Carter County, TN
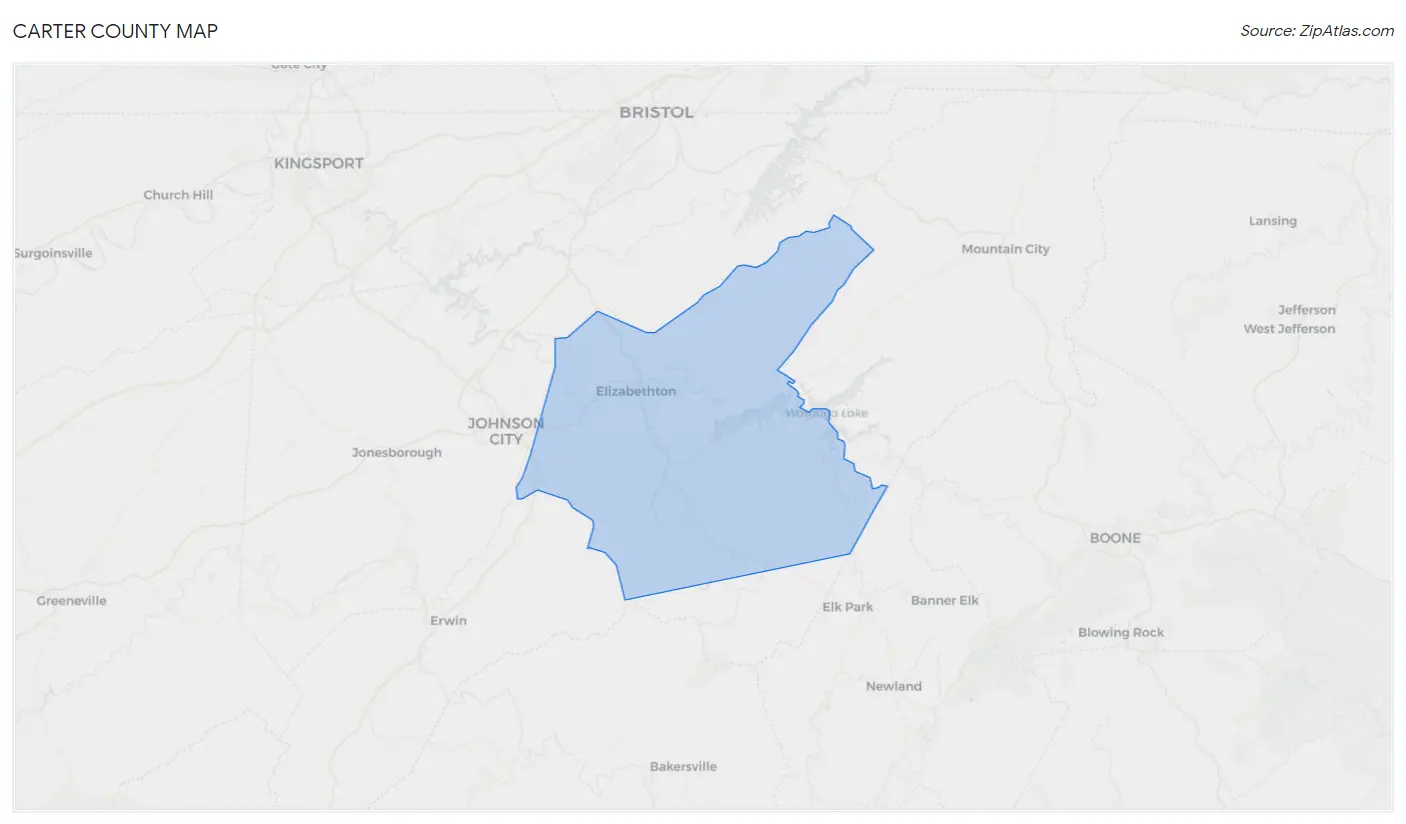
Carter County Map
Carter County Overview
56,315
TOTAL POPULATION
27,645
MALE POPULATION
28,670
FEMALE POPULATION
96.42
MALES / 100 FEMALES
103.71
FEMALES / 100 MALES
46.0
MEDIAN AGE
2.9
AVG FAMILY SIZE
2.3
AVG HOUSEHOLD SIZE
$28,321
PER CAPITA INCOME
$61,776
AVG FAMILY INCOME
$47,994
AVG HOUSEHOLD INCOME
26.7%
WAGE / INCOME GAP [ % ]
73.3¢/ $1
WAGE / INCOME GAP [ $ ]
$10,164
FAMILY INCOME DEFICIT
0.45
INEQUALITY / GINI INDEX
24,981
LABOR FORCE [ PEOPLE ]
52.7%
PERCENT IN LABOR FORCE
7.2%
UNEMPLOYMENT RATE
Carter County Area Codes
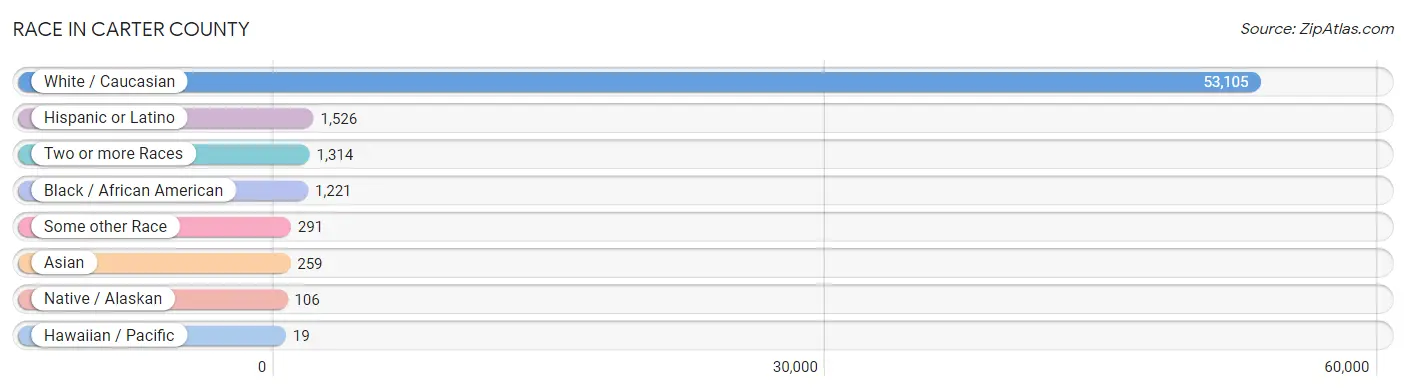
Race in Carter County
The most populous races in Carter County are White / Caucasian (53,105 | 94.3%), Hispanic or Latino (1,526 | 2.7%), and Two or more Races (1,314 | 2.3%).
| Race | # Population | % Population |
| Asian | 259 | 0.5% |
| Black / African American | 1,221 | 2.2% |
| Hawaiian / Pacific | 19 | 0.0% |
| Hispanic or Latino | 1,526 | 2.7% |
| Native / Alaskan | 106 | 0.2% |
| White / Caucasian | 53,105 | 94.3% |
| Two or more Races | 1,314 | 2.3% |
| Some other Race | 291 | 0.5% |
| Total | 56,315 | 100.0% |
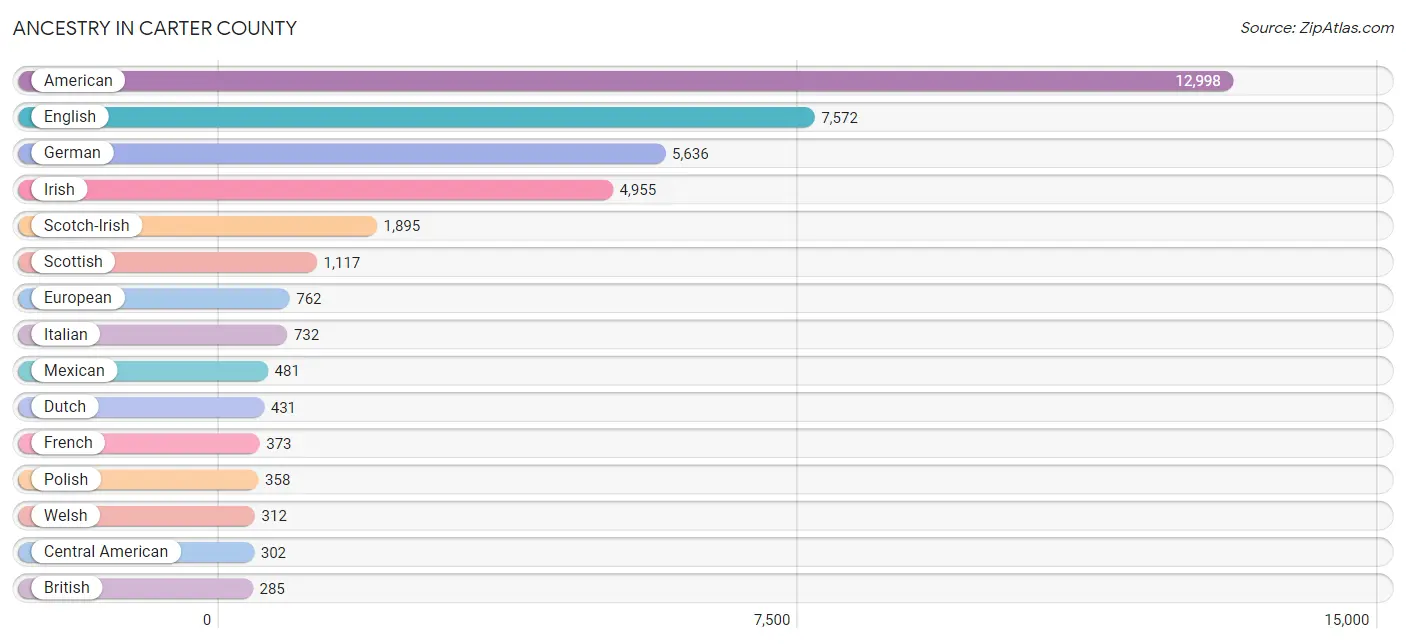
Ancestry in Carter County
The most populous ancestries reported in Carter County are American (12,998 | 23.1%), English (7,572 | 13.5%), German (5,636 | 10.0%), Irish (4,955 | 8.8%), and Scotch-Irish (1,895 | 3.4%), together accounting for 58.7% of all Carter County residents.
| Ancestry | # Population | % Population |
| African | 49 | 0.1% |
| American | 12,998 | 23.1% |
| Apache | 5 | 0.0% |
| Arab | 163 | 0.3% |
| Argentinean | 7 | 0.0% |
| Armenian | 16 | 0.0% |
| Australian | 6 | 0.0% |
| Belgian | 45 | 0.1% |
| Bhutanese | 39 | 0.1% |
| Blackfeet | 32 | 0.1% |
| British | 285 | 0.5% |
| Burmese | 89 | 0.2% |
| Canadian | 129 | 0.2% |
| Celtic | 9 | 0.0% |
| Central American | 302 | 0.5% |
| Central American Indian | 68 | 0.1% |
| Cherokee | 182 | 0.3% |
| Colombian | 9 | 0.0% |
| Cuban | 159 | 0.3% |
| Czech | 66 | 0.1% |
| Czechoslovakian | 9 | 0.0% |
| Danish | 50 | 0.1% |
| Dominican | 3 | 0.0% |
| Dutch | 431 | 0.8% |
| Eastern European | 83 | 0.2% |
| Ecuadorian | 10 | 0.0% |
| Egyptian | 107 | 0.2% |
| English | 7,572 | 13.5% |
| Estonian | 14 | 0.0% |
| Ethiopian | 71 | 0.1% |
| European | 762 | 1.3% |
| Finnish | 9 | 0.0% |
| French | 373 | 0.7% |
| French Canadian | 100 | 0.2% |
| German | 5,636 | 10.0% |
| Greek | 55 | 0.1% |
| Guatemalan | 71 | 0.1% |
| Honduran | 131 | 0.2% |
| Hungarian | 153 | 0.3% |
| Icelander | 35 | 0.1% |
| Indian (Asian) | 2 | 0.0% |
| Irish | 4,955 | 8.8% |
| Israeli | 12 | 0.0% |
| Italian | 732 | 1.3% |
| Korean | 113 | 0.2% |
| Latvian | 41 | 0.1% |
| Lebanese | 25 | 0.0% |
| Malaysian | 101 | 0.2% |
| Mexican | 481 | 0.9% |
| Native Hawaiian | 63 | 0.1% |
| Navajo | 1 | 0.0% |
| Nicaraguan | 54 | 0.1% |
| Northern European | 28 | 0.1% |
| Norwegian | 238 | 0.4% |
| Pennsylvania German | 6 | 0.0% |
| Polish | 358 | 0.6% |
| Portuguese | 8 | 0.0% |
| Puerto Rican | 83 | 0.2% |
| Russian | 157 | 0.3% |
| Salvadoran | 46 | 0.1% |
| Scandinavian | 140 | 0.3% |
| Scotch-Irish | 1,895 | 3.4% |
| Scottish | 1,117 | 2.0% |
| Sioux | 26 | 0.1% |
| Slovak | 4 | 0.0% |
| Slovene | 9 | 0.0% |
| South American | 26 | 0.1% |
| South American Indian | 10 | 0.0% |
| Spaniard | 242 | 0.4% |
| Spanish | 11 | 0.0% |
| Sri Lankan | 26 | 0.1% |
| Subsaharan African | 127 | 0.2% |
| Swedish | 209 | 0.4% |
| Swiss | 89 | 0.2% |
| Syrian | 18 | 0.0% |
| Thai | 51 | 0.1% |
| Turkish | 7 | 0.0% |
| Ukrainian | 31 | 0.1% |
| Welsh | 312 | 0.5% |
| Zimbabwean | 7 | 0.0% | View All 80 Rows |
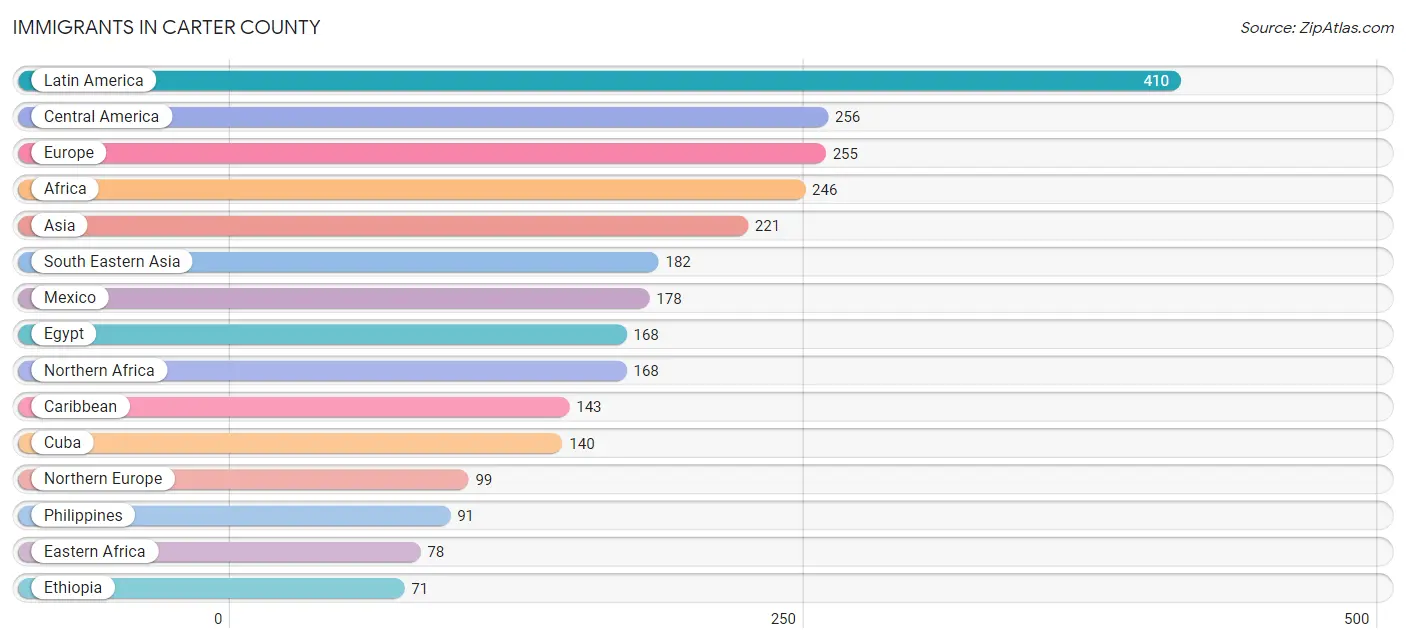
Immigrants in Carter County
The most numerous immigrant groups reported in Carter County came from Latin America (410 | 0.7%), Central America (256 | 0.4%), Europe (255 | 0.4%), Africa (246 | 0.4%), and Asia (221 | 0.4%), together accounting for 2.5% of all Carter County residents.
| Immigration Origin | # Population | % Population |
| Africa | 246 | 0.4% |
| Argentina | 7 | 0.0% |
| Asia | 221 | 0.4% |
| Australia | 6 | 0.0% |
| Bosnia and Herzegovina | 19 | 0.0% |
| Canada | 26 | 0.1% |
| Caribbean | 143 | 0.3% |
| Central America | 256 | 0.4% |
| China | 2 | 0.0% |
| Cuba | 140 | 0.3% |
| Denmark | 10 | 0.0% |
| Dominican Republic | 3 | 0.0% |
| Eastern Africa | 78 | 0.1% |
| Eastern Asia | 39 | 0.1% |
| Eastern Europe | 47 | 0.1% |
| Ecuador | 4 | 0.0% |
| Egypt | 168 | 0.3% |
| El Salvador | 20 | 0.0% |
| England | 46 | 0.1% |
| Ethiopia | 71 | 0.1% |
| Europe | 255 | 0.4% |
| France | 6 | 0.0% |
| Germany | 53 | 0.1% |
| Honduras | 27 | 0.1% |
| Korea | 37 | 0.1% |
| Laos | 50 | 0.1% |
| Latin America | 410 | 0.7% |
| Mexico | 178 | 0.3% |
| Nicaragua | 31 | 0.1% |
| Northern Africa | 168 | 0.3% |
| Northern Europe | 99 | 0.2% |
| Oceania | 6 | 0.0% |
| Philippines | 91 | 0.2% |
| Poland | 14 | 0.0% |
| Russia | 14 | 0.0% |
| South America | 11 | 0.0% |
| South Eastern Asia | 182 | 0.3% |
| Southern Europe | 50 | 0.1% |
| Spain | 50 | 0.1% |
| Taiwan | 2 | 0.0% |
| Thailand | 2 | 0.0% |
| Vietnam | 39 | 0.1% |
| Western Europe | 59 | 0.1% |
| Zimbabwe | 7 | 0.0% | View All 44 Rows |
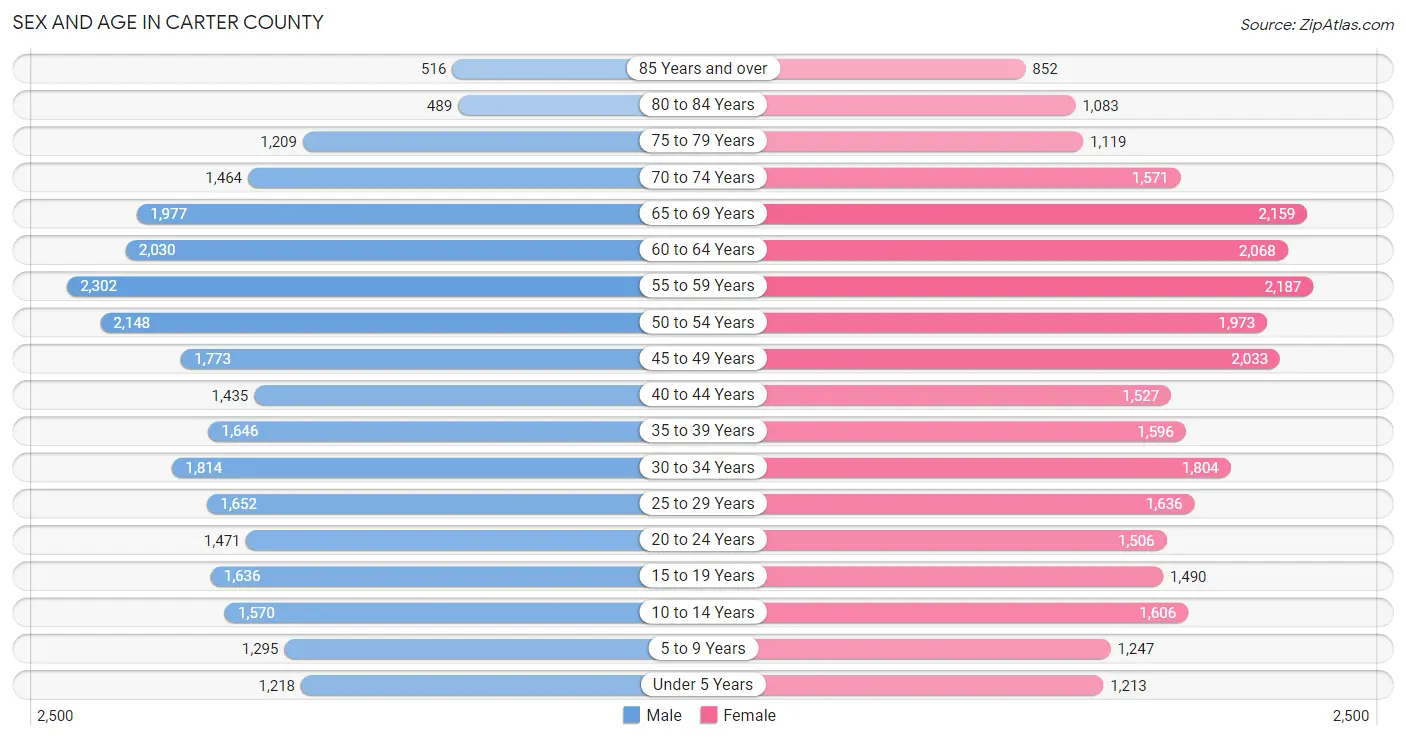
Sex and Age in Carter County
Sex and Age in Carter County
The most populous age groups in Carter County are 55 to 59 Years (2,302 | 8.3%) for men and 55 to 59 Years (2,187 | 7.6%) for women.
| Age Bracket | Male | Female |
| Under 5 Years | 1,218 (4.4%) | 1,213 (4.2%) |
| 5 to 9 Years | 1,295 (4.7%) | 1,247 (4.3%) |
| 10 to 14 Years | 1,570 (5.7%) | 1,606 (5.6%) |
| 15 to 19 Years | 1,636 (5.9%) | 1,490 (5.2%) |
| 20 to 24 Years | 1,471 (5.3%) | 1,506 (5.2%) |
| 25 to 29 Years | 1,652 (6.0%) | 1,636 (5.7%) |
| 30 to 34 Years | 1,814 (6.6%) | 1,804 (6.3%) |
| 35 to 39 Years | 1,646 (5.9%) | 1,596 (5.6%) |
| 40 to 44 Years | 1,435 (5.2%) | 1,527 (5.3%) |
| 45 to 49 Years | 1,773 (6.4%) | 2,033 (7.1%) |
| 50 to 54 Years | 2,148 (7.8%) | 1,973 (6.9%) |
| 55 to 59 Years | 2,302 (8.3%) | 2,187 (7.6%) |
| 60 to 64 Years | 2,030 (7.3%) | 2,068 (7.2%) |
| 65 to 69 Years | 1,977 (7.1%) | 2,159 (7.5%) |
| 70 to 74 Years | 1,464 (5.3%) | 1,571 (5.5%) |
| 75 to 79 Years | 1,209 (4.4%) | 1,119 (3.9%) |
| 80 to 84 Years | 489 (1.8%) | 1,083 (3.8%) |
| 85 Years and over | 516 (1.9%) | 852 (3.0%) |
| Total | 27,645 (100.0%) | 28,670 (100.0%) |
Families and Households in Carter County
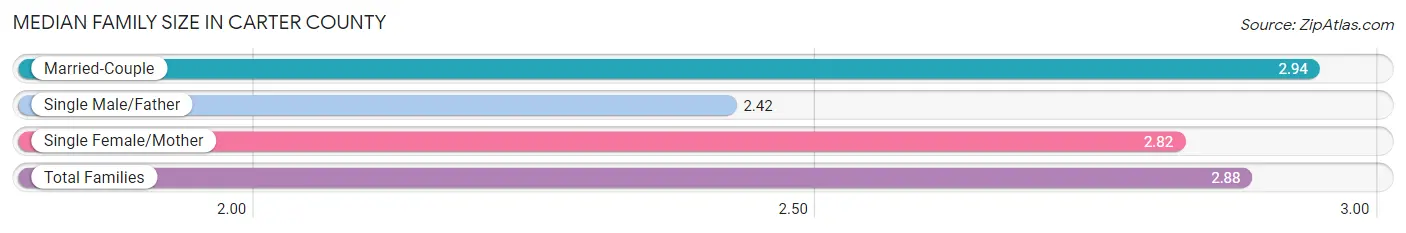
Median Family Size in Carter County
The median family size in Carter County is 2.88 persons per family, with married-couple families (11,161 | 74.8%) accounting for the largest median family size of 2.94 persons per family. On the other hand, single male/father families (1,123 | 7.5%) represent the smallest median family size with 2.42 persons per family.
| Family Type | # Families | Family Size |
| Married-Couple | 11,161 (74.8%) | 2.94 |
| Single Male/Father | 1,123 (7.5%) | 2.42 |
| Single Female/Mother | 2,642 (17.7%) | 2.82 |
| Total Families | 14,926 (100.0%) | 2.88 |
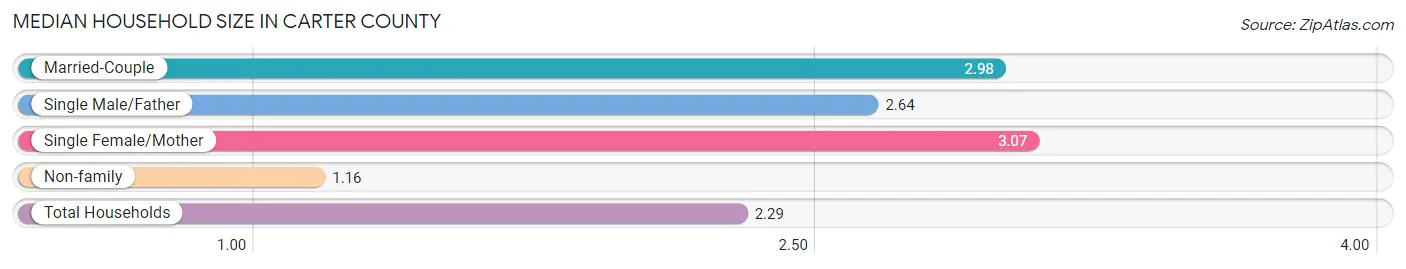
Median Household Size in Carter County
The median household size in Carter County is 2.29 persons per household, with single female/mother households (2,642 | 11.0%) accounting for the largest median household size of 3.07 persons per household. non-family households (9,014 | 37.7%) represent the smallest median household size with 1.16 persons per household.
| Household Type | # Households | Household Size |
| Married-Couple | 11,161 (46.6%) | 2.98 |
| Single Male/Father | 1,123 (4.7%) | 2.64 |
| Single Female/Mother | 2,642 (11.0%) | 3.07 |
| Non-family | 9,014 (37.7%) | 1.16 |
| Total Households | 23,940 (100.0%) | 2.29 |
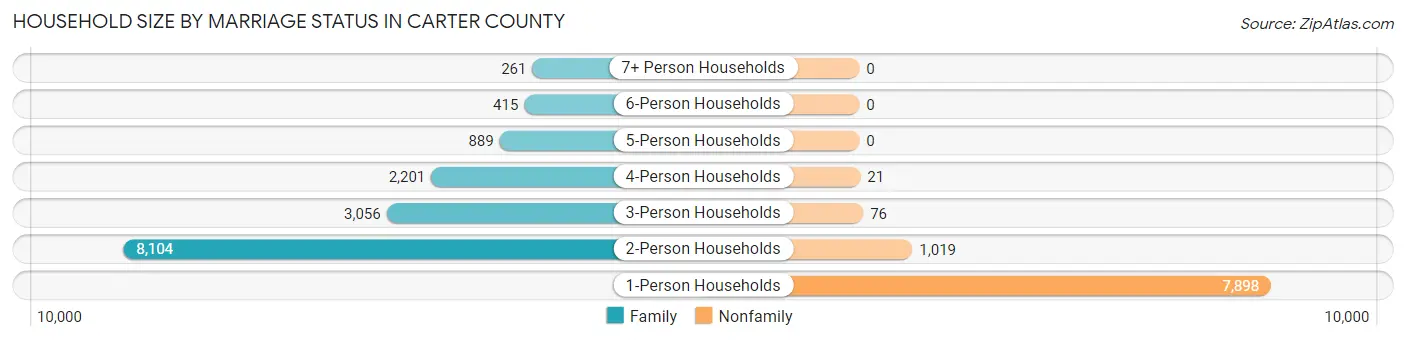
Household Size by Marriage Status in Carter County
Out of a total of 23,940 households in Carter County, 14,926 (62.4%) are family households, while 9,014 (37.7%) are nonfamily households. The most numerous type of family households are 2-person households, comprising 8,104, and the most common type of nonfamily households are 1-person households, comprising 7,898.
| Household Size | Family Households | Nonfamily Households |
| 1-Person Households | - | 7,898 (33.0%) |
| 2-Person Households | 8,104 (33.9%) | 1,019 (4.3%) |
| 3-Person Households | 3,056 (12.8%) | 76 (0.3%) |
| 4-Person Households | 2,201 (9.2%) | 21 (0.1%) |
| 5-Person Households | 889 (3.7%) | 0 (0.0%) |
| 6-Person Households | 415 (1.7%) | 0 (0.0%) |
| 7+ Person Households | 261 (1.1%) | 0 (0.0%) |
| Total | 14,926 (62.4%) | 9,014 (37.7%) |
Female Fertility in Carter County
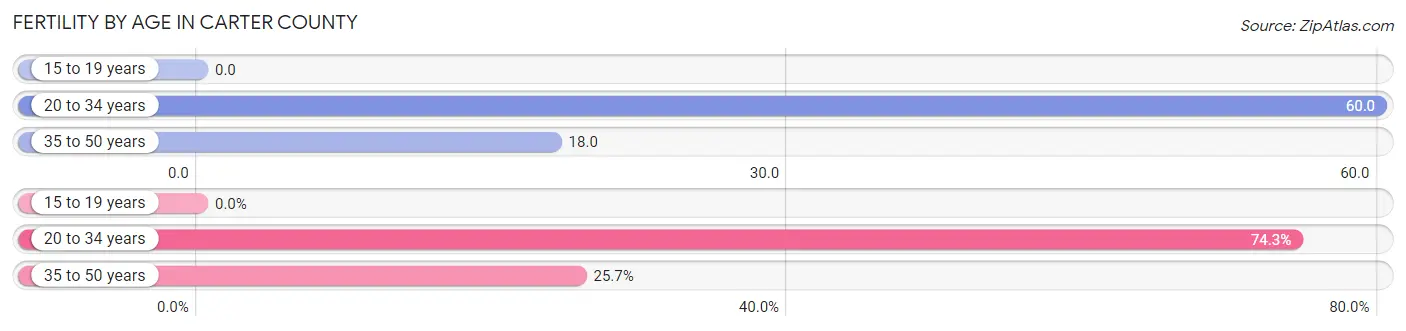
Fertility by Age in Carter County
Average fertility rate in Carter County is 33.0 births per 1,000 women. Women in the age bracket of 20 to 34 years have the highest fertility rate with 60.0 births per 1,000 women. Women in the age bracket of 20 to 34 years acount for 74.3% of all women with births.
| Age Bracket | Women with Births | Births / 1,000 Women |
| 15 to 19 years | 0 (0.0%) | 0.0 |
| 20 to 34 years | 298 (74.3%) | 60.0 |
| 35 to 50 years | 103 (25.7%) | 18.0 |
| Total | 401 (100.0%) | 33.0 |
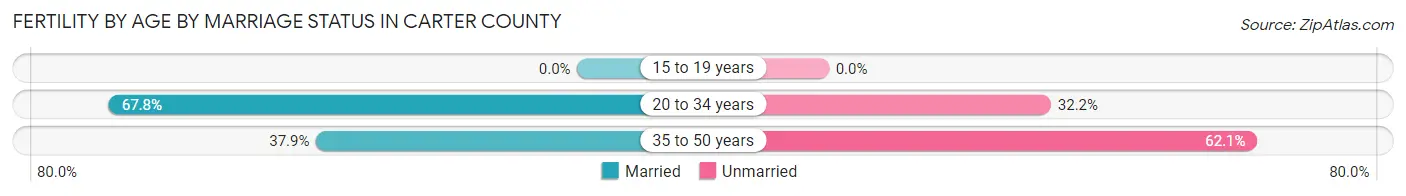
Fertility by Age by Marriage Status in Carter County
60.1% of women with births (401) in Carter County are married. The highest percentage of unmarried women with births falls into 35 to 50 years age bracket with 62.1% of them unmarried at the time of birth, while the lowest percentage of unmarried women with births belong to 20 to 34 years age bracket with 32.2% of them unmarried.
| Age Bracket | Married | Unmarried |
| 15 to 19 years | 0 (0.0%) | 0 (0.0%) |
| 20 to 34 years | 202 (67.8%) | 96 (32.2%) |
| 35 to 50 years | 39 (37.9%) | 64 (62.1%) |
| Total | 241 (60.1%) | 160 (39.9%) |
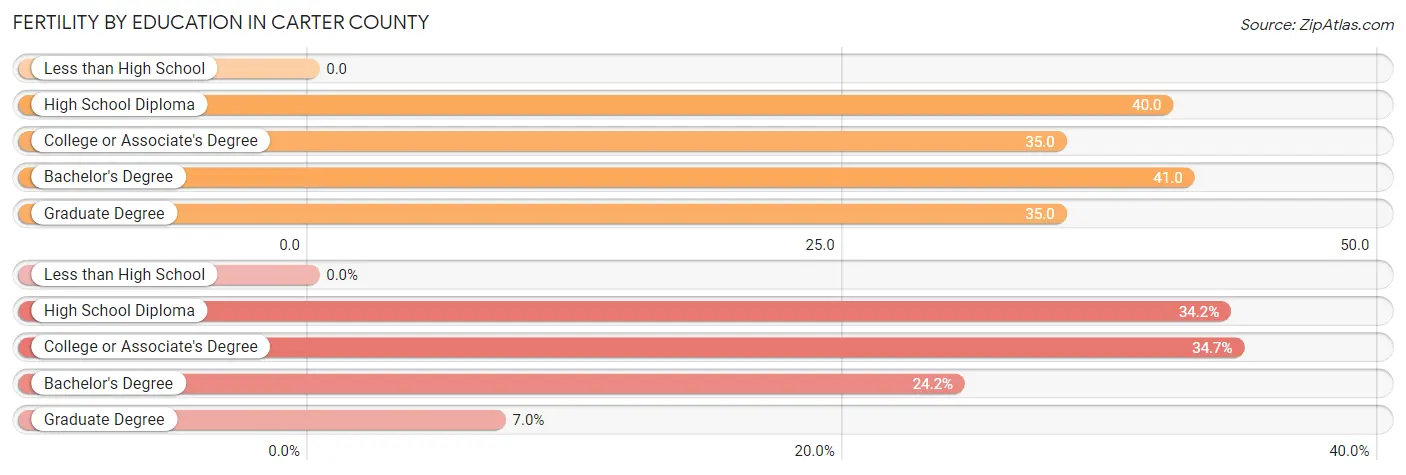
Fertility by Education in Carter County
| Educational Attainment | Women with Births | Births / 1,000 Women |
| Less than High School | 0 (0.0%) | 0.0 |
| High School Diploma | 137 (34.2%) | 40.0 |
| College or Associate's Degree | 139 (34.7%) | 35.0 |
| Bachelor's Degree | 97 (24.2%) | 41.0 |
| Graduate Degree | 28 (7.0%) | 35.0 |
| Total | 401 (100.0%) | 33.0 |
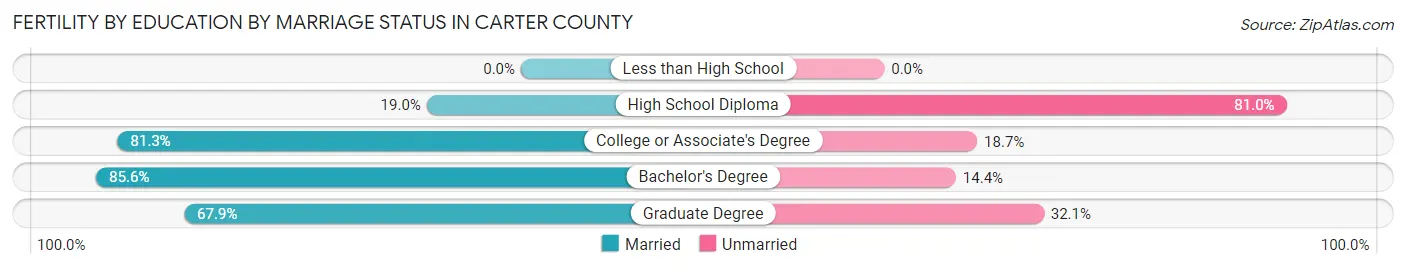
Fertility by Education by Marriage Status in Carter County
39.9% of women with births in Carter County are unmarried. Women with the educational attainment of bachelor's degree are most likely to be married with 85.6% of them married at childbirth, while women with the educational attainment of high school diploma are least likely to be married with 81.0% of them unmarried at childbirth.
| Educational Attainment | Married | Unmarried |
| Less than High School | 0 (0.0%) | 0 (0.0%) |
| High School Diploma | 26 (19.0%) | 111 (81.0%) |
| College or Associate's Degree | 113 (81.3%) | 26 (18.7%) |
| Bachelor's Degree | 83 (85.6%) | 14 (14.4%) |
| Graduate Degree | 19 (67.9%) | 9 (32.1%) |
| Total | 241 (60.1%) | 160 (39.9%) |
Income in Carter County
Income Overview in Carter County
Per Capita Income in Carter County is $28,321, while median incomes of families and households are $61,776 and $47,994 respectively.
| Characteristic | Number | Measure |
| Per Capita Income | 56,315 | $28,321 |
| Median Family Income | 14,926 | $61,776 |
| Mean Family Income | 14,926 | $76,260 |
| Median Household Income | 23,940 | $47,994 |
| Mean Household Income | 23,940 | $62,879 |
| Income Deficit | 14,926 | $10,164 |
| Wage / Income Gap (%) | 56,315 | 26.68% |
| Wage / Income Gap ($) | 56,315 | 73.32¢ per $1 |
| Gini / Inequality Index | 56,315 | 0.45 |
Earnings by Sex in Carter County
Average Earnings in Carter County are $33,429, $38,802 for men and $28,450 for women, a difference of 26.7%.
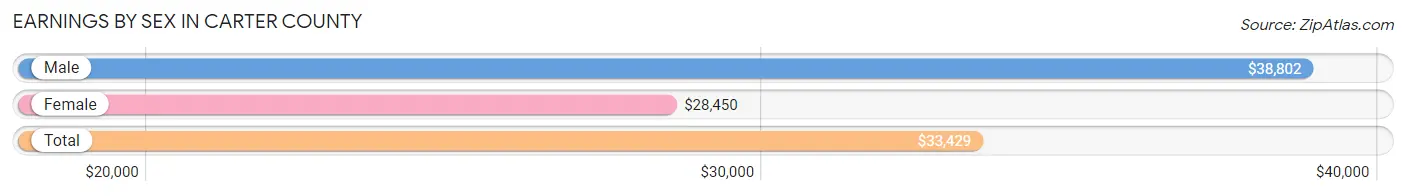
| Sex | Number | Average Earnings |
| Male | 13,480 (52.1%) | $38,802 |
| Female | 12,374 (47.9%) | $28,450 |
| Total | 25,854 (100.0%) | $33,429 |
Earnings by Sex by Income Bracket in Carter County
The most common earnings brackets in Carter County are $75,000 to $99,999 for men (1,137 | 8.4%) and $25,000 to $29,999 for women (1,196 | 9.7%).
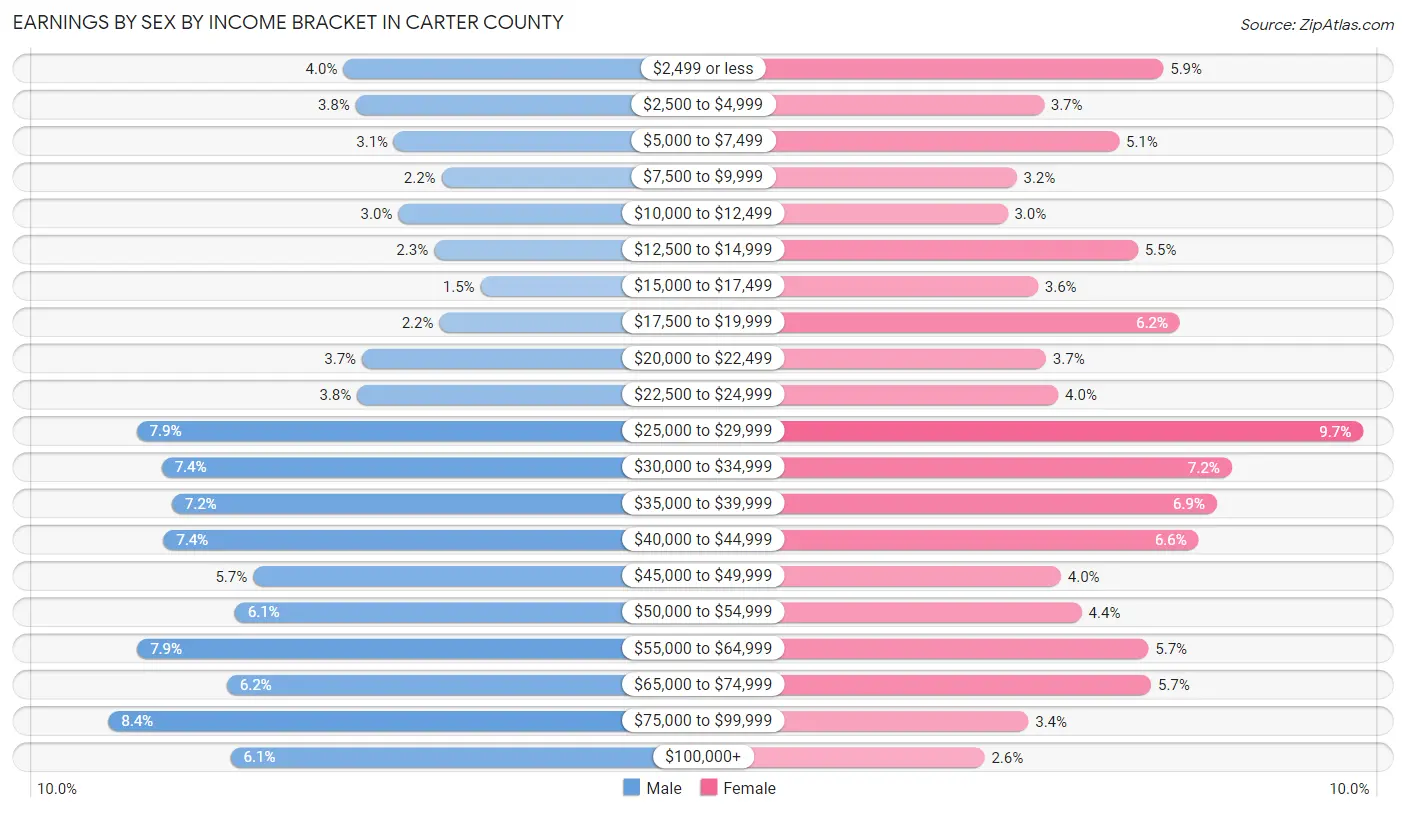
| Income | Male | Female |
| $2,499 or less | 543 (4.0%) | 734 (5.9%) |
| $2,500 to $4,999 | 512 (3.8%) | 456 (3.7%) |
| $5,000 to $7,499 | 415 (3.1%) | 631 (5.1%) |
| $7,500 to $9,999 | 295 (2.2%) | 394 (3.2%) |
| $10,000 to $12,499 | 404 (3.0%) | 373 (3.0%) |
| $12,500 to $14,999 | 314 (2.3%) | 675 (5.4%) |
| $15,000 to $17,499 | 197 (1.5%) | 443 (3.6%) |
| $17,500 to $19,999 | 301 (2.2%) | 772 (6.2%) |
| $20,000 to $22,499 | 496 (3.7%) | 462 (3.7%) |
| $22,500 to $24,999 | 508 (3.8%) | 490 (4.0%) |
| $25,000 to $29,999 | 1,065 (7.9%) | 1,196 (9.7%) |
| $30,000 to $34,999 | 1,002 (7.4%) | 892 (7.2%) |
| $35,000 to $39,999 | 976 (7.2%) | 857 (6.9%) |
| $40,000 to $44,999 | 998 (7.4%) | 815 (6.6%) |
| $45,000 to $49,999 | 771 (5.7%) | 496 (4.0%) |
| $50,000 to $54,999 | 817 (6.1%) | 544 (4.4%) |
| $55,000 to $64,999 | 1,064 (7.9%) | 699 (5.7%) |
| $65,000 to $74,999 | 837 (6.2%) | 705 (5.7%) |
| $75,000 to $99,999 | 1,137 (8.4%) | 421 (3.4%) |
| $100,000+ | 828 (6.1%) | 319 (2.6%) |
| Total | 13,480 (100.0%) | 12,374 (100.0%) |
Earnings by Sex by Educational Attainment in Carter County
Average earnings in Carter County are $41,214 for men and $31,757 for women, a difference of 23.0%. Men with an educational attainment of graduate degree enjoy the highest average annual earnings of $55,980, while those with less than high school education earn the least with $32,500. Women with an educational attainment of graduate degree earn the most with the average annual earnings of $53,594, while those with less than high school education have the smallest earnings of $22,702.
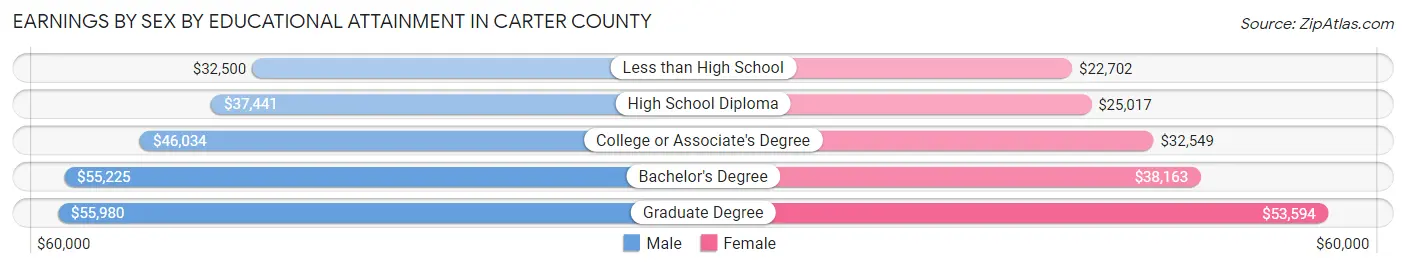
| Educational Attainment | Male Income | Female Income |
| Less than High School | $32,500 | $22,702 |
| High School Diploma | $37,441 | $25,017 |
| College or Associate's Degree | $46,034 | $32,549 |
| Bachelor's Degree | $55,225 | $38,163 |
| Graduate Degree | $55,980 | $53,594 |
| Total | $41,214 | $31,757 |
Family Income in Carter County
Family Income Brackets in Carter County
According to the Carter County family income data, there are 3,373 families falling into the $50,000 to $74,999 income range, which is the most common income bracket and makes up 22.6% of all families. Conversely, the $10,000 to $14,999 income bracket is the least frequent group with only 448 families (3.0%) belonging to this category.
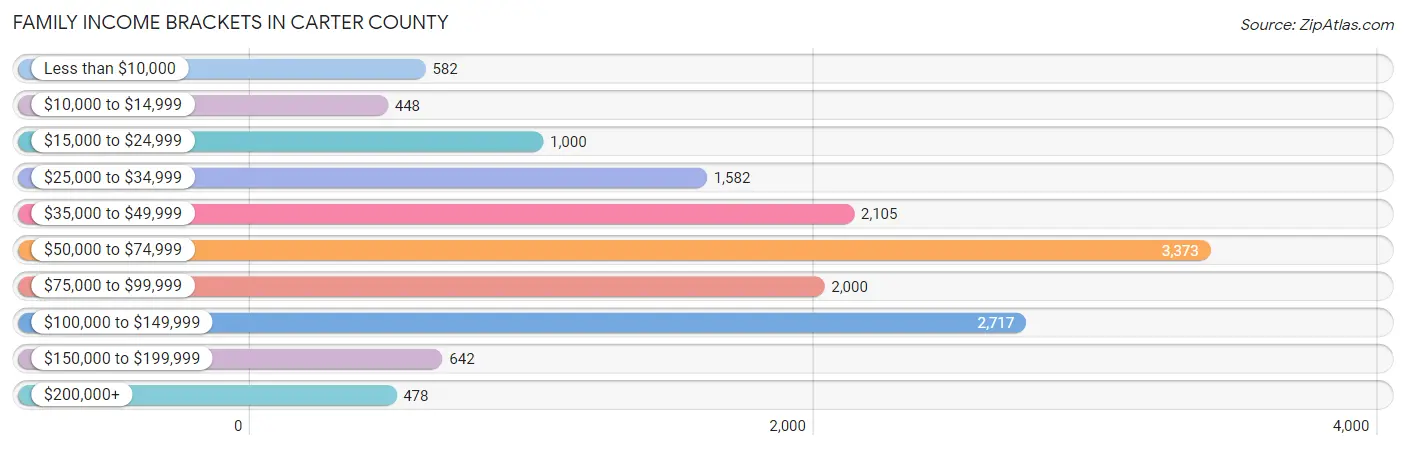
| Income Bracket | # Families | % Families |
| Less than $10,000 | 582 | 3.9% |
| $10,000 to $14,999 | 448 | 3.0% |
| $15,000 to $24,999 | 1,000 | 6.7% |
| $25,000 to $34,999 | 1,582 | 10.6% |
| $35,000 to $49,999 | 2,105 | 14.1% |
| $50,000 to $74,999 | 3,373 | 22.6% |
| $75,000 to $99,999 | 2,000 | 13.4% |
| $100,000 to $149,999 | 2,717 | 18.2% |
| $150,000 to $199,999 | 642 | 4.3% |
| $200,000+ | 478 | 3.2% |
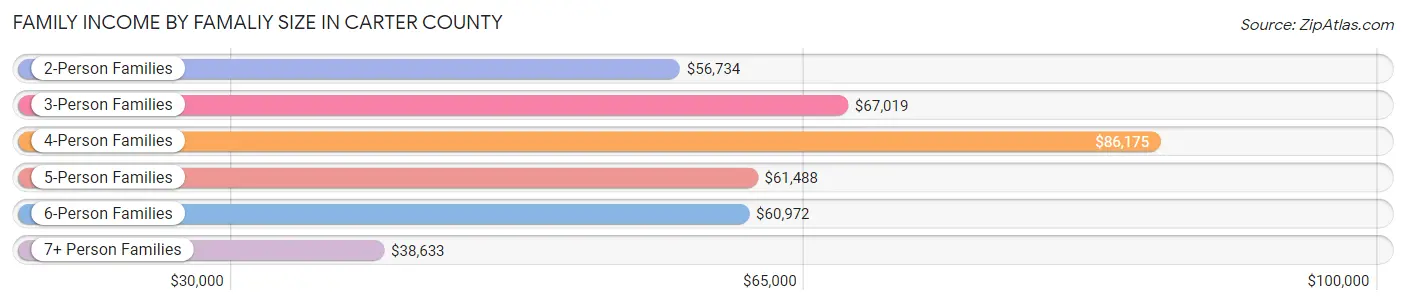
Family Income by Famaliy Size in Carter County
4-person families (2,181 | 14.6%) account for the highest median family income in Carter County with $86,175 per family, while 2-person families (8,529 | 57.1%) have the highest median income of $28,367 per family member.
| Income Bracket | # Families | Median Income |
| 2-Person Families | 8,529 (57.1%) | $56,734 |
| 3-Person Families | 2,906 (19.5%) | $67,019 |
| 4-Person Families | 2,181 (14.6%) | $86,175 |
| 5-Person Families | 793 (5.3%) | $61,488 |
| 6-Person Families | 299 (2.0%) | $60,972 |
| 7+ Person Families | 218 (1.5%) | $38,633 |
| Total | 14,926 (100.0%) | $61,776 |
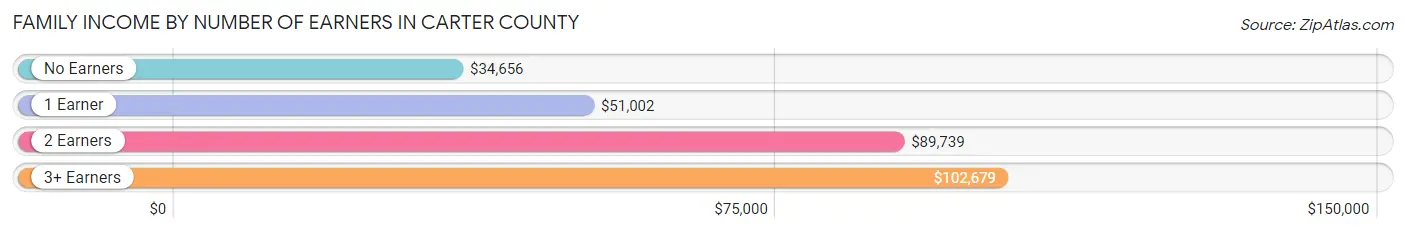
Family Income by Number of Earners in Carter County
The median family income in Carter County is $61,776, with families comprising 3+ earners (1,052) having the highest median family income of $102,679, while families with no earners (3,409) have the lowest median family income of $34,656, accounting for 7.0% and 22.8% of families, respectively.
| Number of Earners | # Families | Median Income |
| No Earners | 3,409 (22.8%) | $34,656 |
| 1 Earner | 5,200 (34.8%) | $51,002 |
| 2 Earners | 5,265 (35.3%) | $89,739 |
| 3+ Earners | 1,052 (7.0%) | $102,679 |
| Total | 14,926 (100.0%) | $61,776 |
Household Income in Carter County
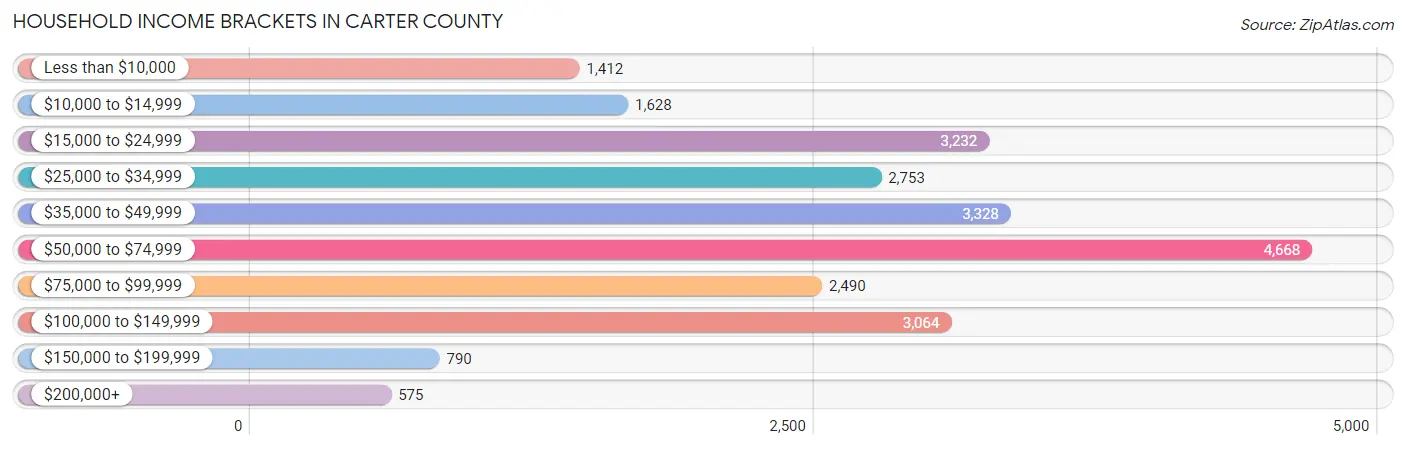
Household Income Brackets in Carter County
With 4,668 households falling in the category, the $50,000 to $74,999 income range is the most frequent in Carter County, accounting for 19.5% of all households. In contrast, only 575 households (2.4%) fall into the $200,000+ income bracket, making it the least populous group.
| Income Bracket | # Households | % Households |
| Less than $10,000 | 1,412 | 5.9% |
| $10,000 to $14,999 | 1,628 | 6.8% |
| $15,000 to $24,999 | 3,232 | 13.5% |
| $25,000 to $34,999 | 2,753 | 11.5% |
| $35,000 to $49,999 | 3,328 | 13.9% |
| $50,000 to $74,999 | 4,668 | 19.5% |
| $75,000 to $99,999 | 2,490 | 10.4% |
| $100,000 to $149,999 | 3,064 | 12.8% |
| $150,000 to $199,999 | 790 | 3.3% |
| $200,000+ | 575 | 2.4% |
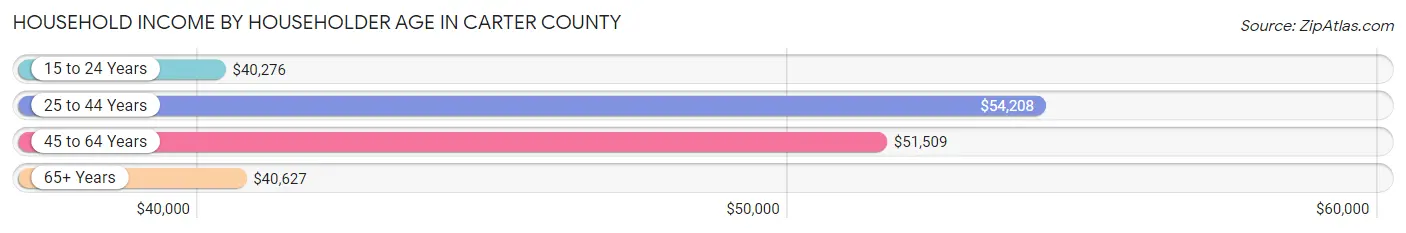
Household Income by Householder Age in Carter County
The median household income in Carter County is $47,994, with the highest median household income of $54,208 found in the 25 to 44 years age bracket for the primary householder. A total of 5,950 households (24.8%) fall into this category. Meanwhile, the 15 to 24 years age bracket for the primary householder has the lowest median household income of $40,276, with 631 households (2.6%) in this group.
| Income Bracket | # Households | Median Income |
| 15 to 24 Years | 631 (2.6%) | $40,276 |
| 25 to 44 Years | 5,950 (24.8%) | $54,208 |
| 45 to 64 Years | 9,218 (38.5%) | $51,509 |
| 65+ Years | 8,141 (34.0%) | $40,627 |
| Total | 23,940 (100.0%) | $47,994 |
Poverty in Carter County
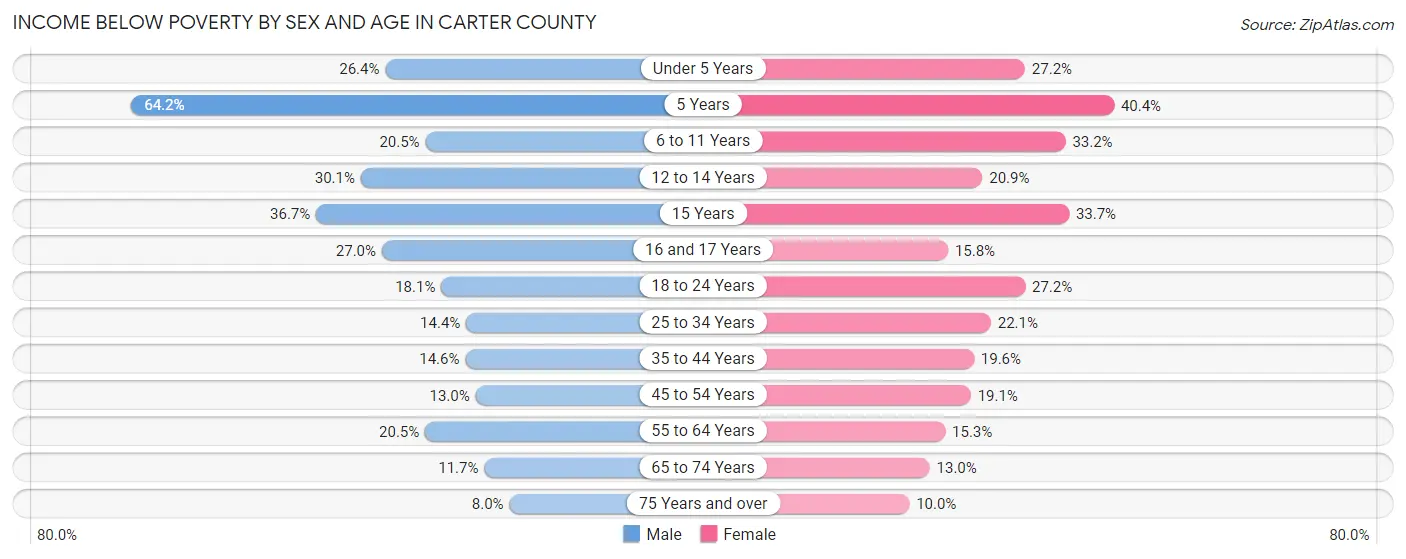
Income Below Poverty by Sex and Age in Carter County
With 17.0% poverty level for males and 19.3% for females among the residents of Carter County, 5 year old males and 5 year old females are the most vulnerable to poverty, with 102 males (64.1%) and 78 females (40.4%) in their respective age groups living below the poverty level.
| Age Bracket | Male | Female |
| Under 5 Years | 308 (26.4%) | 317 (27.2%) |
| 5 Years | 102 (64.1%) | 78 (40.4%) |
| 6 to 11 Years | 350 (20.5%) | 556 (33.2%) |
| 12 to 14 Years | 268 (30.1%) | 195 (20.9%) |
| 15 Years | 156 (36.7%) | 113 (33.7%) |
| 16 and 17 Years | 176 (27.0%) | 93 (15.8%) |
| 18 to 24 Years | 330 (18.1%) | 447 (27.2%) |
| 25 to 34 Years | 487 (14.4%) | 754 (22.1%) |
| 35 to 44 Years | 433 (14.6%) | 611 (19.6%) |
| 45 to 54 Years | 501 (13.0%) | 764 (19.1%) |
| 55 to 64 Years | 885 (20.5%) | 651 (15.3%) |
| 65 to 74 Years | 393 (11.7%) | 480 (13.0%) |
| 75 Years and over | 174 (8.0%) | 274 (10.0%) |
| Total | 4,563 (17.0%) | 5,333 (19.3%) |
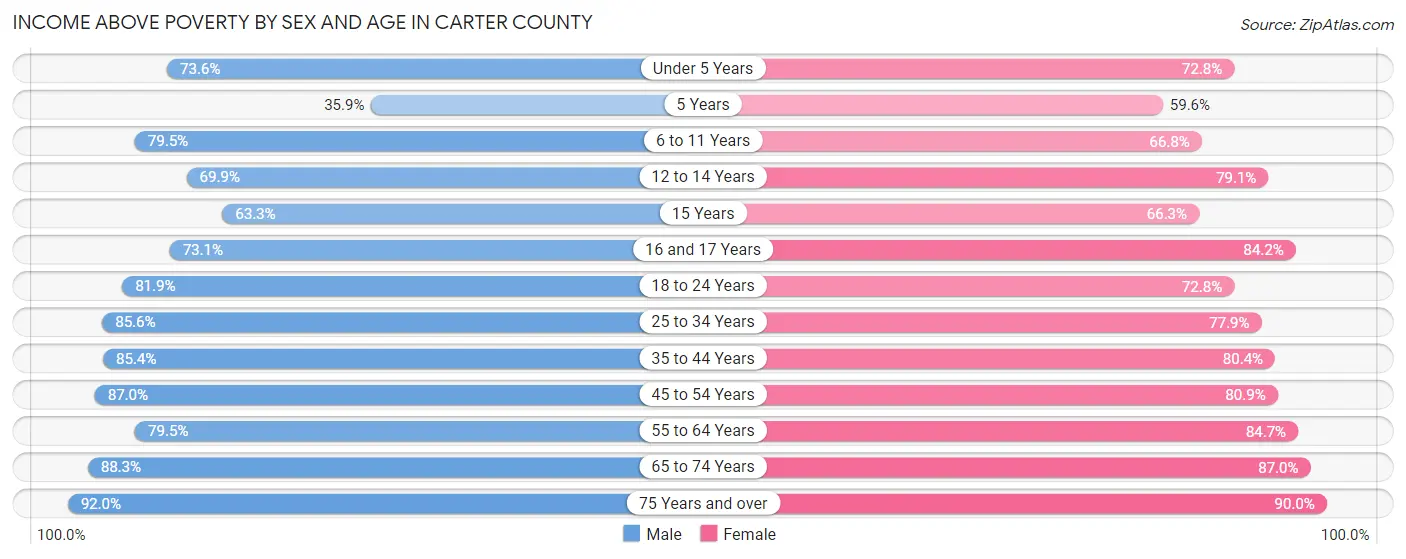
Income Above Poverty by Sex and Age in Carter County
According to the poverty statistics in Carter County, males aged 75 years and over and females aged 75 years and over are the age groups that are most secure financially, with 92.0% of males and 90.0% of females in these age groups living above the poverty line.
| Age Bracket | Male | Female |
| Under 5 Years | 857 (73.6%) | 849 (72.8%) |
| 5 Years | 57 (35.8%) | 115 (59.6%) |
| 6 to 11 Years | 1,359 (79.5%) | 1,118 (66.8%) |
| 12 to 14 Years | 623 (69.9%) | 740 (79.1%) |
| 15 Years | 269 (63.3%) | 222 (66.3%) |
| 16 and 17 Years | 477 (73.1%) | 497 (84.2%) |
| 18 to 24 Years | 1,490 (81.9%) | 1,196 (72.8%) |
| 25 to 34 Years | 2,889 (85.6%) | 2,653 (77.9%) |
| 35 to 44 Years | 2,540 (85.4%) | 2,504 (80.4%) |
| 45 to 54 Years | 3,342 (87.0%) | 3,228 (80.9%) |
| 55 to 64 Years | 3,426 (79.5%) | 3,592 (84.7%) |
| 65 to 74 Years | 2,954 (88.3%) | 3,201 (87.0%) |
| 75 Years and over | 1,998 (92.0%) | 2,462 (90.0%) |
| Total | 22,281 (83.0%) | 22,377 (80.7%) |
Income Below Poverty Among Married-Couple Families in Carter County
The poverty statistics for married-couple families in Carter County show that 9.1% or 1,019 of the total 11,161 families live below the poverty line. Families with 5 or more children have the highest poverty rate of 100.0%, comprising of 69 families. On the other hand, families with no children have the lowest poverty rate of 5.7%, which includes 427 families.

| Children | Above Poverty | Below Poverty |
| No Children | 7,060 (94.3%) | 427 (5.7%) |
| 1 or 2 Children | 2,645 (89.1%) | 322 (10.8%) |
| 3 or 4 Children | 437 (68.5%) | 201 (31.5%) |
| 5 or more Children | 0 (0.0%) | 69 (100.0%) |
| Total | 10,142 (90.9%) | 1,019 (9.1%) |
Income Below Poverty Among Single-Parent Households in Carter County
According to the poverty data in Carter County, 11.3% or 127 single-father households and 29.7% or 784 single-mother households are living below the poverty line. Among single-father households, those with 1 or 2 children have the highest poverty rate, with 119 households (18.3%) experiencing poverty. Likewise, among single-mother households, those with 5 or more children have the highest poverty rate, with 8 households (100.0%) falling below the poverty line.

| Children | Single Father | Single Mother |
| No Children | 8 (1.9%) | 204 (17.5%) |
| 1 or 2 Children | 119 (18.3%) | 375 (30.6%) |
| 3 or 4 Children | 0 (0.0%) | 197 (80.7%) |
| 5 or more Children | 0 (0.0%) | 8 (100.0%) |
| Total | 127 (11.3%) | 784 (29.7%) |
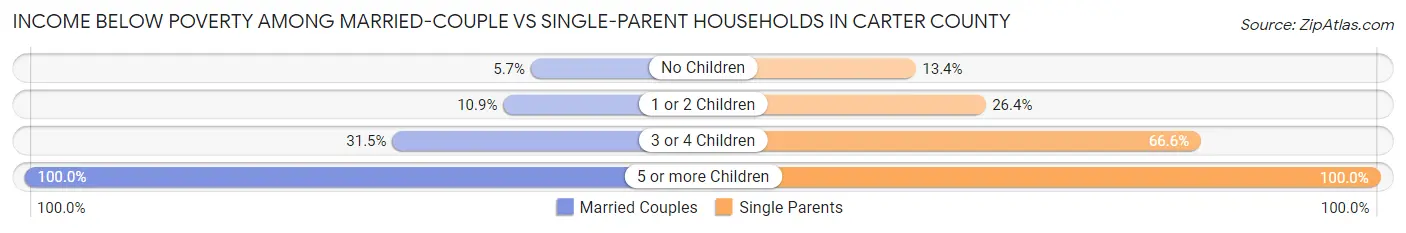
Income Below Poverty Among Married-Couple vs Single-Parent Households in Carter County
The poverty data for Carter County shows that 1,019 of the married-couple family households (9.1%) and 911 of the single-parent households (24.2%) are living below the poverty level. Within the married-couple family households, those with 5 or more children have the highest poverty rate, with 69 households (100.0%) falling below the poverty line. Among the single-parent households, those with 5 or more children have the highest poverty rate, with 8 household (100.0%) living below poverty.
| Children | Married-Couple Families | Single-Parent Households |
| No Children | 427 (5.7%) | 212 (13.4%) |
| 1 or 2 Children | 322 (10.8%) | 494 (26.4%) |
| 3 or 4 Children | 201 (31.5%) | 197 (66.5%) |
| 5 or more Children | 69 (100.0%) | 8 (100.0%) |
| Total | 1,019 (9.1%) | 911 (24.2%) |
Employment Characteristics in Carter County
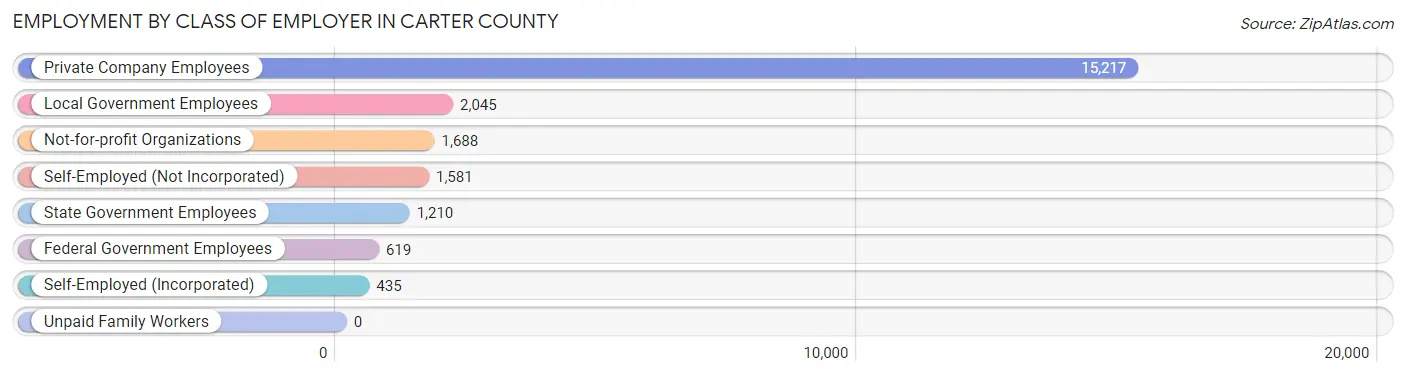
Employment by Class of Employer in Carter County
Among the 22,795 employed individuals in Carter County, private company employees (15,217 | 66.8%), local government employees (2,045 | 9.0%), and not-for-profit organizations (1,688 | 7.4%) make up the most common classes of employment.
| Employer Class | # Employees | % Employees |
| Private Company Employees | 15,217 | 66.8% |
| Self-Employed (Incorporated) | 435 | 1.9% |
| Self-Employed (Not Incorporated) | 1,581 | 6.9% |
| Not-for-profit Organizations | 1,688 | 7.4% |
| Local Government Employees | 2,045 | 9.0% |
| State Government Employees | 1,210 | 5.3% |
| Federal Government Employees | 619 | 2.7% |
| Unpaid Family Workers | 0 | 0.0% |
| Total | 22,795 | 100.0% |
Employment Status by Age in Carter County
According to the labor force statistics for Carter County, out of the total population over 16 years of age (47,403), 52.7% or 24,981 individuals are in the labor force, with 7.2% or 1,799 of them unemployed. The age group with the highest labor force participation rate is 25 to 29 years, with 76.1% or 2,502 individuals in the labor force. Within the labor force, the 25 to 29 years age range has the highest percentage of unemployed individuals, with 12.3% or 308 of them being unemployed.
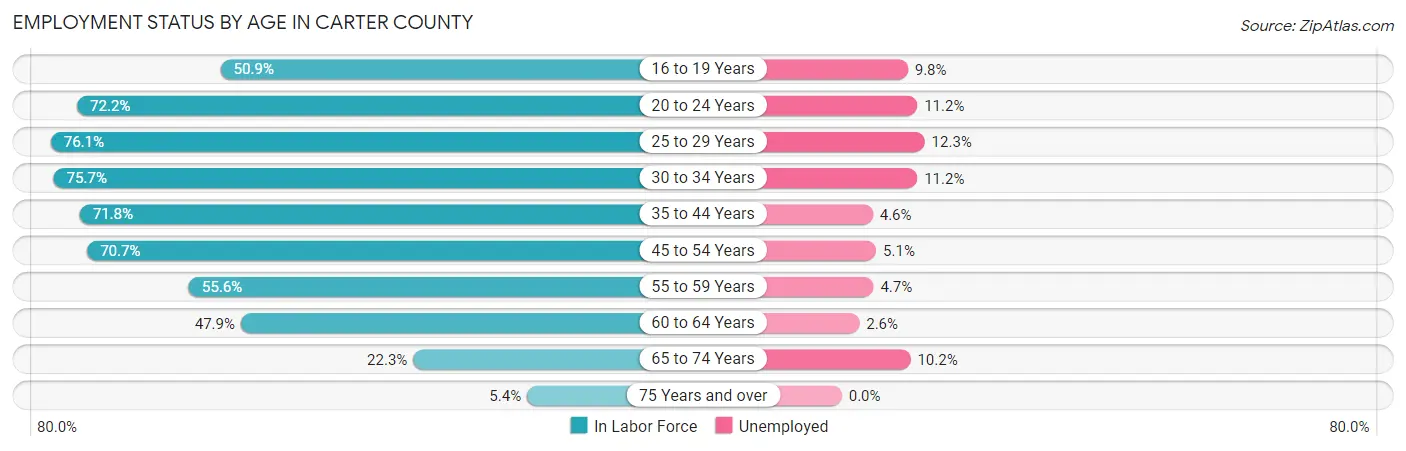
| Age Bracket | In Labor Force | Unemployed |
| 16 to 19 Years | 1,203 (50.9%) | 118 (9.8%) |
| 20 to 24 Years | 2,149 (72.2%) | 241 (11.2%) |
| 25 to 29 Years | 2,502 (76.1%) | 308 (12.3%) |
| 30 to 34 Years | 2,739 (75.7%) | 307 (11.2%) |
| 35 to 44 Years | 4,454 (71.8%) | 205 (4.6%) |
| 45 to 54 Years | 5,604 (70.7%) | 286 (5.1%) |
| 55 to 59 Years | 2,496 (55.6%) | 117 (4.7%) |
| 60 to 64 Years | 1,963 (47.9%) | 51 (2.6%) |
| 65 to 74 Years | 1,599 (22.3%) | 163 (10.2%) |
| 75 Years and over | 284 (5.4%) | 0 (0.0%) |
| Total | 24,981 (52.7%) | 1,799 (7.2%) |
Employment Status by Educational Attainment in Carter County
According to labor force statistics for Carter County, 66.7% of individuals (19,759) out of the total population between 25 and 64 years of age (29,624) are in the labor force, with 6.5% or 1,284 of them being unemployed. The group with the highest labor force participation rate are those with the educational attainment of bachelor's degree or higher, with 81.5% or 5,355 individuals in the labor force. Within the labor force, individuals with less than high school education have the highest percentage of unemployment, with 9.4% or 118 of them being unemployed.
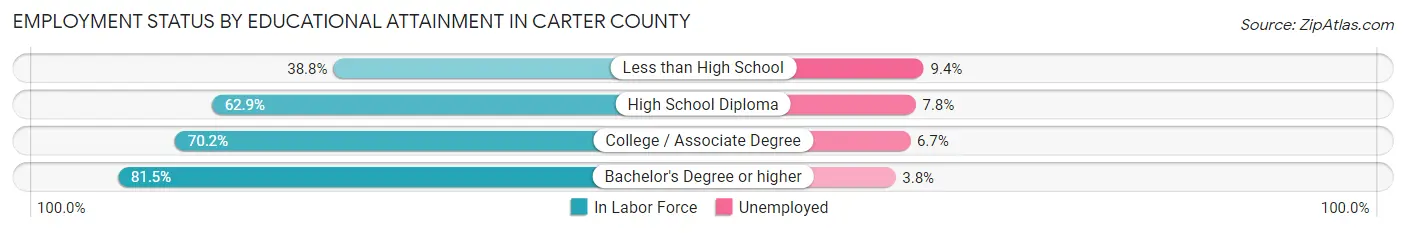
| Educational Attainment | In Labor Force | Unemployed |
| Less than High School | 1,254 (38.8%) | 304 (9.4%) |
| High School Diploma | 6,638 (62.9%) | 823 (7.8%) |
| College / Associate Degree | 6,505 (70.2%) | 621 (6.7%) |
| Bachelor's Degree or higher | 5,355 (81.5%) | 250 (3.8%) |
| Total | 19,759 (66.7%) | 1,926 (6.5%) |
Employment Occupations by Sex in Carter County
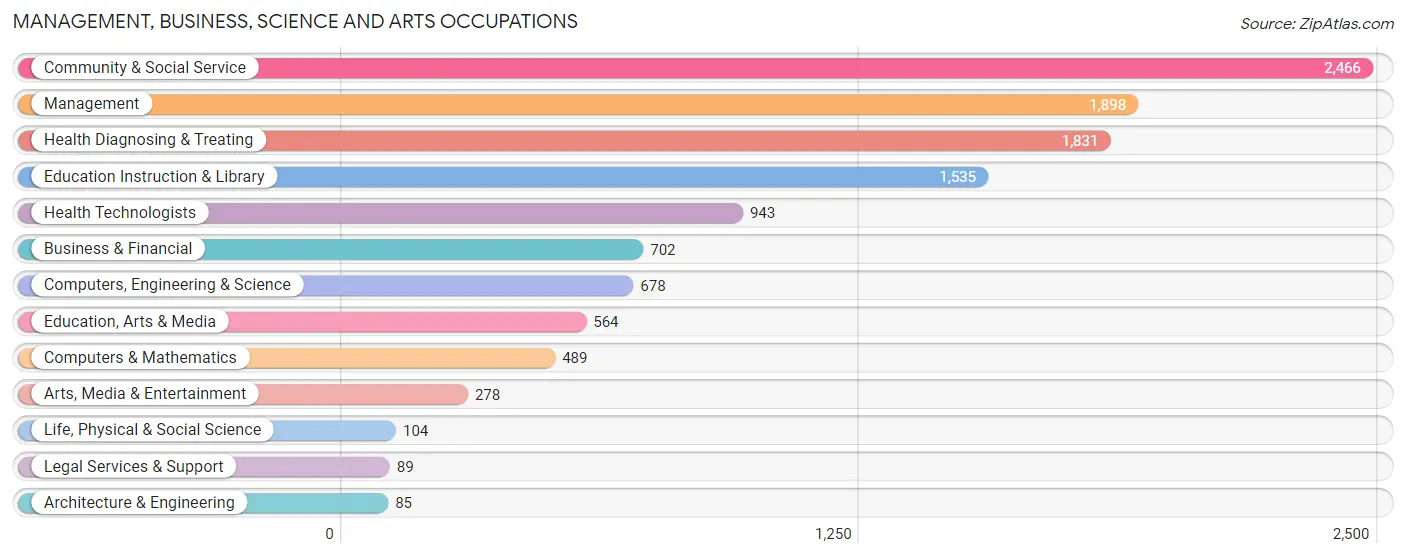
Management, Business, Science and Arts Occupations
The most common Management, Business, Science and Arts occupations in Carter County are Community & Social Service (2,466 | 10.6%), Management (1,898 | 8.2%), Health Diagnosing & Treating (1,831 | 7.9%), Education Instruction & Library (1,535 | 6.6%), and Health Technologists (943 | 4.1%).
Management, Business, Science and Arts Occupations by Sex
Within the Management, Business, Science and Arts occupations in Carter County, the most male-oriented occupations are Life, Physical & Social Science (80.8%), Architecture & Engineering (80.0%), and Computers, Engineering & Science (69.5%), while the most female-oriented occupations are Health Diagnosing & Treating (83.5%), Health Technologists (83.0%), and Education Instruction & Library (73.9%).
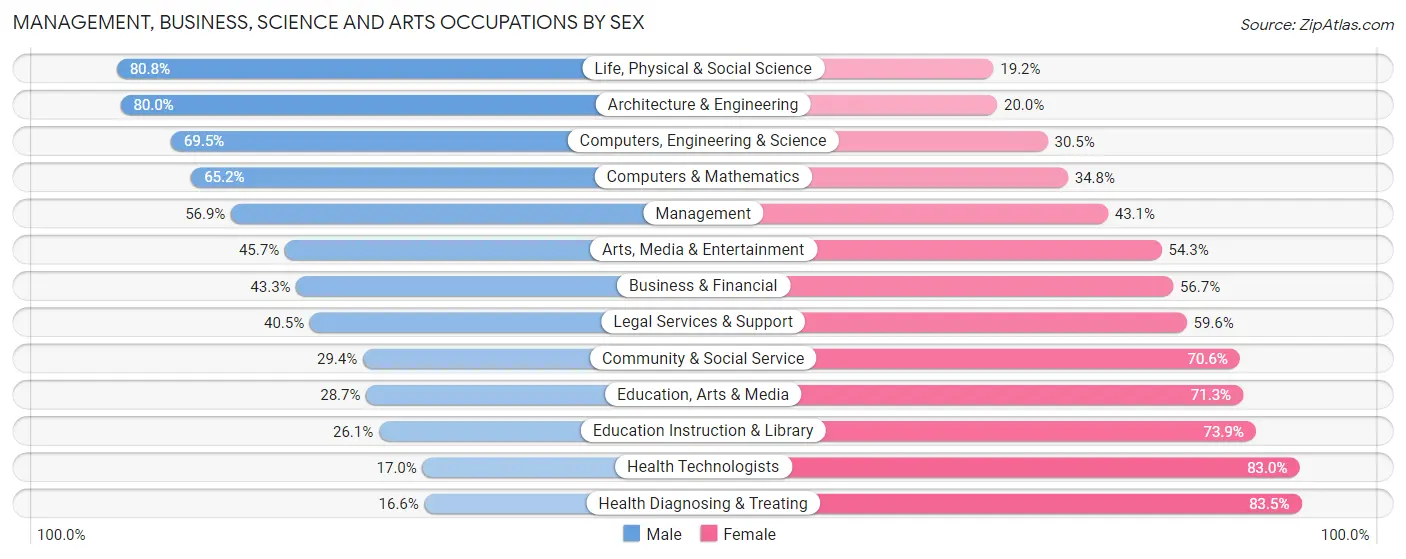
| Occupation | Male | Female |
| Management | 1,080 (56.9%) | 818 (43.1%) |
| Business & Financial | 304 (43.3%) | 398 (56.7%) |
| Computers, Engineering & Science | 471 (69.5%) | 207 (30.5%) |
| Computers & Mathematics | 319 (65.2%) | 170 (34.8%) |
| Architecture & Engineering | 68 (80.0%) | 17 (20.0%) |
| Life, Physical & Social Science | 84 (80.8%) | 20 (19.2%) |
| Community & Social Service | 725 (29.4%) | 1,741 (70.6%) |
| Education, Arts & Media | 162 (28.7%) | 402 (71.3%) |
| Legal Services & Support | 36 (40.5%) | 53 (59.6%) |
| Education Instruction & Library | 400 (26.1%) | 1,135 (73.9%) |
| Arts, Media & Entertainment | 127 (45.7%) | 151 (54.3%) |
| Health Diagnosing & Treating | 303 (16.6%) | 1,528 (83.5%) |
| Health Technologists | 160 (17.0%) | 783 (83.0%) |
| Total (Category) | 2,883 (38.1%) | 4,692 (61.9%) |
| Total (Overall) | 11,908 (51.4%) | 11,247 (48.6%) |
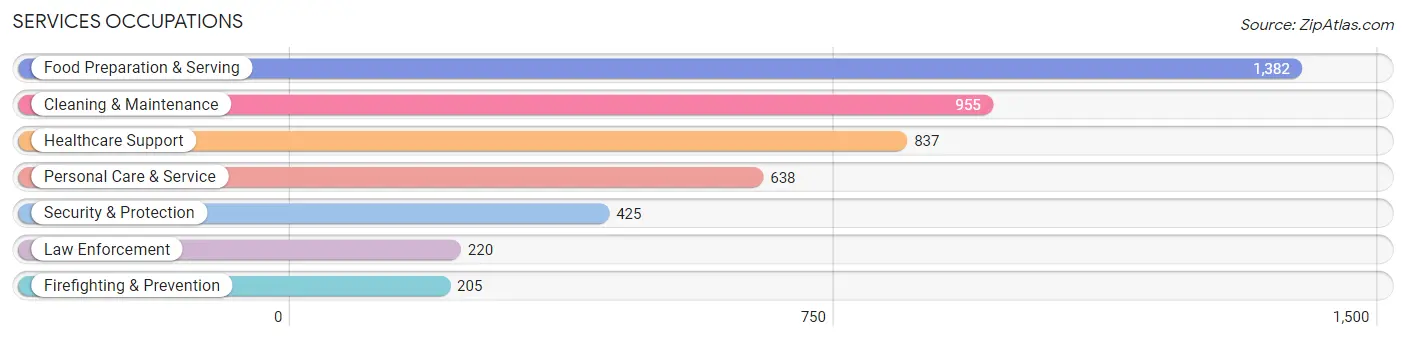
Services Occupations
The most common Services occupations in Carter County are Food Preparation & Serving (1,382 | 6.0%), Cleaning & Maintenance (955 | 4.1%), Healthcare Support (837 | 3.6%), Personal Care & Service (638 | 2.8%), and Security & Protection (425 | 1.8%).
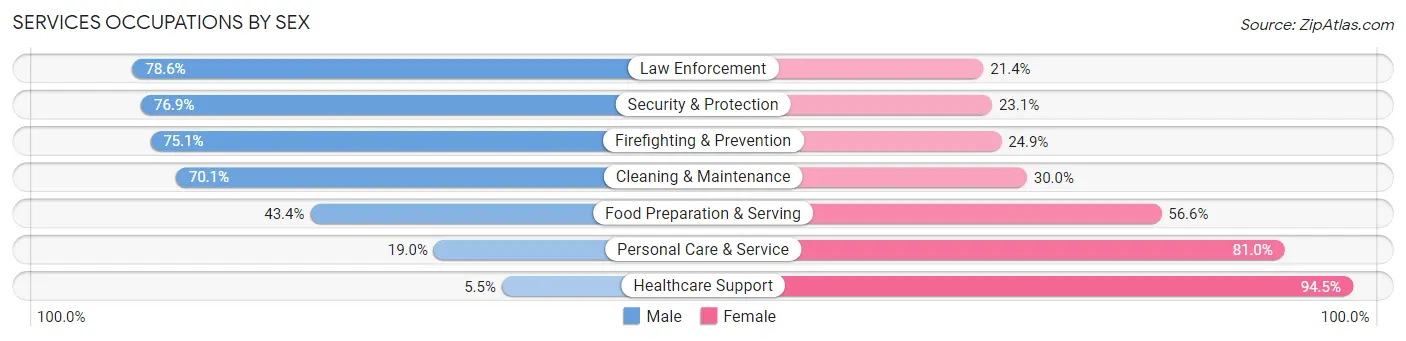
Services Occupations by Sex
Within the Services occupations in Carter County, the most male-oriented occupations are Law Enforcement (78.6%), Security & Protection (76.9%), and Firefighting & Prevention (75.1%), while the most female-oriented occupations are Healthcare Support (94.5%), Personal Care & Service (81.0%), and Food Preparation & Serving (56.6%).
| Occupation | Male | Female |
| Healthcare Support | 46 (5.5%) | 791 (94.5%) |
| Security & Protection | 327 (76.9%) | 98 (23.1%) |
| Firefighting & Prevention | 154 (75.1%) | 51 (24.9%) |
| Law Enforcement | 173 (78.6%) | 47 (21.4%) |
| Food Preparation & Serving | 600 (43.4%) | 782 (56.6%) |
| Cleaning & Maintenance | 669 (70.1%) | 286 (29.9%) |
| Personal Care & Service | 121 (19.0%) | 517 (81.0%) |
| Total (Category) | 1,763 (41.6%) | 2,474 (58.4%) |
| Total (Overall) | 11,908 (51.4%) | 11,247 (48.6%) |
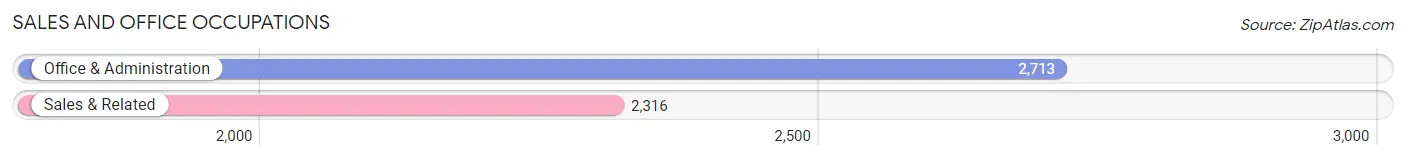
Sales and Office Occupations
The most common Sales and Office occupations in Carter County are Office & Administration (2,713 | 11.7%), and Sales & Related (2,316 | 10.0%).
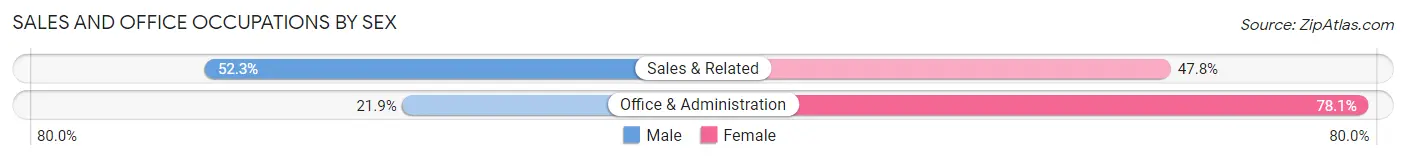
Sales and Office Occupations by Sex
| Occupation | Male | Female |
| Sales & Related | 1,210 (52.2%) | 1,106 (47.7%) |
| Office & Administration | 593 (21.9%) | 2,120 (78.1%) |
| Total (Category) | 1,803 (35.8%) | 3,226 (64.1%) |
| Total (Overall) | 11,908 (51.4%) | 11,247 (48.6%) |
Natural Resources, Construction and Maintenance Occupations
The most common Natural Resources, Construction and Maintenance occupations in Carter County are Construction & Extraction (1,486 | 6.4%), Installation, Maintenance & Repair (944 | 4.1%), and Farming, Fishing & Forestry (104 | 0.4%).
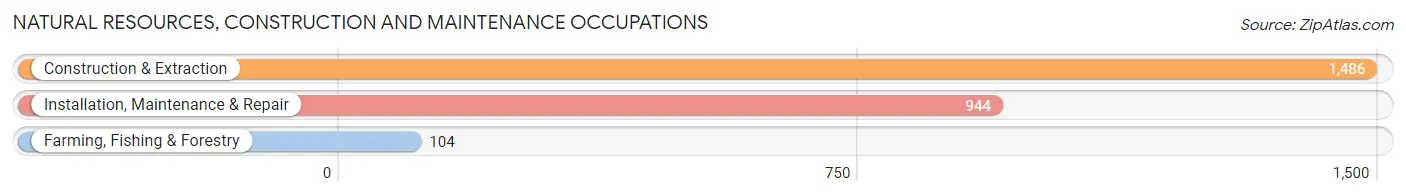
Natural Resources, Construction and Maintenance Occupations by Sex
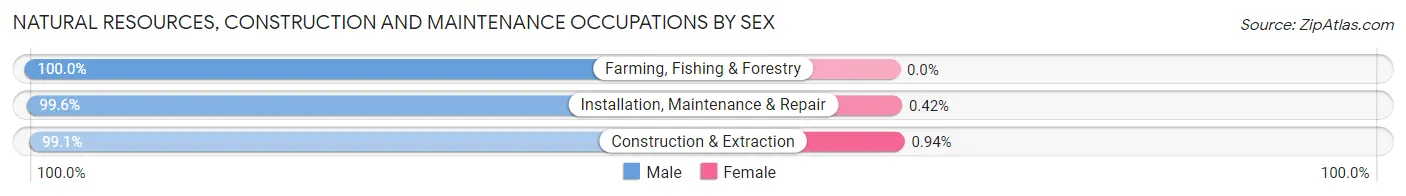
| Occupation | Male | Female |
| Farming, Fishing & Forestry | 104 (100.0%) | 0 (0.0%) |
| Construction & Extraction | 1,472 (99.1%) | 14 (0.9%) |
| Installation, Maintenance & Repair | 940 (99.6%) | 4 (0.4%) |
| Total (Category) | 2,516 (99.3%) | 18 (0.7%) |
| Total (Overall) | 11,908 (51.4%) | 11,247 (48.6%) |
Production, Transportation and Moving Occupations
The most common Production, Transportation and Moving occupations in Carter County are Production (1,913 | 8.3%), Transportation (1,194 | 5.2%), and Material Moving (673 | 2.9%).
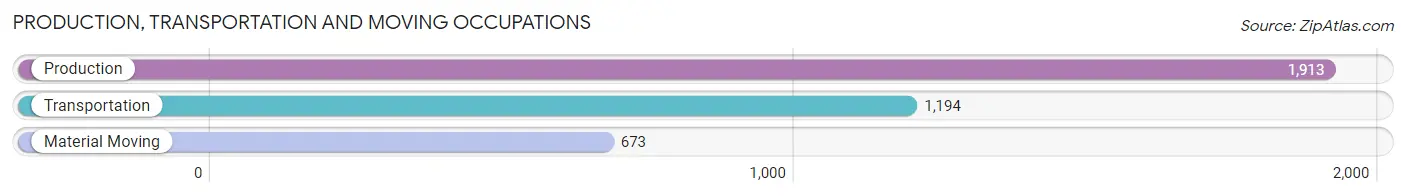
Production, Transportation and Moving Occupations by Sex
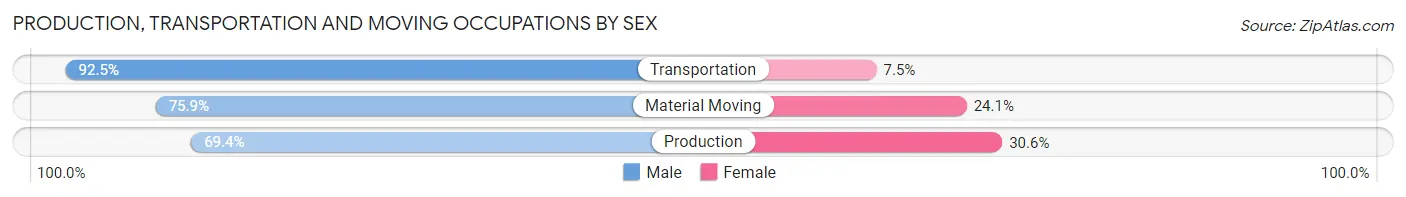
| Occupation | Male | Female |
| Production | 1,328 (69.4%) | 585 (30.6%) |
| Transportation | 1,104 (92.5%) | 90 (7.5%) |
| Material Moving | 511 (75.9%) | 162 (24.1%) |
| Total (Category) | 2,943 (77.9%) | 837 (22.1%) |
| Total (Overall) | 11,908 (51.4%) | 11,247 (48.6%) |
Employment Industries by Sex in Carter County
Employment Industries in Carter County
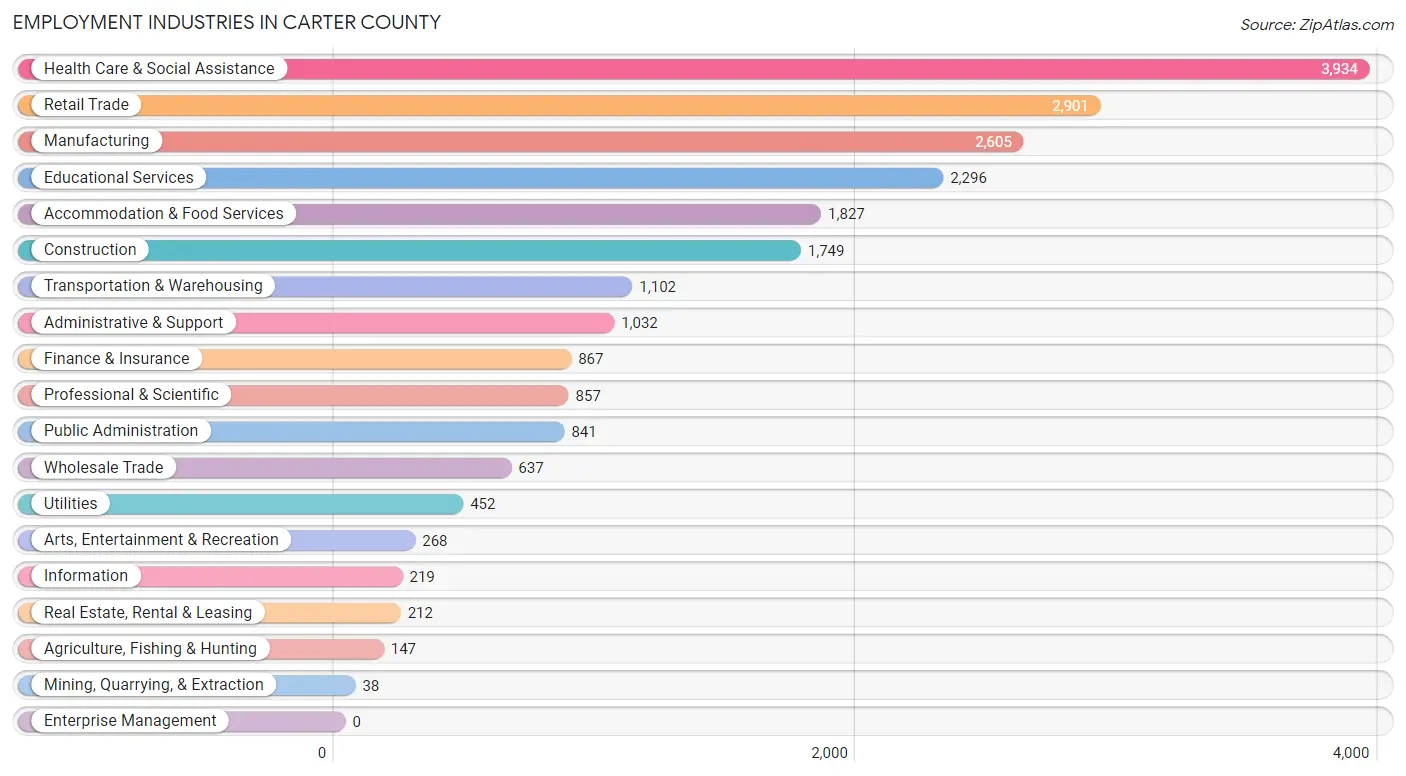
The major employment industries in Carter County include Health Care & Social Assistance (3,934 | 17.0%), Retail Trade (2,901 | 12.5%), Manufacturing (2,605 | 11.3%), Educational Services (2,296 | 9.9%), and Accommodation & Food Services (1,827 | 7.9%).
Employment Industries by Sex in Carter County
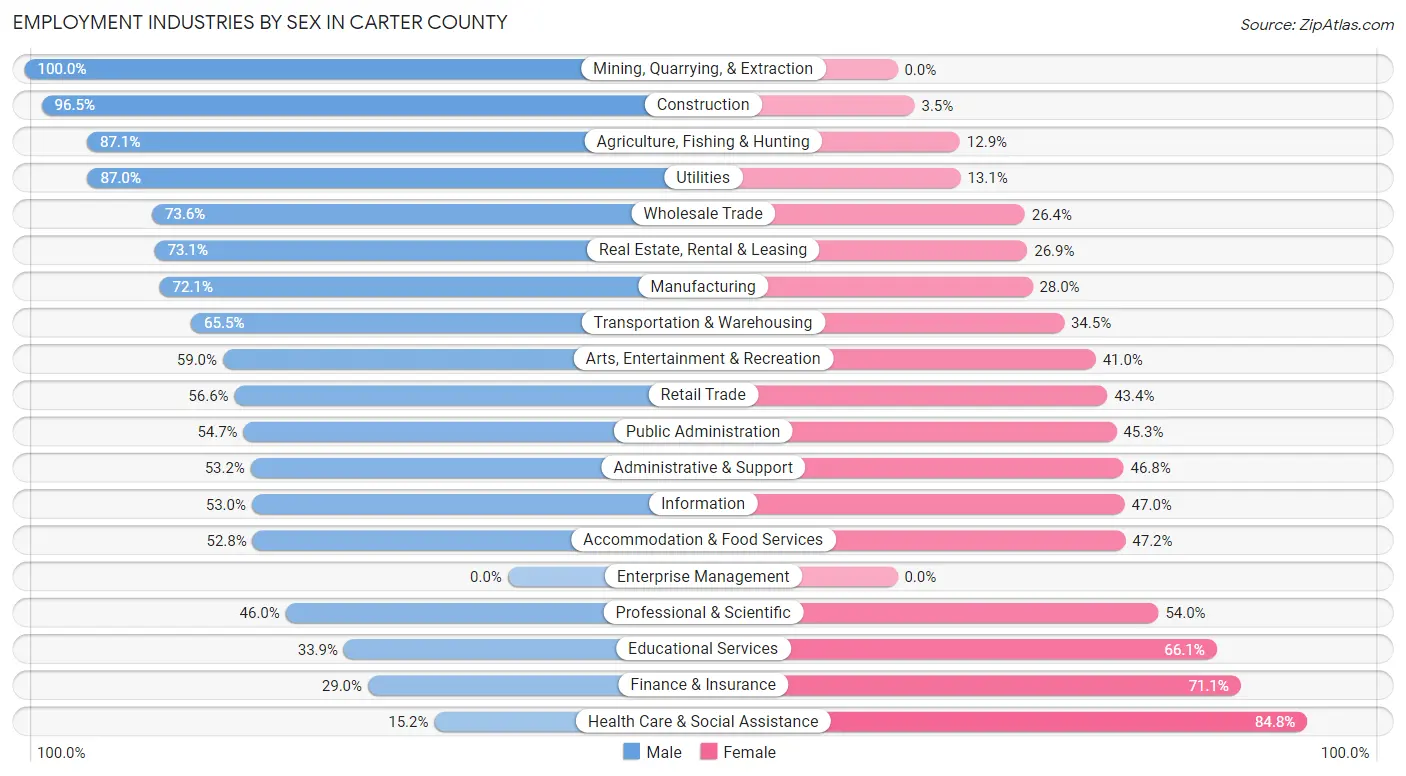
The Carter County industries that see more men than women are Mining, Quarrying, & Extraction (100.0%), Construction (96.5%), and Agriculture, Fishing & Hunting (87.1%), whereas the industries that tend to have a higher number of women are Health Care & Social Assistance (84.8%), Finance & Insurance (71.1%), and Educational Services (66.1%).
| Industry | Male | Female |
| Agriculture, Fishing & Hunting | 128 (87.1%) | 19 (12.9%) |
| Mining, Quarrying, & Extraction | 38 (100.0%) | 0 (0.0%) |
| Construction | 1,687 (96.5%) | 62 (3.5%) |
| Manufacturing | 1,877 (72.1%) | 728 (28.0%) |
| Wholesale Trade | 469 (73.6%) | 168 (26.4%) |
| Retail Trade | 1,641 (56.6%) | 1,260 (43.4%) |
| Transportation & Warehousing | 722 (65.5%) | 380 (34.5%) |
| Utilities | 393 (87.0%) | 59 (13.1%) |
| Information | 116 (53.0%) | 103 (47.0%) |
| Finance & Insurance | 251 (28.9%) | 616 (71.1%) |
| Real Estate, Rental & Leasing | 155 (73.1%) | 57 (26.9%) |
| Professional & Scientific | 394 (46.0%) | 463 (54.0%) |
| Enterprise Management | 0 (0.0%) | 0 (0.0%) |
| Administrative & Support | 549 (53.2%) | 483 (46.8%) |
| Educational Services | 779 (33.9%) | 1,517 (66.1%) |
| Health Care & Social Assistance | 598 (15.2%) | 3,336 (84.8%) |
| Arts, Entertainment & Recreation | 158 (59.0%) | 110 (41.0%) |
| Accommodation & Food Services | 965 (52.8%) | 862 (47.2%) |
| Public Administration | 460 (54.7%) | 381 (45.3%) |
| Total | 11,908 (51.4%) | 11,247 (48.6%) |
Education in Carter County
School Enrollment in Carter County
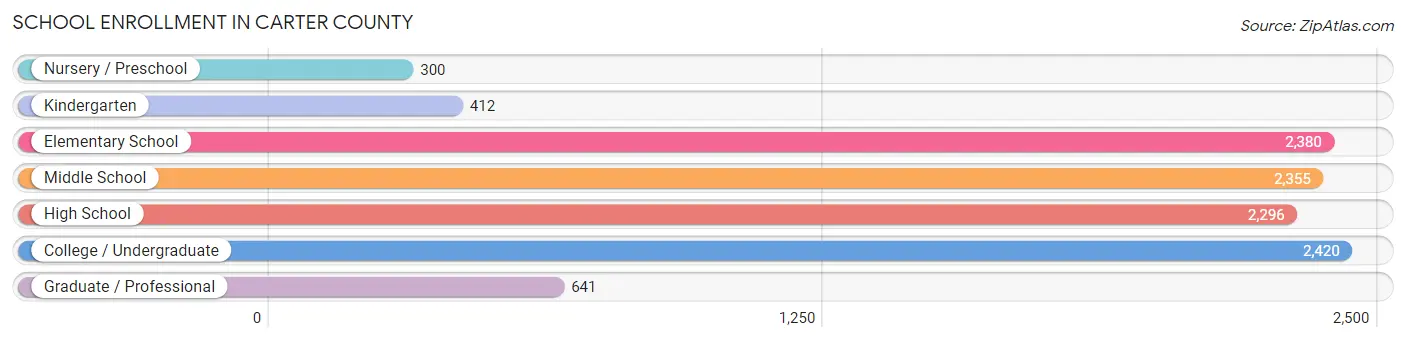
The most common levels of schooling among the 10,804 students in Carter County are college / undergraduate (2,420 | 22.4%), elementary school (2,380 | 22.0%), and middle school (2,355 | 21.8%).
| School Level | # Students | % Students |
| Nursery / Preschool | 300 | 2.8% |
| Kindergarten | 412 | 3.8% |
| Elementary School | 2,380 | 22.0% |
| Middle School | 2,355 | 21.8% |
| High School | 2,296 | 21.2% |
| College / Undergraduate | 2,420 | 22.4% |
| Graduate / Professional | 641 | 5.9% |
| Total | 10,804 | 100.0% |
School Enrollment by Age by Funding Source in Carter County
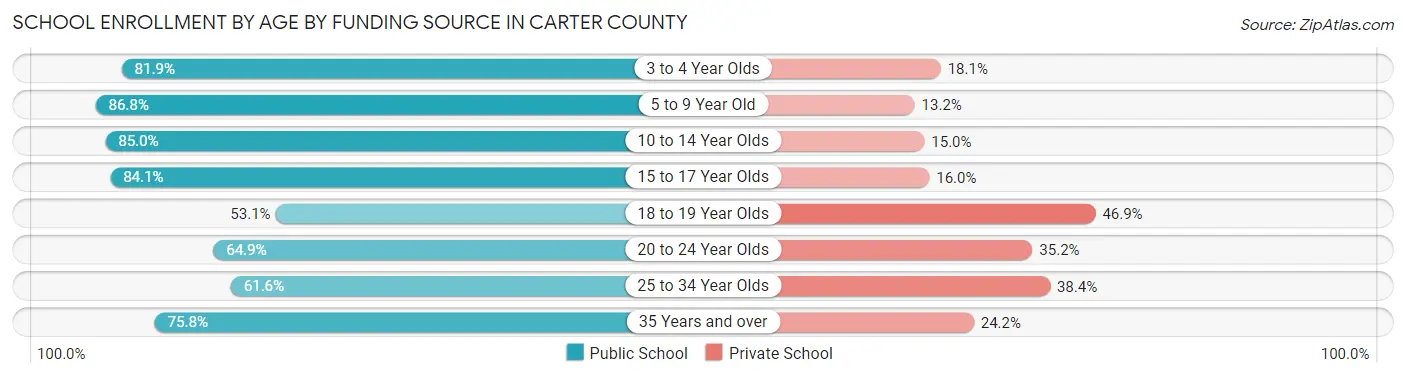
Out of a total of 10,804 students who are enrolled in schools in Carter County, 2,312 (21.4%) attend a private institution, while the remaining 8,492 (78.6%) are enrolled in public schools. The age group of 18 to 19 year olds has the highest likelihood of being enrolled in private schools, with 386 (46.9% in the age bracket) enrolled. Conversely, the age group of 5 to 9 year old has the lowest likelihood of being enrolled in a private school, with 2,061 (86.8% in the age bracket) attending a public institution.
| Age Bracket | Public School | Private School |
| 3 to 4 Year Olds | 213 (81.9%) | 47 (18.1%) |
| 5 to 9 Year Old | 2,061 (86.8%) | 314 (13.2%) |
| 10 to 14 Year Olds | 2,618 (85.0%) | 463 (15.0%) |
| 15 to 17 Year Olds | 1,560 (84.1%) | 296 (16.0%) |
| 18 to 19 Year Olds | 437 (53.1%) | 386 (46.9%) |
| 20 to 24 Year Olds | 703 (64.8%) | 381 (35.1%) |
| 25 to 34 Year Olds | 455 (61.6%) | 284 (38.4%) |
| 35 Years and over | 444 (75.8%) | 142 (24.2%) |
| Total | 8,492 (78.6%) | 2,312 (21.4%) |
Educational Attainment by Field of Study in Carter County
Education (1,976 | 20.7%), business (1,403 | 14.7%), science & technology (1,327 | 13.9%), arts & humanities (981 | 10.3%), and psychology (710 | 7.4%) are the most common fields of study among 9,526 individuals in Carter County who have obtained a bachelor's degree or higher.
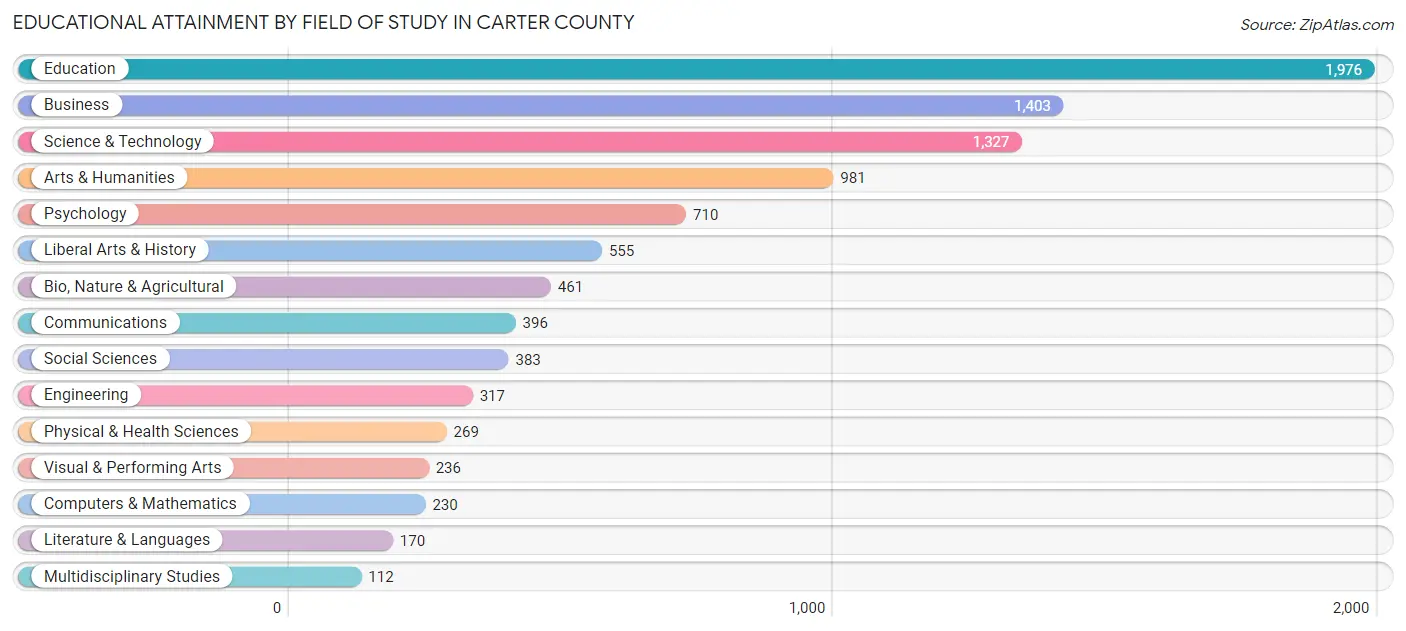
| Field of Study | # Graduates | % Graduates |
| Computers & Mathematics | 230 | 2.4% |
| Bio, Nature & Agricultural | 461 | 4.8% |
| Physical & Health Sciences | 269 | 2.8% |
| Psychology | 710 | 7.4% |
| Social Sciences | 383 | 4.0% |
| Engineering | 317 | 3.3% |
| Multidisciplinary Studies | 112 | 1.2% |
| Science & Technology | 1,327 | 13.9% |
| Business | 1,403 | 14.7% |
| Education | 1,976 | 20.7% |
| Literature & Languages | 170 | 1.8% |
| Liberal Arts & History | 555 | 5.8% |
| Visual & Performing Arts | 236 | 2.5% |
| Communications | 396 | 4.2% |
| Arts & Humanities | 981 | 10.3% |
| Total | 9,526 | 100.0% |
Transportation & Commute in Carter County
Vehicle Availability by Sex in Carter County
The most prevalent vehicle ownership categories in Carter County are males with 2 vehicles (4,837, accounting for 41.4%) and females with 2 vehicles (3,822, making up 44.4%).
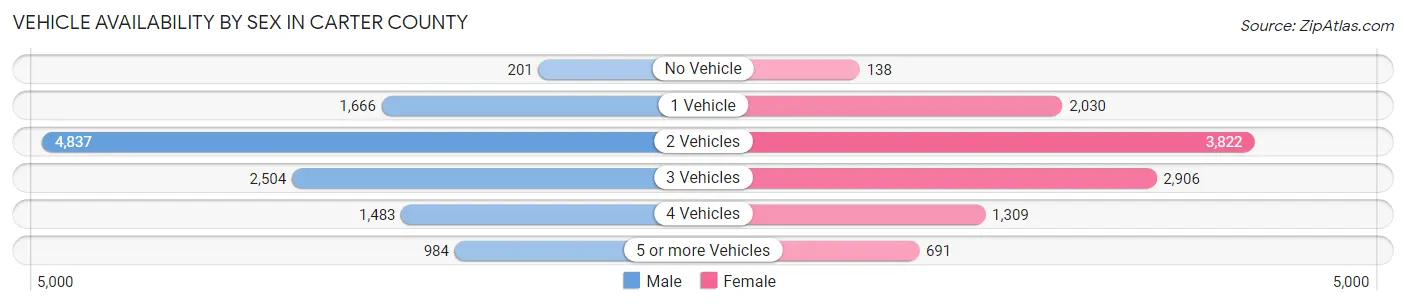
| Vehicles Available | Male | Female |
| No Vehicle | 201 (1.7%) | 138 (1.3%) |
| 1 Vehicle | 1,666 (14.3%) | 2,030 (18.6%) |
| 2 Vehicles | 4,837 (41.4%) | 3,822 (35.1%) |
| 3 Vehicles | 2,504 (21.4%) | 2,906 (26.7%) |
| 4 Vehicles | 1,483 (12.7%) | 1,309 (12.0%) |
| 5 or more Vehicles | 984 (8.4%) | 691 (6.3%) |
| Total | 11,675 (100.0%) | 10,896 (100.0%) |
Commute Time in Carter County
The most frequently occuring commute durations in Carter County are 15 to 19 minutes (3,597 commuters, 16.8%), 10 to 14 minutes (3,138 commuters, 14.7%), and 30 to 34 minutes (2,993 commuters, 14.0%).

| Commute Time | # Commuters | % Commuters |
| Less than 5 Minutes | 730 | 3.4% |
| 5 to 9 Minutes | 2,127 | 10.0% |
| 10 to 14 Minutes | 3,138 | 14.7% |
| 15 to 19 Minutes | 3,597 | 16.8% |
| 20 to 24 Minutes | 2,663 | 12.4% |
| 25 to 29 Minutes | 1,950 | 9.1% |
| 30 to 34 Minutes | 2,993 | 14.0% |
| 35 to 39 Minutes | 677 | 3.2% |
| 40 to 44 Minutes | 824 | 3.8% |
| 45 to 59 Minutes | 1,731 | 8.1% |
| 60 to 89 Minutes | 723 | 3.4% |
| 90 or more Minutes | 231 | 1.1% |
Commute Time by Sex in Carter County
The most common commute times in Carter County are 30 to 34 minutes (1,606 commuters, 14.5%) for males and 15 to 19 minutes (2,157 commuters, 20.9%) for females.
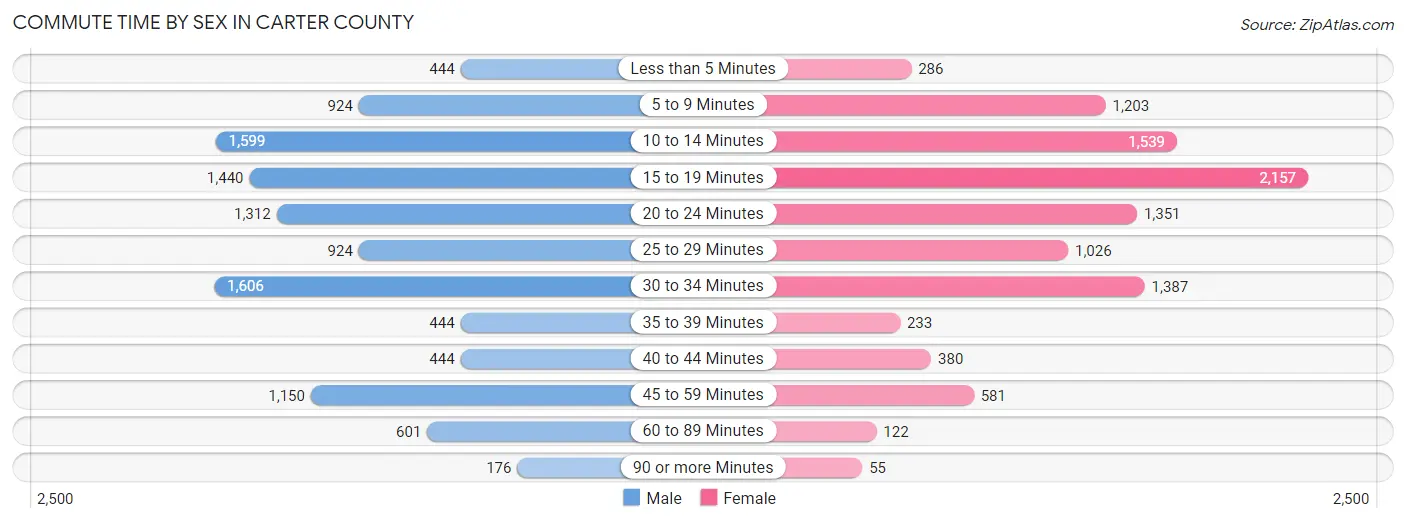
| Commute Time | Male | Female |
| Less than 5 Minutes | 444 (4.0%) | 286 (2.8%) |
| 5 to 9 Minutes | 924 (8.4%) | 1,203 (11.7%) |
| 10 to 14 Minutes | 1,599 (14.4%) | 1,539 (14.9%) |
| 15 to 19 Minutes | 1,440 (13.0%) | 2,157 (20.9%) |
| 20 to 24 Minutes | 1,312 (11.9%) | 1,351 (13.1%) |
| 25 to 29 Minutes | 924 (8.4%) | 1,026 (9.9%) |
| 30 to 34 Minutes | 1,606 (14.5%) | 1,387 (13.4%) |
| 35 to 39 Minutes | 444 (4.0%) | 233 (2.3%) |
| 40 to 44 Minutes | 444 (4.0%) | 380 (3.7%) |
| 45 to 59 Minutes | 1,150 (10.4%) | 581 (5.6%) |
| 60 to 89 Minutes | 601 (5.4%) | 122 (1.2%) |
| 90 or more Minutes | 176 (1.6%) | 55 (0.5%) |
Time of Departure to Work by Sex in Carter County
The most frequent times of departure to work in Carter County are 7:00 AM to 7:29 AM (1,653, 14.9%) for males and 7:00 AM to 7:29 AM (2,019, 19.6%) for females.
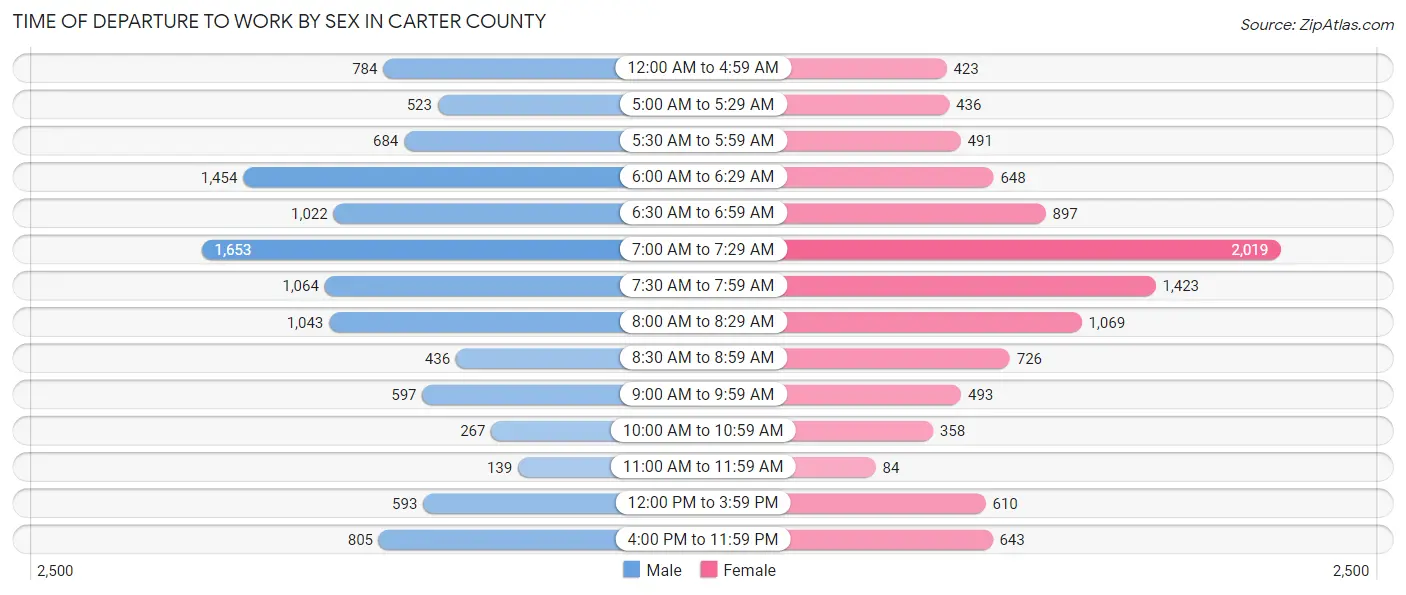
| Time of Departure | Male | Female |
| 12:00 AM to 4:59 AM | 784 (7.1%) | 423 (4.1%) |
| 5:00 AM to 5:29 AM | 523 (4.7%) | 436 (4.2%) |
| 5:30 AM to 5:59 AM | 684 (6.2%) | 491 (4.8%) |
| 6:00 AM to 6:29 AM | 1,454 (13.1%) | 648 (6.3%) |
| 6:30 AM to 6:59 AM | 1,022 (9.2%) | 897 (8.7%) |
| 7:00 AM to 7:29 AM | 1,653 (14.9%) | 2,019 (19.6%) |
| 7:30 AM to 7:59 AM | 1,064 (9.6%) | 1,423 (13.8%) |
| 8:00 AM to 8:29 AM | 1,043 (9.4%) | 1,069 (10.4%) |
| 8:30 AM to 8:59 AM | 436 (3.9%) | 726 (7.0%) |
| 9:00 AM to 9:59 AM | 597 (5.4%) | 493 (4.8%) |
| 10:00 AM to 10:59 AM | 267 (2.4%) | 358 (3.5%) |
| 11:00 AM to 11:59 AM | 139 (1.3%) | 84 (0.8%) |
| 12:00 PM to 3:59 PM | 593 (5.4%) | 610 (5.9%) |
| 4:00 PM to 11:59 PM | 805 (7.3%) | 643 (6.2%) |
| Total | 11,064 (100.0%) | 10,320 (100.0%) |
Housing Occupancy in Carter County
Occupancy by Ownership in Carter County
Of the total 23,940 dwellings in Carter County, owner-occupied units account for 17,555 (73.3%), while renter-occupied units make up 6,385 (26.7%).
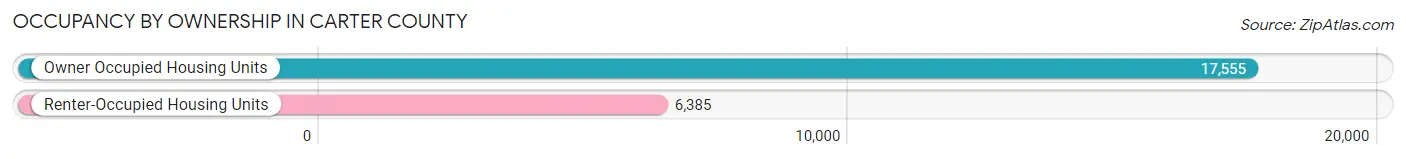
| Occupancy | # Housing Units | % Housing Units |
| Owner Occupied Housing Units | 17,555 | 73.3% |
| Renter-Occupied Housing Units | 6,385 | 26.7% |
| Total Occupied Housing Units | 23,940 | 100.0% |
Occupancy by Household Size in Carter County
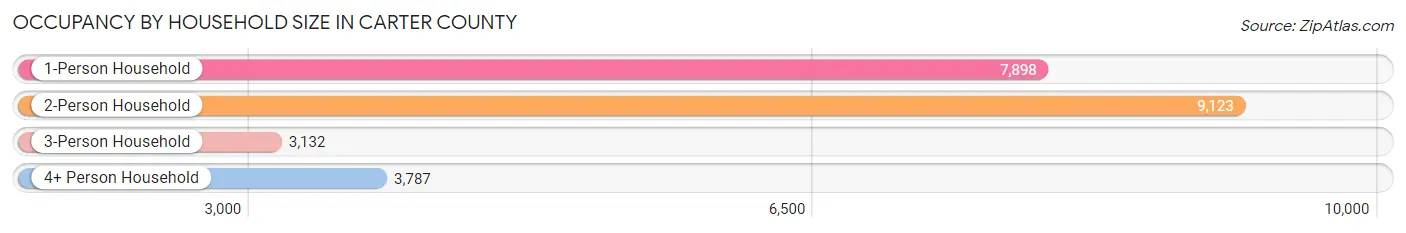
| Household Size | # Housing Units | % Housing Units |
| 1-Person Household | 7,898 | 33.0% |
| 2-Person Household | 9,123 | 38.1% |
| 3-Person Household | 3,132 | 13.1% |
| 4+ Person Household | 3,787 | 15.8% |
| Total Housing Units | 23,940 | 100.0% |
Occupancy by Ownership by Household Size in Carter County
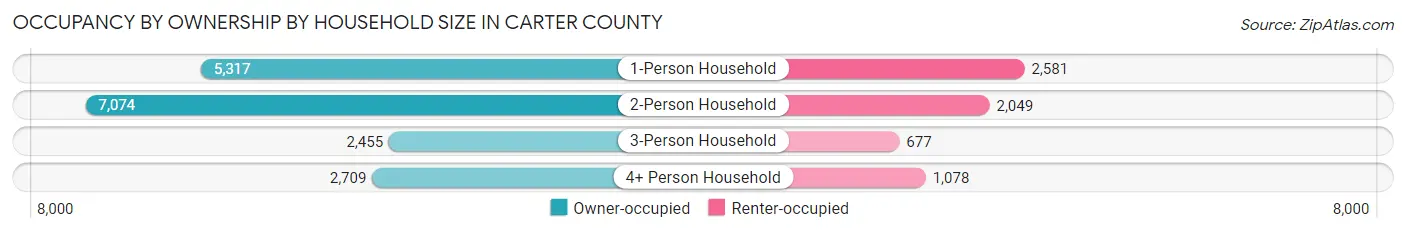
| Household Size | Owner-occupied | Renter-occupied |
| 1-Person Household | 5,317 (67.3%) | 2,581 (32.7%) |
| 2-Person Household | 7,074 (77.5%) | 2,049 (22.5%) |
| 3-Person Household | 2,455 (78.4%) | 677 (21.6%) |
| 4+ Person Household | 2,709 (71.5%) | 1,078 (28.5%) |
| Total Housing Units | 17,555 (73.3%) | 6,385 (26.7%) |
Occupancy by Educational Attainment in Carter County
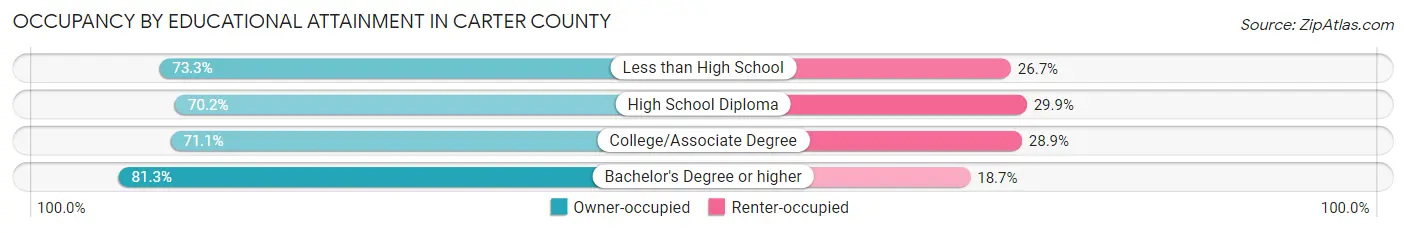
| Household Size | Owner-occupied | Renter-occupied |
| Less than High School | 1,948 (73.3%) | 710 (26.7%) |
| High School Diploma | 5,908 (70.2%) | 2,514 (29.8%) |
| College/Associate Degree | 5,291 (71.1%) | 2,150 (28.9%) |
| Bachelor's Degree or higher | 4,408 (81.3%) | 1,011 (18.7%) |
Occupancy by Age of Householder in Carter County
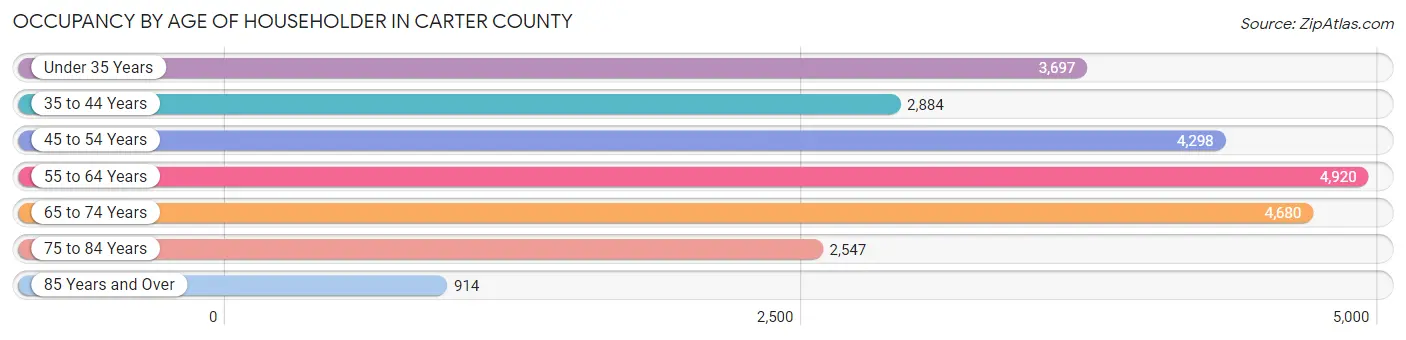
| Age Bracket | # Households | % Households |
| Under 35 Years | 3,697 | 15.4% |
| 35 to 44 Years | 2,884 | 12.0% |
| 45 to 54 Years | 4,298 | 17.9% |
| 55 to 64 Years | 4,920 | 20.5% |
| 65 to 74 Years | 4,680 | 19.6% |
| 75 to 84 Years | 2,547 | 10.6% |
| 85 Years and Over | 914 | 3.8% |
| Total | 23,940 | 100.0% |
Housing Finances in Carter County
Median Income by Occupancy in Carter County
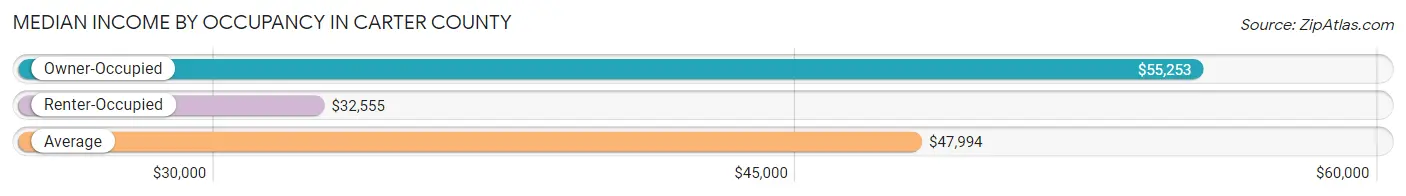
| Occupancy Type | # Households | Median Income |
| Owner-Occupied | 17,555 (73.3%) | $55,253 |
| Renter-Occupied | 6,385 (26.7%) | $32,555 |
| Average | 23,940 (100.0%) | $47,994 |
Occupancy by Householder Income Bracket in Carter County
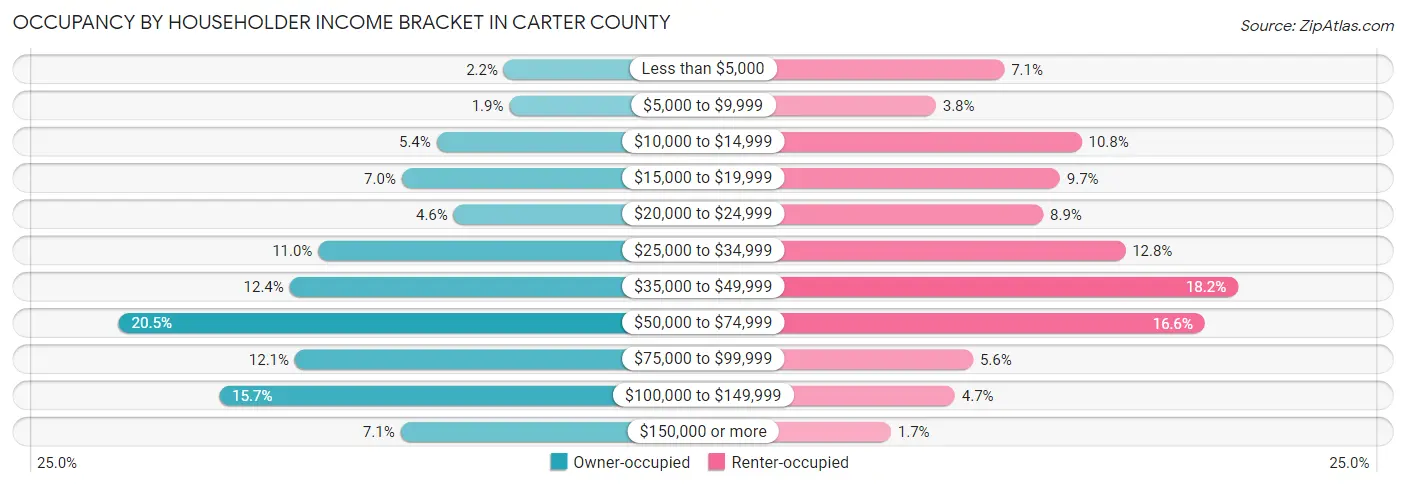
| Income Bracket | Owner-occupied | Renter-occupied |
| Less than $5,000 | 383 (2.2%) | 452 (7.1%) |
| $5,000 to $9,999 | 337 (1.9%) | 244 (3.8%) |
| $10,000 to $14,999 | 945 (5.4%) | 687 (10.8%) |
| $15,000 to $19,999 | 1,236 (7.0%) | 621 (9.7%) |
| $20,000 to $24,999 | 802 (4.6%) | 570 (8.9%) |
| $25,000 to $34,999 | 1,934 (11.0%) | 820 (12.8%) |
| $35,000 to $49,999 | 2,174 (12.4%) | 1,163 (18.2%) |
| $50,000 to $74,999 | 3,603 (20.5%) | 1,062 (16.6%) |
| $75,000 to $99,999 | 2,130 (12.1%) | 357 (5.6%) |
| $100,000 to $149,999 | 2,764 (15.7%) | 302 (4.7%) |
| $150,000 or more | 1,247 (7.1%) | 107 (1.7%) |
| Total | 17,555 (100.0%) | 6,385 (100.0%) |
Monthly Housing Cost Tiers in Carter County
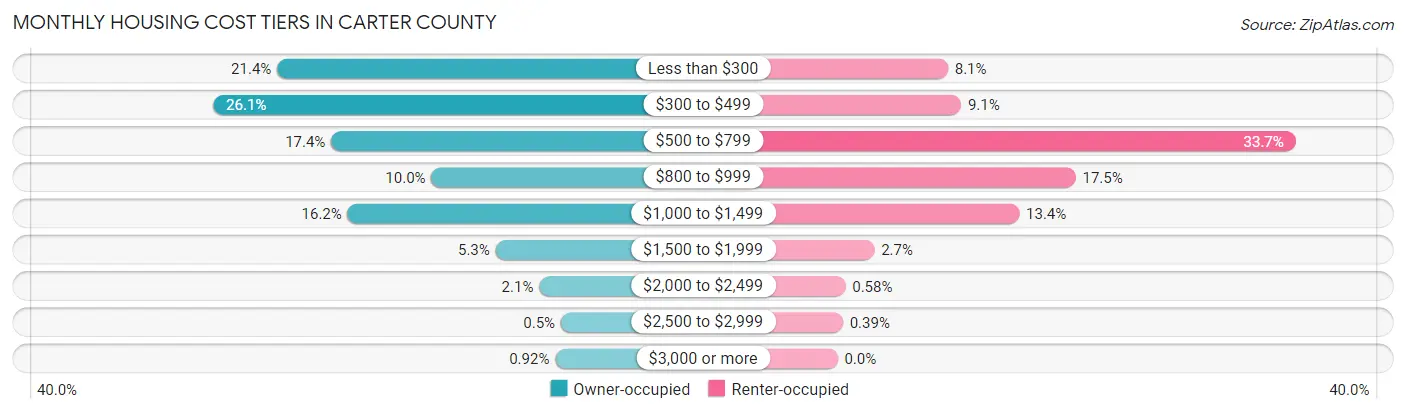
| Monthly Cost | Owner-occupied | Renter-occupied |
| Less than $300 | 3,756 (21.4%) | 519 (8.1%) |
| $300 to $499 | 4,584 (26.1%) | 581 (9.1%) |
| $500 to $799 | 3,058 (17.4%) | 2,154 (33.7%) |
| $800 to $999 | 1,763 (10.0%) | 1,120 (17.5%) |
| $1,000 to $1,499 | 2,845 (16.2%) | 854 (13.4%) |
| $1,500 to $1,999 | 933 (5.3%) | 173 (2.7%) |
| $2,000 to $2,499 | 368 (2.1%) | 37 (0.6%) |
| $2,500 to $2,999 | 87 (0.5%) | 25 (0.4%) |
| $3,000 or more | 161 (0.9%) | 0 (0.0%) |
| Total | 17,555 (100.0%) | 6,385 (100.0%) |
Physical Housing Characteristics in Carter County
Housing Structures in Carter County
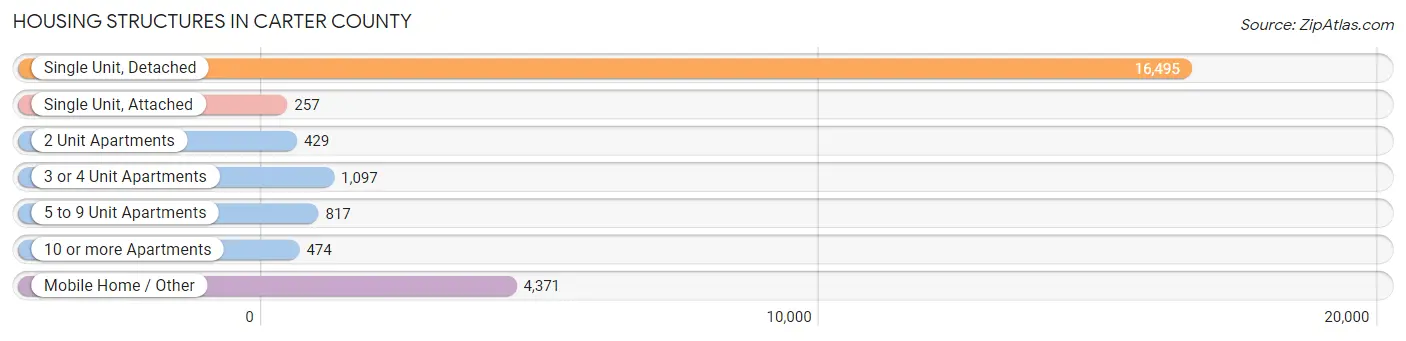
| Structure Type | # Housing Units | % Housing Units |
| Single Unit, Detached | 16,495 | 68.9% |
| Single Unit, Attached | 257 | 1.1% |
| 2 Unit Apartments | 429 | 1.8% |
| 3 or 4 Unit Apartments | 1,097 | 4.6% |
| 5 to 9 Unit Apartments | 817 | 3.4% |
| 10 or more Apartments | 474 | 2.0% |
| Mobile Home / Other | 4,371 | 18.3% |
| Total | 23,940 | 100.0% |
Housing Structures by Occupancy in Carter County
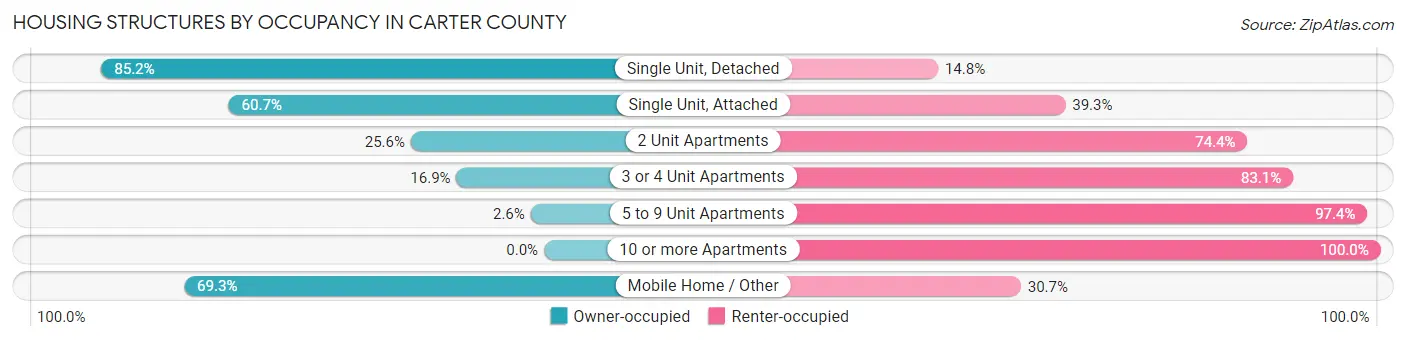
| Structure Type | Owner-occupied | Renter-occupied |
| Single Unit, Detached | 14,055 (85.2%) | 2,440 (14.8%) |
| Single Unit, Attached | 156 (60.7%) | 101 (39.3%) |
| 2 Unit Apartments | 110 (25.6%) | 319 (74.4%) |
| 3 or 4 Unit Apartments | 185 (16.9%) | 912 (83.1%) |
| 5 to 9 Unit Apartments | 21 (2.6%) | 796 (97.4%) |
| 10 or more Apartments | 0 (0.0%) | 474 (100.0%) |
| Mobile Home / Other | 3,028 (69.3%) | 1,343 (30.7%) |
| Total | 17,555 (73.3%) | 6,385 (26.7%) |
Housing Structures by Number of Rooms in Carter County

| Number of Rooms | Owner-occupied | Renter-occupied |
| 1 Room | 49 (0.3%) | 86 (1.3%) |
| 2 or 3 Rooms | 536 (3.0%) | 1,026 (16.1%) |
| 4 or 5 Rooms | 6,027 (34.3%) | 3,714 (58.2%) |
| 6 or 7 Rooms | 7,183 (40.9%) | 1,072 (16.8%) |
| 8 or more Rooms | 3,760 (21.4%) | 487 (7.6%) |
| Total | 17,555 (100.0%) | 6,385 (100.0%) |
Housing Structure by Heating Type in Carter County
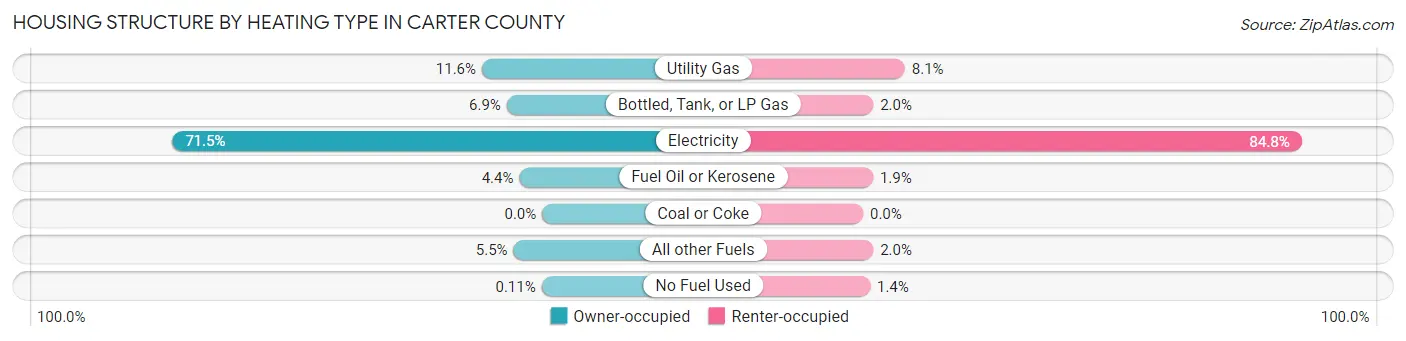
| Heating Type | Owner-occupied | Renter-occupied |
| Utility Gas | 2,043 (11.6%) | 515 (8.1%) |
| Bottled, Tank, or LP Gas | 1,202 (6.9%) | 125 (2.0%) |
| Electricity | 12,546 (71.5%) | 5,411 (84.8%) |
| Fuel Oil or Kerosene | 772 (4.4%) | 122 (1.9%) |
| Coal or Coke | 0 (0.0%) | 0 (0.0%) |
| All other Fuels | 973 (5.5%) | 126 (2.0%) |
| No Fuel Used | 19 (0.1%) | 86 (1.3%) |
| Total | 17,555 (100.0%) | 6,385 (100.0%) |
Household Vehicle Usage in Carter County
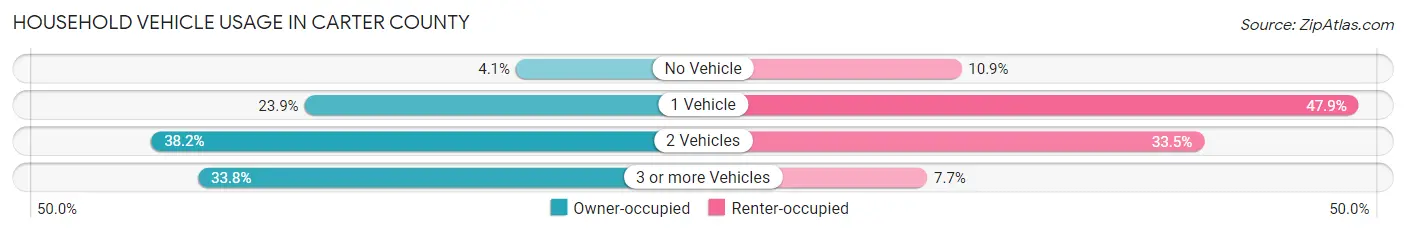
| Vehicles per Household | Owner-occupied | Renter-occupied |
| No Vehicle | 726 (4.1%) | 694 (10.9%) |
| 1 Vehicle | 4,192 (23.9%) | 3,061 (47.9%) |
| 2 Vehicles | 6,703 (38.2%) | 2,140 (33.5%) |
| 3 or more Vehicles | 5,934 (33.8%) | 490 (7.7%) |
| Total | 17,555 (100.0%) | 6,385 (100.0%) |
Real Estate & Mortgages in Carter County
Real Estate and Mortgage Overview in Carter County
| Characteristic | Without Mortgage | With Mortgage |
| Housing Units | 10,029 | 7,526 |
| Median Property Value | $135,400 | $151,500 |
| Median Household Income | $44,296 | $738 |
| Monthly Housing Costs | $353 | $132 |
| Real Estate Taxes | $783 | $309 |
Property Value by Mortgage Status in Carter County
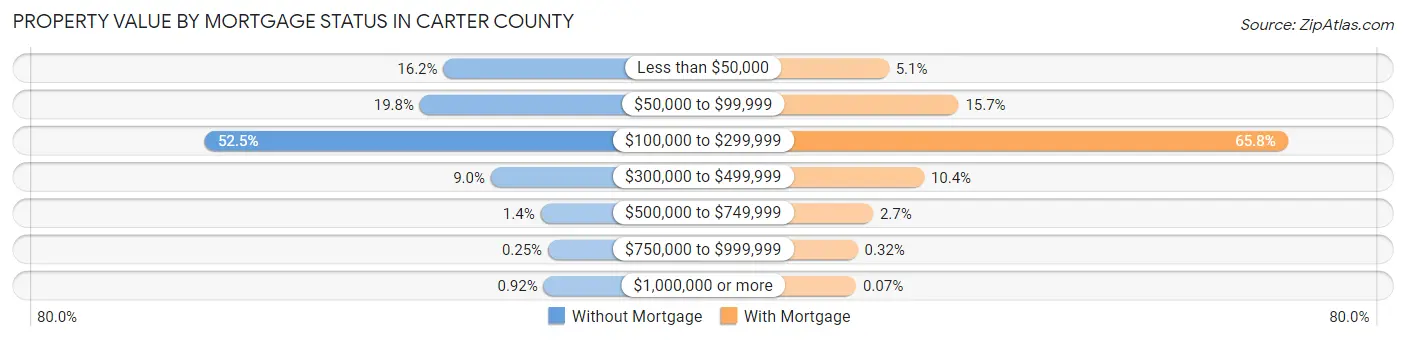
| Property Value | Without Mortgage | With Mortgage |
| Less than $50,000 | 1,624 (16.2%) | 380 (5.1%) |
| $50,000 to $99,999 | 1,984 (19.8%) | 1,180 (15.7%) |
| $100,000 to $299,999 | 5,266 (52.5%) | 4,953 (65.8%) |
| $300,000 to $499,999 | 899 (9.0%) | 784 (10.4%) |
| $500,000 to $749,999 | 139 (1.4%) | 200 (2.7%) |
| $750,000 to $999,999 | 25 (0.3%) | 24 (0.3%) |
| $1,000,000 or more | 92 (0.9%) | 5 (0.1%) |
| Total | 10,029 (100.0%) | 7,526 (100.0%) |
Household Income by Mortgage Status in Carter County

| Household Income | Without Mortgage | With Mortgage |
| Less than $10,000 | 537 (5.3%) | 115 (1.5%) |
| $10,000 to $24,999 | 2,194 (21.9%) | 183 (2.4%) |
| $25,000 to $34,999 | 1,265 (12.6%) | 789 (10.5%) |
| $35,000 to $49,999 | 1,444 (14.4%) | 669 (8.9%) |
| $50,000 to $74,999 | 1,873 (18.7%) | 730 (9.7%) |
| $75,000 to $99,999 | 909 (9.1%) | 1,730 (23.0%) |
| $100,000 to $149,999 | 1,298 (12.9%) | 1,221 (16.2%) |
| $150,000 or more | 509 (5.1%) | 1,466 (19.5%) |
| Total | 10,029 (100.0%) | 7,526 (100.0%) |
Property Value to Household Income Ratio in Carter County
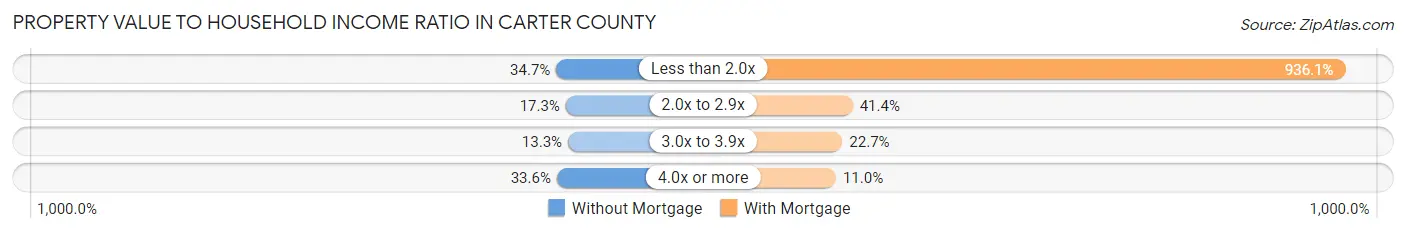
| Value-to-Income Ratio | Without Mortgage | With Mortgage |
| Less than 2.0x | 3,475 (34.6%) | 70,450 (936.1%) |
| 2.0x to 2.9x | 1,733 (17.3%) | 3,116 (41.4%) |
| 3.0x to 3.9x | 1,337 (13.3%) | 1,708 (22.7%) |
| 4.0x or more | 3,370 (33.6%) | 826 (11.0%) |
| Total | 10,029 (100.0%) | 7,526 (100.0%) |
Real Estate Taxes by Mortgage Status in Carter County
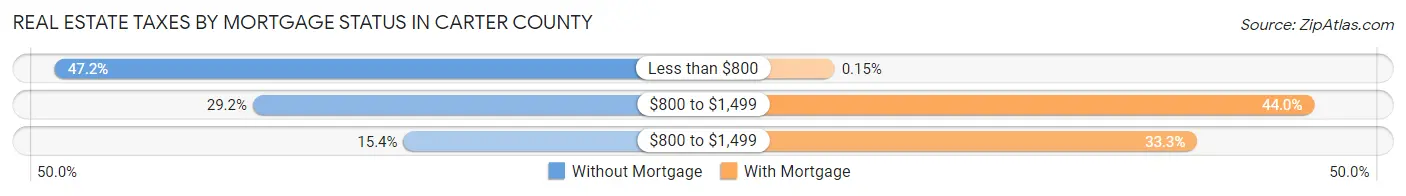
| Property Taxes | Without Mortgage | With Mortgage |
| Less than $800 | 4,737 (47.2%) | 11 (0.2%) |
| $800 to $1,499 | 2,924 (29.2%) | 3,308 (44.0%) |
| $800 to $1,499 | 1,545 (15.4%) | 2,503 (33.3%) |
| Total | 10,029 (100.0%) | 7,526 (100.0%) |
Health & Disability in Carter County
Health Insurance Coverage by Age in Carter County
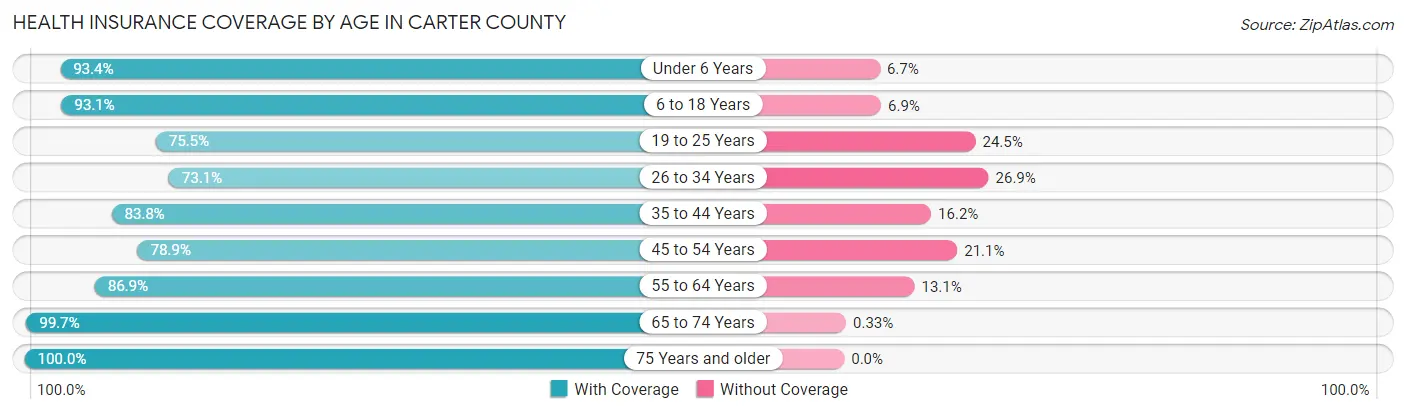
| Age Bracket | With Coverage | Without Coverage |
| Under 6 Years | 2,625 (93.3%) | 187 (6.7%) |
| 6 to 18 Years | 7,422 (93.1%) | 547 (6.9%) |
| 19 to 25 Years | 3,022 (75.5%) | 979 (24.5%) |
| 26 to 34 Years | 4,515 (73.1%) | 1,662 (26.9%) |
| 35 to 44 Years | 5,102 (83.8%) | 986 (16.2%) |
| 45 to 54 Years | 6,186 (78.9%) | 1,651 (21.1%) |
| 55 to 64 Years | 7,440 (86.9%) | 1,122 (13.1%) |
| 65 to 74 Years | 7,005 (99.7%) | 23 (0.3%) |
| 75 Years and older | 4,908 (100.0%) | 0 (0.0%) |
| Total | 48,225 (87.1%) | 7,157 (12.9%) |
Health Insurance Coverage by Citizenship Status in Carter County
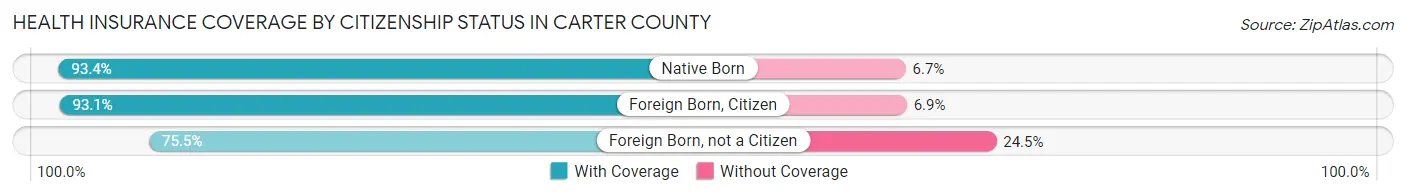
| Citizenship Status | With Coverage | Without Coverage |
| Native Born | 2,625 (93.3%) | 187 (6.7%) |
| Foreign Born, Citizen | 7,422 (93.1%) | 547 (6.9%) |
| Foreign Born, not a Citizen | 3,022 (75.5%) | 979 (24.5%) |
Health Insurance Coverage by Household Income in Carter County
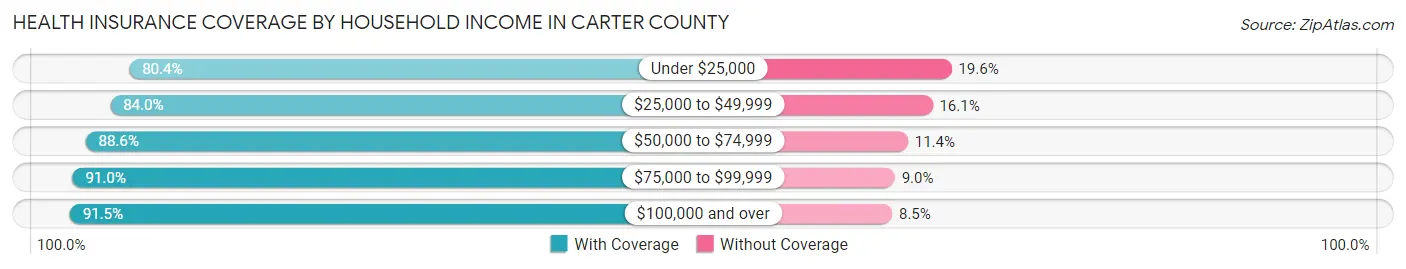
| Household Income | With Coverage | Without Coverage |
| Under $25,000 | 8,038 (80.4%) | 1,961 (19.6%) |
| $25,000 to $49,999 | 11,055 (84.0%) | 2,113 (16.1%) |
| $50,000 to $74,999 | 10,089 (88.6%) | 1,302 (11.4%) |
| $75,000 to $99,999 | 6,169 (91.0%) | 609 (9.0%) |
| $100,000 and over | 12,241 (91.5%) | 1,134 (8.5%) |
Public vs Private Health Insurance Coverage by Age in Carter County
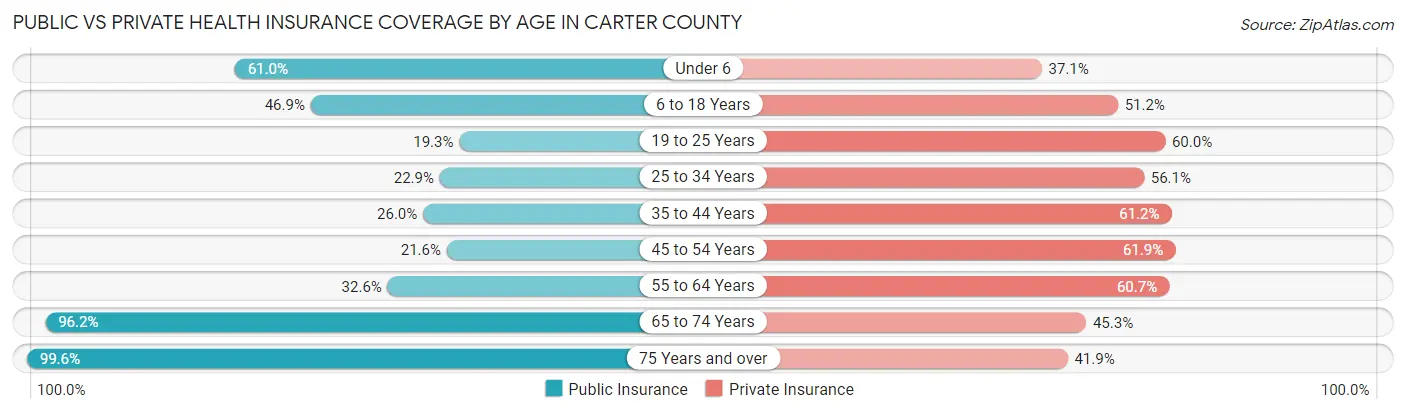
| Age Bracket | Public Insurance | Private Insurance |
| Under 6 | 1,715 (61.0%) | 1,043 (37.1%) |
| 6 to 18 Years | 3,737 (46.9%) | 4,081 (51.2%) |
| 19 to 25 Years | 773 (19.3%) | 2,400 (60.0%) |
| 25 to 34 Years | 1,417 (22.9%) | 3,463 (56.1%) |
| 35 to 44 Years | 1,585 (26.0%) | 3,723 (61.2%) |
| 45 to 54 Years | 1,695 (21.6%) | 4,847 (61.9%) |
| 55 to 64 Years | 2,792 (32.6%) | 5,199 (60.7%) |
| 65 to 74 Years | 6,759 (96.2%) | 3,186 (45.3%) |
| 75 Years and over | 4,888 (99.6%) | 2,056 (41.9%) |
| Total | 25,361 (45.8%) | 29,998 (54.2%) |
Disability Status by Sex by Age in Carter County
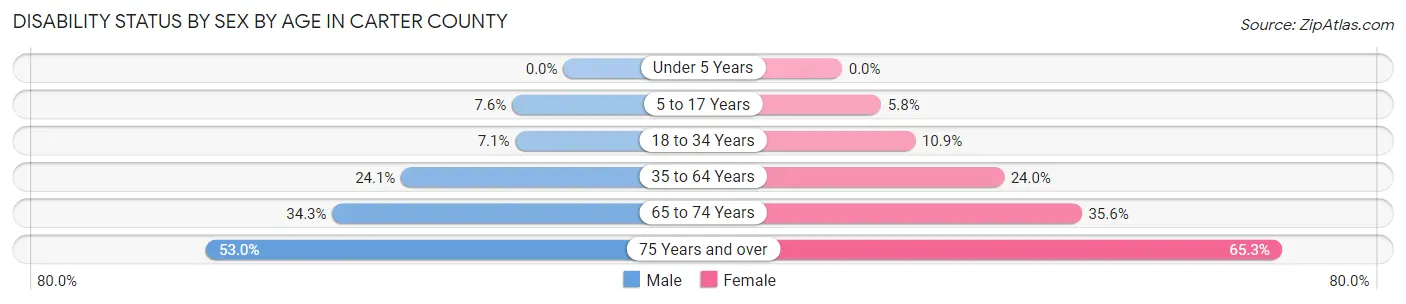
| Age Bracket | Male | Female |
| Under 5 Years | 0 (0.0%) | 0 (0.0%) |
| 5 to 17 Years | 300 (7.6%) | 219 (5.8%) |
| 18 to 34 Years | 382 (7.1%) | 594 (10.9%) |
| 35 to 64 Years | 2,676 (24.1%) | 2,734 (24.0%) |
| 65 to 74 Years | 1,148 (34.3%) | 1,310 (35.6%) |
| 75 Years and over | 1,152 (53.0%) | 1,787 (65.3%) |
Disability Class by Sex by Age in Carter County
Disability Class: Hearing Difficulty
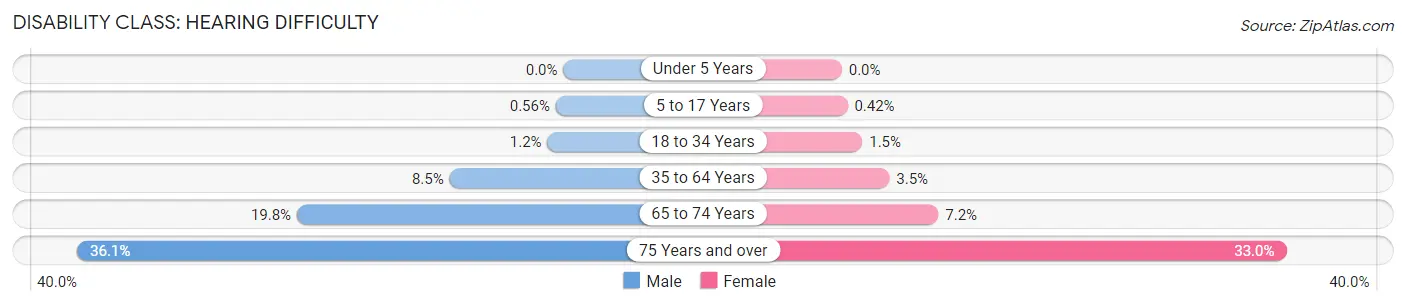
| Age Bracket | Male | Female |
| Under 5 Years | 0 (0.0%) | 0 (0.0%) |
| 5 to 17 Years | 22 (0.6%) | 16 (0.4%) |
| 18 to 34 Years | 63 (1.2%) | 83 (1.5%) |
| 35 to 64 Years | 939 (8.5%) | 402 (3.5%) |
| 65 to 74 Years | 662 (19.8%) | 264 (7.2%) |
| 75 Years and over | 784 (36.1%) | 903 (33.0%) |
Disability Class: Vision Difficulty
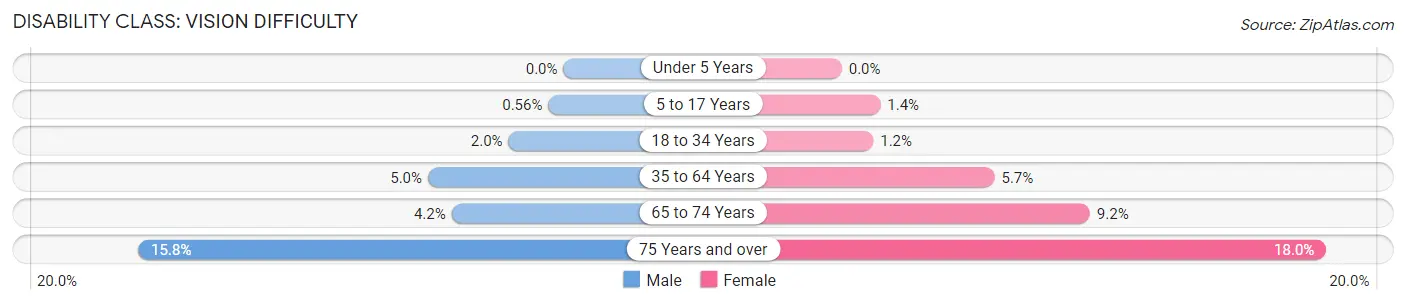
| Age Bracket | Male | Female |
| Under 5 Years | 0 (0.0%) | 0 (0.0%) |
| 5 to 17 Years | 22 (0.6%) | 54 (1.4%) |
| 18 to 34 Years | 109 (2.0%) | 64 (1.2%) |
| 35 to 64 Years | 559 (5.0%) | 645 (5.7%) |
| 65 to 74 Years | 139 (4.2%) | 339 (9.2%) |
| 75 Years and over | 343 (15.8%) | 492 (18.0%) |
Disability Class: Cognitive Difficulty
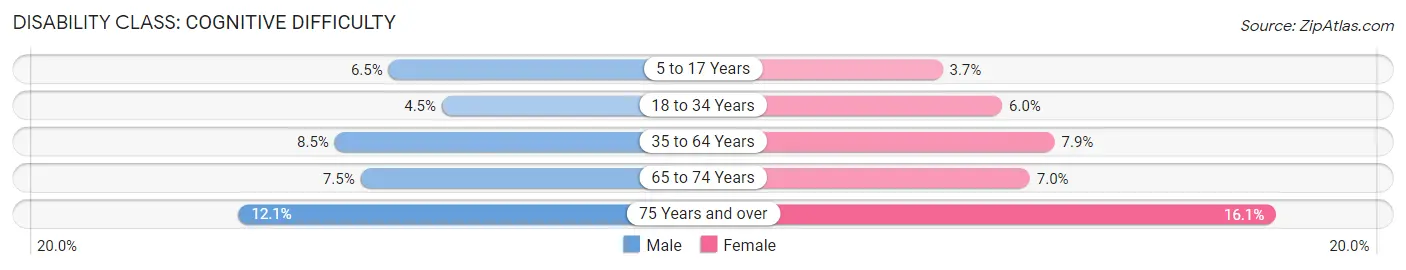
| Age Bracket | Male | Female |
| 5 to 17 Years | 256 (6.5%) | 141 (3.7%) |
| 18 to 34 Years | 241 (4.5%) | 325 (5.9%) |
| 35 to 64 Years | 944 (8.5%) | 898 (7.9%) |
| 65 to 74 Years | 252 (7.5%) | 257 (7.0%) |
| 75 Years and over | 262 (12.1%) | 441 (16.1%) |
Disability Class: Ambulatory Difficulty
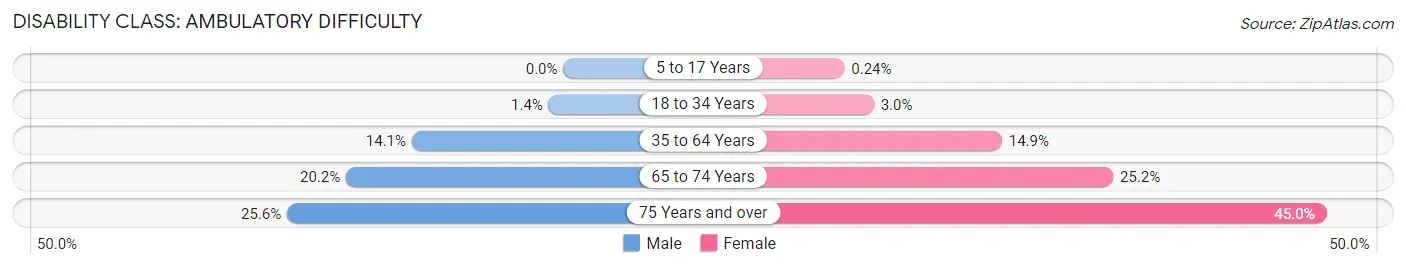
| Age Bracket | Male | Female |
| 5 to 17 Years | 0 (0.0%) | 9 (0.2%) |
| 18 to 34 Years | 73 (1.4%) | 162 (3.0%) |
| 35 to 64 Years | 1,563 (14.1%) | 1,689 (14.8%) |
| 65 to 74 Years | 675 (20.2%) | 927 (25.2%) |
| 75 Years and over | 557 (25.6%) | 1,231 (45.0%) |
Disability Class: Self-Care Difficulty
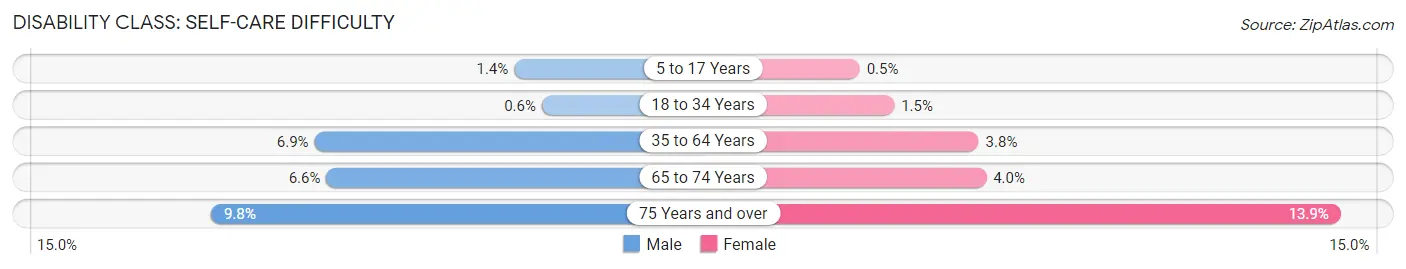
| Age Bracket | Male | Female |
| 5 to 17 Years | 54 (1.4%) | 19 (0.5%) |
| 18 to 34 Years | 32 (0.6%) | 80 (1.5%) |
| 35 to 64 Years | 770 (6.9%) | 433 (3.8%) |
| 65 to 74 Years | 221 (6.6%) | 148 (4.0%) |
| 75 Years and over | 213 (9.8%) | 380 (13.9%) |
Technology Access in Carter County
Computing Device Access in Carter County
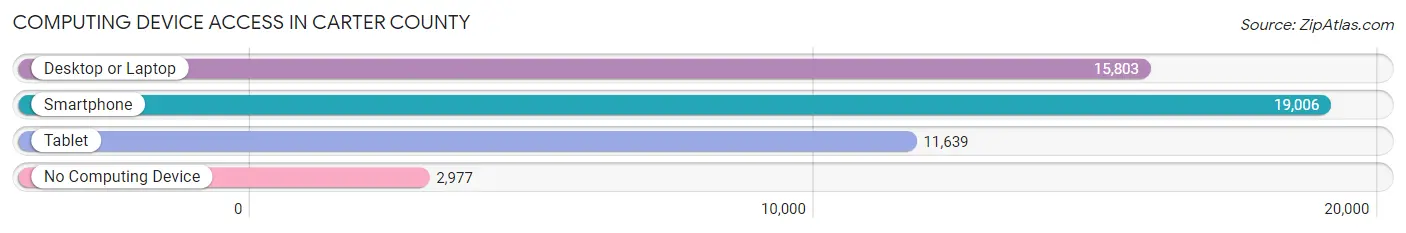
| Device Type | # Households | % Households |
| Desktop or Laptop | 15,803 | 66.0% |
| Smartphone | 19,006 | 79.4% |
| Tablet | 11,639 | 48.6% |
| No Computing Device | 2,977 | 12.4% |
| Total | 23,940 | 100.0% |
Internet Access in Carter County
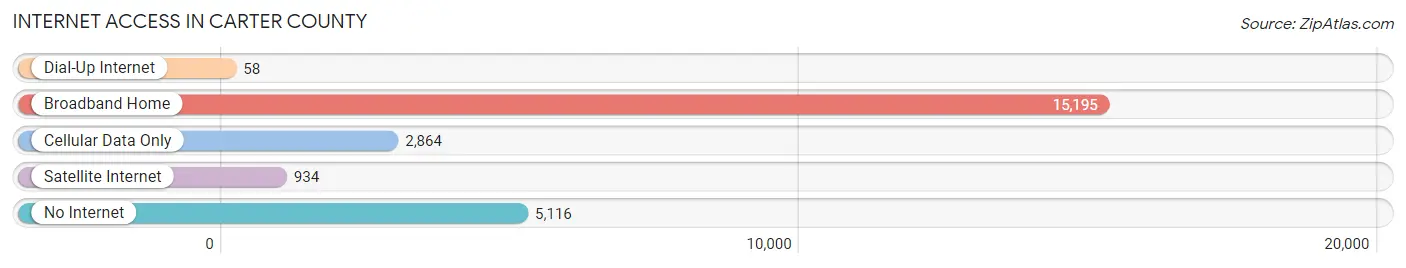
| Internet Type | # Households | % Households |
| Dial-Up Internet | 58 | 0.2% |
| Broadband Home | 15,195 | 63.5% |
| Cellular Data Only | 2,864 | 12.0% |
| Satellite Internet | 934 | 3.9% |
| No Internet | 5,116 | 21.4% |
| Total | 23,940 | 100.0% |
Carter County Summary
Carter County is located in the northeastern corner of Tennessee and is part of the Tri-Cities region. It is bordered by Johnson County to the north, Unicoi County to the east, Washington County to the south, and Sullivan County to the west. The county seat is Elizabethton, and the largest city is Johnson City. The county was established in 1796 and named for Landon Carter, a prominent early settler.
Geography
Carter County covers an area of 437 square miles and is located in the Appalachian Mountains. The terrain is mostly mountainous, with elevations ranging from 1,000 to 4,000 feet. The county is drained by the Watauga River and its tributaries, which flow through the county from west to east. The county is home to several state parks, including Roan Mountain State Park, Sycamore Shoals State Historic Park, and Watauga Lake State Park.
Climate
Carter County has a humid subtropical climate, with hot, humid summers and mild winters. The average annual temperature is 57°F, and the average annual precipitation is 44 inches.
Demographics
As of the 2010 census, Carter County had a population of 57,424. The racial makeup of the county was 94.3% White, 2.7% Black or African American, 0.4% Native American, 0.7% Asian, 0.1% Pacific Islander, 0.7% from other races, and 1.3% from two or more races. Hispanic or Latino of any race were 2.2% of the population.
The median household income was $37,845 and the median family income was $45,945. About 15.2% of families and 19.2% of the population were below the poverty line, including 28.2% of those under age 18 and 11.2% of those age 65 or over.
Economy
Carter County’s economy is largely based on agriculture and manufacturing. The county is home to several large farms, as well as several small family farms. The county is also home to several manufacturing companies, including Eastman Chemical Company, which produces chemicals and plastics, and NN Inc., which produces automotive parts.
The county is also home to several tourist attractions, including the Sycamore Shoals State Historic Park, which is a popular destination for outdoor recreation. The county is also home to several wineries, including the Watauga Lake Winery, which produces a variety of wines.
In addition, the county is home to several colleges and universities, including East Tennessee State University, Milligan College, and Tusculum College. These institutions provide educational opportunities for the county’s residents, as well as employment opportunities.
Conclusion
Carter County is a rural county located in the northeastern corner of Tennessee. It is home to several state parks, as well as several tourist attractions and educational institutions. The county’s economy is largely based on agriculture and manufacturing, and it is home to several large farms and manufacturing companies. The county also has a diverse population, with a median household income of $37,845 and a poverty rate of 19.2%.
Common Questions
What is the Total Population of Carter County?
Total Population of Carter County is 56,315.
What is the Total Male Population of Carter County?
Total Male Population of Carter County is 27,645.
What is the Total Female Population of Carter County?
Total Female Population of Carter County is 28,670.
What is the Ratio of Males per 100 Females in Carter County?
There are 96.42 Males per 100 Females in Carter County.
What is the Ratio of Females per 100 Males in Carter County?
There are 103.71 Females per 100 Males in Carter County.
What is the Median Population Age in Carter County?
Median Population Age in Carter County is 46.0 Years.
What is the Average Family Size in Carter County
Average Family Size in Carter County is 2.9 People.
What is the Average Household Size in Carter County
Average Household Size in Carter County is 2.3 People.
What is Per Capita Income in Carter County?
Per Capita income in Carter County is $28,321.
What is the Median Family Income in Carter County?
Median Family Income in Carter County is $61,776.
What is the Median Household income in Carter County?
Median Household Income in Carter County is $47,994.
What is Income or Wage Gap in Carter County?
Income or Wage Gap in Carter County is 26.7%.
Women in Carter County earn 73.3 cents for every dollar earned by a man.
What is Family Income Deficit in Carter County?
Family Income Deficit in Carter County is $10,164.
Families that are below poverty line in Carter County earn $10,164 less on average than the poverty threshold level.
What is Inequality or Gini Index in Carter County?
Inequality or Gini Index in Carter County is 0.45.
How Large is the Labor Force in Carter County?
There are 24,981 People in the Labor Forcein in Carter County.
What is the Percentage of People in the Labor Force in Carter County?
52.7% of People are in the Labor Force in Carter County.
What is the Unemployment Rate in Carter County?
Unemployment Rate in Carter County is 7.2%.