Cannon County, TN
Cannon County Map
Cannon County Overview
14,481
TOTAL POPULATION
7,312
MALE POPULATION
7,169
FEMALE POPULATION
101.99
MALES / 100 FEMALES
98.04
FEMALES / 100 MALES
40.7
MEDIAN AGE
3.1
AVG FAMILY SIZE
2.5
AVG HOUSEHOLD SIZE
$30,234
PER CAPITA INCOME
$71,000
AVG FAMILY INCOME
$57,651
AVG HOUSEHOLD INCOME
32.7%
WAGE / INCOME GAP [ % ]
67.3¢/ $1
WAGE / INCOME GAP [ $ ]
$12,280
FAMILY INCOME DEFICIT
0.45
INEQUALITY / GINI INDEX
6,666
LABOR FORCE [ PEOPLE ]
56.5%
PERCENT IN LABOR FORCE
3.3%
UNEMPLOYMENT RATE
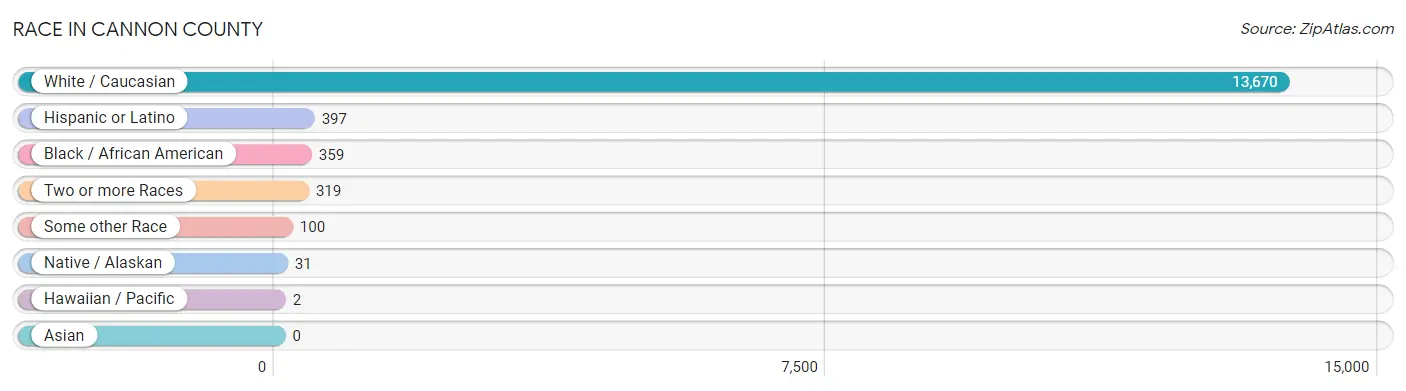
Race in Cannon County
The most populous races in Cannon County are White / Caucasian (13,670 | 94.4%), Hispanic or Latino (397 | 2.7%), and Black / African American (359 | 2.5%).
| Race | # Population | % Population |
| Asian | 0 | 0.0% |
| Black / African American | 359 | 2.5% |
| Hawaiian / Pacific | 2 | 0.0% |
| Hispanic or Latino | 397 | 2.7% |
| Native / Alaskan | 31 | 0.2% |
| White / Caucasian | 13,670 | 94.4% |
| Two or more Races | 319 | 2.2% |
| Some other Race | 100 | 0.7% |
| Total | 14,481 | 100.0% |
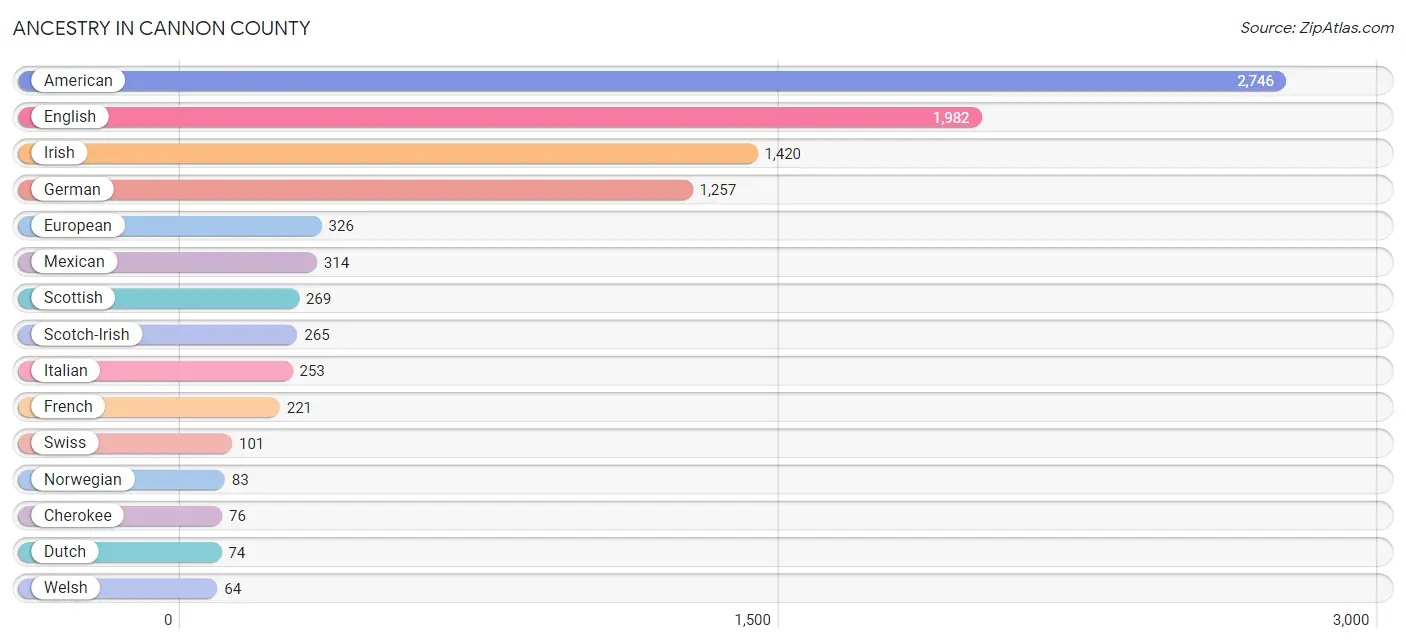
Ancestry in Cannon County
The most populous ancestries reported in Cannon County are American (2,746 | 19.0%), English (1,982 | 13.7%), Irish (1,420 | 9.8%), German (1,257 | 8.7%), and European (326 | 2.2%), together accounting for 53.4% of all Cannon County residents.
| Ancestry | # Population | % Population |
| American | 2,746 | 19.0% |
| Arab | 24 | 0.2% |
| Bhutanese | 11 | 0.1% |
| Blackfeet | 6 | 0.0% |
| British | 60 | 0.4% |
| Cajun | 2 | 0.0% |
| Canadian | 5 | 0.0% |
| Cherokee | 76 | 0.5% |
| Creek | 2 | 0.0% |
| Cuban | 24 | 0.2% |
| Dutch | 74 | 0.5% |
| Eastern European | 11 | 0.1% |
| English | 1,982 | 13.7% |
| European | 326 | 2.2% |
| Finnish | 8 | 0.1% |
| French | 221 | 1.5% |
| French Canadian | 63 | 0.4% |
| German | 1,257 | 8.7% |
| Greek | 21 | 0.2% |
| Guamanian / Chamorro | 18 | 0.1% |
| Hungarian | 63 | 0.4% |
| Irish | 1,420 | 9.8% |
| Iroquois | 2 | 0.0% |
| Italian | 253 | 1.8% |
| Korean | 17 | 0.1% |
| Mexican | 314 | 2.2% |
| Mexican American Indian | 12 | 0.1% |
| Native Hawaiian | 2 | 0.0% |
| Norwegian | 83 | 0.6% |
| Polish | 42 | 0.3% |
| Portuguese | 19 | 0.1% |
| Pueblo | 2 | 0.0% |
| Puerto Rican | 42 | 0.3% |
| Russian | 5 | 0.0% |
| Scandinavian | 30 | 0.2% |
| Scotch-Irish | 265 | 1.8% |
| Scottish | 269 | 1.9% |
| Spanish | 14 | 0.1% |
| Swedish | 27 | 0.2% |
| Swiss | 101 | 0.7% |
| Welsh | 64 | 0.4% |
| Yugoslavian | 4 | 0.0% | View All 42 Rows |
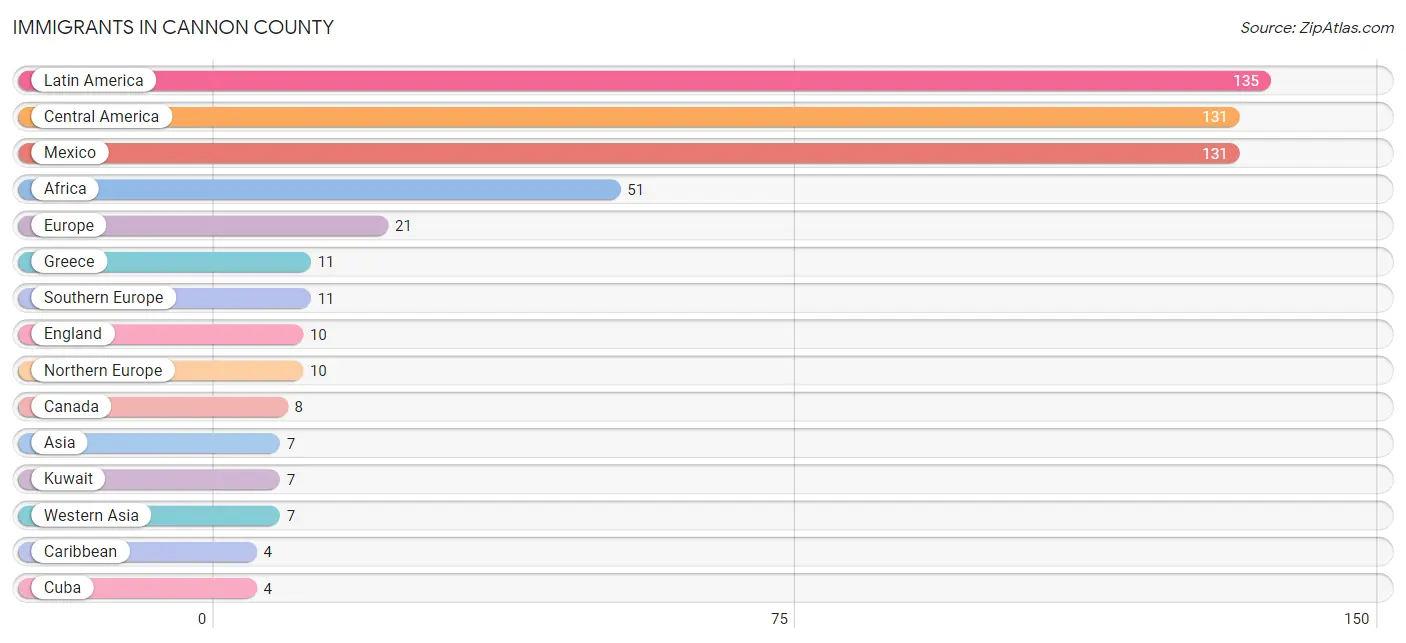
Immigrants in Cannon County
The most numerous immigrant groups reported in Cannon County came from Latin America (135 | 0.9%), Central America (131 | 0.9%), Mexico (131 | 0.9%), Africa (51 | 0.4%), and Europe (21 | 0.2%), together accounting for 3.2% of all Cannon County residents.
| Immigration Origin | # Population | % Population |
| Africa | 51 | 0.4% |
| Asia | 7 | 0.1% |
| Canada | 8 | 0.1% |
| Caribbean | 4 | 0.0% |
| Central America | 131 | 0.9% |
| Cuba | 4 | 0.0% |
| England | 10 | 0.1% |
| Europe | 21 | 0.2% |
| Greece | 11 | 0.1% |
| Kuwait | 7 | 0.1% |
| Latin America | 135 | 0.9% |
| Mexico | 131 | 0.9% |
| Northern Europe | 10 | 0.1% |
| Southern Europe | 11 | 0.1% |
| Western Asia | 7 | 0.1% | View All 15 Rows |
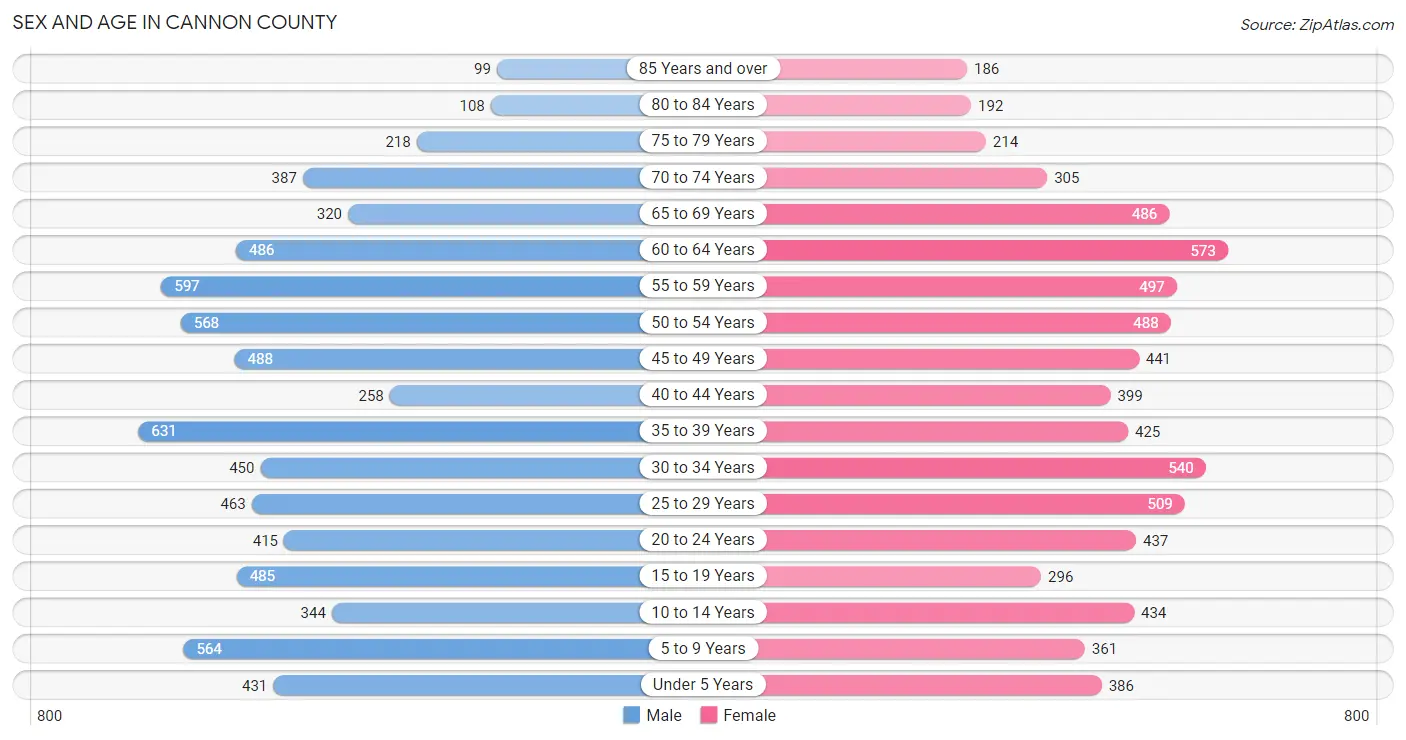
Sex and Age in Cannon County
Sex and Age in Cannon County
The most populous age groups in Cannon County are 35 to 39 Years (631 | 8.6%) for men and 60 to 64 Years (573 | 8.0%) for women.
| Age Bracket | Male | Female |
| Under 5 Years | 431 (5.9%) | 386 (5.4%) |
| 5 to 9 Years | 564 (7.7%) | 361 (5.0%) |
| 10 to 14 Years | 344 (4.7%) | 434 (6.0%) |
| 15 to 19 Years | 485 (6.6%) | 296 (4.1%) |
| 20 to 24 Years | 415 (5.7%) | 437 (6.1%) |
| 25 to 29 Years | 463 (6.3%) | 509 (7.1%) |
| 30 to 34 Years | 450 (6.1%) | 540 (7.5%) |
| 35 to 39 Years | 631 (8.6%) | 425 (5.9%) |
| 40 to 44 Years | 258 (3.5%) | 399 (5.6%) |
| 45 to 49 Years | 488 (6.7%) | 441 (6.1%) |
| 50 to 54 Years | 568 (7.8%) | 488 (6.8%) |
| 55 to 59 Years | 597 (8.2%) | 497 (6.9%) |
| 60 to 64 Years | 486 (6.7%) | 573 (8.0%) |
| 65 to 69 Years | 320 (4.4%) | 486 (6.8%) |
| 70 to 74 Years | 387 (5.3%) | 305 (4.3%) |
| 75 to 79 Years | 218 (3.0%) | 214 (3.0%) |
| 80 to 84 Years | 108 (1.5%) | 192 (2.7%) |
| 85 Years and over | 99 (1.3%) | 186 (2.6%) |
| Total | 7,312 (100.0%) | 7,169 (100.0%) |
Families and Households in Cannon County
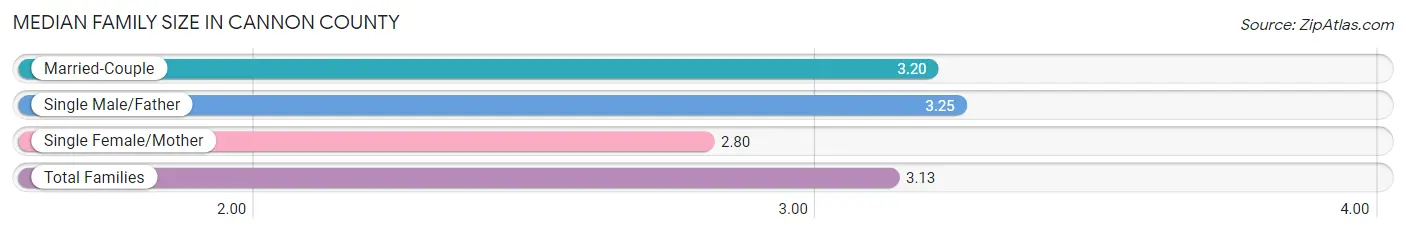
Median Family Size in Cannon County
The median family size in Cannon County is 3.13 persons per family, with single male/father families (275 | 7.5%) accounting for the largest median family size of 3.25 persons per family. On the other hand, single female/mother families (665 | 18.0%) represent the smallest median family size with 2.80 persons per family.
| Family Type | # Families | Family Size |
| Married-Couple | 2,744 (74.5%) | 3.20 |
| Single Male/Father | 275 (7.5%) | 3.25 |
| Single Female/Mother | 665 (18.0%) | 2.80 |
| Total Families | 3,684 (100.0%) | 3.13 |
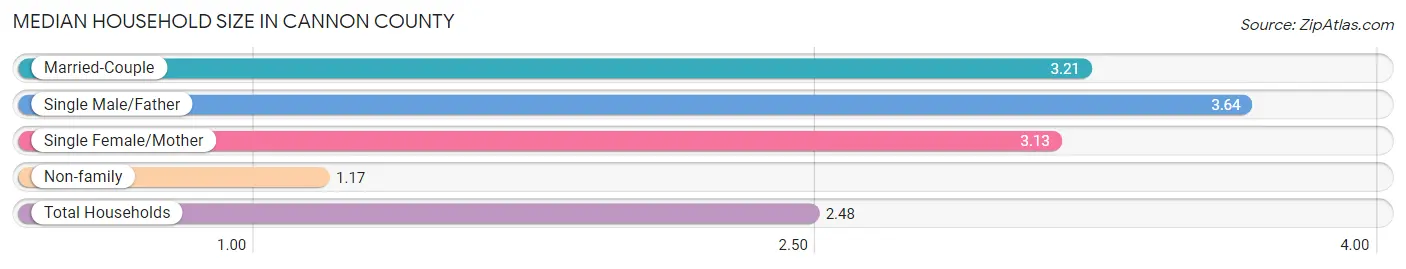
Median Household Size in Cannon County
The median household size in Cannon County is 2.48 persons per household, with single male/father households (275 | 4.8%) accounting for the largest median household size of 3.64 persons per household. non-family households (2,085 | 36.1%) represent the smallest median household size with 1.17 persons per household.
| Household Type | # Households | Household Size |
| Married-Couple | 2,744 (47.6%) | 3.21 |
| Single Male/Father | 275 (4.8%) | 3.64 |
| Single Female/Mother | 665 (11.5%) | 3.13 |
| Non-family | 2,085 (36.1%) | 1.17 |
| Total Households | 5,769 (100.0%) | 2.48 |
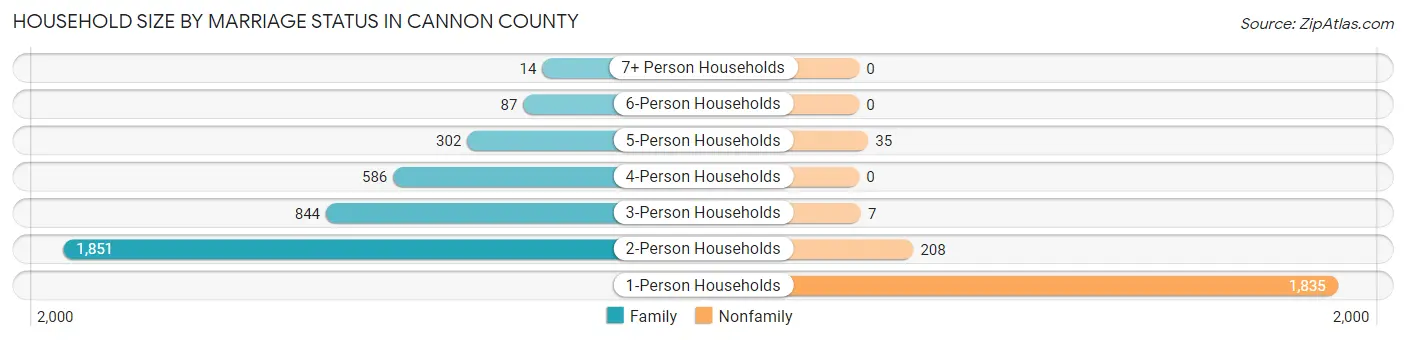
Household Size by Marriage Status in Cannon County
Out of a total of 5,769 households in Cannon County, 3,684 (63.9%) are family households, while 2,085 (36.1%) are nonfamily households. The most numerous type of family households are 2-person households, comprising 1,851, and the most common type of nonfamily households are 1-person households, comprising 1,835.
| Household Size | Family Households | Nonfamily Households |
| 1-Person Households | - | 1,835 (31.8%) |
| 2-Person Households | 1,851 (32.1%) | 208 (3.6%) |
| 3-Person Households | 844 (14.6%) | 7 (0.1%) |
| 4-Person Households | 586 (10.2%) | 0 (0.0%) |
| 5-Person Households | 302 (5.2%) | 35 (0.6%) |
| 6-Person Households | 87 (1.5%) | 0 (0.0%) |
| 7+ Person Households | 14 (0.2%) | 0 (0.0%) |
| Total | 3,684 (63.9%) | 2,085 (36.1%) |
Female Fertility in Cannon County
Fertility by Age in Cannon County
Average fertility rate in Cannon County is 53.0 births per 1,000 women. Women in the age bracket of 20 to 34 years have the highest fertility rate with 104.0 births per 1,000 women. Women in the age bracket of 20 to 34 years acount for 92.3% of all women with births.

| Age Bracket | Women with Births | Births / 1,000 Women |
| 15 to 19 years | 0 (0.0%) | 0.0 |
| 20 to 34 years | 155 (92.3%) | 104.0 |
| 35 to 50 years | 13 (7.7%) | 9.0 |
| Total | 168 (100.0%) | 53.0 |
Fertility by Age by Marriage Status in Cannon County
92.3% of women with births (168) in Cannon County are married. The highest percentage of unmarried women with births falls into 35 to 50 years age bracket with 46.2% of them unmarried at the time of birth, while the lowest percentage of unmarried women with births belong to 20 to 34 years age bracket with 4.5% of them unmarried.
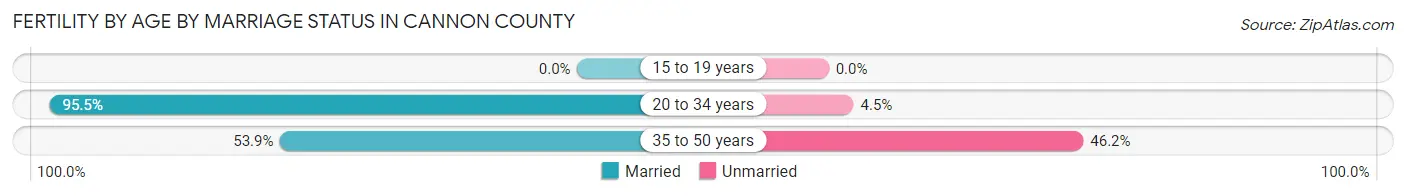
| Age Bracket | Married | Unmarried |
| 15 to 19 years | 0 (0.0%) | 0 (0.0%) |
| 20 to 34 years | 148 (95.5%) | 7 (4.5%) |
| 35 to 50 years | 7 (53.8%) | 6 (46.2%) |
| Total | 155 (92.3%) | 13 (7.7%) |
Fertility by Education in Cannon County
Average fertility rate in Cannon County is 53.0 births per 1,000 women. Women with the education attainment of graduate degree have the highest fertility rate of 291.0 births per 1,000 women, while women with the education attainment of less than high school have the lowest fertility at 13.0 births per 1,000 women. Women with the education attainment of college or associate's degree represent 32.1% of all women with births.
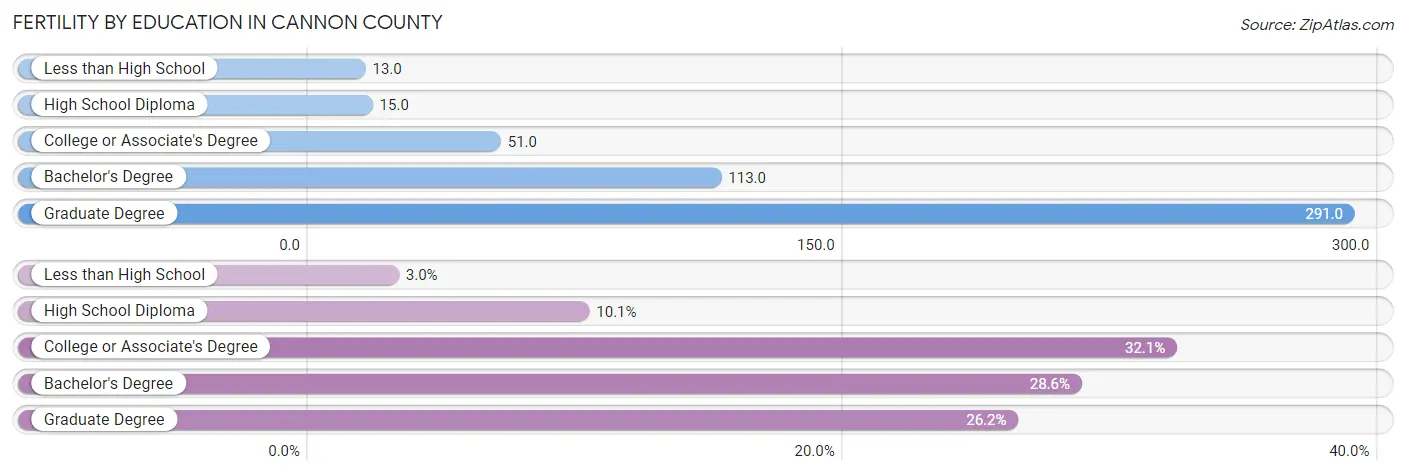
| Educational Attainment | Women with Births | Births / 1,000 Women |
| Less than High School | 5 (3.0%) | 13.0 |
| High School Diploma | 17 (10.1%) | 15.0 |
| College or Associate's Degree | 54 (32.1%) | 51.0 |
| Bachelor's Degree | 48 (28.6%) | 113.0 |
| Graduate Degree | 44 (26.2%) | 291.0 |
| Total | 168 (100.0%) | 53.0 |
Fertility by Education by Marriage Status in Cannon County
7.7% of women with births in Cannon County are unmarried. Women with the educational attainment of less than high school are most likely to be married with 100.0% of them married at childbirth, while women with the educational attainment of high school diploma are least likely to be married with 58.8% of them unmarried at childbirth.
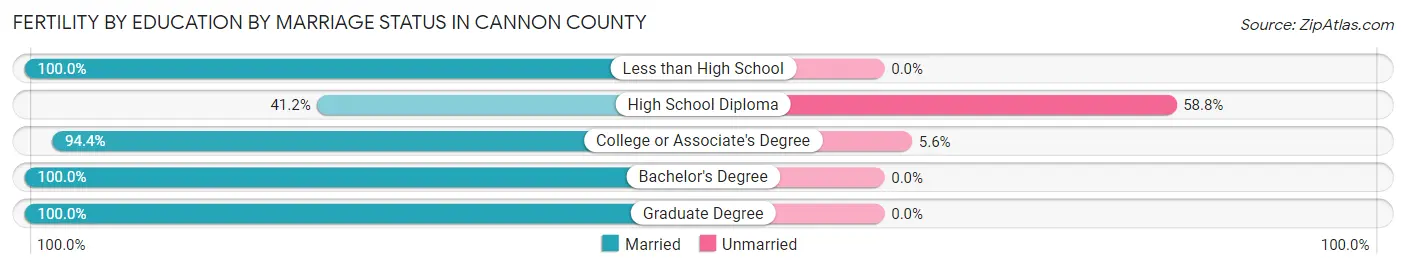
| Educational Attainment | Married | Unmarried |
| Less than High School | 5 (100.0%) | 0 (0.0%) |
| High School Diploma | 7 (41.2%) | 10 (58.8%) |
| College or Associate's Degree | 51 (94.4%) | 3 (5.6%) |
| Bachelor's Degree | 48 (100.0%) | 0 (0.0%) |
| Graduate Degree | 44 (100.0%) | 0 (0.0%) |
| Total | 155 (92.3%) | 13 (7.7%) |
Income in Cannon County
Income Overview in Cannon County
Per Capita Income in Cannon County is $30,234, while median incomes of families and households are $71,000 and $57,651 respectively.
| Characteristic | Number | Measure |
| Per Capita Income | 14,481 | $30,234 |
| Median Family Income | 3,684 | $71,000 |
| Mean Family Income | 3,684 | $84,555 |
| Median Household Income | 5,769 | $57,651 |
| Mean Household Income | 5,769 | $71,694 |
| Income Deficit | 3,684 | $12,280 |
| Wage / Income Gap (%) | 14,481 | 32.70% |
| Wage / Income Gap ($) | 14,481 | 67.30¢ per $1 |
| Gini / Inequality Index | 14,481 | 0.45 |
Earnings by Sex in Cannon County
Average Earnings in Cannon County are $40,903, $49,965 for men and $33,627 for women, a difference of 32.7%.
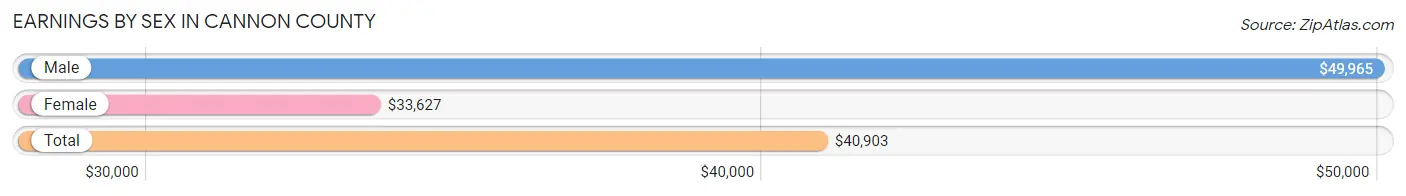
| Sex | Number | Average Earnings |
| Male | 3,679 (53.0%) | $49,965 |
| Female | 3,260 (47.0%) | $33,627 |
| Total | 6,939 (100.0%) | $40,903 |
Earnings by Sex by Income Bracket in Cannon County
The most common earnings brackets in Cannon County are $75,000 to $99,999 for men (525 | 14.3%) and $40,000 to $44,999 for women (454 | 13.9%).
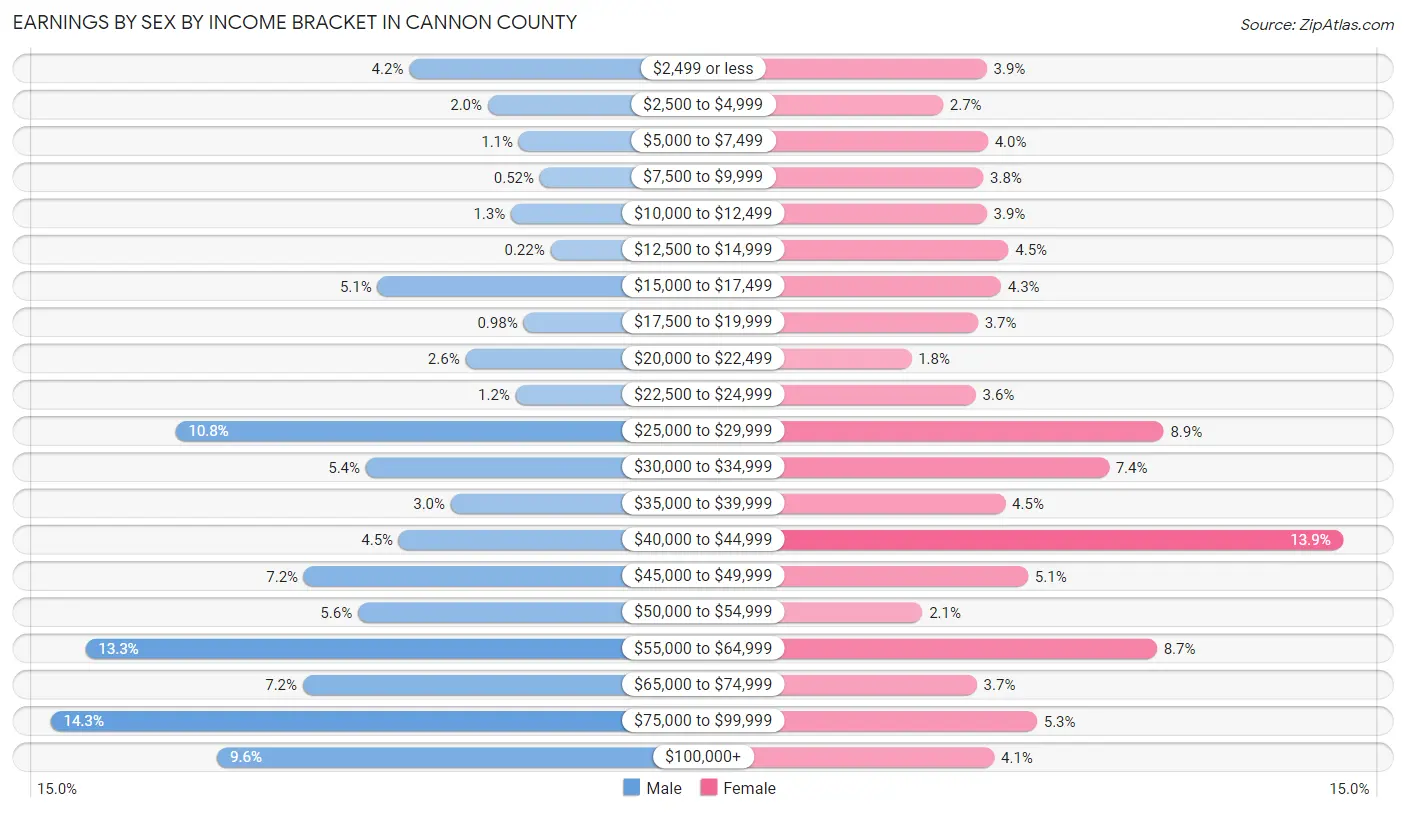
| Income | Male | Female |
| $2,499 or less | 154 (4.2%) | 128 (3.9%) |
| $2,500 to $4,999 | 73 (2.0%) | 88 (2.7%) |
| $5,000 to $7,499 | 41 (1.1%) | 129 (4.0%) |
| $7,500 to $9,999 | 19 (0.5%) | 125 (3.8%) |
| $10,000 to $12,499 | 49 (1.3%) | 128 (3.9%) |
| $12,500 to $14,999 | 8 (0.2%) | 148 (4.5%) |
| $15,000 to $17,499 | 187 (5.1%) | 141 (4.3%) |
| $17,500 to $19,999 | 36 (1.0%) | 120 (3.7%) |
| $20,000 to $22,499 | 96 (2.6%) | 59 (1.8%) |
| $22,500 to $24,999 | 44 (1.2%) | 118 (3.6%) |
| $25,000 to $29,999 | 396 (10.8%) | 290 (8.9%) |
| $30,000 to $34,999 | 199 (5.4%) | 240 (7.4%) |
| $35,000 to $39,999 | 111 (3.0%) | 145 (4.4%) |
| $40,000 to $44,999 | 165 (4.5%) | 454 (13.9%) |
| $45,000 to $49,999 | 263 (7.1%) | 166 (5.1%) |
| $50,000 to $54,999 | 207 (5.6%) | 69 (2.1%) |
| $55,000 to $64,999 | 489 (13.3%) | 284 (8.7%) |
| $65,000 to $74,999 | 264 (7.2%) | 119 (3.6%) |
| $75,000 to $99,999 | 525 (14.3%) | 174 (5.3%) |
| $100,000+ | 353 (9.6%) | 135 (4.1%) |
| Total | 3,679 (100.0%) | 3,260 (100.0%) |
Earnings by Sex by Educational Attainment in Cannon County
Average earnings in Cannon County are $55,180 for men and $39,808 for women, a difference of 27.9%. Men with an educational attainment of bachelor's degree enjoy the highest average annual earnings of $68,750, while those with high school diploma education earn the least with $47,526. Women with an educational attainment of bachelor's degree earn the most with the average annual earnings of $48,523, while those with less than high school education have the smallest earnings of $19,236.
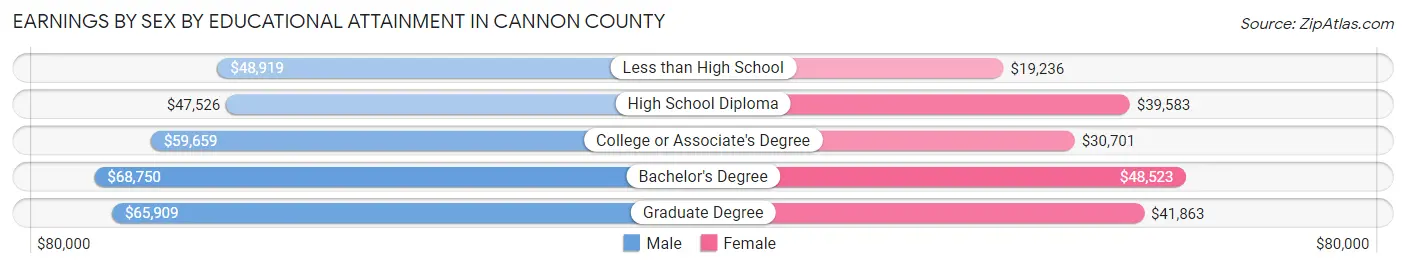
| Educational Attainment | Male Income | Female Income |
| Less than High School | $48,919 | $19,236 |
| High School Diploma | $47,526 | $39,583 |
| College or Associate's Degree | $59,659 | $30,701 |
| Bachelor's Degree | $68,750 | $48,523 |
| Graduate Degree | $65,909 | $41,863 |
| Total | $55,180 | $39,808 |
Family Income in Cannon County
Family Income Brackets in Cannon County
According to the Cannon County family income data, there are 755 families falling into the $50,000 to $74,999 income range, which is the most common income bracket and makes up 20.5% of all families. Conversely, the $10,000 to $14,999 income bracket is the least frequent group with only 96 families (2.6%) belonging to this category.
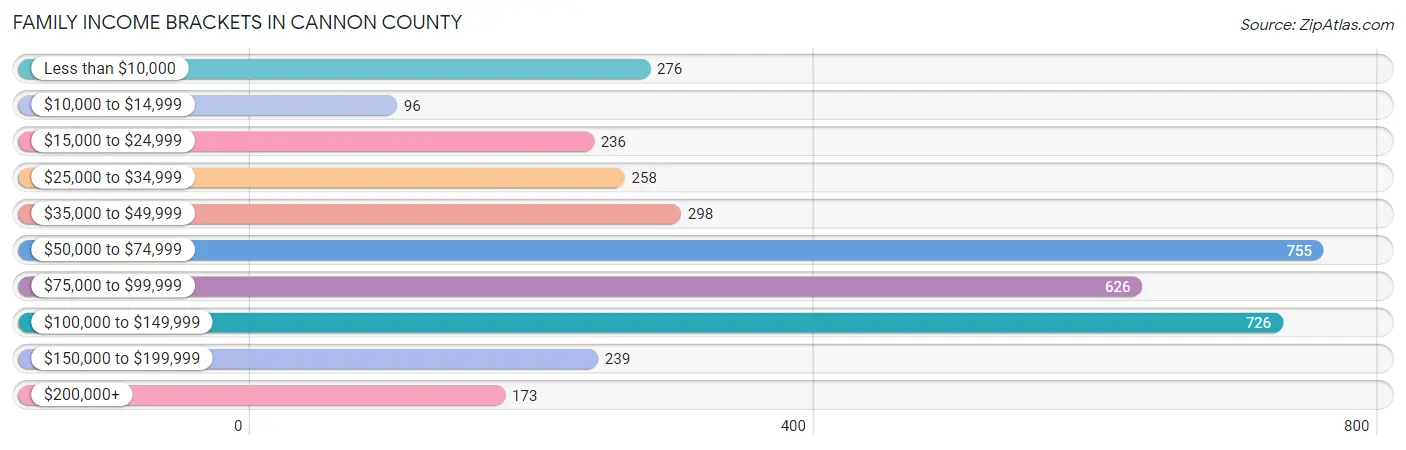
| Income Bracket | # Families | % Families |
| Less than $10,000 | 276 | 7.5% |
| $10,000 to $14,999 | 96 | 2.6% |
| $15,000 to $24,999 | 236 | 6.4% |
| $25,000 to $34,999 | 258 | 7.0% |
| $35,000 to $49,999 | 298 | 8.1% |
| $50,000 to $74,999 | 755 | 20.5% |
| $75,000 to $99,999 | 626 | 17.0% |
| $100,000 to $149,999 | 726 | 19.7% |
| $150,000 to $199,999 | 239 | 6.5% |
| $200,000+ | 173 | 4.7% |
Family Income by Famaliy Size in Cannon County
4-person families (519 | 14.1%) account for the highest median family income in Cannon County with $99,688 per family, while 2-person families (1,996 | 54.2%) have the highest median income of $29,688 per family member.
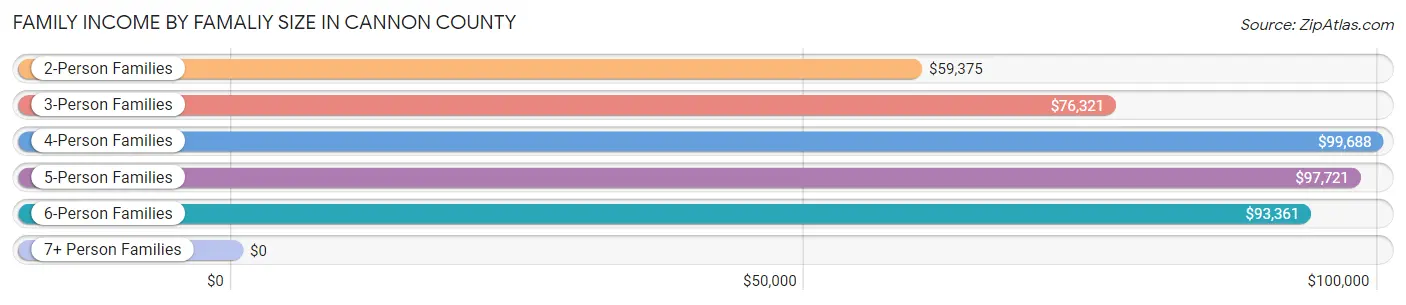
| Income Bracket | # Families | Median Income |
| 2-Person Families | 1,996 (54.2%) | $59,375 |
| 3-Person Families | 847 (23.0%) | $76,321 |
| 4-Person Families | 519 (14.1%) | $99,688 |
| 5-Person Families | 229 (6.2%) | $97,721 |
| 6-Person Families | 79 (2.1%) | $93,361 |
| 7+ Person Families | 14 (0.4%) | $0 |
| Total | 3,684 (100.0%) | $71,000 |
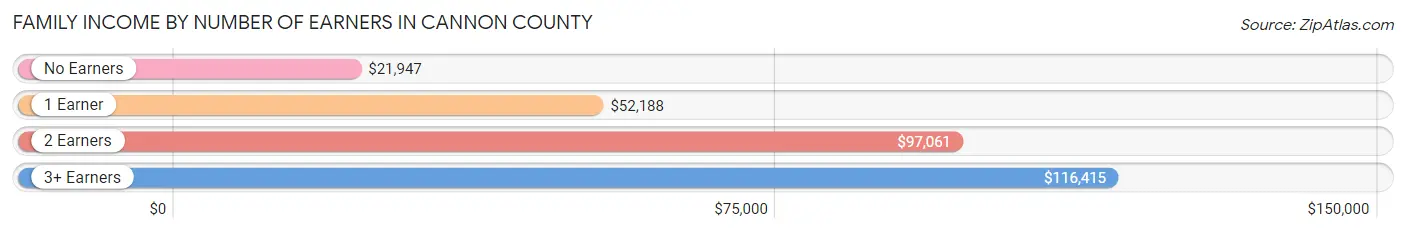
Family Income by Number of Earners in Cannon County
The median family income in Cannon County is $71,000, with families comprising 3+ earners (288) having the highest median family income of $116,415, while families with no earners (723) have the lowest median family income of $21,947, accounting for 7.8% and 19.6% of families, respectively.
| Number of Earners | # Families | Median Income |
| No Earners | 723 (19.6%) | $21,947 |
| 1 Earner | 1,302 (35.3%) | $52,188 |
| 2 Earners | 1,371 (37.2%) | $97,061 |
| 3+ Earners | 288 (7.8%) | $116,415 |
| Total | 3,684 (100.0%) | $71,000 |
Household Income in Cannon County
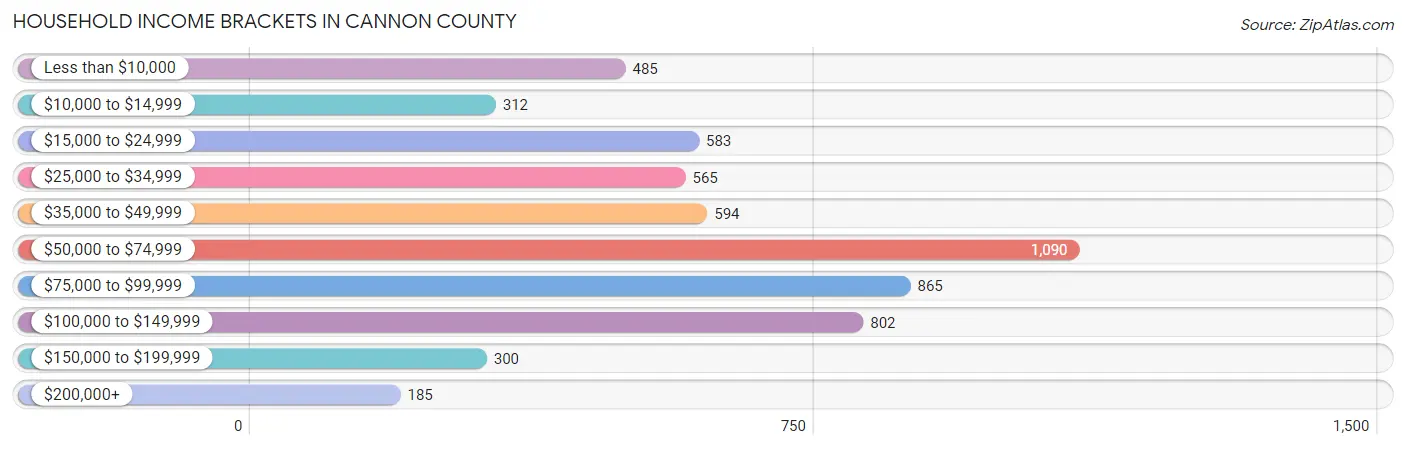
Household Income Brackets in Cannon County
With 1,090 households falling in the category, the $50,000 to $74,999 income range is the most frequent in Cannon County, accounting for 18.9% of all households. In contrast, only 185 households (3.2%) fall into the $200,000+ income bracket, making it the least populous group.
| Income Bracket | # Households | % Households |
| Less than $10,000 | 485 | 8.4% |
| $10,000 to $14,999 | 312 | 5.4% |
| $15,000 to $24,999 | 583 | 10.1% |
| $25,000 to $34,999 | 565 | 9.8% |
| $35,000 to $49,999 | 594 | 10.3% |
| $50,000 to $74,999 | 1,090 | 18.9% |
| $75,000 to $99,999 | 865 | 15.0% |
| $100,000 to $149,999 | 802 | 13.9% |
| $150,000 to $199,999 | 300 | 5.2% |
| $200,000+ | 185 | 3.2% |
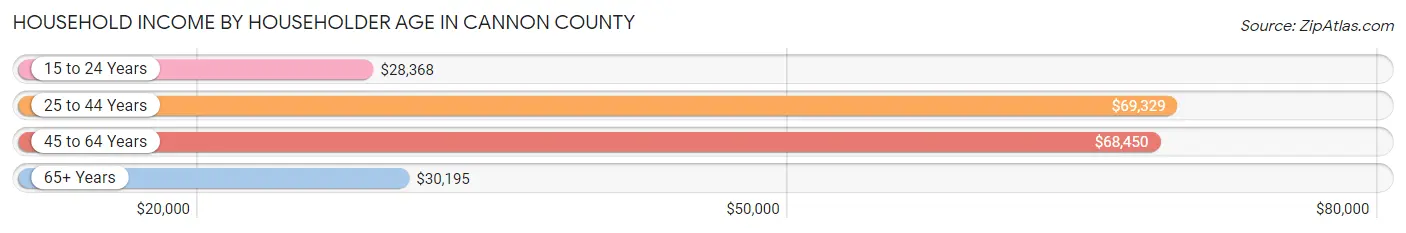
Household Income by Householder Age in Cannon County
The median household income in Cannon County is $57,651, with the highest median household income of $69,329 found in the 25 to 44 years age bracket for the primary householder. A total of 1,525 households (26.4%) fall into this category. Meanwhile, the 15 to 24 years age bracket for the primary householder has the lowest median household income of $28,368, with 103 households (1.8%) in this group.
| Income Bracket | # Households | Median Income |
| 15 to 24 Years | 103 (1.8%) | $28,368 |
| 25 to 44 Years | 1,525 (26.4%) | $69,329 |
| 45 to 64 Years | 2,587 (44.8%) | $68,450 |
| 65+ Years | 1,554 (26.9%) | $30,195 |
| Total | 5,769 (100.0%) | $57,651 |
Poverty in Cannon County
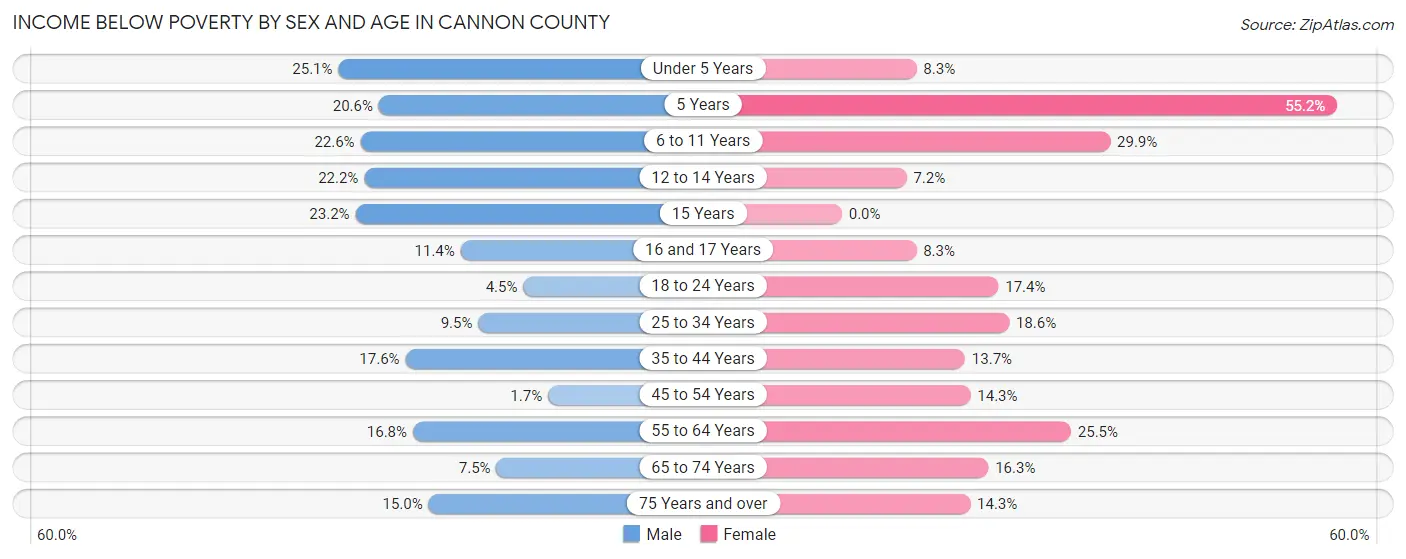
Income Below Poverty by Sex and Age in Cannon County
With 12.9% poverty level for males and 17.4% for females among the residents of Cannon County, under 5 year old males and 5 year old females are the most vulnerable to poverty, with 108 males (25.1%) and 16 females (55.2%) in their respective age groups living below the poverty level.
| Age Bracket | Male | Female |
| Under 5 Years | 108 (25.1%) | 31 (8.3%) |
| 5 Years | 15 (20.5%) | 16 (55.2%) |
| 6 to 11 Years | 125 (22.6%) | 150 (29.9%) |
| 12 to 14 Years | 61 (22.2%) | 19 (7.2%) |
| 15 Years | 22 (23.2%) | 0 (0.0%) |
| 16 and 17 Years | 27 (11.4%) | 15 (8.3%) |
| 18 to 24 Years | 25 (4.5%) | 84 (17.4%) |
| 25 to 34 Years | 86 (9.5%) | 195 (18.6%) |
| 35 to 44 Years | 155 (17.6%) | 113 (13.7%) |
| 45 to 54 Years | 18 (1.7%) | 133 (14.3%) |
| 55 to 64 Years | 178 (16.8%) | 273 (25.5%) |
| 65 to 74 Years | 52 (7.4%) | 128 (16.3%) |
| 75 Years and over | 62 (15.0%) | 77 (14.3%) |
| Total | 934 (12.9%) | 1,234 (17.4%) |
Income Above Poverty by Sex and Age in Cannon County
According to the poverty statistics in Cannon County, males aged 45 to 54 years and females aged 15 years are the age groups that are most secure financially, with 98.3% of males and 100.0% of females in these age groups living above the poverty line.
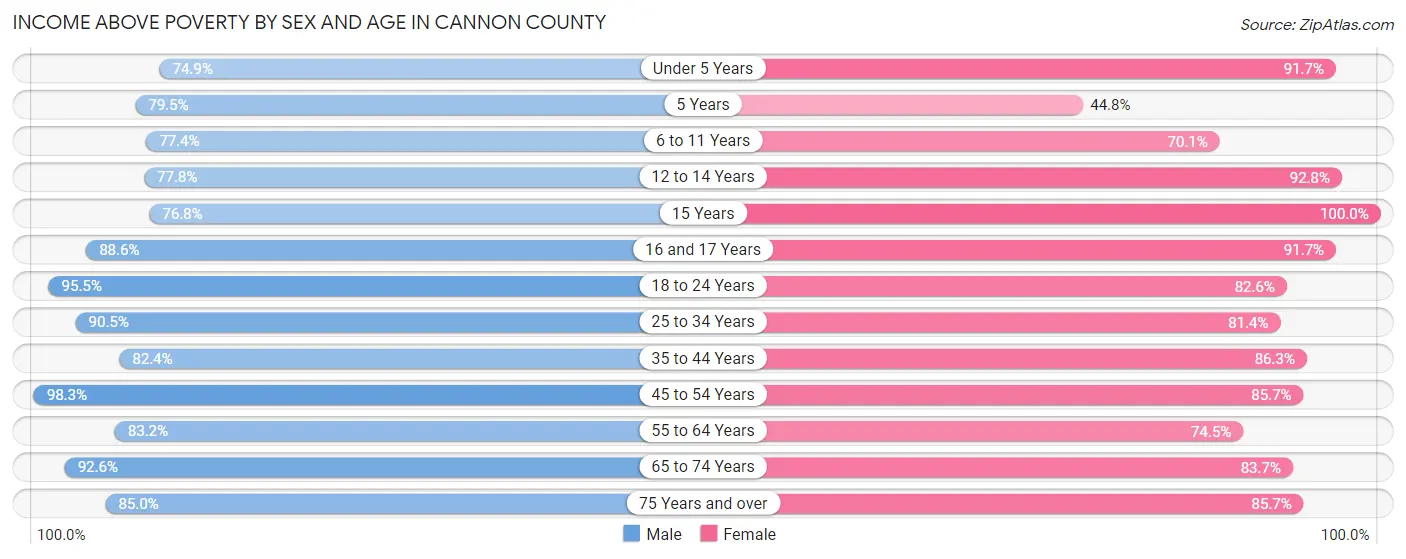
| Age Bracket | Male | Female |
| Under 5 Years | 323 (74.9%) | 342 (91.7%) |
| 5 Years | 58 (79.4%) | 13 (44.8%) |
| 6 to 11 Years | 428 (77.4%) | 352 (70.1%) |
| 12 to 14 Years | 214 (77.8%) | 245 (92.8%) |
| 15 Years | 73 (76.8%) | 67 (100.0%) |
| 16 and 17 Years | 209 (88.6%) | 166 (91.7%) |
| 18 to 24 Years | 535 (95.5%) | 398 (82.6%) |
| 25 to 34 Years | 822 (90.5%) | 852 (81.4%) |
| 35 to 44 Years | 726 (82.4%) | 711 (86.3%) |
| 45 to 54 Years | 1,035 (98.3%) | 796 (85.7%) |
| 55 to 64 Years | 884 (83.2%) | 797 (74.5%) |
| 65 to 74 Years | 646 (92.5%) | 657 (83.7%) |
| 75 Years and over | 351 (85.0%) | 462 (85.7%) |
| Total | 6,304 (87.1%) | 5,858 (82.6%) |
Income Below Poverty Among Married-Couple Families in Cannon County
The poverty statistics for married-couple families in Cannon County show that 5.3% or 145 of the total 2,744 families live below the poverty line. Families with 5 or more children have the highest poverty rate of 35.7%, comprising of 5 families. On the other hand, families with 1 or 2 children have the lowest poverty rate of 0.0%, which includes 0 families.
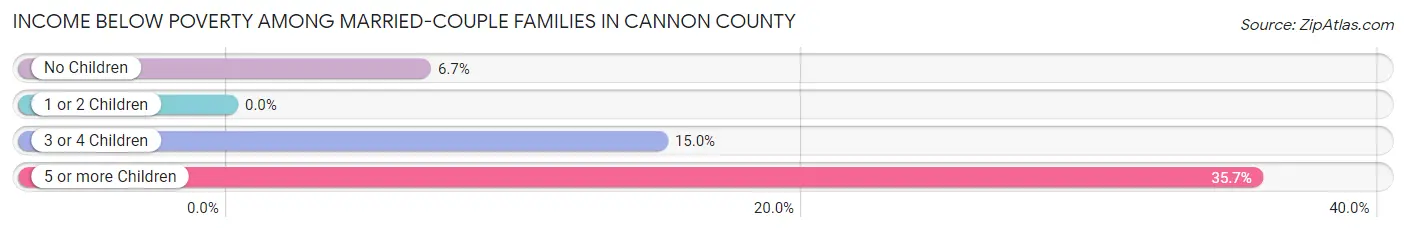
| Children | Above Poverty | Below Poverty |
| No Children | 1,637 (93.3%) | 118 (6.7%) |
| 1 or 2 Children | 828 (100.0%) | 0 (0.0%) |
| 3 or 4 Children | 125 (85.0%) | 22 (15.0%) |
| 5 or more Children | 9 (64.3%) | 5 (35.7%) |
| Total | 2,599 (94.7%) | 145 (5.3%) |
Income Below Poverty Among Single-Parent Households in Cannon County
According to the poverty data in Cannon County, 28.4% or 78 single-father households and 42.1% or 280 single-mother households are living below the poverty line. Among single-father households, those with 3 or 4 children have the highest poverty rate, with 48 households (100.0%) experiencing poverty. Likewise, among single-mother households, those with 1 or 2 children have the highest poverty rate, with 192 households (57.0%) falling below the poverty line.
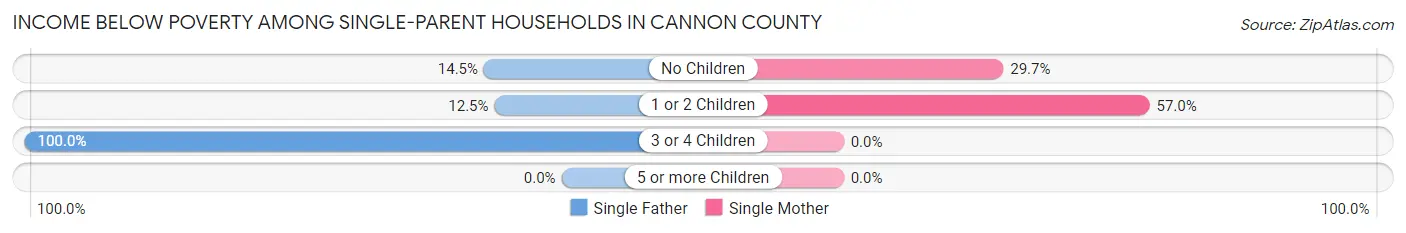
| Children | Single Father | Single Mother |
| No Children | 12 (14.5%) | 88 (29.7%) |
| 1 or 2 Children | 18 (12.5%) | 192 (57.0%) |
| 3 or 4 Children | 48 (100.0%) | 0 (0.0%) |
| 5 or more Children | 0 (0.0%) | 0 (0.0%) |
| Total | 78 (28.4%) | 280 (42.1%) |
Income Below Poverty Among Married-Couple vs Single-Parent Households in Cannon County
The poverty data for Cannon County shows that 145 of the married-couple family households (5.3%) and 358 of the single-parent households (38.1%) are living below the poverty level. Within the married-couple family households, those with 5 or more children have the highest poverty rate, with 5 households (35.7%) falling below the poverty line. Among the single-parent households, those with 3 or 4 children have the highest poverty rate, with 48 household (60.0%) living below poverty.

| Children | Married-Couple Families | Single-Parent Households |
| No Children | 118 (6.7%) | 100 (26.4%) |
| 1 or 2 Children | 0 (0.0%) | 210 (43.7%) |
| 3 or 4 Children | 22 (15.0%) | 48 (60.0%) |
| 5 or more Children | 5 (35.7%) | 0 (0.0%) |
| Total | 145 (5.3%) | 358 (38.1%) |
Employment Characteristics in Cannon County
Employment by Class of Employer in Cannon County
Among the 6,287 employed individuals in Cannon County, private company employees (4,343 | 69.1%), local government employees (555 | 8.8%), and self-employed (not incorporated) (518 | 8.2%) make up the most common classes of employment.
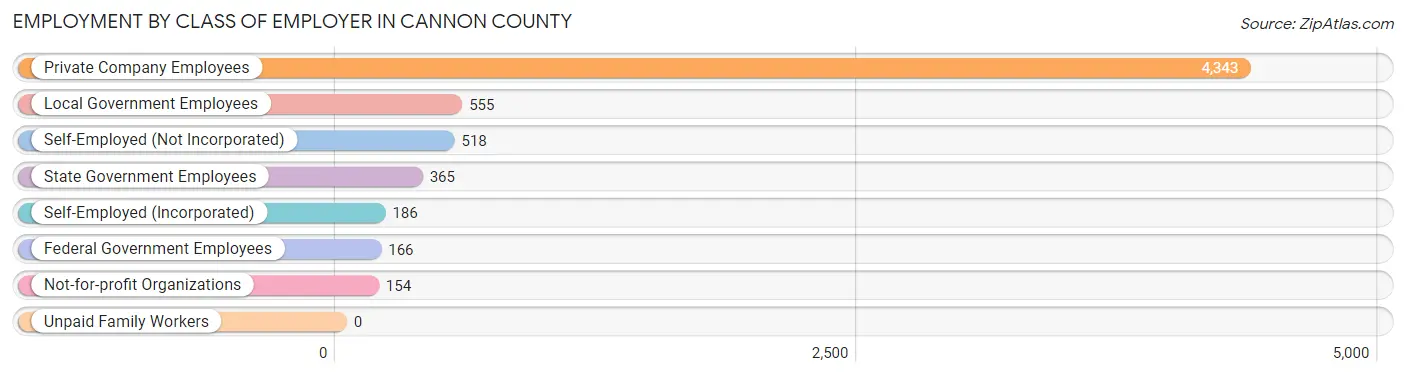
| Employer Class | # Employees | % Employees |
| Private Company Employees | 4,343 | 69.1% |
| Self-Employed (Incorporated) | 186 | 3.0% |
| Self-Employed (Not Incorporated) | 518 | 8.2% |
| Not-for-profit Organizations | 154 | 2.5% |
| Local Government Employees | 555 | 8.8% |
| State Government Employees | 365 | 5.8% |
| Federal Government Employees | 166 | 2.6% |
| Unpaid Family Workers | 0 | 0.0% |
| Total | 6,287 | 100.0% |
Employment Status by Age in Cannon County
According to the labor force statistics for Cannon County, out of the total population over 16 years of age (11,799), 56.5% or 6,666 individuals are in the labor force, with 3.3% or 220 of them unemployed. The age group with the highest labor force participation rate is 30 to 34 years, with 84.7% or 839 individuals in the labor force. Within the labor force, the 30 to 34 years age range has the highest percentage of unemployed individuals, with 7.3% or 61 of them being unemployed.
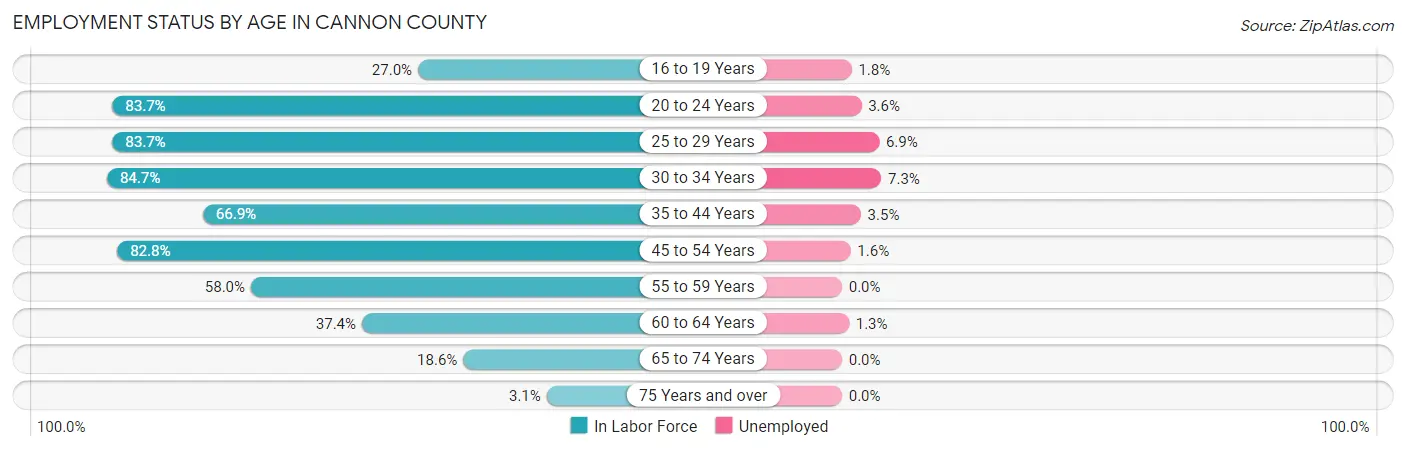
| Age Bracket | In Labor Force | Unemployed |
| 16 to 19 Years | 167 (27.0%) | 3 (1.8%) |
| 20 to 24 Years | 713 (83.7%) | 26 (3.6%) |
| 25 to 29 Years | 814 (83.7%) | 56 (6.9%) |
| 30 to 34 Years | 839 (84.7%) | 61 (7.3%) |
| 35 to 44 Years | 1,146 (66.9%) | 40 (3.5%) |
| 45 to 54 Years | 1,644 (82.8%) | 26 (1.6%) |
| 55 to 59 Years | 635 (58.0%) | 0 (0.0%) |
| 60 to 64 Years | 396 (37.4%) | 5 (1.3%) |
| 65 to 74 Years | 279 (18.6%) | 0 (0.0%) |
| 75 Years and over | 32 (3.1%) | 0 (0.0%) |
| Total | 6,666 (56.5%) | 220 (3.3%) |
Employment Status by Educational Attainment in Cannon County
According to labor force statistics for Cannon County, 70.0% of individuals (5,469) out of the total population between 25 and 64 years of age (7,813) are in the labor force, with 3.4% or 186 of them being unemployed. The group with the highest labor force participation rate are those with the educational attainment of bachelor's degree or higher, with 84.3% or 1,132 individuals in the labor force. Within the labor force, individuals with college / associate degree education have the highest percentage of unemployment, with 5.1% or 82 of them being unemployed.
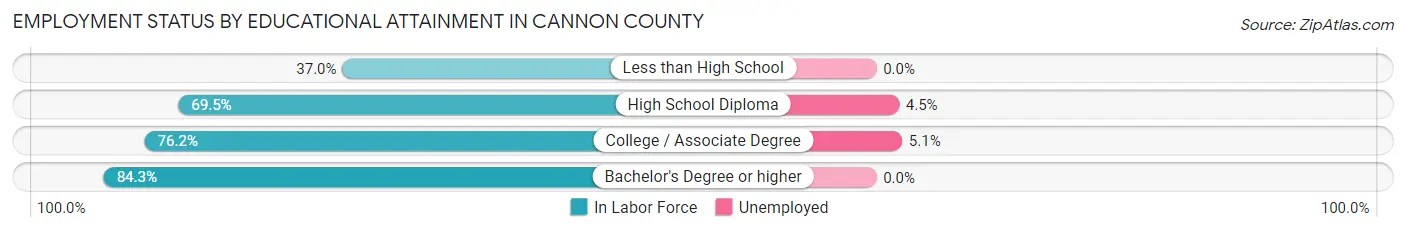
| Educational Attainment | In Labor Force | Unemployed |
| Less than High School | 339 (37.0%) | 0 (0.0%) |
| High School Diploma | 2,399 (69.5%) | 155 (4.5%) |
| College / Associate Degree | 1,601 (76.2%) | 107 (5.1%) |
| Bachelor's Degree or higher | 1,132 (84.3%) | 0 (0.0%) |
| Total | 5,469 (70.0%) | 266 (3.4%) |
Employment Occupations by Sex in Cannon County
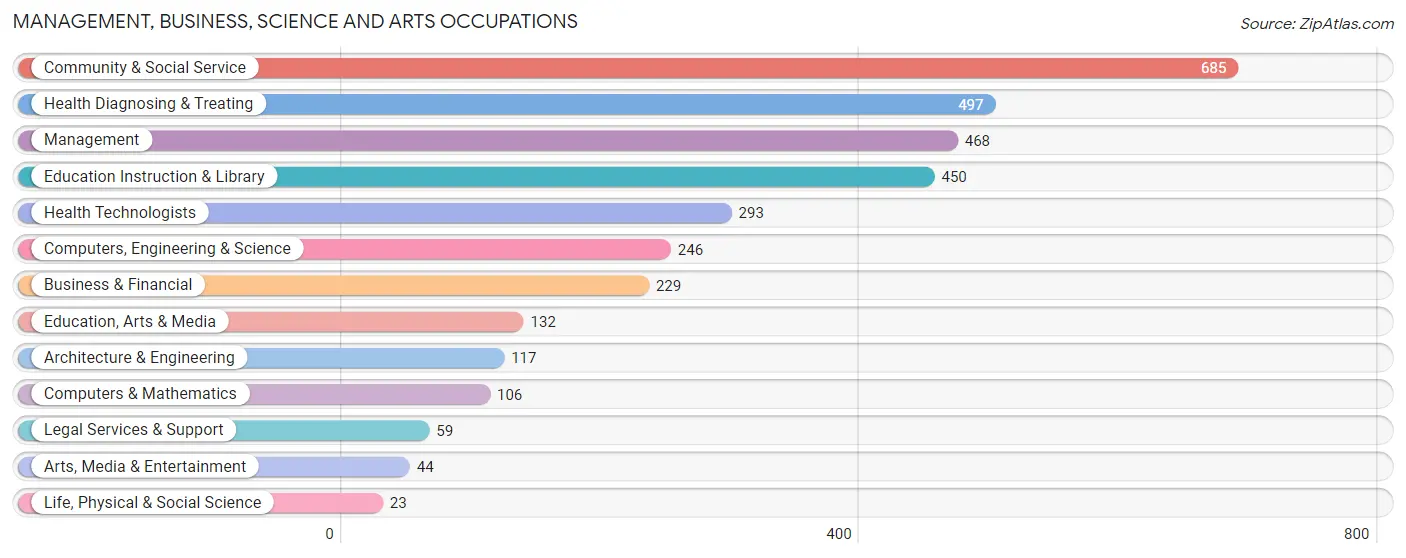
Management, Business, Science and Arts Occupations
The most common Management, Business, Science and Arts occupations in Cannon County are Community & Social Service (685 | 10.6%), Health Diagnosing & Treating (497 | 7.7%), Management (468 | 7.3%), Education Instruction & Library (450 | 7.0%), and Health Technologists (293 | 4.5%).
Management, Business, Science and Arts Occupations by Sex
Within the Management, Business, Science and Arts occupations in Cannon County, the most male-oriented occupations are Computers & Mathematics (93.4%), Architecture & Engineering (88.9%), and Computers, Engineering & Science (85.0%), while the most female-oriented occupations are Education, Arts & Media (100.0%), Health Diagnosing & Treating (81.7%), and Life, Physical & Social Science (73.9%).
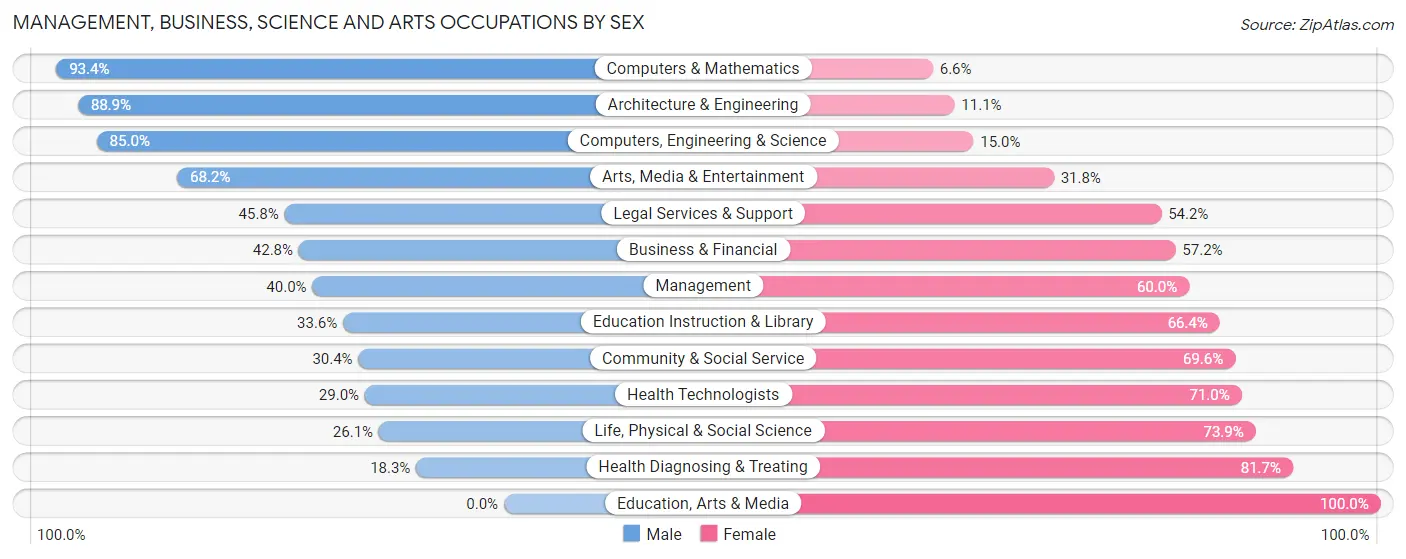
| Occupation | Male | Female |
| Management | 187 (40.0%) | 281 (60.0%) |
| Business & Financial | 98 (42.8%) | 131 (57.2%) |
| Computers, Engineering & Science | 209 (85.0%) | 37 (15.0%) |
| Computers & Mathematics | 99 (93.4%) | 7 (6.6%) |
| Architecture & Engineering | 104 (88.9%) | 13 (11.1%) |
| Life, Physical & Social Science | 6 (26.1%) | 17 (73.9%) |
| Community & Social Service | 208 (30.4%) | 477 (69.6%) |
| Education, Arts & Media | 0 (0.0%) | 132 (100.0%) |
| Legal Services & Support | 27 (45.8%) | 32 (54.2%) |
| Education Instruction & Library | 151 (33.6%) | 299 (66.4%) |
| Arts, Media & Entertainment | 30 (68.2%) | 14 (31.8%) |
| Health Diagnosing & Treating | 91 (18.3%) | 406 (81.7%) |
| Health Technologists | 85 (29.0%) | 208 (71.0%) |
| Total (Category) | 793 (37.3%) | 1,332 (62.7%) |
| Total (Overall) | 3,402 (52.8%) | 3,043 (47.2%) |
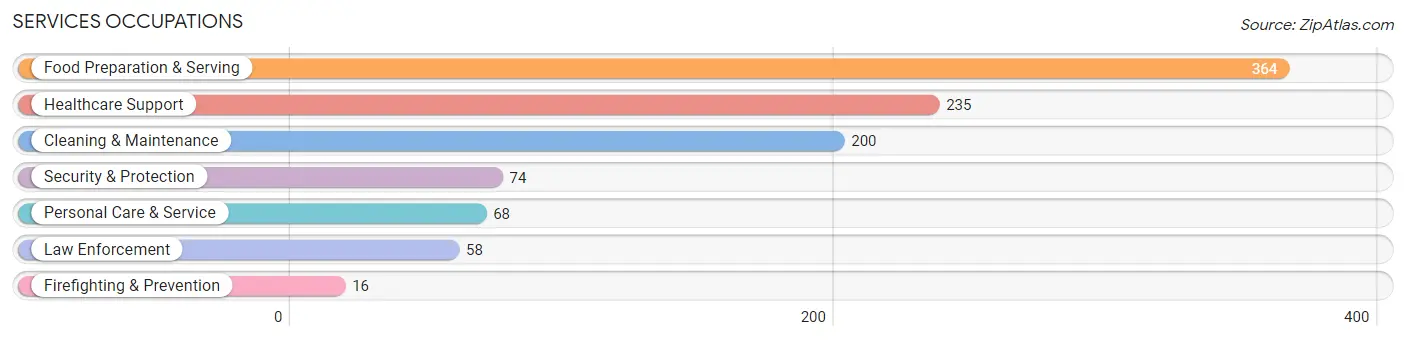
Services Occupations
The most common Services occupations in Cannon County are Food Preparation & Serving (364 | 5.7%), Healthcare Support (235 | 3.6%), Cleaning & Maintenance (200 | 3.1%), Security & Protection (74 | 1.1%), and Personal Care & Service (68 | 1.1%).
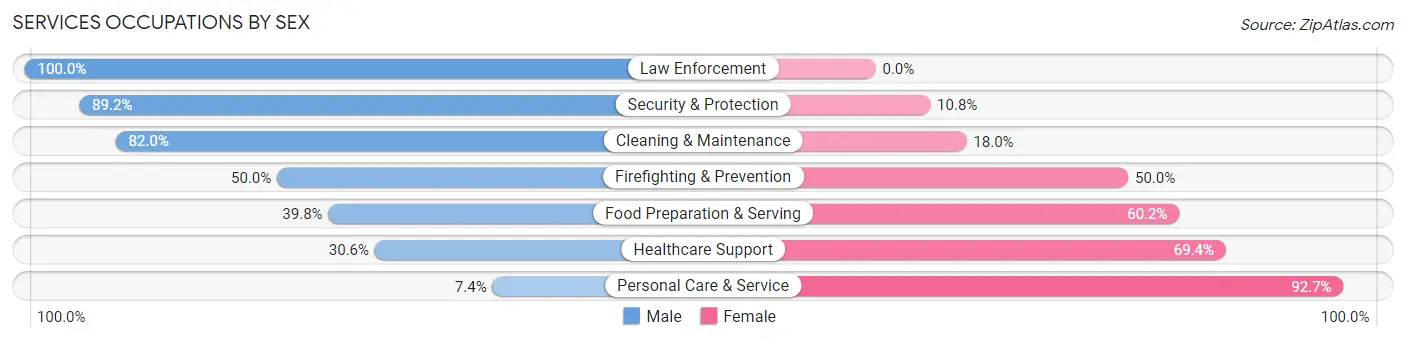
Services Occupations by Sex
Within the Services occupations in Cannon County, the most male-oriented occupations are Law Enforcement (100.0%), Security & Protection (89.2%), and Cleaning & Maintenance (82.0%), while the most female-oriented occupations are Personal Care & Service (92.6%), Healthcare Support (69.4%), and Food Preparation & Serving (60.2%).
| Occupation | Male | Female |
| Healthcare Support | 72 (30.6%) | 163 (69.4%) |
| Security & Protection | 66 (89.2%) | 8 (10.8%) |
| Firefighting & Prevention | 8 (50.0%) | 8 (50.0%) |
| Law Enforcement | 58 (100.0%) | 0 (0.0%) |
| Food Preparation & Serving | 145 (39.8%) | 219 (60.2%) |
| Cleaning & Maintenance | 164 (82.0%) | 36 (18.0%) |
| Personal Care & Service | 5 (7.3%) | 63 (92.6%) |
| Total (Category) | 452 (48.0%) | 489 (52.0%) |
| Total (Overall) | 3,402 (52.8%) | 3,043 (47.2%) |
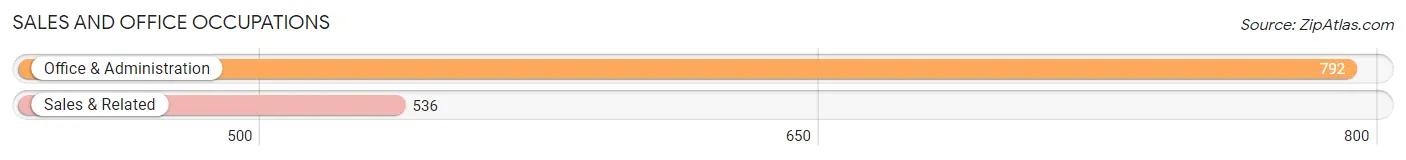
Sales and Office Occupations
The most common Sales and Office occupations in Cannon County are Office & Administration (792 | 12.3%), and Sales & Related (536 | 8.3%).
Sales and Office Occupations by Sex
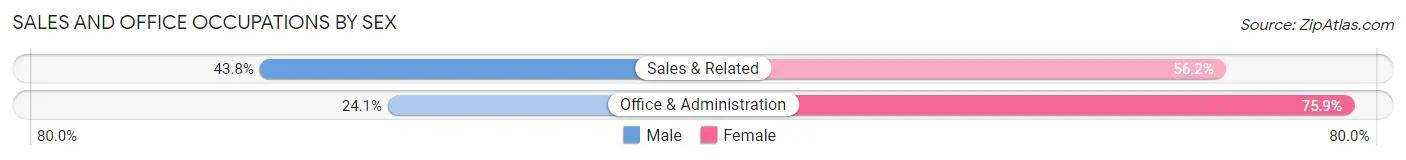
| Occupation | Male | Female |
| Sales & Related | 235 (43.8%) | 301 (56.2%) |
| Office & Administration | 191 (24.1%) | 601 (75.9%) |
| Total (Category) | 426 (32.1%) | 902 (67.9%) |
| Total (Overall) | 3,402 (52.8%) | 3,043 (47.2%) |
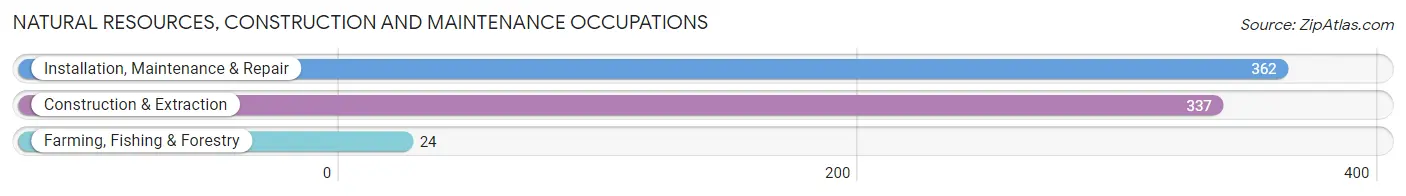
Natural Resources, Construction and Maintenance Occupations
The most common Natural Resources, Construction and Maintenance occupations in Cannon County are Installation, Maintenance & Repair (362 | 5.6%), Construction & Extraction (337 | 5.2%), and Farming, Fishing & Forestry (24 | 0.4%).
Natural Resources, Construction and Maintenance Occupations by Sex
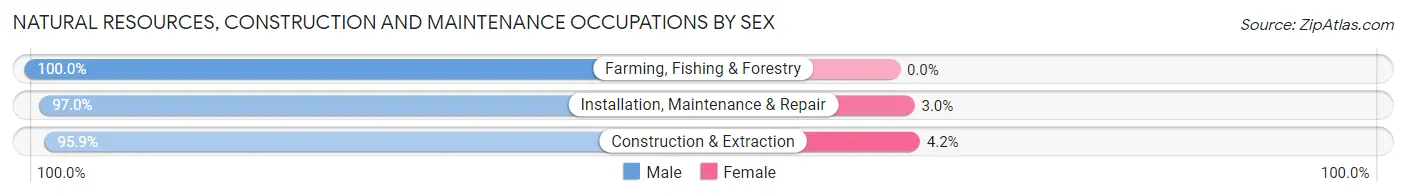
| Occupation | Male | Female |
| Farming, Fishing & Forestry | 24 (100.0%) | 0 (0.0%) |
| Construction & Extraction | 323 (95.9%) | 14 (4.2%) |
| Installation, Maintenance & Repair | 351 (97.0%) | 11 (3.0%) |
| Total (Category) | 698 (96.5%) | 25 (3.5%) |
| Total (Overall) | 3,402 (52.8%) | 3,043 (47.2%) |
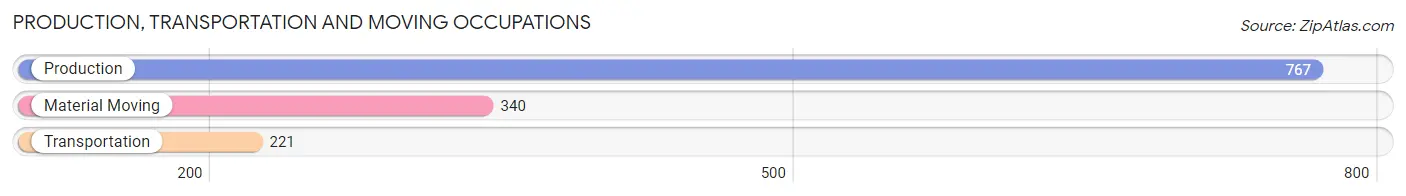
Production, Transportation and Moving Occupations
The most common Production, Transportation and Moving occupations in Cannon County are Production (767 | 11.9%), Material Moving (340 | 5.3%), and Transportation (221 | 3.4%).
Production, Transportation and Moving Occupations by Sex
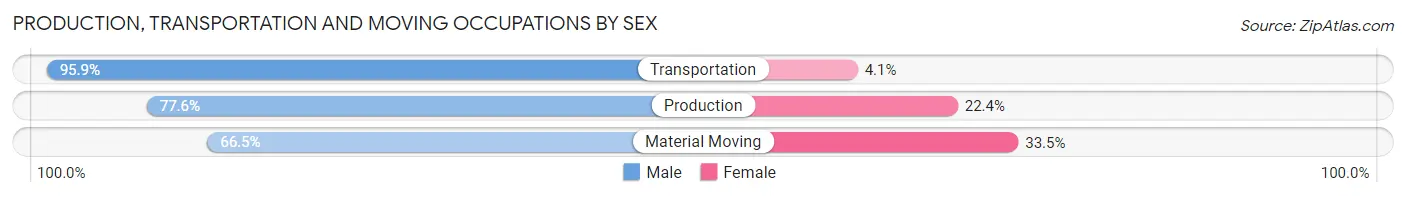
| Occupation | Male | Female |
| Production | 595 (77.6%) | 172 (22.4%) |
| Transportation | 212 (95.9%) | 9 (4.1%) |
| Material Moving | 226 (66.5%) | 114 (33.5%) |
| Total (Category) | 1,033 (77.8%) | 295 (22.2%) |
| Total (Overall) | 3,402 (52.8%) | 3,043 (47.2%) |
Employment Industries by Sex in Cannon County
Employment Industries in Cannon County
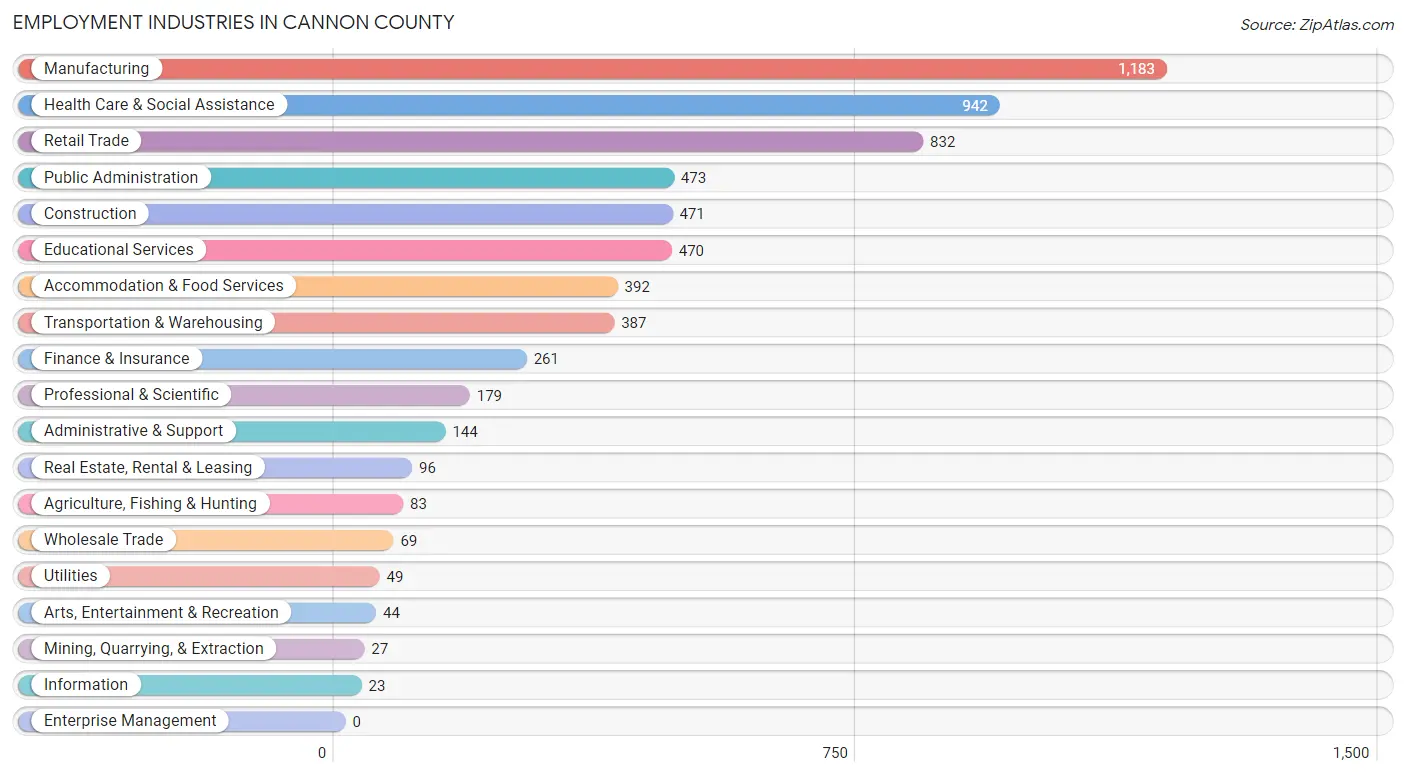
The major employment industries in Cannon County include Manufacturing (1,183 | 18.4%), Health Care & Social Assistance (942 | 14.6%), Retail Trade (832 | 12.9%), Public Administration (473 | 7.3%), and Construction (471 | 7.3%).
Employment Industries by Sex in Cannon County
The Cannon County industries that see more men than women are Information (100.0%), Construction (91.1%), and Agriculture, Fishing & Hunting (84.3%), whereas the industries that tend to have a higher number of women are Health Care & Social Assistance (83.7%), Educational Services (83.2%), and Real Estate, Rental & Leasing (77.1%).
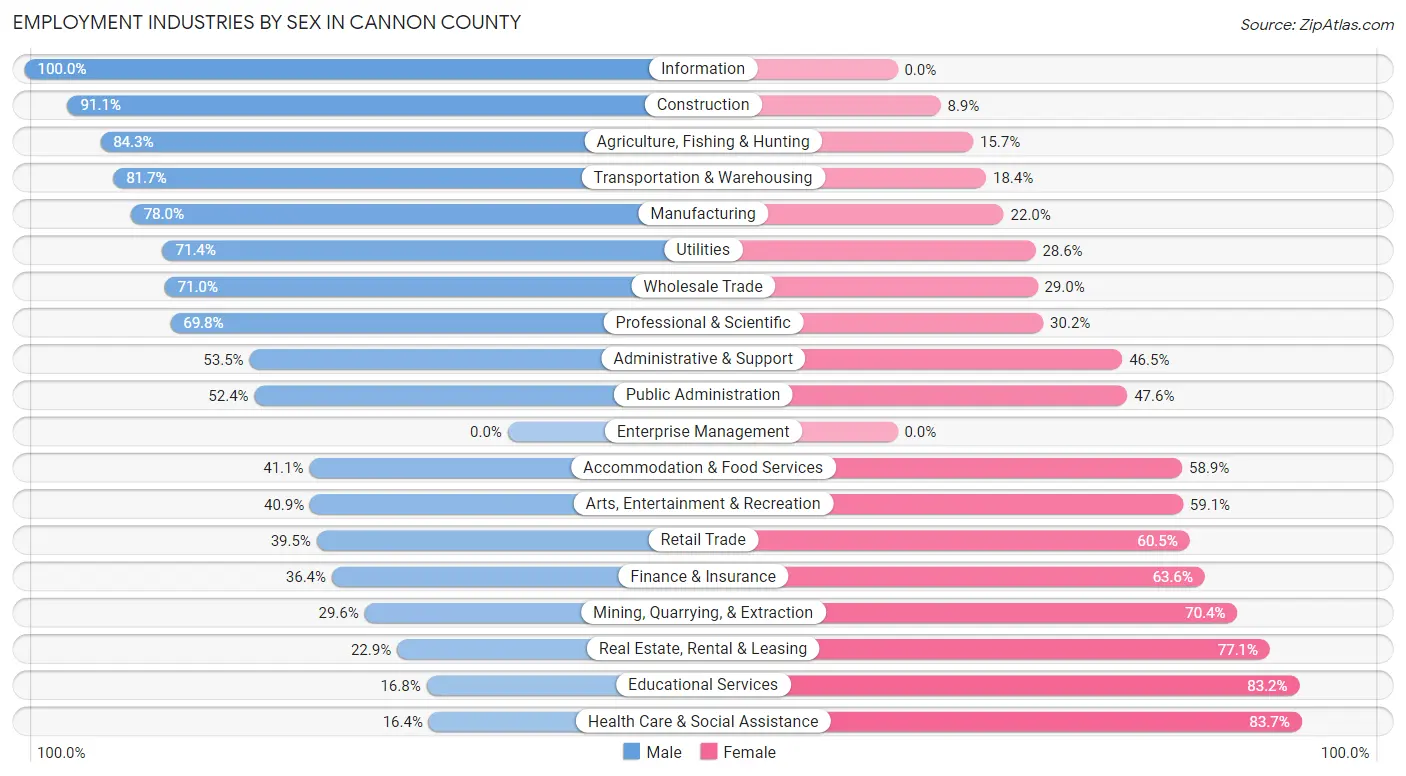
| Industry | Male | Female |
| Agriculture, Fishing & Hunting | 70 (84.3%) | 13 (15.7%) |
| Mining, Quarrying, & Extraction | 8 (29.6%) | 19 (70.4%) |
| Construction | 429 (91.1%) | 42 (8.9%) |
| Manufacturing | 923 (78.0%) | 260 (22.0%) |
| Wholesale Trade | 49 (71.0%) | 20 (29.0%) |
| Retail Trade | 329 (39.5%) | 503 (60.5%) |
| Transportation & Warehousing | 316 (81.7%) | 71 (18.3%) |
| Utilities | 35 (71.4%) | 14 (28.6%) |
| Information | 23 (100.0%) | 0 (0.0%) |
| Finance & Insurance | 95 (36.4%) | 166 (63.6%) |
| Real Estate, Rental & Leasing | 22 (22.9%) | 74 (77.1%) |
| Professional & Scientific | 125 (69.8%) | 54 (30.2%) |
| Enterprise Management | 0 (0.0%) | 0 (0.0%) |
| Administrative & Support | 77 (53.5%) | 67 (46.5%) |
| Educational Services | 79 (16.8%) | 391 (83.2%) |
| Health Care & Social Assistance | 154 (16.4%) | 788 (83.7%) |
| Arts, Entertainment & Recreation | 18 (40.9%) | 26 (59.1%) |
| Accommodation & Food Services | 161 (41.1%) | 231 (58.9%) |
| Public Administration | 248 (52.4%) | 225 (47.6%) |
| Total | 3,402 (52.8%) | 3,043 (47.2%) |
Education in Cannon County
School Enrollment in Cannon County
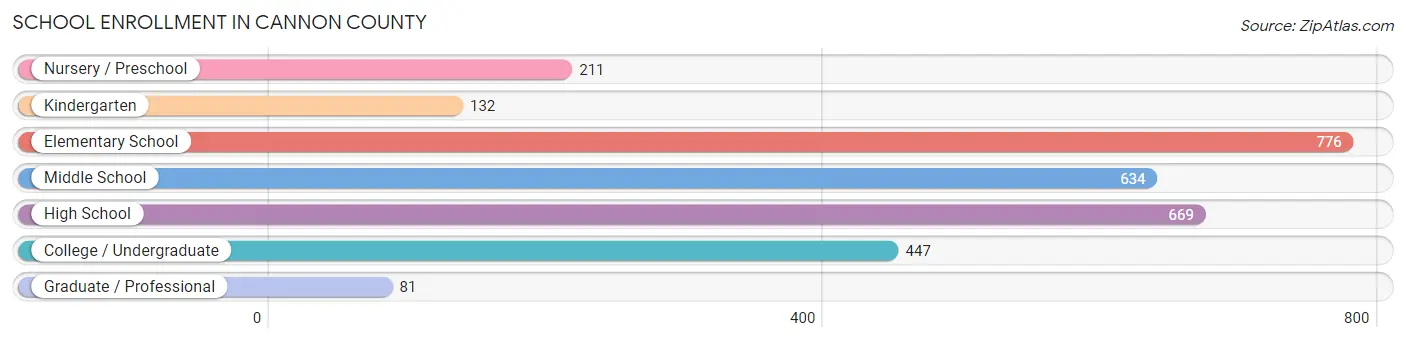
The most common levels of schooling among the 2,950 students in Cannon County are elementary school (776 | 26.3%), high school (669 | 22.7%), and middle school (634 | 21.5%).
| School Level | # Students | % Students |
| Nursery / Preschool | 211 | 7.1% |
| Kindergarten | 132 | 4.5% |
| Elementary School | 776 | 26.3% |
| Middle School | 634 | 21.5% |
| High School | 669 | 22.7% |
| College / Undergraduate | 447 | 15.1% |
| Graduate / Professional | 81 | 2.8% |
| Total | 2,950 | 100.0% |
School Enrollment by Age by Funding Source in Cannon County
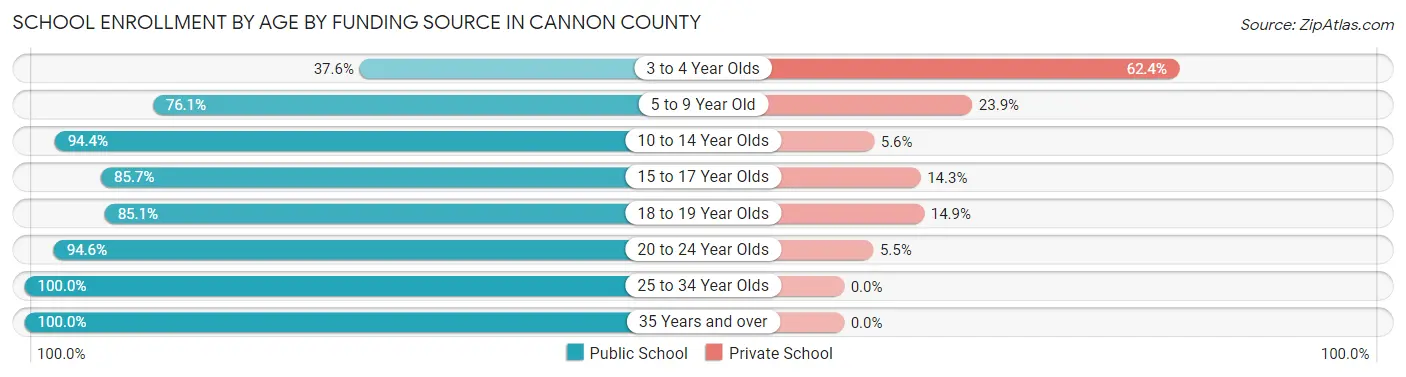
Out of a total of 2,950 students who are enrolled in schools in Cannon County, 469 (15.9%) attend a private institution, while the remaining 2,481 (84.1%) are enrolled in public schools. The age group of 3 to 4 year olds has the highest likelihood of being enrolled in private schools, with 103 (62.4% in the age bracket) enrolled. Conversely, the age group of 25 to 34 year olds has the lowest likelihood of being enrolled in a private school, with 121 (100.0% in the age bracket) attending a public institution.
| Age Bracket | Public School | Private School |
| 3 to 4 Year Olds | 62 (37.6%) | 103 (62.4%) |
| 5 to 9 Year Old | 688 (76.1%) | 216 (23.9%) |
| 10 to 14 Year Olds | 690 (94.4%) | 41 (5.6%) |
| 15 to 17 Year Olds | 445 (85.7%) | 74 (14.3%) |
| 18 to 19 Year Olds | 114 (85.1%) | 20 (14.9%) |
| 20 to 24 Year Olds | 260 (94.6%) | 15 (5.4%) |
| 25 to 34 Year Olds | 121 (100.0%) | 0 (0.0%) |
| 35 Years and over | 101 (100.0%) | 0 (0.0%) |
| Total | 2,481 (84.1%) | 469 (15.9%) |
Educational Attainment by Field of Study in Cannon County
Education (330 | 16.9%), business (329 | 16.9%), science & technology (302 | 15.5%), bio, nature & agricultural (205 | 10.5%), and arts & humanities (160 | 8.2%) are the most common fields of study among 1,953 individuals in Cannon County who have obtained a bachelor's degree or higher.
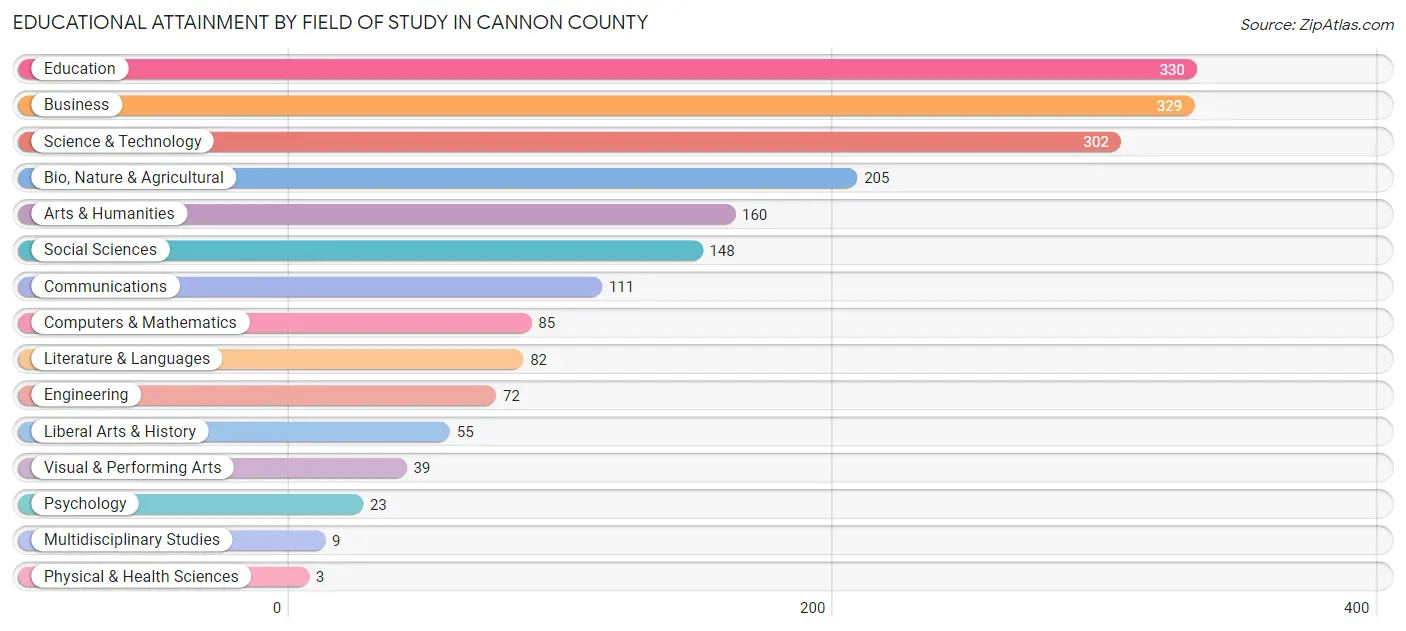
| Field of Study | # Graduates | % Graduates |
| Computers & Mathematics | 85 | 4.3% |
| Bio, Nature & Agricultural | 205 | 10.5% |
| Physical & Health Sciences | 3 | 0.2% |
| Psychology | 23 | 1.2% |
| Social Sciences | 148 | 7.6% |
| Engineering | 72 | 3.7% |
| Multidisciplinary Studies | 9 | 0.5% |
| Science & Technology | 302 | 15.5% |
| Business | 329 | 16.9% |
| Education | 330 | 16.9% |
| Literature & Languages | 82 | 4.2% |
| Liberal Arts & History | 55 | 2.8% |
| Visual & Performing Arts | 39 | 2.0% |
| Communications | 111 | 5.7% |
| Arts & Humanities | 160 | 8.2% |
| Total | 1,953 | 100.0% |
Transportation & Commute in Cannon County
Vehicle Availability by Sex in Cannon County
The most prevalent vehicle ownership categories in Cannon County are males with 3 vehicles (1,042, accounting for 30.9%) and females with 3 vehicles (754, making up 35.7%).
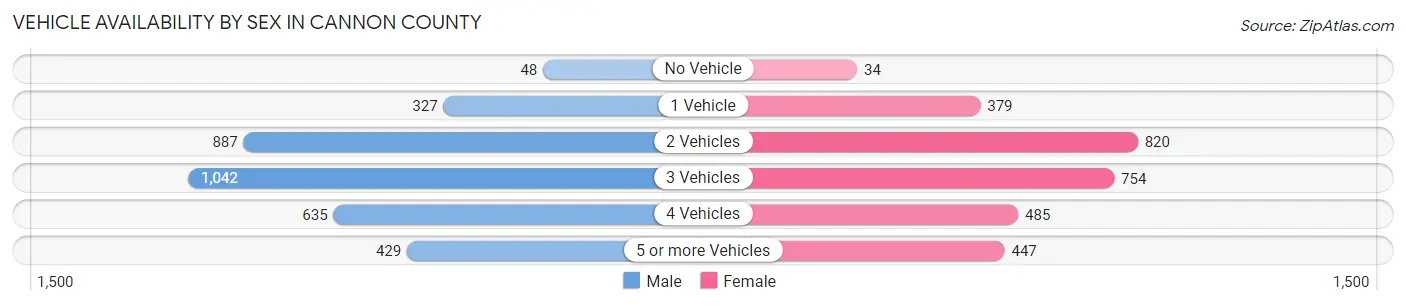
| Vehicles Available | Male | Female |
| No Vehicle | 48 (1.4%) | 34 (1.2%) |
| 1 Vehicle | 327 (9.7%) | 379 (13.0%) |
| 2 Vehicles | 887 (26.3%) | 820 (28.1%) |
| 3 Vehicles | 1,042 (30.9%) | 754 (25.8%) |
| 4 Vehicles | 635 (18.9%) | 485 (16.6%) |
| 5 or more Vehicles | 429 (12.7%) | 447 (15.3%) |
| Total | 3,368 (100.0%) | 2,919 (100.0%) |
Commute Time in Cannon County
The most frequently occuring commute durations in Cannon County are 45 to 59 minutes (1,087 commuters, 18.3%), 30 to 34 minutes (1,037 commuters, 17.5%), and 60 to 89 minutes (708 commuters, 11.9%).
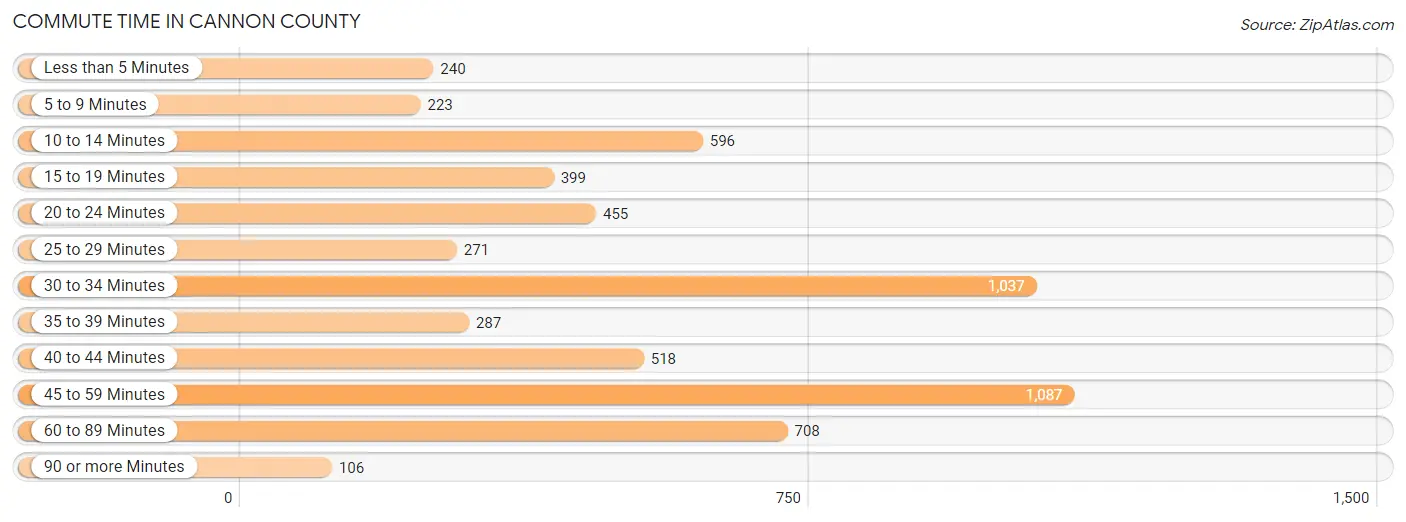
| Commute Time | # Commuters | % Commuters |
| Less than 5 Minutes | 240 | 4.1% |
| 5 to 9 Minutes | 223 | 3.8% |
| 10 to 14 Minutes | 596 | 10.1% |
| 15 to 19 Minutes | 399 | 6.7% |
| 20 to 24 Minutes | 455 | 7.7% |
| 25 to 29 Minutes | 271 | 4.6% |
| 30 to 34 Minutes | 1,037 | 17.5% |
| 35 to 39 Minutes | 287 | 4.8% |
| 40 to 44 Minutes | 518 | 8.7% |
| 45 to 59 Minutes | 1,087 | 18.3% |
| 60 to 89 Minutes | 708 | 11.9% |
| 90 or more Minutes | 106 | 1.8% |
Commute Time by Sex in Cannon County
The most common commute times in Cannon County are 45 to 59 minutes (663 commuters, 21.0%) for males and 30 to 34 minutes (493 commuters, 17.8%) for females.

| Commute Time | Male | Female |
| Less than 5 Minutes | 108 (3.4%) | 132 (4.8%) |
| 5 to 9 Minutes | 135 (4.3%) | 88 (3.2%) |
| 10 to 14 Minutes | 265 (8.4%) | 331 (12.0%) |
| 15 to 19 Minutes | 188 (5.9%) | 211 (7.6%) |
| 20 to 24 Minutes | 197 (6.2%) | 258 (9.3%) |
| 25 to 29 Minutes | 123 (3.9%) | 148 (5.3%) |
| 30 to 34 Minutes | 544 (17.2%) | 493 (17.8%) |
| 35 to 39 Minutes | 204 (6.5%) | 83 (3.0%) |
| 40 to 44 Minutes | 259 (8.2%) | 259 (9.4%) |
| 45 to 59 Minutes | 663 (21.0%) | 424 (15.3%) |
| 60 to 89 Minutes | 414 (13.1%) | 294 (10.6%) |
| 90 or more Minutes | 61 (1.9%) | 45 (1.6%) |
Time of Departure to Work by Sex in Cannon County
The most frequent times of departure to work in Cannon County are 6:00 AM to 6:29 AM (664, 21.0%) for males and 7:00 AM to 7:29 AM (590, 21.3%) for females.

| Time of Departure | Male | Female |
| 12:00 AM to 4:59 AM | 231 (7.3%) | 239 (8.6%) |
| 5:00 AM to 5:29 AM | 423 (13.4%) | 102 (3.7%) |
| 5:30 AM to 5:59 AM | 169 (5.3%) | 186 (6.7%) |
| 6:00 AM to 6:29 AM | 664 (21.0%) | 129 (4.7%) |
| 6:30 AM to 6:59 AM | 205 (6.5%) | 475 (17.2%) |
| 7:00 AM to 7:29 AM | 195 (6.2%) | 590 (21.3%) |
| 7:30 AM to 7:59 AM | 381 (12.0%) | 202 (7.3%) |
| 8:00 AM to 8:29 AM | 50 (1.6%) | 215 (7.8%) |
| 8:30 AM to 8:59 AM | 70 (2.2%) | 45 (1.6%) |
| 9:00 AM to 9:59 AM | 66 (2.1%) | 75 (2.7%) |
| 10:00 AM to 10:59 AM | 80 (2.5%) | 8 (0.3%) |
| 11:00 AM to 11:59 AM | 13 (0.4%) | 0 (0.0%) |
| 12:00 PM to 3:59 PM | 219 (6.9%) | 268 (9.7%) |
| 4:00 PM to 11:59 PM | 395 (12.5%) | 232 (8.4%) |
| Total | 3,161 (100.0%) | 2,766 (100.0%) |
Housing Occupancy in Cannon County
Occupancy by Ownership in Cannon County
Of the total 5,769 dwellings in Cannon County, owner-occupied units account for 4,417 (76.6%), while renter-occupied units make up 1,352 (23.4%).
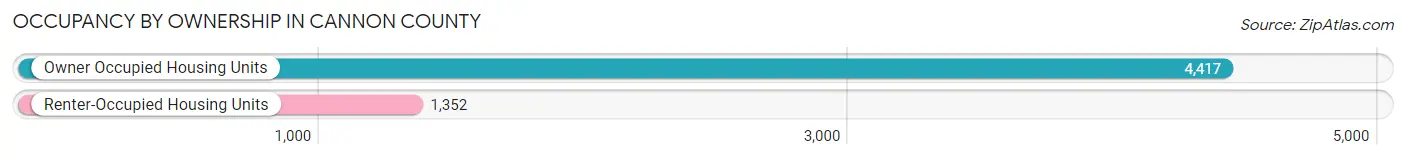
| Occupancy | # Housing Units | % Housing Units |
| Owner Occupied Housing Units | 4,417 | 76.6% |
| Renter-Occupied Housing Units | 1,352 | 23.4% |
| Total Occupied Housing Units | 5,769 | 100.0% |
Occupancy by Household Size in Cannon County
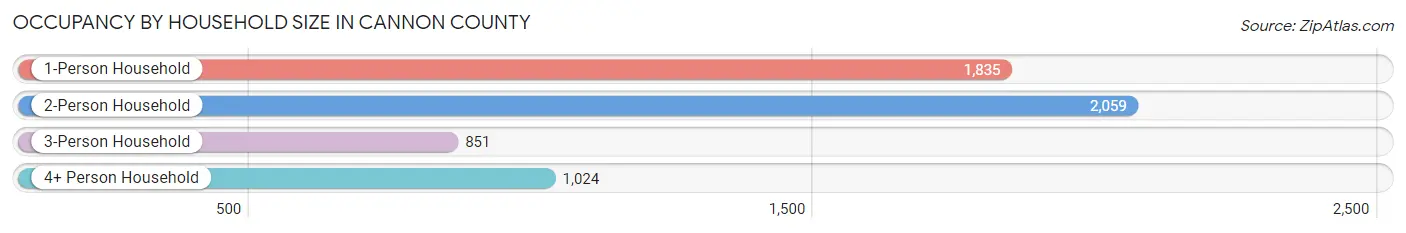
| Household Size | # Housing Units | % Housing Units |
| 1-Person Household | 1,835 | 31.8% |
| 2-Person Household | 2,059 | 35.7% |
| 3-Person Household | 851 | 14.7% |
| 4+ Person Household | 1,024 | 17.7% |
| Total Housing Units | 5,769 | 100.0% |
Occupancy by Ownership by Household Size in Cannon County
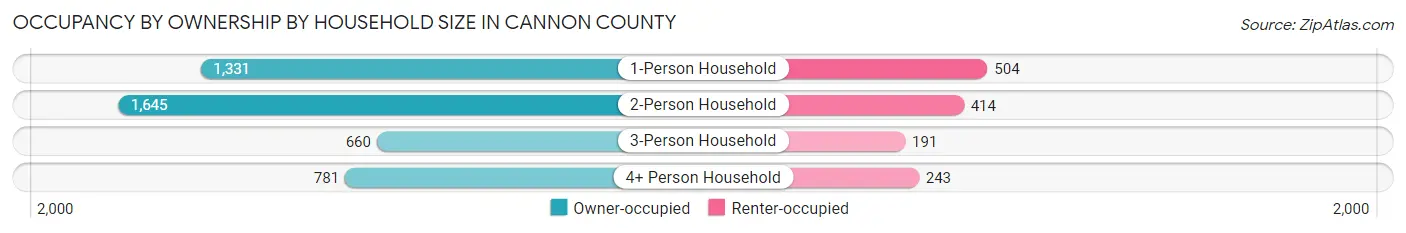
| Household Size | Owner-occupied | Renter-occupied |
| 1-Person Household | 1,331 (72.5%) | 504 (27.5%) |
| 2-Person Household | 1,645 (79.9%) | 414 (20.1%) |
| 3-Person Household | 660 (77.6%) | 191 (22.4%) |
| 4+ Person Household | 781 (76.3%) | 243 (23.7%) |
| Total Housing Units | 4,417 (76.6%) | 1,352 (23.4%) |
Occupancy by Educational Attainment in Cannon County
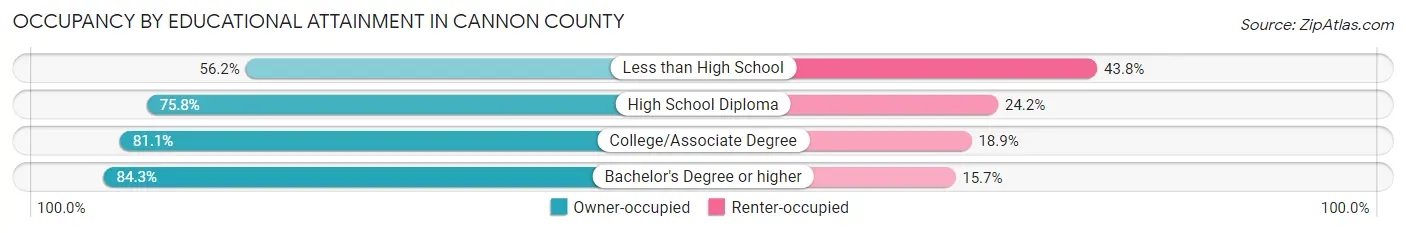
| Household Size | Owner-occupied | Renter-occupied |
| Less than High School | 404 (56.2%) | 315 (43.8%) |
| High School Diploma | 1,723 (75.8%) | 549 (24.2%) |
| College/Associate Degree | 1,322 (81.1%) | 308 (18.9%) |
| Bachelor's Degree or higher | 968 (84.3%) | 180 (15.7%) |
Occupancy by Age of Householder in Cannon County
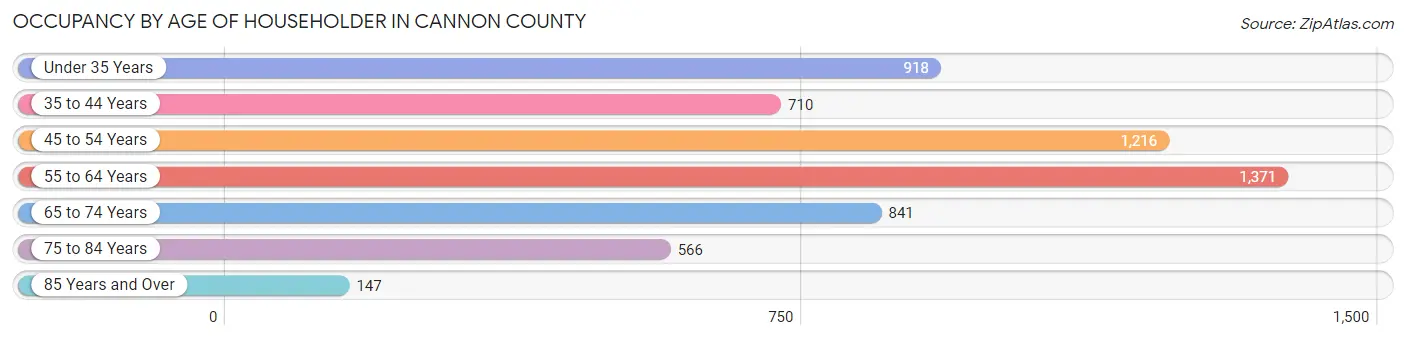
| Age Bracket | # Households | % Households |
| Under 35 Years | 918 | 15.9% |
| 35 to 44 Years | 710 | 12.3% |
| 45 to 54 Years | 1,216 | 21.1% |
| 55 to 64 Years | 1,371 | 23.8% |
| 65 to 74 Years | 841 | 14.6% |
| 75 to 84 Years | 566 | 9.8% |
| 85 Years and Over | 147 | 2.5% |
| Total | 5,769 | 100.0% |
Housing Finances in Cannon County
Median Income by Occupancy in Cannon County
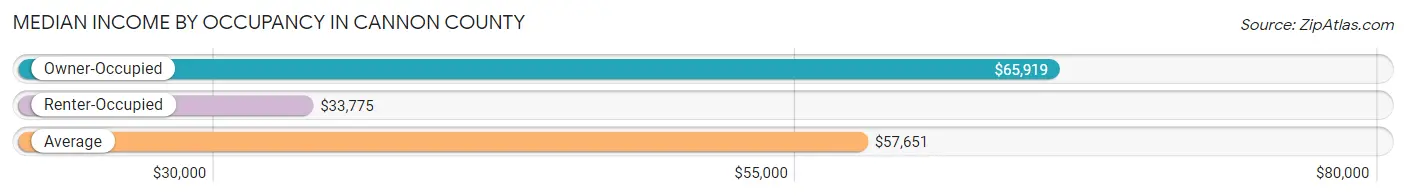
| Occupancy Type | # Households | Median Income |
| Owner-Occupied | 4,417 (76.6%) | $65,919 |
| Renter-Occupied | 1,352 (23.4%) | $33,775 |
| Average | 5,769 (100.0%) | $57,651 |
Occupancy by Householder Income Bracket in Cannon County
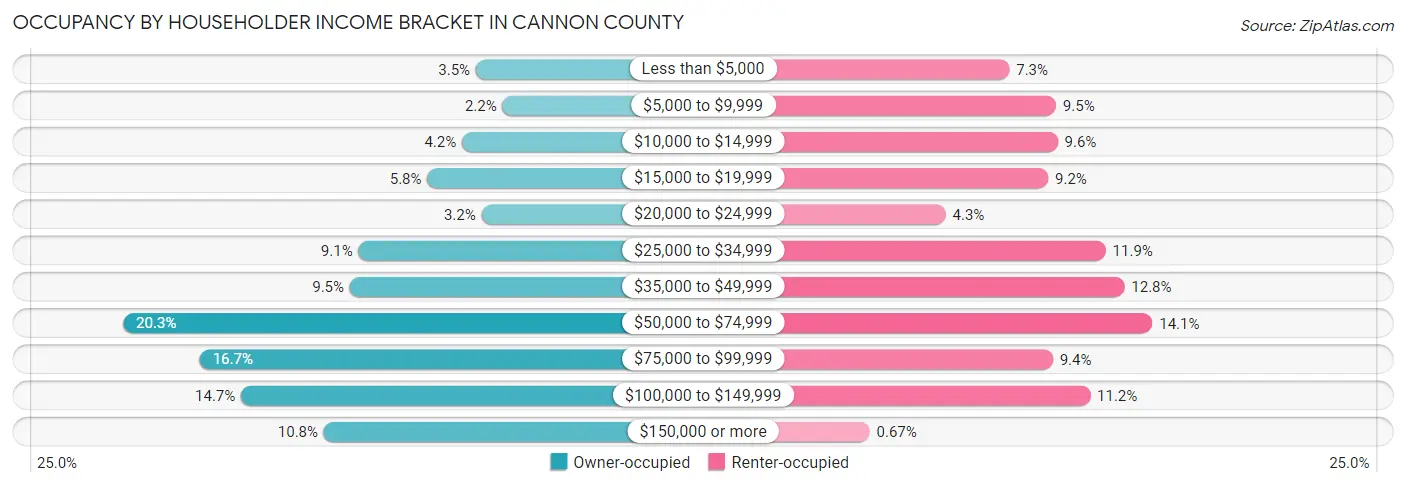
| Income Bracket | Owner-occupied | Renter-occupied |
| Less than $5,000 | 155 (3.5%) | 99 (7.3%) |
| $5,000 to $9,999 | 99 (2.2%) | 129 (9.5%) |
| $10,000 to $14,999 | 184 (4.2%) | 130 (9.6%) |
| $15,000 to $19,999 | 257 (5.8%) | 124 (9.2%) |
| $20,000 to $24,999 | 143 (3.2%) | 58 (4.3%) |
| $25,000 to $34,999 | 402 (9.1%) | 161 (11.9%) |
| $35,000 to $49,999 | 420 (9.5%) | 173 (12.8%) |
| $50,000 to $74,999 | 897 (20.3%) | 191 (14.1%) |
| $75,000 to $99,999 | 736 (16.7%) | 127 (9.4%) |
| $100,000 to $149,999 | 649 (14.7%) | 151 (11.2%) |
| $150,000 or more | 475 (10.7%) | 9 (0.7%) |
| Total | 4,417 (100.0%) | 1,352 (100.0%) |
Monthly Housing Cost Tiers in Cannon County
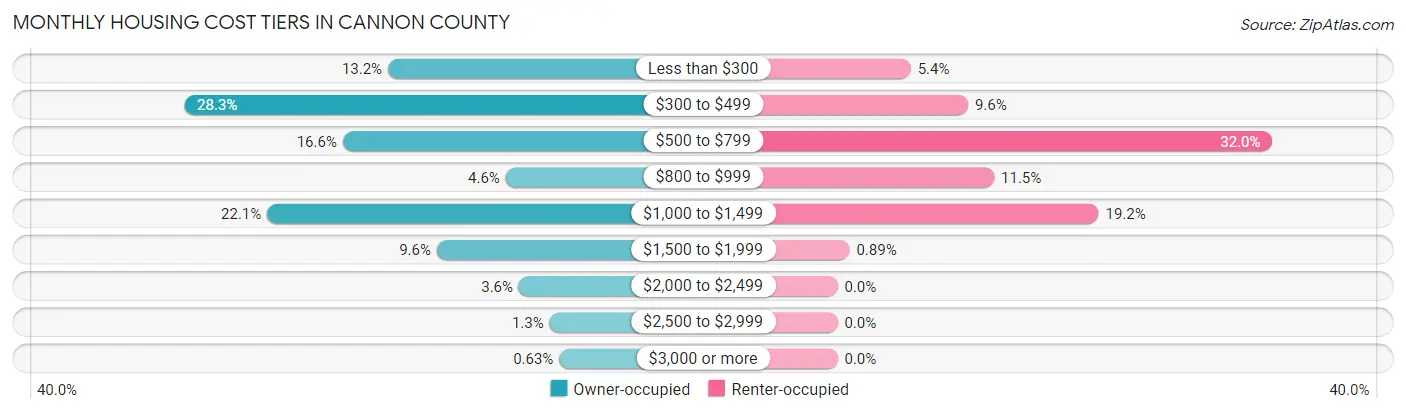
| Monthly Cost | Owner-occupied | Renter-occupied |
| Less than $300 | 585 (13.2%) | 73 (5.4%) |
| $300 to $499 | 1,248 (28.2%) | 130 (9.6%) |
| $500 to $799 | 732 (16.6%) | 433 (32.0%) |
| $800 to $999 | 202 (4.6%) | 156 (11.5%) |
| $1,000 to $1,499 | 978 (22.1%) | 260 (19.2%) |
| $1,500 to $1,999 | 426 (9.6%) | 12 (0.9%) |
| $2,000 to $2,499 | 159 (3.6%) | 0 (0.0%) |
| $2,500 to $2,999 | 59 (1.3%) | 0 (0.0%) |
| $3,000 or more | 28 (0.6%) | 0 (0.0%) |
| Total | 4,417 (100.0%) | 1,352 (100.0%) |
Physical Housing Characteristics in Cannon County
Housing Structures in Cannon County
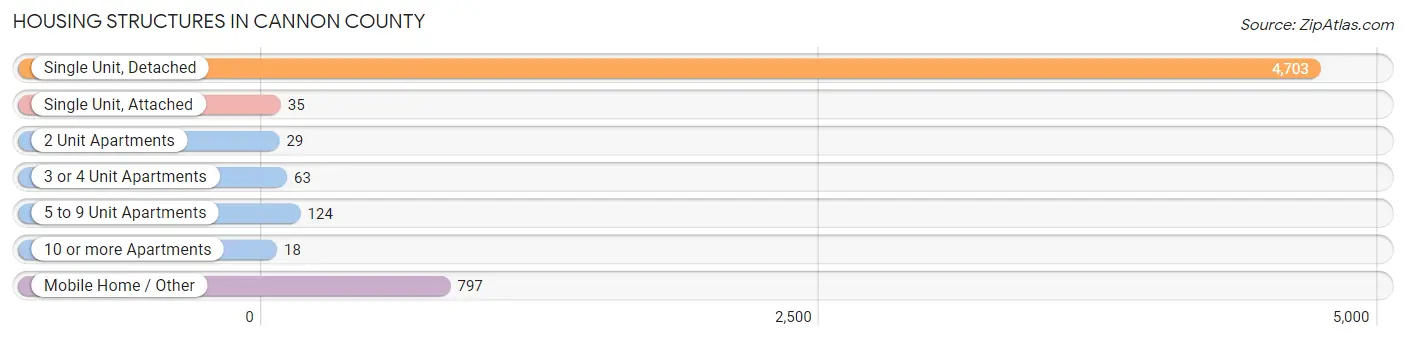
| Structure Type | # Housing Units | % Housing Units |
| Single Unit, Detached | 4,703 | 81.5% |
| Single Unit, Attached | 35 | 0.6% |
| 2 Unit Apartments | 29 | 0.5% |
| 3 or 4 Unit Apartments | 63 | 1.1% |
| 5 to 9 Unit Apartments | 124 | 2.1% |
| 10 or more Apartments | 18 | 0.3% |
| Mobile Home / Other | 797 | 13.8% |
| Total | 5,769 | 100.0% |
Housing Structures by Occupancy in Cannon County
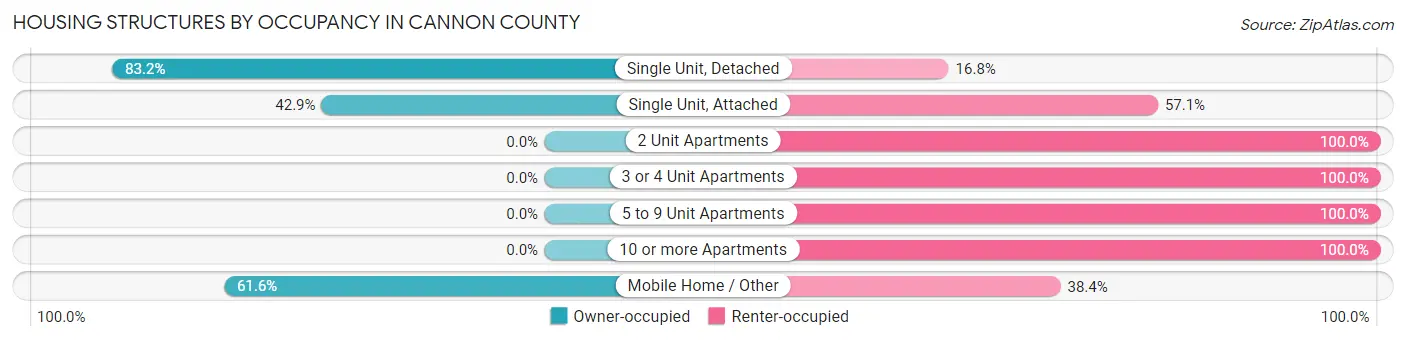
| Structure Type | Owner-occupied | Renter-occupied |
| Single Unit, Detached | 3,911 (83.2%) | 792 (16.8%) |
| Single Unit, Attached | 15 (42.9%) | 20 (57.1%) |
| 2 Unit Apartments | 0 (0.0%) | 29 (100.0%) |
| 3 or 4 Unit Apartments | 0 (0.0%) | 63 (100.0%) |
| 5 to 9 Unit Apartments | 0 (0.0%) | 124 (100.0%) |
| 10 or more Apartments | 0 (0.0%) | 18 (100.0%) |
| Mobile Home / Other | 491 (61.6%) | 306 (38.4%) |
| Total | 4,417 (76.6%) | 1,352 (23.4%) |
Housing Structures by Number of Rooms in Cannon County
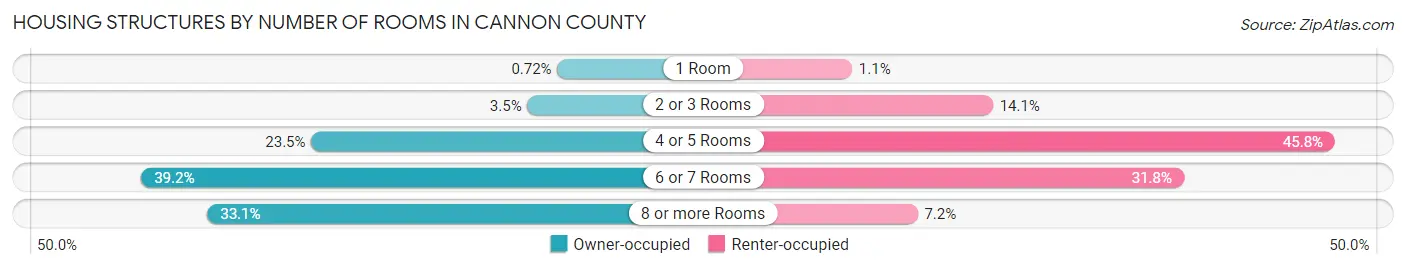
| Number of Rooms | Owner-occupied | Renter-occupied |
| 1 Room | 32 (0.7%) | 15 (1.1%) |
| 2 or 3 Rooms | 154 (3.5%) | 191 (14.1%) |
| 4 or 5 Rooms | 1,037 (23.5%) | 619 (45.8%) |
| 6 or 7 Rooms | 1,732 (39.2%) | 430 (31.8%) |
| 8 or more Rooms | 1,462 (33.1%) | 97 (7.2%) |
| Total | 4,417 (100.0%) | 1,352 (100.0%) |
Housing Structure by Heating Type in Cannon County
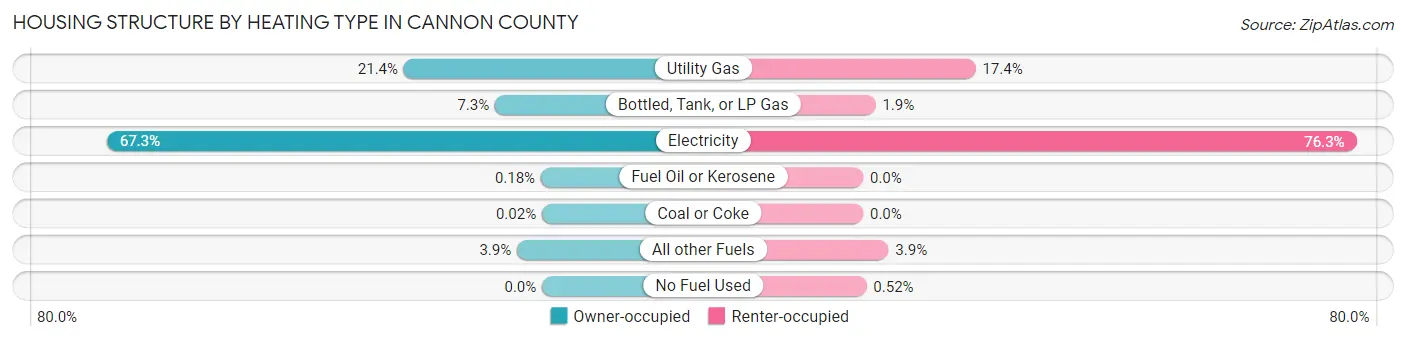
| Heating Type | Owner-occupied | Renter-occupied |
| Utility Gas | 944 (21.4%) | 235 (17.4%) |
| Bottled, Tank, or LP Gas | 321 (7.3%) | 26 (1.9%) |
| Electricity | 2,972 (67.3%) | 1,031 (76.3%) |
| Fuel Oil or Kerosene | 8 (0.2%) | 0 (0.0%) |
| Coal or Coke | 1 (0.0%) | 0 (0.0%) |
| All other Fuels | 171 (3.9%) | 53 (3.9%) |
| No Fuel Used | 0 (0.0%) | 7 (0.5%) |
| Total | 4,417 (100.0%) | 1,352 (100.0%) |
Household Vehicle Usage in Cannon County
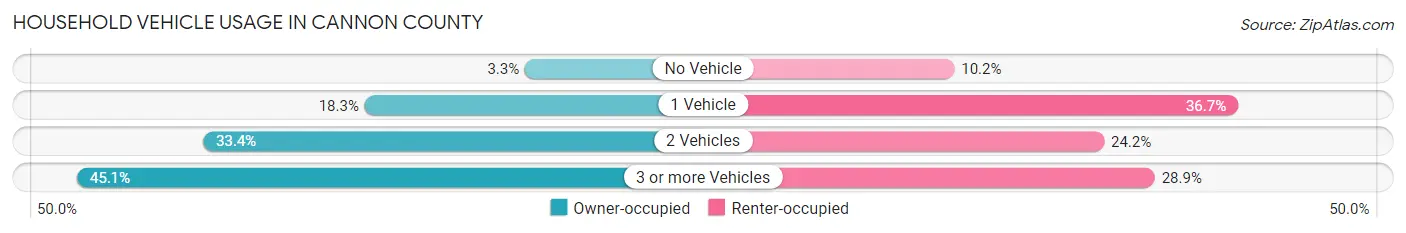
| Vehicles per Household | Owner-occupied | Renter-occupied |
| No Vehicle | 145 (3.3%) | 138 (10.2%) |
| 1 Vehicle | 806 (18.2%) | 496 (36.7%) |
| 2 Vehicles | 1,473 (33.4%) | 327 (24.2%) |
| 3 or more Vehicles | 1,993 (45.1%) | 391 (28.9%) |
| Total | 4,417 (100.0%) | 1,352 (100.0%) |
Real Estate & Mortgages in Cannon County
Real Estate and Mortgage Overview in Cannon County
| Characteristic | Without Mortgage | With Mortgage |
| Housing Units | 2,466 | 1,951 |
| Median Property Value | $154,900 | $249,900 |
| Median Household Income | $51,375 | $193 |
| Monthly Housing Costs | $394 | $24 |
| Real Estate Taxes | $1,080 | $37 |
Property Value by Mortgage Status in Cannon County
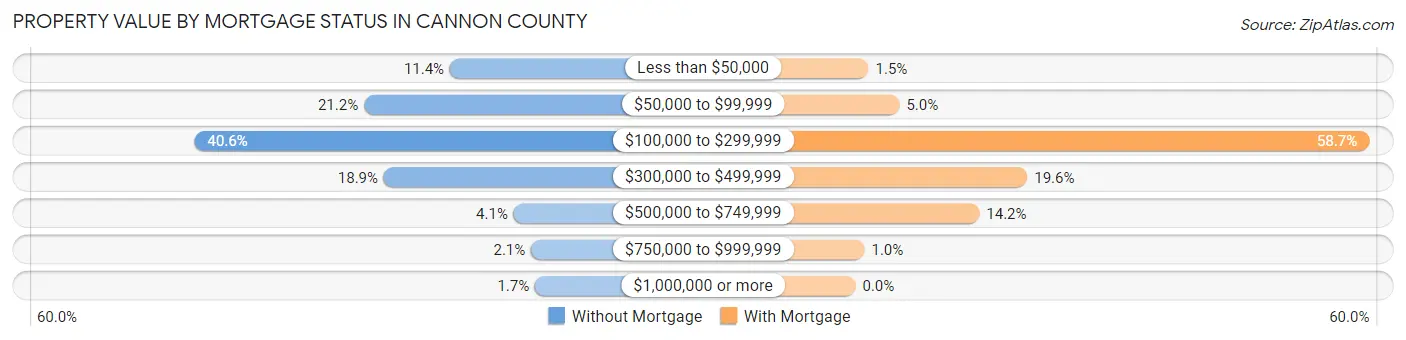
| Property Value | Without Mortgage | With Mortgage |
| Less than $50,000 | 281 (11.4%) | 29 (1.5%) |
| $50,000 to $99,999 | 523 (21.2%) | 98 (5.0%) |
| $100,000 to $299,999 | 1,001 (40.6%) | 1,145 (58.7%) |
| $300,000 to $499,999 | 467 (18.9%) | 383 (19.6%) |
| $500,000 to $749,999 | 101 (4.1%) | 276 (14.1%) |
| $750,000 to $999,999 | 52 (2.1%) | 20 (1.0%) |
| $1,000,000 or more | 41 (1.7%) | 0 (0.0%) |
| Total | 2,466 (100.0%) | 1,951 (100.0%) |
Household Income by Mortgage Status in Cannon County
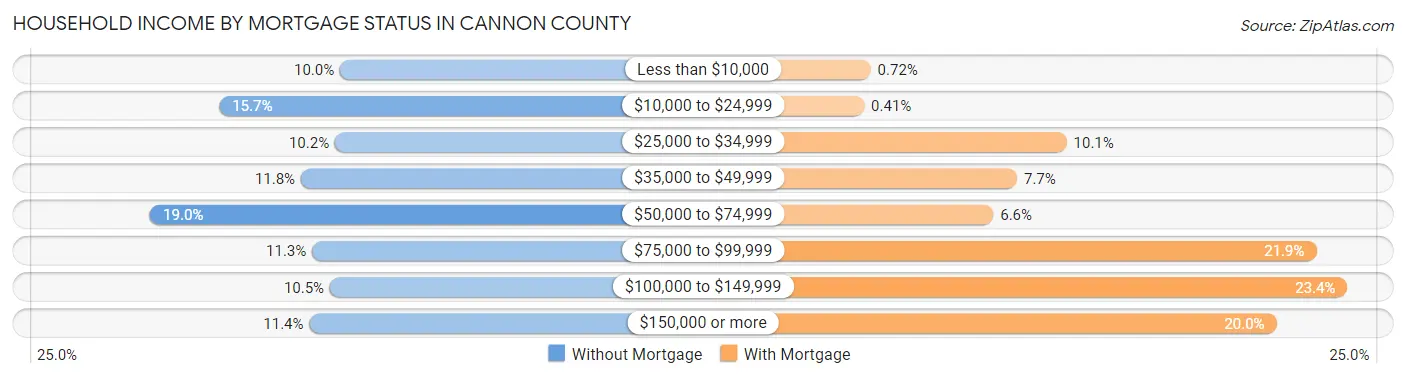
| Household Income | Without Mortgage | With Mortgage |
| Less than $10,000 | 246 (10.0%) | 14 (0.7%) |
| $10,000 to $24,999 | 388 (15.7%) | 8 (0.4%) |
| $25,000 to $34,999 | 252 (10.2%) | 196 (10.1%) |
| $35,000 to $49,999 | 292 (11.8%) | 150 (7.7%) |
| $50,000 to $74,999 | 469 (19.0%) | 128 (6.6%) |
| $75,000 to $99,999 | 279 (11.3%) | 428 (21.9%) |
| $100,000 to $149,999 | 258 (10.5%) | 457 (23.4%) |
| $150,000 or more | 282 (11.4%) | 391 (20.0%) |
| Total | 2,466 (100.0%) | 1,951 (100.0%) |
Property Value to Household Income Ratio in Cannon County
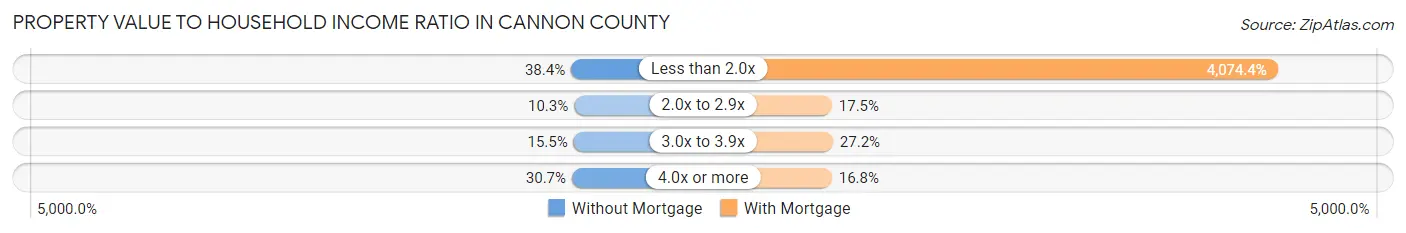
| Value-to-Income Ratio | Without Mortgage | With Mortgage |
| Less than 2.0x | 947 (38.4%) | 79,492 (4,074.4%) |
| 2.0x to 2.9x | 254 (10.3%) | 342 (17.5%) |
| 3.0x to 3.9x | 383 (15.5%) | 531 (27.2%) |
| 4.0x or more | 758 (30.7%) | 328 (16.8%) |
| Total | 2,466 (100.0%) | 1,951 (100.0%) |
Real Estate Taxes by Mortgage Status in Cannon County
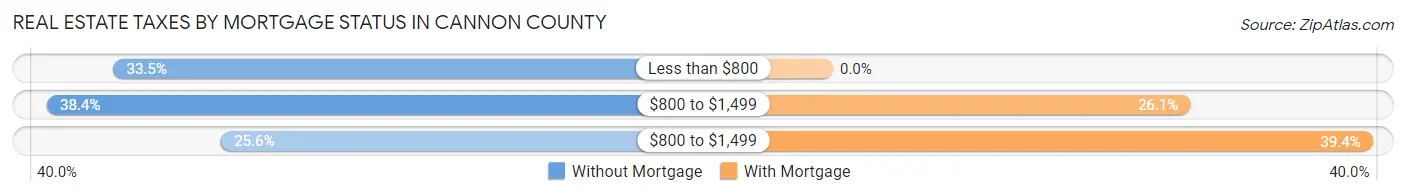
| Property Taxes | Without Mortgage | With Mortgage |
| Less than $800 | 826 (33.5%) | 0 (0.0%) |
| $800 to $1,499 | 946 (38.4%) | 509 (26.1%) |
| $800 to $1,499 | 632 (25.6%) | 769 (39.4%) |
| Total | 2,466 (100.0%) | 1,951 (100.0%) |
Health & Disability in Cannon County
Health Insurance Coverage by Age in Cannon County
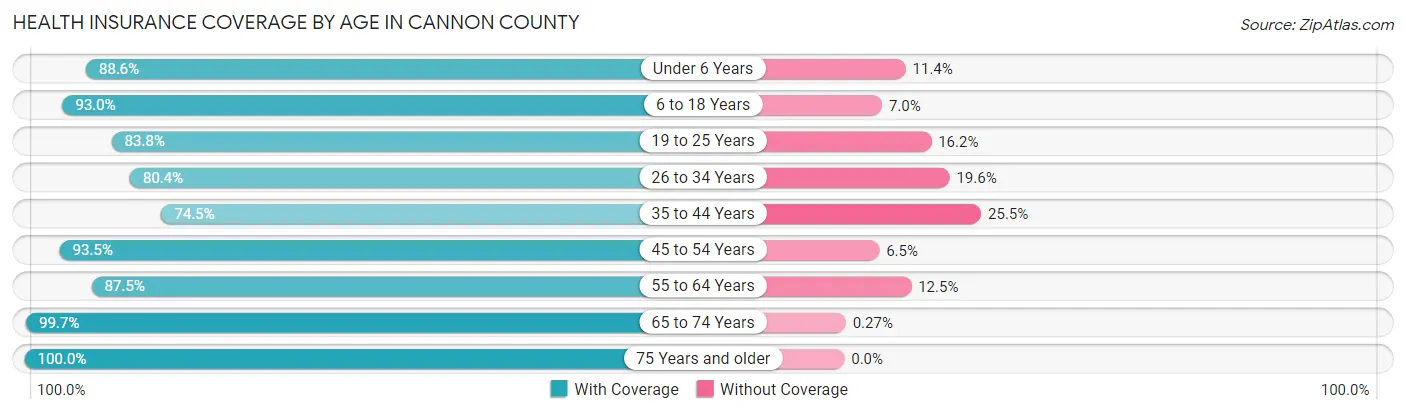
| Age Bracket | With Coverage | Without Coverage |
| Under 6 Years | 814 (88.6%) | 105 (11.4%) |
| 6 to 18 Years | 2,127 (93.0%) | 161 (7.0%) |
| 19 to 25 Years | 879 (83.8%) | 170 (16.2%) |
| 26 to 34 Years | 1,479 (80.4%) | 361 (19.6%) |
| 35 to 44 Years | 1,270 (74.5%) | 435 (25.5%) |
| 45 to 54 Years | 1,853 (93.5%) | 129 (6.5%) |
| 55 to 64 Years | 1,866 (87.5%) | 266 (12.5%) |
| 65 to 74 Years | 1,479 (99.7%) | 4 (0.3%) |
| 75 Years and older | 952 (100.0%) | 0 (0.0%) |
| Total | 12,719 (88.6%) | 1,631 (11.4%) |
Health Insurance Coverage by Citizenship Status in Cannon County
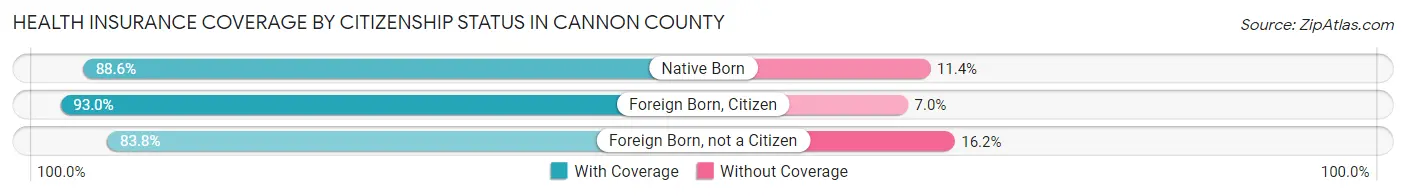
| Citizenship Status | With Coverage | Without Coverage |
| Native Born | 814 (88.6%) | 105 (11.4%) |
| Foreign Born, Citizen | 2,127 (93.0%) | 161 (7.0%) |
| Foreign Born, not a Citizen | 879 (83.8%) | 170 (16.2%) |
Health Insurance Coverage by Household Income in Cannon County
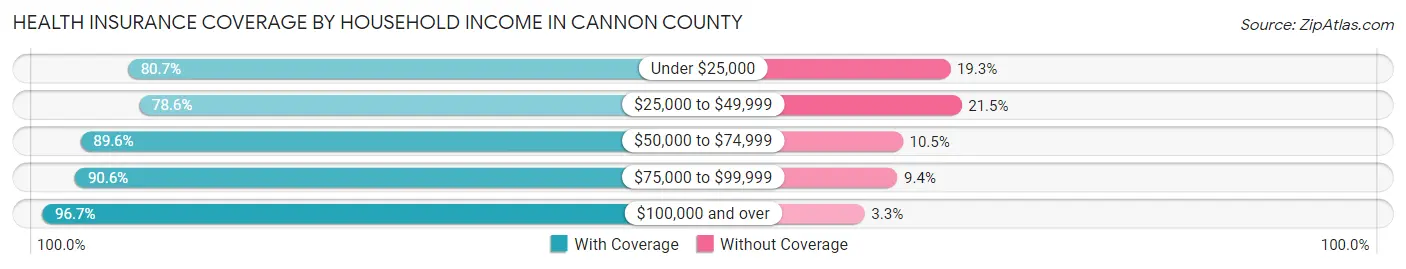
| Household Income | With Coverage | Without Coverage |
| Under $25,000 | 1,770 (80.7%) | 424 (19.3%) |
| $25,000 to $49,999 | 1,908 (78.5%) | 521 (21.4%) |
| $50,000 to $74,999 | 2,391 (89.5%) | 279 (10.4%) |
| $75,000 to $99,999 | 2,581 (90.6%) | 269 (9.4%) |
| $100,000 and over | 4,048 (96.7%) | 138 (3.3%) |
Public vs Private Health Insurance Coverage by Age in Cannon County
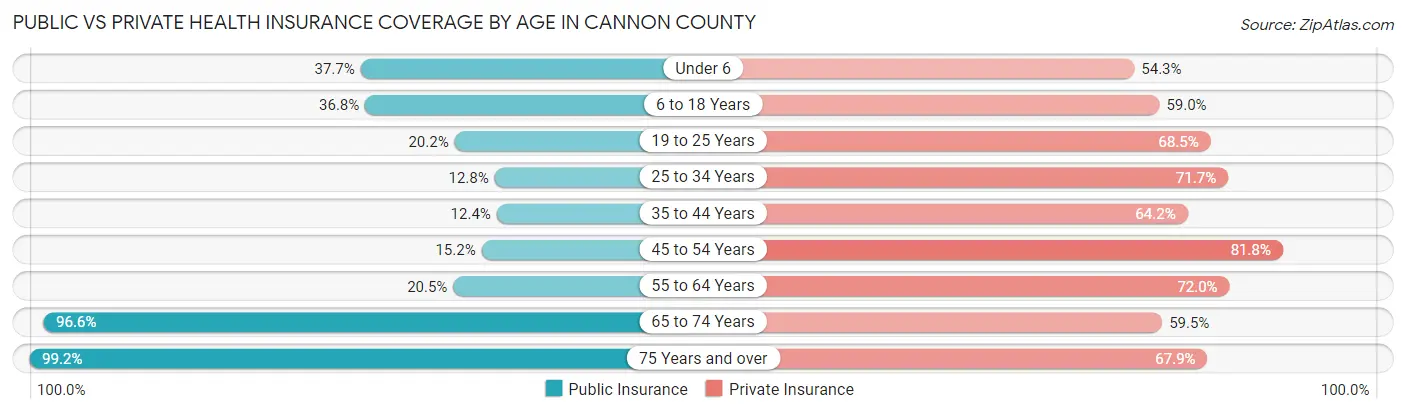
| Age Bracket | Public Insurance | Private Insurance |
| Under 6 | 346 (37.7%) | 499 (54.3%) |
| 6 to 18 Years | 842 (36.8%) | 1,349 (59.0%) |
| 19 to 25 Years | 212 (20.2%) | 718 (68.4%) |
| 25 to 34 Years | 235 (12.8%) | 1,319 (71.7%) |
| 35 to 44 Years | 211 (12.4%) | 1,094 (64.2%) |
| 45 to 54 Years | 301 (15.2%) | 1,622 (81.8%) |
| 55 to 64 Years | 436 (20.4%) | 1,534 (72.0%) |
| 65 to 74 Years | 1,432 (96.6%) | 882 (59.5%) |
| 75 Years and over | 944 (99.2%) | 646 (67.9%) |
| Total | 4,959 (34.6%) | 9,663 (67.3%) |
Disability Status by Sex by Age in Cannon County
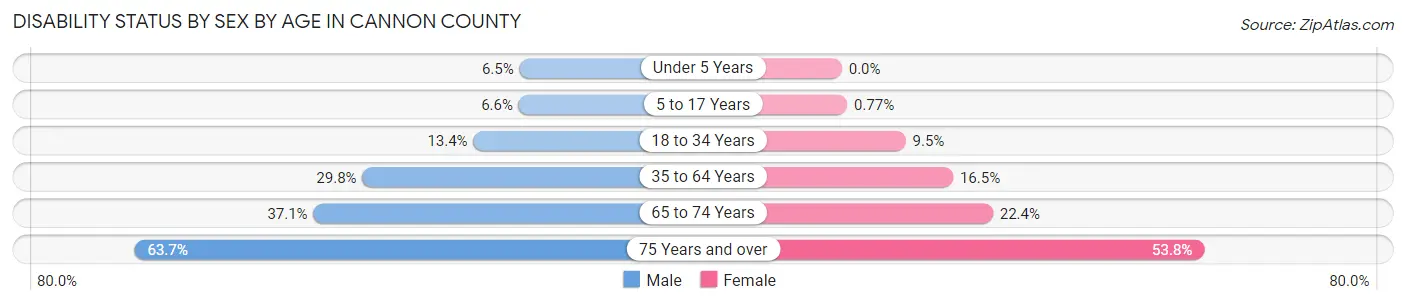
| Age Bracket | Male | Female |
| Under 5 Years | 28 (6.5%) | 0 (0.0%) |
| 5 to 17 Years | 82 (6.6%) | 8 (0.8%) |
| 18 to 34 Years | 196 (13.4%) | 145 (9.5%) |
| 35 to 64 Years | 894 (29.8%) | 466 (16.5%) |
| 65 to 74 Years | 259 (37.1%) | 176 (22.4%) |
| 75 Years and over | 263 (63.7%) | 290 (53.8%) |
Disability Class by Sex by Age in Cannon County
Disability Class: Hearing Difficulty
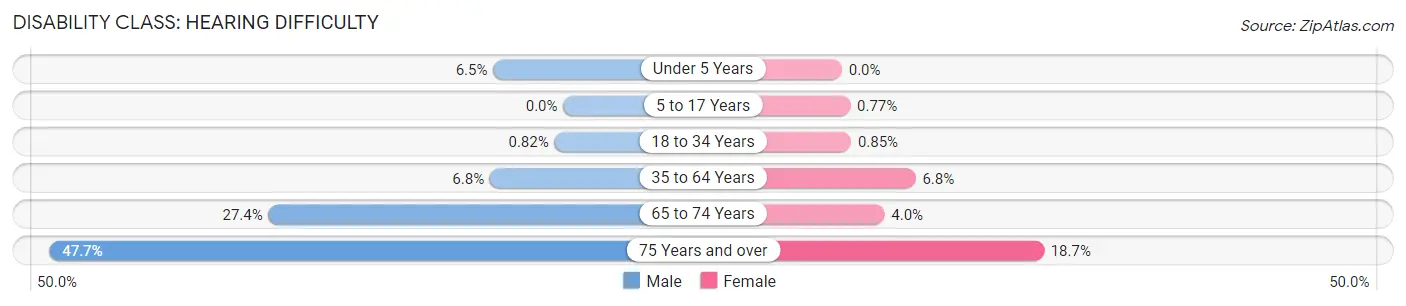
| Age Bracket | Male | Female |
| Under 5 Years | 28 (6.5%) | 0 (0.0%) |
| 5 to 17 Years | 0 (0.0%) | 8 (0.8%) |
| 18 to 34 Years | 12 (0.8%) | 13 (0.9%) |
| 35 to 64 Years | 204 (6.8%) | 193 (6.8%) |
| 65 to 74 Years | 191 (27.4%) | 31 (4.0%) |
| 75 Years and over | 197 (47.7%) | 101 (18.7%) |
Disability Class: Vision Difficulty
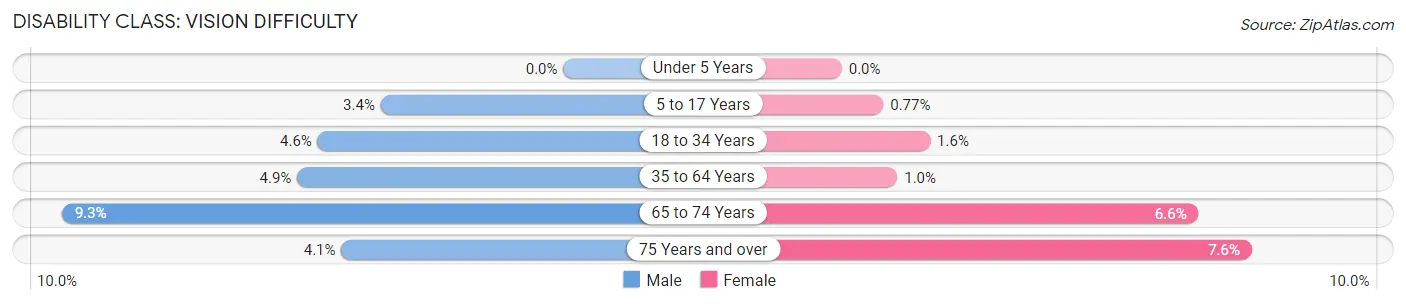
| Age Bracket | Male | Female |
| Under 5 Years | 0 (0.0%) | 0 (0.0%) |
| 5 to 17 Years | 42 (3.4%) | 8 (0.8%) |
| 18 to 34 Years | 67 (4.6%) | 25 (1.6%) |
| 35 to 64 Years | 148 (4.9%) | 29 (1.0%) |
| 65 to 74 Years | 65 (9.3%) | 52 (6.6%) |
| 75 Years and over | 17 (4.1%) | 41 (7.6%) |
Disability Class: Cognitive Difficulty
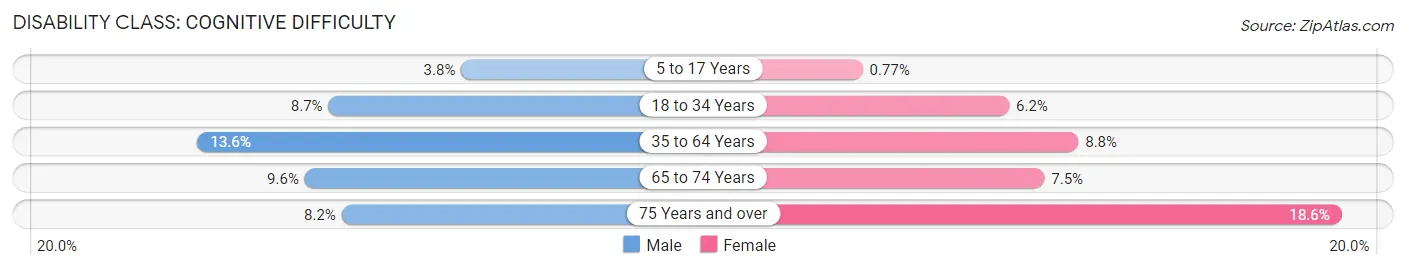
| Age Bracket | Male | Female |
| 5 to 17 Years | 47 (3.8%) | 8 (0.8%) |
| 18 to 34 Years | 128 (8.7%) | 95 (6.2%) |
| 35 to 64 Years | 407 (13.6%) | 248 (8.8%) |
| 65 to 74 Years | 67 (9.6%) | 59 (7.5%) |
| 75 Years and over | 34 (8.2%) | 100 (18.5%) |
Disability Class: Ambulatory Difficulty
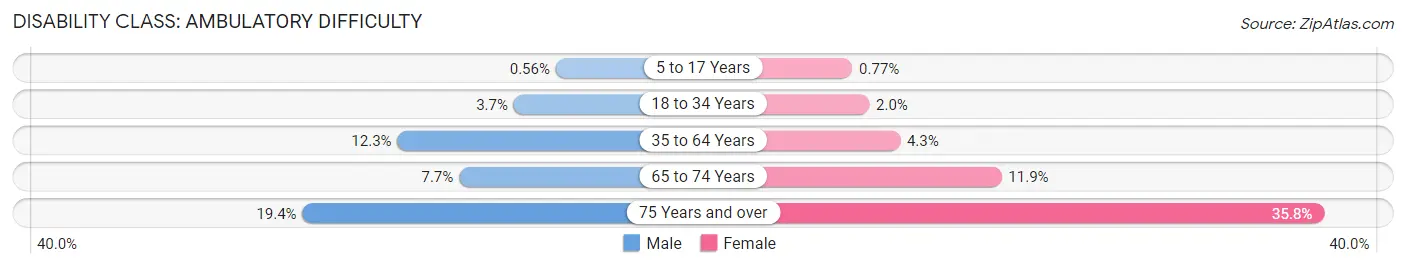
| Age Bracket | Male | Female |
| 5 to 17 Years | 7 (0.6%) | 8 (0.8%) |
| 18 to 34 Years | 54 (3.7%) | 31 (2.0%) |
| 35 to 64 Years | 369 (12.3%) | 122 (4.3%) |
| 65 to 74 Years | 54 (7.7%) | 93 (11.8%) |
| 75 Years and over | 80 (19.4%) | 193 (35.8%) |
Disability Class: Self-Care Difficulty
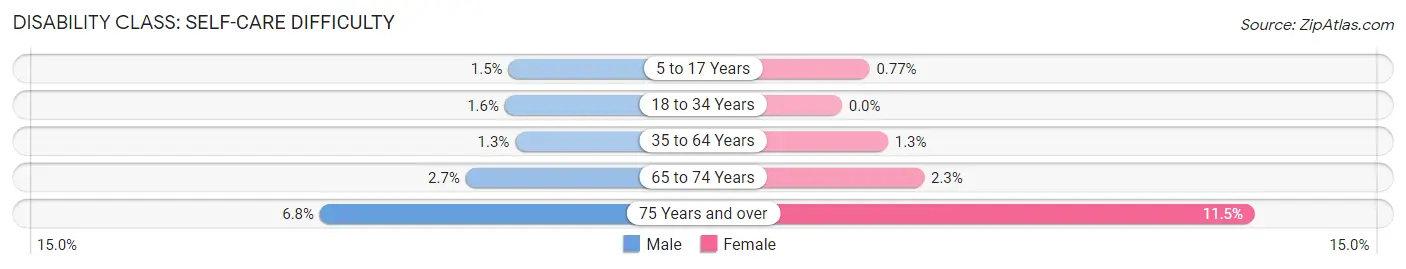
| Age Bracket | Male | Female |
| 5 to 17 Years | 19 (1.5%) | 8 (0.8%) |
| 18 to 34 Years | 24 (1.6%) | 0 (0.0%) |
| 35 to 64 Years | 40 (1.3%) | 36 (1.3%) |
| 65 to 74 Years | 19 (2.7%) | 18 (2.3%) |
| 75 Years and over | 28 (6.8%) | 62 (11.5%) |
Technology Access in Cannon County
Computing Device Access in Cannon County
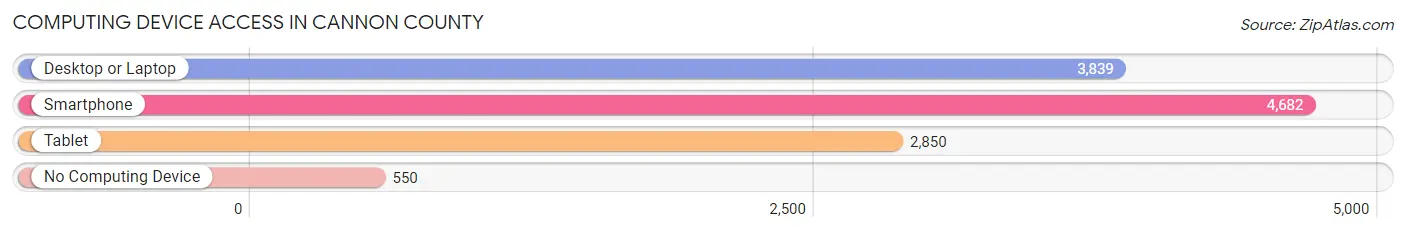
| Device Type | # Households | % Households |
| Desktop or Laptop | 3,839 | 66.5% |
| Smartphone | 4,682 | 81.2% |
| Tablet | 2,850 | 49.4% |
| No Computing Device | 550 | 9.5% |
| Total | 5,769 | 100.0% |
Internet Access in Cannon County
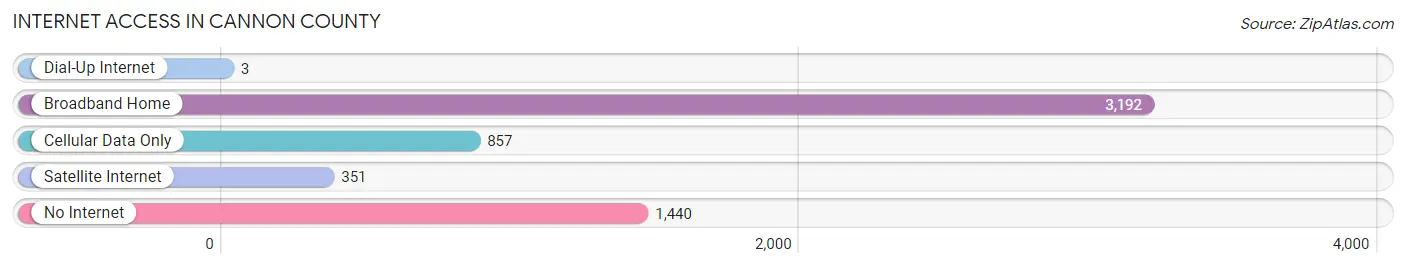
| Internet Type | # Households | % Households |
| Dial-Up Internet | 3 | 0.1% |
| Broadband Home | 3,192 | 55.3% |
| Cellular Data Only | 857 | 14.9% |
| Satellite Internet | 351 | 6.1% |
| No Internet | 1,440 | 25.0% |
| Total | 5,769 | 100.0% |
Cannon County Summary
Cannon County is a county located in the U.S. state of Tennessee. As of the 2010 census, the population was 13,801. Its county seat is Woodbury. The county was created in 1836 and named for Newton Cannon, a member of the state legislature and a relative of President James K. Polk.
Geography
Cannon County is located in the central part of Tennessee, and is bordered by Rutherford County to the north, Coffee County to the east, Warren County to the south, and DeKalb and Smith Counties to the west. The county covers an area of approximately 517 square miles, and is located in the Highland Rim region of the state. The terrain is mostly rolling hills, with the highest point being Short Mountain, which rises to an elevation of 1,890 feet. The county is drained by the Stones River, which flows through the center of the county.
Demographics
As of the 2010 census, there were 13,801 people, 5,541 households, and 3,845 families residing in the county. The population density was 27 people per square mile. The racial makeup of the county was 95.2% White, 2.3% Black or African American, 0.3% Native American, 0.2% Asian, 0.2% Pacific Islander, 0.7% from other races, and 1.2% from two or more races. 1.7% of the population were Hispanic or Latino of any race.
The median income for a household in the county was $37,845, and the median income for a family was $45,945. The per capita income for the county was $18,845. About 11.2% of families and 14.2% of the population were below the poverty line, including 18.2% of those under age 18 and 14.2% of those age 65 or over.
Economy
Cannon County is largely rural, and the economy is based on agriculture and manufacturing. The county is home to several large farms, and the main crops grown are corn, soybeans, and hay. The county is also home to several manufacturing companies, including a furniture factory, a plastics factory, and a metal fabrication plant.
The county is also home to several tourist attractions, including the Stones River National Battlefield, the Short Mountain Distillery, and the Arts Center of Cannon County. The county is also home to several wineries, and is a popular destination for outdoor recreation, including fishing, hunting, and camping.
Conclusion
Cannon County is a rural county located in the central part of Tennessee. The county is home to several large farms, and the main crops grown are corn, soybeans, and hay. The county is also home to several manufacturing companies, and is a popular destination for outdoor recreation. The county has a population of 13,801, and the median income for a household is $37,845.
Common Questions
What is the Total Population of Cannon County?
Total Population of Cannon County is 14,481.
What is the Total Male Population of Cannon County?
Total Male Population of Cannon County is 7,312.
What is the Total Female Population of Cannon County?
Total Female Population of Cannon County is 7,169.
What is the Ratio of Males per 100 Females in Cannon County?
There are 101.99 Males per 100 Females in Cannon County.
What is the Ratio of Females per 100 Males in Cannon County?
There are 98.04 Females per 100 Males in Cannon County.
What is the Median Population Age in Cannon County?
Median Population Age in Cannon County is 40.7 Years.
What is the Average Family Size in Cannon County
Average Family Size in Cannon County is 3.1 People.
What is the Average Household Size in Cannon County
Average Household Size in Cannon County is 2.5 People.
What is Per Capita Income in Cannon County?
Per Capita income in Cannon County is $30,234.
What is the Median Family Income in Cannon County?
Median Family Income in Cannon County is $71,000.
What is the Median Household income in Cannon County?
Median Household Income in Cannon County is $57,651.
What is Income or Wage Gap in Cannon County?
Income or Wage Gap in Cannon County is 32.7%.
Women in Cannon County earn 67.3 cents for every dollar earned by a man.
What is Family Income Deficit in Cannon County?
Family Income Deficit in Cannon County is $12,280.
Families that are below poverty line in Cannon County earn $12,280 less on average than the poverty threshold level.
What is Inequality or Gini Index in Cannon County?
Inequality or Gini Index in Cannon County is 0.45.
How Large is the Labor Force in Cannon County?
There are 6,666 People in the Labor Forcein in Cannon County.
What is the Percentage of People in the Labor Force in Cannon County?
56.5% of People are in the Labor Force in Cannon County.
What is the Unemployment Rate in Cannon County?
Unemployment Rate in Cannon County is 3.3%.