Bradley County, TN
Bradley County Map
Bradley County Overview
108,859
TOTAL POPULATION
53,175
MALE POPULATION
55,684
FEMALE POPULATION
95.49
MALES / 100 FEMALES
104.72
FEMALES / 100 MALES
39.9
MEDIAN AGE
3.1
AVG FAMILY SIZE
2.6
AVG HOUSEHOLD SIZE
$31,121
PER CAPITA INCOME
$75,270
AVG FAMILY INCOME
$60,692
AVG HOUSEHOLD INCOME
31.1%
WAGE / INCOME GAP [ % ]
68.9¢/ $1
WAGE / INCOME GAP [ $ ]
$9,642
FAMILY INCOME DEFICIT
0.45
INEQUALITY / GINI INDEX
54,016
LABOR FORCE [ PEOPLE ]
61.3%
PERCENT IN LABOR FORCE
5.4%
UNEMPLOYMENT RATE
Bradley County Area Codes
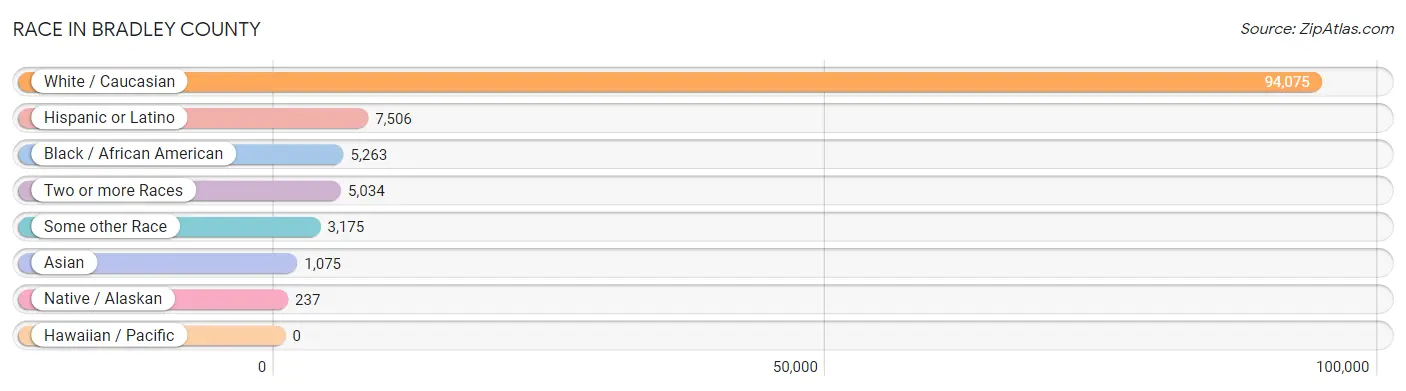
Race in Bradley County
The most populous races in Bradley County are White / Caucasian (94,075 | 86.4%), Hispanic or Latino (7,506 | 6.9%), and Black / African American (5,263 | 4.8%).
| Race | # Population | % Population |
| Asian | 1,075 | 1.0% |
| Black / African American | 5,263 | 4.8% |
| Hawaiian / Pacific | 0 | 0.0% |
| Hispanic or Latino | 7,506 | 6.9% |
| Native / Alaskan | 237 | 0.2% |
| White / Caucasian | 94,075 | 86.4% |
| Two or more Races | 5,034 | 4.6% |
| Some other Race | 3,175 | 2.9% |
| Total | 108,859 | 100.0% |
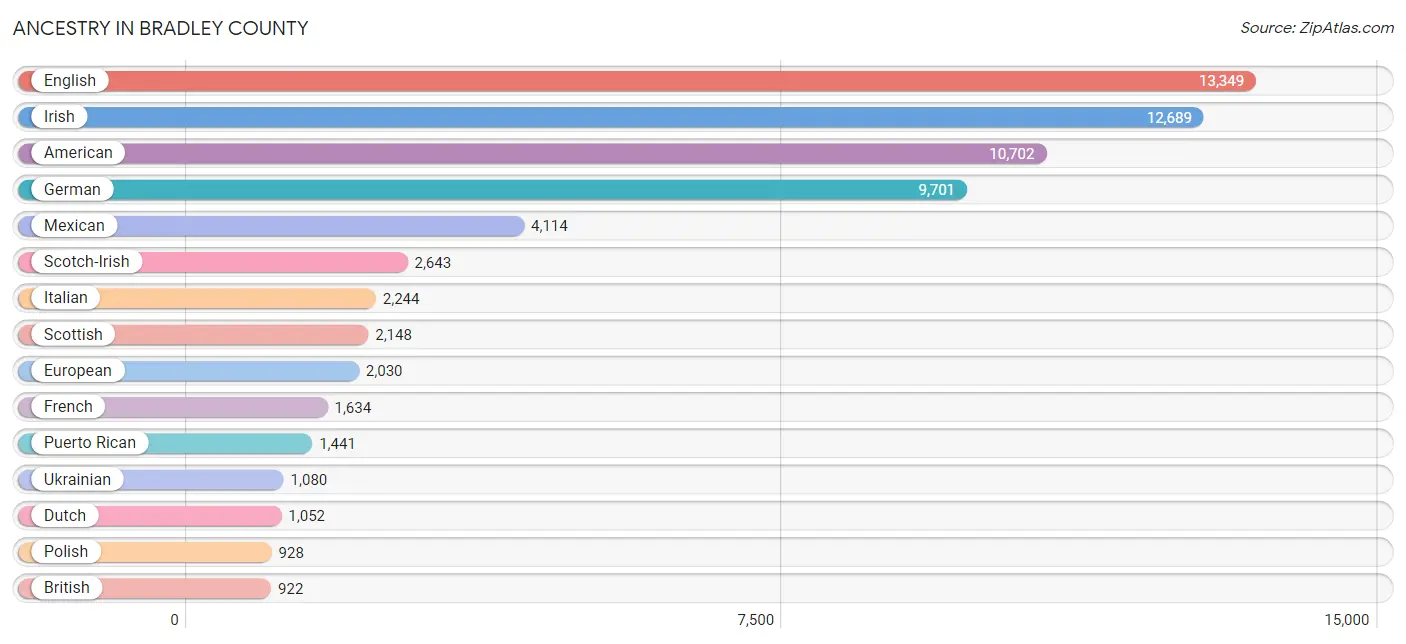
Ancestry in Bradley County
The most populous ancestries reported in Bradley County are English (13,349 | 12.3%), Irish (12,689 | 11.7%), American (10,702 | 9.8%), German (9,701 | 8.9%), and Mexican (4,114 | 3.8%), together accounting for 46.4% of all Bradley County residents.
| Ancestry | # Population | % Population |
| African | 367 | 0.3% |
| Alaska Native | 3 | 0.0% |
| Aleut | 66 | 0.1% |
| Alsatian | 24 | 0.0% |
| American | 10,702 | 9.8% |
| Arab | 116 | 0.1% |
| Argentinean | 9 | 0.0% |
| Assyrian / Chaldean / Syriac | 15 | 0.0% |
| Austrian | 18 | 0.0% |
| Bahamian | 4 | 0.0% |
| Belgian | 55 | 0.1% |
| Bhutanese | 47 | 0.0% |
| Blackfeet | 12 | 0.0% |
| Brazilian | 93 | 0.1% |
| British | 922 | 0.9% |
| British West Indian | 78 | 0.1% |
| Bulgarian | 39 | 0.0% |
| Burmese | 120 | 0.1% |
| Canadian | 71 | 0.1% |
| Central American | 484 | 0.4% |
| Central American Indian | 169 | 0.2% |
| Cherokee | 784 | 0.7% |
| Cheyenne | 2 | 0.0% |
| Chilean | 12 | 0.0% |
| Choctaw | 7 | 0.0% |
| Colombian | 85 | 0.1% |
| Costa Rican | 20 | 0.0% |
| Creek | 90 | 0.1% |
| Croatian | 29 | 0.0% |
| Crow | 29 | 0.0% |
| Cuban | 226 | 0.2% |
| Czech | 200 | 0.2% |
| Czechoslovakian | 65 | 0.1% |
| Danish | 244 | 0.2% |
| Dominican | 428 | 0.4% |
| Dutch | 1,052 | 1.0% |
| Dutch West Indian | 35 | 0.0% |
| Eastern European | 111 | 0.1% |
| Ecuadorian | 10 | 0.0% |
| Egyptian | 57 | 0.1% |
| English | 13,349 | 12.3% |
| European | 2,030 | 1.9% |
| Filipino | 40 | 0.0% |
| Finnish | 64 | 0.1% |
| French | 1,634 | 1.5% |
| French Canadian | 426 | 0.4% |
| German | 9,701 | 8.9% |
| Greek | 105 | 0.1% |
| Guatemalan | 208 | 0.2% |
| Haitian | 49 | 0.1% |
| Honduran | 160 | 0.2% |
| Hungarian | 120 | 0.1% |
| Indian (Asian) | 107 | 0.1% |
| Inupiat | 7 | 0.0% |
| Irish | 12,689 | 11.7% |
| Italian | 2,244 | 2.1% |
| Jamaican | 120 | 0.1% |
| Kenyan | 24 | 0.0% |
| Korean | 446 | 0.4% |
| Laotian | 6 | 0.0% |
| Lebanese | 15 | 0.0% |
| Liberian | 20 | 0.0% |
| Lithuanian | 65 | 0.1% |
| Lumbee | 36 | 0.0% |
| Luxembourger | 4 | 0.0% |
| Malaysian | 40 | 0.0% |
| Maltese | 12 | 0.0% |
| Mexican | 4,114 | 3.8% |
| Mexican American Indian | 174 | 0.2% |
| Native Hawaiian | 62 | 0.1% |
| Navajo | 17 | 0.0% |
| New Zealander | 26 | 0.0% |
| Nicaraguan | 26 | 0.0% |
| Nigerian | 351 | 0.3% |
| Northern European | 64 | 0.1% |
| Norwegian | 390 | 0.4% |
| Pakistani | 26 | 0.0% |
| Panamanian | 12 | 0.0% |
| Pennsylvania German | 47 | 0.0% |
| Peruvian | 21 | 0.0% |
| Polish | 928 | 0.9% |
| Portuguese | 549 | 0.5% |
| Puerto Rican | 1,441 | 1.3% |
| Romanian | 27 | 0.0% |
| Russian | 564 | 0.5% |
| Salvadoran | 58 | 0.1% |
| Samoan | 36 | 0.0% |
| Scandinavian | 330 | 0.3% |
| Scotch-Irish | 2,643 | 2.4% |
| Scottish | 2,148 | 2.0% |
| Shoshone | 6 | 0.0% |
| Slovak | 59 | 0.1% |
| Slovene | 7 | 0.0% |
| South African | 57 | 0.1% |
| South American | 417 | 0.4% |
| South American Indian | 8 | 0.0% |
| Spaniard | 129 | 0.1% |
| Spanish | 10 | 0.0% |
| Sri Lankan | 149 | 0.1% |
| Subsaharan African | 845 | 0.8% |
| Swedish | 825 | 0.8% |
| Swiss | 141 | 0.1% |
| Thai | 307 | 0.3% |
| Trinidadian and Tobagonian | 7 | 0.0% |
| U.S. Virgin Islander | 42 | 0.0% |
| Ukrainian | 1,080 | 1.0% |
| Venezuelan | 280 | 0.3% |
| Vietnamese | 24 | 0.0% |
| Welsh | 703 | 0.6% |
| West Indian | 75 | 0.1% | View All 110 Rows |
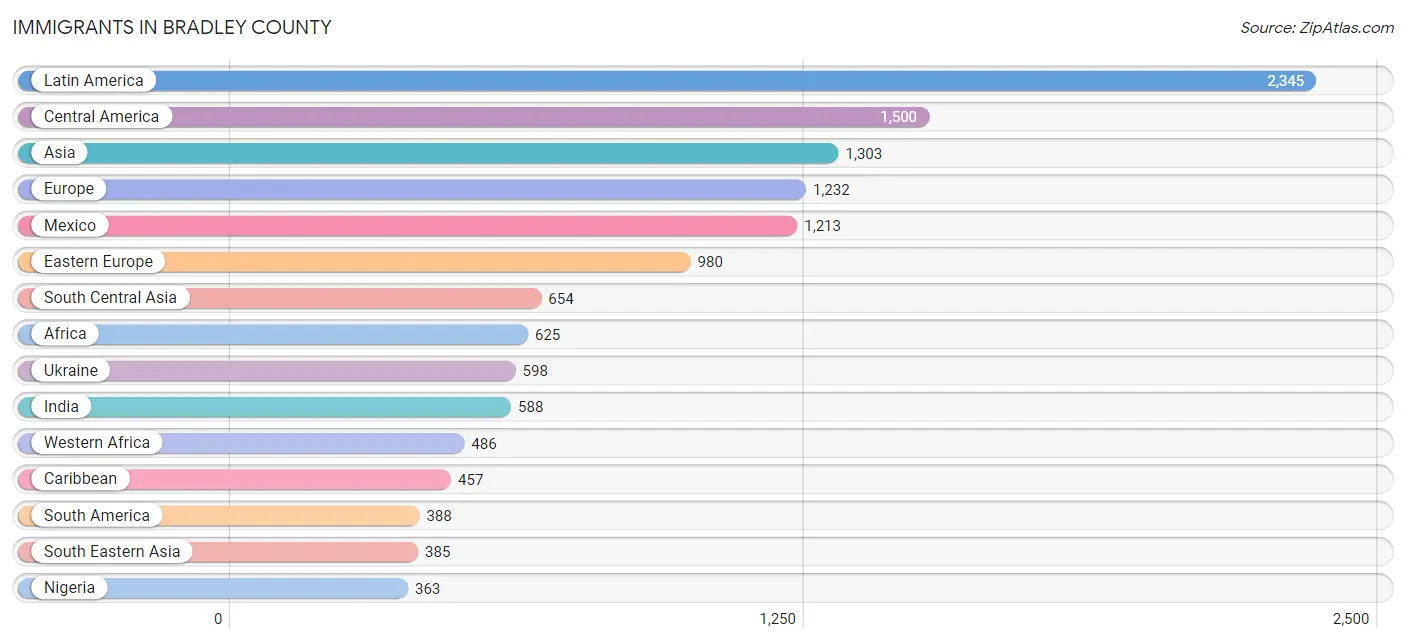
Immigrants in Bradley County
The most numerous immigrant groups reported in Bradley County came from Latin America (2,345 | 2.1%), Central America (1,500 | 1.4%), Asia (1,303 | 1.2%), Europe (1,232 | 1.1%), and Mexico (1,213 | 1.1%), together accounting for 7.0% of all Bradley County residents.
| Immigration Origin | # Population | % Population |
| Africa | 625 | 0.6% |
| Asia | 1,303 | 1.2% |
| Austria | 34 | 0.0% |
| Bahamas | 100 | 0.1% |
| Bangladesh | 14 | 0.0% |
| Brazil | 159 | 0.2% |
| Bulgaria | 47 | 0.0% |
| Canada | 255 | 0.2% |
| Caribbean | 457 | 0.4% |
| Central America | 1,500 | 1.4% |
| Chile | 24 | 0.0% |
| China | 101 | 0.1% |
| Colombia | 17 | 0.0% |
| Costa Rica | 20 | 0.0% |
| Cuba | 29 | 0.0% |
| Dominican Republic | 166 | 0.2% |
| Eastern Africa | 98 | 0.1% |
| Eastern Asia | 263 | 0.2% |
| Eastern Europe | 980 | 0.9% |
| Ecuador | 10 | 0.0% |
| Egypt | 28 | 0.0% |
| El Salvador | 13 | 0.0% |
| England | 38 | 0.0% |
| Europe | 1,232 | 1.1% |
| France | 16 | 0.0% |
| Germany | 38 | 0.0% |
| Guatemala | 156 | 0.1% |
| Haiti | 3 | 0.0% |
| Honduras | 98 | 0.1% |
| India | 588 | 0.5% |
| Ireland | 14 | 0.0% |
| Jamaica | 50 | 0.1% |
| Kenya | 24 | 0.0% |
| Korea | 162 | 0.2% |
| Laos | 40 | 0.0% |
| Latin America | 2,345 | 2.1% |
| Liberia | 72 | 0.1% |
| Mexico | 1,213 | 1.1% |
| Moldova | 134 | 0.1% |
| Nepal | 4 | 0.0% |
| Netherlands | 24 | 0.0% |
| Nigeria | 363 | 0.3% |
| Northern Africa | 41 | 0.0% |
| Northern Europe | 131 | 0.1% |
| Pakistan | 48 | 0.0% |
| Peru | 18 | 0.0% |
| Philippines | 236 | 0.2% |
| Romania | 49 | 0.1% |
| Russia | 152 | 0.1% |
| Scotland | 45 | 0.0% |
| South America | 388 | 0.4% |
| South Central Asia | 654 | 0.6% |
| South Eastern Asia | 385 | 0.4% |
| Southern Europe | 9 | 0.0% |
| Spain | 9 | 0.0% |
| Sudan | 13 | 0.0% |
| Sweden | 14 | 0.0% |
| Thailand | 11 | 0.0% |
| Trinidad and Tobago | 69 | 0.1% |
| Turkey | 1 | 0.0% |
| Ukraine | 598 | 0.5% |
| Venezuela | 160 | 0.2% |
| Vietnam | 98 | 0.1% |
| Western Africa | 486 | 0.4% |
| Western Asia | 1 | 0.0% |
| Western Europe | 112 | 0.1% |
| Zimbabwe | 74 | 0.1% | View All 67 Rows |
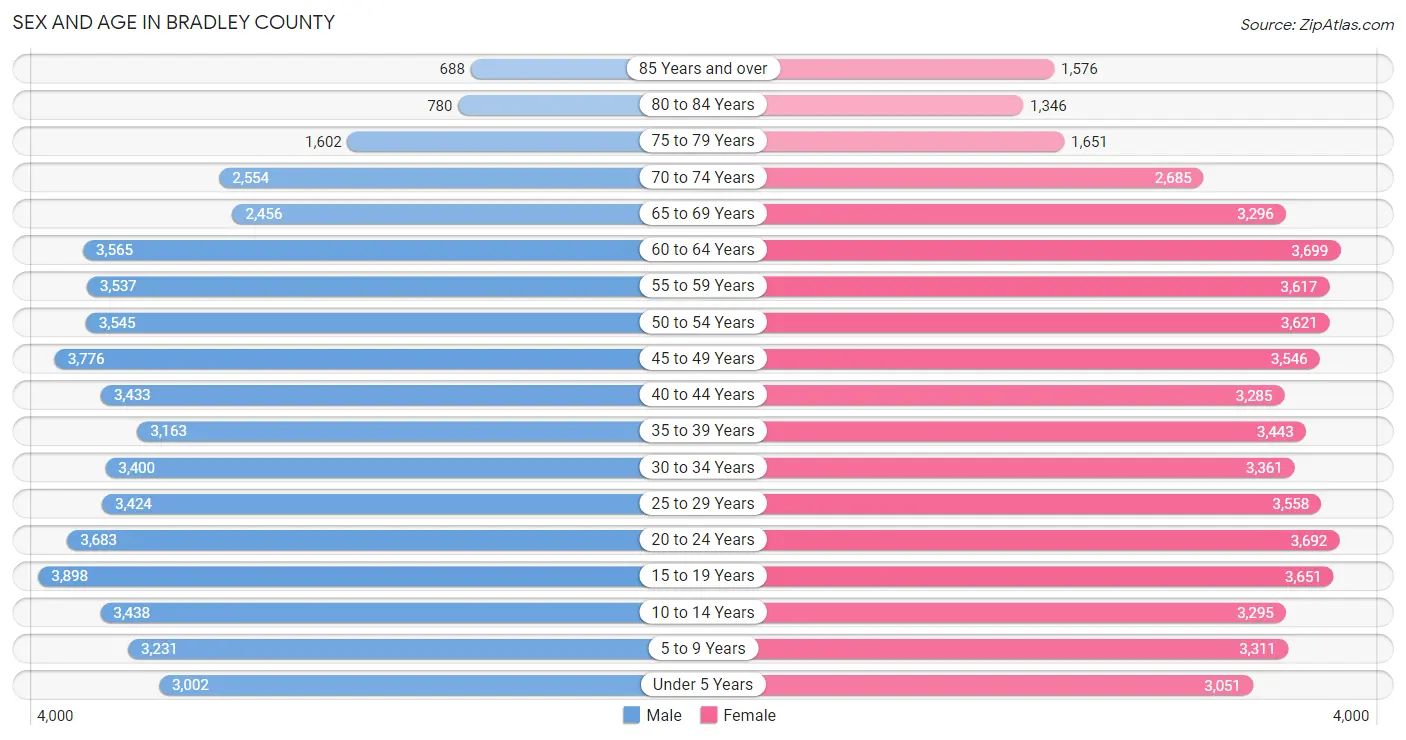
Sex and Age in Bradley County
Sex and Age in Bradley County
The most populous age groups in Bradley County are 15 to 19 Years (3,898 | 7.3%) for men and 60 to 64 Years (3,699 | 6.6%) for women.
| Age Bracket | Male | Female |
| Under 5 Years | 3,002 (5.7%) | 3,051 (5.5%) |
| 5 to 9 Years | 3,231 (6.1%) | 3,311 (5.9%) |
| 10 to 14 Years | 3,438 (6.5%) | 3,295 (5.9%) |
| 15 to 19 Years | 3,898 (7.3%) | 3,651 (6.6%) |
| 20 to 24 Years | 3,683 (6.9%) | 3,692 (6.6%) |
| 25 to 29 Years | 3,424 (6.4%) | 3,558 (6.4%) |
| 30 to 34 Years | 3,400 (6.4%) | 3,361 (6.0%) |
| 35 to 39 Years | 3,163 (5.9%) | 3,443 (6.2%) |
| 40 to 44 Years | 3,433 (6.5%) | 3,285 (5.9%) |
| 45 to 49 Years | 3,776 (7.1%) | 3,546 (6.4%) |
| 50 to 54 Years | 3,545 (6.7%) | 3,621 (6.5%) |
| 55 to 59 Years | 3,537 (6.7%) | 3,617 (6.5%) |
| 60 to 64 Years | 3,565 (6.7%) | 3,699 (6.6%) |
| 65 to 69 Years | 2,456 (4.6%) | 3,296 (5.9%) |
| 70 to 74 Years | 2,554 (4.8%) | 2,685 (4.8%) |
| 75 to 79 Years | 1,602 (3.0%) | 1,651 (3.0%) |
| 80 to 84 Years | 780 (1.5%) | 1,346 (2.4%) |
| 85 Years and over | 688 (1.3%) | 1,576 (2.8%) |
| Total | 53,175 (100.0%) | 55,684 (100.0%) |
Families and Households in Bradley County
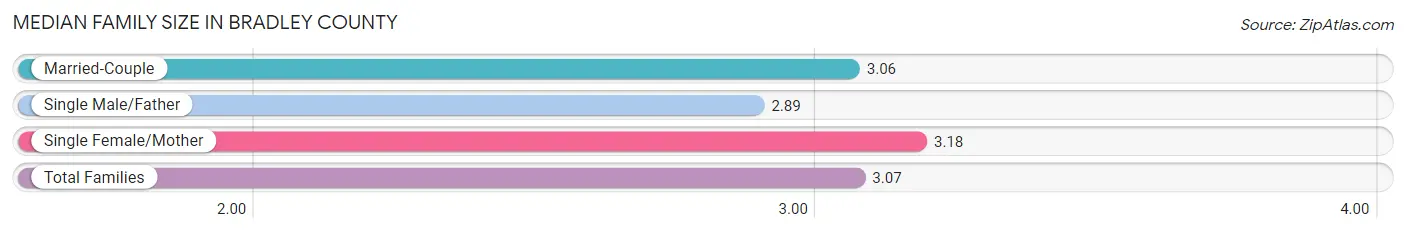
Median Family Size in Bradley County
The median family size in Bradley County is 3.07 persons per family, with single female/mother families (4,783 | 16.9%) accounting for the largest median family size of 3.18 persons per family. On the other hand, single male/father families (2,291 | 8.1%) represent the smallest median family size with 2.89 persons per family.
| Family Type | # Families | Family Size |
| Married-Couple | 21,220 (75.0%) | 3.06 |
| Single Male/Father | 2,291 (8.1%) | 2.89 |
| Single Female/Mother | 4,783 (16.9%) | 3.18 |
| Total Families | 28,294 (100.0%) | 3.07 |
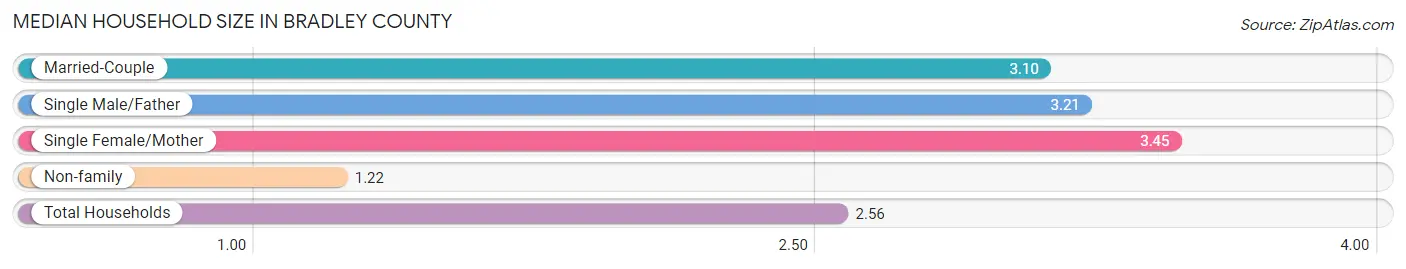
Median Household Size in Bradley County
The median household size in Bradley County is 2.56 persons per household, with single female/mother households (4,783 | 11.6%) accounting for the largest median household size of 3.45 persons per household. non-family households (13,046 | 31.6%) represent the smallest median household size with 1.22 persons per household.
| Household Type | # Households | Household Size |
| Married-Couple | 21,220 (51.3%) | 3.10 |
| Single Male/Father | 2,291 (5.5%) | 3.21 |
| Single Female/Mother | 4,783 (11.6%) | 3.45 |
| Non-family | 13,046 (31.6%) | 1.22 |
| Total Households | 41,340 (100.0%) | 2.56 |
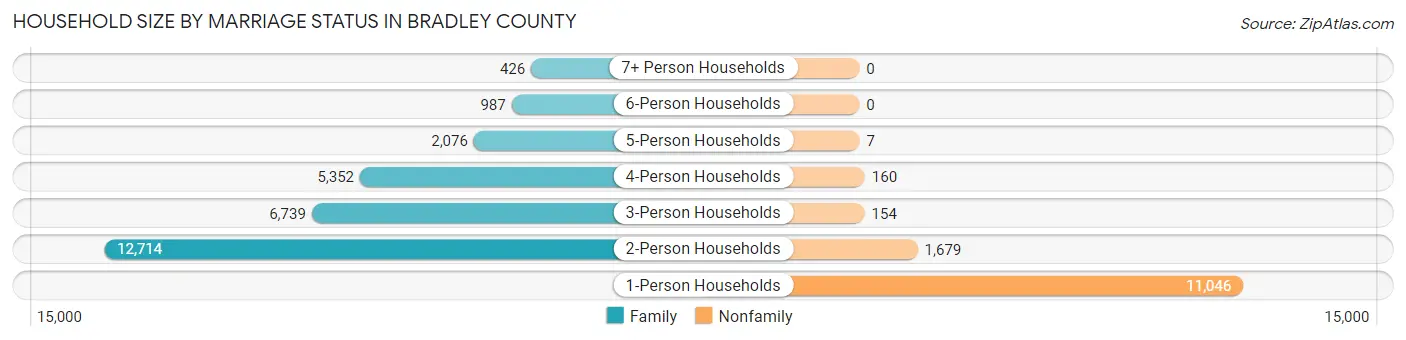
Household Size by Marriage Status in Bradley County
Out of a total of 41,340 households in Bradley County, 28,294 (68.4%) are family households, while 13,046 (31.6%) are nonfamily households. The most numerous type of family households are 2-person households, comprising 12,714, and the most common type of nonfamily households are 1-person households, comprising 11,046.
| Household Size | Family Households | Nonfamily Households |
| 1-Person Households | - | 11,046 (26.7%) |
| 2-Person Households | 12,714 (30.7%) | 1,679 (4.1%) |
| 3-Person Households | 6,739 (16.3%) | 154 (0.4%) |
| 4-Person Households | 5,352 (13.0%) | 160 (0.4%) |
| 5-Person Households | 2,076 (5.0%) | 7 (0.0%) |
| 6-Person Households | 987 (2.4%) | 0 (0.0%) |
| 7+ Person Households | 426 (1.0%) | 0 (0.0%) |
| Total | 28,294 (68.4%) | 13,046 (31.6%) |
Female Fertility in Bradley County
Fertility by Age in Bradley County
Average fertility rate in Bradley County is 55.0 births per 1,000 women. Women in the age bracket of 20 to 34 years have the highest fertility rate with 97.0 births per 1,000 women. Women in the age bracket of 20 to 34 years acount for 74.1% of all women with births.
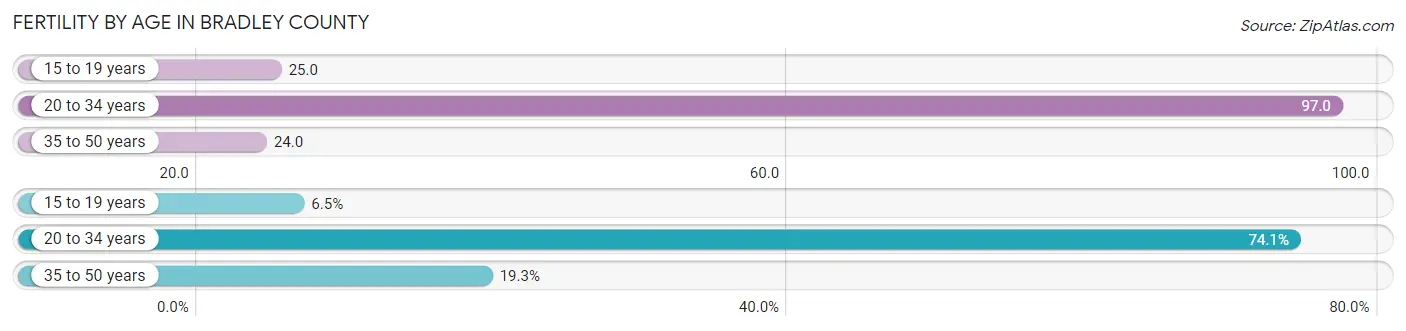
| Age Bracket | Women with Births | Births / 1,000 Women |
| 15 to 19 years | 91 (6.5%) | 25.0 |
| 20 to 34 years | 1,032 (74.1%) | 97.0 |
| 35 to 50 years | 269 (19.3%) | 24.0 |
| Total | 1,392 (100.0%) | 55.0 |
Fertility by Age by Marriage Status in Bradley County
60.8% of women with births (1,392) in Bradley County are married. The highest percentage of unmarried women with births falls into 15 to 19 years age bracket with 85.7% of them unmarried at the time of birth, while the lowest percentage of unmarried women with births belong to 20 to 34 years age bracket with 35.5% of them unmarried.
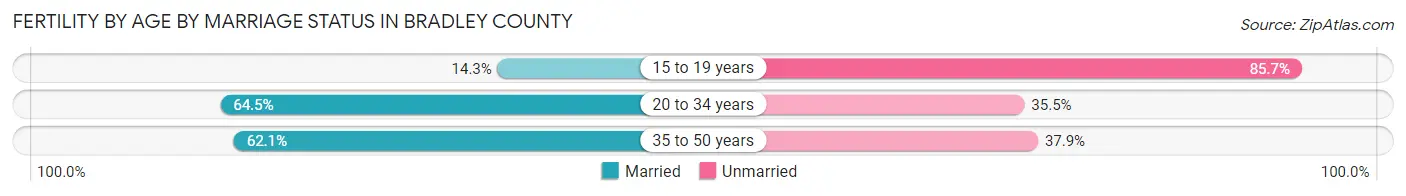
| Age Bracket | Married | Unmarried |
| 15 to 19 years | 13 (14.3%) | 78 (85.7%) |
| 20 to 34 years | 666 (64.5%) | 366 (35.5%) |
| 35 to 50 years | 167 (62.1%) | 102 (37.9%) |
| Total | 846 (60.8%) | 546 (39.2%) |
Fertility by Education in Bradley County
Average fertility rate in Bradley County is 55.0 births per 1,000 women. Women with the education attainment of graduate degree have the highest fertility rate of 68.0 births per 1,000 women, while women with the education attainment of less than high school have the lowest fertility at 40.0 births per 1,000 women. Women with the education attainment of college or associate's degree represent 37.2% of all women with births.
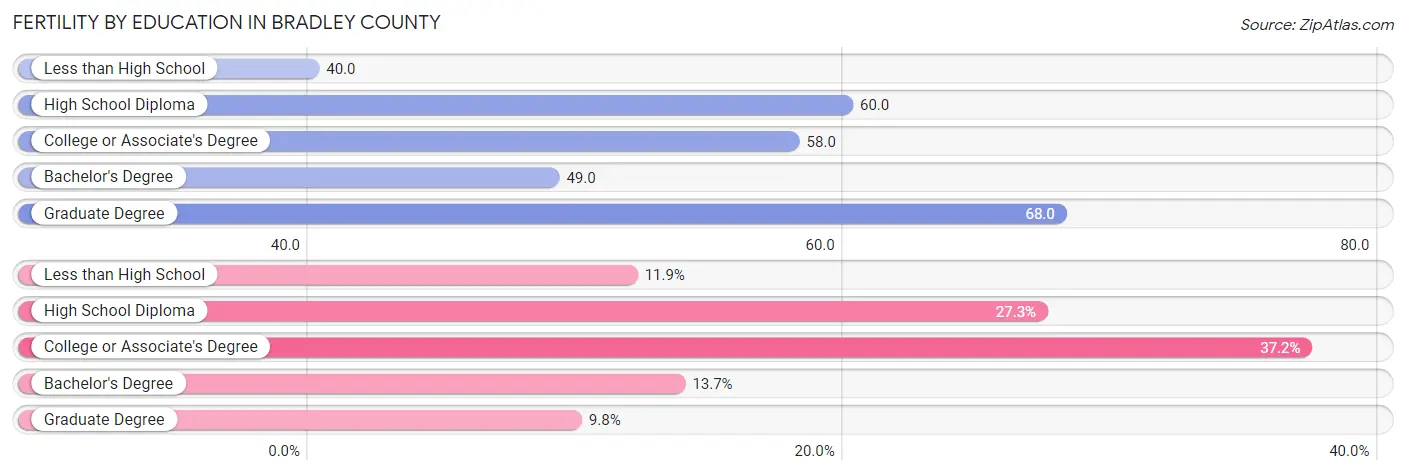
| Educational Attainment | Women with Births | Births / 1,000 Women |
| Less than High School | 166 (11.9%) | 40.0 |
| High School Diploma | 380 (27.3%) | 60.0 |
| College or Associate's Degree | 518 (37.2%) | 58.0 |
| Bachelor's Degree | 191 (13.7%) | 49.0 |
| Graduate Degree | 137 (9.8%) | 68.0 |
| Total | 1,392 (100.0%) | 55.0 |
Fertility by Education by Marriage Status in Bradley County
39.2% of women with births in Bradley County are unmarried. Women with the educational attainment of graduate degree are most likely to be married with 92.7% of them married at childbirth, while women with the educational attainment of high school diploma are least likely to be married with 56.6% of them unmarried at childbirth.
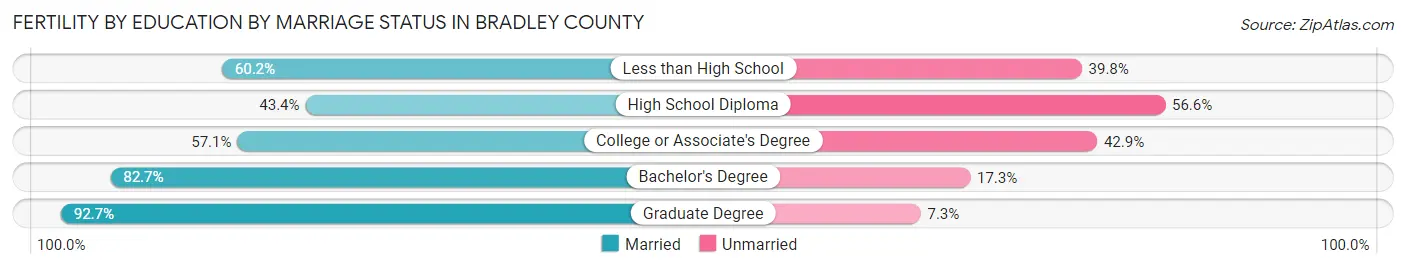
| Educational Attainment | Married | Unmarried |
| Less than High School | 100 (60.2%) | 66 (39.8%) |
| High School Diploma | 165 (43.4%) | 215 (56.6%) |
| College or Associate's Degree | 296 (57.1%) | 222 (42.9%) |
| Bachelor's Degree | 158 (82.7%) | 33 (17.3%) |
| Graduate Degree | 127 (92.7%) | 10 (7.3%) |
| Total | 846 (60.8%) | 546 (39.2%) |
Income in Bradley County
Income Overview in Bradley County
Per Capita Income in Bradley County is $31,121, while median incomes of families and households are $75,270 and $60,692 respectively.
| Characteristic | Number | Measure |
| Per Capita Income | 108,859 | $31,121 |
| Median Family Income | 28,294 | $75,270 |
| Mean Family Income | 28,294 | $91,084 |
| Median Household Income | 41,340 | $60,692 |
| Mean Household Income | 41,340 | $79,443 |
| Income Deficit | 28,294 | $9,642 |
| Wage / Income Gap (%) | 108,859 | 31.10% |
| Wage / Income Gap ($) | 108,859 | 68.90¢ per $1 |
| Gini / Inequality Index | 108,859 | 0.45 |
Earnings by Sex in Bradley County
Average Earnings in Bradley County are $35,404, $42,067 for men and $28,985 for women, a difference of 31.1%.
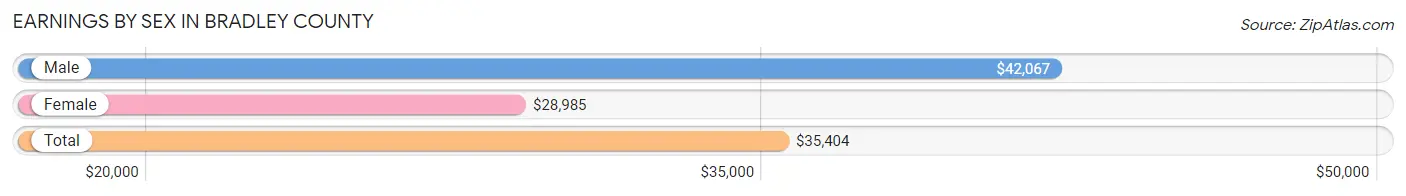
| Sex | Number | Average Earnings |
| Male | 29,271 (51.4%) | $42,067 |
| Female | 27,636 (48.6%) | $28,985 |
| Total | 56,907 (100.0%) | $35,404 |
Earnings by Sex by Income Bracket in Bradley County
The most common earnings brackets in Bradley County are $100,000+ for men (3,159 | 10.8%) and $35,000 to $39,999 for women (2,246 | 8.1%).
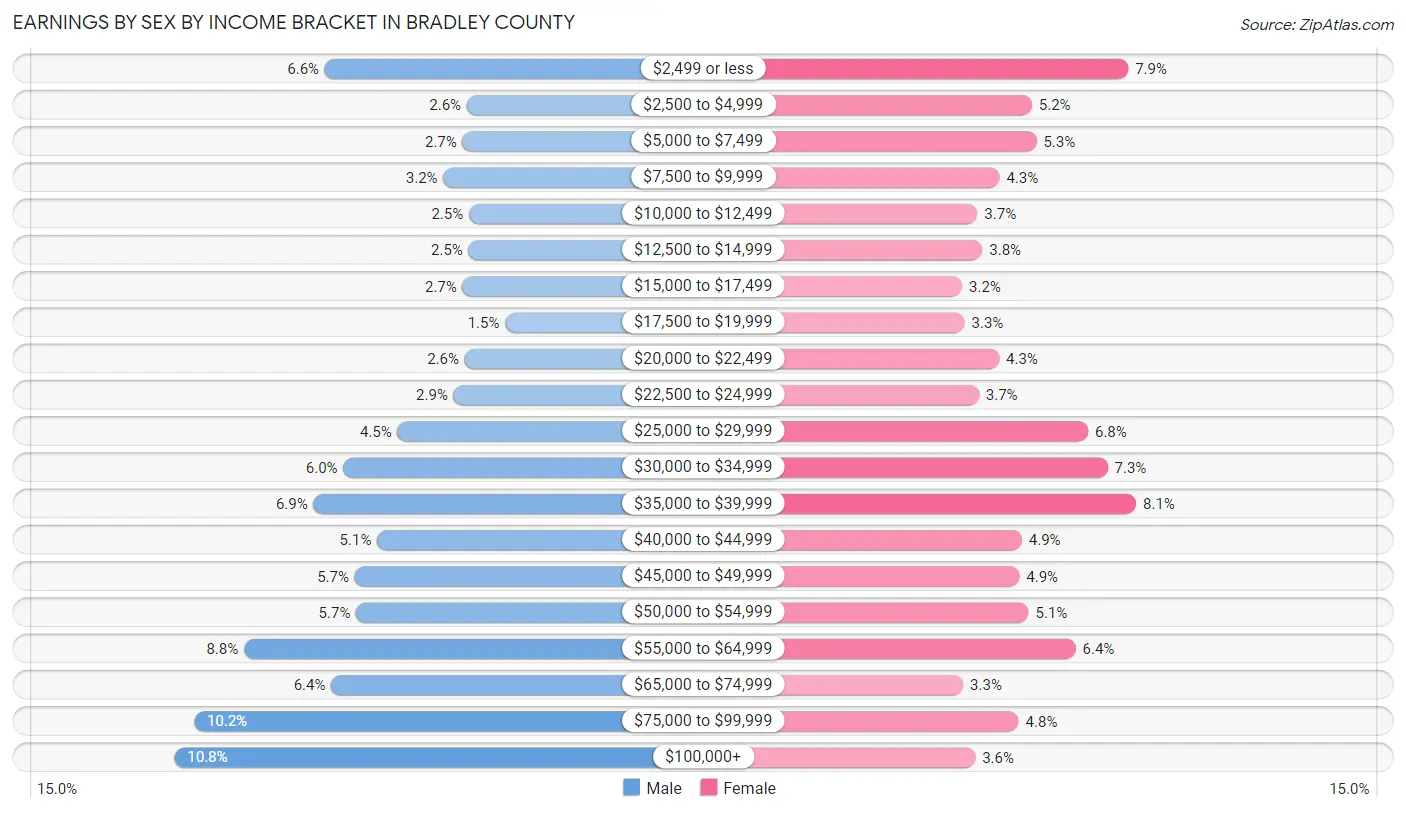
| Income | Male | Female |
| $2,499 or less | 1,921 (6.6%) | 2,186 (7.9%) |
| $2,500 to $4,999 | 751 (2.6%) | 1,438 (5.2%) |
| $5,000 to $7,499 | 786 (2.7%) | 1,474 (5.3%) |
| $7,500 to $9,999 | 945 (3.2%) | 1,185 (4.3%) |
| $10,000 to $12,499 | 735 (2.5%) | 1,013 (3.7%) |
| $12,500 to $14,999 | 738 (2.5%) | 1,052 (3.8%) |
| $15,000 to $17,499 | 788 (2.7%) | 896 (3.2%) |
| $17,500 to $19,999 | 435 (1.5%) | 914 (3.3%) |
| $20,000 to $22,499 | 771 (2.6%) | 1,184 (4.3%) |
| $22,500 to $24,999 | 861 (2.9%) | 1,025 (3.7%) |
| $25,000 to $29,999 | 1,323 (4.5%) | 1,873 (6.8%) |
| $30,000 to $34,999 | 1,767 (6.0%) | 2,025 (7.3%) |
| $35,000 to $39,999 | 2,015 (6.9%) | 2,246 (8.1%) |
| $40,000 to $44,999 | 1,491 (5.1%) | 1,359 (4.9%) |
| $45,000 to $49,999 | 1,674 (5.7%) | 1,340 (4.9%) |
| $50,000 to $54,999 | 1,662 (5.7%) | 1,411 (5.1%) |
| $55,000 to $64,999 | 2,586 (8.8%) | 1,778 (6.4%) |
| $65,000 to $74,999 | 1,867 (6.4%) | 905 (3.3%) |
| $75,000 to $99,999 | 2,996 (10.2%) | 1,335 (4.8%) |
| $100,000+ | 3,159 (10.8%) | 997 (3.6%) |
| Total | 29,271 (100.0%) | 27,636 (100.0%) |
Earnings by Sex by Educational Attainment in Bradley County
Average earnings in Bradley County are $49,056 for men and $34,536 for women, a difference of 29.6%. Men with an educational attainment of graduate degree enjoy the highest average annual earnings of $76,036, while those with less than high school education earn the least with $35,269. Women with an educational attainment of graduate degree earn the most with the average annual earnings of $58,710, while those with less than high school education have the smallest earnings of $22,958.
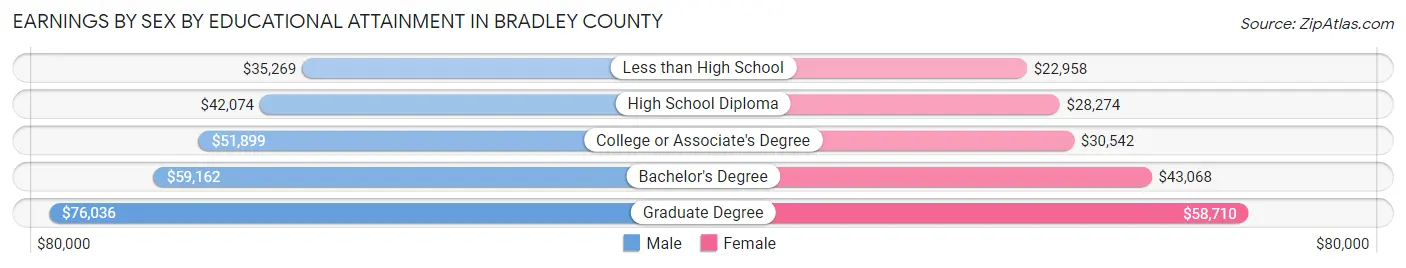
| Educational Attainment | Male Income | Female Income |
| Less than High School | $35,269 | $22,958 |
| High School Diploma | $42,074 | $28,274 |
| College or Associate's Degree | $51,899 | $30,542 |
| Bachelor's Degree | $59,162 | $43,068 |
| Graduate Degree | $76,036 | $58,710 |
| Total | $49,056 | $34,536 |
Family Income in Bradley County
Family Income Brackets in Bradley County
According to the Bradley County family income data, there are 5,772 families falling into the $100,000 to $149,999 income range, which is the most common income bracket and makes up 20.4% of all families. Conversely, the $10,000 to $14,999 income bracket is the least frequent group with only 679 families (2.4%) belonging to this category.
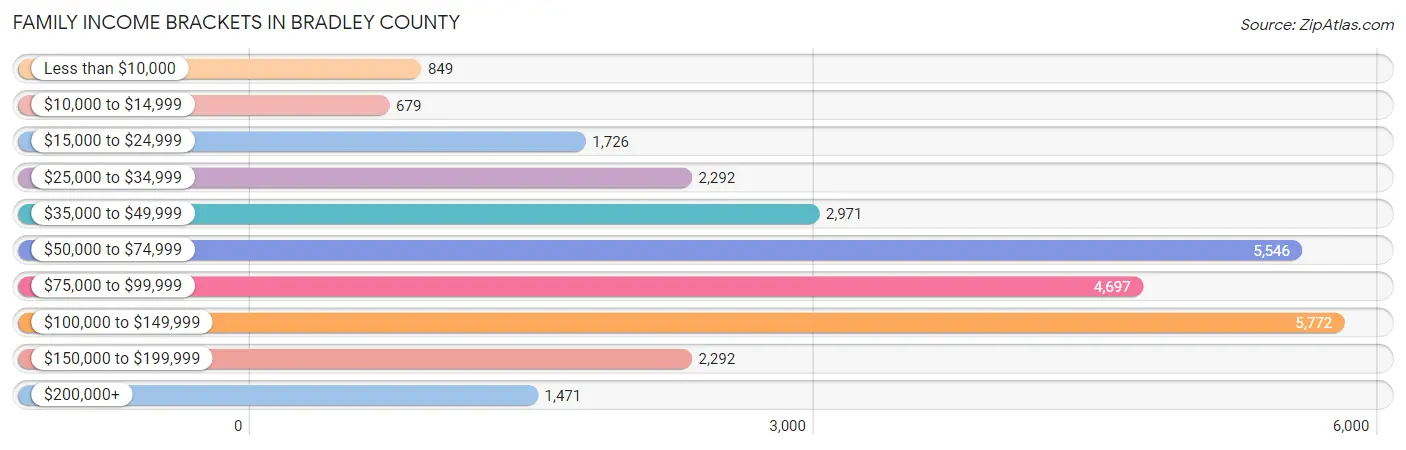
| Income Bracket | # Families | % Families |
| Less than $10,000 | 849 | 3.0% |
| $10,000 to $14,999 | 679 | 2.4% |
| $15,000 to $24,999 | 1,726 | 6.1% |
| $25,000 to $34,999 | 2,292 | 8.1% |
| $35,000 to $49,999 | 2,971 | 10.5% |
| $50,000 to $74,999 | 5,546 | 19.6% |
| $75,000 to $99,999 | 4,697 | 16.6% |
| $100,000 to $149,999 | 5,772 | 20.4% |
| $150,000 to $199,999 | 2,292 | 8.1% |
| $200,000+ | 1,471 | 5.2% |
Family Income by Famaliy Size in Bradley County
6-person families (644 | 2.3%) account for the highest median family income in Bradley County with $121,563 per family, while 2-person families (13,586 | 48.0%) have the highest median income of $32,450 per family member.

| Income Bracket | # Families | Median Income |
| 2-Person Families | 13,586 (48.0%) | $64,899 |
| 3-Person Families | 6,608 (23.4%) | $81,467 |
| 4-Person Families | 5,009 (17.7%) | $89,345 |
| 5-Person Families | 2,055 (7.3%) | $88,068 |
| 6-Person Families | 644 (2.3%) | $121,563 |
| 7+ Person Families | 392 (1.4%) | $119,167 |
| Total | 28,294 (100.0%) | $75,270 |
Family Income by Number of Earners in Bradley County
The median family income in Bradley County is $75,270, with families comprising 3+ earners (3,186) having the highest median family income of $122,018, while families with no earners (4,805) have the lowest median family income of $37,546, accounting for 11.3% and 17.0% of families, respectively.
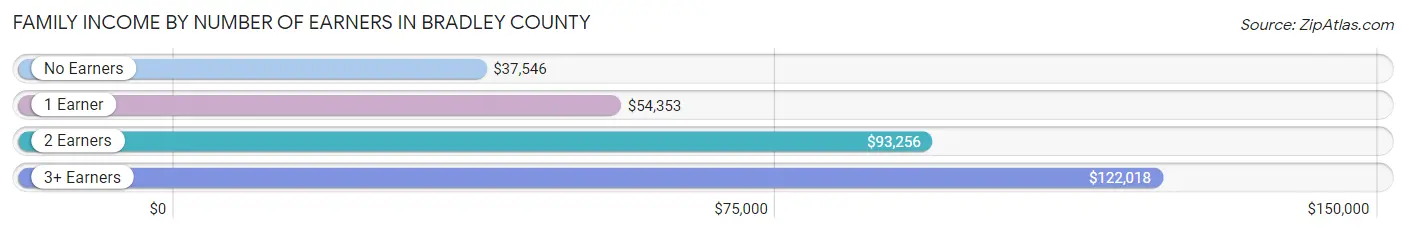
| Number of Earners | # Families | Median Income |
| No Earners | 4,805 (17.0%) | $37,546 |
| 1 Earner | 8,682 (30.7%) | $54,353 |
| 2 Earners | 11,621 (41.1%) | $93,256 |
| 3+ Earners | 3,186 (11.3%) | $122,018 |
| Total | 28,294 (100.0%) | $75,270 |
Household Income in Bradley County
Household Income Brackets in Bradley County
With 7,772 households falling in the category, the $50,000 to $74,999 income range is the most frequent in Bradley County, accounting for 18.8% of all households. In contrast, only 1,943 households (4.7%) fall into the $200,000+ income bracket, making it the least populous group.
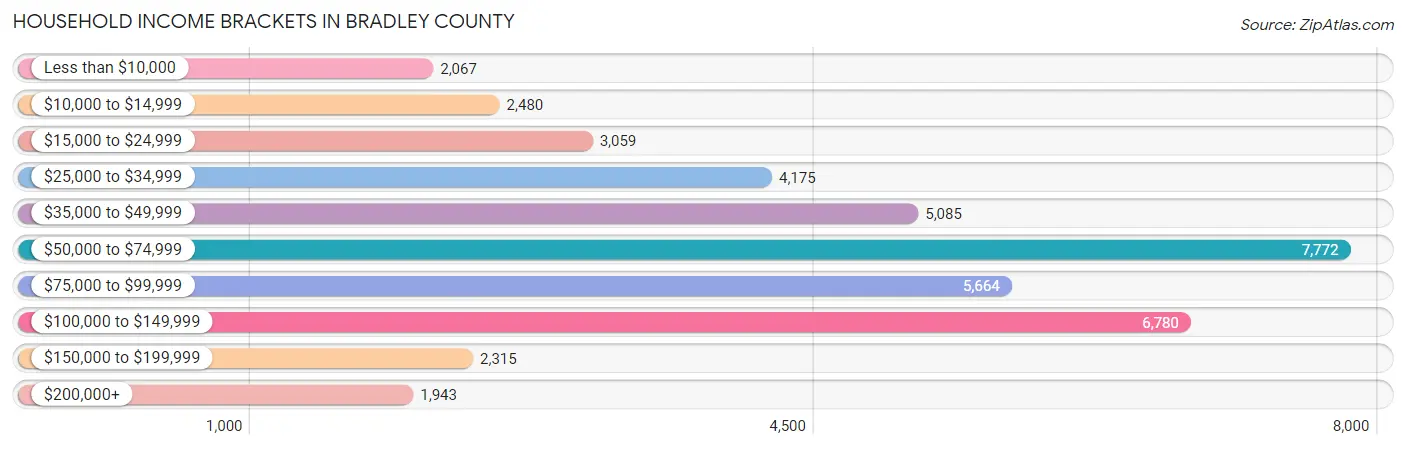
| Income Bracket | # Households | % Households |
| Less than $10,000 | 2,067 | 5.0% |
| $10,000 to $14,999 | 2,480 | 6.0% |
| $15,000 to $24,999 | 3,059 | 7.4% |
| $25,000 to $34,999 | 4,175 | 10.1% |
| $35,000 to $49,999 | 5,085 | 12.3% |
| $50,000 to $74,999 | 7,772 | 18.8% |
| $75,000 to $99,999 | 5,664 | 13.7% |
| $100,000 to $149,999 | 6,780 | 16.4% |
| $150,000 to $199,999 | 2,315 | 5.6% |
| $200,000+ | 1,943 | 4.7% |
Household Income by Householder Age in Bradley County
The median household income in Bradley County is $60,692, with the highest median household income of $73,524 found in the 25 to 44 years age bracket for the primary householder. A total of 13,044 households (31.6%) fall into this category. Meanwhile, the 15 to 24 years age bracket for the primary householder has the lowest median household income of $32,058, with 1,337 households (3.2%) in this group.
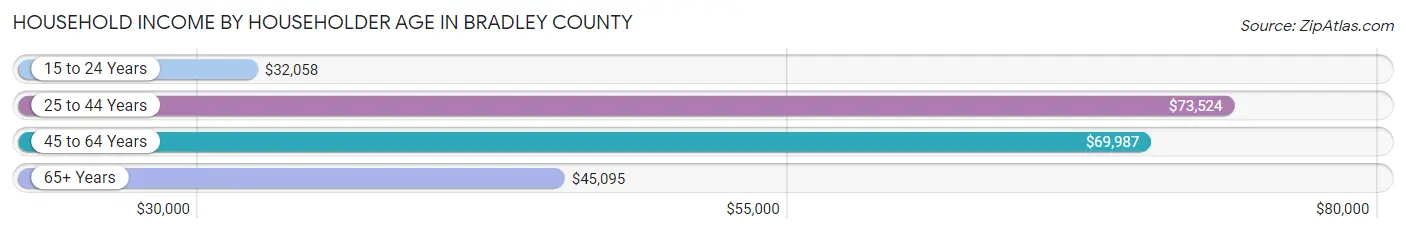
| Income Bracket | # Households | Median Income |
| 15 to 24 Years | 1,337 (3.2%) | $32,058 |
| 25 to 44 Years | 13,044 (31.6%) | $73,524 |
| 45 to 64 Years | 15,381 (37.2%) | $69,987 |
| 65+ Years | 11,578 (28.0%) | $45,095 |
| Total | 41,340 (100.0%) | $60,692 |
Poverty in Bradley County
Income Below Poverty by Sex and Age in Bradley County
With 12.1% poverty level for males and 14.6% for females among the residents of Bradley County, under 5 year old males and 18 to 24 year old females are the most vulnerable to poverty, with 695 males (23.7%) and 961 females (24.1%) in their respective age groups living below the poverty level.
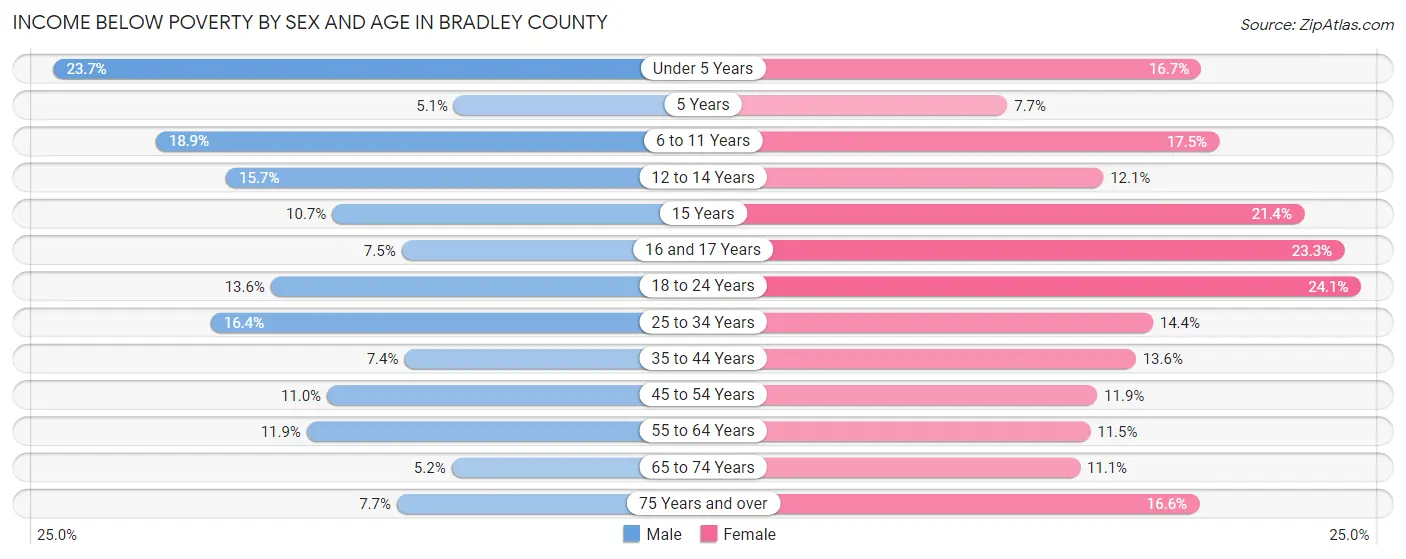
| Age Bracket | Male | Female |
| Under 5 Years | 695 (23.7%) | 486 (16.7%) |
| 5 Years | 33 (5.1%) | 45 (7.7%) |
| 6 to 11 Years | 738 (18.9%) | 721 (17.5%) |
| 12 to 14 Years | 299 (15.7%) | 219 (12.1%) |
| 15 Years | 71 (10.7%) | 161 (21.4%) |
| 16 and 17 Years | 122 (7.5%) | 281 (23.3%) |
| 18 to 24 Years | 625 (13.6%) | 961 (24.1%) |
| 25 to 34 Years | 1,101 (16.4%) | 991 (14.4%) |
| 35 to 44 Years | 473 (7.4%) | 916 (13.6%) |
| 45 to 54 Years | 795 (11.0%) | 847 (11.8%) |
| 55 to 64 Years | 842 (11.9%) | 839 (11.5%) |
| 65 to 74 Years | 259 (5.2%) | 647 (11.1%) |
| 75 Years and over | 229 (7.7%) | 732 (16.6%) |
| Total | 6,282 (12.1%) | 7,846 (14.6%) |
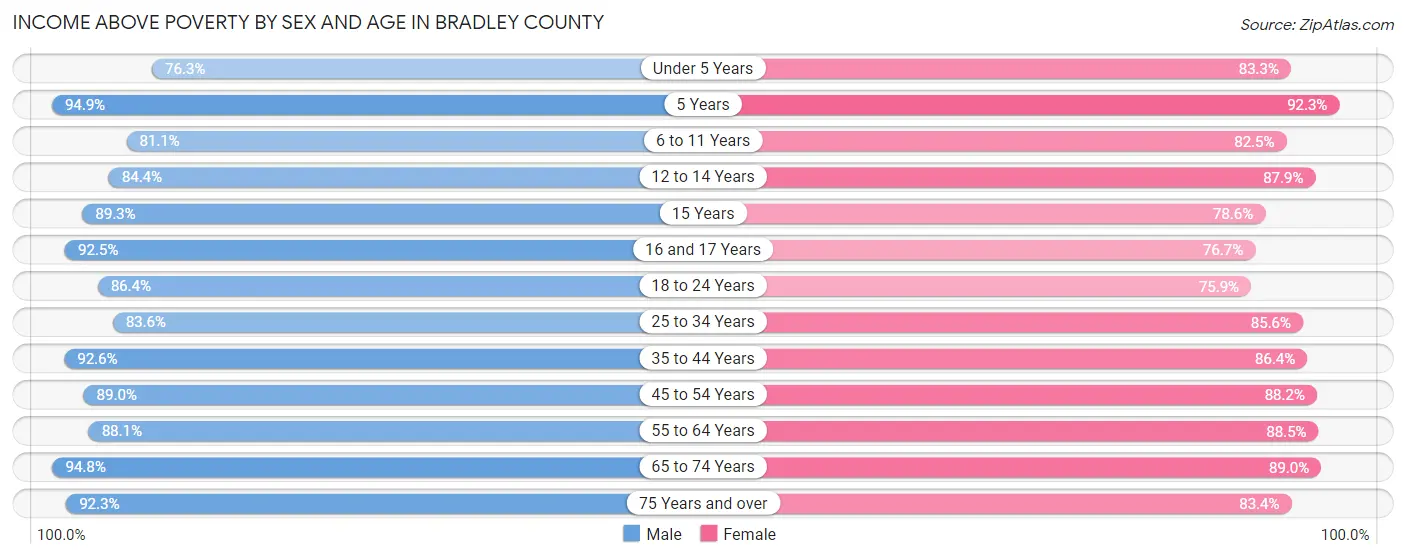
Income Above Poverty by Sex and Age in Bradley County
According to the poverty statistics in Bradley County, males aged 5 years and females aged 5 years are the age groups that are most secure financially, with 94.9% of males and 92.3% of females in these age groups living above the poverty line.
| Age Bracket | Male | Female |
| Under 5 Years | 2,243 (76.3%) | 2,430 (83.3%) |
| 5 Years | 616 (94.9%) | 541 (92.3%) |
| 6 to 11 Years | 3,164 (81.1%) | 3,398 (82.5%) |
| 12 to 14 Years | 1,612 (84.4%) | 1,586 (87.9%) |
| 15 Years | 591 (89.3%) | 590 (78.6%) |
| 16 and 17 Years | 1,503 (92.5%) | 925 (76.7%) |
| 18 to 24 Years | 3,978 (86.4%) | 3,034 (75.9%) |
| 25 to 34 Years | 5,628 (83.6%) | 5,876 (85.6%) |
| 35 to 44 Years | 5,938 (92.6%) | 5,802 (86.4%) |
| 45 to 54 Years | 6,454 (89.0%) | 6,298 (88.1%) |
| 55 to 64 Years | 6,228 (88.1%) | 6,435 (88.5%) |
| 65 to 74 Years | 4,735 (94.8%) | 5,209 (88.9%) |
| 75 Years and over | 2,733 (92.3%) | 3,686 (83.4%) |
| Total | 45,423 (87.8%) | 45,810 (85.4%) |
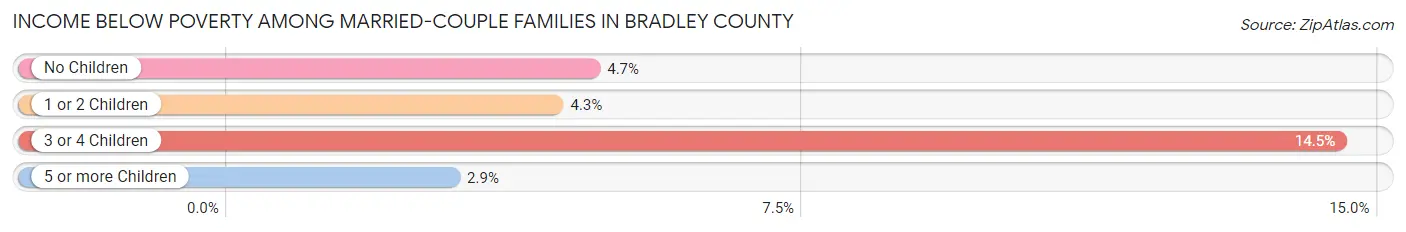
Income Below Poverty Among Married-Couple Families in Bradley County
The poverty statistics for married-couple families in Bradley County show that 5.2% or 1,094 of the total 21,220 families live below the poverty line. Families with 3 or 4 children have the highest poverty rate of 14.5%, comprising of 187 families. On the other hand, families with 5 or more children have the lowest poverty rate of 2.9%, which includes 4 families.
| Children | Above Poverty | Below Poverty |
| No Children | 12,461 (95.3%) | 618 (4.7%) |
| 1 or 2 Children | 6,427 (95.8%) | 285 (4.3%) |
| 3 or 4 Children | 1,104 (85.5%) | 187 (14.5%) |
| 5 or more Children | 134 (97.1%) | 4 (2.9%) |
| Total | 20,126 (94.8%) | 1,094 (5.2%) |
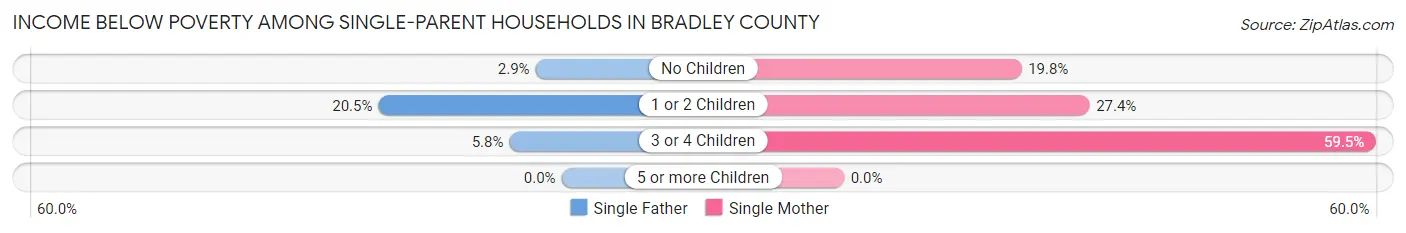
Income Below Poverty Among Single-Parent Households in Bradley County
According to the poverty data in Bradley County, 12.8% or 293 single-father households and 29.6% or 1,415 single-mother households are living below the poverty line. Among single-father households, those with 1 or 2 children have the highest poverty rate, with 261 households (20.5%) experiencing poverty. Likewise, among single-mother households, those with 3 or 4 children have the highest poverty rate, with 448 households (59.5%) falling below the poverty line.
| Children | Single Father | Single Mother |
| No Children | 26 (2.9%) | 362 (19.8%) |
| 1 or 2 Children | 261 (20.5%) | 605 (27.4%) |
| 3 or 4 Children | 6 (5.8%) | 448 (59.5%) |
| 5 or more Children | 0 (0.0%) | 0 (0.0%) |
| Total | 293 (12.8%) | 1,415 (29.6%) |
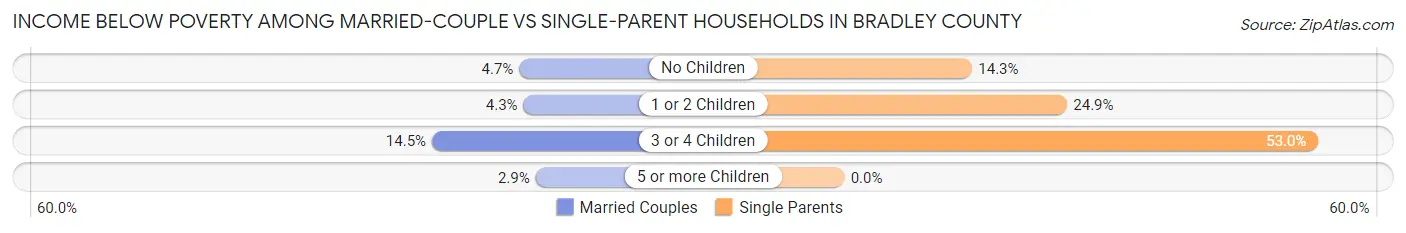
Income Below Poverty Among Married-Couple vs Single-Parent Households in Bradley County
The poverty data for Bradley County shows that 1,094 of the married-couple family households (5.2%) and 1,708 of the single-parent households (24.1%) are living below the poverty level. Within the married-couple family households, those with 3 or 4 children have the highest poverty rate, with 187 households (14.5%) falling below the poverty line. Among the single-parent households, those with 3 or 4 children have the highest poverty rate, with 454 household (53.0%) living below poverty.
| Children | Married-Couple Families | Single-Parent Households |
| No Children | 618 (4.7%) | 388 (14.3%) |
| 1 or 2 Children | 285 (4.3%) | 866 (24.9%) |
| 3 or 4 Children | 187 (14.5%) | 454 (53.0%) |
| 5 or more Children | 4 (2.9%) | 0 (0.0%) |
| Total | 1,094 (5.2%) | 1,708 (24.1%) |
Employment Characteristics in Bradley County
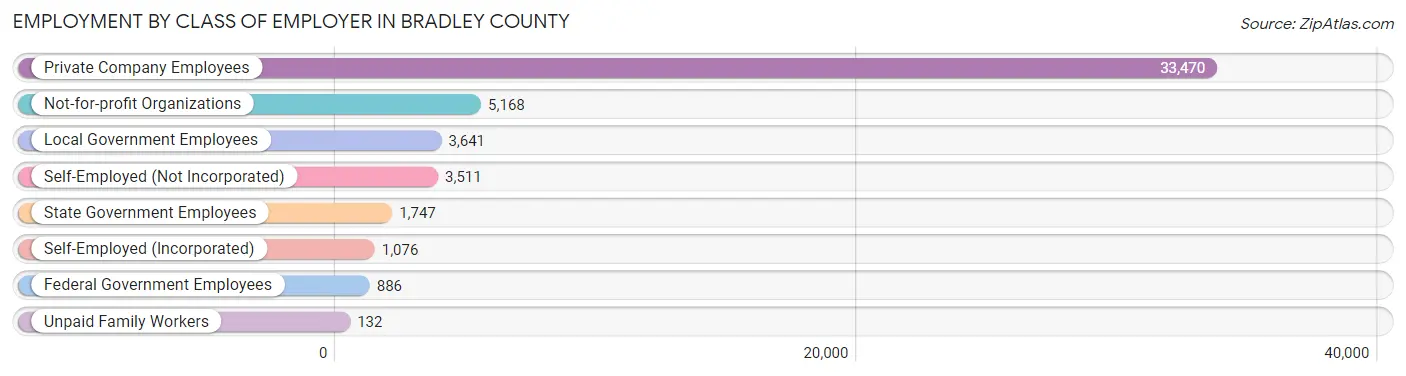
Employment by Class of Employer in Bradley County
Among the 49,631 employed individuals in Bradley County, private company employees (33,470 | 67.4%), not-for-profit organizations (5,168 | 10.4%), and local government employees (3,641 | 7.3%) make up the most common classes of employment.
| Employer Class | # Employees | % Employees |
| Private Company Employees | 33,470 | 67.4% |
| Self-Employed (Incorporated) | 1,076 | 2.2% |
| Self-Employed (Not Incorporated) | 3,511 | 7.1% |
| Not-for-profit Organizations | 5,168 | 10.4% |
| Local Government Employees | 3,641 | 7.3% |
| State Government Employees | 1,747 | 3.5% |
| Federal Government Employees | 886 | 1.8% |
| Unpaid Family Workers | 132 | 0.3% |
| Total | 49,631 | 100.0% |
Employment Status by Age in Bradley County
According to the labor force statistics for Bradley County, out of the total population over 16 years of age (88,117), 61.3% or 54,016 individuals are in the labor force, with 5.4% or 2,917 of them unemployed. The age group with the highest labor force participation rate is 30 to 34 years, with 82.8% or 5,598 individuals in the labor force. Within the labor force, the 16 to 19 years age range has the highest percentage of unemployed individuals, with 22.3% or 629 of them being unemployed.

| Age Bracket | In Labor Force | Unemployed |
| 16 to 19 Years | 2,822 (46.0%) | 629 (22.3%) |
| 20 to 24 Years | 5,878 (79.7%) | 323 (5.5%) |
| 25 to 29 Years | 5,704 (81.7%) | 251 (4.4%) |
| 30 to 34 Years | 5,598 (82.8%) | 358 (6.4%) |
| 35 to 44 Years | 10,912 (81.9%) | 371 (3.4%) |
| 45 to 54 Years | 10,924 (75.4%) | 503 (4.6%) |
| 55 to 59 Years | 4,986 (69.7%) | 135 (2.7%) |
| 60 to 64 Years | 4,010 (55.2%) | 96 (2.4%) |
| 65 to 74 Years | 2,605 (23.7%) | 115 (4.4%) |
| 75 Years and over | 589 (7.7%) | 120 (20.4%) |
| Total | 54,016 (61.3%) | 2,917 (5.4%) |
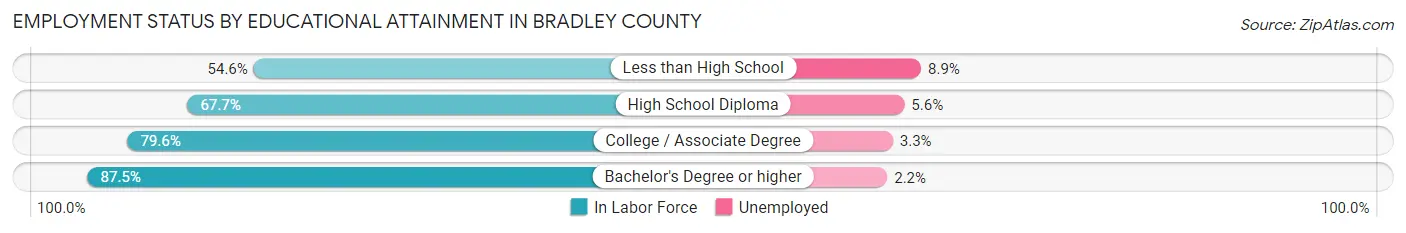
Employment Status by Educational Attainment in Bradley County
According to labor force statistics for Bradley County, 75.3% of individuals (42,148) out of the total population between 25 and 64 years of age (55,973) are in the labor force, with 4.1% or 1,728 of them being unemployed. The group with the highest labor force participation rate are those with the educational attainment of bachelor's degree or higher, with 87.5% or 12,064 individuals in the labor force. Within the labor force, individuals with less than high school education have the highest percentage of unemployment, with 8.9% or 285 of them being unemployed.
| Educational Attainment | In Labor Force | Unemployed |
| Less than High School | 3,202 (54.6%) | 522 (8.9%) |
| High School Diploma | 11,728 (67.7%) | 970 (5.6%) |
| College / Associate Degree | 15,122 (79.6%) | 627 (3.3%) |
| Bachelor's Degree or higher | 12,064 (87.5%) | 303 (2.2%) |
| Total | 42,148 (75.3%) | 2,295 (4.1%) |
Employment Occupations by Sex in Bradley County
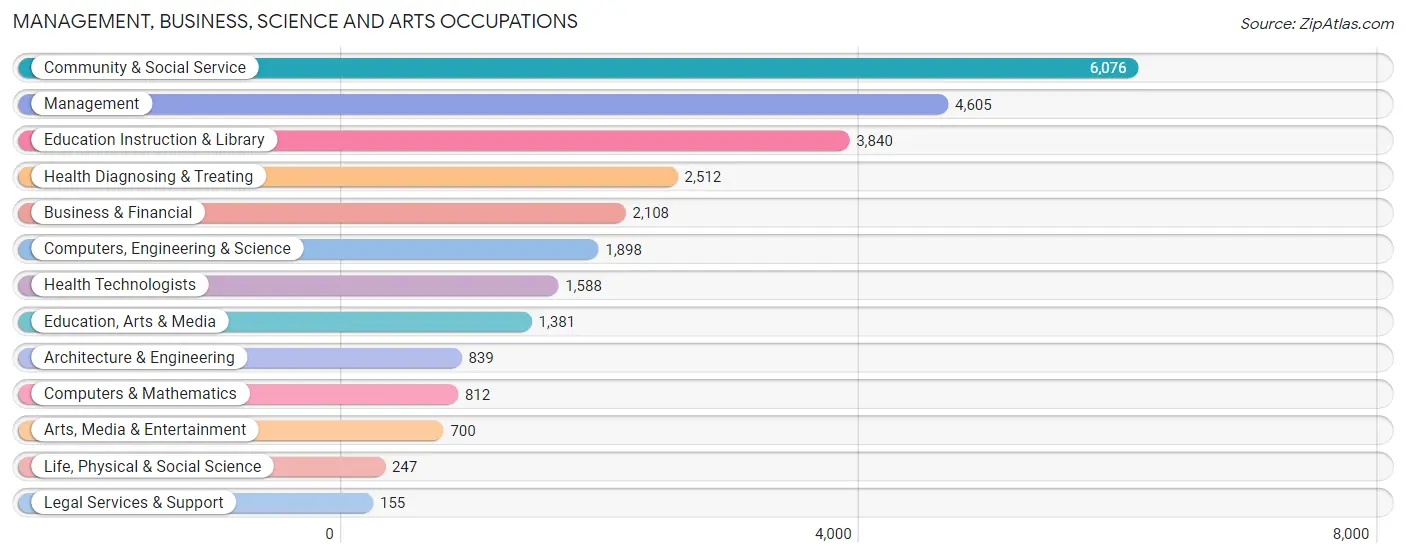
Management, Business, Science and Arts Occupations
The most common Management, Business, Science and Arts occupations in Bradley County are Community & Social Service (6,076 | 11.9%), Management (4,605 | 9.0%), Education Instruction & Library (3,840 | 7.5%), Health Diagnosing & Treating (2,512 | 4.9%), and Business & Financial (2,108 | 4.1%).
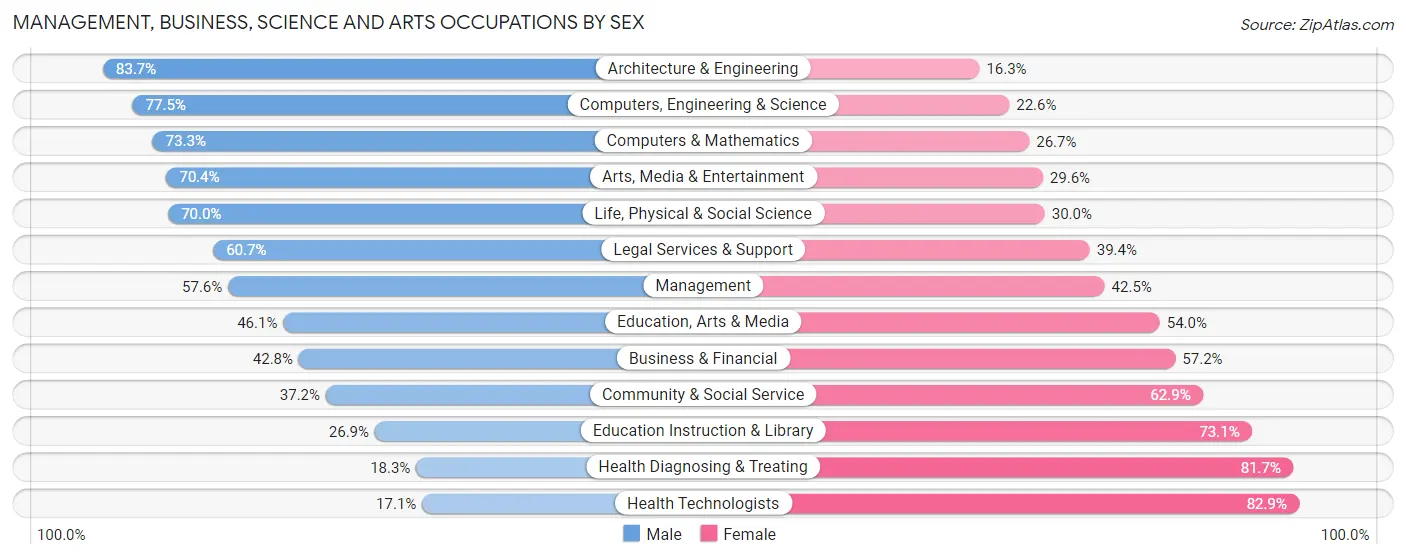
Management, Business, Science and Arts Occupations by Sex
Within the Management, Business, Science and Arts occupations in Bradley County, the most male-oriented occupations are Architecture & Engineering (83.7%), Computers, Engineering & Science (77.4%), and Computers & Mathematics (73.3%), while the most female-oriented occupations are Health Technologists (82.9%), Health Diagnosing & Treating (81.7%), and Education Instruction & Library (73.1%).
| Occupation | Male | Female |
| Management | 2,650 (57.6%) | 1,955 (42.4%) |
| Business & Financial | 902 (42.8%) | 1,206 (57.2%) |
| Computers, Engineering & Science | 1,470 (77.4%) | 428 (22.6%) |
| Computers & Mathematics | 595 (73.3%) | 217 (26.7%) |
| Architecture & Engineering | 702 (83.7%) | 137 (16.3%) |
| Life, Physical & Social Science | 173 (70.0%) | 74 (30.0%) |
| Community & Social Service | 2,257 (37.1%) | 3,819 (62.8%) |
| Education, Arts & Media | 636 (46.1%) | 745 (53.9%) |
| Legal Services & Support | 94 (60.7%) | 61 (39.4%) |
| Education Instruction & Library | 1,034 (26.9%) | 2,806 (73.1%) |
| Arts, Media & Entertainment | 493 (70.4%) | 207 (29.6%) |
| Health Diagnosing & Treating | 460 (18.3%) | 2,052 (81.7%) |
| Health Technologists | 271 (17.1%) | 1,317 (82.9%) |
| Total (Category) | 7,739 (45.0%) | 9,460 (55.0%) |
| Total (Overall) | 26,264 (51.4%) | 24,793 (48.6%) |
Services Occupations
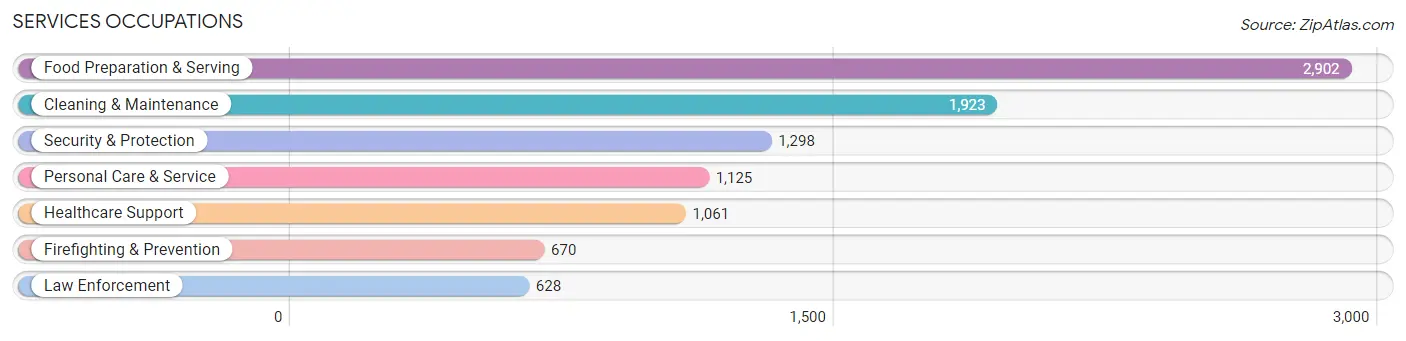
The most common Services occupations in Bradley County are Food Preparation & Serving (2,902 | 5.7%), Cleaning & Maintenance (1,923 | 3.8%), Security & Protection (1,298 | 2.5%), Personal Care & Service (1,125 | 2.2%), and Healthcare Support (1,061 | 2.1%).
Services Occupations by Sex
Within the Services occupations in Bradley County, the most male-oriented occupations are Law Enforcement (77.5%), Security & Protection (71.3%), and Firefighting & Prevention (65.5%), while the most female-oriented occupations are Healthcare Support (92.3%), Personal Care & Service (66.6%), and Food Preparation & Serving (65.8%).
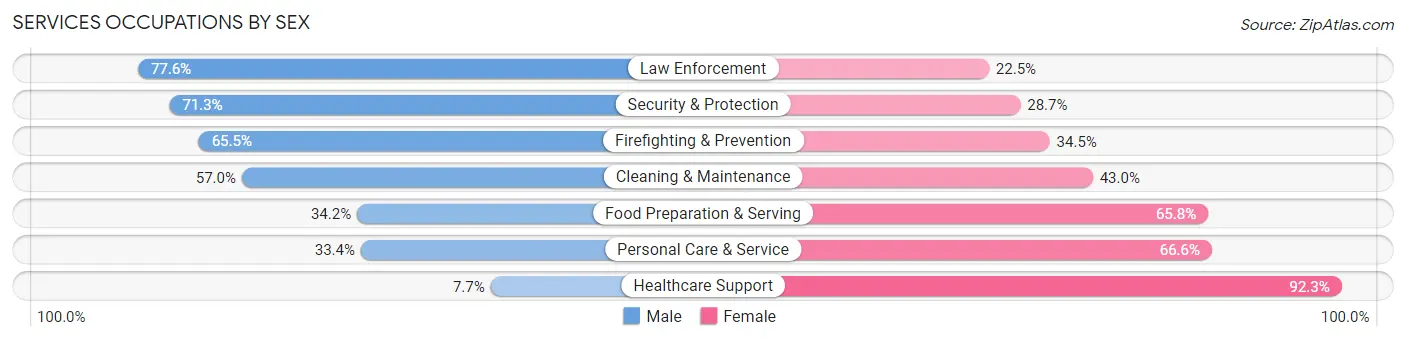
| Occupation | Male | Female |
| Healthcare Support | 82 (7.7%) | 979 (92.3%) |
| Security & Protection | 926 (71.3%) | 372 (28.7%) |
| Firefighting & Prevention | 439 (65.5%) | 231 (34.5%) |
| Law Enforcement | 487 (77.5%) | 141 (22.5%) |
| Food Preparation & Serving | 992 (34.2%) | 1,910 (65.8%) |
| Cleaning & Maintenance | 1,096 (57.0%) | 827 (43.0%) |
| Personal Care & Service | 376 (33.4%) | 749 (66.6%) |
| Total (Category) | 3,472 (41.8%) | 4,837 (58.2%) |
| Total (Overall) | 26,264 (51.4%) | 24,793 (48.6%) |
Sales and Office Occupations
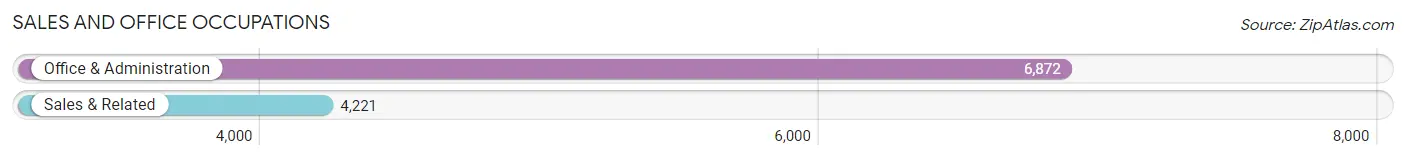
The most common Sales and Office occupations in Bradley County are Office & Administration (6,872 | 13.5%), and Sales & Related (4,221 | 8.3%).
Sales and Office Occupations by Sex
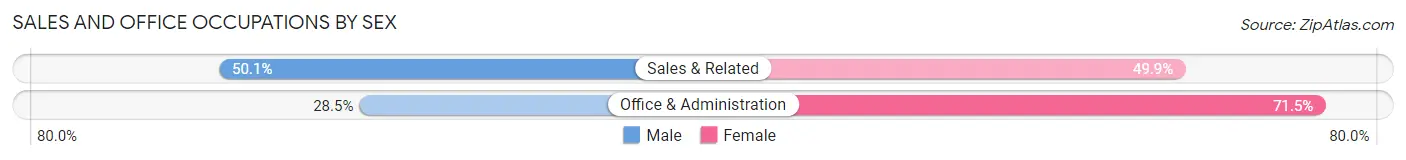
| Occupation | Male | Female |
| Sales & Related | 2,114 (50.1%) | 2,107 (49.9%) |
| Office & Administration | 1,960 (28.5%) | 4,912 (71.5%) |
| Total (Category) | 4,074 (36.7%) | 7,019 (63.3%) |
| Total (Overall) | 26,264 (51.4%) | 24,793 (48.6%) |
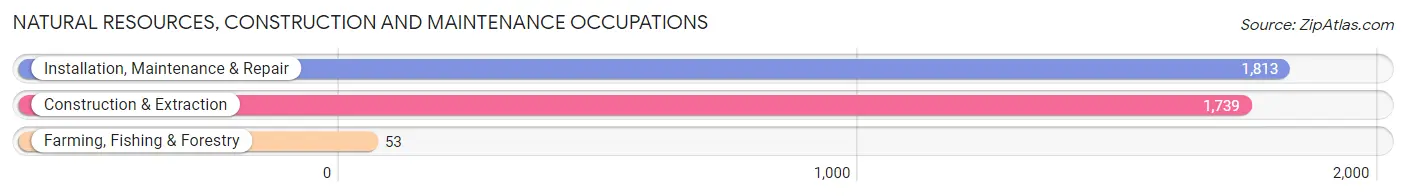
Natural Resources, Construction and Maintenance Occupations
The most common Natural Resources, Construction and Maintenance occupations in Bradley County are Installation, Maintenance & Repair (1,813 | 3.5%), Construction & Extraction (1,739 | 3.4%), and Farming, Fishing & Forestry (53 | 0.1%).
Natural Resources, Construction and Maintenance Occupations by Sex
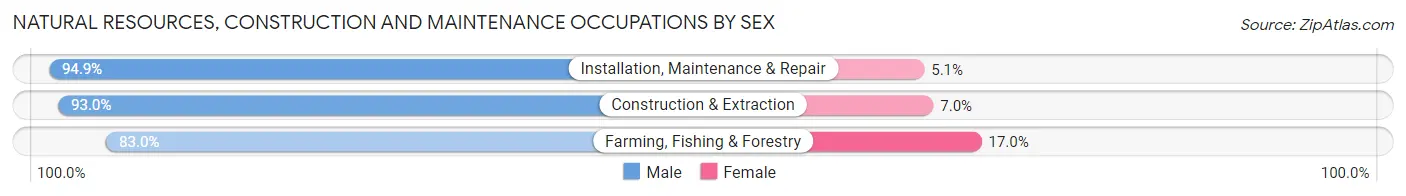
| Occupation | Male | Female |
| Farming, Fishing & Forestry | 44 (83.0%) | 9 (17.0%) |
| Construction & Extraction | 1,618 (93.0%) | 121 (7.0%) |
| Installation, Maintenance & Repair | 1,721 (94.9%) | 92 (5.1%) |
| Total (Category) | 3,383 (93.8%) | 222 (6.2%) |
| Total (Overall) | 26,264 (51.4%) | 24,793 (48.6%) |
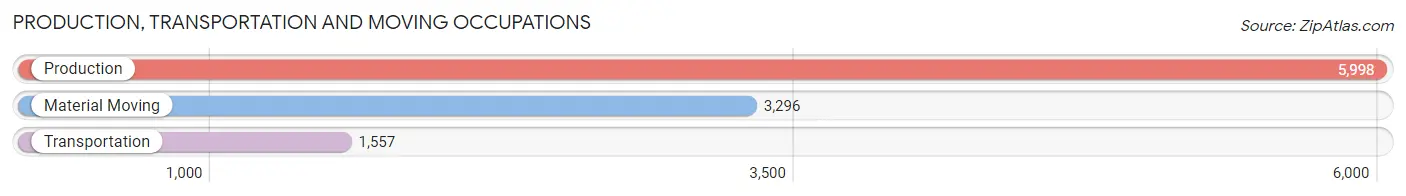
Production, Transportation and Moving Occupations
The most common Production, Transportation and Moving occupations in Bradley County are Production (5,998 | 11.7%), Material Moving (3,296 | 6.5%), and Transportation (1,557 | 3.0%).
Production, Transportation and Moving Occupations by Sex
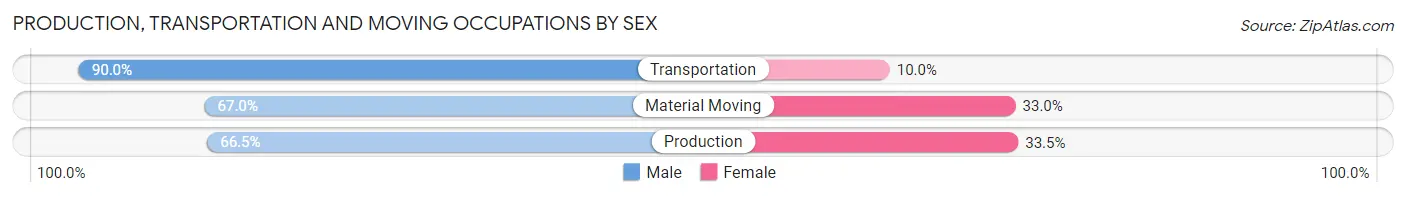
| Occupation | Male | Female |
| Production | 3,987 (66.5%) | 2,011 (33.5%) |
| Transportation | 1,402 (90.0%) | 155 (10.0%) |
| Material Moving | 2,207 (67.0%) | 1,089 (33.0%) |
| Total (Category) | 7,596 (70.0%) | 3,255 (30.0%) |
| Total (Overall) | 26,264 (51.4%) | 24,793 (48.6%) |
Employment Industries by Sex in Bradley County
Employment Industries in Bradley County
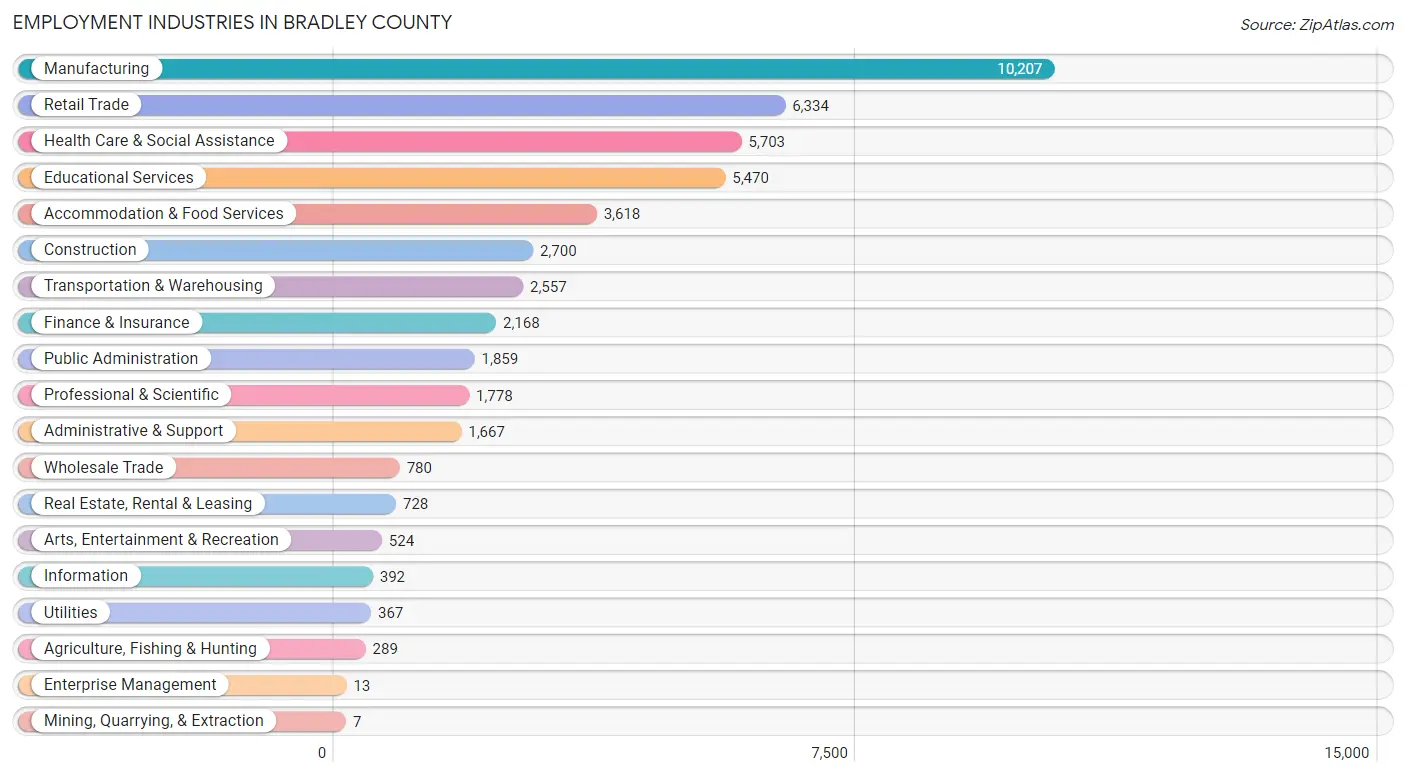
The major employment industries in Bradley County include Manufacturing (10,207 | 20.0%), Retail Trade (6,334 | 12.4%), Health Care & Social Assistance (5,703 | 11.2%), Educational Services (5,470 | 10.7%), and Accommodation & Food Services (3,618 | 7.1%).
Employment Industries by Sex in Bradley County
The Bradley County industries that see more men than women are Construction (87.7%), Wholesale Trade (81.9%), and Utilities (79.0%), whereas the industries that tend to have a higher number of women are Mining, Quarrying, & Extraction (100.0%), Enterprise Management (100.0%), and Finance & Insurance (79.1%).
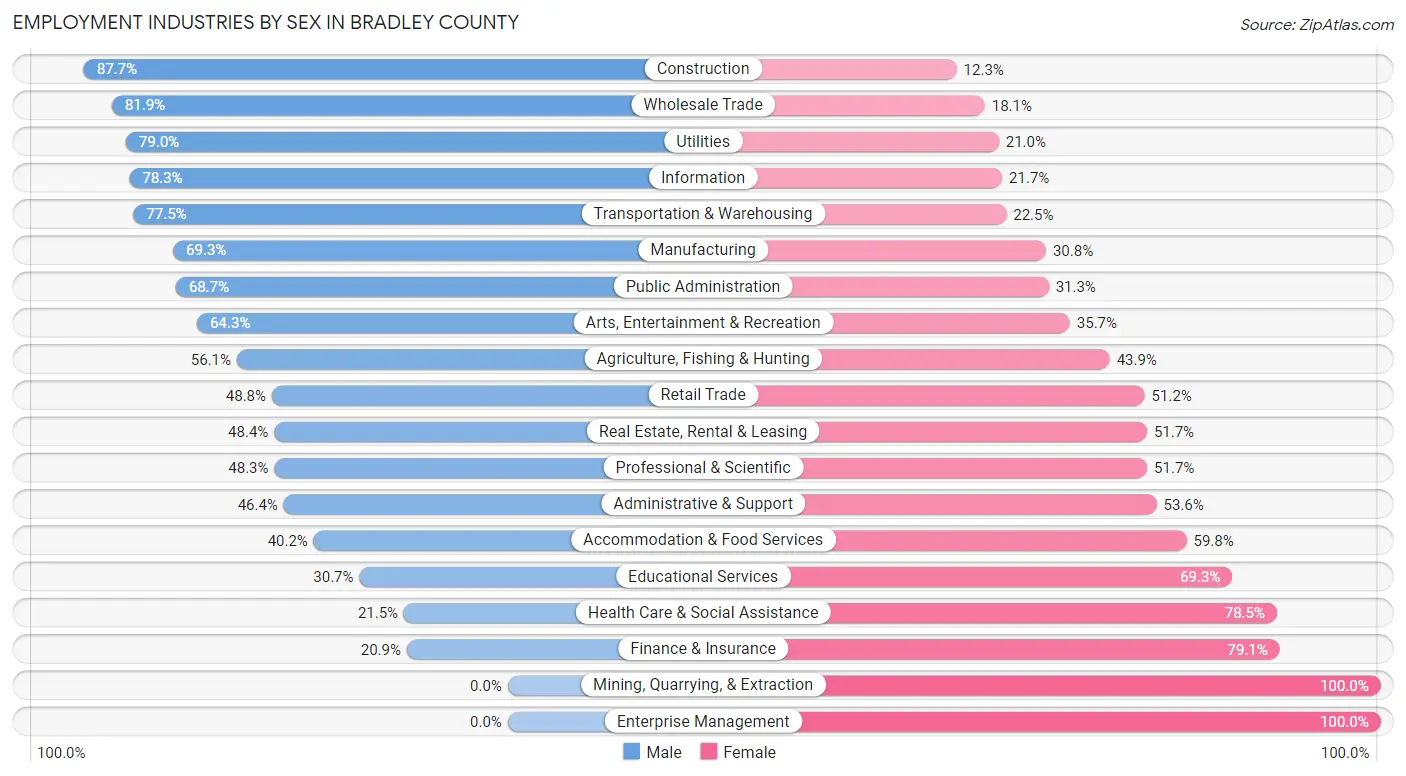
| Industry | Male | Female |
| Agriculture, Fishing & Hunting | 162 (56.1%) | 127 (43.9%) |
| Mining, Quarrying, & Extraction | 0 (0.0%) | 7 (100.0%) |
| Construction | 2,369 (87.7%) | 331 (12.3%) |
| Manufacturing | 7,068 (69.3%) | 3,139 (30.7%) |
| Wholesale Trade | 639 (81.9%) | 141 (18.1%) |
| Retail Trade | 3,092 (48.8%) | 3,242 (51.2%) |
| Transportation & Warehousing | 1,981 (77.5%) | 576 (22.5%) |
| Utilities | 290 (79.0%) | 77 (21.0%) |
| Information | 307 (78.3%) | 85 (21.7%) |
| Finance & Insurance | 453 (20.9%) | 1,715 (79.1%) |
| Real Estate, Rental & Leasing | 352 (48.3%) | 376 (51.6%) |
| Professional & Scientific | 859 (48.3%) | 919 (51.7%) |
| Enterprise Management | 0 (0.0%) | 13 (100.0%) |
| Administrative & Support | 773 (46.4%) | 894 (53.6%) |
| Educational Services | 1,680 (30.7%) | 3,790 (69.3%) |
| Health Care & Social Assistance | 1,225 (21.5%) | 4,478 (78.5%) |
| Arts, Entertainment & Recreation | 337 (64.3%) | 187 (35.7%) |
| Accommodation & Food Services | 1,453 (40.2%) | 2,165 (59.8%) |
| Public Administration | 1,277 (68.7%) | 582 (31.3%) |
| Total | 26,264 (51.4%) | 24,793 (48.6%) |
Education in Bradley County
School Enrollment in Bradley County
The most common levels of schooling among the 25,161 students in Bradley County are college / undergraduate (6,454 | 25.7%), high school (5,398 | 21.4%), and middle school (5,122 | 20.4%).
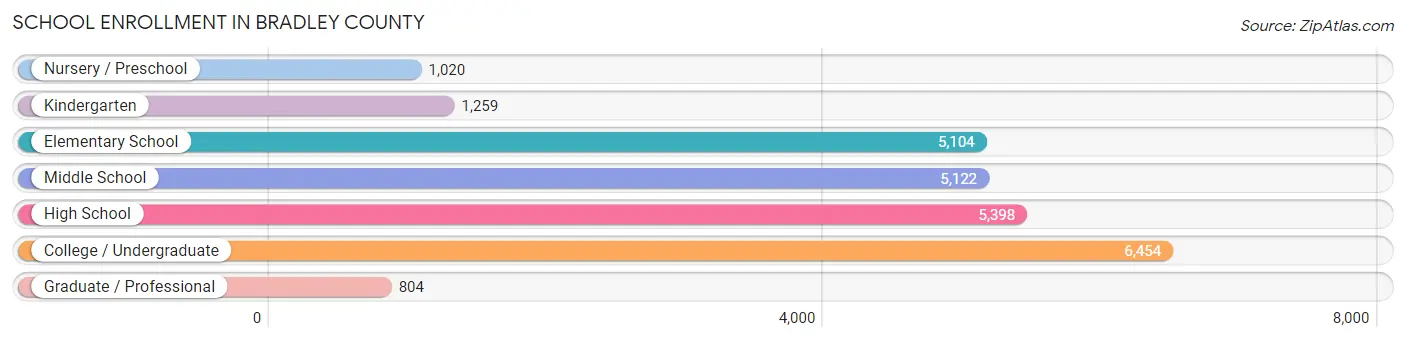
| School Level | # Students | % Students |
| Nursery / Preschool | 1,020 | 4.1% |
| Kindergarten | 1,259 | 5.0% |
| Elementary School | 5,104 | 20.3% |
| Middle School | 5,122 | 20.4% |
| High School | 5,398 | 21.4% |
| College / Undergraduate | 6,454 | 25.7% |
| Graduate / Professional | 804 | 3.2% |
| Total | 25,161 | 100.0% |
School Enrollment by Age by Funding Source in Bradley County
Out of a total of 25,161 students who are enrolled in schools in Bradley County, 6,240 (24.8%) attend a private institution, while the remaining 18,921 (75.2%) are enrolled in public schools. The age group of 20 to 24 year olds has the highest likelihood of being enrolled in private schools, with 2,333 (71.1% in the age bracket) enrolled. Conversely, the age group of 5 to 9 year old has the lowest likelihood of being enrolled in a private school, with 5,460 (91.3% in the age bracket) attending a public institution.
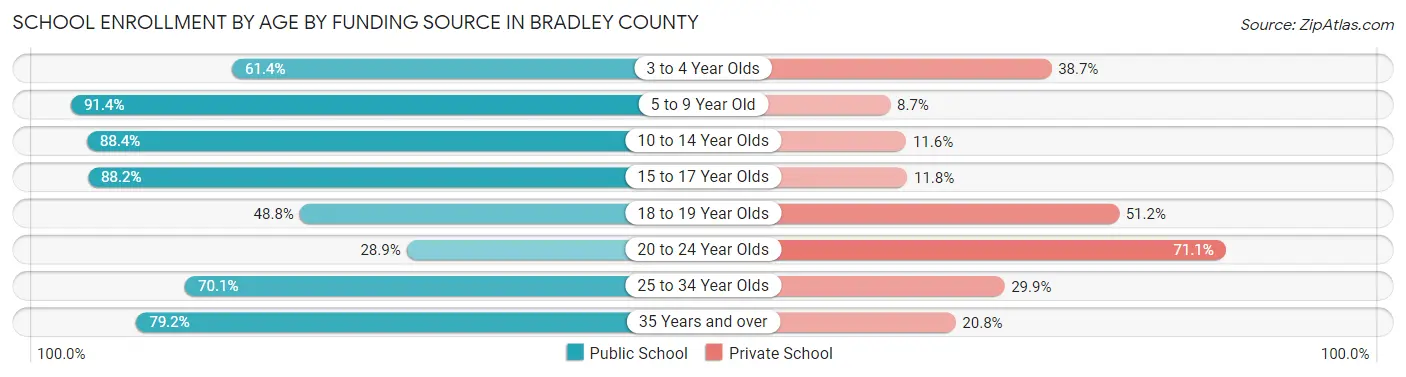
| Age Bracket | Public School | Private School |
| 3 to 4 Year Olds | 446 (61.4%) | 281 (38.7%) |
| 5 to 9 Year Old | 5,460 (91.3%) | 517 (8.6%) |
| 10 to 14 Year Olds | 5,654 (88.4%) | 743 (11.6%) |
| 15 to 17 Year Olds | 3,486 (88.2%) | 467 (11.8%) |
| 18 to 19 Year Olds | 1,264 (48.8%) | 1,328 (51.2%) |
| 20 to 24 Year Olds | 947 (28.9%) | 2,333 (71.1%) |
| 25 to 34 Year Olds | 785 (70.1%) | 335 (29.9%) |
| 35 Years and over | 883 (79.2%) | 232 (20.8%) |
| Total | 18,921 (75.2%) | 6,240 (24.8%) |
Educational Attainment by Field of Study in Bradley County
Business (4,201 | 21.8%), education (3,167 | 16.5%), science & technology (1,837 | 9.5%), arts & humanities (1,482 | 7.7%), and liberal arts & history (1,310 | 6.8%) are the most common fields of study among 19,248 individuals in Bradley County who have obtained a bachelor's degree or higher.
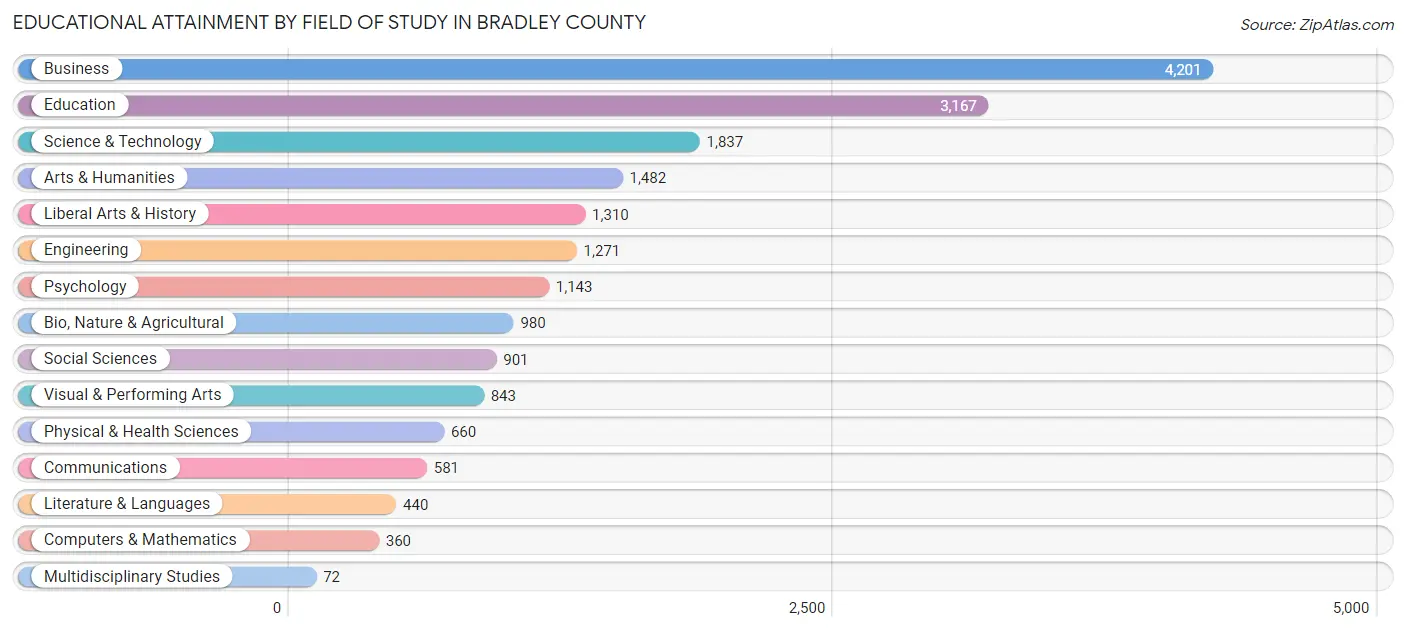
| Field of Study | # Graduates | % Graduates |
| Computers & Mathematics | 360 | 1.9% |
| Bio, Nature & Agricultural | 980 | 5.1% |
| Physical & Health Sciences | 660 | 3.4% |
| Psychology | 1,143 | 5.9% |
| Social Sciences | 901 | 4.7% |
| Engineering | 1,271 | 6.6% |
| Multidisciplinary Studies | 72 | 0.4% |
| Science & Technology | 1,837 | 9.5% |
| Business | 4,201 | 21.8% |
| Education | 3,167 | 16.5% |
| Literature & Languages | 440 | 2.3% |
| Liberal Arts & History | 1,310 | 6.8% |
| Visual & Performing Arts | 843 | 4.4% |
| Communications | 581 | 3.0% |
| Arts & Humanities | 1,482 | 7.7% |
| Total | 19,248 | 100.0% |
Transportation & Commute in Bradley County
Vehicle Availability by Sex in Bradley County
The most prevalent vehicle ownership categories in Bradley County are males with 2 vehicles (9,508, accounting for 37.6%) and females with 2 vehicles (7,982, making up 40.6%).
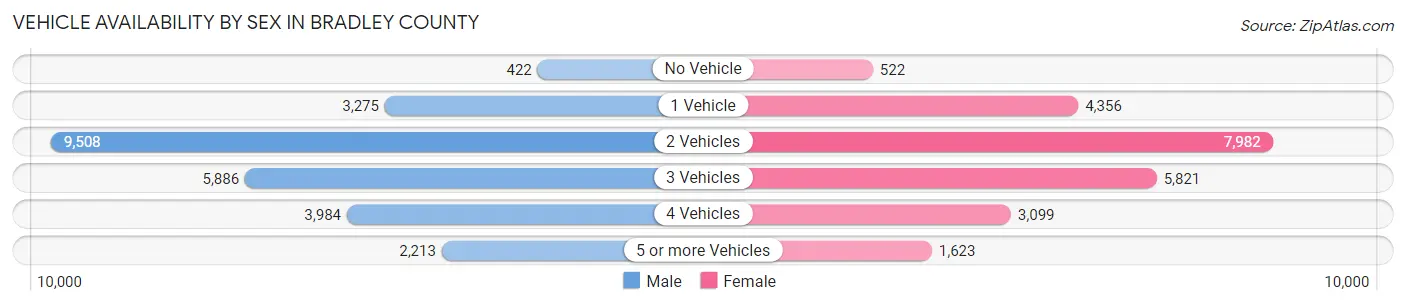
| Vehicles Available | Male | Female |
| No Vehicle | 422 (1.7%) | 522 (2.2%) |
| 1 Vehicle | 3,275 (13.0%) | 4,356 (18.6%) |
| 2 Vehicles | 9,508 (37.6%) | 7,982 (34.1%) |
| 3 Vehicles | 5,886 (23.3%) | 5,821 (24.9%) |
| 4 Vehicles | 3,984 (15.8%) | 3,099 (13.2%) |
| 5 or more Vehicles | 2,213 (8.7%) | 1,623 (6.9%) |
| Total | 25,288 (100.0%) | 23,403 (100.0%) |
Commute Time in Bradley County
The most frequently occuring commute durations in Bradley County are 15 to 19 minutes (9,665 commuters, 20.6%), 10 to 14 minutes (7,800 commuters, 16.6%), and 20 to 24 minutes (6,007 commuters, 12.8%).
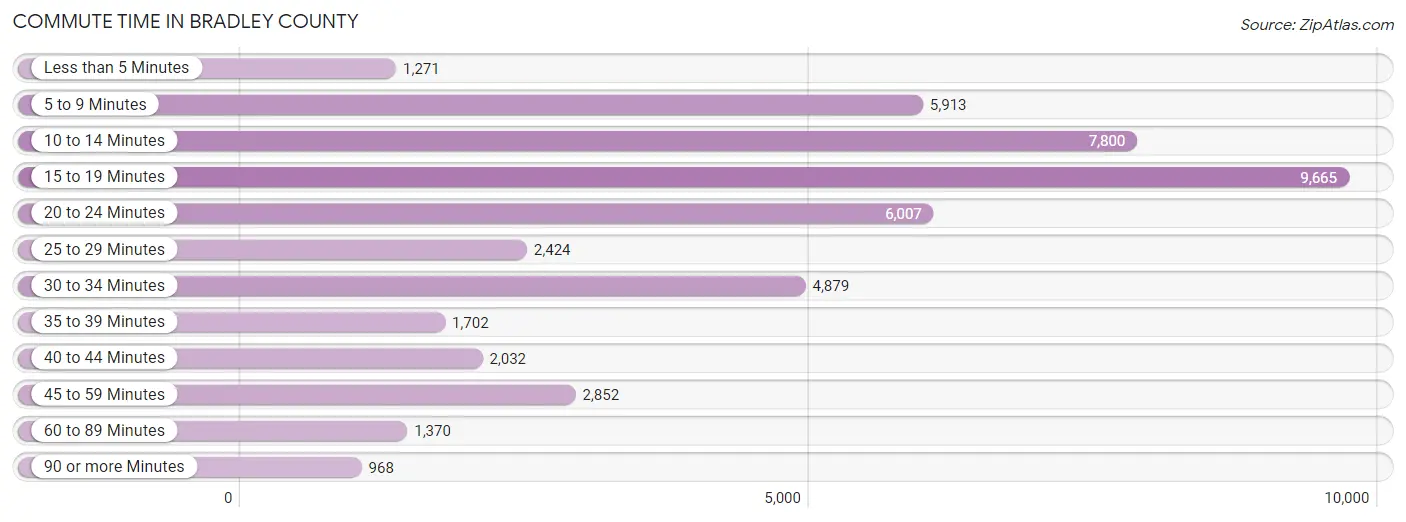
| Commute Time | # Commuters | % Commuters |
| Less than 5 Minutes | 1,271 | 2.7% |
| 5 to 9 Minutes | 5,913 | 12.6% |
| 10 to 14 Minutes | 7,800 | 16.6% |
| 15 to 19 Minutes | 9,665 | 20.6% |
| 20 to 24 Minutes | 6,007 | 12.8% |
| 25 to 29 Minutes | 2,424 | 5.2% |
| 30 to 34 Minutes | 4,879 | 10.4% |
| 35 to 39 Minutes | 1,702 | 3.6% |
| 40 to 44 Minutes | 2,032 | 4.3% |
| 45 to 59 Minutes | 2,852 | 6.1% |
| 60 to 89 Minutes | 1,370 | 2.9% |
| 90 or more Minutes | 968 | 2.1% |
Commute Time by Sex in Bradley County
The most common commute times in Bradley County are 15 to 19 minutes (5,007 commuters, 20.3%) for males and 15 to 19 minutes (4,658 commuters, 21.0%) for females.
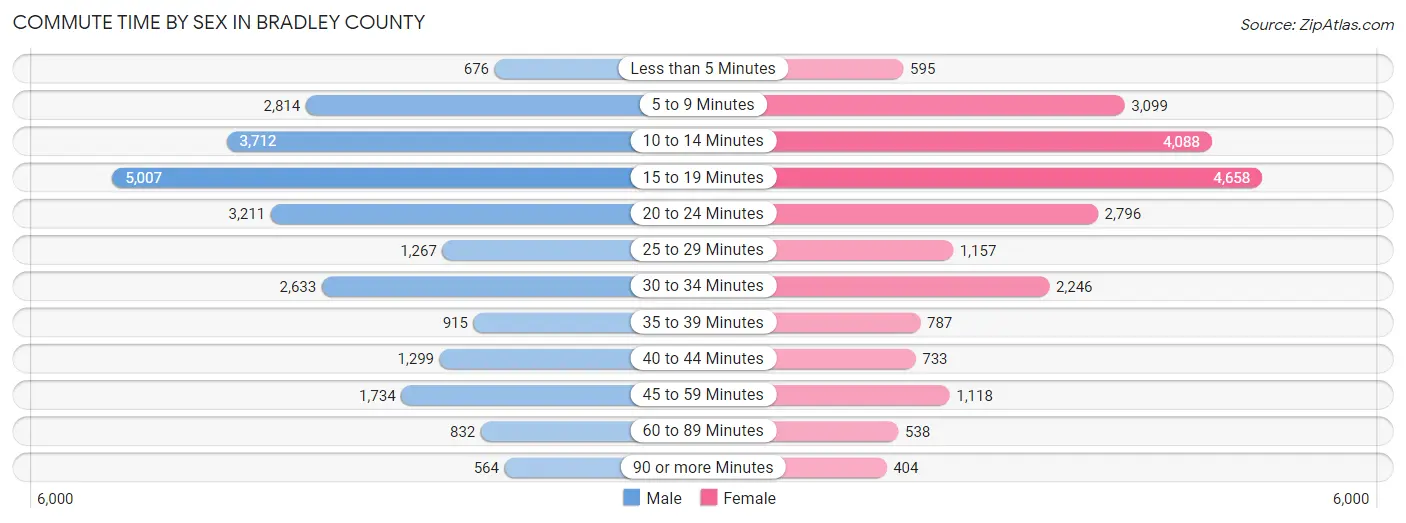
| Commute Time | Male | Female |
| Less than 5 Minutes | 676 (2.7%) | 595 (2.7%) |
| 5 to 9 Minutes | 2,814 (11.4%) | 3,099 (14.0%) |
| 10 to 14 Minutes | 3,712 (15.0%) | 4,088 (18.4%) |
| 15 to 19 Minutes | 5,007 (20.3%) | 4,658 (21.0%) |
| 20 to 24 Minutes | 3,211 (13.0%) | 2,796 (12.6%) |
| 25 to 29 Minutes | 1,267 (5.1%) | 1,157 (5.2%) |
| 30 to 34 Minutes | 2,633 (10.7%) | 2,246 (10.1%) |
| 35 to 39 Minutes | 915 (3.7%) | 787 (3.5%) |
| 40 to 44 Minutes | 1,299 (5.3%) | 733 (3.3%) |
| 45 to 59 Minutes | 1,734 (7.0%) | 1,118 (5.0%) |
| 60 to 89 Minutes | 832 (3.4%) | 538 (2.4%) |
| 90 or more Minutes | 564 (2.3%) | 404 (1.8%) |
Time of Departure to Work by Sex in Bradley County
The most frequent times of departure to work in Bradley County are 7:00 AM to 7:29 AM (3,247, 13.2%) for males and 7:30 AM to 7:59 AM (3,384, 15.2%) for females.
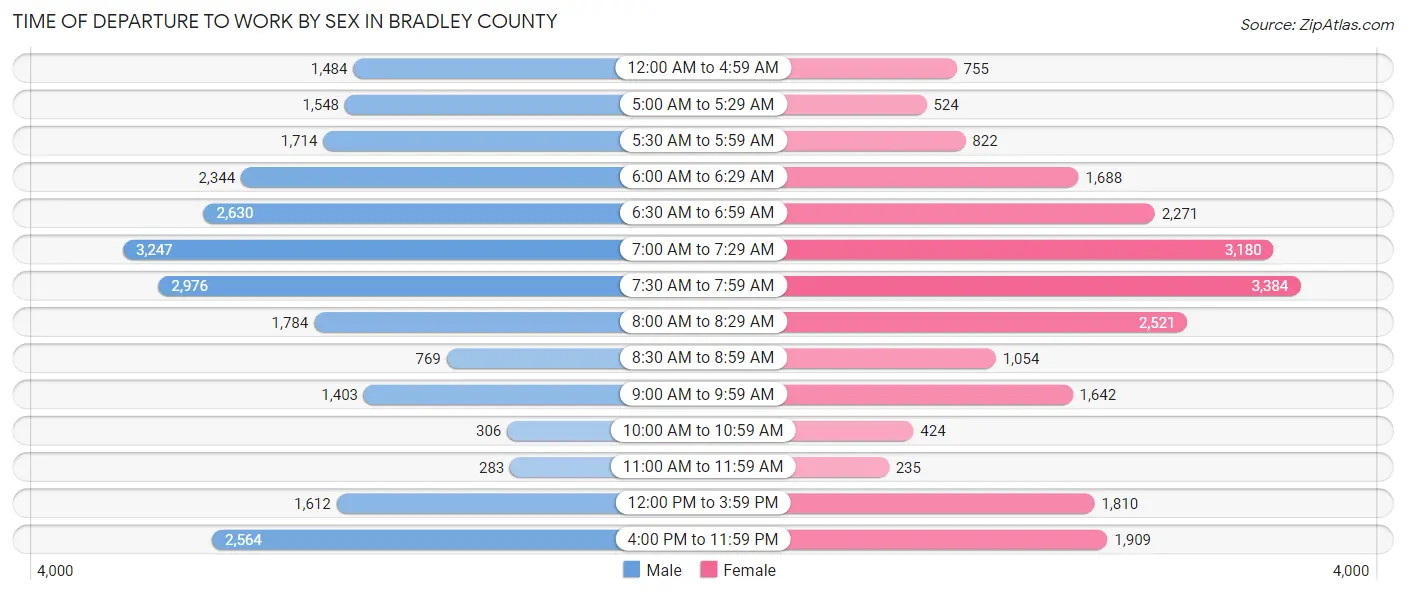
| Time of Departure | Male | Female |
| 12:00 AM to 4:59 AM | 1,484 (6.0%) | 755 (3.4%) |
| 5:00 AM to 5:29 AM | 1,548 (6.3%) | 524 (2.4%) |
| 5:30 AM to 5:59 AM | 1,714 (7.0%) | 822 (3.7%) |
| 6:00 AM to 6:29 AM | 2,344 (9.5%) | 1,688 (7.6%) |
| 6:30 AM to 6:59 AM | 2,630 (10.7%) | 2,271 (10.2%) |
| 7:00 AM to 7:29 AM | 3,247 (13.2%) | 3,180 (14.3%) |
| 7:30 AM to 7:59 AM | 2,976 (12.1%) | 3,384 (15.2%) |
| 8:00 AM to 8:29 AM | 1,784 (7.2%) | 2,521 (11.4%) |
| 8:30 AM to 8:59 AM | 769 (3.1%) | 1,054 (4.7%) |
| 9:00 AM to 9:59 AM | 1,403 (5.7%) | 1,642 (7.4%) |
| 10:00 AM to 10:59 AM | 306 (1.2%) | 424 (1.9%) |
| 11:00 AM to 11:59 AM | 283 (1.1%) | 235 (1.1%) |
| 12:00 PM to 3:59 PM | 1,612 (6.5%) | 1,810 (8.2%) |
| 4:00 PM to 11:59 PM | 2,564 (10.4%) | 1,909 (8.6%) |
| Total | 24,664 (100.0%) | 22,219 (100.0%) |
Housing Occupancy in Bradley County
Occupancy by Ownership in Bradley County
Of the total 41,340 dwellings in Bradley County, owner-occupied units account for 28,102 (68.0%), while renter-occupied units make up 13,238 (32.0%).
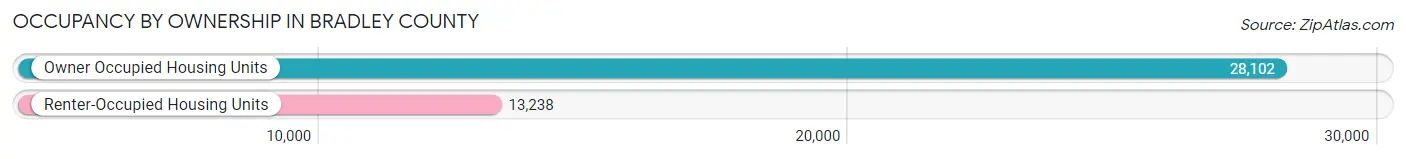
| Occupancy | # Housing Units | % Housing Units |
| Owner Occupied Housing Units | 28,102 | 68.0% |
| Renter-Occupied Housing Units | 13,238 | 32.0% |
| Total Occupied Housing Units | 41,340 | 100.0% |
Occupancy by Household Size in Bradley County
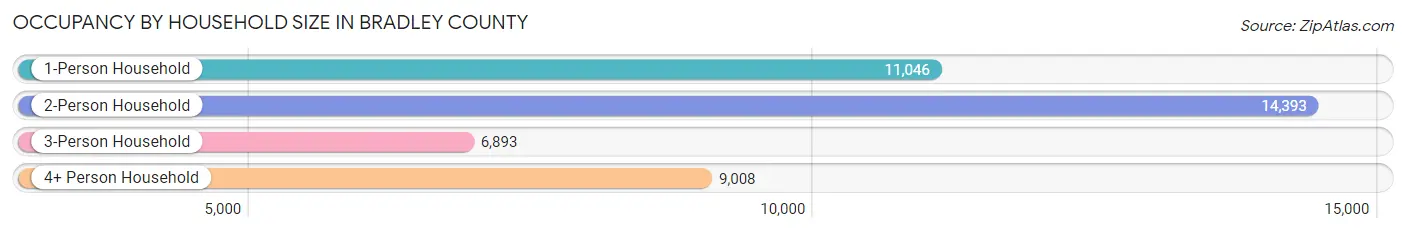
| Household Size | # Housing Units | % Housing Units |
| 1-Person Household | 11,046 | 26.7% |
| 2-Person Household | 14,393 | 34.8% |
| 3-Person Household | 6,893 | 16.7% |
| 4+ Person Household | 9,008 | 21.8% |
| Total Housing Units | 41,340 | 100.0% |
Occupancy by Ownership by Household Size in Bradley County
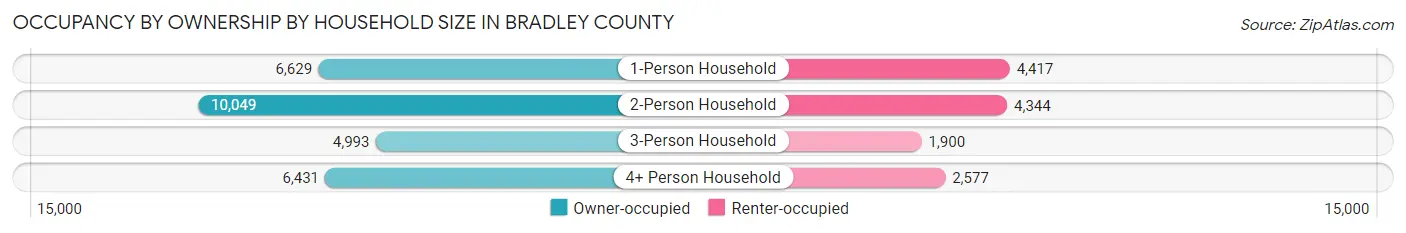
| Household Size | Owner-occupied | Renter-occupied |
| 1-Person Household | 6,629 (60.0%) | 4,417 (40.0%) |
| 2-Person Household | 10,049 (69.8%) | 4,344 (30.2%) |
| 3-Person Household | 4,993 (72.4%) | 1,900 (27.6%) |
| 4+ Person Household | 6,431 (71.4%) | 2,577 (28.6%) |
| Total Housing Units | 28,102 (68.0%) | 13,238 (32.0%) |
Occupancy by Educational Attainment in Bradley County
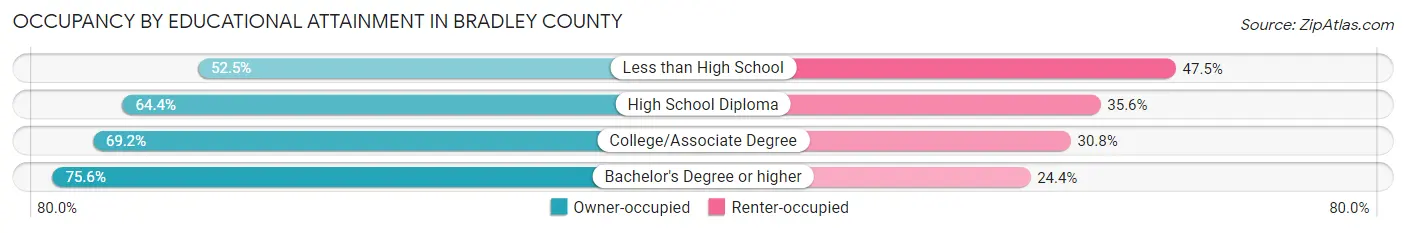
| Household Size | Owner-occupied | Renter-occupied |
| Less than High School | 2,152 (52.5%) | 1,947 (47.5%) |
| High School Diploma | 7,153 (64.4%) | 3,947 (35.6%) |
| College/Associate Degree | 10,361 (69.2%) | 4,617 (30.8%) |
| Bachelor's Degree or higher | 8,436 (75.6%) | 2,727 (24.4%) |
Occupancy by Age of Householder in Bradley County
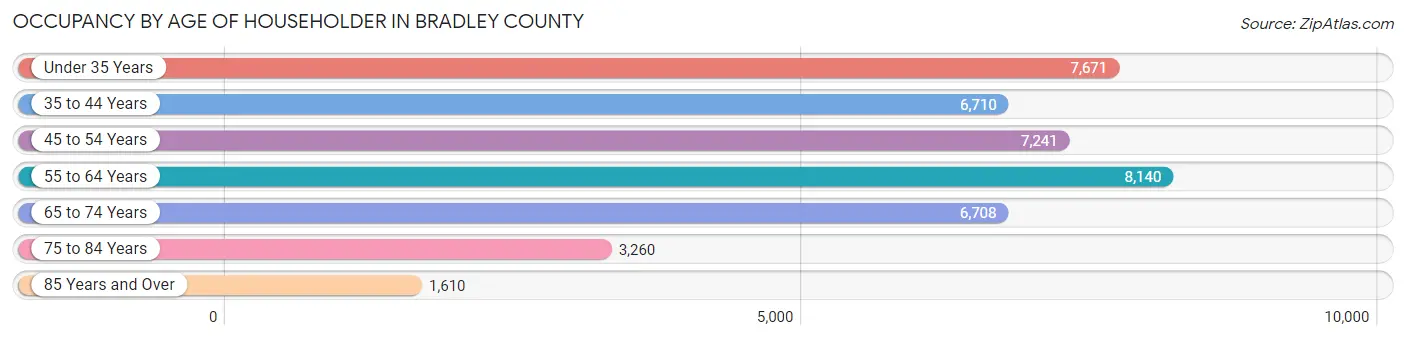
| Age Bracket | # Households | % Households |
| Under 35 Years | 7,671 | 18.6% |
| 35 to 44 Years | 6,710 | 16.2% |
| 45 to 54 Years | 7,241 | 17.5% |
| 55 to 64 Years | 8,140 | 19.7% |
| 65 to 74 Years | 6,708 | 16.2% |
| 75 to 84 Years | 3,260 | 7.9% |
| 85 Years and Over | 1,610 | 3.9% |
| Total | 41,340 | 100.0% |
Housing Finances in Bradley County
Median Income by Occupancy in Bradley County
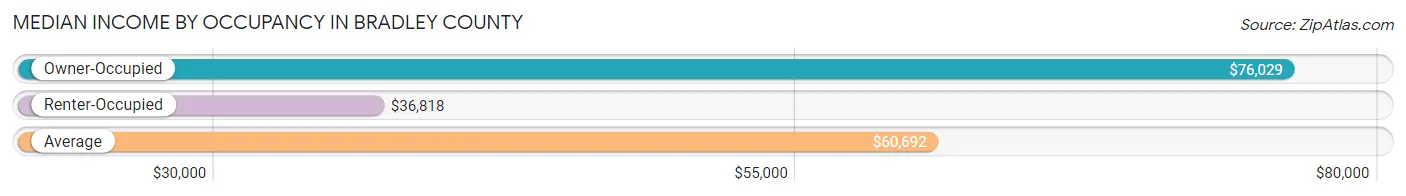
| Occupancy Type | # Households | Median Income |
| Owner-Occupied | 28,102 (68.0%) | $76,029 |
| Renter-Occupied | 13,238 (32.0%) | $36,818 |
| Average | 41,340 (100.0%) | $60,692 |
Occupancy by Householder Income Bracket in Bradley County
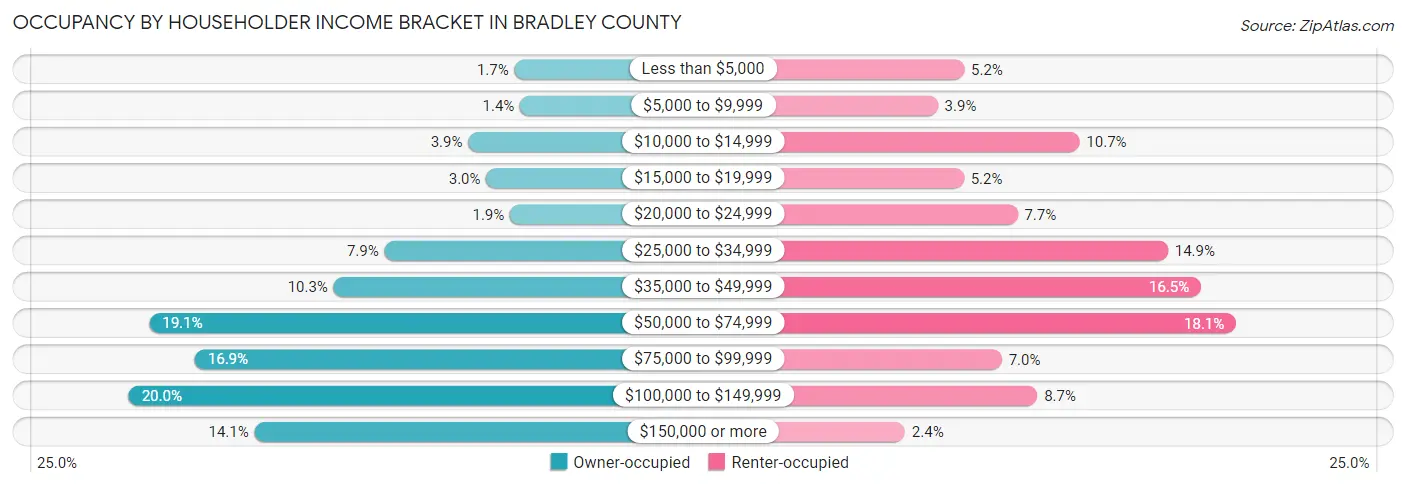
| Income Bracket | Owner-occupied | Renter-occupied |
| Less than $5,000 | 468 (1.7%) | 684 (5.2%) |
| $5,000 to $9,999 | 393 (1.4%) | 518 (3.9%) |
| $10,000 to $14,999 | 1,087 (3.9%) | 1,411 (10.7%) |
| $15,000 to $19,999 | 847 (3.0%) | 682 (5.1%) |
| $20,000 to $24,999 | 528 (1.9%) | 1,020 (7.7%) |
| $25,000 to $34,999 | 2,208 (7.9%) | 1,968 (14.9%) |
| $35,000 to $49,999 | 2,889 (10.3%) | 2,178 (16.5%) |
| $50,000 to $74,999 | 5,356 (19.1%) | 2,399 (18.1%) |
| $75,000 to $99,999 | 4,746 (16.9%) | 922 (7.0%) |
| $100,000 to $149,999 | 5,632 (20.0%) | 1,145 (8.6%) |
| $150,000 or more | 3,948 (14.1%) | 311 (2.4%) |
| Total | 28,102 (100.0%) | 13,238 (100.0%) |
Monthly Housing Cost Tiers in Bradley County
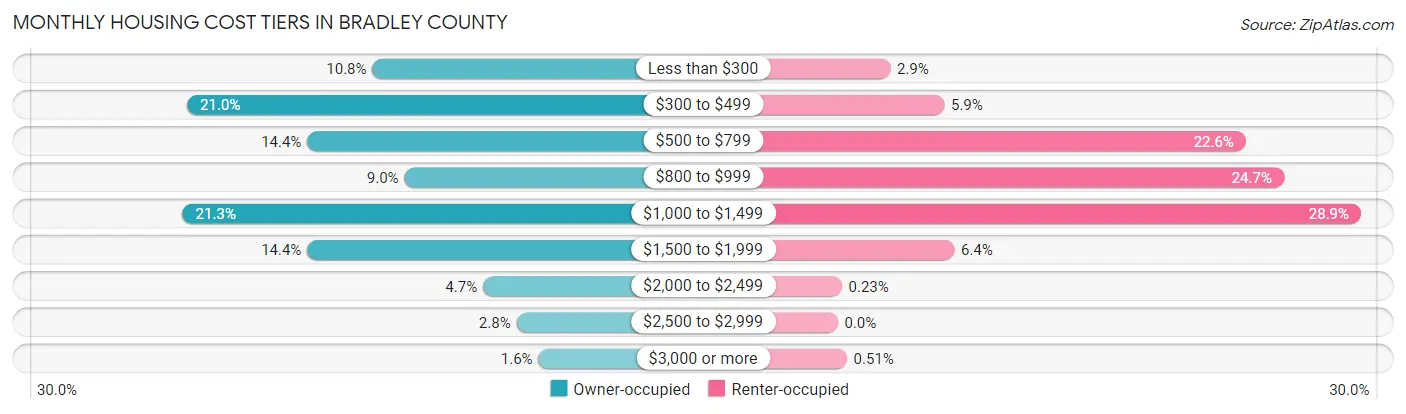
| Monthly Cost | Owner-occupied | Renter-occupied |
| Less than $300 | 3,031 (10.8%) | 384 (2.9%) |
| $300 to $499 | 5,906 (21.0%) | 780 (5.9%) |
| $500 to $799 | 4,044 (14.4%) | 2,985 (22.6%) |
| $800 to $999 | 2,534 (9.0%) | 3,263 (24.6%) |
| $1,000 to $1,499 | 5,978 (21.3%) | 3,827 (28.9%) |
| $1,500 to $1,999 | 4,043 (14.4%) | 853 (6.4%) |
| $2,000 to $2,499 | 1,315 (4.7%) | 30 (0.2%) |
| $2,500 to $2,999 | 796 (2.8%) | 0 (0.0%) |
| $3,000 or more | 455 (1.6%) | 67 (0.5%) |
| Total | 28,102 (100.0%) | 13,238 (100.0%) |
Physical Housing Characteristics in Bradley County
Housing Structures in Bradley County
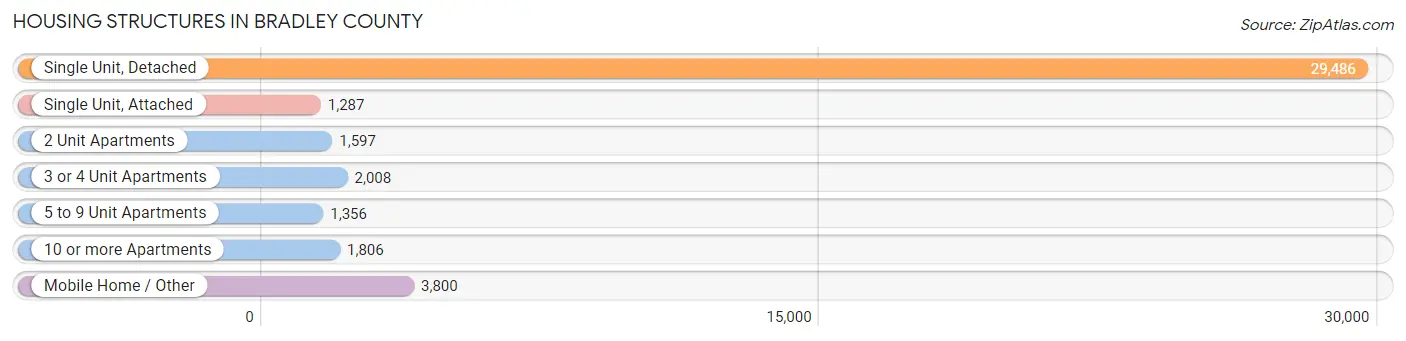
| Structure Type | # Housing Units | % Housing Units |
| Single Unit, Detached | 29,486 | 71.3% |
| Single Unit, Attached | 1,287 | 3.1% |
| 2 Unit Apartments | 1,597 | 3.9% |
| 3 or 4 Unit Apartments | 2,008 | 4.9% |
| 5 to 9 Unit Apartments | 1,356 | 3.3% |
| 10 or more Apartments | 1,806 | 4.4% |
| Mobile Home / Other | 3,800 | 9.2% |
| Total | 41,340 | 100.0% |
Housing Structures by Occupancy in Bradley County
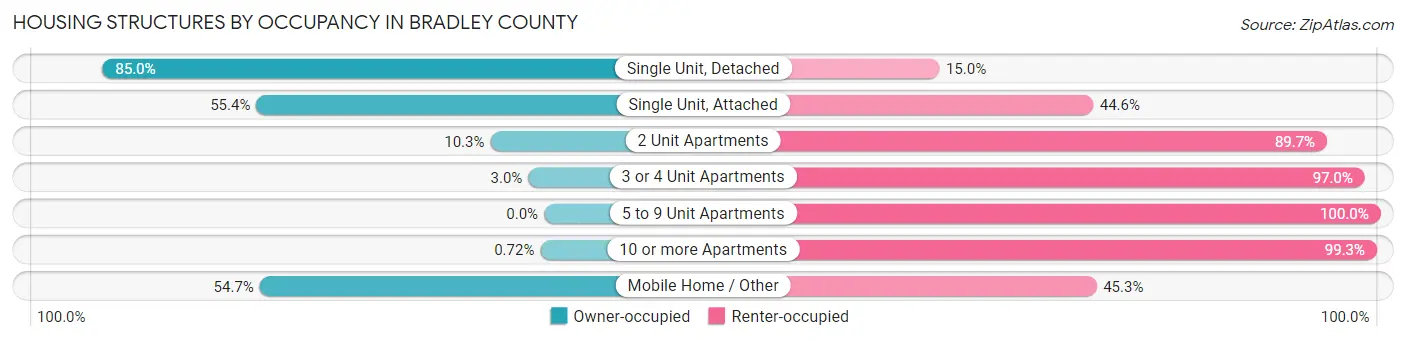
| Structure Type | Owner-occupied | Renter-occupied |
| Single Unit, Detached | 25,070 (85.0%) | 4,416 (15.0%) |
| Single Unit, Attached | 713 (55.4%) | 574 (44.6%) |
| 2 Unit Apartments | 165 (10.3%) | 1,432 (89.7%) |
| 3 or 4 Unit Apartments | 61 (3.0%) | 1,947 (97.0%) |
| 5 to 9 Unit Apartments | 0 (0.0%) | 1,356 (100.0%) |
| 10 or more Apartments | 13 (0.7%) | 1,793 (99.3%) |
| Mobile Home / Other | 2,080 (54.7%) | 1,720 (45.3%) |
| Total | 28,102 (68.0%) | 13,238 (32.0%) |
Housing Structures by Number of Rooms in Bradley County

| Number of Rooms | Owner-occupied | Renter-occupied |
| 1 Room | 42 (0.2%) | 175 (1.3%) |
| 2 or 3 Rooms | 411 (1.5%) | 2,910 (22.0%) |
| 4 or 5 Rooms | 8,049 (28.6%) | 7,009 (52.9%) |
| 6 or 7 Rooms | 11,125 (39.6%) | 2,407 (18.2%) |
| 8 or more Rooms | 8,475 (30.2%) | 737 (5.6%) |
| Total | 28,102 (100.0%) | 13,238 (100.0%) |
Housing Structure by Heating Type in Bradley County
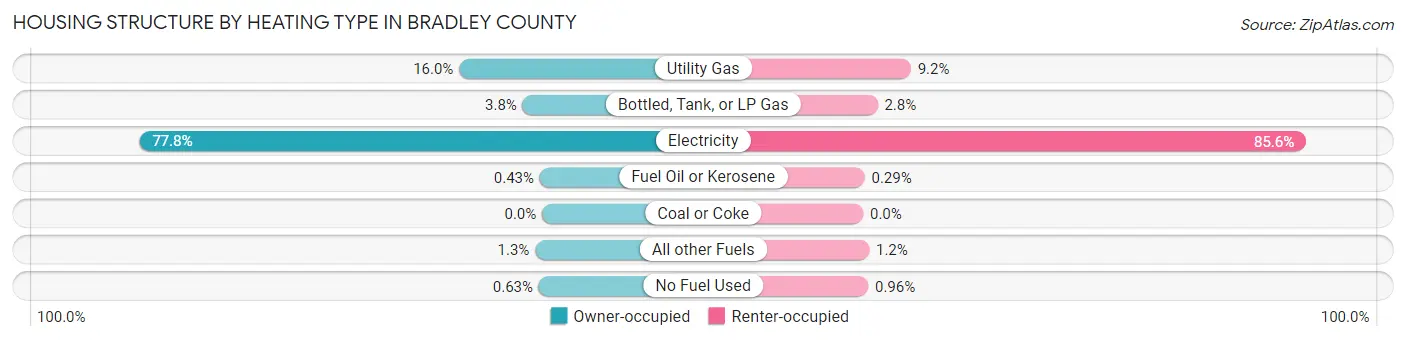
| Heating Type | Owner-occupied | Renter-occupied |
| Utility Gas | 4,502 (16.0%) | 1,219 (9.2%) |
| Bottled, Tank, or LP Gas | 1,053 (3.7%) | 368 (2.8%) |
| Electricity | 21,874 (77.8%) | 11,332 (85.6%) |
| Fuel Oil or Kerosene | 122 (0.4%) | 38 (0.3%) |
| Coal or Coke | 0 (0.0%) | 0 (0.0%) |
| All other Fuels | 374 (1.3%) | 154 (1.2%) |
| No Fuel Used | 177 (0.6%) | 127 (1.0%) |
| Total | 28,102 (100.0%) | 13,238 (100.0%) |
Household Vehicle Usage in Bradley County
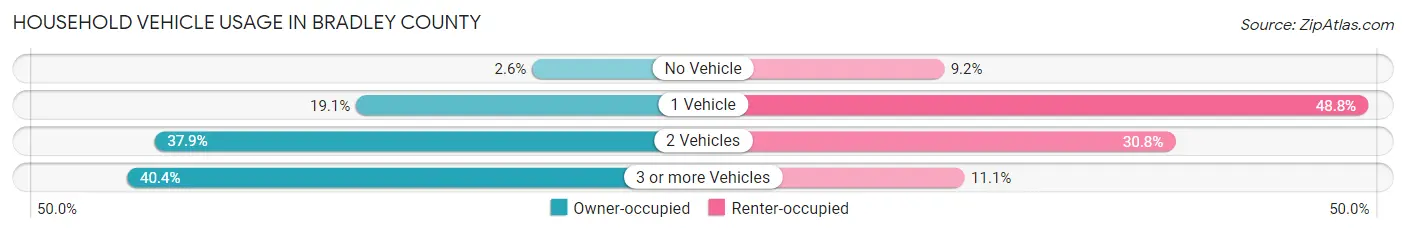
| Vehicles per Household | Owner-occupied | Renter-occupied |
| No Vehicle | 736 (2.6%) | 1,221 (9.2%) |
| 1 Vehicle | 5,356 (19.1%) | 6,463 (48.8%) |
| 2 Vehicles | 10,648 (37.9%) | 4,080 (30.8%) |
| 3 or more Vehicles | 11,362 (40.4%) | 1,474 (11.1%) |
| Total | 28,102 (100.0%) | 13,238 (100.0%) |
Real Estate & Mortgages in Bradley County
Real Estate and Mortgage Overview in Bradley County
| Characteristic | Without Mortgage | With Mortgage |
| Housing Units | 12,300 | 15,802 |
| Median Property Value | $188,900 | $229,500 |
| Median Household Income | $53,852 | $2,846 |
| Monthly Housing Costs | $394 | $416 |
| Real Estate Taxes | $970 | $551 |
Property Value by Mortgage Status in Bradley County
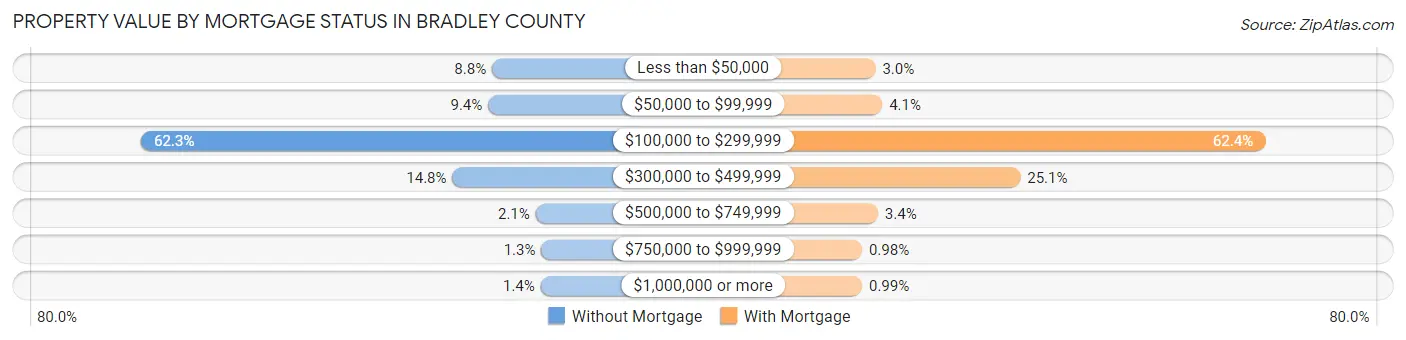
| Property Value | Without Mortgage | With Mortgage |
| Less than $50,000 | 1,080 (8.8%) | 481 (3.0%) |
| $50,000 to $99,999 | 1,153 (9.4%) | 642 (4.1%) |
| $100,000 to $299,999 | 7,658 (62.3%) | 9,862 (62.4%) |
| $300,000 to $499,999 | 1,823 (14.8%) | 3,966 (25.1%) |
| $500,000 to $749,999 | 262 (2.1%) | 539 (3.4%) |
| $750,000 to $999,999 | 156 (1.3%) | 155 (1.0%) |
| $1,000,000 or more | 168 (1.4%) | 157 (1.0%) |
| Total | 12,300 (100.0%) | 15,802 (100.0%) |
Household Income by Mortgage Status in Bradley County

| Household Income | Without Mortgage | With Mortgage |
| Less than $10,000 | 528 (4.3%) | 253 (1.6%) |
| $10,000 to $24,999 | 1,896 (15.4%) | 333 (2.1%) |
| $25,000 to $34,999 | 1,346 (10.9%) | 566 (3.6%) |
| $35,000 to $49,999 | 1,797 (14.6%) | 862 (5.5%) |
| $50,000 to $74,999 | 2,442 (19.9%) | 1,092 (6.9%) |
| $75,000 to $99,999 | 1,557 (12.7%) | 2,914 (18.4%) |
| $100,000 to $149,999 | 1,632 (13.3%) | 3,189 (20.2%) |
| $150,000 or more | 1,102 (9.0%) | 4,000 (25.3%) |
| Total | 12,300 (100.0%) | 15,802 (100.0%) |
Property Value to Household Income Ratio in Bradley County
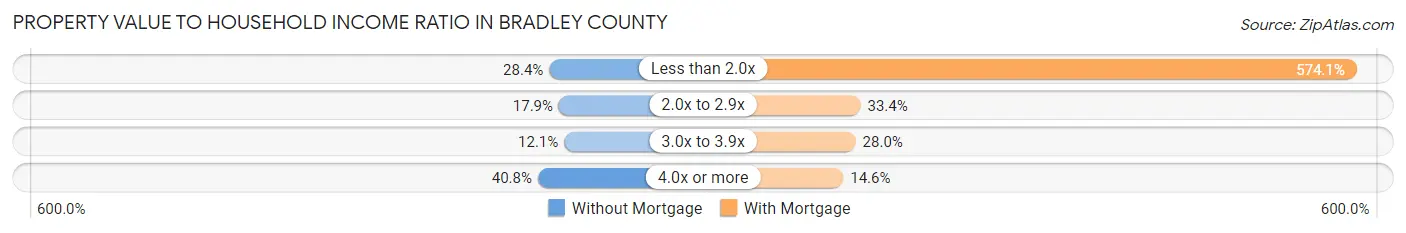
| Value-to-Income Ratio | Without Mortgage | With Mortgage |
| Less than 2.0x | 3,494 (28.4%) | 90,713 (574.1%) |
| 2.0x to 2.9x | 2,195 (17.8%) | 5,276 (33.4%) |
| 3.0x to 3.9x | 1,490 (12.1%) | 4,430 (28.0%) |
| 4.0x or more | 5,021 (40.8%) | 2,303 (14.6%) |
| Total | 12,300 (100.0%) | 15,802 (100.0%) |
Real Estate Taxes by Mortgage Status in Bradley County

| Property Taxes | Without Mortgage | With Mortgage |
| Less than $800 | 4,334 (35.2%) | 20 (0.1%) |
| $800 to $1,499 | 4,352 (35.4%) | 3,481 (22.0%) |
| $800 to $1,499 | 2,969 (24.1%) | 6,858 (43.4%) |
| Total | 12,300 (100.0%) | 15,802 (100.0%) |
Health & Disability in Bradley County
Health Insurance Coverage by Age in Bradley County
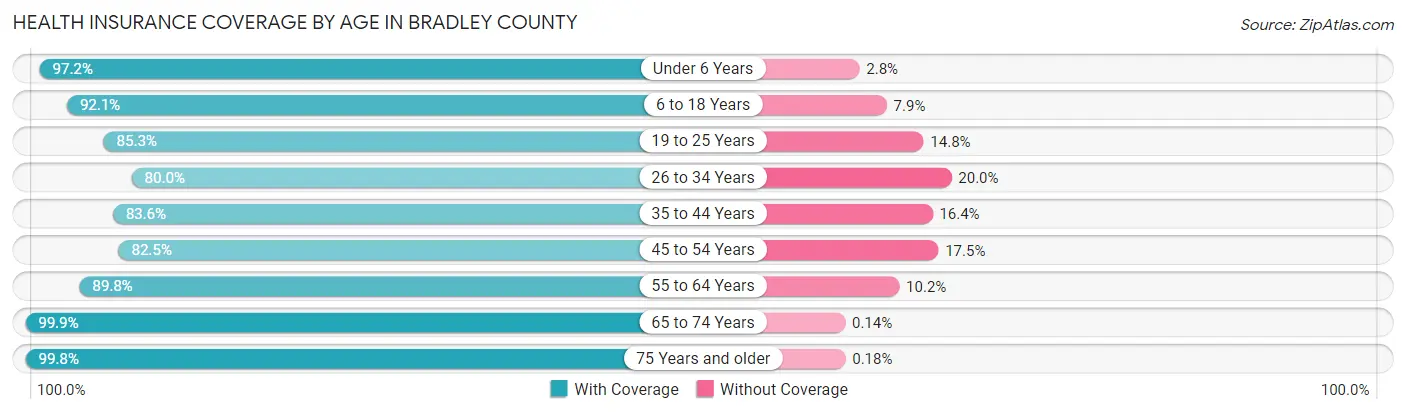
| Age Bracket | With Coverage | Without Coverage |
| Under 6 Years | 7,150 (97.2%) | 207 (2.8%) |
| 6 to 18 Years | 16,352 (92.1%) | 1,403 (7.9%) |
| 19 to 25 Years | 8,923 (85.3%) | 1,544 (14.7%) |
| 26 to 34 Years | 9,739 (80.0%) | 2,430 (20.0%) |
| 35 to 44 Years | 10,960 (83.6%) | 2,157 (16.4%) |
| 45 to 54 Years | 11,872 (82.5%) | 2,522 (17.5%) |
| 55 to 64 Years | 12,877 (89.8%) | 1,467 (10.2%) |
| 65 to 74 Years | 10,835 (99.9%) | 15 (0.1%) |
| 75 Years and older | 7,367 (99.8%) | 13 (0.2%) |
| Total | 96,075 (89.1%) | 11,758 (10.9%) |
Health Insurance Coverage by Citizenship Status in Bradley County
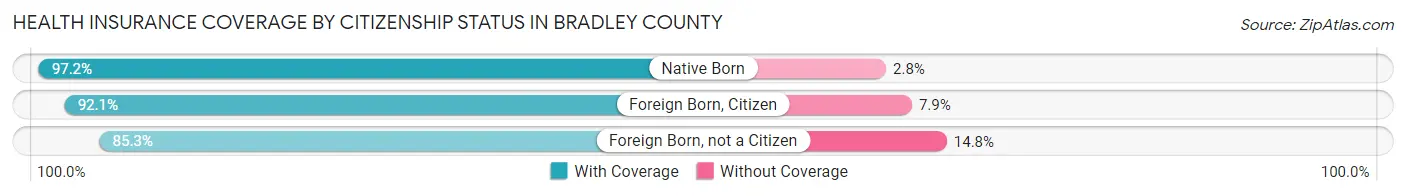
| Citizenship Status | With Coverage | Without Coverage |
| Native Born | 7,150 (97.2%) | 207 (2.8%) |
| Foreign Born, Citizen | 16,352 (92.1%) | 1,403 (7.9%) |
| Foreign Born, not a Citizen | 8,923 (85.3%) | 1,544 (14.7%) |
Health Insurance Coverage by Household Income in Bradley County
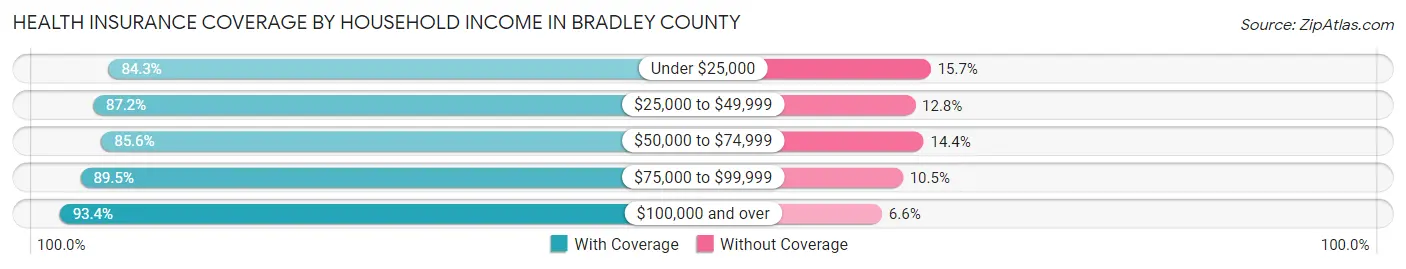
| Household Income | With Coverage | Without Coverage |
| Under $25,000 | 11,330 (84.3%) | 2,114 (15.7%) |
| $25,000 to $49,999 | 16,660 (87.2%) | 2,446 (12.8%) |
| $50,000 to $74,999 | 16,991 (85.6%) | 2,854 (14.4%) |
| $75,000 to $99,999 | 14,789 (89.5%) | 1,731 (10.5%) |
| $100,000 and over | 34,301 (93.4%) | 2,416 (6.6%) |
Public vs Private Health Insurance Coverage by Age in Bradley County
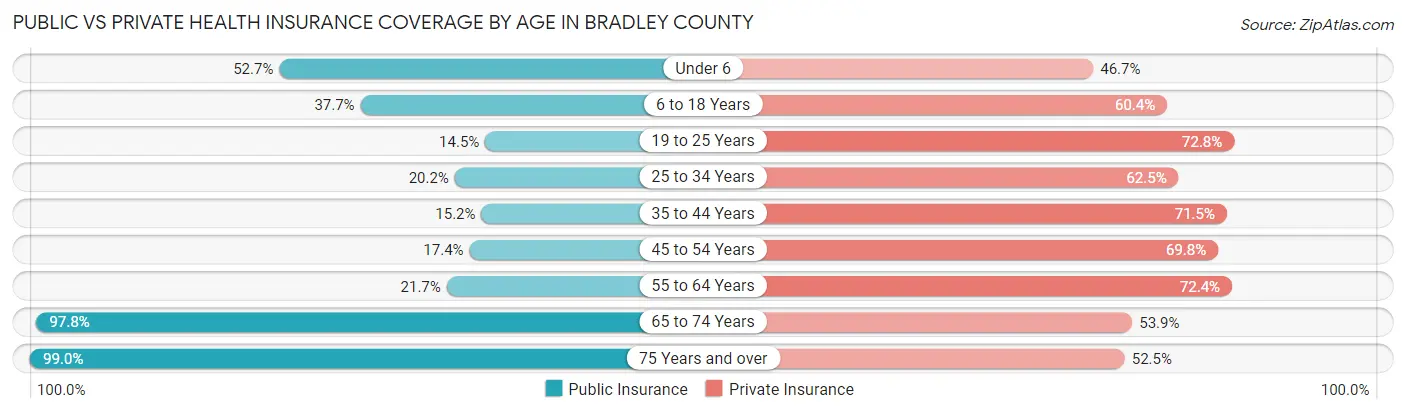
| Age Bracket | Public Insurance | Private Insurance |
| Under 6 | 3,880 (52.7%) | 3,435 (46.7%) |
| 6 to 18 Years | 6,687 (37.7%) | 10,719 (60.4%) |
| 19 to 25 Years | 1,519 (14.5%) | 7,621 (72.8%) |
| 25 to 34 Years | 2,455 (20.2%) | 7,604 (62.5%) |
| 35 to 44 Years | 1,997 (15.2%) | 9,373 (71.5%) |
| 45 to 54 Years | 2,510 (17.4%) | 10,051 (69.8%) |
| 55 to 64 Years | 3,108 (21.7%) | 10,386 (72.4%) |
| 65 to 74 Years | 10,611 (97.8%) | 5,850 (53.9%) |
| 75 Years and over | 7,305 (99.0%) | 3,877 (52.5%) |
| Total | 40,072 (37.2%) | 68,916 (63.9%) |
Disability Status by Sex by Age in Bradley County
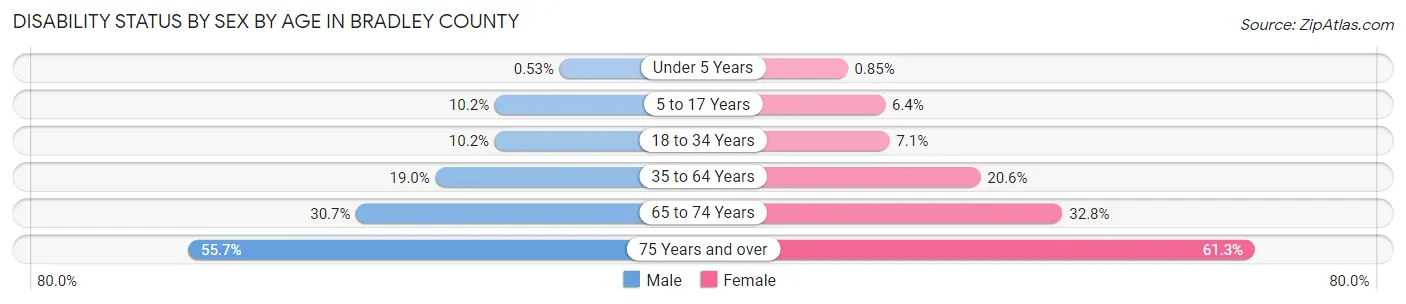
| Age Bracket | Male | Female |
| Under 5 Years | 16 (0.5%) | 26 (0.9%) |
| 5 to 17 Years | 909 (10.2%) | 550 (6.4%) |
| 18 to 34 Years | 1,211 (10.2%) | 866 (7.1%) |
| 35 to 64 Years | 3,930 (19.0%) | 4,351 (20.6%) |
| 65 to 74 Years | 1,535 (30.7%) | 1,918 (32.8%) |
| 75 Years and over | 1,650 (55.7%) | 2,710 (61.3%) |
Disability Class by Sex by Age in Bradley County
Disability Class: Hearing Difficulty

| Age Bracket | Male | Female |
| Under 5 Years | 0 (0.0%) | 4 (0.1%) |
| 5 to 17 Years | 58 (0.6%) | 0 (0.0%) |
| 18 to 34 Years | 200 (1.7%) | 23 (0.2%) |
| 35 to 64 Years | 933 (4.5%) | 945 (4.5%) |
| 65 to 74 Years | 836 (16.7%) | 329 (5.6%) |
| 75 Years and over | 941 (31.8%) | 1,009 (22.8%) |
Disability Class: Vision Difficulty
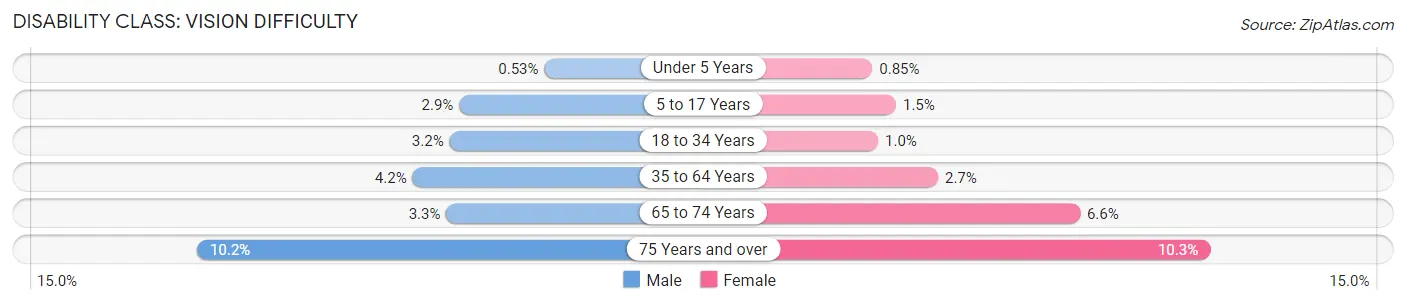
| Age Bracket | Male | Female |
| Under 5 Years | 16 (0.5%) | 26 (0.9%) |
| 5 to 17 Years | 260 (2.9%) | 129 (1.5%) |
| 18 to 34 Years | 378 (3.2%) | 124 (1.0%) |
| 35 to 64 Years | 870 (4.2%) | 567 (2.7%) |
| 65 to 74 Years | 163 (3.3%) | 388 (6.6%) |
| 75 Years and over | 302 (10.2%) | 453 (10.2%) |
Disability Class: Cognitive Difficulty
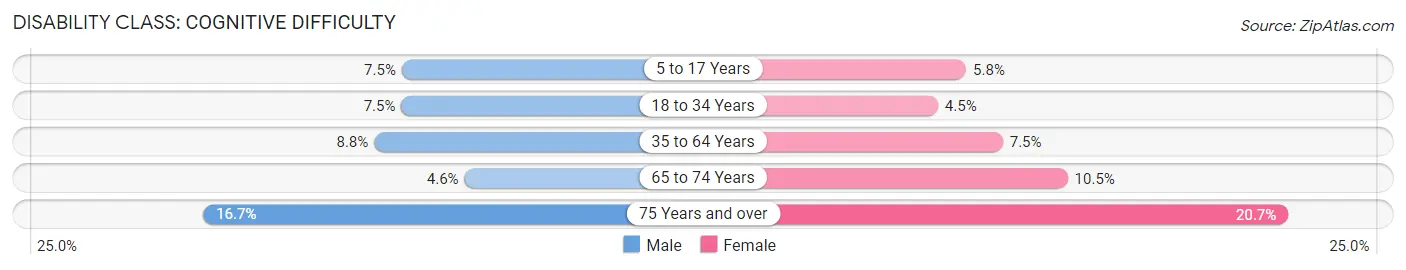
| Age Bracket | Male | Female |
| 5 to 17 Years | 672 (7.5%) | 494 (5.8%) |
| 18 to 34 Years | 896 (7.5%) | 547 (4.5%) |
| 35 to 64 Years | 1,819 (8.8%) | 1,578 (7.5%) |
| 65 to 74 Years | 229 (4.6%) | 614 (10.5%) |
| 75 Years and over | 495 (16.7%) | 915 (20.7%) |
Disability Class: Ambulatory Difficulty
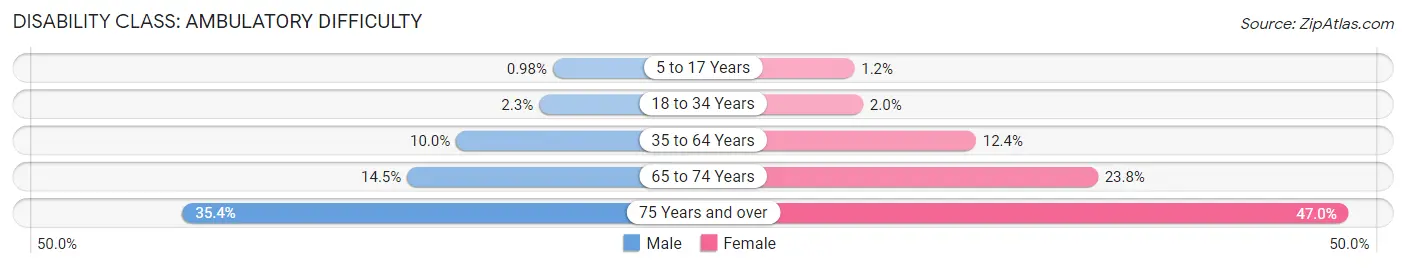
| Age Bracket | Male | Female |
| 5 to 17 Years | 88 (1.0%) | 99 (1.2%) |
| 18 to 34 Years | 269 (2.3%) | 240 (2.0%) |
| 35 to 64 Years | 2,063 (10.0%) | 2,630 (12.4%) |
| 65 to 74 Years | 724 (14.5%) | 1,391 (23.7%) |
| 75 Years and over | 1,047 (35.3%) | 2,078 (47.0%) |
Disability Class: Self-Care Difficulty
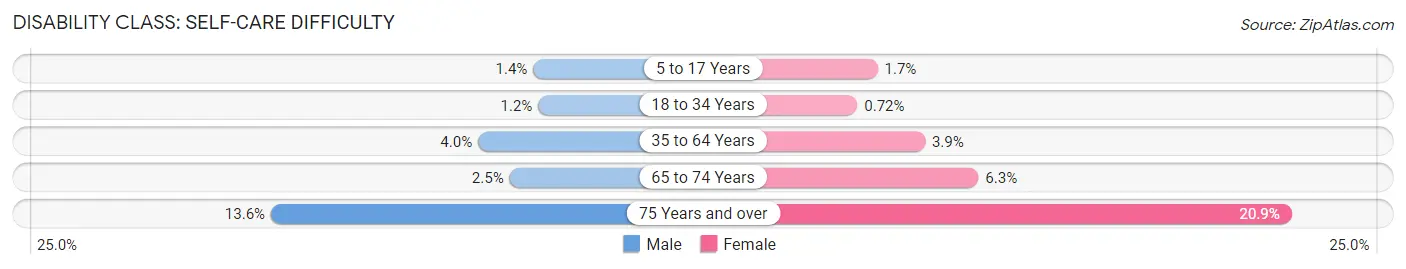
| Age Bracket | Male | Female |
| 5 to 17 Years | 125 (1.4%) | 142 (1.7%) |
| 18 to 34 Years | 140 (1.2%) | 88 (0.7%) |
| 35 to 64 Years | 821 (4.0%) | 815 (3.9%) |
| 65 to 74 Years | 125 (2.5%) | 371 (6.3%) |
| 75 Years and over | 402 (13.6%) | 922 (20.9%) |
Technology Access in Bradley County
Computing Device Access in Bradley County
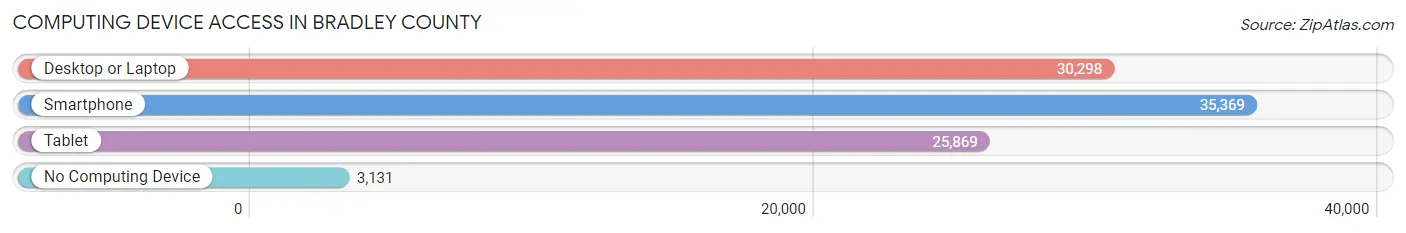
| Device Type | # Households | % Households |
| Desktop or Laptop | 30,298 | 73.3% |
| Smartphone | 35,369 | 85.6% |
| Tablet | 25,869 | 62.6% |
| No Computing Device | 3,131 | 7.6% |
| Total | 41,340 | 100.0% |
Internet Access in Bradley County
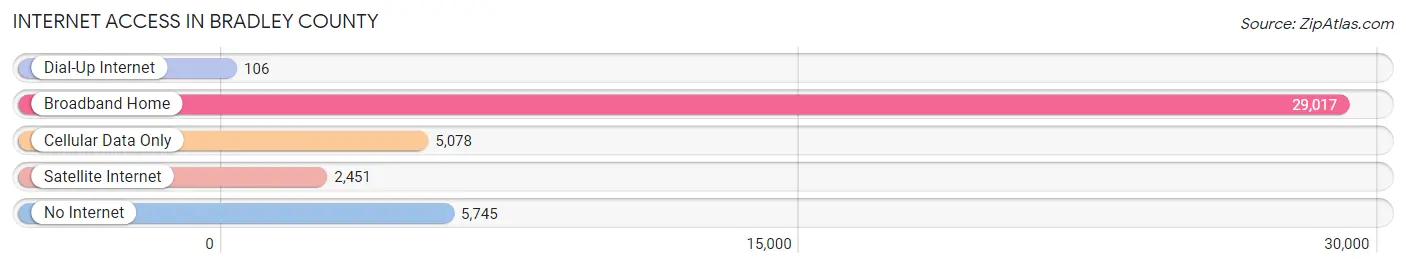
| Internet Type | # Households | % Households |
| Dial-Up Internet | 106 | 0.3% |
| Broadband Home | 29,017 | 70.2% |
| Cellular Data Only | 5,078 | 12.3% |
| Satellite Internet | 2,451 | 5.9% |
| No Internet | 5,745 | 13.9% |
| Total | 41,340 | 100.0% |
Bradley County Summary
Bradley County is located in the southeastern corner of Tennessee, and is part of the Chattanooga metropolitan area. It is bordered by Hamilton County to the north, Polk County to the east, McMinn County to the south, and Meigs County to the west. The county seat is Cleveland, and the largest city is Charleston.
History
The area that is now Bradley County was originally inhabited by the Cherokee and Creek Native American tribes. The first European settlers arrived in the area in the late 1700s, and the county was officially established in 1836. It was named after Colonel Edward Bradley, who was a veteran of the War of 1812.
During the Civil War, Bradley County was a major site of the Battle of Chickamauga, which was fought in 1863. The county was also the site of the Battle of Cleveland, which was fought in 1863.
In the late 1800s, the county experienced a period of rapid growth and development. The railroad was extended into the area, and several new towns were established. The county also experienced a boom in the timber industry, and several new sawmills were built.
Geography
Bradley County covers an area of 545 square miles, and is located in the Appalachian Mountains. The terrain is mostly hilly, with elevations ranging from 800 to 1,800 feet above sea level. The county is drained by the Hiwassee River, which flows through the western part of the county.
The county is home to several state parks, including the Cherokee National Forest, which covers over 600,000 acres. The county also contains several lakes, including Lake Ocoee, which is the largest lake in the county.
Economy
The economy of Bradley County is largely based on manufacturing and agriculture. The county is home to several large manufacturing companies, including Whirlpool Corporation, which has a major plant in Cleveland. The county is also home to several large agricultural operations, including poultry farms and dairy farms.
The county is also home to several tourist attractions, including the Ocoee Whitewater Center, which is a popular destination for whitewater rafting. The county is also home to several wineries, which attract visitors from all over the region.
Demographics
As of the 2010 census, Bradley County had a population of 98,963. The racial makeup of the county was 87.3% White, 8.2% African American, 0.7% Native American, 0.7% Asian, 0.1% Pacific Islander, 1.3% from other races, and 1.9% from two or more races. Hispanic or Latino of any race were 3.2% of the population.
The median income for a household in the county was $41,945, and the median income for a family was $50,945. The per capita income for the county was $21,845. About 11.2% of families and 14.3% of the population were below the poverty line, including 19.2% of those under age 18 and 11.2% of those age 65 or over.
Common Questions
What is the Total Population of Bradley County?
Total Population of Bradley County is 108,859.
What is the Total Male Population of Bradley County?
Total Male Population of Bradley County is 53,175.
What is the Total Female Population of Bradley County?
Total Female Population of Bradley County is 55,684.
What is the Ratio of Males per 100 Females in Bradley County?
There are 95.49 Males per 100 Females in Bradley County.
What is the Ratio of Females per 100 Males in Bradley County?
There are 104.72 Females per 100 Males in Bradley County.
What is the Median Population Age in Bradley County?
Median Population Age in Bradley County is 39.9 Years.
What is the Average Family Size in Bradley County
Average Family Size in Bradley County is 3.1 People.
What is the Average Household Size in Bradley County
Average Household Size in Bradley County is 2.6 People.
What is Per Capita Income in Bradley County?
Per Capita income in Bradley County is $31,121.
What is the Median Family Income in Bradley County?
Median Family Income in Bradley County is $75,270.
What is the Median Household income in Bradley County?
Median Household Income in Bradley County is $60,692.
What is Income or Wage Gap in Bradley County?
Income or Wage Gap in Bradley County is 31.1%.
Women in Bradley County earn 68.9 cents for every dollar earned by a man.
What is Family Income Deficit in Bradley County?
Family Income Deficit in Bradley County is $9,642.
Families that are below poverty line in Bradley County earn $9,642 less on average than the poverty threshold level.
What is Inequality or Gini Index in Bradley County?
Inequality or Gini Index in Bradley County is 0.45.
How Large is the Labor Force in Bradley County?
There are 54,016 People in the Labor Forcein in Bradley County.
What is the Percentage of People in the Labor Force in Bradley County?
61.3% of People are in the Labor Force in Bradley County.
What is the Unemployment Rate in Bradley County?
Unemployment Rate in Bradley County is 5.4%.