Blount County, TN
Blount County Map
Blount County Overview
135,951
TOTAL POPULATION
66,732
MALE POPULATION
69,219
FEMALE POPULATION
96.41
MALES / 100 FEMALES
103.73
FEMALES / 100 MALES
43.8
MEDIAN AGE
3.0
AVG FAMILY SIZE
2.5
AVG HOUSEHOLD SIZE
$36,376
PER CAPITA INCOME
$85,194
AVG FAMILY INCOME
$70,935
AVG HOUSEHOLD INCOME
31.8%
WAGE / INCOME GAP [ % ]
68.2¢/ $1
WAGE / INCOME GAP [ $ ]
$10,308
FAMILY INCOME DEFICIT
0.42
INEQUALITY / GINI INDEX
68,090
LABOR FORCE [ PEOPLE ]
60.5%
PERCENT IN LABOR FORCE
4.1%
UNEMPLOYMENT RATE
Blount County Area Codes
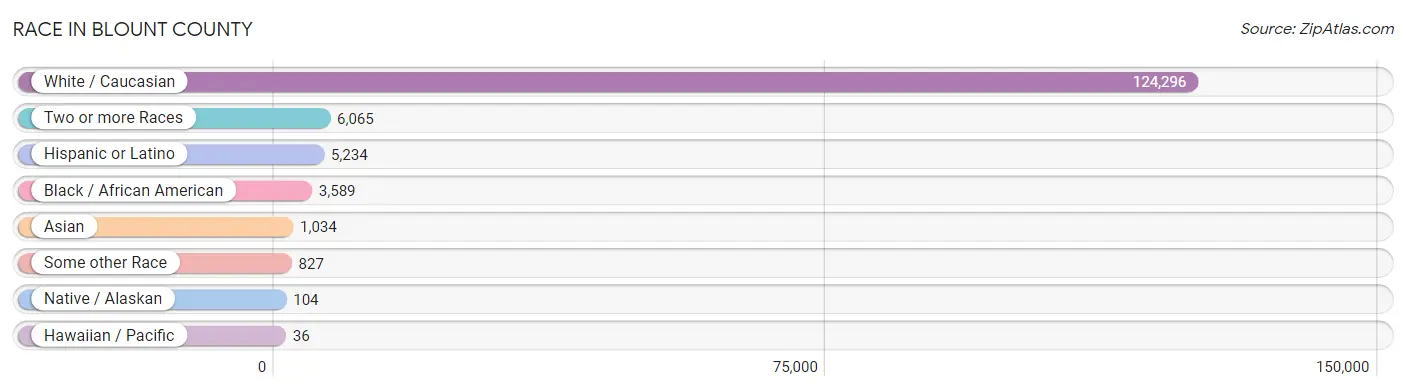
Race in Blount County
The most populous races in Blount County are White / Caucasian (124,296 | 91.4%), Two or more Races (6,065 | 4.5%), and Hispanic or Latino (5,234 | 3.8%).
| Race | # Population | % Population |
| Asian | 1,034 | 0.8% |
| Black / African American | 3,589 | 2.6% |
| Hawaiian / Pacific | 36 | 0.0% |
| Hispanic or Latino | 5,234 | 3.8% |
| Native / Alaskan | 104 | 0.1% |
| White / Caucasian | 124,296 | 91.4% |
| Two or more Races | 6,065 | 4.5% |
| Some other Race | 827 | 0.6% |
| Total | 135,951 | 100.0% |
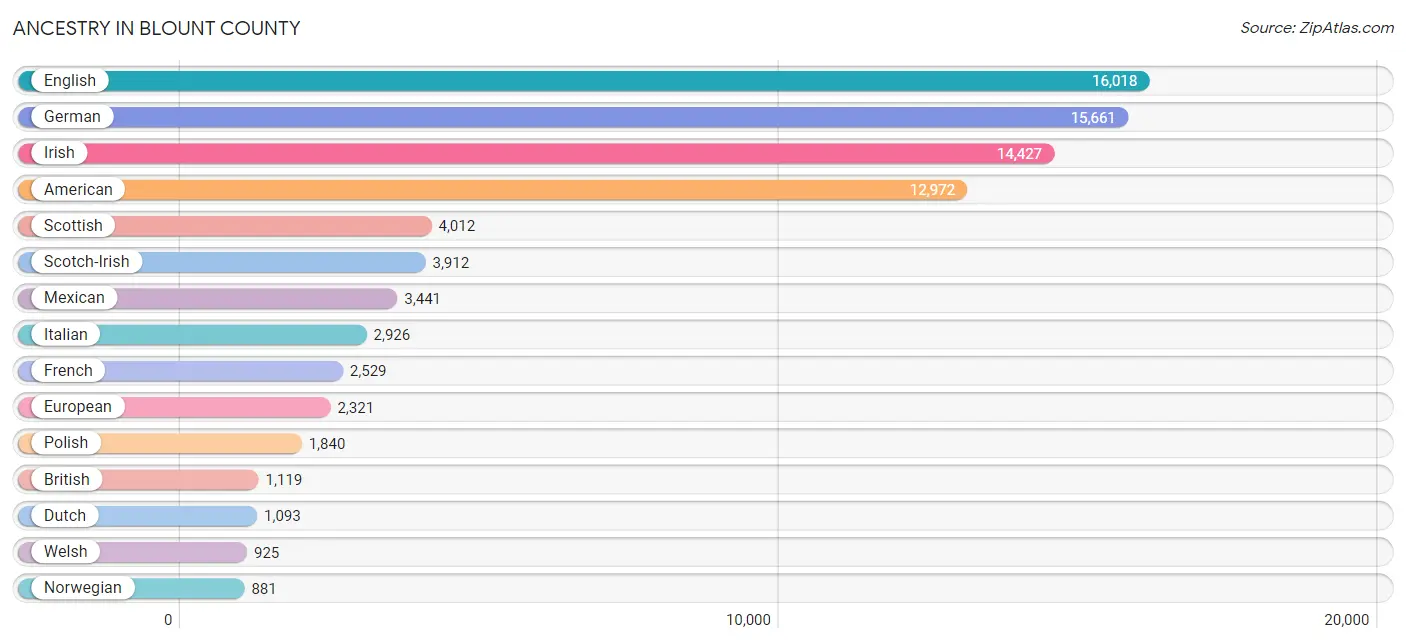
Ancestry in Blount County
The most populous ancestries reported in Blount County are English (16,018 | 11.8%), German (15,661 | 11.5%), Irish (14,427 | 10.6%), American (12,972 | 9.5%), and Scottish (4,012 | 2.9%), together accounting for 46.4% of all Blount County residents.
| Ancestry | # Population | % Population |
| African | 258 | 0.2% |
| Alaskan Athabascan | 25 | 0.0% |
| Albanian | 72 | 0.1% |
| American | 12,972 | 9.5% |
| Apache | 11 | 0.0% |
| Arab | 148 | 0.1% |
| Argentinean | 8 | 0.0% |
| Australian | 16 | 0.0% |
| Austrian | 82 | 0.1% |
| Belgian | 74 | 0.1% |
| Bhutanese | 94 | 0.1% |
| Blackfeet | 11 | 0.0% |
| Brazilian | 82 | 0.1% |
| British | 1,119 | 0.8% |
| Bulgarian | 16 | 0.0% |
| Burmese | 404 | 0.3% |
| Canadian | 89 | 0.1% |
| Cape Verdean | 48 | 0.0% |
| Central American | 701 | 0.5% |
| Central American Indian | 33 | 0.0% |
| Cherokee | 499 | 0.4% |
| Chilean | 15 | 0.0% |
| Chinese | 13 | 0.0% |
| Chippewa | 12 | 0.0% |
| Choctaw | 4 | 0.0% |
| Colombian | 30 | 0.0% |
| Comanche | 16 | 0.0% |
| Crow | 10 | 0.0% |
| Cuban | 145 | 0.1% |
| Czech | 298 | 0.2% |
| Czechoslovakian | 20 | 0.0% |
| Danish | 171 | 0.1% |
| Dutch | 1,093 | 0.8% |
| Dutch West Indian | 55 | 0.0% |
| Eastern European | 205 | 0.2% |
| English | 16,018 | 11.8% |
| Estonian | 9 | 0.0% |
| European | 2,321 | 1.7% |
| Finnish | 109 | 0.1% |
| French | 2,529 | 1.9% |
| French Canadian | 358 | 0.3% |
| German | 15,661 | 11.5% |
| Greek | 401 | 0.3% |
| Guamanian / Chamorro | 36 | 0.0% |
| Guatemalan | 108 | 0.1% |
| Haitian | 23 | 0.0% |
| Honduran | 40 | 0.0% |
| Hungarian | 401 | 0.3% |
| Indian (Asian) | 195 | 0.1% |
| Iranian | 17 | 0.0% |
| Iraqi | 8 | 0.0% |
| Irish | 14,427 | 10.6% |
| Iroquois | 51 | 0.0% |
| Italian | 2,926 | 2.1% |
| Jamaican | 94 | 0.1% |
| Japanese | 106 | 0.1% |
| Jordanian | 15 | 0.0% |
| Korean | 227 | 0.2% |
| Lebanese | 33 | 0.0% |
| Lithuanian | 166 | 0.1% |
| Lumbee | 3 | 0.0% |
| Luxembourger | 82 | 0.1% |
| Malaysian | 241 | 0.2% |
| Maltese | 21 | 0.0% |
| Menominee | 10 | 0.0% |
| Mexican | 3,441 | 2.5% |
| Mexican American Indian | 46 | 0.0% |
| Nicaraguan | 40 | 0.0% |
| Nigerian | 29 | 0.0% |
| Northern European | 96 | 0.1% |
| Norwegian | 881 | 0.6% |
| Pakistani | 47 | 0.0% |
| Palestinian | 76 | 0.1% |
| Pennsylvania German | 29 | 0.0% |
| Peruvian | 64 | 0.1% |
| Polish | 1,840 | 1.3% |
| Portuguese | 112 | 0.1% |
| Puerto Rican | 390 | 0.3% |
| Romanian | 87 | 0.1% |
| Russian | 152 | 0.1% |
| Salvadoran | 513 | 0.4% |
| Samoan | 54 | 0.0% |
| Scandinavian | 137 | 0.1% |
| Scotch-Irish | 3,912 | 2.9% |
| Scottish | 4,012 | 2.9% |
| Serbian | 43 | 0.0% |
| Sioux | 21 | 0.0% |
| Slavic | 81 | 0.1% |
| Slovak | 202 | 0.2% |
| Slovene | 6 | 0.0% |
| South African | 80 | 0.1% |
| South American | 117 | 0.1% |
| Spaniard | 14 | 0.0% |
| Spanish | 80 | 0.1% |
| Sri Lankan | 26 | 0.0% |
| Subsaharan African | 415 | 0.3% |
| Swedish | 731 | 0.5% |
| Swiss | 113 | 0.1% |
| Syrian | 16 | 0.0% |
| Thai | 196 | 0.1% |
| Trinidadian and Tobagonian | 78 | 0.1% |
| Turkish | 23 | 0.0% |
| Ukrainian | 202 | 0.2% |
| Welsh | 925 | 0.7% |
| Yugoslavian | 34 | 0.0% | View All 105 Rows |
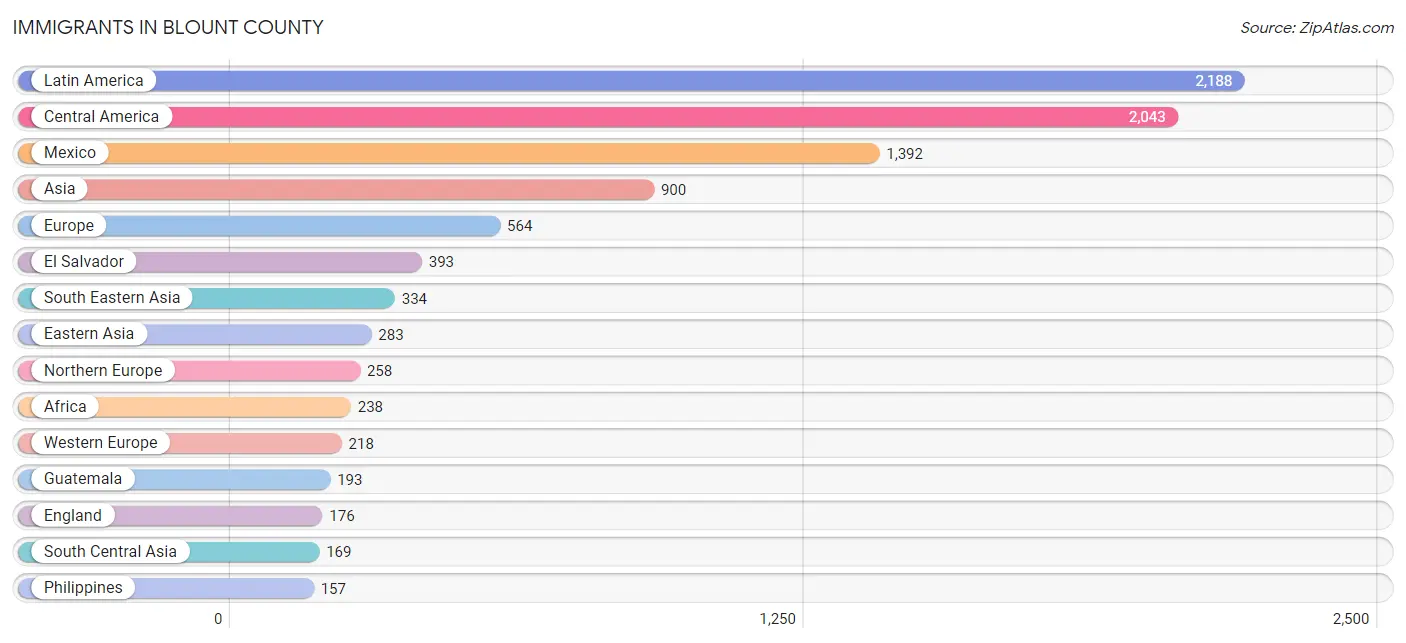
Immigrants in Blount County
The most numerous immigrant groups reported in Blount County came from Latin America (2,188 | 1.6%), Central America (2,043 | 1.5%), Mexico (1,392 | 1.0%), Asia (900 | 0.7%), and Europe (564 | 0.4%), together accounting for 5.2% of all Blount County residents.
| Immigration Origin | # Population | % Population |
| Africa | 238 | 0.2% |
| Asia | 900 | 0.7% |
| Australia | 21 | 0.0% |
| Brazil | 10 | 0.0% |
| Cabo Verde | 27 | 0.0% |
| Canada | 148 | 0.1% |
| Caribbean | 40 | 0.0% |
| Central America | 2,043 | 1.5% |
| Chile | 15 | 0.0% |
| China | 114 | 0.1% |
| Colombia | 30 | 0.0% |
| Cuba | 21 | 0.0% |
| Czechoslovakia | 12 | 0.0% |
| Eastern Africa | 143 | 0.1% |
| Eastern Asia | 283 | 0.2% |
| Eastern Europe | 88 | 0.1% |
| El Salvador | 393 | 0.3% |
| England | 176 | 0.1% |
| Europe | 564 | 0.4% |
| Germany | 136 | 0.1% |
| Guatemala | 193 | 0.1% |
| Honduras | 33 | 0.0% |
| India | 127 | 0.1% |
| Iran | 9 | 0.0% |
| Iraq | 8 | 0.0% |
| Jamaica | 19 | 0.0% |
| Japan | 41 | 0.0% |
| Kenya | 88 | 0.1% |
| Korea | 128 | 0.1% |
| Laos | 69 | 0.1% |
| Latin America | 2,188 | 1.6% |
| Lebanon | 21 | 0.0% |
| Mexico | 1,392 | 1.0% |
| Netherlands | 41 | 0.0% |
| Nicaragua | 32 | 0.0% |
| Northern Europe | 258 | 0.2% |
| Oceania | 21 | 0.0% |
| Pakistan | 33 | 0.0% |
| Peru | 50 | 0.0% |
| Philippines | 157 | 0.1% |
| Poland | 17 | 0.0% |
| Russia | 21 | 0.0% |
| Scotland | 13 | 0.0% |
| South Africa | 68 | 0.1% |
| South America | 105 | 0.1% |
| South Central Asia | 169 | 0.1% |
| South Eastern Asia | 334 | 0.3% |
| Thailand | 104 | 0.1% |
| Turkey | 8 | 0.0% |
| Vietnam | 4 | 0.0% |
| Western Africa | 27 | 0.0% |
| Western Asia | 62 | 0.1% |
| Western Europe | 218 | 0.2% |
| Zimbabwe | 37 | 0.0% | View All 54 Rows |
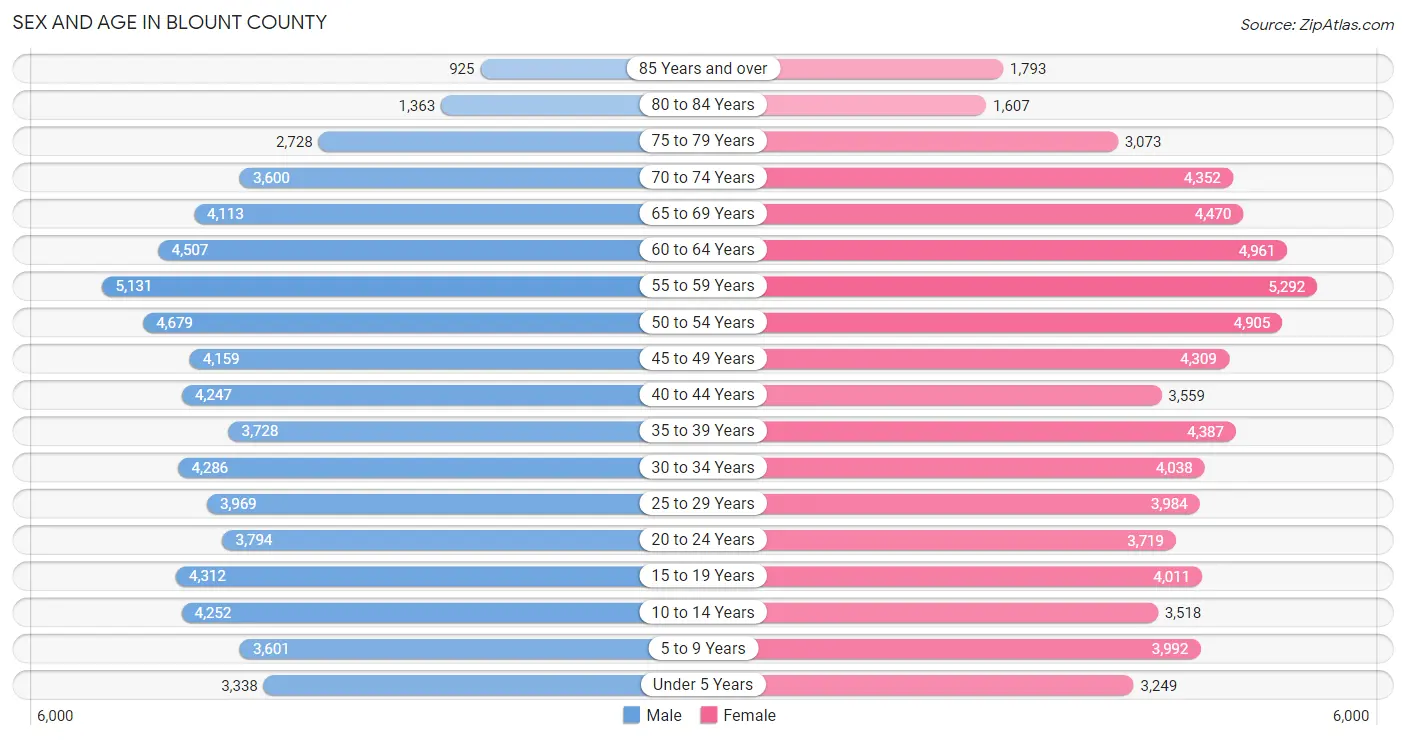
Sex and Age in Blount County
Sex and Age in Blount County
The most populous age groups in Blount County are 55 to 59 Years (5,131 | 7.7%) for men and 55 to 59 Years (5,292 | 7.6%) for women.
| Age Bracket | Male | Female |
| Under 5 Years | 3,338 (5.0%) | 3,249 (4.7%) |
| 5 to 9 Years | 3,601 (5.4%) | 3,992 (5.8%) |
| 10 to 14 Years | 4,252 (6.4%) | 3,518 (5.1%) |
| 15 to 19 Years | 4,312 (6.5%) | 4,011 (5.8%) |
| 20 to 24 Years | 3,794 (5.7%) | 3,719 (5.4%) |
| 25 to 29 Years | 3,969 (5.9%) | 3,984 (5.8%) |
| 30 to 34 Years | 4,286 (6.4%) | 4,038 (5.8%) |
| 35 to 39 Years | 3,728 (5.6%) | 4,387 (6.3%) |
| 40 to 44 Years | 4,247 (6.4%) | 3,559 (5.1%) |
| 45 to 49 Years | 4,159 (6.2%) | 4,309 (6.2%) |
| 50 to 54 Years | 4,679 (7.0%) | 4,905 (7.1%) |
| 55 to 59 Years | 5,131 (7.7%) | 5,292 (7.6%) |
| 60 to 64 Years | 4,507 (6.8%) | 4,961 (7.2%) |
| 65 to 69 Years | 4,113 (6.2%) | 4,470 (6.5%) |
| 70 to 74 Years | 3,600 (5.4%) | 4,352 (6.3%) |
| 75 to 79 Years | 2,728 (4.1%) | 3,073 (4.4%) |
| 80 to 84 Years | 1,363 (2.0%) | 1,607 (2.3%) |
| 85 Years and over | 925 (1.4%) | 1,793 (2.6%) |
| Total | 66,732 (100.0%) | 69,219 (100.0%) |
Families and Households in Blount County
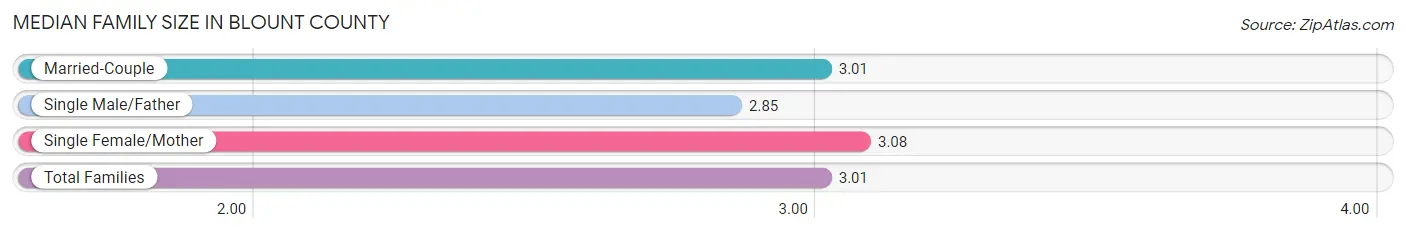
Median Family Size in Blount County
The median family size in Blount County is 3.01 persons per family, with single female/mother families (5,367 | 14.4%) accounting for the largest median family size of 3.08 persons per family. On the other hand, single male/father families (2,297 | 6.2%) represent the smallest median family size with 2.85 persons per family.
| Family Type | # Families | Family Size |
| Married-Couple | 29,567 (79.4%) | 3.01 |
| Single Male/Father | 2,297 (6.2%) | 2.85 |
| Single Female/Mother | 5,367 (14.4%) | 3.08 |
| Total Families | 37,231 (100.0%) | 3.01 |
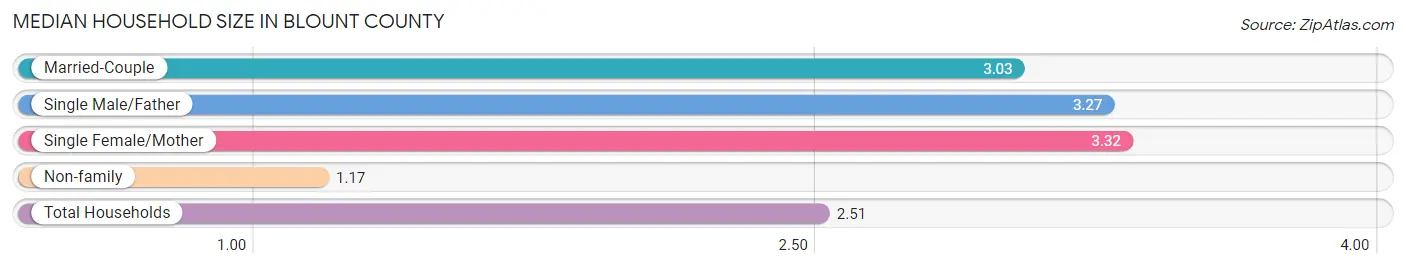
Median Household Size in Blount County
The median household size in Blount County is 2.51 persons per household, with single female/mother households (5,367 | 10.0%) accounting for the largest median household size of 3.32 persons per household. non-family households (16,225 | 30.3%) represent the smallest median household size with 1.17 persons per household.
| Household Type | # Households | Household Size |
| Married-Couple | 29,567 (55.3%) | 3.03 |
| Single Male/Father | 2,297 (4.3%) | 3.27 |
| Single Female/Mother | 5,367 (10.0%) | 3.32 |
| Non-family | 16,225 (30.3%) | 1.17 |
| Total Households | 53,456 (100.0%) | 2.51 |
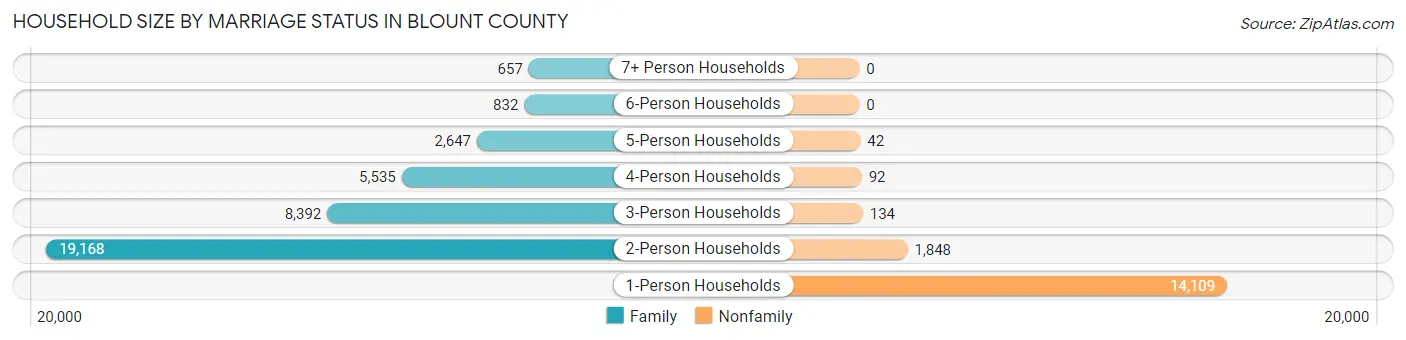
Household Size by Marriage Status in Blount County
Out of a total of 53,456 households in Blount County, 37,231 (69.7%) are family households, while 16,225 (30.3%) are nonfamily households. The most numerous type of family households are 2-person households, comprising 19,168, and the most common type of nonfamily households are 1-person households, comprising 14,109.
| Household Size | Family Households | Nonfamily Households |
| 1-Person Households | - | 14,109 (26.4%) |
| 2-Person Households | 19,168 (35.9%) | 1,848 (3.5%) |
| 3-Person Households | 8,392 (15.7%) | 134 (0.3%) |
| 4-Person Households | 5,535 (10.3%) | 92 (0.2%) |
| 5-Person Households | 2,647 (5.0%) | 42 (0.1%) |
| 6-Person Households | 832 (1.6%) | 0 (0.0%) |
| 7+ Person Households | 657 (1.2%) | 0 (0.0%) |
| Total | 37,231 (69.7%) | 16,225 (30.3%) |
Female Fertility in Blount County
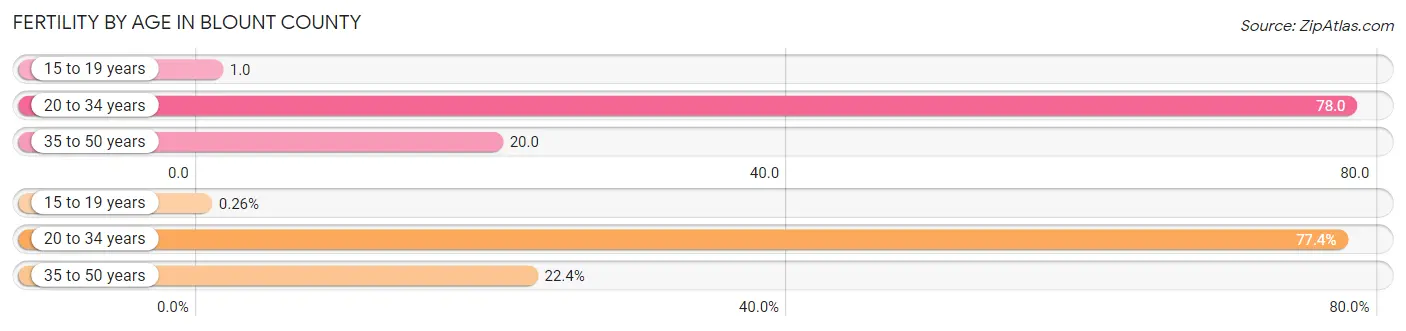
Fertility by Age in Blount County
Average fertility rate in Blount County is 41.0 births per 1,000 women. Women in the age bracket of 20 to 34 years have the highest fertility rate with 78.0 births per 1,000 women. Women in the age bracket of 20 to 34 years acount for 77.4% of all women with births.
| Age Bracket | Women with Births | Births / 1,000 Women |
| 15 to 19 years | 3 (0.3%) | 1.0 |
| 20 to 34 years | 910 (77.4%) | 78.0 |
| 35 to 50 years | 263 (22.4%) | 20.0 |
| Total | 1,176 (100.0%) | 41.0 |
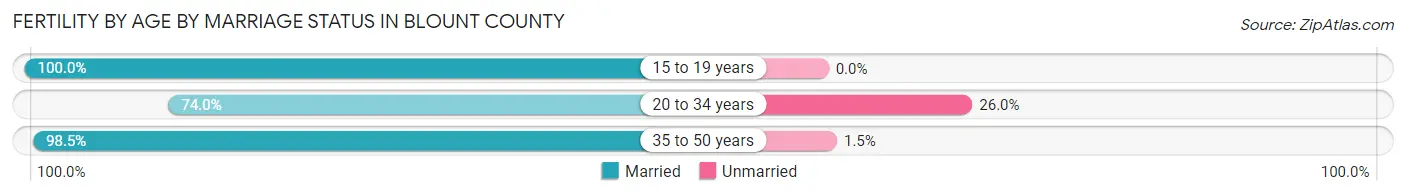
Fertility by Age by Marriage Status in Blount County
79.5% of women with births (1,176) in Blount County are married. The highest percentage of unmarried women with births falls into 20 to 34 years age bracket with 26.0% of them unmarried at the time of birth, while the lowest percentage of unmarried women with births belong to 15 to 19 years age bracket with 0.0% of them unmarried.
| Age Bracket | Married | Unmarried |
| 15 to 19 years | 3 (100.0%) | 0 (0.0%) |
| 20 to 34 years | 673 (74.0%) | 237 (26.0%) |
| 35 to 50 years | 259 (98.5%) | 4 (1.5%) |
| Total | 935 (79.5%) | 241 (20.5%) |
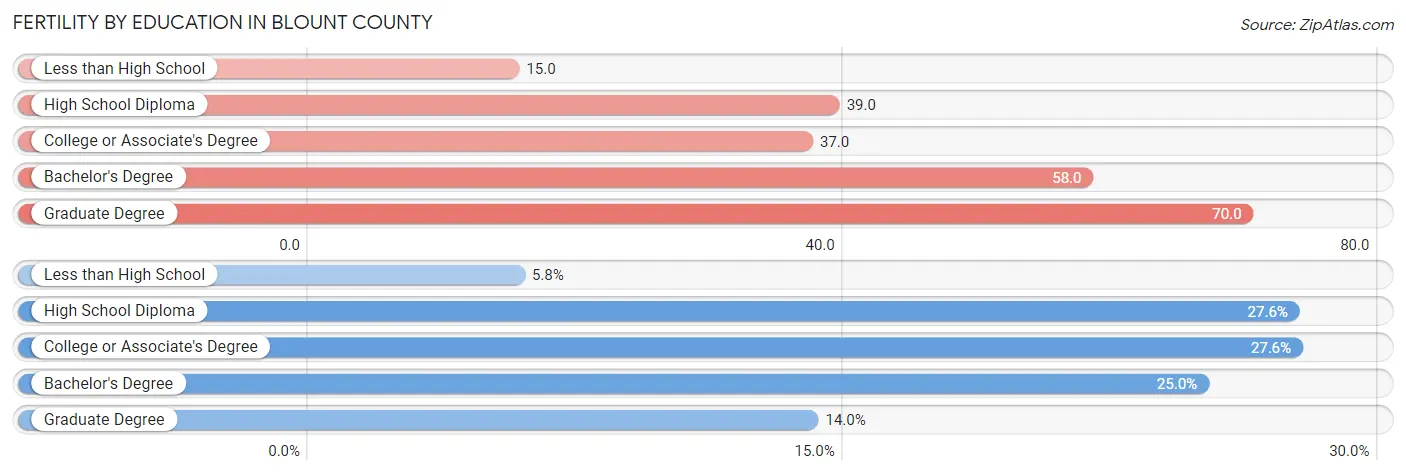
Fertility by Education in Blount County
Average fertility rate in Blount County is 41.0 births per 1,000 women. Women with the education attainment of graduate degree have the highest fertility rate of 70.0 births per 1,000 women, while women with the education attainment of less than high school have the lowest fertility at 15.0 births per 1,000 women. Women with the education attainment of college or associate's degree represent 27.6% of all women with births.
| Educational Attainment | Women with Births | Births / 1,000 Women |
| Less than High School | 68 (5.8%) | 15.0 |
| High School Diploma | 324 (27.6%) | 39.0 |
| College or Associate's Degree | 325 (27.6%) | 37.0 |
| Bachelor's Degree | 294 (25.0%) | 58.0 |
| Graduate Degree | 165 (14.0%) | 70.0 |
| Total | 1,176 (100.0%) | 41.0 |
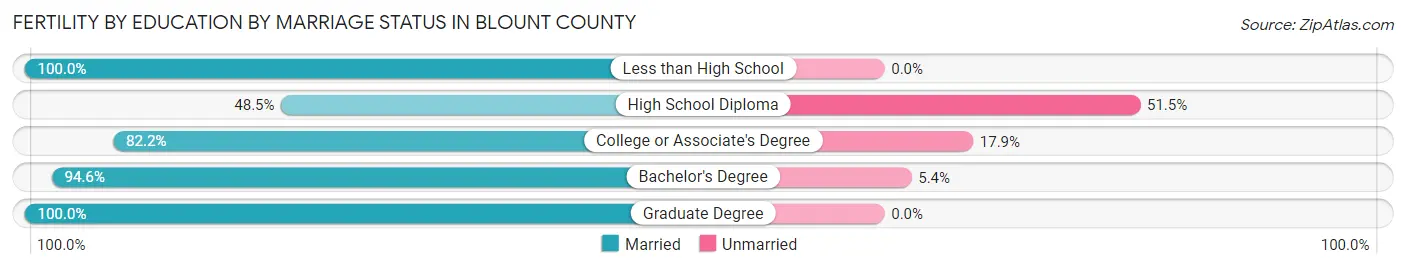
Fertility by Education by Marriage Status in Blount County
20.5% of women with births in Blount County are unmarried. Women with the educational attainment of less than high school are most likely to be married with 100.0% of them married at childbirth, while women with the educational attainment of high school diploma are least likely to be married with 51.5% of them unmarried at childbirth.
| Educational Attainment | Married | Unmarried |
| Less than High School | 68 (100.0%) | 0 (0.0%) |
| High School Diploma | 157 (48.5%) | 167 (51.5%) |
| College or Associate's Degree | 267 (82.2%) | 58 (17.8%) |
| Bachelor's Degree | 278 (94.6%) | 16 (5.4%) |
| Graduate Degree | 165 (100.0%) | 0 (0.0%) |
| Total | 935 (79.5%) | 241 (20.5%) |
Income in Blount County
Income Overview in Blount County
Per Capita Income in Blount County is $36,376, while median incomes of families and households are $85,194 and $70,935 respectively.
| Characteristic | Number | Measure |
| Per Capita Income | 135,951 | $36,376 |
| Median Family Income | 37,231 | $85,194 |
| Mean Family Income | 37,231 | $104,606 |
| Median Household Income | 53,456 | $70,935 |
| Mean Household Income | 53,456 | $89,542 |
| Income Deficit | 37,231 | $10,308 |
| Wage / Income Gap (%) | 135,951 | 31.76% |
| Wage / Income Gap ($) | 135,951 | 68.24¢ per $1 |
| Gini / Inequality Index | 135,951 | 0.42 |
Earnings by Sex in Blount County
Average Earnings in Blount County are $38,343, $46,732 for men and $31,888 for women, a difference of 31.8%.
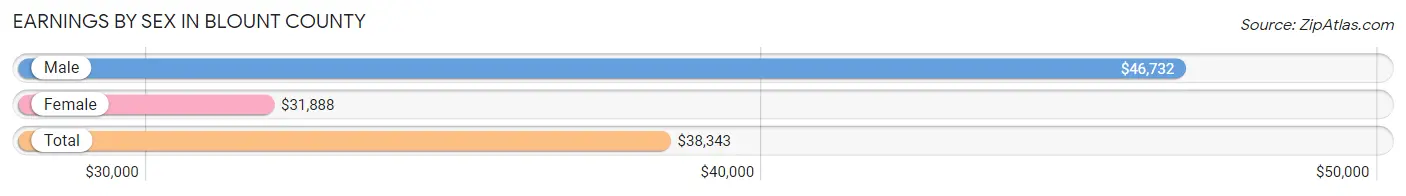
| Sex | Number | Average Earnings |
| Male | 37,786 (52.8%) | $46,732 |
| Female | 33,768 (47.2%) | $31,888 |
| Total | 71,554 (100.0%) | $38,343 |
Earnings by Sex by Income Bracket in Blount County
The most common earnings brackets in Blount County are $100,000+ for men (4,724 | 12.5%) and $25,000 to $29,999 for women (3,133 | 9.3%).
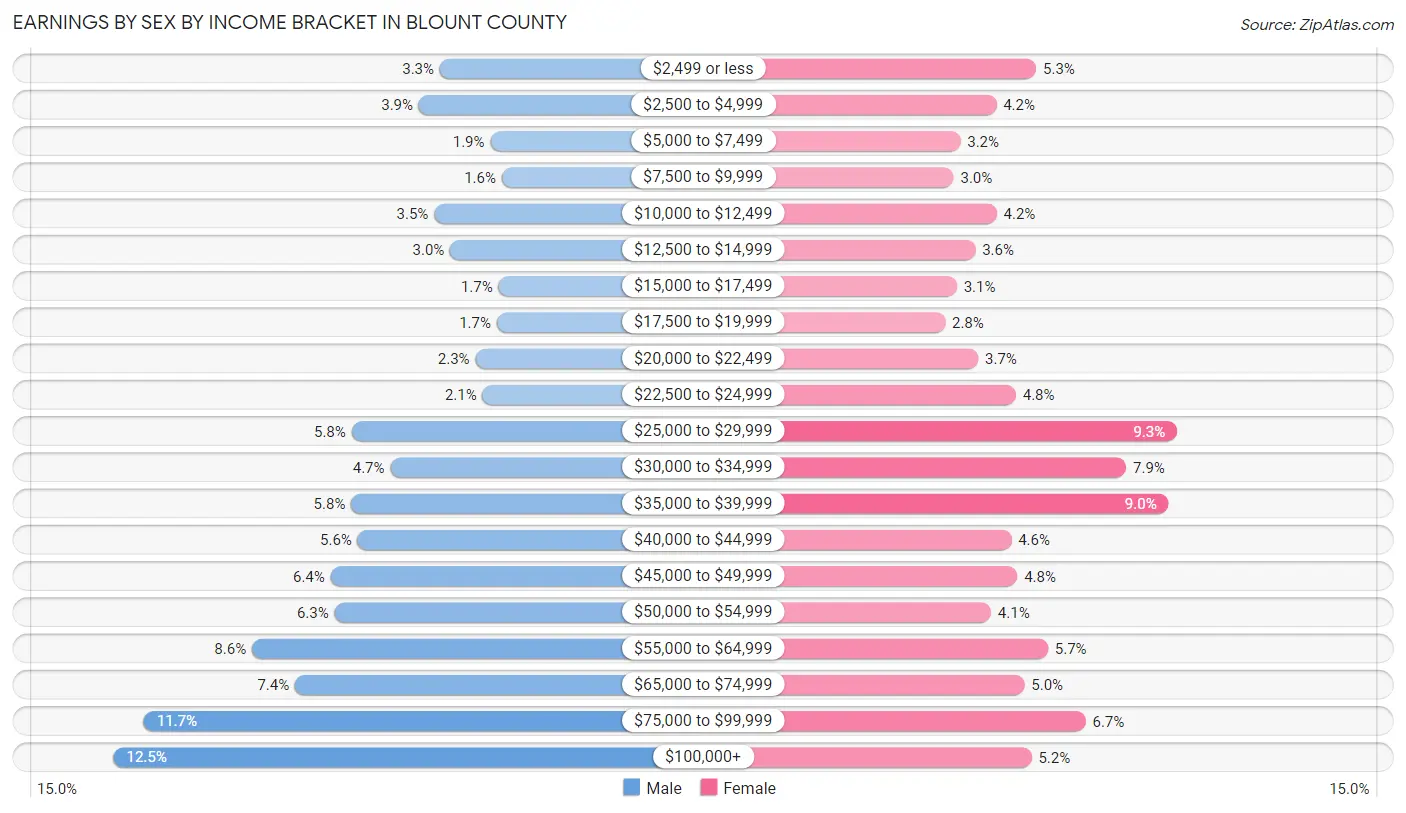
| Income | Male | Female |
| $2,499 or less | 1,259 (3.3%) | 1,796 (5.3%) |
| $2,500 to $4,999 | 1,482 (3.9%) | 1,418 (4.2%) |
| $5,000 to $7,499 | 722 (1.9%) | 1,078 (3.2%) |
| $7,500 to $9,999 | 599 (1.6%) | 1,014 (3.0%) |
| $10,000 to $12,499 | 1,320 (3.5%) | 1,421 (4.2%) |
| $12,500 to $14,999 | 1,150 (3.0%) | 1,218 (3.6%) |
| $15,000 to $17,499 | 636 (1.7%) | 1,044 (3.1%) |
| $17,500 to $19,999 | 655 (1.7%) | 933 (2.8%) |
| $20,000 to $22,499 | 879 (2.3%) | 1,247 (3.7%) |
| $22,500 to $24,999 | 804 (2.1%) | 1,605 (4.8%) |
| $25,000 to $29,999 | 2,194 (5.8%) | 3,133 (9.3%) |
| $30,000 to $34,999 | 1,782 (4.7%) | 2,652 (7.9%) |
| $35,000 to $39,999 | 2,198 (5.8%) | 3,054 (9.0%) |
| $40,000 to $44,999 | 2,133 (5.6%) | 1,559 (4.6%) |
| $45,000 to $49,999 | 2,418 (6.4%) | 1,619 (4.8%) |
| $50,000 to $54,999 | 2,378 (6.3%) | 1,366 (4.1%) |
| $55,000 to $64,999 | 3,255 (8.6%) | 1,907 (5.7%) |
| $65,000 to $74,999 | 2,795 (7.4%) | 1,684 (5.0%) |
| $75,000 to $99,999 | 4,403 (11.7%) | 2,266 (6.7%) |
| $100,000+ | 4,724 (12.5%) | 1,754 (5.2%) |
| Total | 37,786 (100.0%) | 33,768 (100.0%) |
Earnings by Sex by Educational Attainment in Blount County
Average earnings in Blount County are $51,776 for men and $35,455 for women, a difference of 31.5%. Men with an educational attainment of graduate degree enjoy the highest average annual earnings of $74,894, while those with less than high school education earn the least with $35,696. Women with an educational attainment of graduate degree earn the most with the average annual earnings of $63,088, while those with less than high school education have the smallest earnings of $24,567.
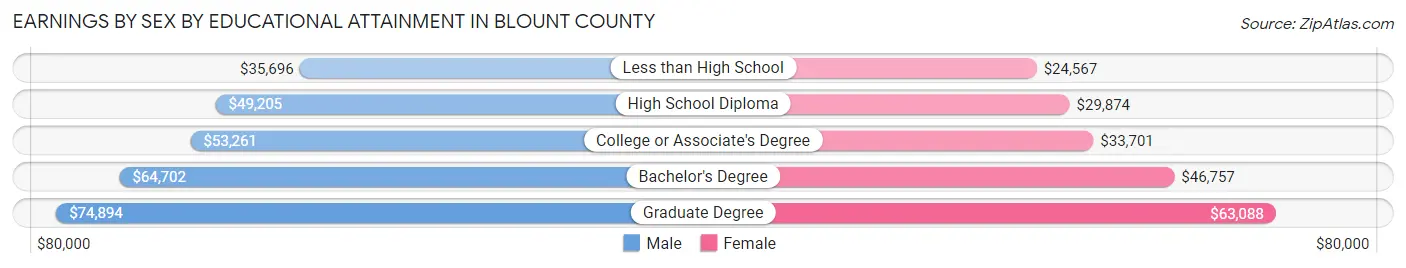
| Educational Attainment | Male Income | Female Income |
| Less than High School | $35,696 | $24,567 |
| High School Diploma | $49,205 | $29,874 |
| College or Associate's Degree | $53,261 | $33,701 |
| Bachelor's Degree | $64,702 | $46,757 |
| Graduate Degree | $74,894 | $63,088 |
| Total | $51,776 | $35,455 |
Family Income in Blount County
Family Income Brackets in Blount County
According to the Blount County family income data, there are 8,935 families falling into the $100,000 to $149,999 income range, which is the most common income bracket and makes up 24.0% of all families. Conversely, the $10,000 to $14,999 income bracket is the least frequent group with only 707 families (1.9%) belonging to this category.
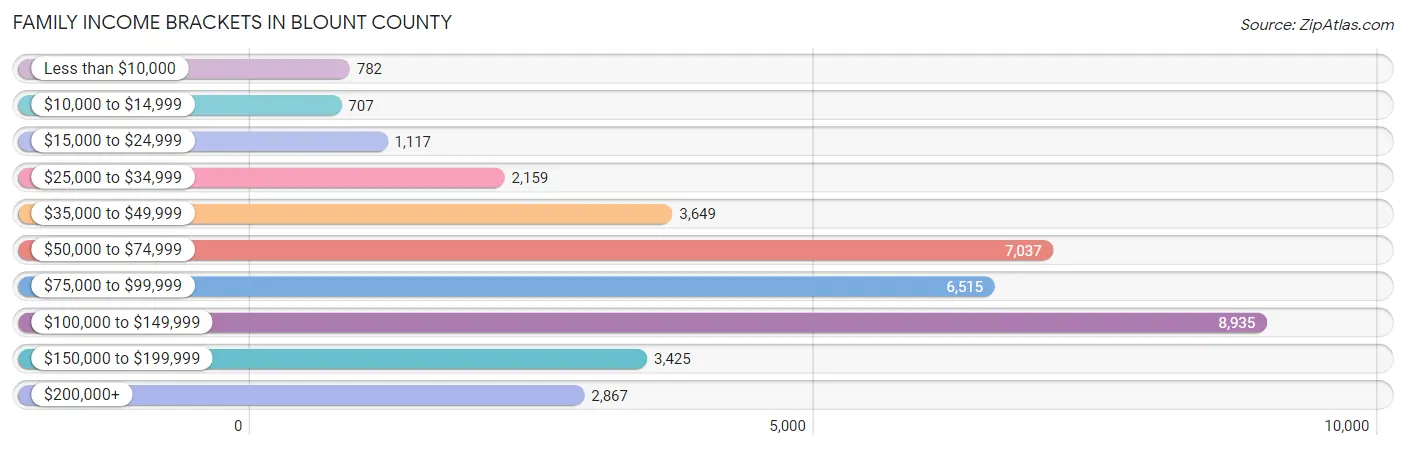
| Income Bracket | # Families | % Families |
| Less than $10,000 | 782 | 2.1% |
| $10,000 to $14,999 | 707 | 1.9% |
| $15,000 to $24,999 | 1,117 | 3.0% |
| $25,000 to $34,999 | 2,159 | 5.8% |
| $35,000 to $49,999 | 3,649 | 9.8% |
| $50,000 to $74,999 | 7,037 | 18.9% |
| $75,000 to $99,999 | 6,515 | 17.5% |
| $100,000 to $149,999 | 8,935 | 24.0% |
| $150,000 to $199,999 | 3,425 | 9.2% |
| $200,000+ | 2,867 | 7.7% |
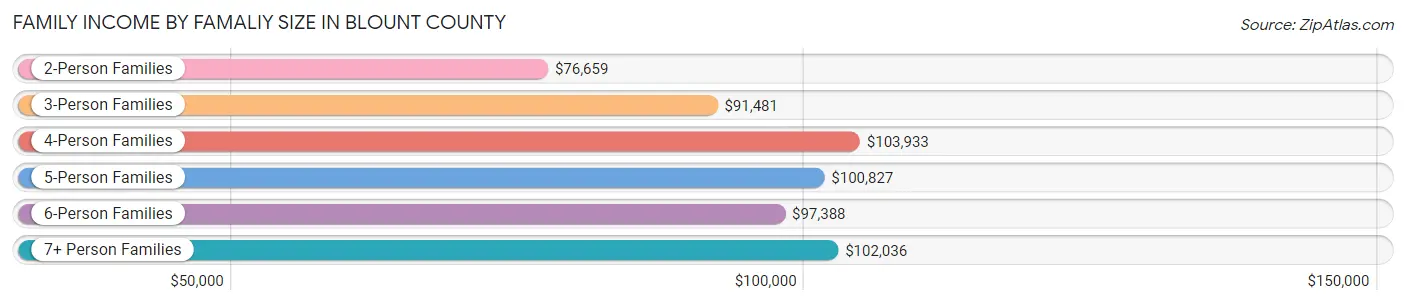
Family Income by Famaliy Size in Blount County
4-person families (5,230 | 14.1%) account for the highest median family income in Blount County with $103,933 per family, while 2-person families (19,964 | 53.6%) have the highest median income of $38,330 per family member.
| Income Bracket | # Families | Median Income |
| 2-Person Families | 19,964 (53.6%) | $76,659 |
| 3-Person Families | 8,353 (22.4%) | $91,481 |
| 4-Person Families | 5,230 (14.1%) | $103,933 |
| 5-Person Families | 2,361 (6.3%) | $100,827 |
| 6-Person Families | 828 (2.2%) | $97,388 |
| 7+ Person Families | 495 (1.3%) | $102,036 |
| Total | 37,231 (100.0%) | $85,194 |
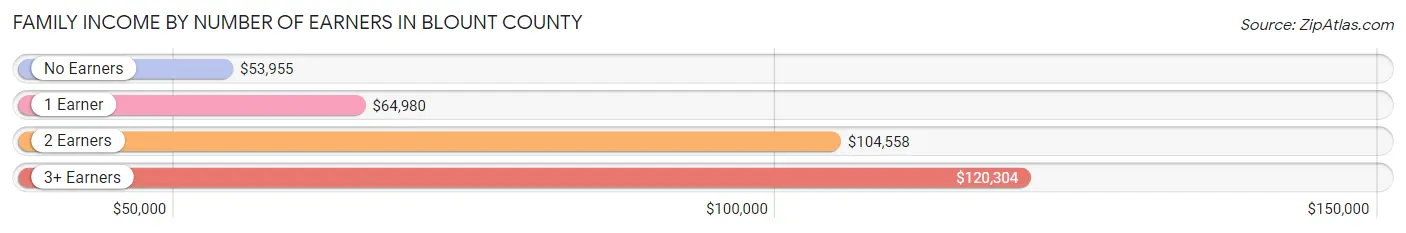
Family Income by Number of Earners in Blount County
The median family income in Blount County is $85,194, with families comprising 3+ earners (4,340) having the highest median family income of $120,304, while families with no earners (7,117) have the lowest median family income of $53,955, accounting for 11.7% and 19.1% of families, respectively.
| Number of Earners | # Families | Median Income |
| No Earners | 7,117 (19.1%) | $53,955 |
| 1 Earner | 11,324 (30.4%) | $64,980 |
| 2 Earners | 14,450 (38.8%) | $104,558 |
| 3+ Earners | 4,340 (11.7%) | $120,304 |
| Total | 37,231 (100.0%) | $85,194 |
Household Income in Blount County
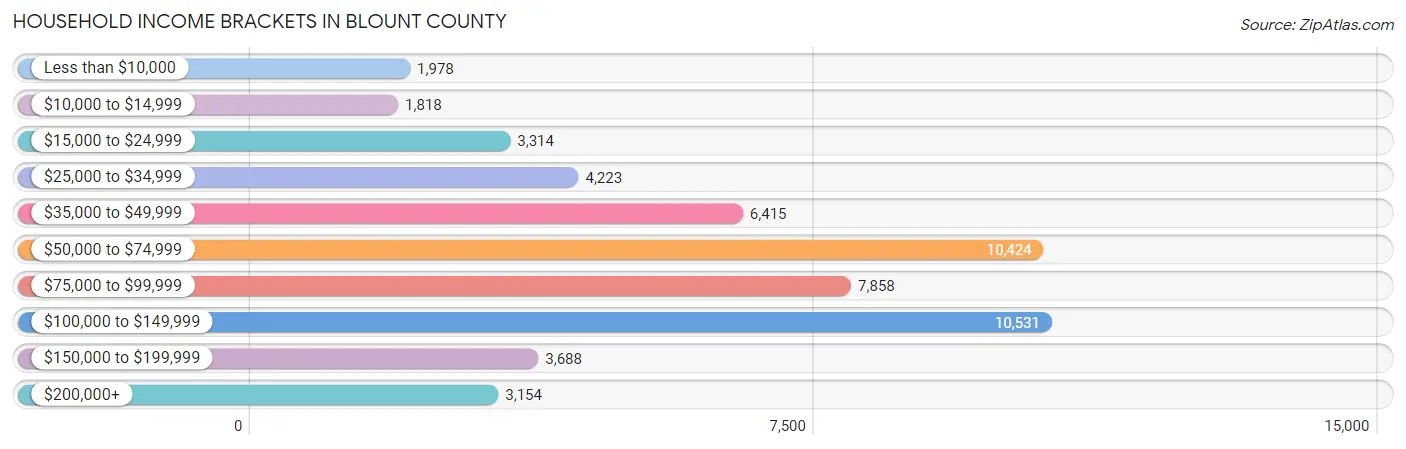
Household Income Brackets in Blount County
With 10,531 households falling in the category, the $100,000 to $149,999 income range is the most frequent in Blount County, accounting for 19.7% of all households. In contrast, only 1,818 households (3.4%) fall into the $10,000 to $14,999 income bracket, making it the least populous group.
| Income Bracket | # Households | % Households |
| Less than $10,000 | 1,978 | 3.7% |
| $10,000 to $14,999 | 1,818 | 3.4% |
| $15,000 to $24,999 | 3,314 | 6.2% |
| $25,000 to $34,999 | 4,223 | 7.9% |
| $35,000 to $49,999 | 6,415 | 12.0% |
| $50,000 to $74,999 | 10,424 | 19.5% |
| $75,000 to $99,999 | 7,858 | 14.7% |
| $100,000 to $149,999 | 10,531 | 19.7% |
| $150,000 to $199,999 | 3,688 | 6.9% |
| $200,000+ | 3,154 | 5.9% |
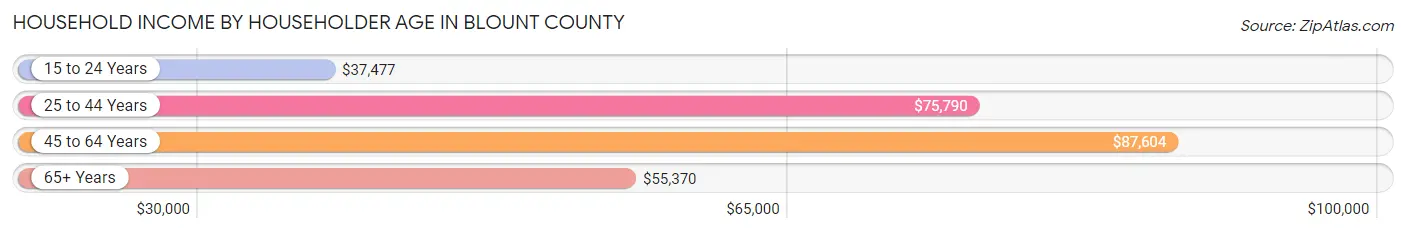
Household Income by Householder Age in Blount County
The median household income in Blount County is $70,935, with the highest median household income of $87,604 found in the 45 to 64 years age bracket for the primary householder. A total of 20,849 households (39.0%) fall into this category. Meanwhile, the 15 to 24 years age bracket for the primary householder has the lowest median household income of $37,477, with 1,478 households (2.8%) in this group.
| Income Bracket | # Households | Median Income |
| 15 to 24 Years | 1,478 (2.8%) | $37,477 |
| 25 to 44 Years | 14,060 (26.3%) | $75,790 |
| 45 to 64 Years | 20,849 (39.0%) | $87,604 |
| 65+ Years | 17,069 (31.9%) | $55,370 |
| Total | 53,456 (100.0%) | $70,935 |
Poverty in Blount County
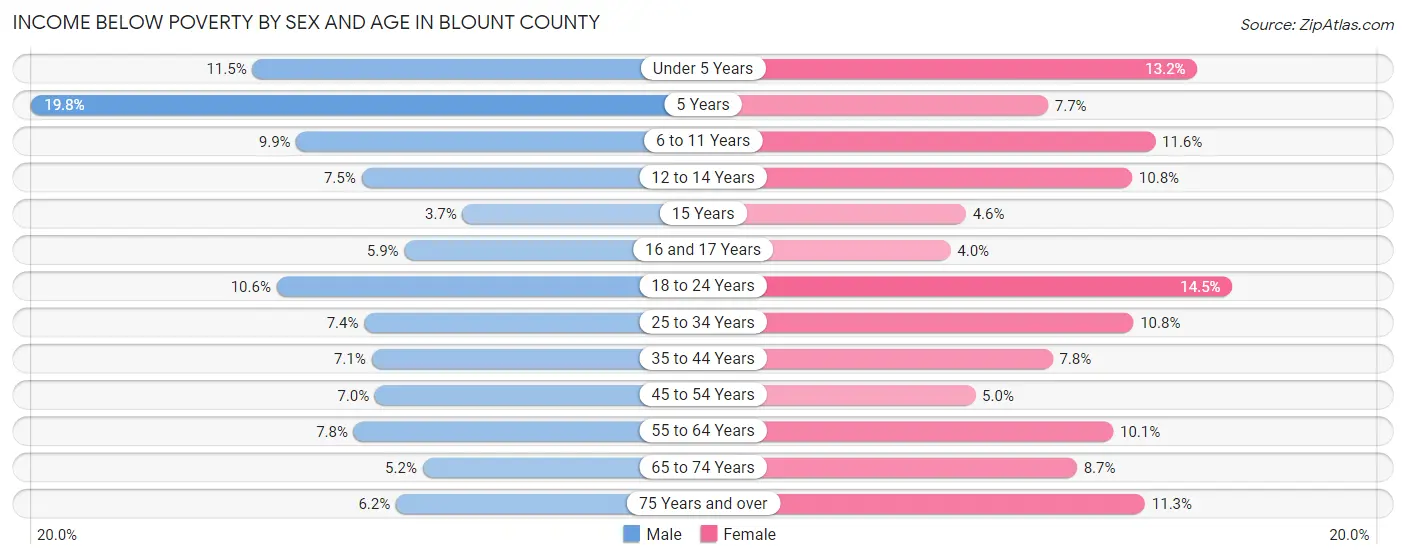
Income Below Poverty by Sex and Age in Blount County
With 7.7% poverty level for males and 9.5% for females among the residents of Blount County, 5 year old males and 18 to 24 year old females are the most vulnerable to poverty, with 110 males (19.8%) and 683 females (14.5%) in their respective age groups living below the poverty level.
| Age Bracket | Male | Female |
| Under 5 Years | 385 (11.5%) | 420 (13.2%) |
| 5 Years | 110 (19.8%) | 77 (7.6%) |
| 6 to 11 Years | 471 (9.9%) | 483 (11.6%) |
| 12 to 14 Years | 175 (7.5%) | 233 (10.8%) |
| 15 Years | 25 (3.7%) | 36 (4.6%) |
| 16 and 17 Years | 113 (5.9%) | 67 (4.0%) |
| 18 to 24 Years | 559 (10.6%) | 683 (14.5%) |
| 25 to 34 Years | 601 (7.4%) | 865 (10.8%) |
| 35 to 44 Years | 561 (7.1%) | 616 (7.8%) |
| 45 to 54 Years | 614 (7.0%) | 455 (5.0%) |
| 55 to 64 Years | 746 (7.8%) | 1,030 (10.1%) |
| 65 to 74 Years | 400 (5.2%) | 765 (8.7%) |
| 75 Years and over | 307 (6.2%) | 703 (11.3%) |
| Total | 5,067 (7.7%) | 6,433 (9.5%) |
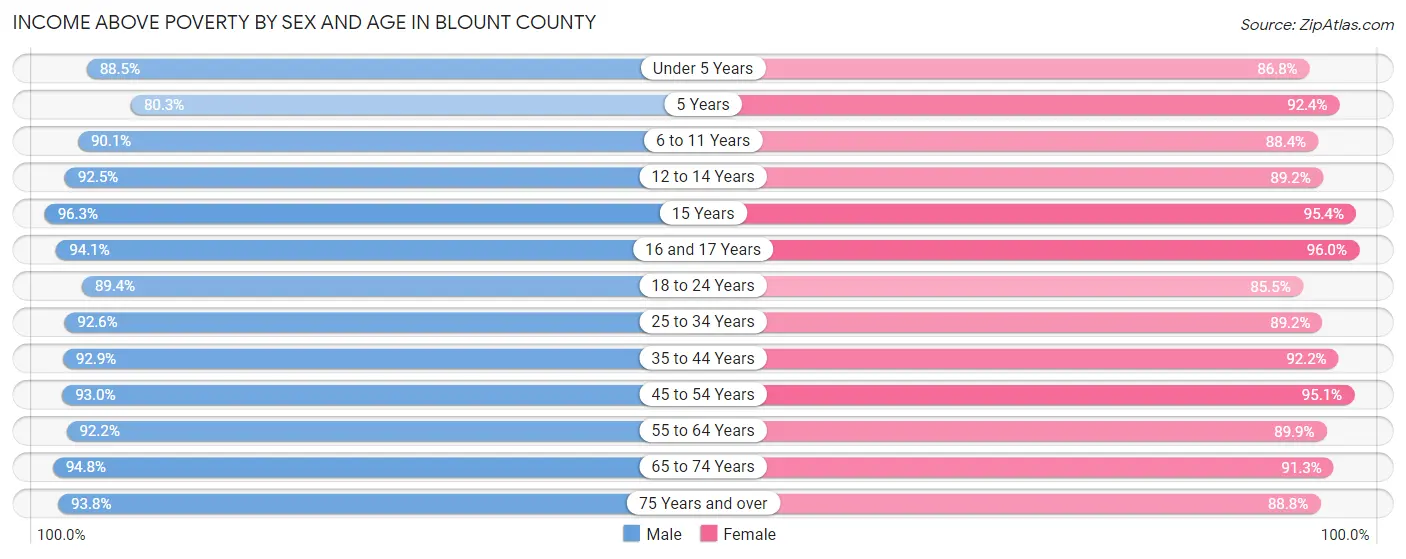
Income Above Poverty by Sex and Age in Blount County
According to the poverty statistics in Blount County, males aged 15 years and females aged 16 and 17 years are the age groups that are most secure financially, with 96.3% of males and 96.0% of females in these age groups living above the poverty line.
| Age Bracket | Male | Female |
| Under 5 Years | 2,951 (88.5%) | 2,761 (86.8%) |
| 5 Years | 447 (80.2%) | 930 (92.3%) |
| 6 to 11 Years | 4,280 (90.1%) | 3,669 (88.4%) |
| 12 to 14 Years | 2,160 (92.5%) | 1,930 (89.2%) |
| 15 Years | 644 (96.3%) | 746 (95.4%) |
| 16 and 17 Years | 1,802 (94.1%) | 1,594 (96.0%) |
| 18 to 24 Years | 4,696 (89.4%) | 4,028 (85.5%) |
| 25 to 34 Years | 7,534 (92.6%) | 7,129 (89.2%) |
| 35 to 44 Years | 7,322 (92.9%) | 7,261 (92.2%) |
| 45 to 54 Years | 8,173 (93.0%) | 8,734 (95.1%) |
| 55 to 64 Years | 8,837 (92.2%) | 9,196 (89.9%) |
| 65 to 74 Years | 7,258 (94.8%) | 8,012 (91.3%) |
| 75 Years and over | 4,638 (93.8%) | 5,546 (88.7%) |
| Total | 60,742 (92.3%) | 61,536 (90.5%) |
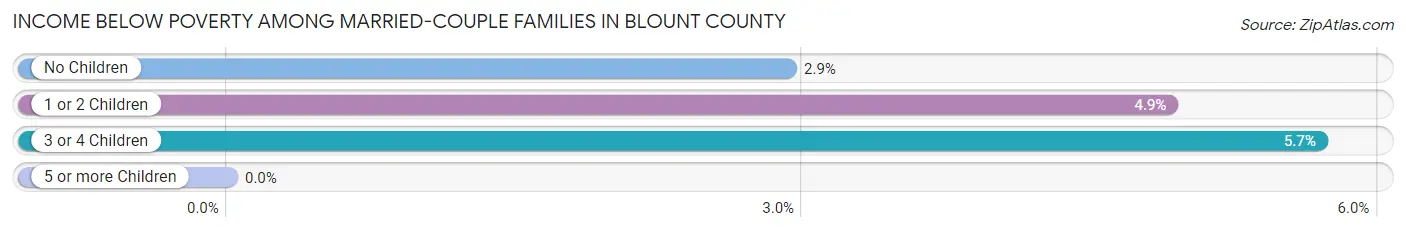
Income Below Poverty Among Married-Couple Families in Blount County
The poverty statistics for married-couple families in Blount County show that 3.6% or 1,075 of the total 29,567 families live below the poverty line. Families with 3 or 4 children have the highest poverty rate of 5.7%, comprising of 103 families. On the other hand, families with 5 or more children have the lowest poverty rate of 0.0%, which includes 0 families.
| Children | Above Poverty | Below Poverty |
| No Children | 18,685 (97.1%) | 562 (2.9%) |
| 1 or 2 Children | 7,946 (95.1%) | 410 (4.9%) |
| 3 or 4 Children | 1,706 (94.3%) | 103 (5.7%) |
| 5 or more Children | 155 (100.0%) | 0 (0.0%) |
| Total | 28,492 (96.4%) | 1,075 (3.6%) |
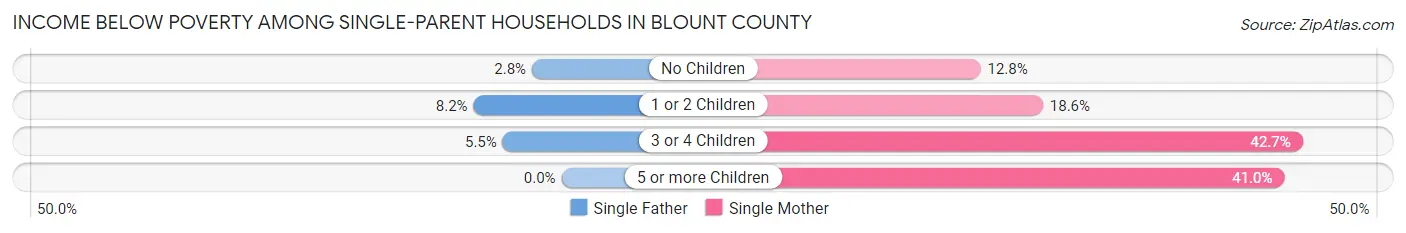
Income Below Poverty Among Single-Parent Households in Blount County
According to the poverty data in Blount County, 5.7% or 131 single-father households and 17.0% or 910 single-mother households are living below the poverty line. Among single-father households, those with 1 or 2 children have the highest poverty rate, with 90 households (8.2%) experiencing poverty. Likewise, among single-mother households, those with 3 or 4 children have the highest poverty rate, with 100 households (42.7%) falling below the poverty line.
| Children | Single Father | Single Mother |
| No Children | 25 (2.8%) | 351 (12.8%) |
| 1 or 2 Children | 90 (8.2%) | 427 (18.5%) |
| 3 or 4 Children | 16 (5.5%) | 100 (42.7%) |
| 5 or more Children | 0 (0.0%) | 32 (41.0%) |
| Total | 131 (5.7%) | 910 (17.0%) |
Income Below Poverty Among Married-Couple vs Single-Parent Households in Blount County
The poverty data for Blount County shows that 1,075 of the married-couple family households (3.6%) and 1,041 of the single-parent households (13.6%) are living below the poverty level. Within the married-couple family households, those with 3 or 4 children have the highest poverty rate, with 103 households (5.7%) falling below the poverty line. Among the single-parent households, those with 5 or more children have the highest poverty rate, with 32 household (41.0%) living below poverty.
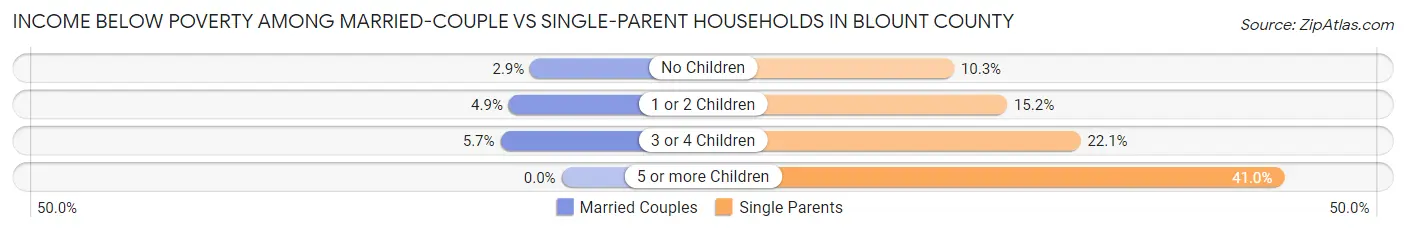
| Children | Married-Couple Families | Single-Parent Households |
| No Children | 562 (2.9%) | 376 (10.3%) |
| 1 or 2 Children | 410 (4.9%) | 517 (15.2%) |
| 3 or 4 Children | 103 (5.7%) | 116 (22.1%) |
| 5 or more Children | 0 (0.0%) | 32 (41.0%) |
| Total | 1,075 (3.6%) | 1,041 (13.6%) |
Employment Characteristics in Blount County
Employment by Class of Employer in Blount County
Among the 64,637 employed individuals in Blount County, private company employees (45,176 | 69.9%), not-for-profit organizations (5,781 | 8.9%), and local government employees (5,239 | 8.1%) make up the most common classes of employment.
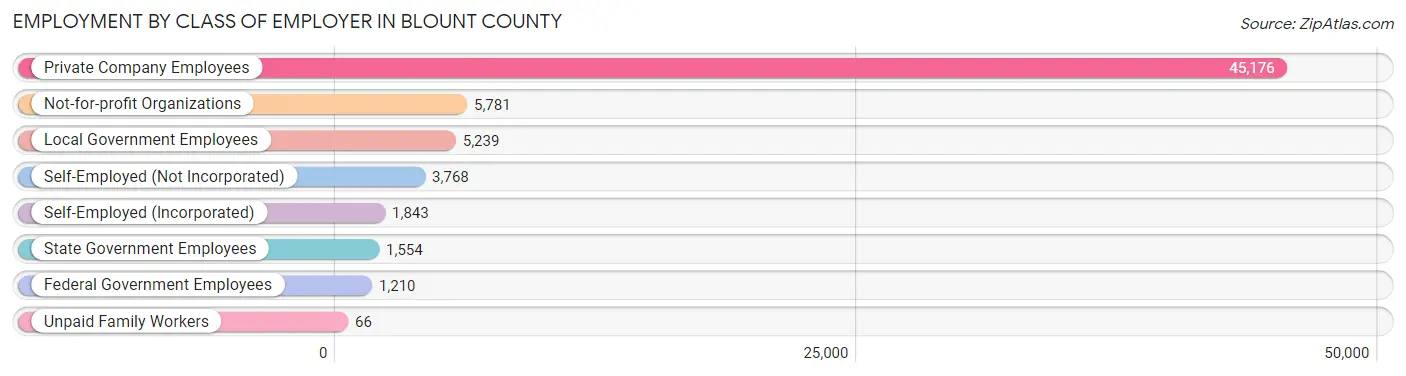
| Employer Class | # Employees | % Employees |
| Private Company Employees | 45,176 | 69.9% |
| Self-Employed (Incorporated) | 1,843 | 2.9% |
| Self-Employed (Not Incorporated) | 3,768 | 5.8% |
| Not-for-profit Organizations | 5,781 | 8.9% |
| Local Government Employees | 5,239 | 8.1% |
| State Government Employees | 1,554 | 2.4% |
| Federal Government Employees | 1,210 | 1.9% |
| Unpaid Family Workers | 66 | 0.1% |
| Total | 64,637 | 100.0% |
Employment Status by Age in Blount County
According to the labor force statistics for Blount County, out of the total population over 16 years of age (112,546), 60.5% or 68,090 individuals are in the labor force, with 4.1% or 2,792 of them unemployed. The age group with the highest labor force participation rate is 20 to 24 years, with 85.8% or 6,446 individuals in the labor force. Within the labor force, the 16 to 19 years age range has the highest percentage of unemployed individuals, with 9.8% or 262 of them being unemployed.
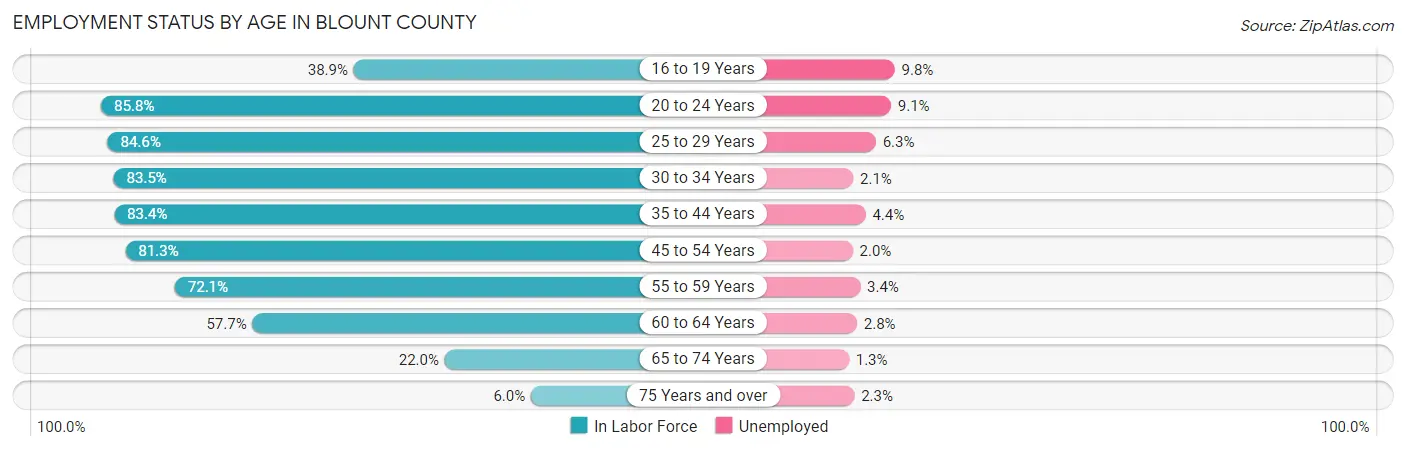
| Age Bracket | In Labor Force | Unemployed |
| 16 to 19 Years | 2,672 (38.9%) | 262 (9.8%) |
| 20 to 24 Years | 6,446 (85.8%) | 587 (9.1%) |
| 25 to 29 Years | 6,728 (84.6%) | 424 (6.3%) |
| 30 to 34 Years | 6,951 (83.5%) | 146 (2.1%) |
| 35 to 44 Years | 13,278 (83.4%) | 584 (4.4%) |
| 45 to 54 Years | 14,676 (81.3%) | 294 (2.0%) |
| 55 to 59 Years | 7,515 (72.1%) | 256 (3.4%) |
| 60 to 64 Years | 5,463 (57.7%) | 153 (2.8%) |
| 65 to 74 Years | 3,638 (22.0%) | 47 (1.3%) |
| 75 Years and over | 689 (6.0%) | 16 (2.3%) |
| Total | 68,090 (60.5%) | 2,792 (4.1%) |
Employment Status by Educational Attainment in Blount County
According to labor force statistics for Blount County, 77.9% of individuals (54,640) out of the total population between 25 and 64 years of age (70,141) are in the labor force, with 3.4% or 1,858 of them being unemployed. The group with the highest labor force participation rate are those with the educational attainment of bachelor's degree or higher, with 85.7% or 15,599 individuals in the labor force. Within the labor force, individuals with high school diploma education have the highest percentage of unemployment, with 3.7% or 689 of them being unemployed.
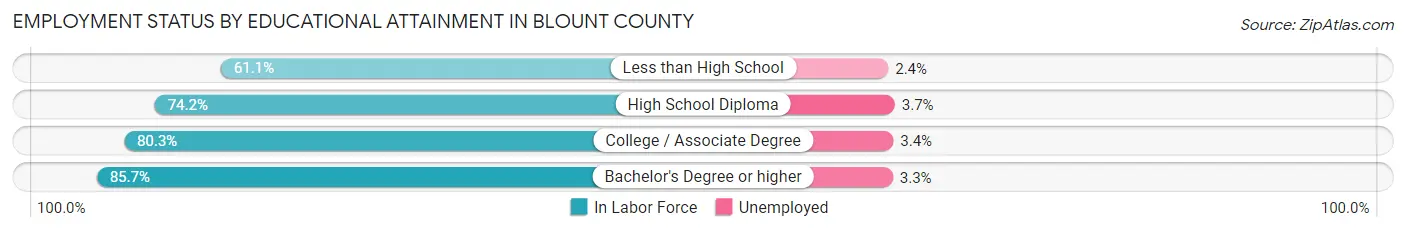
| Educational Attainment | In Labor Force | Unemployed |
| Less than High School | 3,777 (61.1%) | 148 (2.4%) |
| High School Diploma | 18,615 (74.2%) | 928 (3.7%) |
| College / Associate Degree | 16,598 (80.3%) | 703 (3.4%) |
| Bachelor's Degree or higher | 15,599 (85.7%) | 601 (3.3%) |
| Total | 54,640 (77.9%) | 2,385 (3.4%) |
Employment Occupations by Sex in Blount County
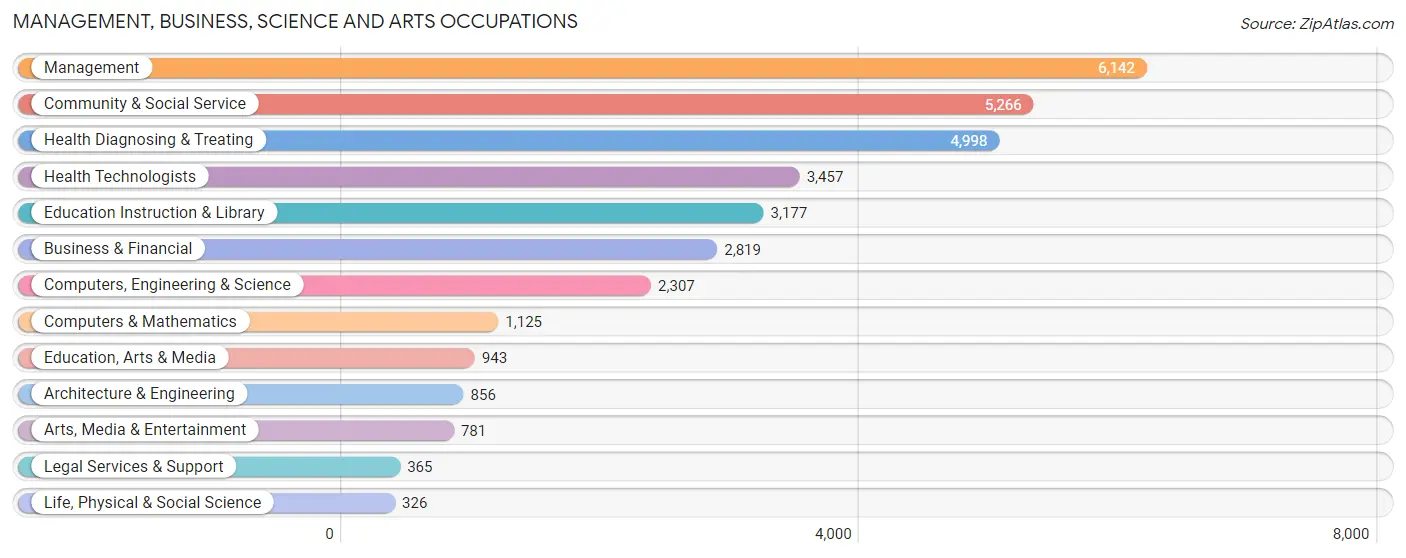
Management, Business, Science and Arts Occupations
The most common Management, Business, Science and Arts occupations in Blount County are Management (6,142 | 9.4%), Community & Social Service (5,266 | 8.1%), Health Diagnosing & Treating (4,998 | 7.7%), Health Technologists (3,457 | 5.3%), and Education Instruction & Library (3,177 | 4.9%).
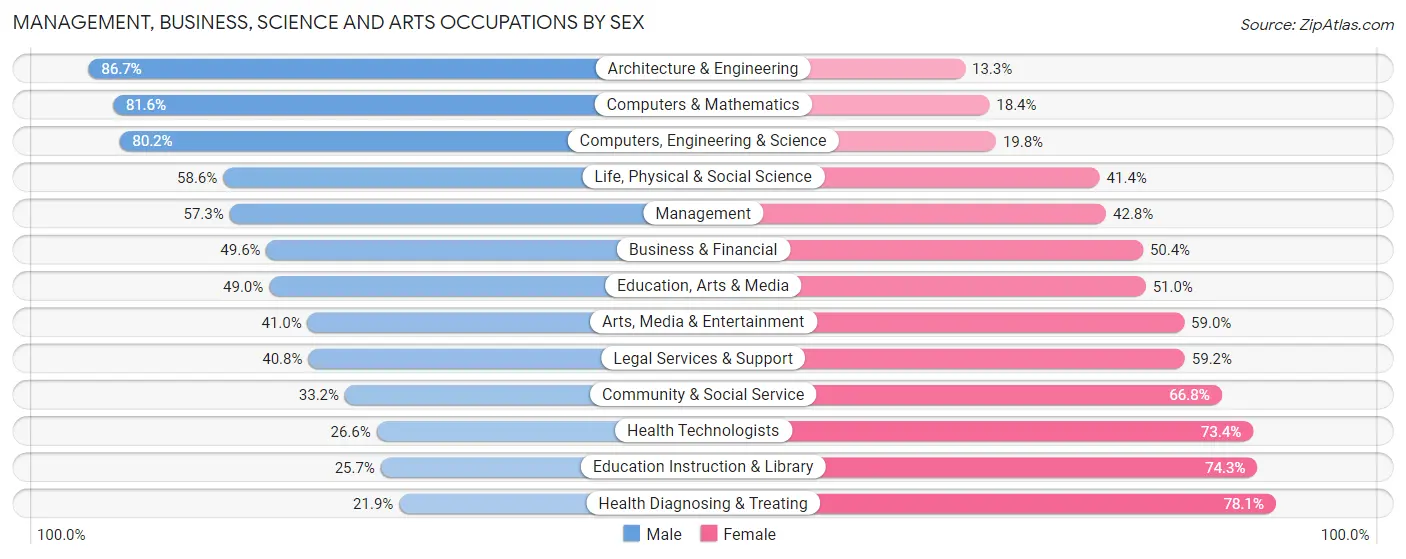
Management, Business, Science and Arts Occupations by Sex
Within the Management, Business, Science and Arts occupations in Blount County, the most male-oriented occupations are Architecture & Engineering (86.7%), Computers & Mathematics (81.6%), and Computers, Engineering & Science (80.2%), while the most female-oriented occupations are Health Diagnosing & Treating (78.1%), Education Instruction & Library (74.3%), and Health Technologists (73.4%).
| Occupation | Male | Female |
| Management | 3,516 (57.3%) | 2,626 (42.7%) |
| Business & Financial | 1,397 (49.6%) | 1,422 (50.4%) |
| Computers, Engineering & Science | 1,851 (80.2%) | 456 (19.8%) |
| Computers & Mathematics | 918 (81.6%) | 207 (18.4%) |
| Architecture & Engineering | 742 (86.7%) | 114 (13.3%) |
| Life, Physical & Social Science | 191 (58.6%) | 135 (41.4%) |
| Community & Social Service | 1,748 (33.2%) | 3,518 (66.8%) |
| Education, Arts & Media | 462 (49.0%) | 481 (51.0%) |
| Legal Services & Support | 149 (40.8%) | 216 (59.2%) |
| Education Instruction & Library | 817 (25.7%) | 2,360 (74.3%) |
| Arts, Media & Entertainment | 320 (41.0%) | 461 (59.0%) |
| Health Diagnosing & Treating | 1,093 (21.9%) | 3,905 (78.1%) |
| Health Technologists | 919 (26.6%) | 2,538 (73.4%) |
| Total (Category) | 9,605 (44.6%) | 11,927 (55.4%) |
| Total (Overall) | 34,546 (53.1%) | 30,535 (46.9%) |
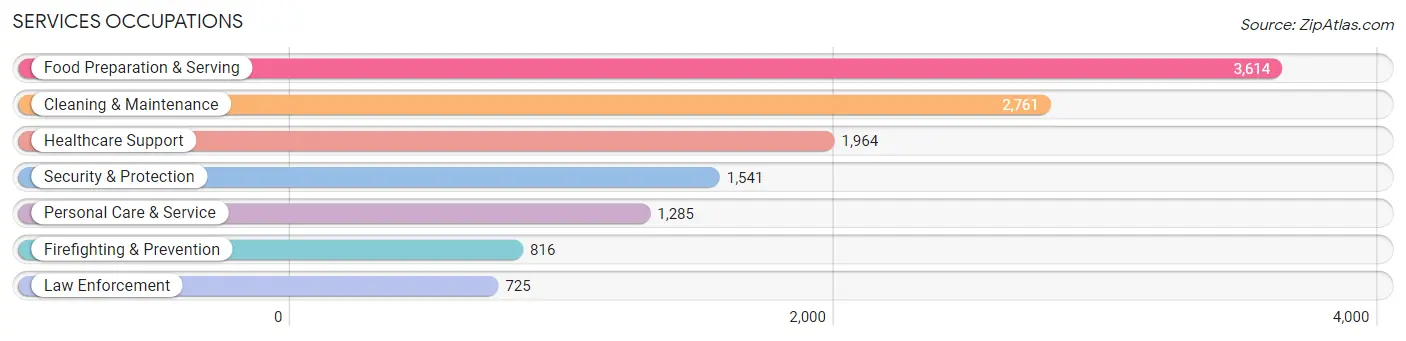
Services Occupations
The most common Services occupations in Blount County are Food Preparation & Serving (3,614 | 5.6%), Cleaning & Maintenance (2,761 | 4.2%), Healthcare Support (1,964 | 3.0%), Security & Protection (1,541 | 2.4%), and Personal Care & Service (1,285 | 2.0%).
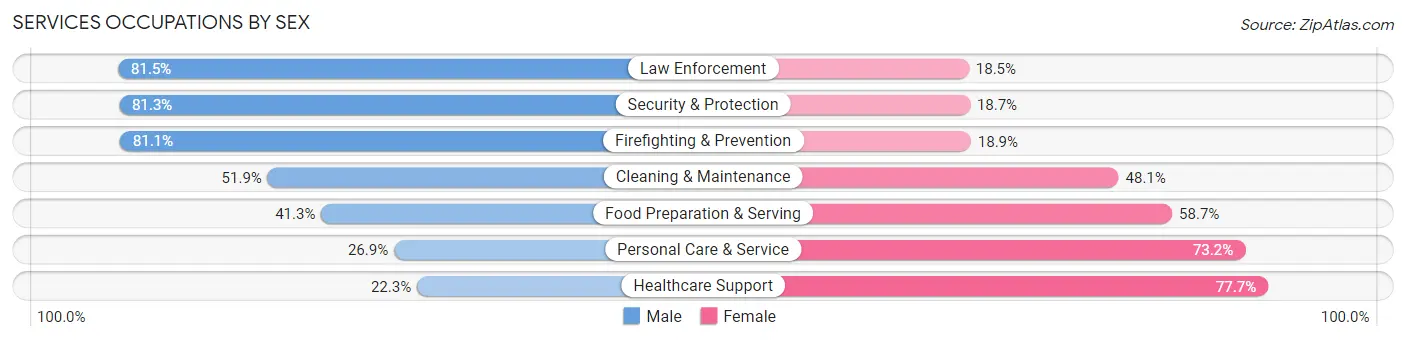
Services Occupations by Sex
Within the Services occupations in Blount County, the most male-oriented occupations are Law Enforcement (81.5%), Security & Protection (81.3%), and Firefighting & Prevention (81.1%), while the most female-oriented occupations are Healthcare Support (77.7%), Personal Care & Service (73.2%), and Food Preparation & Serving (58.7%).
| Occupation | Male | Female |
| Healthcare Support | 438 (22.3%) | 1,526 (77.7%) |
| Security & Protection | 1,253 (81.3%) | 288 (18.7%) |
| Firefighting & Prevention | 662 (81.1%) | 154 (18.9%) |
| Law Enforcement | 591 (81.5%) | 134 (18.5%) |
| Food Preparation & Serving | 1,491 (41.3%) | 2,123 (58.7%) |
| Cleaning & Maintenance | 1,432 (51.9%) | 1,329 (48.1%) |
| Personal Care & Service | 345 (26.9%) | 940 (73.2%) |
| Total (Category) | 4,959 (44.4%) | 6,206 (55.6%) |
| Total (Overall) | 34,546 (53.1%) | 30,535 (46.9%) |
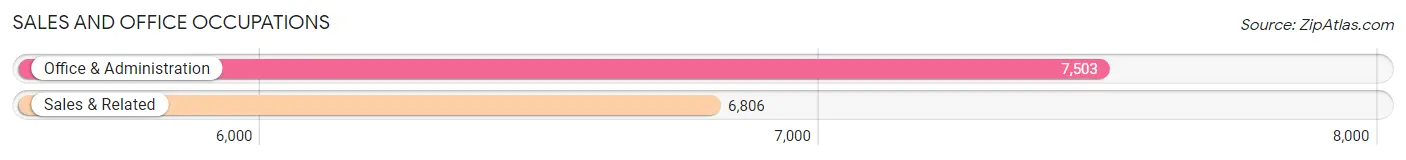
Sales and Office Occupations
The most common Sales and Office occupations in Blount County are Office & Administration (7,503 | 11.5%), and Sales & Related (6,806 | 10.5%).
Sales and Office Occupations by Sex
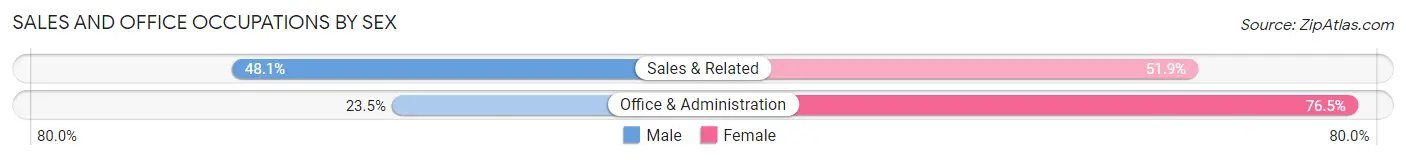
| Occupation | Male | Female |
| Sales & Related | 3,274 (48.1%) | 3,532 (51.9%) |
| Office & Administration | 1,765 (23.5%) | 5,738 (76.5%) |
| Total (Category) | 5,039 (35.2%) | 9,270 (64.8%) |
| Total (Overall) | 34,546 (53.1%) | 30,535 (46.9%) |
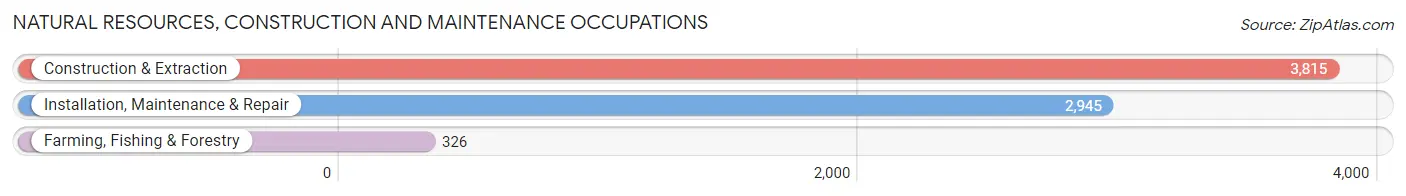
Natural Resources, Construction and Maintenance Occupations
The most common Natural Resources, Construction and Maintenance occupations in Blount County are Construction & Extraction (3,815 | 5.9%), Installation, Maintenance & Repair (2,945 | 4.5%), and Farming, Fishing & Forestry (326 | 0.5%).
Natural Resources, Construction and Maintenance Occupations by Sex
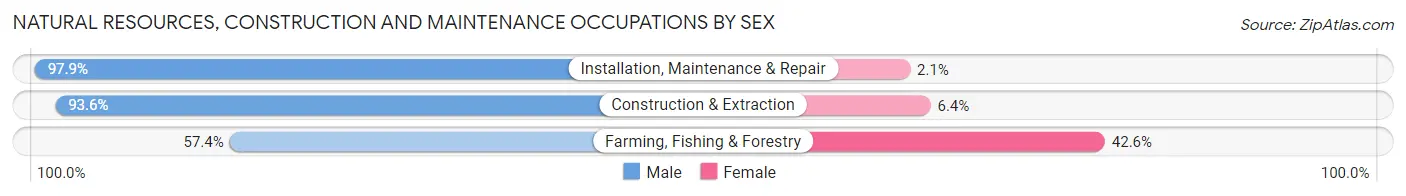
| Occupation | Male | Female |
| Farming, Fishing & Forestry | 187 (57.4%) | 139 (42.6%) |
| Construction & Extraction | 3,572 (93.6%) | 243 (6.4%) |
| Installation, Maintenance & Repair | 2,883 (97.9%) | 62 (2.1%) |
| Total (Category) | 6,642 (93.7%) | 444 (6.3%) |
| Total (Overall) | 34,546 (53.1%) | 30,535 (46.9%) |
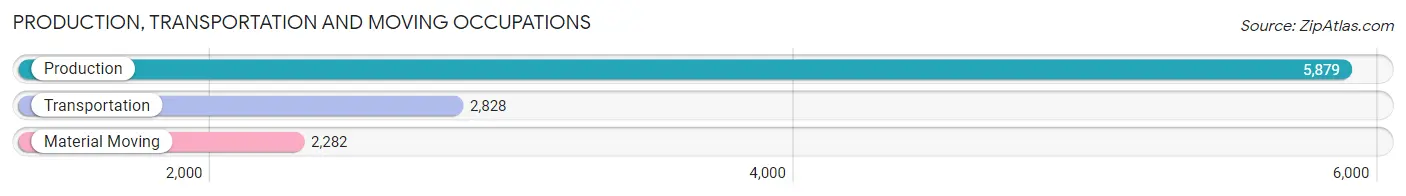
Production, Transportation and Moving Occupations
The most common Production, Transportation and Moving occupations in Blount County are Production (5,879 | 9.0%), Transportation (2,828 | 4.3%), and Material Moving (2,282 | 3.5%).
Production, Transportation and Moving Occupations by Sex
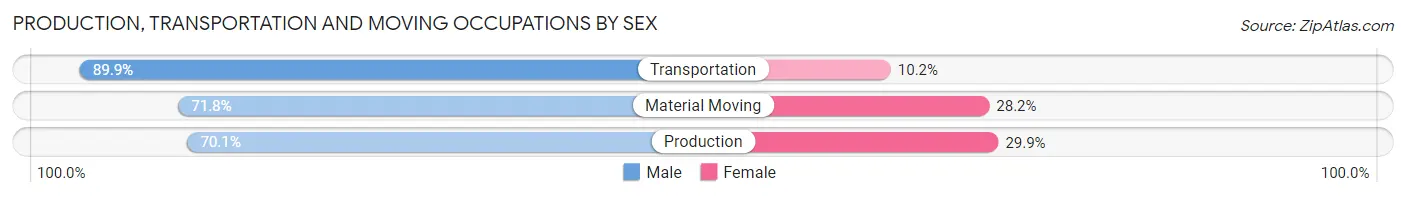
| Occupation | Male | Female |
| Production | 4,122 (70.1%) | 1,757 (29.9%) |
| Transportation | 2,541 (89.8%) | 287 (10.2%) |
| Material Moving | 1,638 (71.8%) | 644 (28.2%) |
| Total (Category) | 8,301 (75.5%) | 2,688 (24.5%) |
| Total (Overall) | 34,546 (53.1%) | 30,535 (46.9%) |
Employment Industries by Sex in Blount County
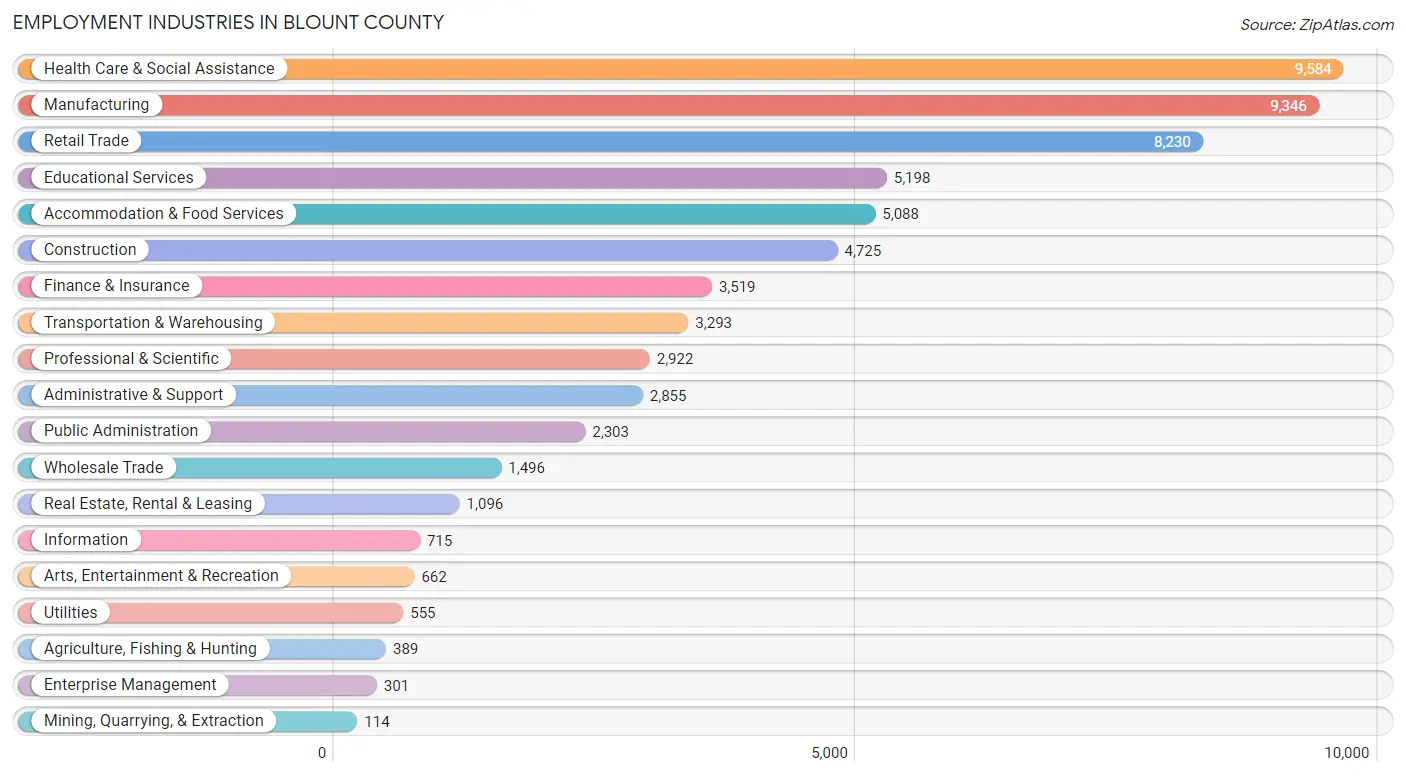
Employment Industries in Blount County
The major employment industries in Blount County include Health Care & Social Assistance (9,584 | 14.7%), Manufacturing (9,346 | 14.4%), Retail Trade (8,230 | 12.7%), Educational Services (5,198 | 8.0%), and Accommodation & Food Services (5,088 | 7.8%).
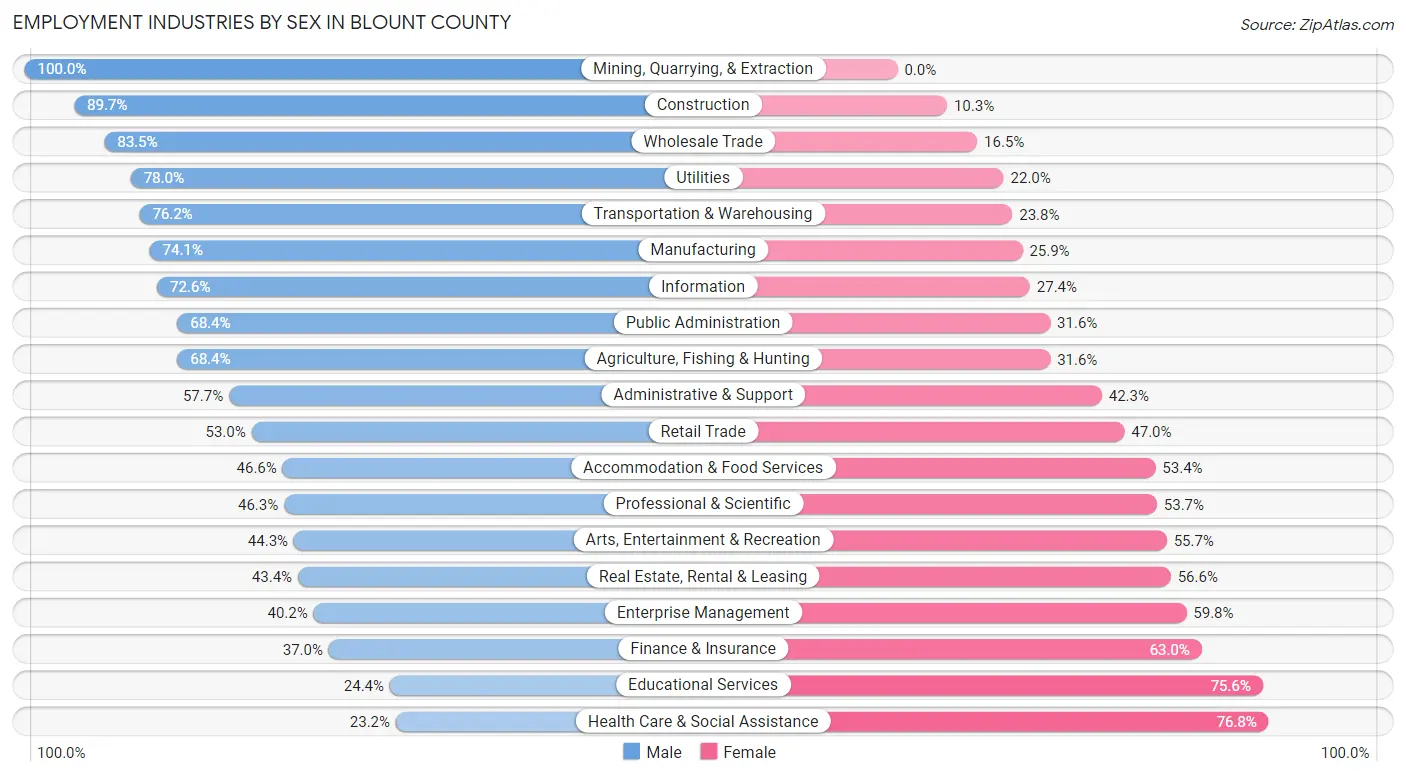
Employment Industries by Sex in Blount County
The Blount County industries that see more men than women are Mining, Quarrying, & Extraction (100.0%), Construction (89.7%), and Wholesale Trade (83.5%), whereas the industries that tend to have a higher number of women are Health Care & Social Assistance (76.8%), Educational Services (75.6%), and Finance & Insurance (63.0%).
| Industry | Male | Female |
| Agriculture, Fishing & Hunting | 266 (68.4%) | 123 (31.6%) |
| Mining, Quarrying, & Extraction | 114 (100.0%) | 0 (0.0%) |
| Construction | 4,240 (89.7%) | 485 (10.3%) |
| Manufacturing | 6,927 (74.1%) | 2,419 (25.9%) |
| Wholesale Trade | 1,249 (83.5%) | 247 (16.5%) |
| Retail Trade | 4,364 (53.0%) | 3,866 (47.0%) |
| Transportation & Warehousing | 2,510 (76.2%) | 783 (23.8%) |
| Utilities | 433 (78.0%) | 122 (22.0%) |
| Information | 519 (72.6%) | 196 (27.4%) |
| Finance & Insurance | 1,303 (37.0%) | 2,216 (63.0%) |
| Real Estate, Rental & Leasing | 476 (43.4%) | 620 (56.6%) |
| Professional & Scientific | 1,353 (46.3%) | 1,569 (53.7%) |
| Enterprise Management | 121 (40.2%) | 180 (59.8%) |
| Administrative & Support | 1,647 (57.7%) | 1,208 (42.3%) |
| Educational Services | 1,268 (24.4%) | 3,930 (75.6%) |
| Health Care & Social Assistance | 2,220 (23.2%) | 7,364 (76.8%) |
| Arts, Entertainment & Recreation | 293 (44.3%) | 369 (55.7%) |
| Accommodation & Food Services | 2,371 (46.6%) | 2,717 (53.4%) |
| Public Administration | 1,575 (68.4%) | 728 (31.6%) |
| Total | 34,546 (53.1%) | 30,535 (46.9%) |
Education in Blount County
School Enrollment in Blount County
The most common levels of schooling among the 26,742 students in Blount County are high school (6,385 | 23.9%), middle school (5,929 | 22.2%), and elementary school (5,646 | 21.1%).
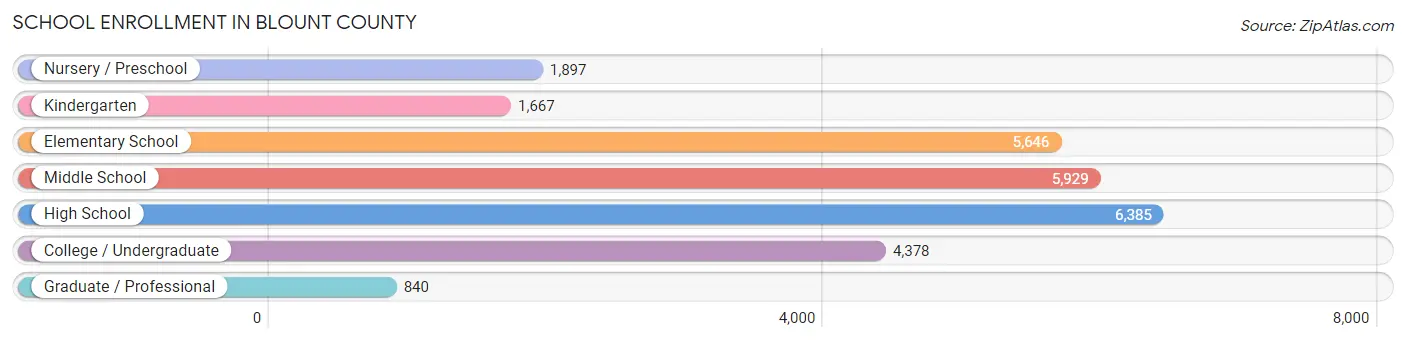
| School Level | # Students | % Students |
| Nursery / Preschool | 1,897 | 7.1% |
| Kindergarten | 1,667 | 6.2% |
| Elementary School | 5,646 | 21.1% |
| Middle School | 5,929 | 22.2% |
| High School | 6,385 | 23.9% |
| College / Undergraduate | 4,378 | 16.4% |
| Graduate / Professional | 840 | 3.1% |
| Total | 26,742 | 100.0% |
School Enrollment by Age by Funding Source in Blount County
Out of a total of 26,742 students who are enrolled in schools in Blount County, 4,439 (16.6%) attend a private institution, while the remaining 22,303 (83.4%) are enrolled in public schools. The age group of 20 to 24 year olds has the highest likelihood of being enrolled in private schools, with 572 (32.2% in the age bracket) enrolled. Conversely, the age group of 35 years and over has the lowest likelihood of being enrolled in a private school, with 1,002 (87.3% in the age bracket) attending a public institution.
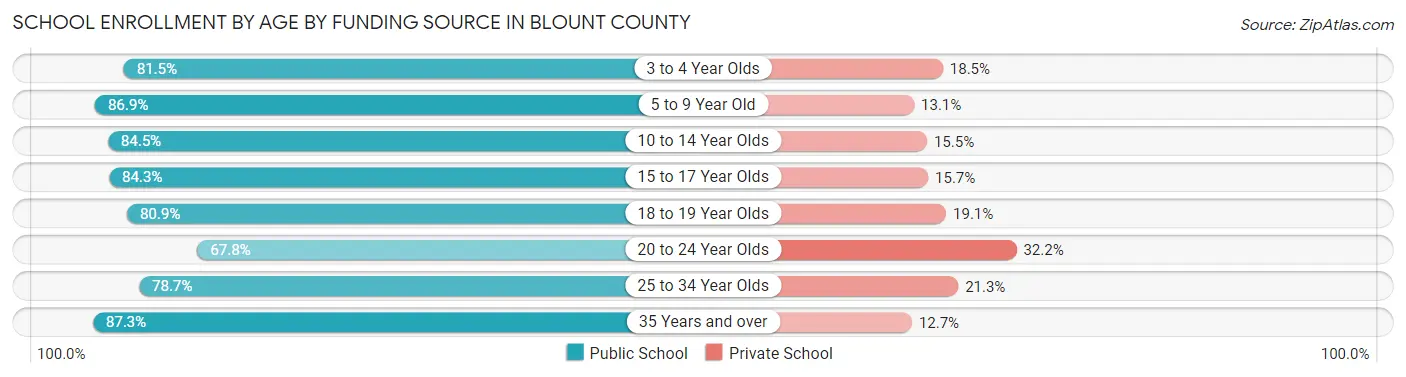
| Age Bracket | Public School | Private School |
| 3 to 4 Year Olds | 1,112 (81.5%) | 252 (18.5%) |
| 5 to 9 Year Old | 6,113 (86.9%) | 923 (13.1%) |
| 10 to 14 Year Olds | 6,196 (84.5%) | 1,138 (15.5%) |
| 15 to 17 Year Olds | 3,944 (84.3%) | 736 (15.7%) |
| 18 to 19 Year Olds | 1,900 (80.9%) | 448 (19.1%) |
| 20 to 24 Year Olds | 1,205 (67.8%) | 572 (32.2%) |
| 25 to 34 Year Olds | 830 (78.7%) | 225 (21.3%) |
| 35 Years and over | 1,002 (87.3%) | 146 (12.7%) |
| Total | 22,303 (83.4%) | 4,439 (16.6%) |
Educational Attainment by Field of Study in Blount County
Business (5,623 | 20.6%), education (4,086 | 15.0%), science & technology (3,446 | 12.6%), arts & humanities (1,967 | 7.2%), and bio, nature & agricultural (1,731 | 6.4%) are the most common fields of study among 27,267 individuals in Blount County who have obtained a bachelor's degree or higher.
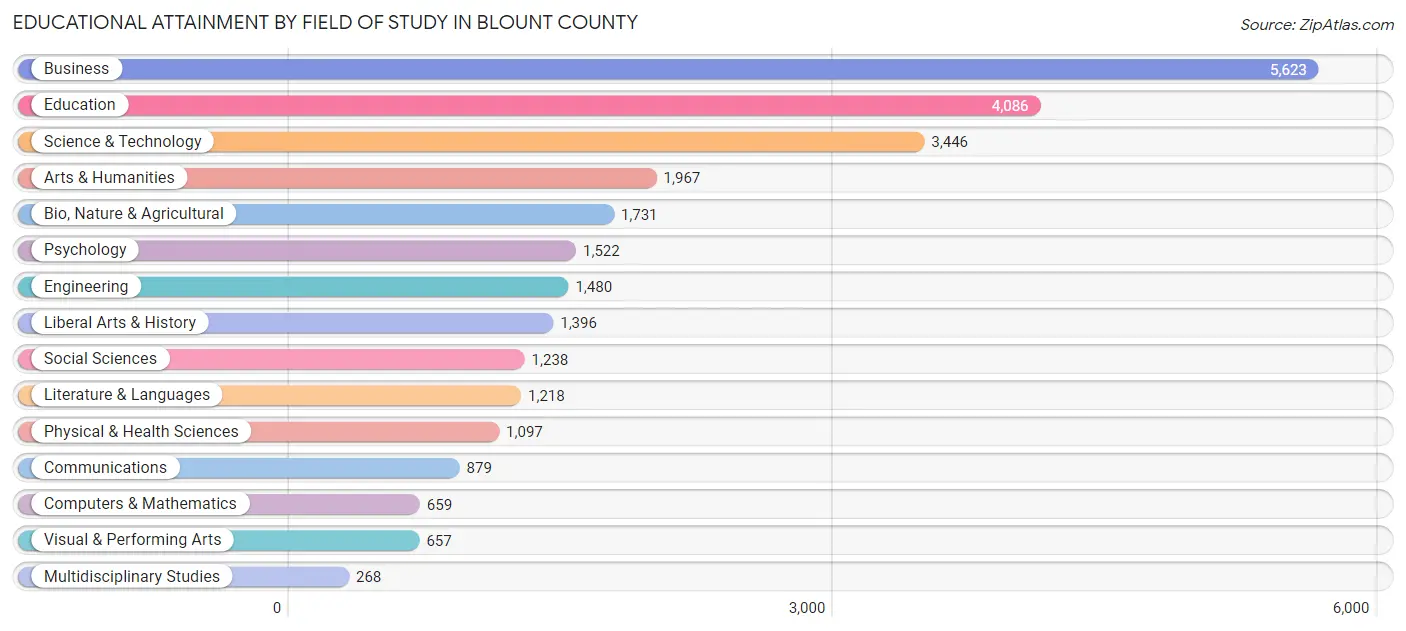
| Field of Study | # Graduates | % Graduates |
| Computers & Mathematics | 659 | 2.4% |
| Bio, Nature & Agricultural | 1,731 | 6.4% |
| Physical & Health Sciences | 1,097 | 4.0% |
| Psychology | 1,522 | 5.6% |
| Social Sciences | 1,238 | 4.5% |
| Engineering | 1,480 | 5.4% |
| Multidisciplinary Studies | 268 | 1.0% |
| Science & Technology | 3,446 | 12.6% |
| Business | 5,623 | 20.6% |
| Education | 4,086 | 15.0% |
| Literature & Languages | 1,218 | 4.5% |
| Liberal Arts & History | 1,396 | 5.1% |
| Visual & Performing Arts | 657 | 2.4% |
| Communications | 879 | 3.2% |
| Arts & Humanities | 1,967 | 7.2% |
| Total | 27,267 | 100.0% |
Transportation & Commute in Blount County
Vehicle Availability by Sex in Blount County
The most prevalent vehicle ownership categories in Blount County are males with 2 vehicles (12,833, accounting for 37.2%) and females with 2 vehicles (11,069, making up 43.1%).
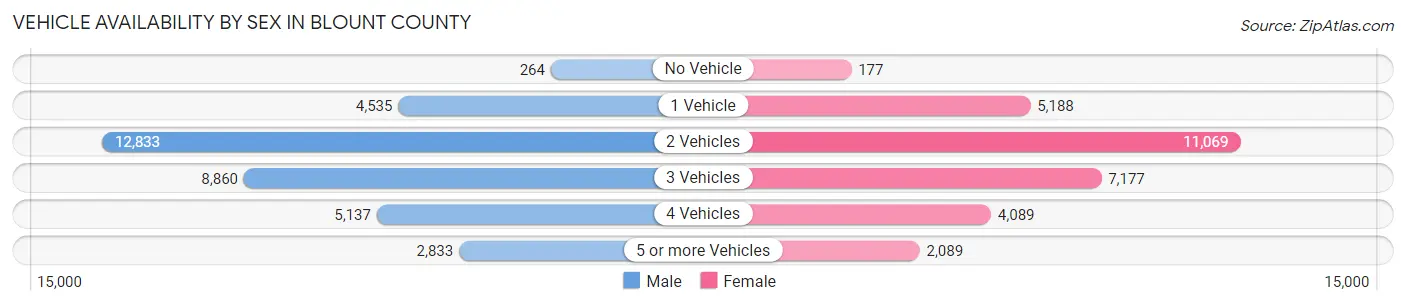
| Vehicles Available | Male | Female |
| No Vehicle | 264 (0.8%) | 177 (0.6%) |
| 1 Vehicle | 4,535 (13.2%) | 5,188 (17.4%) |
| 2 Vehicles | 12,833 (37.2%) | 11,069 (37.2%) |
| 3 Vehicles | 8,860 (25.7%) | 7,177 (24.1%) |
| 4 Vehicles | 5,137 (14.9%) | 4,089 (13.7%) |
| 5 or more Vehicles | 2,833 (8.2%) | 2,089 (7.0%) |
| Total | 34,462 (100.0%) | 29,789 (100.0%) |
Commute Time in Blount County
The most frequently occuring commute durations in Blount County are 15 to 19 minutes (9,834 commuters, 16.9%), 30 to 34 minutes (8,902 commuters, 15.3%), and 20 to 24 minutes (8,125 commuters, 14.0%).
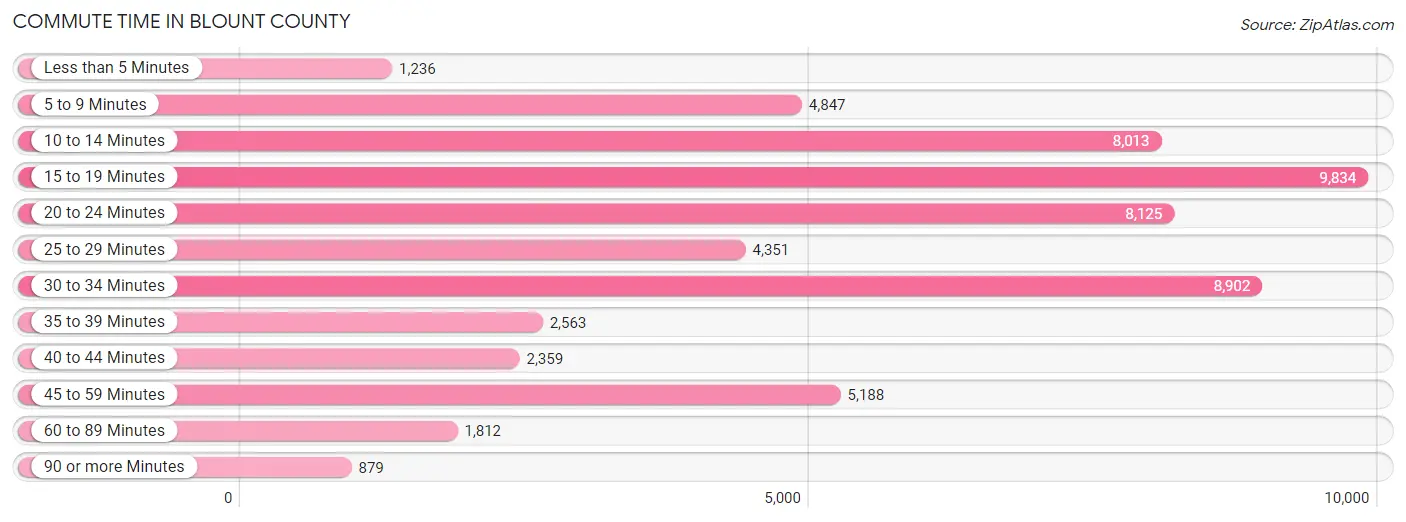
| Commute Time | # Commuters | % Commuters |
| Less than 5 Minutes | 1,236 | 2.1% |
| 5 to 9 Minutes | 4,847 | 8.3% |
| 10 to 14 Minutes | 8,013 | 13.8% |
| 15 to 19 Minutes | 9,834 | 16.9% |
| 20 to 24 Minutes | 8,125 | 14.0% |
| 25 to 29 Minutes | 4,351 | 7.5% |
| 30 to 34 Minutes | 8,902 | 15.3% |
| 35 to 39 Minutes | 2,563 | 4.4% |
| 40 to 44 Minutes | 2,359 | 4.1% |
| 45 to 59 Minutes | 5,188 | 8.9% |
| 60 to 89 Minutes | 1,812 | 3.1% |
| 90 or more Minutes | 879 | 1.5% |
Commute Time by Sex in Blount County
The most common commute times in Blount County are 15 to 19 minutes (5,855 commuters, 18.7%) for males and 10 to 14 minutes (4,262 commuters, 15.9%) for females.
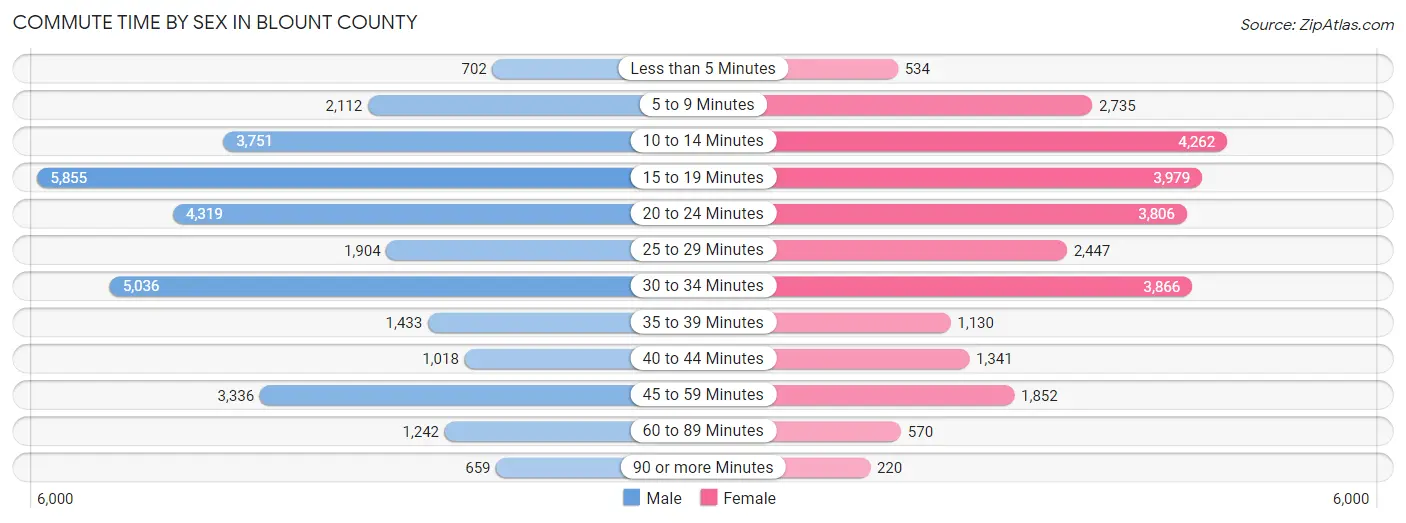
| Commute Time | Male | Female |
| Less than 5 Minutes | 702 (2.2%) | 534 (2.0%) |
| 5 to 9 Minutes | 2,112 (6.7%) | 2,735 (10.2%) |
| 10 to 14 Minutes | 3,751 (12.0%) | 4,262 (15.9%) |
| 15 to 19 Minutes | 5,855 (18.7%) | 3,979 (14.9%) |
| 20 to 24 Minutes | 4,319 (13.8%) | 3,806 (14.2%) |
| 25 to 29 Minutes | 1,904 (6.1%) | 2,447 (9.1%) |
| 30 to 34 Minutes | 5,036 (16.1%) | 3,866 (14.5%) |
| 35 to 39 Minutes | 1,433 (4.6%) | 1,130 (4.2%) |
| 40 to 44 Minutes | 1,018 (3.3%) | 1,341 (5.0%) |
| 45 to 59 Minutes | 3,336 (10.6%) | 1,852 (6.9%) |
| 60 to 89 Minutes | 1,242 (4.0%) | 570 (2.1%) |
| 90 or more Minutes | 659 (2.1%) | 220 (0.8%) |
Time of Departure to Work by Sex in Blount County
The most frequent times of departure to work in Blount County are 7:00 AM to 7:29 AM (4,234, 13.5%) for males and 7:00 AM to 7:29 AM (4,955, 18.5%) for females.
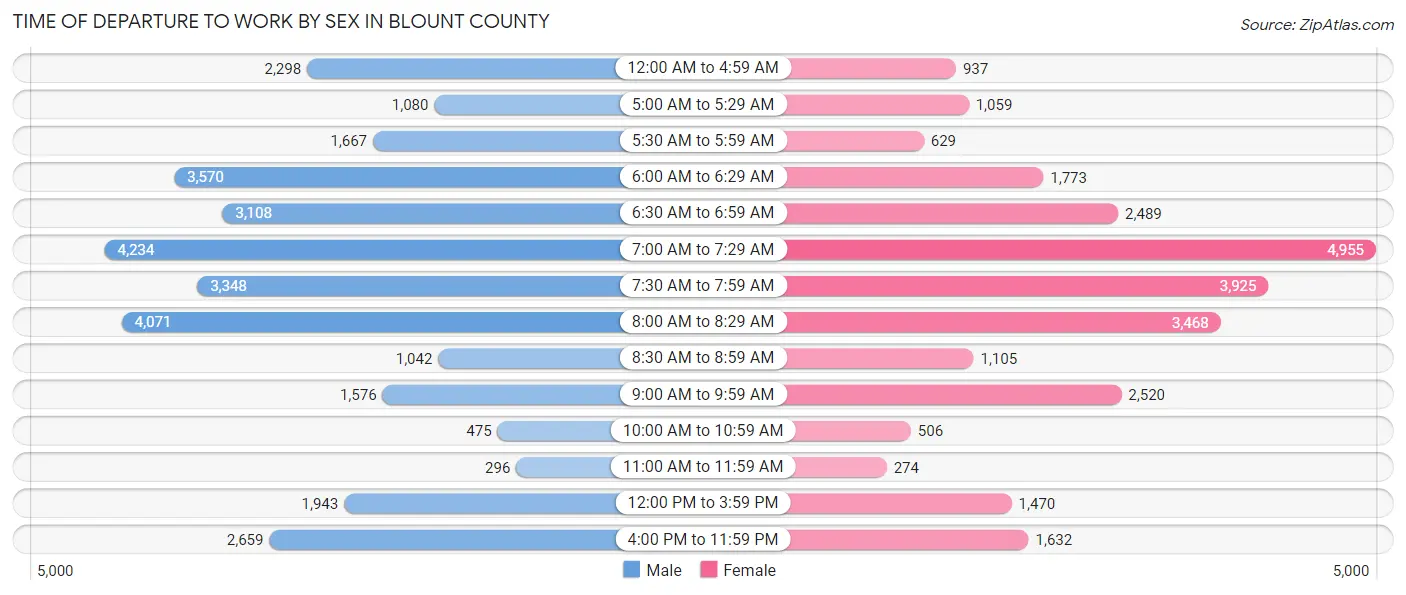
| Time of Departure | Male | Female |
| 12:00 AM to 4:59 AM | 2,298 (7.3%) | 937 (3.5%) |
| 5:00 AM to 5:29 AM | 1,080 (3.4%) | 1,059 (4.0%) |
| 5:30 AM to 5:59 AM | 1,667 (5.3%) | 629 (2.4%) |
| 6:00 AM to 6:29 AM | 3,570 (11.4%) | 1,773 (6.6%) |
| 6:30 AM to 6:59 AM | 3,108 (9.9%) | 2,489 (9.3%) |
| 7:00 AM to 7:29 AM | 4,234 (13.5%) | 4,955 (18.5%) |
| 7:30 AM to 7:59 AM | 3,348 (10.7%) | 3,925 (14.7%) |
| 8:00 AM to 8:29 AM | 4,071 (13.0%) | 3,468 (13.0%) |
| 8:30 AM to 8:59 AM | 1,042 (3.3%) | 1,105 (4.1%) |
| 9:00 AM to 9:59 AM | 1,576 (5.0%) | 2,520 (9.4%) |
| 10:00 AM to 10:59 AM | 475 (1.5%) | 506 (1.9%) |
| 11:00 AM to 11:59 AM | 296 (0.9%) | 274 (1.0%) |
| 12:00 PM to 3:59 PM | 1,943 (6.2%) | 1,470 (5.5%) |
| 4:00 PM to 11:59 PM | 2,659 (8.5%) | 1,632 (6.1%) |
| Total | 31,367 (100.0%) | 26,742 (100.0%) |
Housing Occupancy in Blount County
Occupancy by Ownership in Blount County
Of the total 53,456 dwellings in Blount County, owner-occupied units account for 40,762 (76.2%), while renter-occupied units make up 12,694 (23.7%).
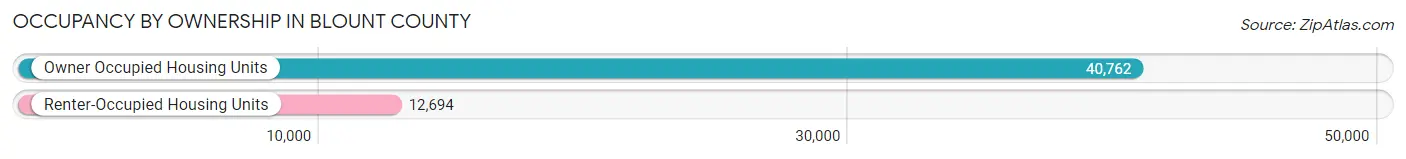
| Occupancy | # Housing Units | % Housing Units |
| Owner Occupied Housing Units | 40,762 | 76.2% |
| Renter-Occupied Housing Units | 12,694 | 23.7% |
| Total Occupied Housing Units | 53,456 | 100.0% |
Occupancy by Household Size in Blount County
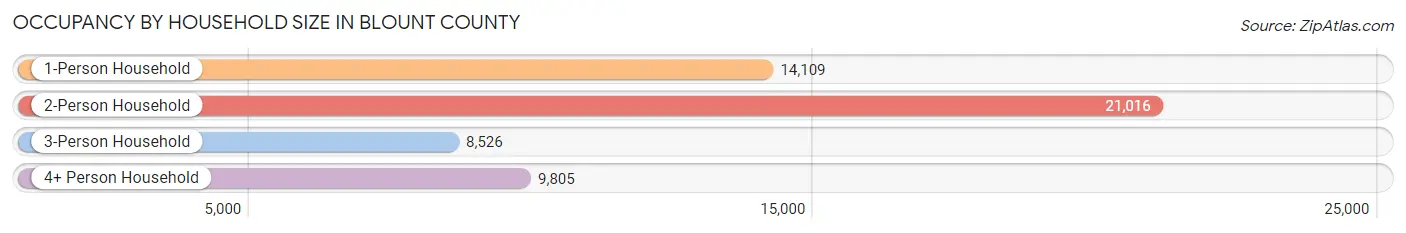
| Household Size | # Housing Units | % Housing Units |
| 1-Person Household | 14,109 | 26.4% |
| 2-Person Household | 21,016 | 39.3% |
| 3-Person Household | 8,526 | 16.0% |
| 4+ Person Household | 9,805 | 18.3% |
| Total Housing Units | 53,456 | 100.0% |
Occupancy by Ownership by Household Size in Blount County
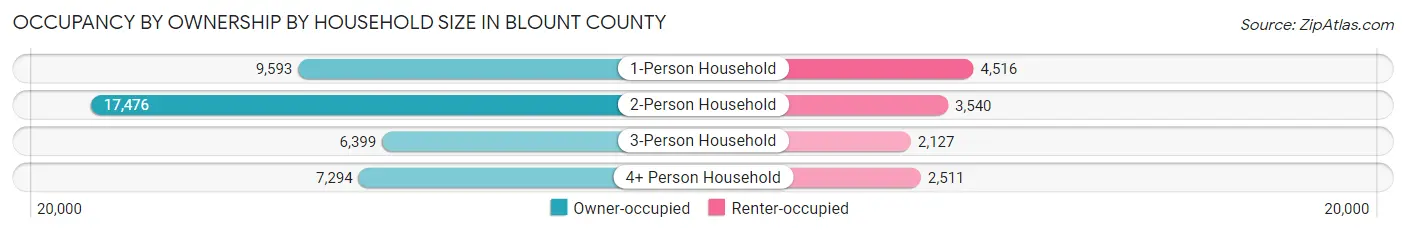
| Household Size | Owner-occupied | Renter-occupied |
| 1-Person Household | 9,593 (68.0%) | 4,516 (32.0%) |
| 2-Person Household | 17,476 (83.2%) | 3,540 (16.8%) |
| 3-Person Household | 6,399 (75.0%) | 2,127 (24.9%) |
| 4+ Person Household | 7,294 (74.4%) | 2,511 (25.6%) |
| Total Housing Units | 40,762 (76.2%) | 12,694 (23.7%) |
Occupancy by Educational Attainment in Blount County
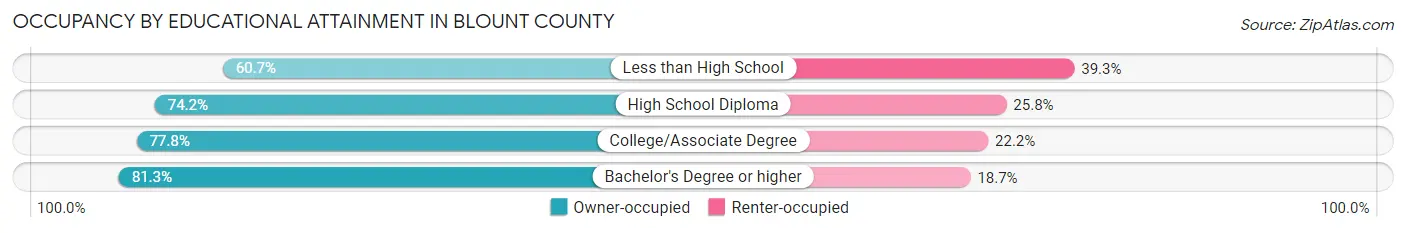
| Household Size | Owner-occupied | Renter-occupied |
| Less than High School | 2,595 (60.7%) | 1,679 (39.3%) |
| High School Diploma | 13,015 (74.2%) | 4,531 (25.8%) |
| College/Associate Degree | 12,721 (77.8%) | 3,627 (22.2%) |
| Bachelor's Degree or higher | 12,431 (81.3%) | 2,857 (18.7%) |
Occupancy by Age of Householder in Blount County
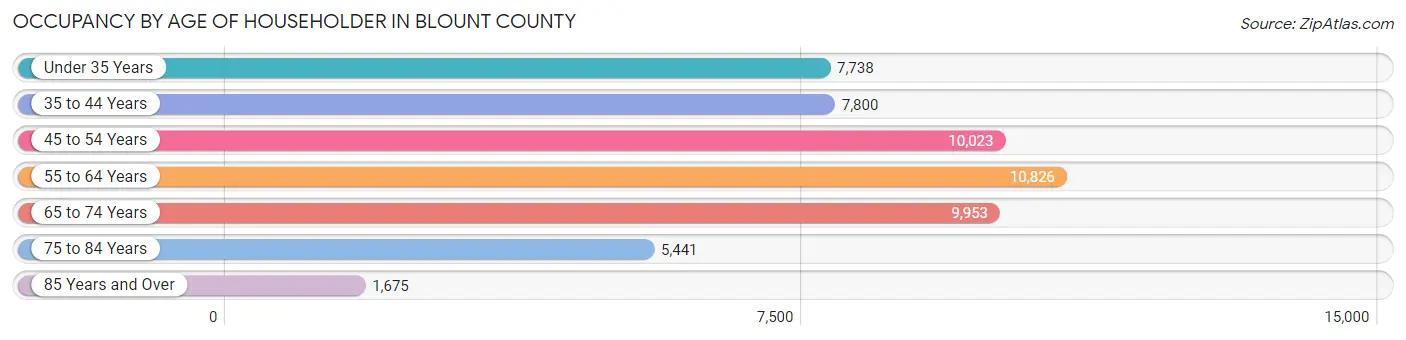
| Age Bracket | # Households | % Households |
| Under 35 Years | 7,738 | 14.5% |
| 35 to 44 Years | 7,800 | 14.6% |
| 45 to 54 Years | 10,023 | 18.8% |
| 55 to 64 Years | 10,826 | 20.3% |
| 65 to 74 Years | 9,953 | 18.6% |
| 75 to 84 Years | 5,441 | 10.2% |
| 85 Years and Over | 1,675 | 3.1% |
| Total | 53,456 | 100.0% |
Housing Finances in Blount County
Median Income by Occupancy in Blount County
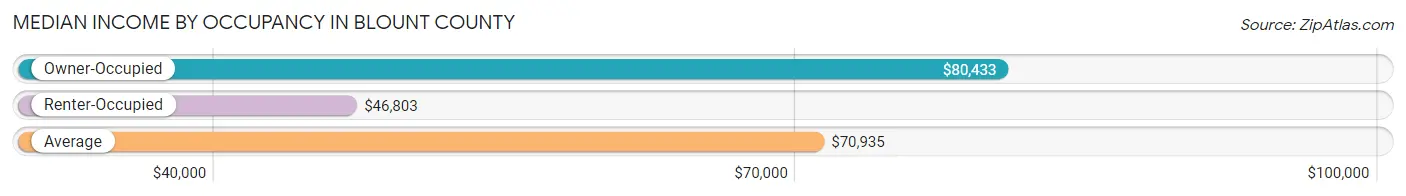
| Occupancy Type | # Households | Median Income |
| Owner-Occupied | 40,762 (76.2%) | $80,433 |
| Renter-Occupied | 12,694 (23.7%) | $46,803 |
| Average | 53,456 (100.0%) | $70,935 |
Occupancy by Householder Income Bracket in Blount County
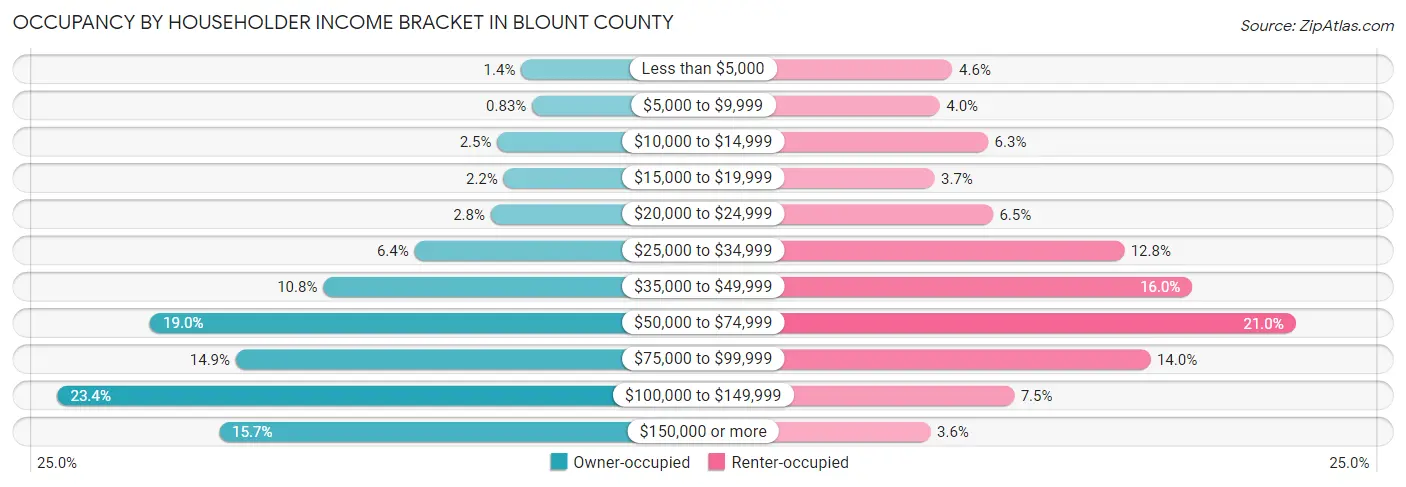
| Income Bracket | Owner-occupied | Renter-occupied |
| Less than $5,000 | 549 (1.3%) | 584 (4.6%) |
| $5,000 to $9,999 | 340 (0.8%) | 507 (4.0%) |
| $10,000 to $14,999 | 1,013 (2.5%) | 798 (6.3%) |
| $15,000 to $19,999 | 893 (2.2%) | 475 (3.7%) |
| $20,000 to $24,999 | 1,143 (2.8%) | 828 (6.5%) |
| $25,000 to $34,999 | 2,619 (6.4%) | 1,621 (12.8%) |
| $35,000 to $49,999 | 4,393 (10.8%) | 2,035 (16.0%) |
| $50,000 to $74,999 | 7,753 (19.0%) | 2,659 (20.9%) |
| $75,000 to $99,999 | 6,090 (14.9%) | 1,780 (14.0%) |
| $100,000 to $149,999 | 9,552 (23.4%) | 956 (7.5%) |
| $150,000 or more | 6,417 (15.7%) | 451 (3.5%) |
| Total | 40,762 (100.0%) | 12,694 (100.0%) |
Monthly Housing Cost Tiers in Blount County
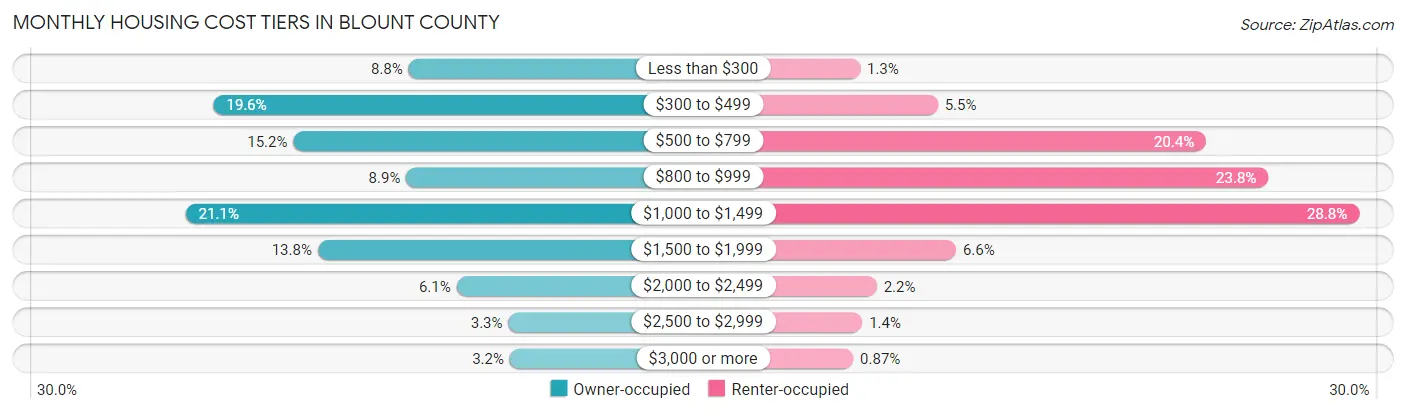
| Monthly Cost | Owner-occupied | Renter-occupied |
| Less than $300 | 3,585 (8.8%) | 159 (1.3%) |
| $300 to $499 | 7,979 (19.6%) | 703 (5.5%) |
| $500 to $799 | 6,179 (15.2%) | 2,584 (20.4%) |
| $800 to $999 | 3,636 (8.9%) | 3,020 (23.8%) |
| $1,000 to $1,499 | 8,606 (21.1%) | 3,657 (28.8%) |
| $1,500 to $1,999 | 5,631 (13.8%) | 832 (6.6%) |
| $2,000 to $2,499 | 2,502 (6.1%) | 276 (2.2%) |
| $2,500 to $2,999 | 1,339 (3.3%) | 174 (1.4%) |
| $3,000 or more | 1,305 (3.2%) | 111 (0.9%) |
| Total | 40,762 (100.0%) | 12,694 (100.0%) |
Physical Housing Characteristics in Blount County
Housing Structures in Blount County
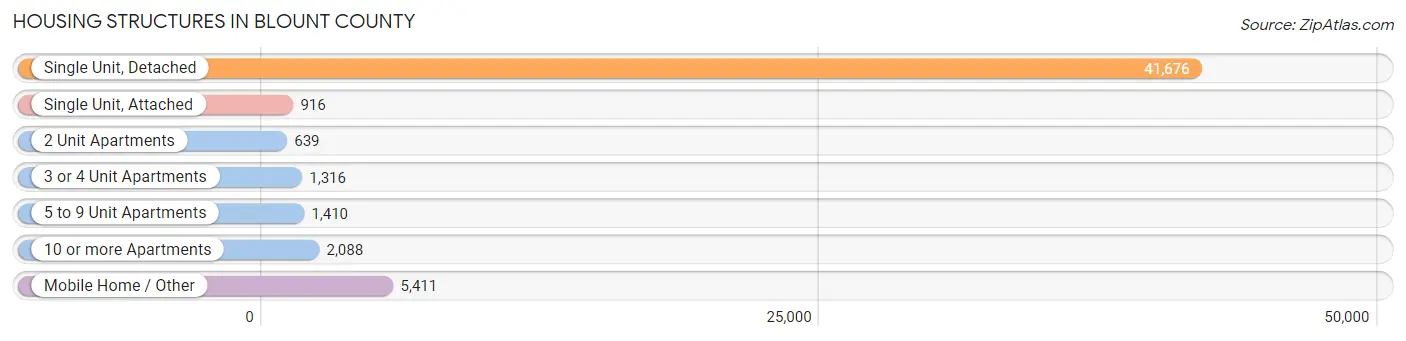
| Structure Type | # Housing Units | % Housing Units |
| Single Unit, Detached | 41,676 | 78.0% |
| Single Unit, Attached | 916 | 1.7% |
| 2 Unit Apartments | 639 | 1.2% |
| 3 or 4 Unit Apartments | 1,316 | 2.5% |
| 5 to 9 Unit Apartments | 1,410 | 2.6% |
| 10 or more Apartments | 2,088 | 3.9% |
| Mobile Home / Other | 5,411 | 10.1% |
| Total | 53,456 | 100.0% |
Housing Structures by Occupancy in Blount County
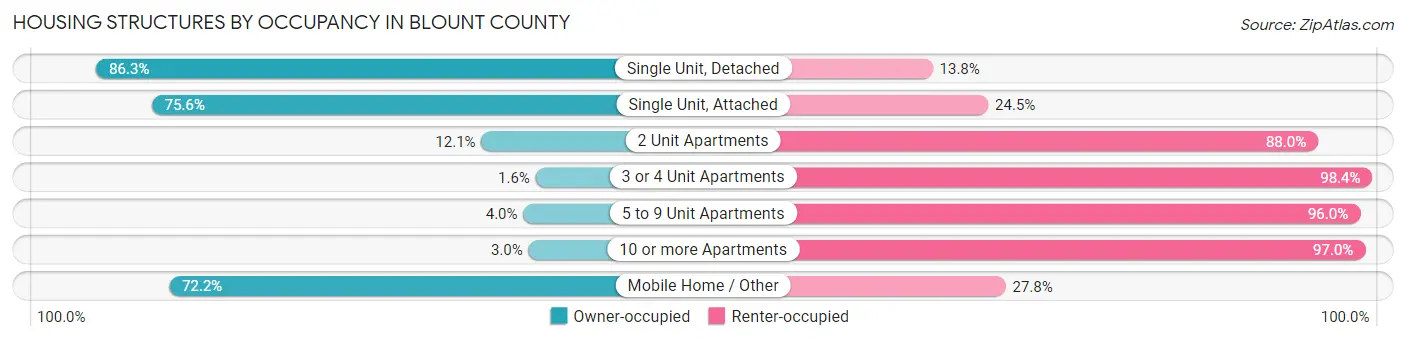
| Structure Type | Owner-occupied | Renter-occupied |
| Single Unit, Detached | 35,947 (86.3%) | 5,729 (13.8%) |
| Single Unit, Attached | 692 (75.5%) | 224 (24.4%) |
| 2 Unit Apartments | 77 (12.0%) | 562 (87.9%) |
| 3 or 4 Unit Apartments | 21 (1.6%) | 1,295 (98.4%) |
| 5 to 9 Unit Apartments | 56 (4.0%) | 1,354 (96.0%) |
| 10 or more Apartments | 62 (3.0%) | 2,026 (97.0%) |
| Mobile Home / Other | 3,907 (72.2%) | 1,504 (27.8%) |
| Total | 40,762 (76.2%) | 12,694 (23.7%) |
Housing Structures by Number of Rooms in Blount County
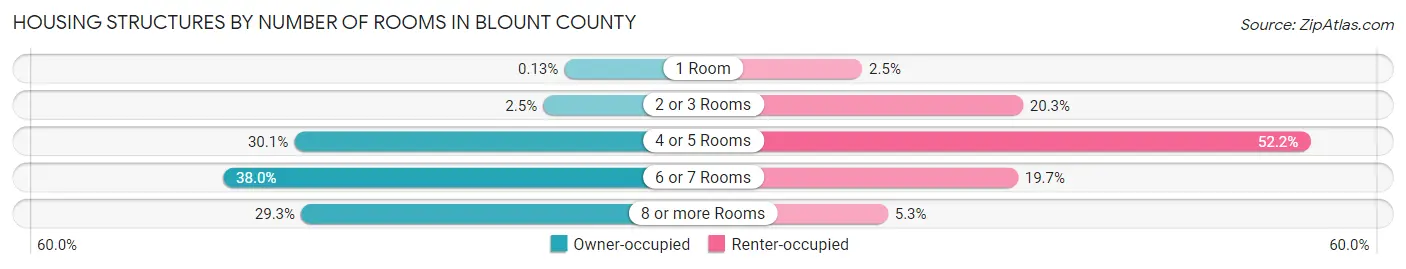
| Number of Rooms | Owner-occupied | Renter-occupied |
| 1 Room | 51 (0.1%) | 313 (2.5%) |
| 2 or 3 Rooms | 1,007 (2.5%) | 2,577 (20.3%) |
| 4 or 5 Rooms | 12,269 (30.1%) | 6,624 (52.2%) |
| 6 or 7 Rooms | 15,475 (38.0%) | 2,506 (19.7%) |
| 8 or more Rooms | 11,960 (29.3%) | 674 (5.3%) |
| Total | 40,762 (100.0%) | 12,694 (100.0%) |
Housing Structure by Heating Type in Blount County
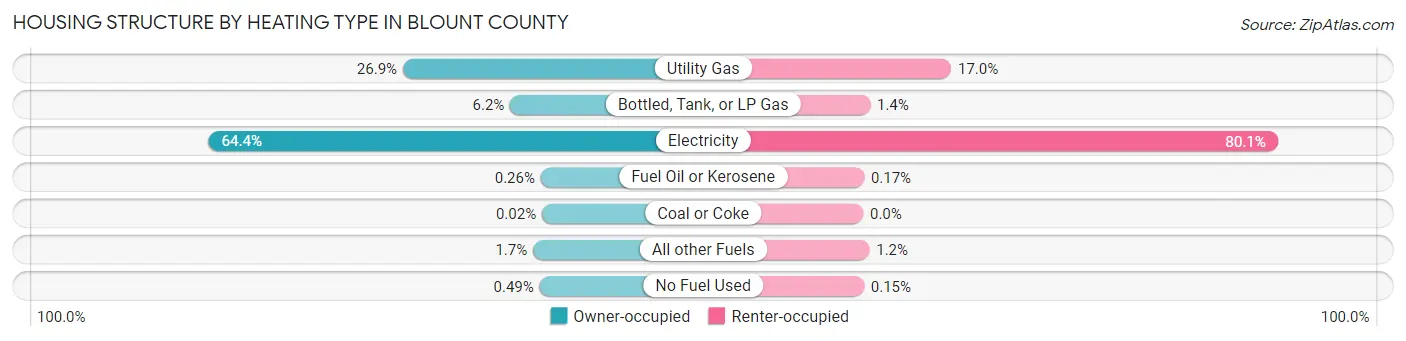
| Heating Type | Owner-occupied | Renter-occupied |
| Utility Gas | 10,967 (26.9%) | 2,159 (17.0%) |
| Bottled, Tank, or LP Gas | 2,514 (6.2%) | 172 (1.3%) |
| Electricity | 26,261 (64.4%) | 10,169 (80.1%) |
| Fuel Oil or Kerosene | 104 (0.3%) | 22 (0.2%) |
| Coal or Coke | 7 (0.0%) | 0 (0.0%) |
| All other Fuels | 711 (1.7%) | 153 (1.2%) |
| No Fuel Used | 198 (0.5%) | 19 (0.2%) |
| Total | 40,762 (100.0%) | 12,694 (100.0%) |
Household Vehicle Usage in Blount County
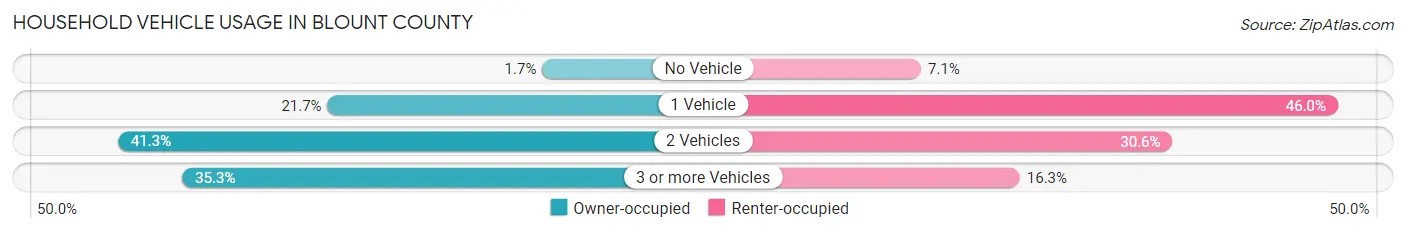
| Vehicles per Household | Owner-occupied | Renter-occupied |
| No Vehicle | 683 (1.7%) | 902 (7.1%) |
| 1 Vehicle | 8,857 (21.7%) | 5,840 (46.0%) |
| 2 Vehicles | 16,835 (41.3%) | 3,879 (30.6%) |
| 3 or more Vehicles | 14,387 (35.3%) | 2,073 (16.3%) |
| Total | 40,762 (100.0%) | 12,694 (100.0%) |
Real Estate & Mortgages in Blount County
Real Estate and Mortgage Overview in Blount County
| Characteristic | Without Mortgage | With Mortgage |
| Housing Units | 17,209 | 23,553 |
| Median Property Value | $230,000 | $259,900 |
| Median Household Income | $62,611 | $4,234 |
| Monthly Housing Costs | $427 | $1,278 |
| Real Estate Taxes | $1,237 | $567 |
Property Value by Mortgage Status in Blount County
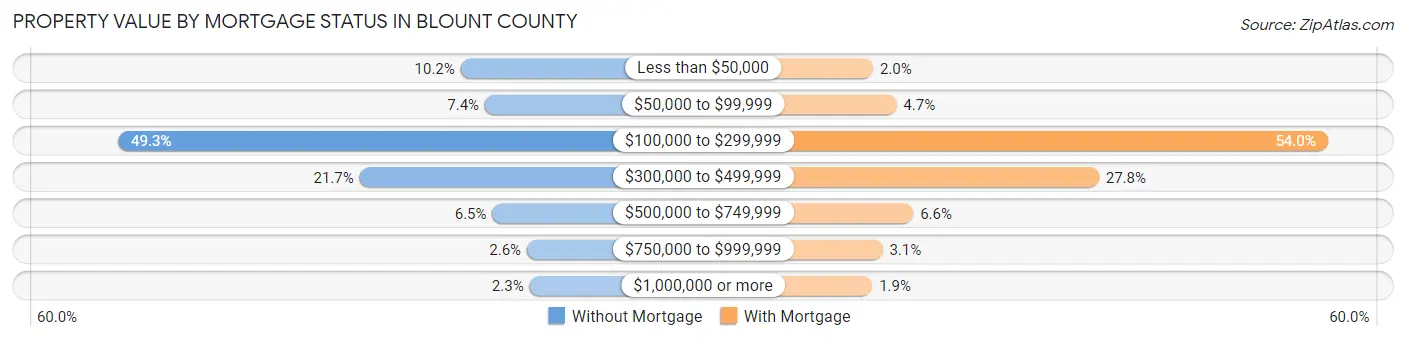
| Property Value | Without Mortgage | With Mortgage |
| Less than $50,000 | 1,750 (10.2%) | 469 (2.0%) |
| $50,000 to $99,999 | 1,271 (7.4%) | 1,100 (4.7%) |
| $100,000 to $299,999 | 8,485 (49.3%) | 12,709 (54.0%) |
| $300,000 to $499,999 | 3,737 (21.7%) | 6,547 (27.8%) |
| $500,000 to $749,999 | 1,125 (6.5%) | 1,553 (6.6%) |
| $750,000 to $999,999 | 446 (2.6%) | 726 (3.1%) |
| $1,000,000 or more | 395 (2.3%) | 449 (1.9%) |
| Total | 17,209 (100.0%) | 23,553 (100.0%) |
Household Income by Mortgage Status in Blount County
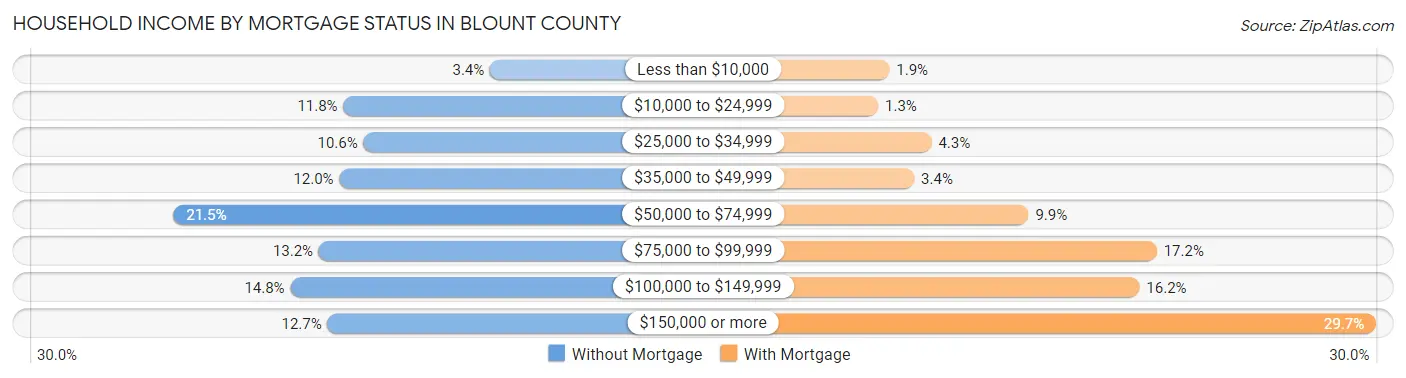
| Household Income | Without Mortgage | With Mortgage |
| Less than $10,000 | 585 (3.4%) | 454 (1.9%) |
| $10,000 to $24,999 | 2,027 (11.8%) | 304 (1.3%) |
| $25,000 to $34,999 | 1,830 (10.6%) | 1,022 (4.3%) |
| $35,000 to $49,999 | 2,067 (12.0%) | 789 (3.4%) |
| $50,000 to $74,999 | 3,700 (21.5%) | 2,326 (9.9%) |
| $75,000 to $99,999 | 2,269 (13.2%) | 4,053 (17.2%) |
| $100,000 to $149,999 | 2,548 (14.8%) | 3,821 (16.2%) |
| $150,000 or more | 2,183 (12.7%) | 7,004 (29.7%) |
| Total | 17,209 (100.0%) | 23,553 (100.0%) |
Property Value to Household Income Ratio in Blount County
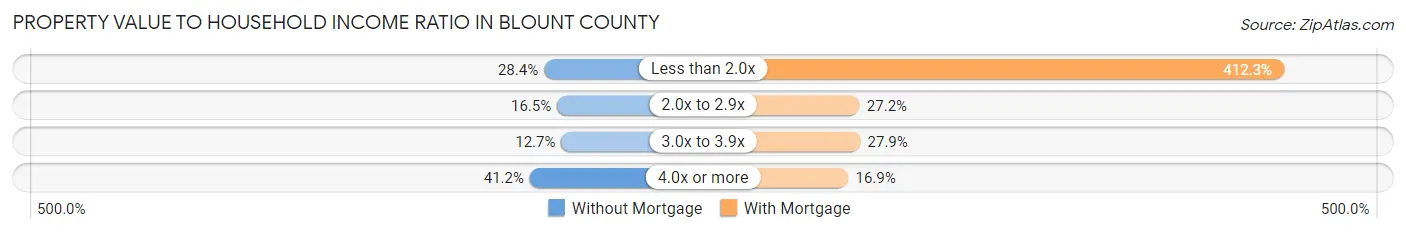
| Value-to-Income Ratio | Without Mortgage | With Mortgage |
| Less than 2.0x | 4,880 (28.4%) | 97,098 (412.2%) |
| 2.0x to 2.9x | 2,839 (16.5%) | 6,412 (27.2%) |
| 3.0x to 3.9x | 2,180 (12.7%) | 6,569 (27.9%) |
| 4.0x or more | 7,096 (41.2%) | 3,986 (16.9%) |
| Total | 17,209 (100.0%) | 23,553 (100.0%) |
Real Estate Taxes by Mortgage Status in Blount County
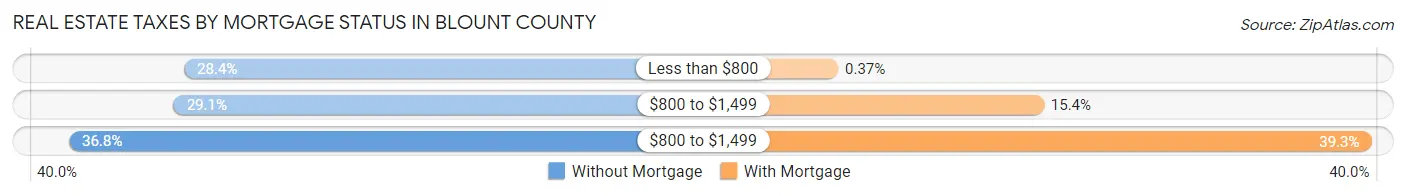
| Property Taxes | Without Mortgage | With Mortgage |
| Less than $800 | 4,879 (28.3%) | 88 (0.4%) |
| $800 to $1,499 | 5,008 (29.1%) | 3,626 (15.4%) |
| $800 to $1,499 | 6,325 (36.7%) | 9,260 (39.3%) |
| Total | 17,209 (100.0%) | 23,553 (100.0%) |
Health & Disability in Blount County
Health Insurance Coverage by Age in Blount County
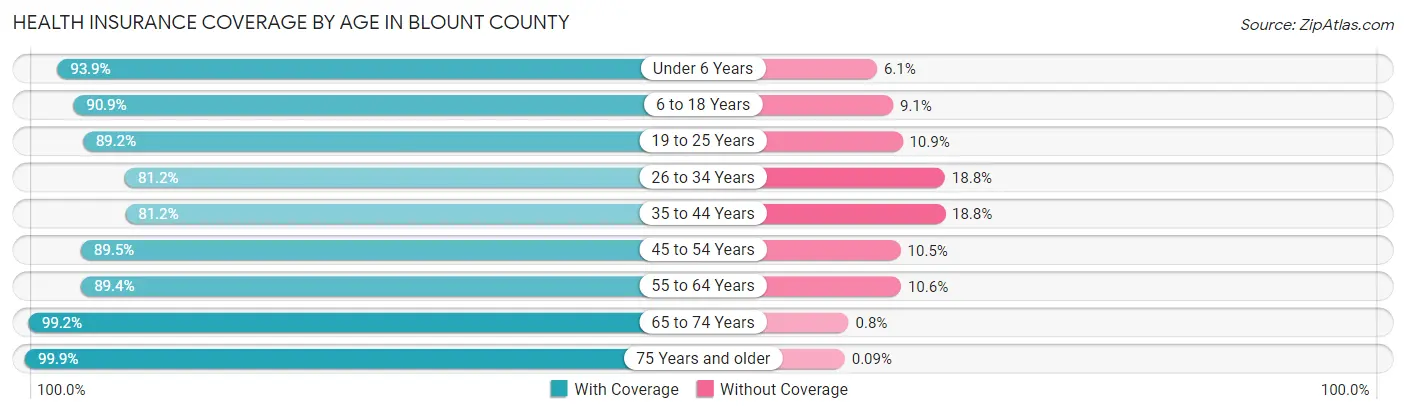
| Age Bracket | With Coverage | Without Coverage |
| Under 6 Years | 7,654 (93.9%) | 497 (6.1%) |
| 6 to 18 Years | 18,733 (90.9%) | 1,873 (9.1%) |
| 19 to 25 Years | 9,209 (89.1%) | 1,121 (10.8%) |
| 26 to 34 Years | 11,834 (81.2%) | 2,732 (18.8%) |
| 35 to 44 Years | 12,769 (81.2%) | 2,952 (18.8%) |
| 45 to 54 Years | 16,085 (89.5%) | 1,889 (10.5%) |
| 55 to 64 Years | 17,698 (89.4%) | 2,092 (10.6%) |
| 65 to 74 Years | 16,303 (99.2%) | 132 (0.8%) |
| 75 Years and older | 11,184 (99.9%) | 10 (0.1%) |
| Total | 121,469 (90.1%) | 13,298 (9.9%) |
Health Insurance Coverage by Citizenship Status in Blount County
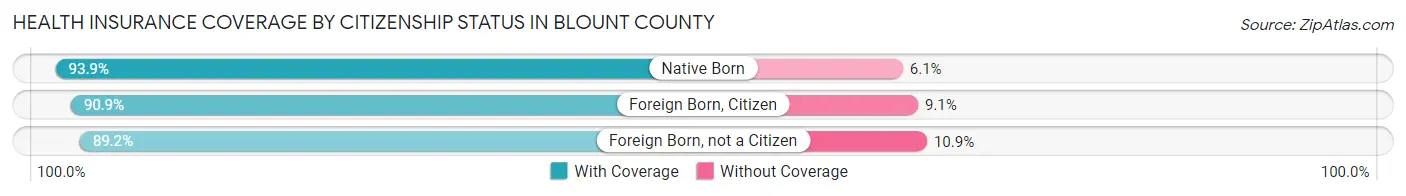
| Citizenship Status | With Coverage | Without Coverage |
| Native Born | 7,654 (93.9%) | 497 (6.1%) |
| Foreign Born, Citizen | 18,733 (90.9%) | 1,873 (9.1%) |
| Foreign Born, not a Citizen | 9,209 (89.1%) | 1,121 (10.8%) |
Health Insurance Coverage by Household Income in Blount County
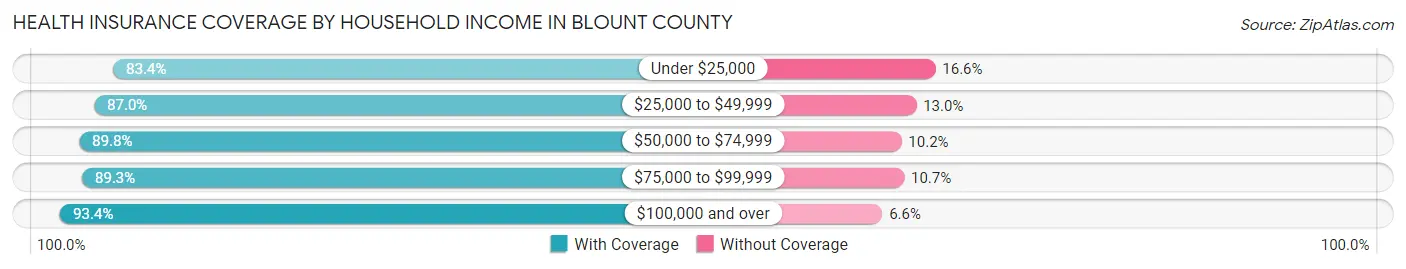
| Household Income | With Coverage | Without Coverage |
| Under $25,000 | 9,504 (83.4%) | 1,891 (16.6%) |
| $25,000 to $49,999 | 18,813 (87.0%) | 2,811 (13.0%) |
| $50,000 to $74,999 | 22,416 (89.8%) | 2,555 (10.2%) |
| $75,000 to $99,999 | 19,654 (89.3%) | 2,362 (10.7%) |
| $100,000 and over | 50,169 (93.4%) | 3,568 (6.6%) |
Public vs Private Health Insurance Coverage by Age in Blount County
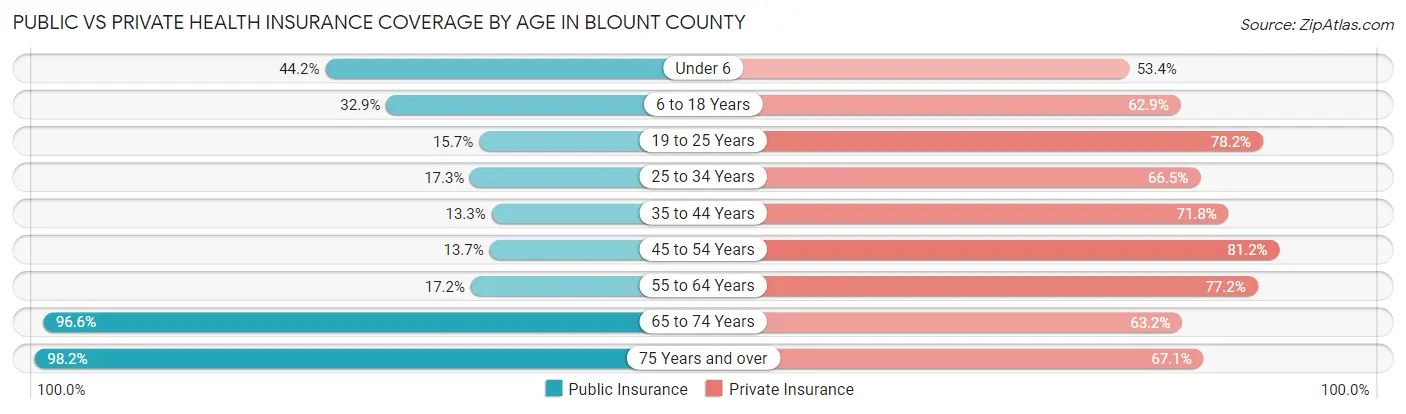
| Age Bracket | Public Insurance | Private Insurance |
| Under 6 | 3,603 (44.2%) | 4,356 (53.4%) |
| 6 to 18 Years | 6,770 (32.9%) | 12,957 (62.9%) |
| 19 to 25 Years | 1,618 (15.7%) | 8,074 (78.2%) |
| 25 to 34 Years | 2,518 (17.3%) | 9,688 (66.5%) |
| 35 to 44 Years | 2,096 (13.3%) | 11,288 (71.8%) |
| 45 to 54 Years | 2,462 (13.7%) | 14,601 (81.2%) |
| 55 to 64 Years | 3,399 (17.2%) | 15,271 (77.2%) |
| 65 to 74 Years | 15,876 (96.6%) | 10,386 (63.2%) |
| 75 Years and over | 10,991 (98.2%) | 7,514 (67.1%) |
| Total | 49,333 (36.6%) | 94,135 (69.9%) |
Disability Status by Sex by Age in Blount County
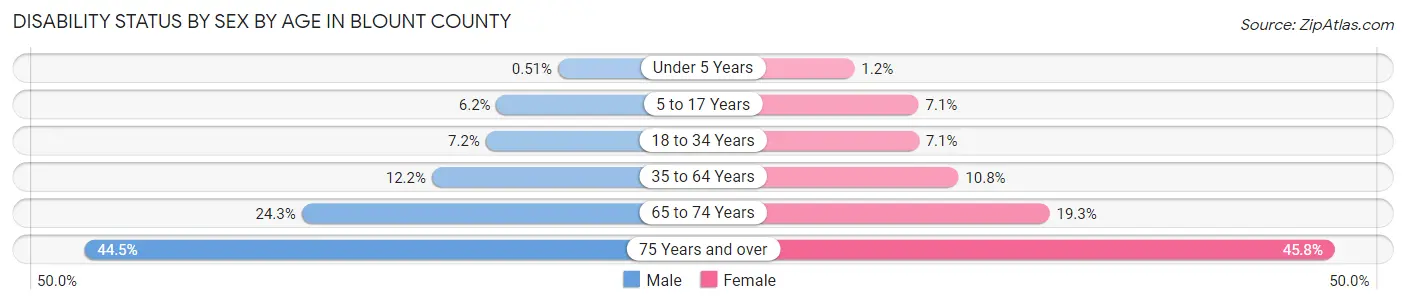
| Age Bracket | Male | Female |
| Under 5 Years | 17 (0.5%) | 38 (1.2%) |
| 5 to 17 Years | 648 (6.2%) | 707 (7.1%) |
| 18 to 34 Years | 971 (7.2%) | 946 (7.1%) |
| 35 to 64 Years | 3,197 (12.2%) | 2,952 (10.8%) |
| 65 to 74 Years | 1,861 (24.3%) | 1,692 (19.3%) |
| 75 Years and over | 2,198 (44.5%) | 2,859 (45.8%) |
Disability Class by Sex by Age in Blount County
Disability Class: Hearing Difficulty
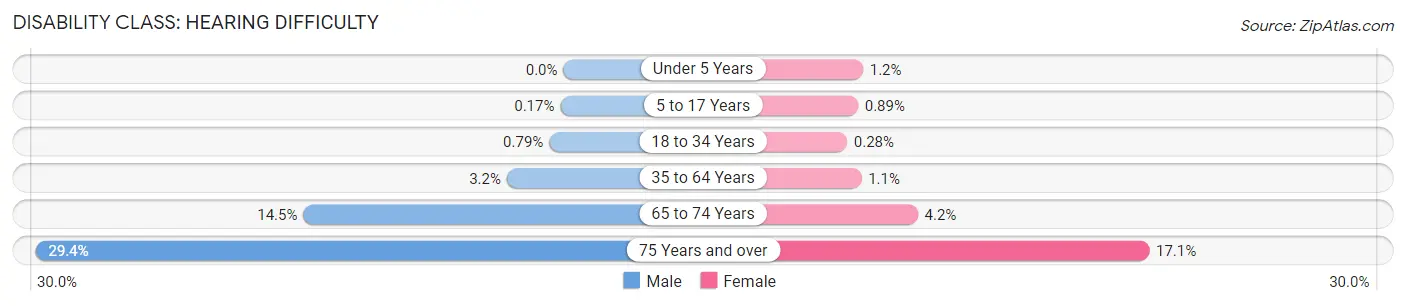
| Age Bracket | Male | Female |
| Under 5 Years | 0 (0.0%) | 38 (1.2%) |
| 5 to 17 Years | 18 (0.2%) | 88 (0.9%) |
| 18 to 34 Years | 107 (0.8%) | 37 (0.3%) |
| 35 to 64 Years | 825 (3.2%) | 296 (1.1%) |
| 65 to 74 Years | 1,109 (14.5%) | 370 (4.2%) |
| 75 Years and over | 1,454 (29.4%) | 1,069 (17.1%) |
Disability Class: Vision Difficulty
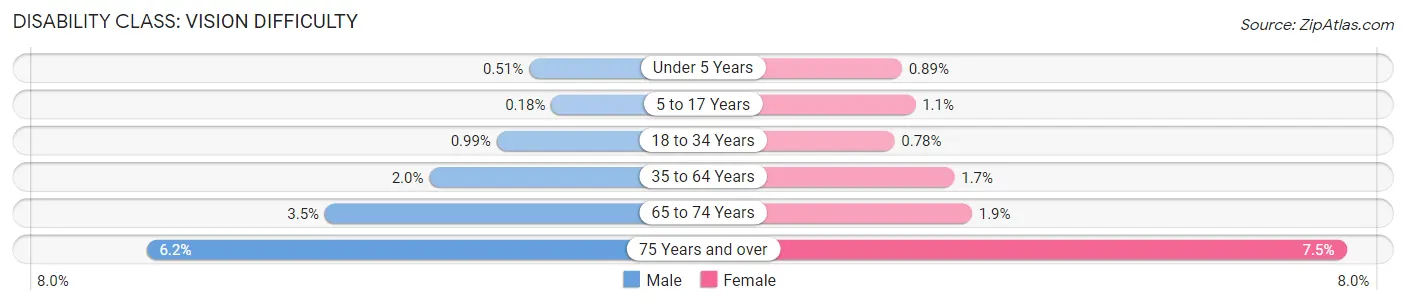
| Age Bracket | Male | Female |
| Under 5 Years | 17 (0.5%) | 29 (0.9%) |
| 5 to 17 Years | 19 (0.2%) | 108 (1.1%) |
| 18 to 34 Years | 133 (1.0%) | 103 (0.8%) |
| 35 to 64 Years | 522 (2.0%) | 455 (1.7%) |
| 65 to 74 Years | 271 (3.5%) | 169 (1.9%) |
| 75 Years and over | 306 (6.2%) | 468 (7.5%) |
Disability Class: Cognitive Difficulty
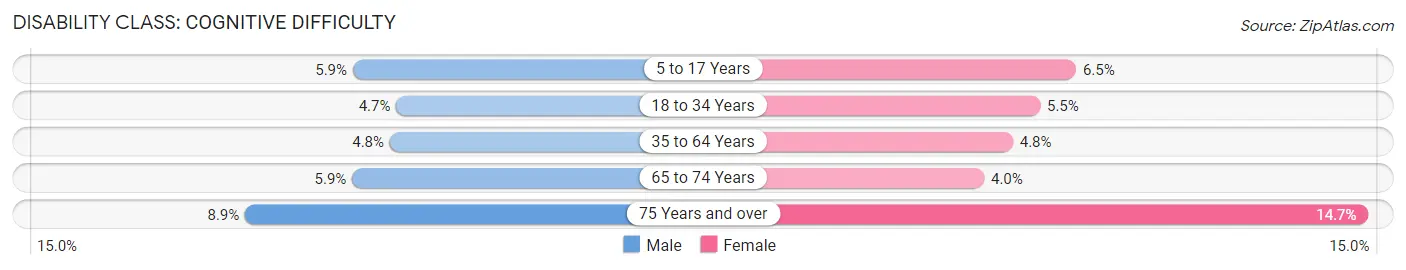
| Age Bracket | Male | Female |
| 5 to 17 Years | 611 (5.9%) | 647 (6.5%) |
| 18 to 34 Years | 626 (4.6%) | 731 (5.5%) |
| 35 to 64 Years | 1,266 (4.8%) | 1,298 (4.8%) |
| 65 to 74 Years | 450 (5.9%) | 348 (4.0%) |
| 75 Years and over | 438 (8.9%) | 916 (14.7%) |
Disability Class: Ambulatory Difficulty
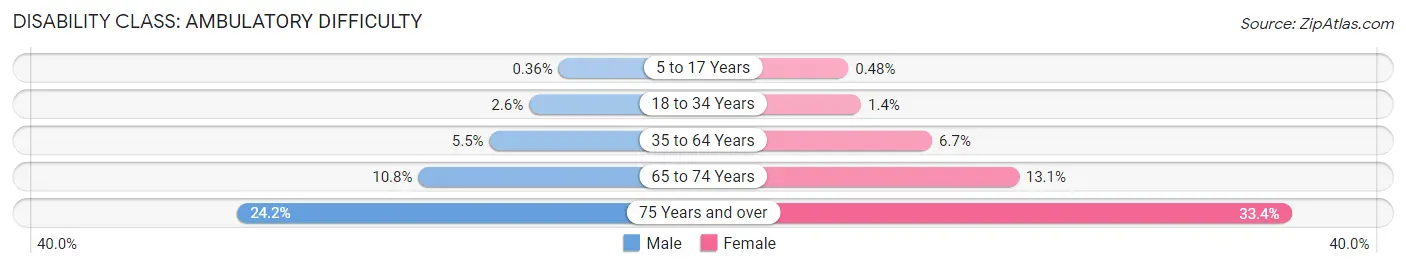
| Age Bracket | Male | Female |
| 5 to 17 Years | 38 (0.4%) | 48 (0.5%) |
| 18 to 34 Years | 343 (2.5%) | 190 (1.4%) |
| 35 to 64 Years | 1,437 (5.5%) | 1,831 (6.7%) |
| 65 to 74 Years | 825 (10.8%) | 1,153 (13.1%) |
| 75 Years and over | 1,197 (24.2%) | 2,086 (33.4%) |
Disability Class: Self-Care Difficulty
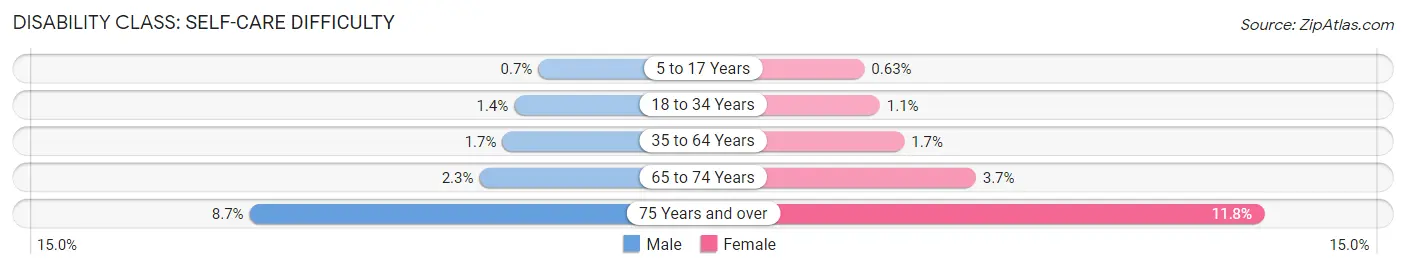
| Age Bracket | Male | Female |
| 5 to 17 Years | 73 (0.7%) | 62 (0.6%) |
| 18 to 34 Years | 185 (1.4%) | 140 (1.1%) |
| 35 to 64 Years | 445 (1.7%) | 476 (1.7%) |
| 65 to 74 Years | 179 (2.3%) | 327 (3.7%) |
| 75 Years and over | 432 (8.7%) | 734 (11.7%) |
Technology Access in Blount County
Computing Device Access in Blount County
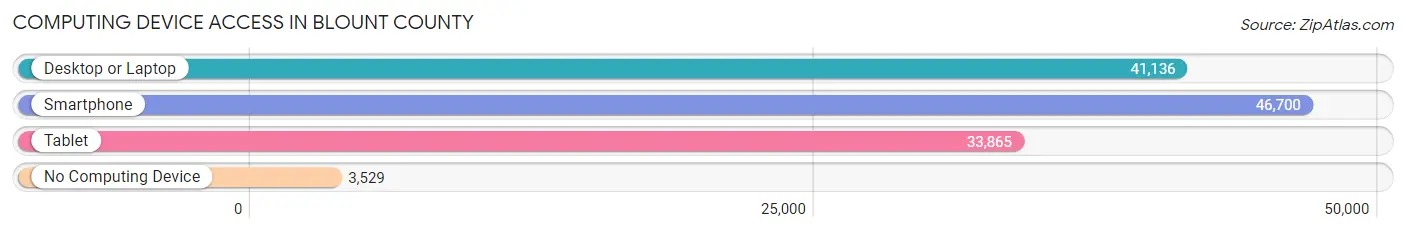
| Device Type | # Households | % Households |
| Desktop or Laptop | 41,136 | 76.9% |
| Smartphone | 46,700 | 87.4% |
| Tablet | 33,865 | 63.3% |
| No Computing Device | 3,529 | 6.6% |
| Total | 53,456 | 100.0% |
Internet Access in Blount County
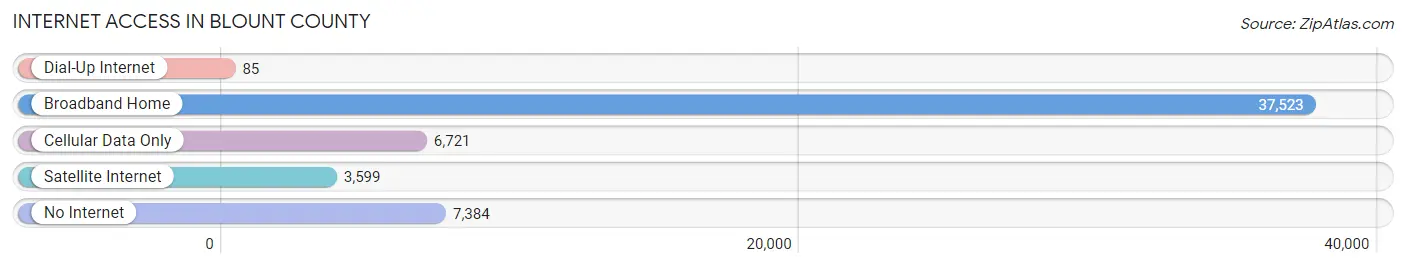
| Internet Type | # Households | % Households |
| Dial-Up Internet | 85 | 0.2% |
| Broadband Home | 37,523 | 70.2% |
| Cellular Data Only | 6,721 | 12.6% |
| Satellite Internet | 3,599 | 6.7% |
| No Internet | 7,384 | 13.8% |
| Total | 53,456 | 100.0% |
Blount County Summary
Blount County, Tennessee is located in the eastern part of the state, just south of Knoxville. It is bordered by Knox, Sevier, Loudon, Monroe, and Sevier counties. The county seat is Maryville, and the county is named after William Blount, the first territorial governor of Tennessee.
History
Blount County was formed in 1795 from parts of Knox and Greene counties. It was named after William Blount, the first territorial governor of Tennessee. The county was originally part of the Cherokee Nation, and the first settlers arrived in the late 1700s. The county was home to several prominent families, including the Blounts, the Fords, and the Tiptons.
The county was an important center of the early iron industry in Tennessee. The first iron furnace was built in 1802, and by the mid-1800s, the county was home to several iron furnaces and forges. The county also had several gristmills, sawmills, and other industries.
During the Civil War, Blount County was a center of Confederate activity. The county was home to several Confederate regiments, and the Battle of Maryville was fought in the county in 1863. After the war, the county was home to several prominent families, including the Fords, the Tiptons, and the Blounts.
Geography
Blount County is located in the eastern part of Tennessee, just south of Knoxville. It is bordered by Knox, Sevier, Loudon, Monroe, and Sevier counties. The county is mostly mountainous, with the Great Smoky Mountains to the east and the Cumberland Plateau to the west. The county is home to several rivers, including the Little River, the Little Tennessee River, and the Chilhowee River.
The county has a total area of 545 square miles, of which 543 square miles is land and 2 square miles is water. The county is home to several state parks, including the Great Smoky Mountains National Park, the Cherokee National Forest, and the Big South Fork National River and Recreation Area.
Economy
Blount County has a diverse economy, with a mix of manufacturing, agriculture, and tourism. The county is home to several large employers, including Denso Manufacturing, Alcoa, and the University of Tennessee. The county is also home to several small businesses, including restaurants, retail stores, and service providers.
Agriculture is an important part of the county’s economy. The county is home to several farms, and the main crops are corn, soybeans, hay, and tobacco. The county is also home to several wineries and breweries.
Tourism is also an important part of the county’s economy. The county is home to several popular attractions, including the Great Smoky Mountains National Park, the Big South Fork National River and Recreation Area, and the Chilhowee Mountain State Park.
Demographics
As of the 2010 census, Blount County had a population of 123,010. The population was spread out, with 24.3% under the age of 18, 10.2% from 18 to 24, 28.2% from 25 to 44, 24.3% from 45 to 64, and 12.9% who were 65 years of age or older. The median age was 36.4 years.
The racial makeup of the county was 92.2% White, 4.2% African American, 0.4% Native American, 1.2% Asian, 0.1% Pacific Islander, 0.7% from other races, and 1.2% from two or more races. Hispanic or Latino of any race were 2.3% of the population.
The median income for a household in the county was $45,945, and the median income for a family was $54,945. The per capita income for the county was $24,945. About 10.2% of families and 13.2% of the population were below the poverty line, including 17.2% of those under age 18 and 9.2% of those age 65 or over.
Common Questions
What is the Total Population of Blount County?
Total Population of Blount County is 135,951.
What is the Total Male Population of Blount County?
Total Male Population of Blount County is 66,732.
What is the Total Female Population of Blount County?
Total Female Population of Blount County is 69,219.
What is the Ratio of Males per 100 Females in Blount County?
There are 96.41 Males per 100 Females in Blount County.
What is the Ratio of Females per 100 Males in Blount County?
There are 103.73 Females per 100 Males in Blount County.
What is the Median Population Age in Blount County?
Median Population Age in Blount County is 43.8 Years.
What is the Average Family Size in Blount County
Average Family Size in Blount County is 3.0 People.
What is the Average Household Size in Blount County
Average Household Size in Blount County is 2.5 People.
What is Per Capita Income in Blount County?
Per Capita income in Blount County is $36,376.
What is the Median Family Income in Blount County?
Median Family Income in Blount County is $85,194.
What is the Median Household income in Blount County?
Median Household Income in Blount County is $70,935.
What is Income or Wage Gap in Blount County?
Income or Wage Gap in Blount County is 31.8%.
Women in Blount County earn 68.2 cents for every dollar earned by a man.
What is Family Income Deficit in Blount County?
Family Income Deficit in Blount County is $10,308.
Families that are below poverty line in Blount County earn $10,308 less on average than the poverty threshold level.
What is Inequality or Gini Index in Blount County?
Inequality or Gini Index in Blount County is 0.42.
How Large is the Labor Force in Blount County?
There are 68,090 People in the Labor Forcein in Blount County.
What is the Percentage of People in the Labor Force in Blount County?
60.5% of People are in the Labor Force in Blount County.
What is the Unemployment Rate in Blount County?
Unemployment Rate in Blount County is 4.1%.