Bledsoe County, TN
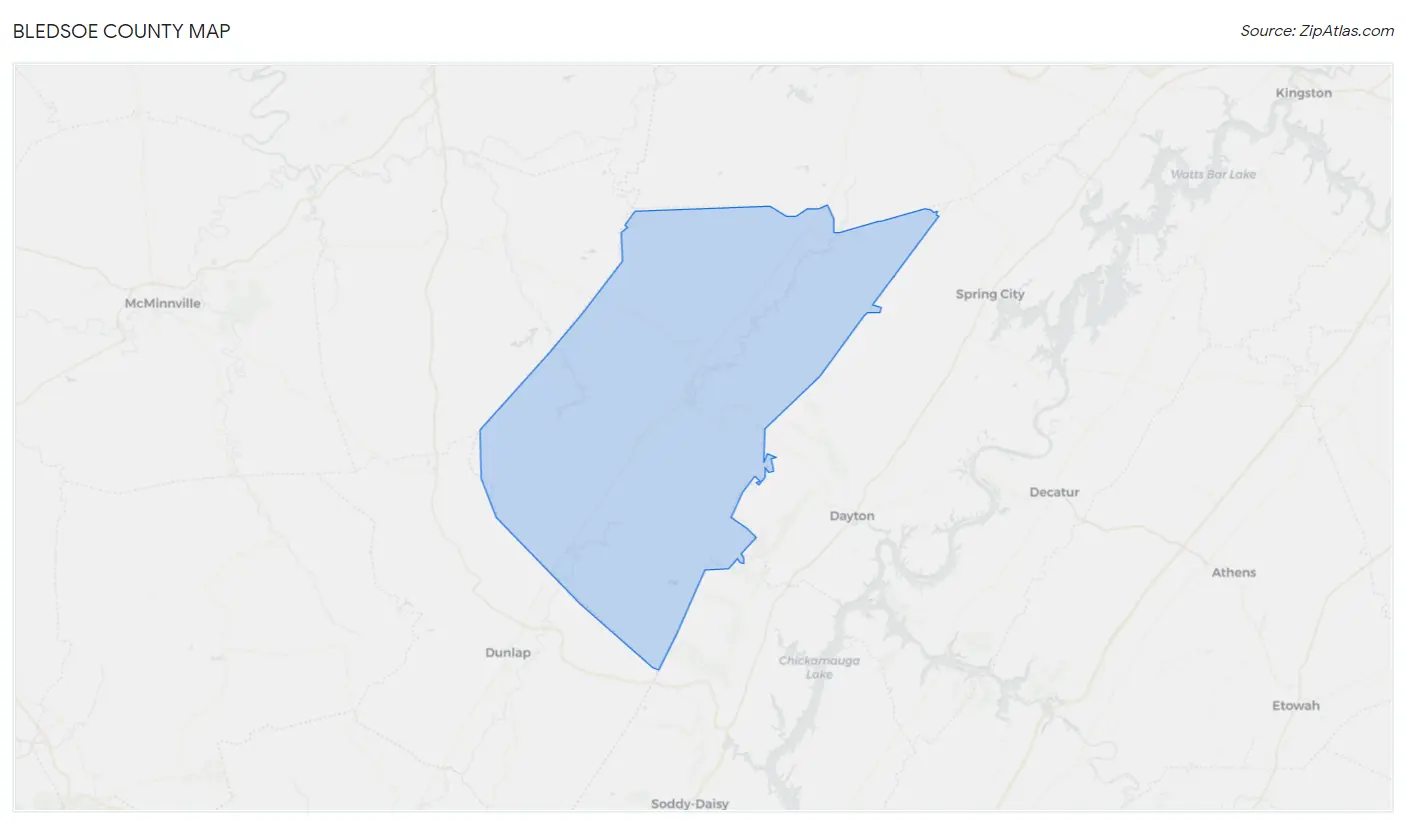
Bledsoe County Map
Bledsoe County Overview
14,816
TOTAL POPULATION
8,744
MALE POPULATION
6,072
FEMALE POPULATION
144.01
MALES / 100 FEMALES
69.44
FEMALES / 100 MALES
44.6
MEDIAN AGE
3.1
AVG FAMILY SIZE
2.8
AVG HOUSEHOLD SIZE
$24,241
PER CAPITA INCOME
$59,695
AVG FAMILY INCOME
$51,783
AVG HOUSEHOLD INCOME
33.6%
WAGE / INCOME GAP [ % ]
66.4¢/ $1
WAGE / INCOME GAP [ $ ]
$11,245
FAMILY INCOME DEFICIT
0.45
INEQUALITY / GINI INDEX
6,031
LABOR FORCE [ PEOPLE ]
47.7%
PERCENT IN LABOR FORCE
6.7%
UNEMPLOYMENT RATE
Bledsoe County Area Codes
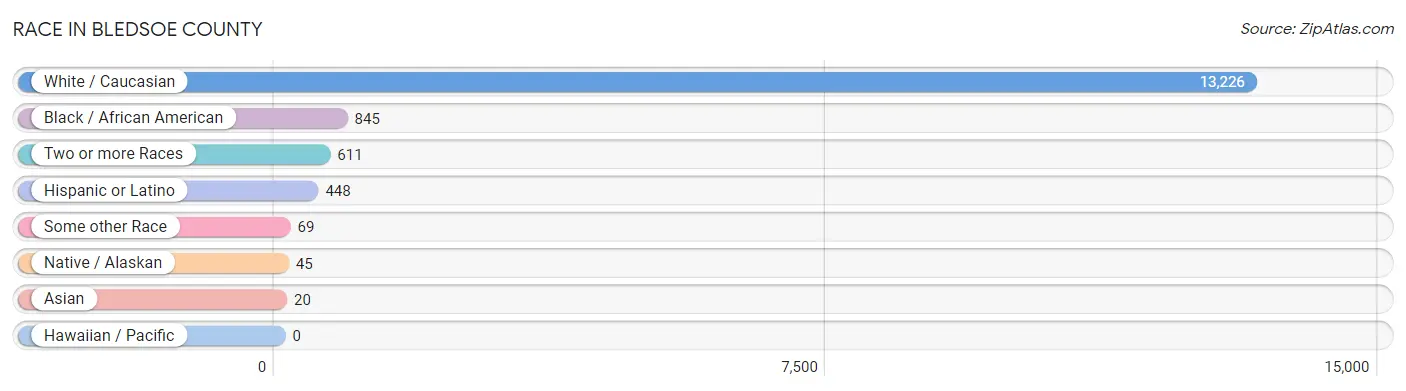
Race in Bledsoe County
The most populous races in Bledsoe County are White / Caucasian (13,226 | 89.3%), Black / African American (845 | 5.7%), and Two or more Races (611 | 4.1%).
| Race | # Population | % Population |
| Asian | 20 | 0.1% |
| Black / African American | 845 | 5.7% |
| Hawaiian / Pacific | 0 | 0.0% |
| Hispanic or Latino | 448 | 3.0% |
| Native / Alaskan | 45 | 0.3% |
| White / Caucasian | 13,226 | 89.3% |
| Two or more Races | 611 | 4.1% |
| Some other Race | 69 | 0.5% |
| Total | 14,816 | 100.0% |
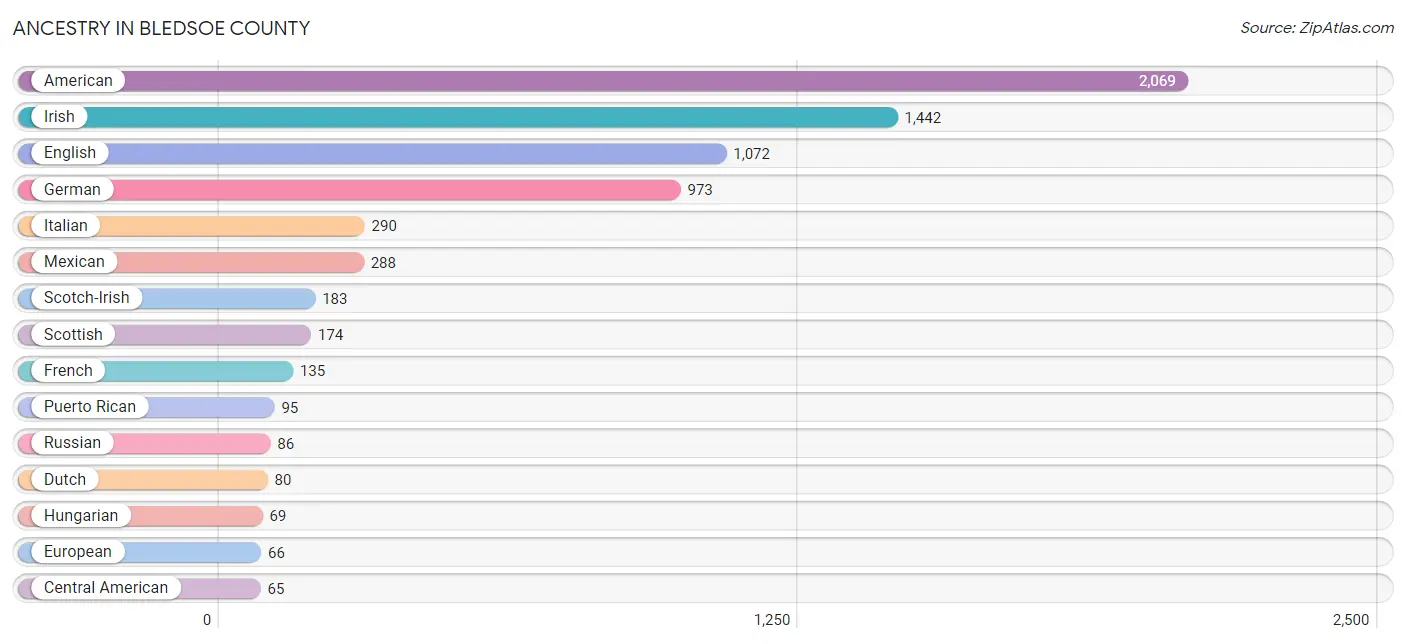
Ancestry in Bledsoe County
The most populous ancestries reported in Bledsoe County are American (2,069 | 14.0%), Irish (1,442 | 9.7%), English (1,072 | 7.2%), German (973 | 6.6%), and Italian (290 | 2.0%), together accounting for 39.5% of all Bledsoe County residents.
| Ancestry | # Population | % Population |
| African | 49 | 0.3% |
| American | 2,069 | 14.0% |
| Arab | 1 | 0.0% |
| Brazilian | 5 | 0.0% |
| British | 46 | 0.3% |
| Central American | 65 | 0.4% |
| Central American Indian | 3 | 0.0% |
| Cherokee | 48 | 0.3% |
| Chippewa | 2 | 0.0% |
| Choctaw | 24 | 0.2% |
| Czech | 16 | 0.1% |
| Czechoslovakian | 12 | 0.1% |
| Danish | 18 | 0.1% |
| Dutch | 80 | 0.5% |
| Eastern European | 33 | 0.2% |
| English | 1,072 | 7.2% |
| European | 66 | 0.4% |
| Finnish | 2 | 0.0% |
| French | 135 | 0.9% |
| French Canadian | 14 | 0.1% |
| German | 973 | 6.6% |
| Greek | 27 | 0.2% |
| Guatemalan | 65 | 0.4% |
| Hungarian | 69 | 0.5% |
| Indian (Asian) | 2 | 0.0% |
| Irish | 1,442 | 9.7% |
| Israeli | 4 | 0.0% |
| Italian | 290 | 2.0% |
| Korean | 23 | 0.2% |
| Mexican | 288 | 1.9% |
| Navajo | 17 | 0.1% |
| Nigerian | 10 | 0.1% |
| Northern European | 45 | 0.3% |
| Norwegian | 31 | 0.2% |
| Pennsylvania German | 11 | 0.1% |
| Polish | 56 | 0.4% |
| Portuguese | 3 | 0.0% |
| Puerto Rican | 95 | 0.6% |
| Romanian | 1 | 0.0% |
| Russian | 86 | 0.6% |
| Scandinavian | 49 | 0.3% |
| Scotch-Irish | 183 | 1.2% |
| Scottish | 174 | 1.2% |
| Subsaharan African | 59 | 0.4% |
| Swedish | 60 | 0.4% |
| Swiss | 61 | 0.4% |
| Thai | 5 | 0.0% |
| Trinidadian and Tobagonian | 4 | 0.0% |
| Welsh | 59 | 0.4% | View All 49 Rows |
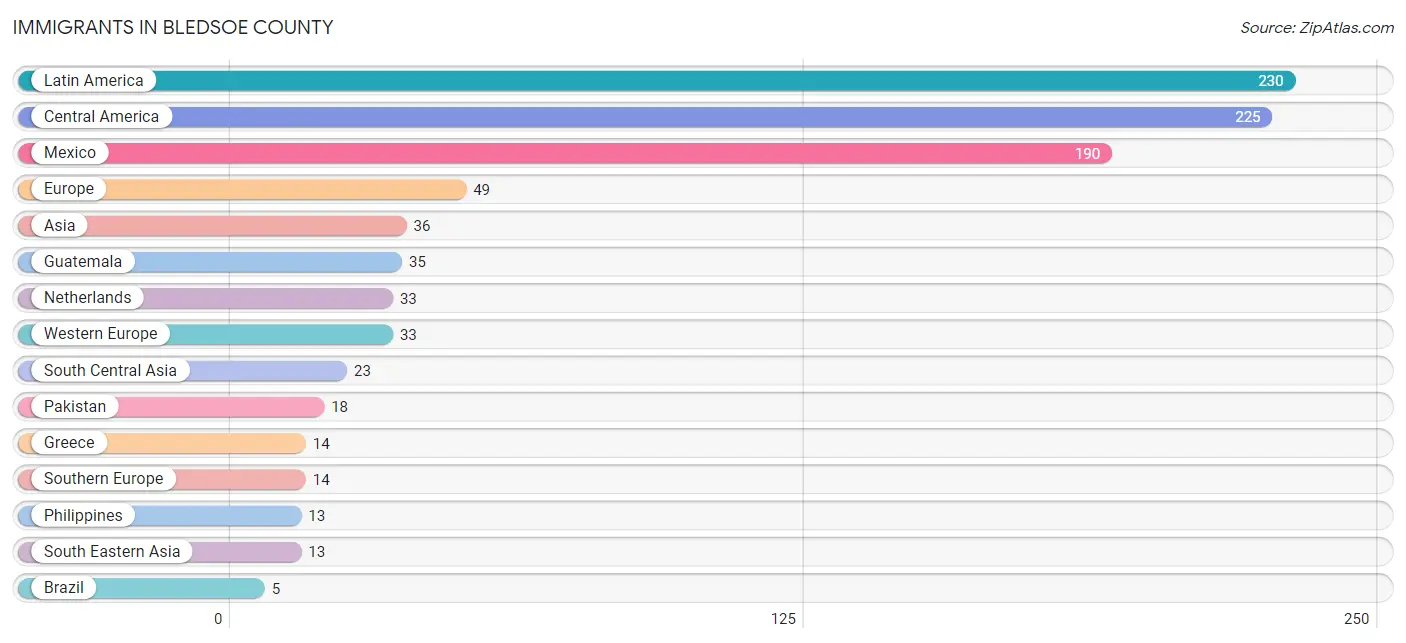
Immigrants in Bledsoe County
The most numerous immigrant groups reported in Bledsoe County came from Latin America (230 | 1.5%), Central America (225 | 1.5%), Mexico (190 | 1.3%), Europe (49 | 0.3%), and Asia (36 | 0.2%), together accounting for 4.9% of all Bledsoe County residents.
| Immigration Origin | # Population | % Population |
| Asia | 36 | 0.2% |
| Brazil | 5 | 0.0% |
| Central America | 225 | 1.5% |
| England | 2 | 0.0% |
| Europe | 49 | 0.3% |
| Greece | 14 | 0.1% |
| Guatemala | 35 | 0.2% |
| India | 5 | 0.0% |
| Latin America | 230 | 1.5% |
| Mexico | 190 | 1.3% |
| Netherlands | 33 | 0.2% |
| Northern Europe | 2 | 0.0% |
| Pakistan | 18 | 0.1% |
| Philippines | 13 | 0.1% |
| South America | 5 | 0.0% |
| South Central Asia | 23 | 0.2% |
| South Eastern Asia | 13 | 0.1% |
| Southern Europe | 14 | 0.1% |
| Western Europe | 33 | 0.2% | View All 19 Rows |
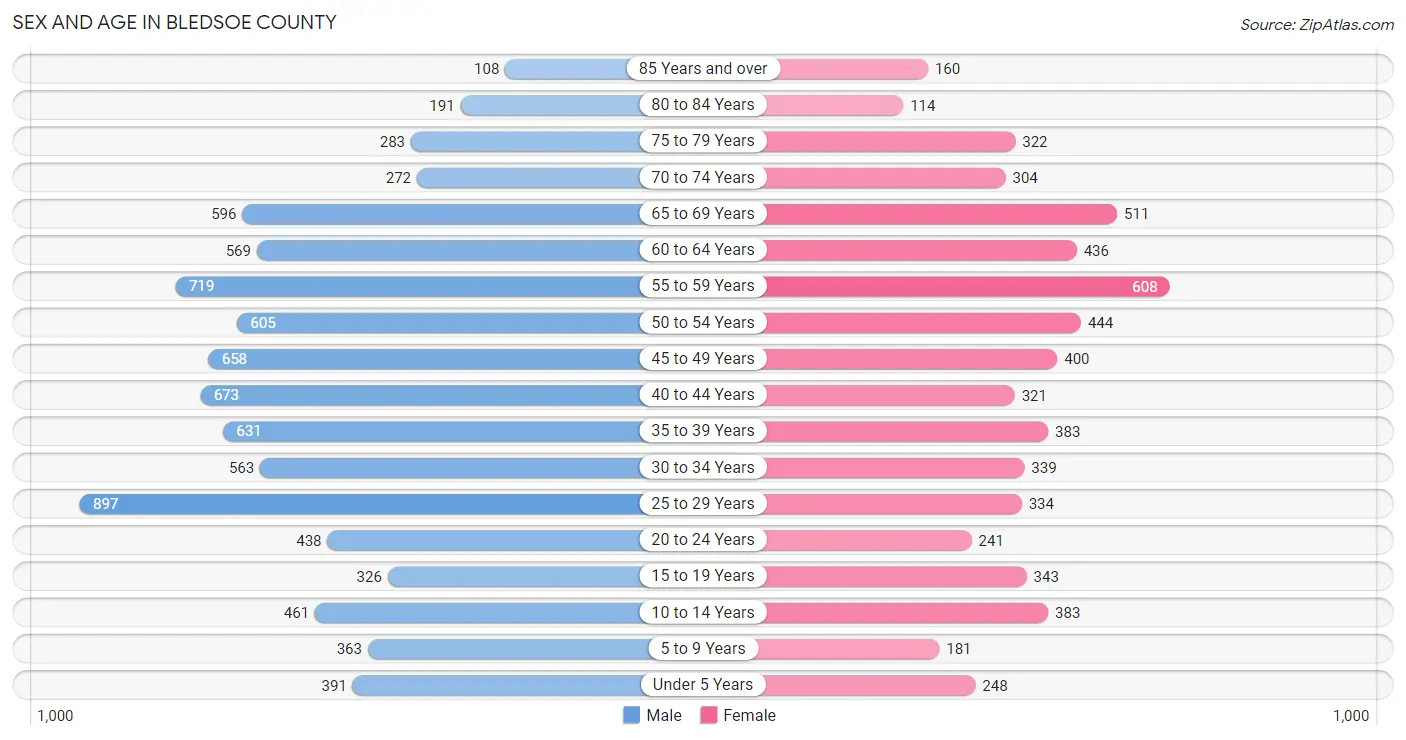
Sex and Age in Bledsoe County
Sex and Age in Bledsoe County
The most populous age groups in Bledsoe County are 25 to 29 Years (897 | 10.3%) for men and 55 to 59 Years (608 | 10.0%) for women.
| Age Bracket | Male | Female |
| Under 5 Years | 391 (4.5%) | 248 (4.1%) |
| 5 to 9 Years | 363 (4.2%) | 181 (3.0%) |
| 10 to 14 Years | 461 (5.3%) | 383 (6.3%) |
| 15 to 19 Years | 326 (3.7%) | 343 (5.7%) |
| 20 to 24 Years | 438 (5.0%) | 241 (4.0%) |
| 25 to 29 Years | 897 (10.3%) | 334 (5.5%) |
| 30 to 34 Years | 563 (6.4%) | 339 (5.6%) |
| 35 to 39 Years | 631 (7.2%) | 383 (6.3%) |
| 40 to 44 Years | 673 (7.7%) | 321 (5.3%) |
| 45 to 49 Years | 658 (7.5%) | 400 (6.6%) |
| 50 to 54 Years | 605 (6.9%) | 444 (7.3%) |
| 55 to 59 Years | 719 (8.2%) | 608 (10.0%) |
| 60 to 64 Years | 569 (6.5%) | 436 (7.2%) |
| 65 to 69 Years | 596 (6.8%) | 511 (8.4%) |
| 70 to 74 Years | 272 (3.1%) | 304 (5.0%) |
| 75 to 79 Years | 283 (3.2%) | 322 (5.3%) |
| 80 to 84 Years | 191 (2.2%) | 114 (1.9%) |
| 85 Years and over | 108 (1.2%) | 160 (2.6%) |
| Total | 8,744 (100.0%) | 6,072 (100.0%) |
Families and Households in Bledsoe County
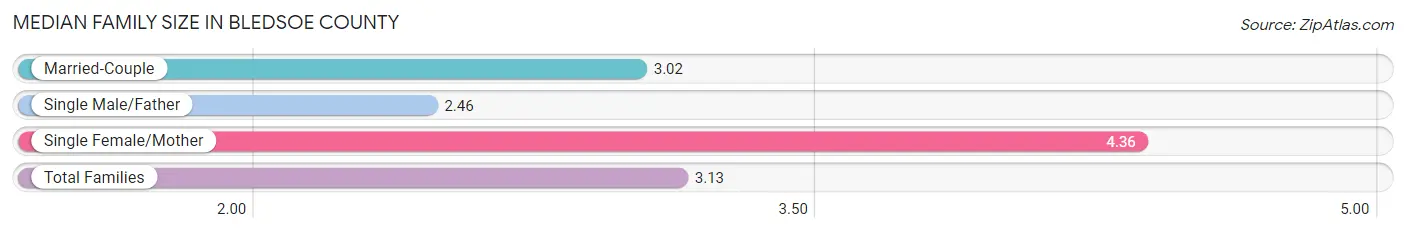
Median Family Size in Bledsoe County
The median family size in Bledsoe County is 3.13 persons per family, with single female/mother families (421 | 11.9%) accounting for the largest median family size of 4.36 persons per family. On the other hand, single male/father families (356 | 10.1%) represent the smallest median family size with 2.46 persons per family.
| Family Type | # Families | Family Size |
| Married-Couple | 2,755 (78.0%) | 3.02 |
| Single Male/Father | 356 (10.1%) | 2.46 |
| Single Female/Mother | 421 (11.9%) | 4.36 |
| Total Families | 3,532 (100.0%) | 3.13 |
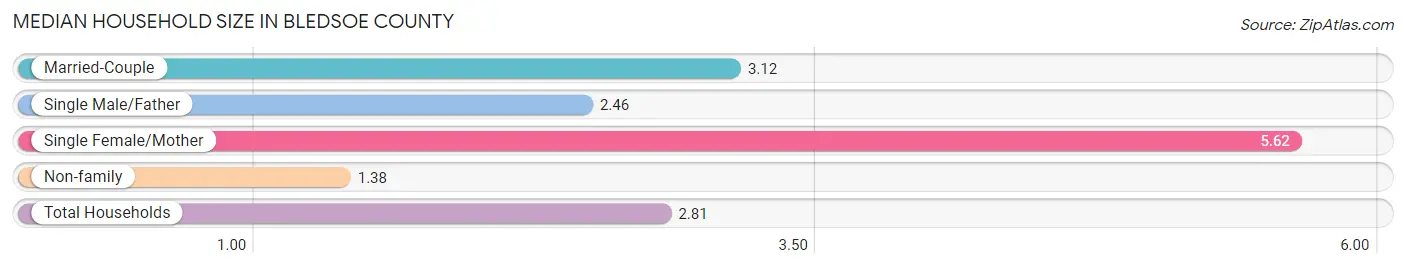
Median Household Size in Bledsoe County
The median household size in Bledsoe County is 2.81 persons per household, with single female/mother households (421 | 8.7%) accounting for the largest median household size of 5.62 persons per household. non-family households (1,319 | 27.2%) represent the smallest median household size with 1.38 persons per household.
| Household Type | # Households | Household Size |
| Married-Couple | 2,755 (56.8%) | 3.12 |
| Single Male/Father | 356 (7.3%) | 2.46 |
| Single Female/Mother | 421 (8.7%) | 5.62 |
| Non-family | 1,319 (27.2%) | 1.38 |
| Total Households | 4,851 (100.0%) | 2.81 |
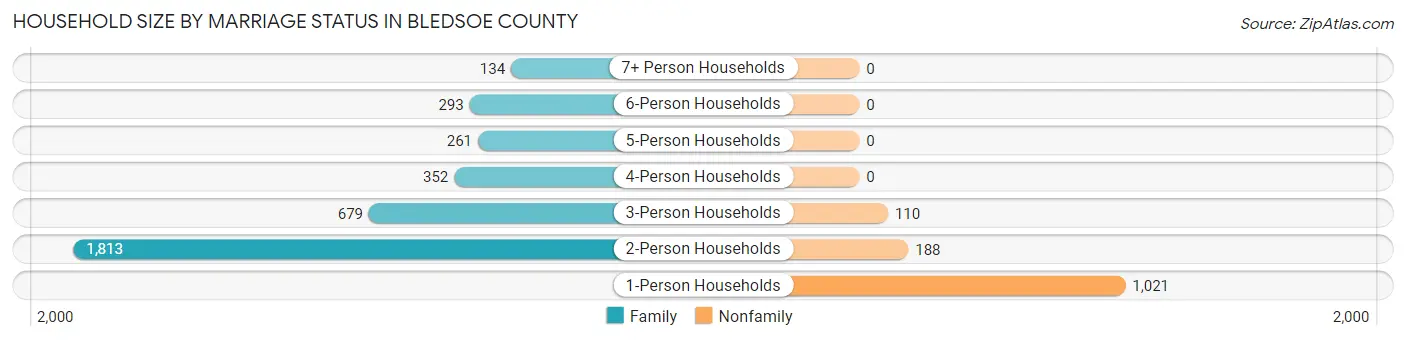
Household Size by Marriage Status in Bledsoe County
Out of a total of 4,851 households in Bledsoe County, 3,532 (72.8%) are family households, while 1,319 (27.2%) are nonfamily households. The most numerous type of family households are 2-person households, comprising 1,813, and the most common type of nonfamily households are 1-person households, comprising 1,021.
| Household Size | Family Households | Nonfamily Households |
| 1-Person Households | - | 1,021 (21.0%) |
| 2-Person Households | 1,813 (37.4%) | 188 (3.9%) |
| 3-Person Households | 679 (14.0%) | 110 (2.3%) |
| 4-Person Households | 352 (7.3%) | 0 (0.0%) |
| 5-Person Households | 261 (5.4%) | 0 (0.0%) |
| 6-Person Households | 293 (6.0%) | 0 (0.0%) |
| 7+ Person Households | 134 (2.8%) | 0 (0.0%) |
| Total | 3,532 (72.8%) | 1,319 (27.2%) |
Female Fertility in Bledsoe County
Fertility by Age in Bledsoe County
Average fertility rate in Bledsoe County is 74.0 births per 1,000 women. Women in the age bracket of 20 to 34 years have the highest fertility rate with 190.0 births per 1,000 women. Women in the age bracket of 20 to 34 years acount for 95.1% of all women with births.
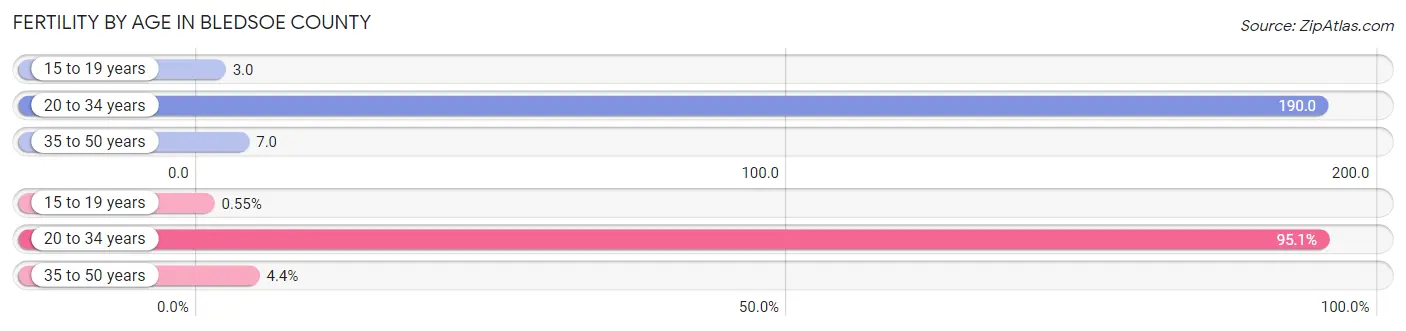
| Age Bracket | Women with Births | Births / 1,000 Women |
| 15 to 19 years | 1 (0.5%) | 3.0 |
| 20 to 34 years | 174 (95.1%) | 190.0 |
| 35 to 50 years | 8 (4.4%) | 7.0 |
| Total | 183 (100.0%) | 74.0 |
Fertility by Age by Marriage Status in Bledsoe County
44.8% of women with births (183) in Bledsoe County are married. The highest percentage of unmarried women with births falls into 15 to 19 years age bracket with 100.0% of them unmarried at the time of birth, while the lowest percentage of unmarried women with births belong to 35 to 50 years age bracket with 0.0% of them unmarried.
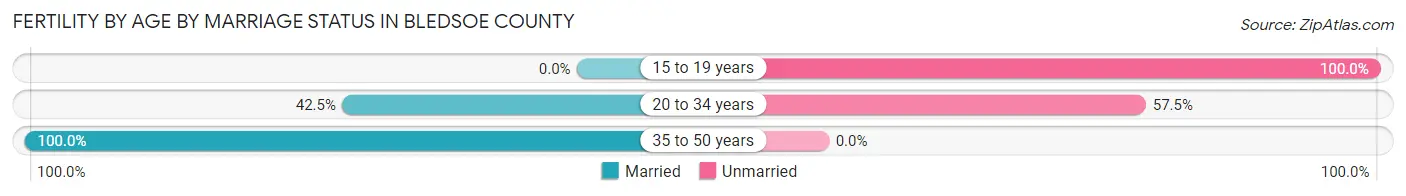
| Age Bracket | Married | Unmarried |
| 15 to 19 years | 0 (0.0%) | 1 (100.0%) |
| 20 to 34 years | 74 (42.5%) | 100 (57.5%) |
| 35 to 50 years | 8 (100.0%) | 0 (0.0%) |
| Total | 82 (44.8%) | 101 (55.2%) |
Fertility by Education in Bledsoe County
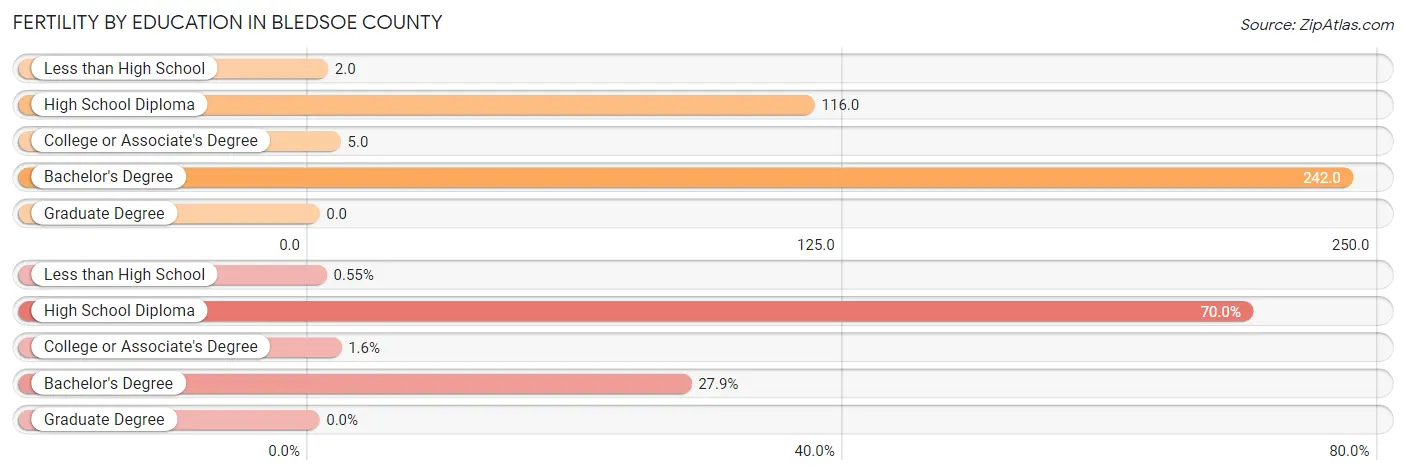
| Educational Attainment | Women with Births | Births / 1,000 Women |
| Less than High School | 1 (0.5%) | 2.0 |
| High School Diploma | 128 (70.0%) | 116.0 |
| College or Associate's Degree | 3 (1.6%) | 5.0 |
| Bachelor's Degree | 51 (27.9%) | 242.0 |
| Graduate Degree | 0 (0.0%) | 0.0 |
| Total | 183 (100.0%) | 74.0 |
Fertility by Education by Marriage Status in Bledsoe County
55.2% of women with births in Bledsoe County are unmarried. Women with the educational attainment of college or associate's degree are most likely to be married with 100.0% of them married at childbirth, while women with the educational attainment of less than high school are least likely to be married with 100.0% of them unmarried at childbirth.
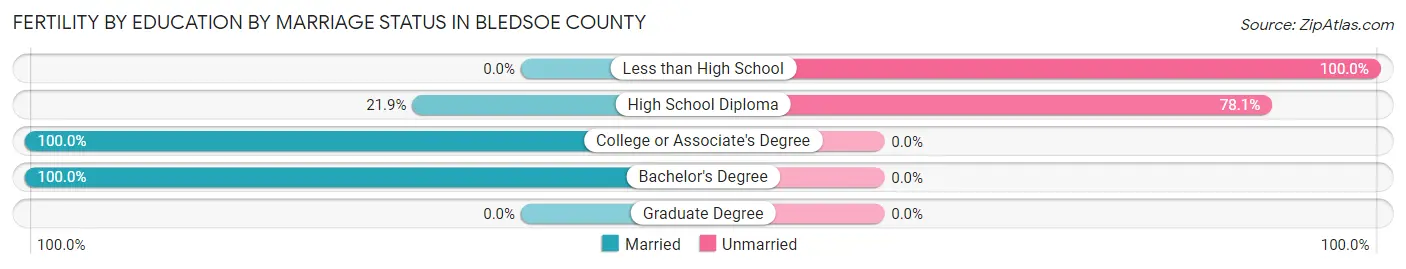
| Educational Attainment | Married | Unmarried |
| Less than High School | 0 (0.0%) | 1 (100.0%) |
| High School Diploma | 28 (21.9%) | 100 (78.1%) |
| College or Associate's Degree | 3 (100.0%) | 0 (0.0%) |
| Bachelor's Degree | 51 (100.0%) | 0 (0.0%) |
| Graduate Degree | 0 (0.0%) | 0 (0.0%) |
| Total | 82 (44.8%) | 101 (55.2%) |
Income in Bledsoe County
Income Overview in Bledsoe County
Per Capita Income in Bledsoe County is $24,241, while median incomes of families and households are $59,695 and $51,783 respectively.
| Characteristic | Number | Measure |
| Per Capita Income | 14,816 | $24,241 |
| Median Family Income | 3,532 | $59,695 |
| Mean Family Income | 3,532 | $73,091 |
| Median Household Income | 4,851 | $51,783 |
| Mean Household Income | 4,851 | $65,017 |
| Income Deficit | 3,532 | $11,245 |
| Wage / Income Gap (%) | 14,816 | 33.56% |
| Wage / Income Gap ($) | 14,816 | 66.44¢ per $1 |
| Gini / Inequality Index | 14,816 | 0.45 |
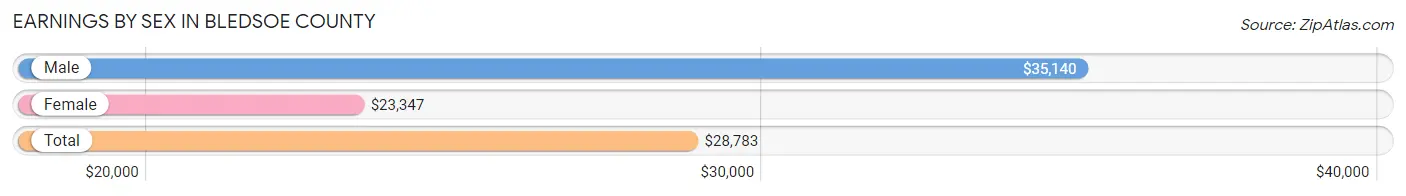
Earnings by Sex in Bledsoe County
Average Earnings in Bledsoe County are $28,783, $35,140 for men and $23,347 for women, a difference of 33.6%.
| Sex | Number | Average Earnings |
| Male | 4,092 (66.0%) | $35,140 |
| Female | 2,107 (34.0%) | $23,347 |
| Total | 6,199 (100.0%) | $28,783 |
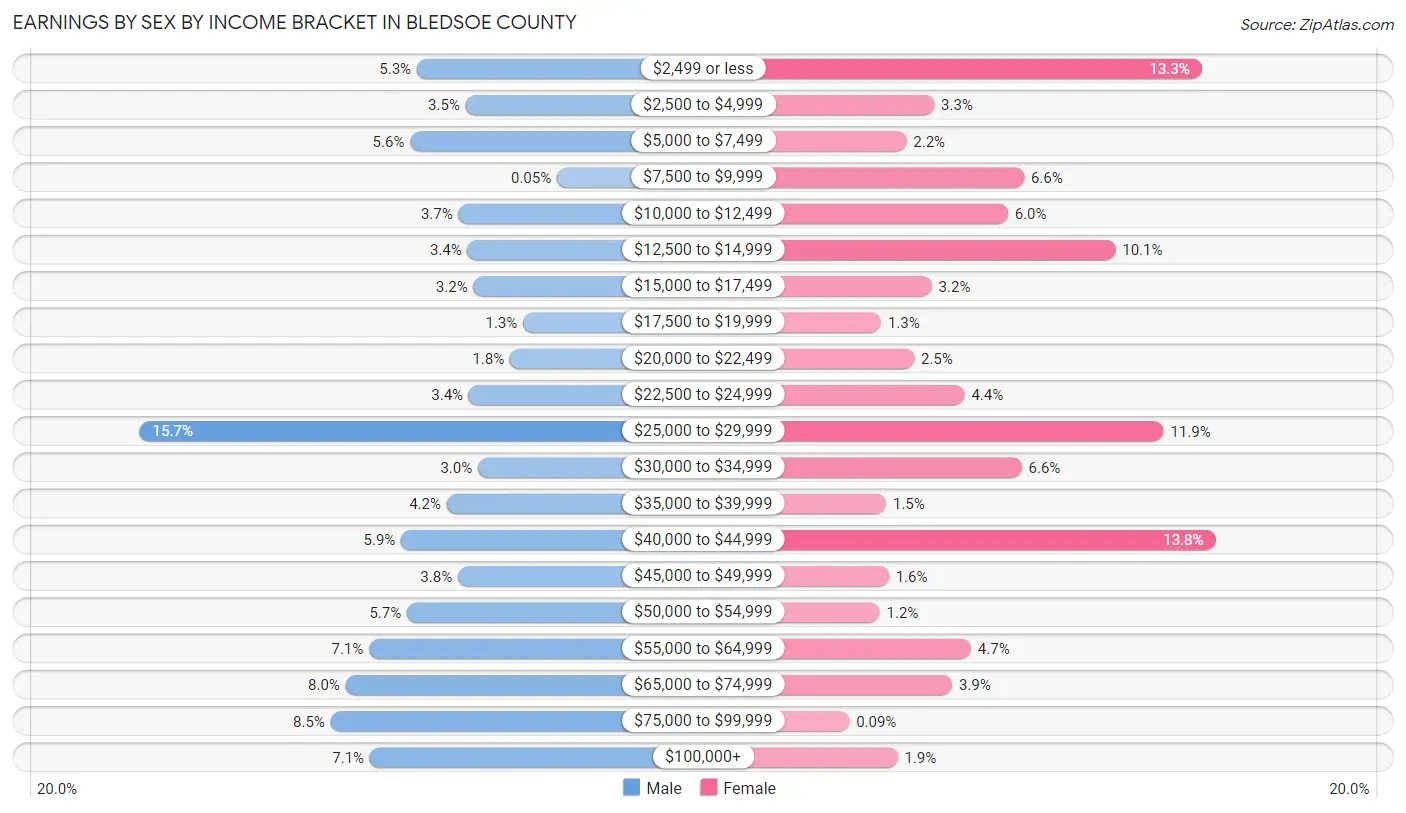
Earnings by Sex by Income Bracket in Bledsoe County
The most common earnings brackets in Bledsoe County are $25,000 to $29,999 for men (642 | 15.7%) and $40,000 to $44,999 for women (291 | 13.8%).
| Income | Male | Female |
| $2,499 or less | 217 (5.3%) | 280 (13.3%) |
| $2,500 to $4,999 | 142 (3.5%) | 69 (3.3%) |
| $5,000 to $7,499 | 227 (5.6%) | 47 (2.2%) |
| $7,500 to $9,999 | 2 (0.1%) | 140 (6.6%) |
| $10,000 to $12,499 | 153 (3.7%) | 127 (6.0%) |
| $12,500 to $14,999 | 139 (3.4%) | 212 (10.1%) |
| $15,000 to $17,499 | 130 (3.2%) | 67 (3.2%) |
| $17,500 to $19,999 | 54 (1.3%) | 27 (1.3%) |
| $20,000 to $22,499 | 74 (1.8%) | 53 (2.5%) |
| $22,500 to $24,999 | 137 (3.4%) | 93 (4.4%) |
| $25,000 to $29,999 | 642 (15.7%) | 250 (11.9%) |
| $30,000 to $34,999 | 123 (3.0%) | 138 (6.6%) |
| $35,000 to $39,999 | 171 (4.2%) | 31 (1.5%) |
| $40,000 to $44,999 | 241 (5.9%) | 291 (13.8%) |
| $45,000 to $49,999 | 154 (3.8%) | 33 (1.6%) |
| $50,000 to $54,999 | 232 (5.7%) | 26 (1.2%) |
| $55,000 to $64,999 | 290 (7.1%) | 98 (4.6%) |
| $65,000 to $74,999 | 326 (8.0%) | 83 (3.9%) |
| $75,000 to $99,999 | 349 (8.5%) | 2 (0.1%) |
| $100,000+ | 289 (7.1%) | 40 (1.9%) |
| Total | 4,092 (100.0%) | 2,107 (100.0%) |
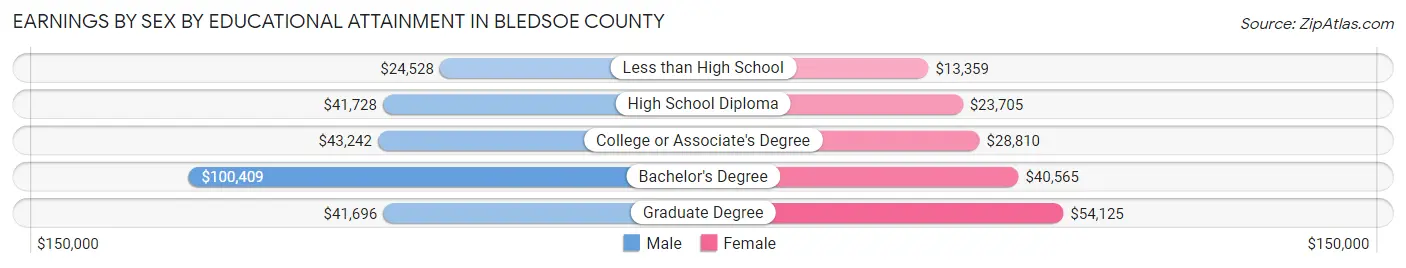
Earnings by Sex by Educational Attainment in Bledsoe County
Average earnings in Bledsoe County are $40,030 for men and $25,640 for women, a difference of 35.9%. Men with an educational attainment of bachelor's degree enjoy the highest average annual earnings of $100,409, while those with less than high school education earn the least with $24,528. Women with an educational attainment of graduate degree earn the most with the average annual earnings of $54,125, while those with less than high school education have the smallest earnings of $13,359.
| Educational Attainment | Male Income | Female Income |
| Less than High School | $24,528 | $13,359 |
| High School Diploma | $41,728 | $23,705 |
| College or Associate's Degree | $43,242 | $28,810 |
| Bachelor's Degree | $100,409 | $40,565 |
| Graduate Degree | $41,696 | $54,125 |
| Total | $40,030 | $25,640 |
Family Income in Bledsoe County
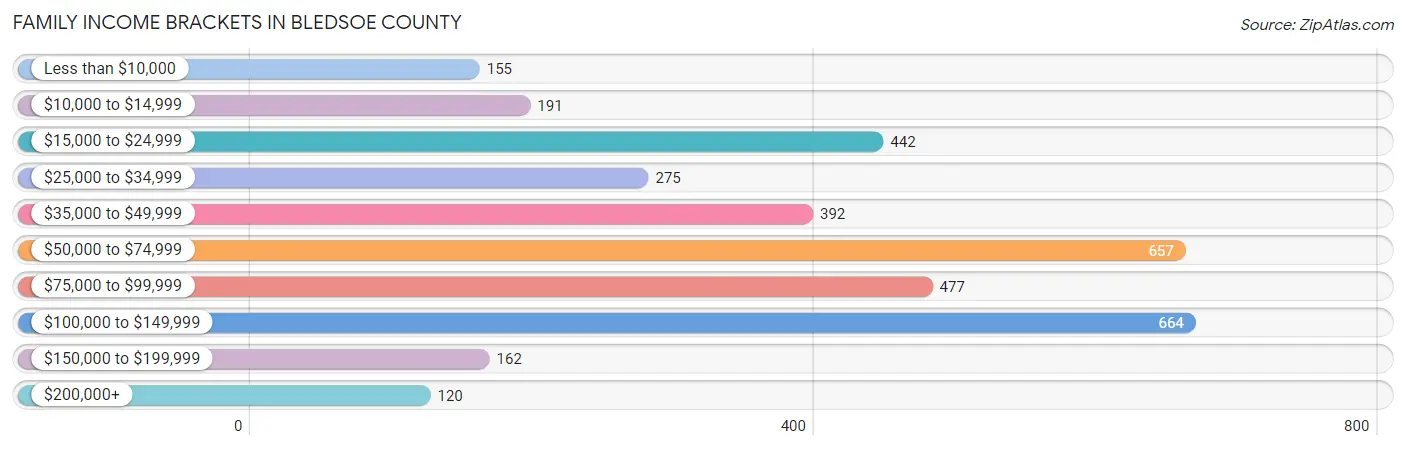
Family Income Brackets in Bledsoe County
According to the Bledsoe County family income data, there are 664 families falling into the $100,000 to $149,999 income range, which is the most common income bracket and makes up 18.8% of all families. Conversely, the $200,000+ income bracket is the least frequent group with only 120 families (3.4%) belonging to this category.
| Income Bracket | # Families | % Families |
| Less than $10,000 | 155 | 4.4% |
| $10,000 to $14,999 | 191 | 5.4% |
| $15,000 to $24,999 | 442 | 12.5% |
| $25,000 to $34,999 | 275 | 7.8% |
| $35,000 to $49,999 | 392 | 11.1% |
| $50,000 to $74,999 | 657 | 18.6% |
| $75,000 to $99,999 | 477 | 13.5% |
| $100,000 to $149,999 | 664 | 18.8% |
| $150,000 to $199,999 | 162 | 4.6% |
| $200,000+ | 120 | 3.4% |
Family Income by Famaliy Size in Bledsoe County
4-person families (427 | 12.1%) account for the highest median family income in Bledsoe County with $113,060 per family, while 2-person families (1,906 | 54.0%) have the highest median income of $28,636 per family member.
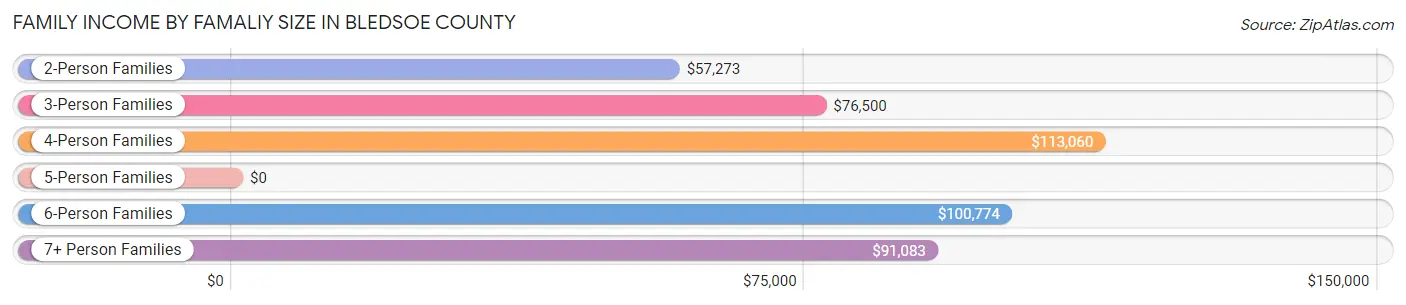
| Income Bracket | # Families | Median Income |
| 2-Person Families | 1,906 (54.0%) | $57,273 |
| 3-Person Families | 606 (17.2%) | $76,500 |
| 4-Person Families | 427 (12.1%) | $113,060 |
| 5-Person Families | 230 (6.5%) | $0 |
| 6-Person Families | 264 (7.5%) | $100,774 |
| 7+ Person Families | 99 (2.8%) | $91,083 |
| Total | 3,532 (100.0%) | $59,695 |
Family Income by Number of Earners in Bledsoe County
The median family income in Bledsoe County is $59,695, with families comprising 3+ earners (342) having the highest median family income of $116,000, while families with no earners (1,001) have the lowest median family income of $26,513, accounting for 9.7% and 28.3% of families, respectively.

| Number of Earners | # Families | Median Income |
| No Earners | 1,001 (28.3%) | $26,513 |
| 1 Earner | 980 (27.8%) | $58,284 |
| 2 Earners | 1,209 (34.2%) | $85,401 |
| 3+ Earners | 342 (9.7%) | $116,000 |
| Total | 3,532 (100.0%) | $59,695 |
Household Income in Bledsoe County
Household Income Brackets in Bledsoe County
With 791 households falling in the category, the $50,000 to $74,999 income range is the most frequent in Bledsoe County, accounting for 16.3% of all households. In contrast, only 141 households (2.9%) fall into the $200,000+ income bracket, making it the least populous group.
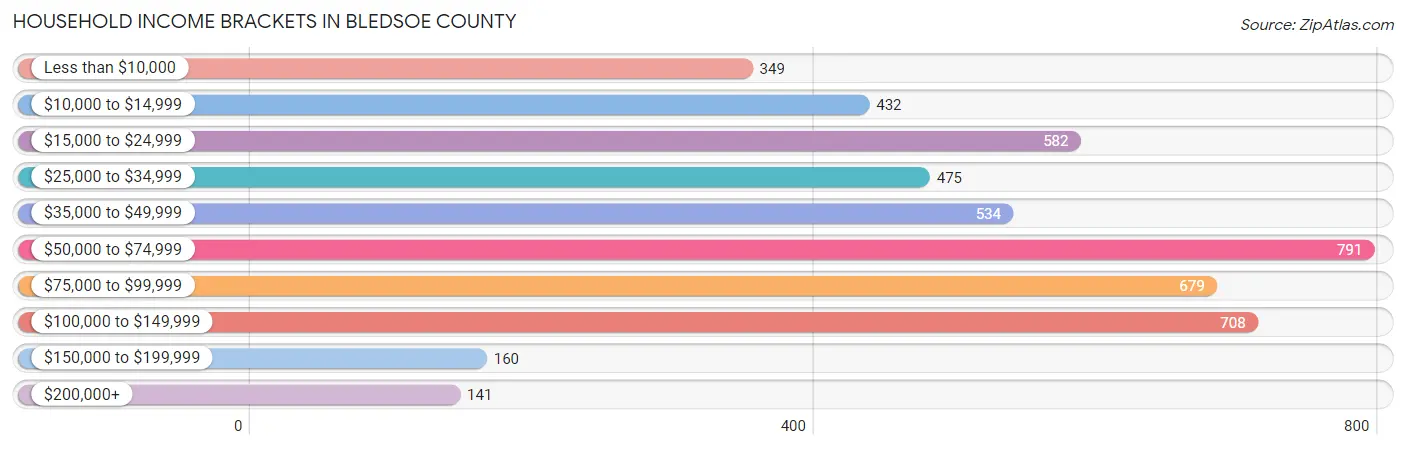
| Income Bracket | # Households | % Households |
| Less than $10,000 | 349 | 7.2% |
| $10,000 to $14,999 | 432 | 8.9% |
| $15,000 to $24,999 | 582 | 12.0% |
| $25,000 to $34,999 | 475 | 9.8% |
| $35,000 to $49,999 | 534 | 11.0% |
| $50,000 to $74,999 | 791 | 16.3% |
| $75,000 to $99,999 | 679 | 14.0% |
| $100,000 to $149,999 | 708 | 14.6% |
| $150,000 to $199,999 | 160 | 3.3% |
| $200,000+ | 141 | 2.9% |
Household Income by Householder Age in Bledsoe County
The median household income in Bledsoe County is $51,783, with the highest median household income of $58,648 found in the 45 to 64 years age bracket for the primary householder. A total of 2,144 households (44.2%) fall into this category. Meanwhile, the 15 to 24 years age bracket for the primary householder has the lowest median household income of $16,512, with 92 households (1.9%) in this group.
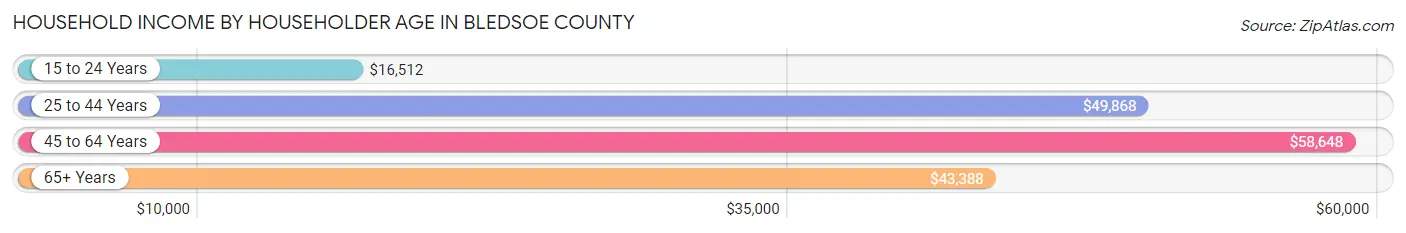
| Income Bracket | # Households | Median Income |
| 15 to 24 Years | 92 (1.9%) | $16,512 |
| 25 to 44 Years | 1,132 (23.3%) | $49,868 |
| 45 to 64 Years | 2,144 (44.2%) | $58,648 |
| 65+ Years | 1,483 (30.6%) | $43,388 |
| Total | 4,851 (100.0%) | $51,783 |
Poverty in Bledsoe County
Income Below Poverty by Sex and Age in Bledsoe County
With 23.4% poverty level for males and 29.4% for females among the residents of Bledsoe County, 15 year old males and 5 year old females are the most vulnerable to poverty, with 39 males (62.9%) and 16 females (100.0%) in their respective age groups living below the poverty level.
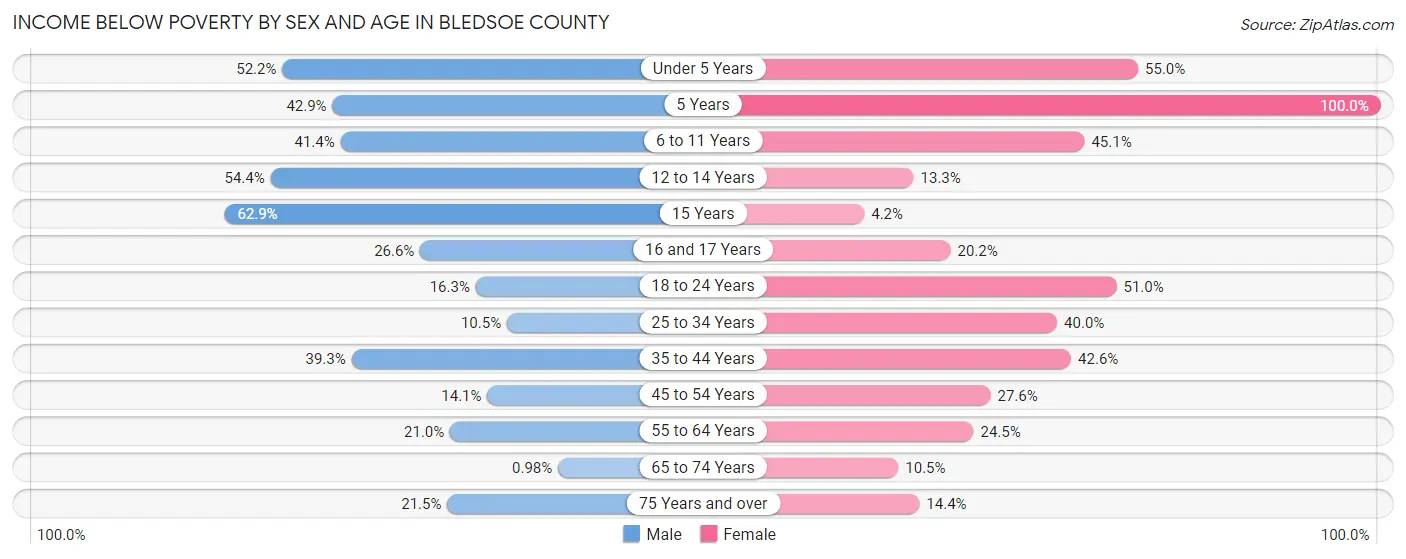
| Age Bracket | Male | Female |
| Under 5 Years | 204 (52.2%) | 132 (55.0%) |
| 5 Years | 9 (42.9%) | 16 (100.0%) |
| 6 to 11 Years | 189 (41.4%) | 132 (45.1%) |
| 12 to 14 Years | 181 (54.3%) | 34 (13.3%) |
| 15 Years | 39 (62.9%) | 3 (4.2%) |
| 16 and 17 Years | 38 (26.6%) | 21 (20.2%) |
| 18 to 24 Years | 79 (16.3%) | 206 (51.0%) |
| 25 to 34 Years | 121 (10.5%) | 269 (40.0%) |
| 35 to 44 Years | 421 (39.3%) | 292 (42.6%) |
| 45 to 54 Years | 150 (14.1%) | 233 (27.6%) |
| 55 to 64 Years | 230 (21.0%) | 254 (24.4%) |
| 65 to 74 Years | 8 (1.0%) | 82 (10.5%) |
| 75 Years and over | 123 (21.5%) | 83 (14.4%) |
| Total | 1,792 (23.4%) | 1,757 (29.4%) |
Income Above Poverty by Sex and Age in Bledsoe County
According to the poverty statistics in Bledsoe County, males aged 65 to 74 years and females aged 15 years are the age groups that are most secure financially, with 99.0% of males and 95.8% of females in these age groups living above the poverty line.
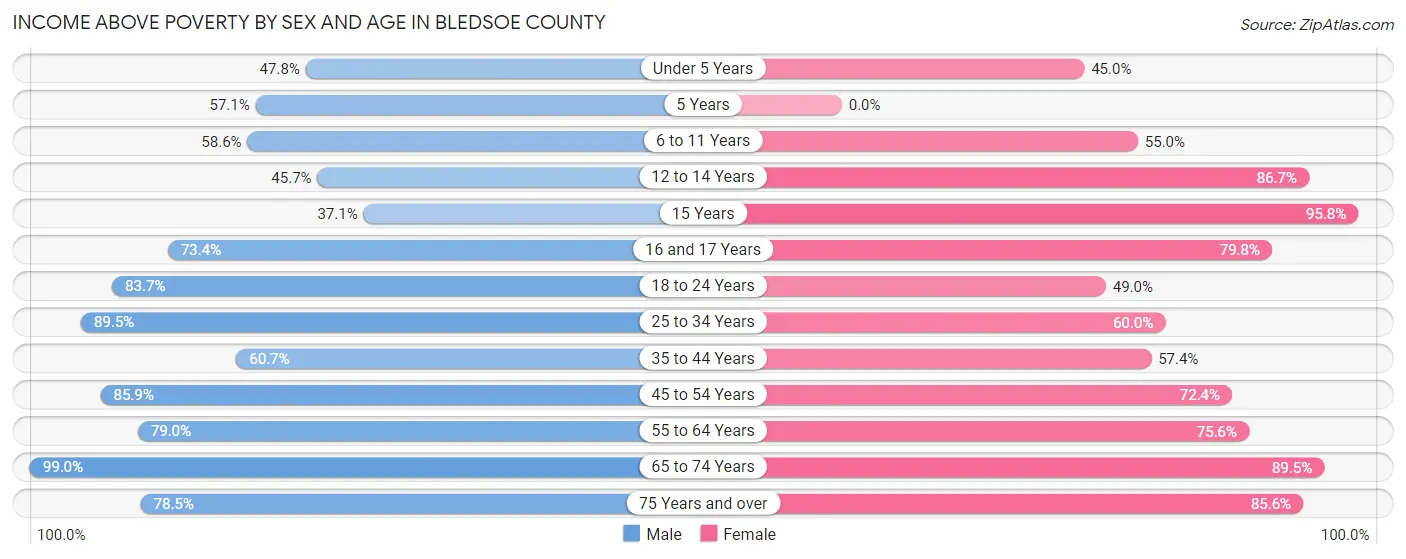
| Age Bracket | Male | Female |
| Under 5 Years | 187 (47.8%) | 108 (45.0%) |
| 5 Years | 12 (57.1%) | 0 (0.0%) |
| 6 to 11 Years | 268 (58.6%) | 161 (54.9%) |
| 12 to 14 Years | 152 (45.7%) | 221 (86.7%) |
| 15 Years | 23 (37.1%) | 69 (95.8%) |
| 16 and 17 Years | 105 (73.4%) | 83 (79.8%) |
| 18 to 24 Years | 407 (83.7%) | 198 (49.0%) |
| 25 to 34 Years | 1,036 (89.5%) | 404 (60.0%) |
| 35 to 44 Years | 650 (60.7%) | 394 (57.4%) |
| 45 to 54 Years | 914 (85.9%) | 611 (72.4%) |
| 55 to 64 Years | 864 (79.0%) | 785 (75.5%) |
| 65 to 74 Years | 805 (99.0%) | 699 (89.5%) |
| 75 Years and over | 448 (78.5%) | 493 (85.6%) |
| Total | 5,871 (76.6%) | 4,226 (70.6%) |
Income Below Poverty Among Married-Couple Families in Bledsoe County
The poverty statistics for married-couple families in Bledsoe County show that 11.7% or 323 of the total 2,755 families live below the poverty line. Families with 5 or more children have the highest poverty rate of 61.5%, comprising of 16 families. On the other hand, families with no children have the lowest poverty rate of 6.7%, which includes 109 families.
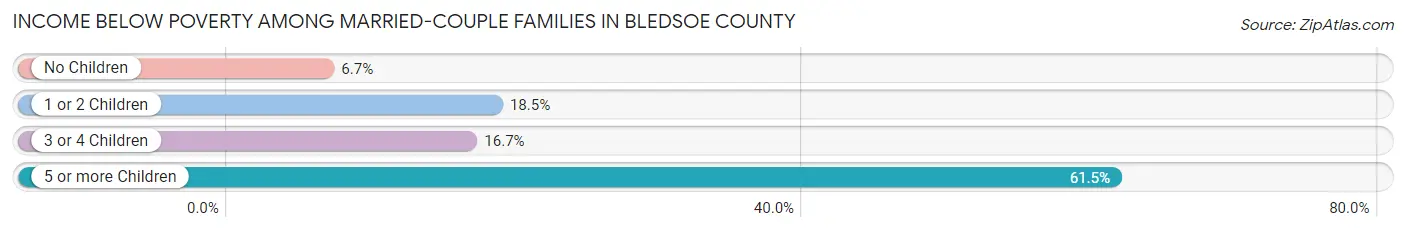
| Children | Above Poverty | Below Poverty |
| No Children | 1,515 (93.3%) | 109 (6.7%) |
| 1 or 2 Children | 632 (81.6%) | 143 (18.4%) |
| 3 or 4 Children | 275 (83.3%) | 55 (16.7%) |
| 5 or more Children | 10 (38.5%) | 16 (61.5%) |
| Total | 2,432 (88.3%) | 323 (11.7%) |
Income Below Poverty Among Single-Parent Households in Bledsoe County
According to the poverty data in Bledsoe County, 37.6% or 134 single-father households and 52.3% or 220 single-mother households are living below the poverty line. Among single-father households, those with 5 or more children have the highest poverty rate, with 11 households (100.0%) experiencing poverty. Likewise, among single-mother households, those with 3 or 4 children have the highest poverty rate, with 66 households (100.0%) falling below the poverty line.
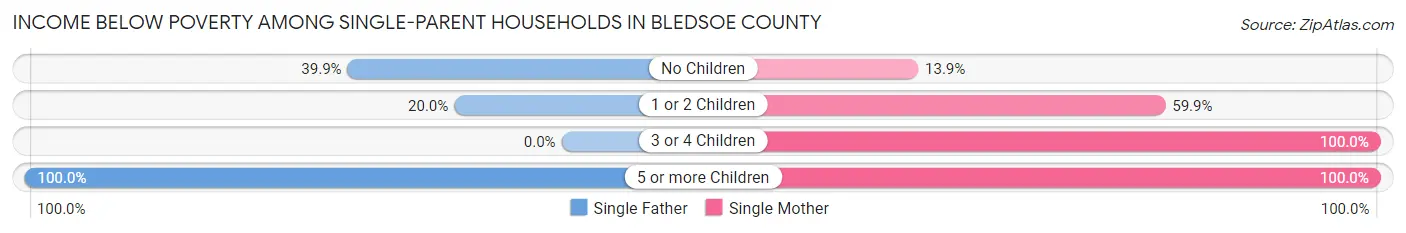
| Children | Single Father | Single Mother |
| No Children | 120 (39.9%) | 19 (13.9%) |
| 1 or 2 Children | 3 (20.0%) | 124 (59.9%) |
| 3 or 4 Children | 0 (0.0%) | 66 (100.0%) |
| 5 or more Children | 11 (100.0%) | 11 (100.0%) |
| Total | 134 (37.6%) | 220 (52.3%) |
Income Below Poverty Among Married-Couple vs Single-Parent Households in Bledsoe County
The poverty data for Bledsoe County shows that 323 of the married-couple family households (11.7%) and 354 of the single-parent households (45.6%) are living below the poverty level. Within the married-couple family households, those with 5 or more children have the highest poverty rate, with 16 households (61.5%) falling below the poverty line. Among the single-parent households, those with 5 or more children have the highest poverty rate, with 22 household (100.0%) living below poverty.
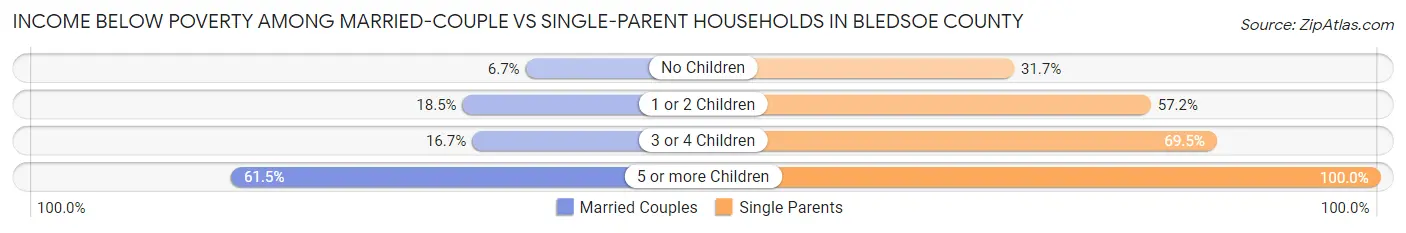
| Children | Married-Couple Families | Single-Parent Households |
| No Children | 109 (6.7%) | 139 (31.7%) |
| 1 or 2 Children | 143 (18.4%) | 127 (57.2%) |
| 3 or 4 Children | 55 (16.7%) | 66 (69.5%) |
| 5 or more Children | 16 (61.5%) | 22 (100.0%) |
| Total | 323 (11.7%) | 354 (45.6%) |
Employment Characteristics in Bledsoe County
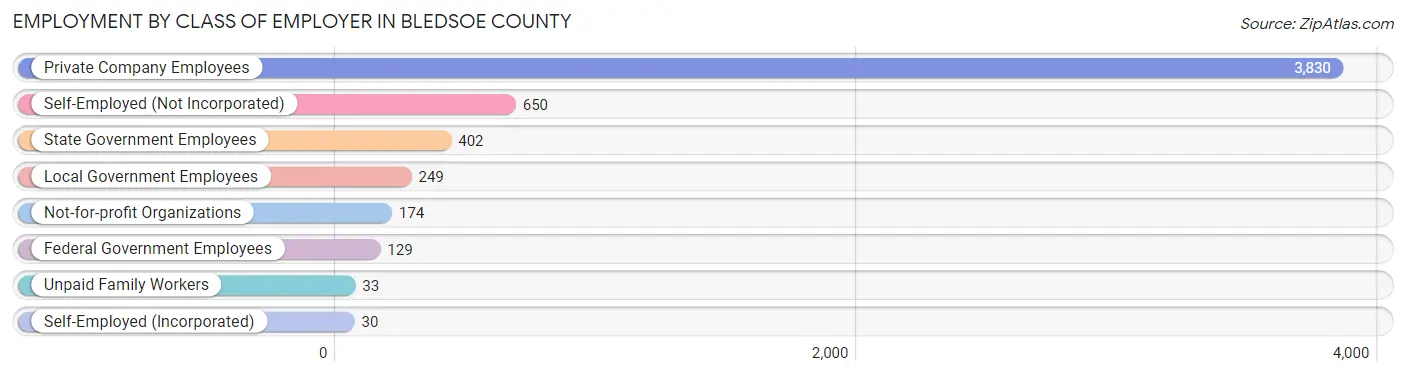
Employment by Class of Employer in Bledsoe County
Among the 5,497 employed individuals in Bledsoe County, private company employees (3,830 | 69.7%), self-employed (not incorporated) (650 | 11.8%), and state government employees (402 | 7.3%) make up the most common classes of employment.
| Employer Class | # Employees | % Employees |
| Private Company Employees | 3,830 | 69.7% |
| Self-Employed (Incorporated) | 30 | 0.5% |
| Self-Employed (Not Incorporated) | 650 | 11.8% |
| Not-for-profit Organizations | 174 | 3.2% |
| Local Government Employees | 249 | 4.5% |
| State Government Employees | 402 | 7.3% |
| Federal Government Employees | 129 | 2.4% |
| Unpaid Family Workers | 33 | 0.6% |
| Total | 5,497 | 100.0% |
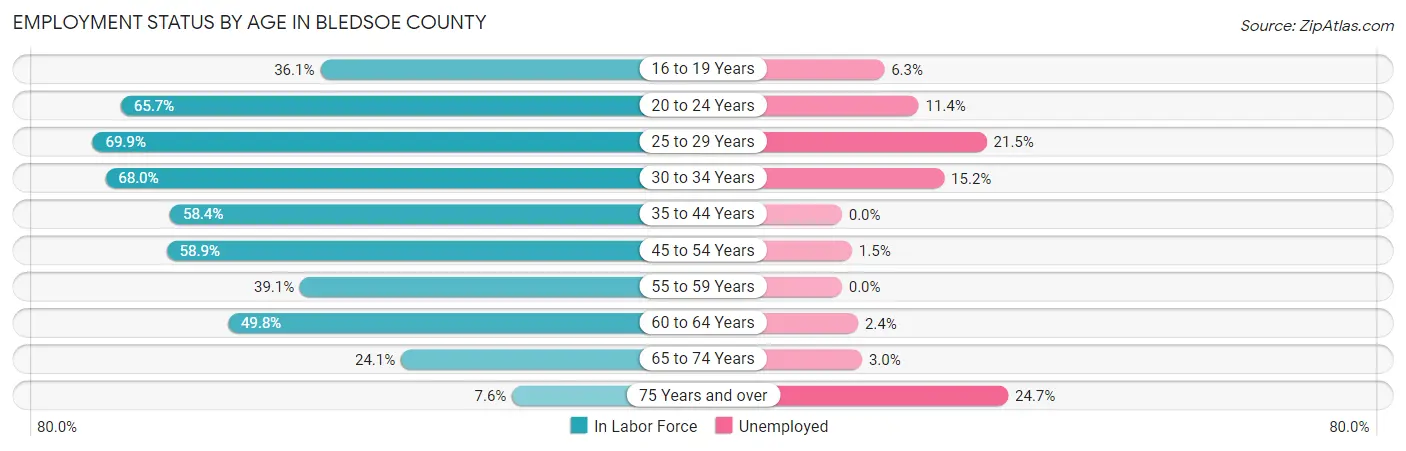
Employment Status by Age in Bledsoe County
According to the labor force statistics for Bledsoe County, out of the total population over 16 years of age (12,644), 47.7% or 6,031 individuals are in the labor force, with 6.7% or 404 of them unemployed. The age group with the highest labor force participation rate is 25 to 29 years, with 69.9% or 860 individuals in the labor force. Within the labor force, the 75 years and over age range has the highest percentage of unemployed individuals, with 24.7% or 22 of them being unemployed.
| Age Bracket | In Labor Force | Unemployed |
| 16 to 19 Years | 189 (36.1%) | 12 (6.3%) |
| 20 to 24 Years | 446 (65.7%) | 51 (11.4%) |
| 25 to 29 Years | 860 (69.9%) | 185 (21.5%) |
| 30 to 34 Years | 613 (68.0%) | 93 (15.2%) |
| 35 to 44 Years | 1,173 (58.4%) | 0 (0.0%) |
| 45 to 54 Years | 1,241 (58.9%) | 19 (1.5%) |
| 55 to 59 Years | 519 (39.1%) | 0 (0.0%) |
| 60 to 64 Years | 500 (49.8%) | 12 (2.4%) |
| 65 to 74 Years | 406 (24.1%) | 12 (3.0%) |
| 75 Years and over | 90 (7.6%) | 22 (24.7%) |
| Total | 6,031 (47.7%) | 404 (6.7%) |
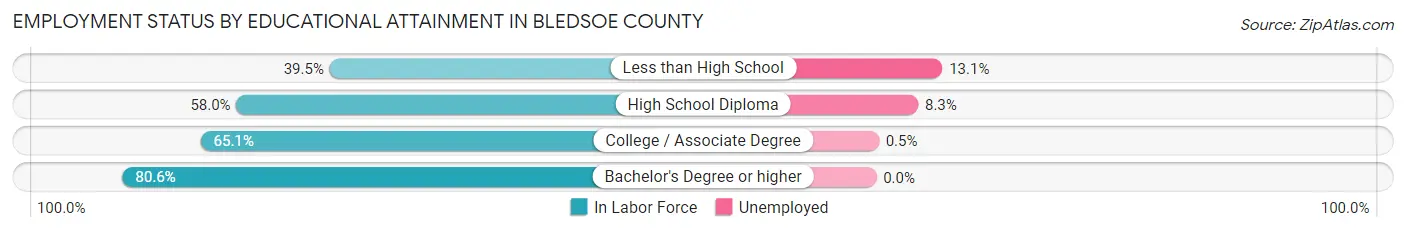
Employment Status by Educational Attainment in Bledsoe County
According to labor force statistics for Bledsoe County, 57.2% of individuals (4,908) out of the total population between 25 and 64 years of age (8,580) are in the labor force, with 6.2% or 304 of them being unemployed. The group with the highest labor force participation rate are those with the educational attainment of bachelor's degree or higher, with 80.6% or 583 individuals in the labor force. Within the labor force, individuals with less than high school education have the highest percentage of unemployment, with 13.1% or 100 of them being unemployed.
| Educational Attainment | In Labor Force | Unemployed |
| Less than High School | 766 (39.5%) | 254 (13.1%) |
| High School Diploma | 2,387 (58.0%) | 342 (8.3%) |
| College / Associate Degree | 1,174 (65.1%) | 9 (0.5%) |
| Bachelor's Degree or higher | 583 (80.6%) | 0 (0.0%) |
| Total | 4,908 (57.2%) | 532 (6.2%) |
Employment Occupations by Sex in Bledsoe County
Management, Business, Science and Arts Occupations
The most common Management, Business, Science and Arts occupations in Bledsoe County are Management (520 | 9.3%), Community & Social Service (455 | 8.1%), Education Instruction & Library (308 | 5.5%), Health Diagnosing & Treating (218 | 3.9%), and Arts, Media & Entertainment (98 | 1.7%).
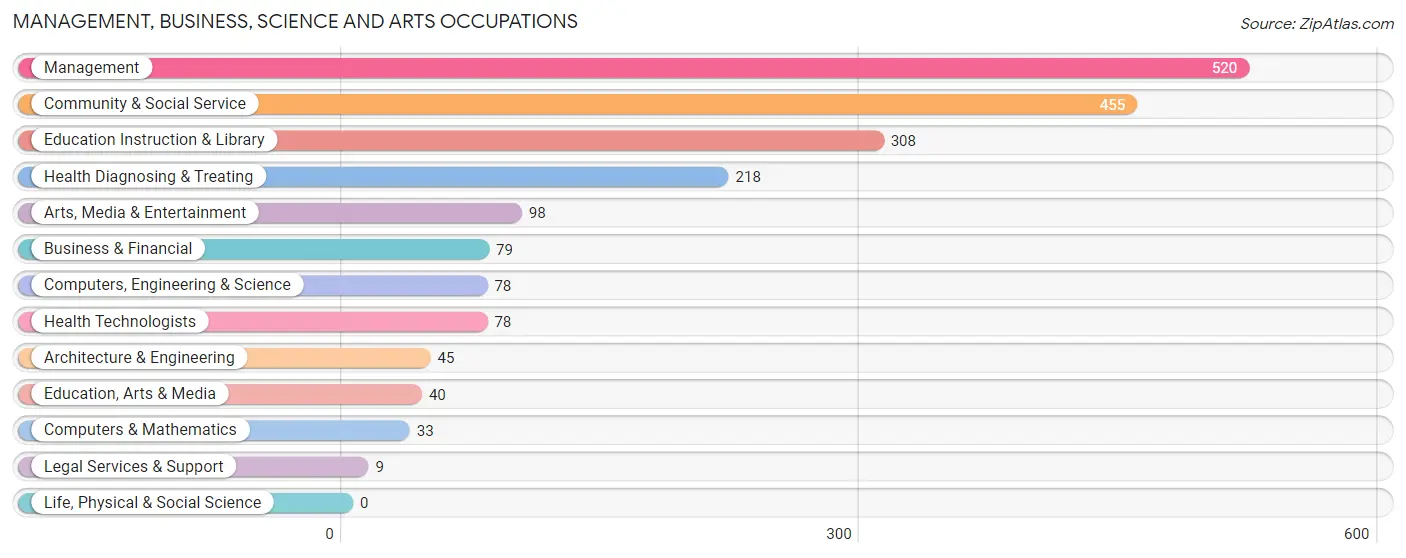
Management, Business, Science and Arts Occupations by Sex
Within the Management, Business, Science and Arts occupations in Bledsoe County, the most male-oriented occupations are Computers, Engineering & Science (100.0%), Computers & Mathematics (100.0%), and Architecture & Engineering (100.0%), while the most female-oriented occupations are Legal Services & Support (100.0%), Health Technologists (100.0%), and Health Diagnosing & Treating (86.2%).
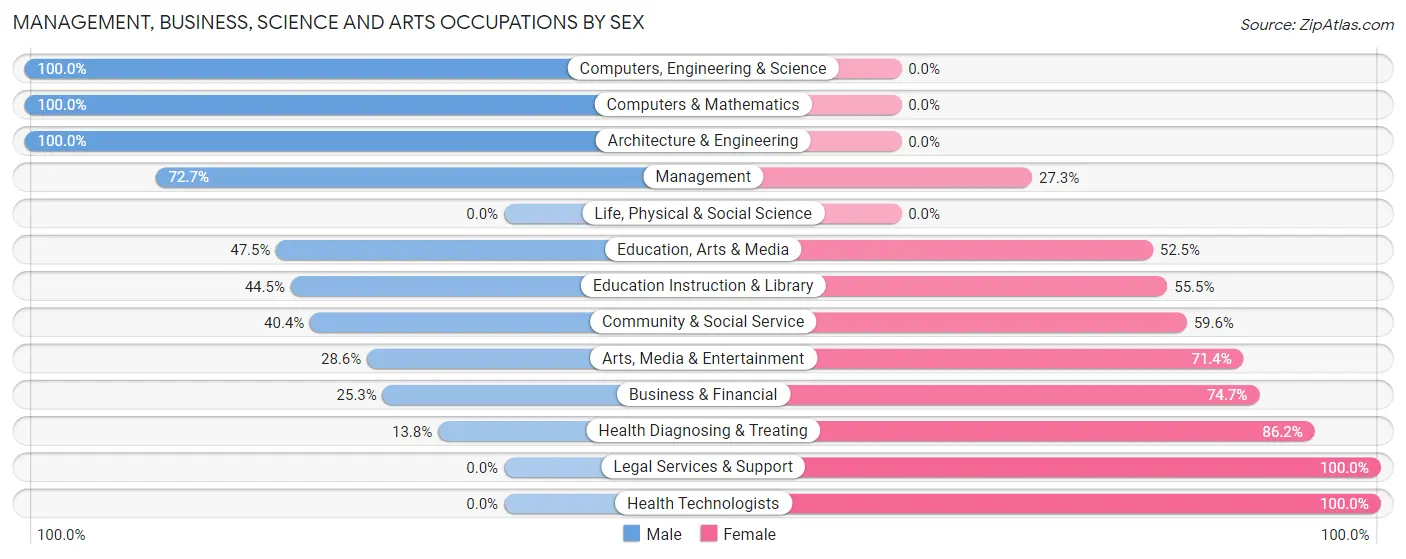
| Occupation | Male | Female |
| Management | 378 (72.7%) | 142 (27.3%) |
| Business & Financial | 20 (25.3%) | 59 (74.7%) |
| Computers, Engineering & Science | 78 (100.0%) | 0 (0.0%) |
| Computers & Mathematics | 33 (100.0%) | 0 (0.0%) |
| Architecture & Engineering | 45 (100.0%) | 0 (0.0%) |
| Life, Physical & Social Science | 0 (0.0%) | 0 (0.0%) |
| Community & Social Service | 184 (40.4%) | 271 (59.6%) |
| Education, Arts & Media | 19 (47.5%) | 21 (52.5%) |
| Legal Services & Support | 0 (0.0%) | 9 (100.0%) |
| Education Instruction & Library | 137 (44.5%) | 171 (55.5%) |
| Arts, Media & Entertainment | 28 (28.6%) | 70 (71.4%) |
| Health Diagnosing & Treating | 30 (13.8%) | 188 (86.2%) |
| Health Technologists | 0 (0.0%) | 78 (100.0%) |
| Total (Category) | 690 (51.1%) | 660 (48.9%) |
| Total (Overall) | 3,792 (67.5%) | 1,825 (32.5%) |
Services Occupations
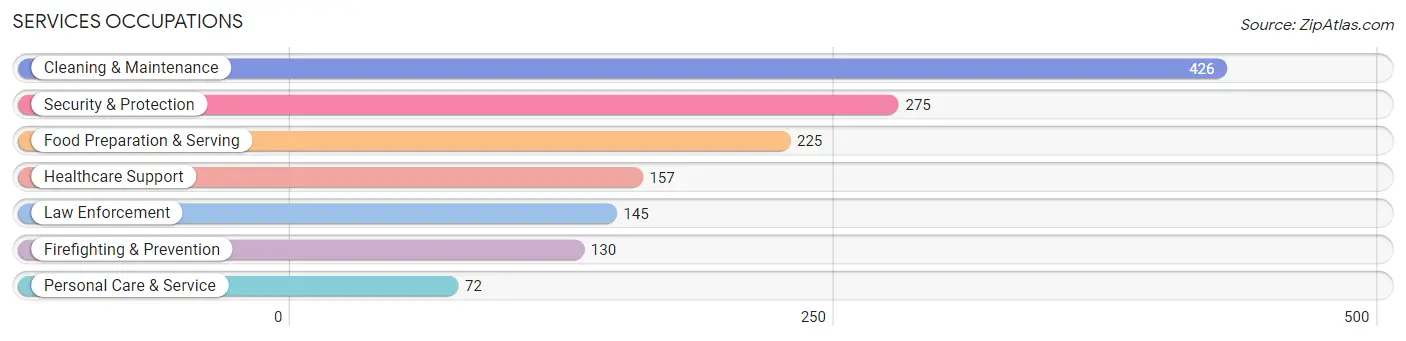
The most common Services occupations in Bledsoe County are Cleaning & Maintenance (426 | 7.6%), Security & Protection (275 | 4.9%), Food Preparation & Serving (225 | 4.0%), Healthcare Support (157 | 2.8%), and Law Enforcement (145 | 2.6%).
Services Occupations by Sex
Within the Services occupations in Bledsoe County, the most male-oriented occupations are Firefighting & Prevention (100.0%), Security & Protection (97.8%), and Law Enforcement (95.9%), while the most female-oriented occupations are Personal Care & Service (100.0%), Healthcare Support (93.0%), and Food Preparation & Serving (51.6%).
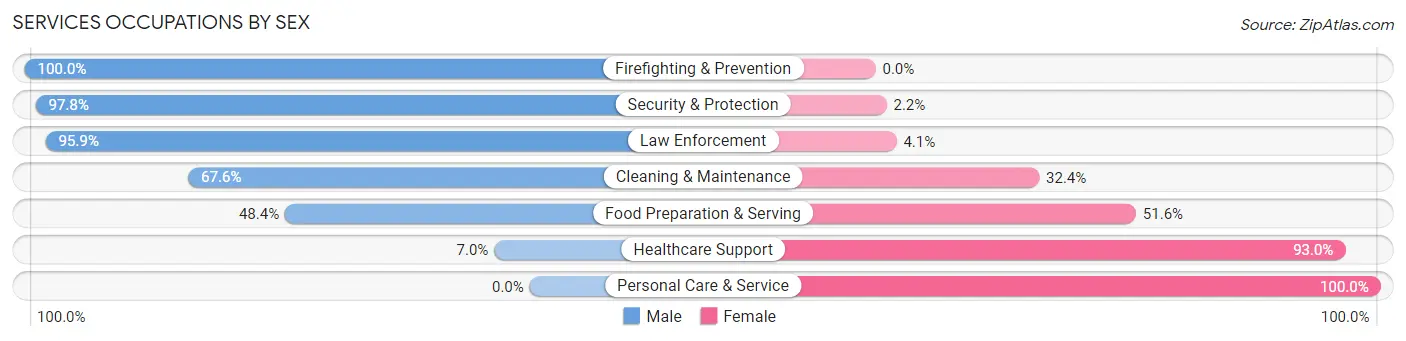
| Occupation | Male | Female |
| Healthcare Support | 11 (7.0%) | 146 (93.0%) |
| Security & Protection | 269 (97.8%) | 6 (2.2%) |
| Firefighting & Prevention | 130 (100.0%) | 0 (0.0%) |
| Law Enforcement | 139 (95.9%) | 6 (4.1%) |
| Food Preparation & Serving | 109 (48.4%) | 116 (51.6%) |
| Cleaning & Maintenance | 288 (67.6%) | 138 (32.4%) |
| Personal Care & Service | 0 (0.0%) | 72 (100.0%) |
| Total (Category) | 677 (58.6%) | 478 (41.4%) |
| Total (Overall) | 3,792 (67.5%) | 1,825 (32.5%) |
Sales and Office Occupations
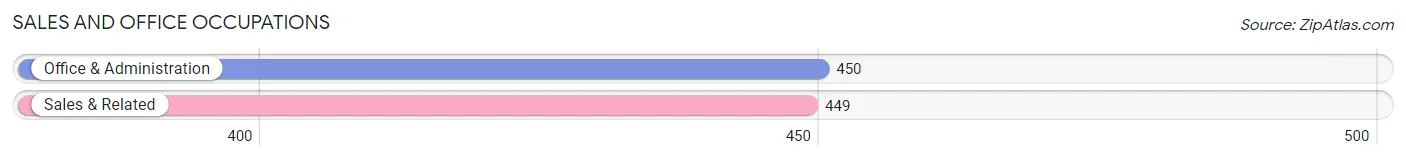
The most common Sales and Office occupations in Bledsoe County are Office & Administration (450 | 8.0%), and Sales & Related (449 | 8.0%).
Sales and Office Occupations by Sex
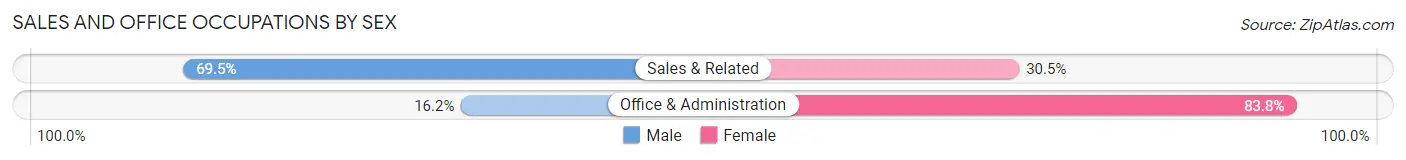
| Occupation | Male | Female |
| Sales & Related | 312 (69.5%) | 137 (30.5%) |
| Office & Administration | 73 (16.2%) | 377 (83.8%) |
| Total (Category) | 385 (42.8%) | 514 (57.2%) |
| Total (Overall) | 3,792 (67.5%) | 1,825 (32.5%) |
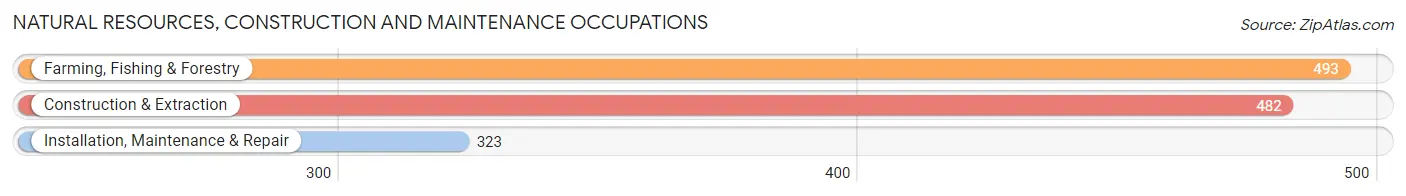
Natural Resources, Construction and Maintenance Occupations
The most common Natural Resources, Construction and Maintenance occupations in Bledsoe County are Farming, Fishing & Forestry (493 | 8.8%), Construction & Extraction (482 | 8.6%), and Installation, Maintenance & Repair (323 | 5.8%).
Natural Resources, Construction and Maintenance Occupations by Sex
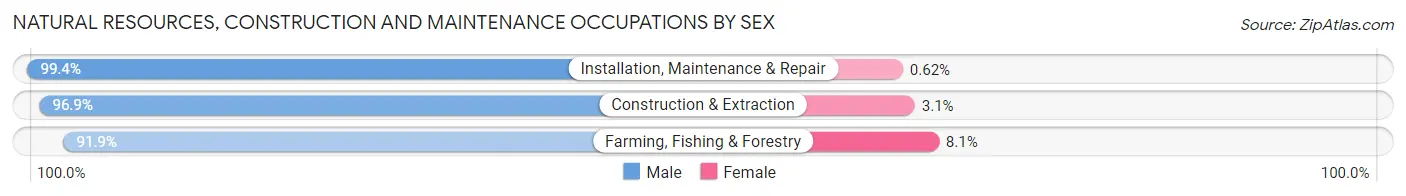
| Occupation | Male | Female |
| Farming, Fishing & Forestry | 453 (91.9%) | 40 (8.1%) |
| Construction & Extraction | 467 (96.9%) | 15 (3.1%) |
| Installation, Maintenance & Repair | 321 (99.4%) | 2 (0.6%) |
| Total (Category) | 1,241 (95.6%) | 57 (4.4%) |
| Total (Overall) | 3,792 (67.5%) | 1,825 (32.5%) |
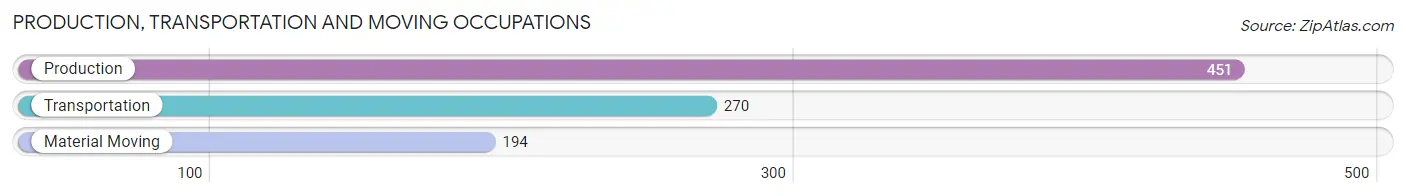
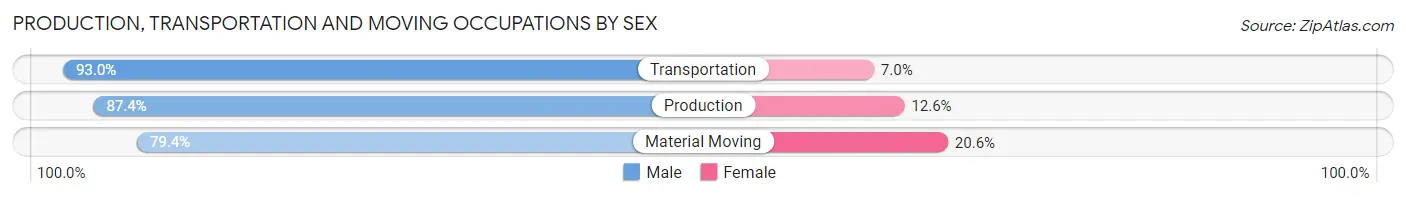
Production, Transportation and Moving Occupations
The most common Production, Transportation and Moving occupations in Bledsoe County are Production (451 | 8.0%), Transportation (270 | 4.8%), and Material Moving (194 | 3.5%).
Production, Transportation and Moving Occupations by Sex
| Occupation | Male | Female |
| Production | 394 (87.4%) | 57 (12.6%) |
| Transportation | 251 (93.0%) | 19 (7.0%) |
| Material Moving | 154 (79.4%) | 40 (20.6%) |
| Total (Category) | 799 (87.3%) | 116 (12.7%) |
| Total (Overall) | 3,792 (67.5%) | 1,825 (32.5%) |
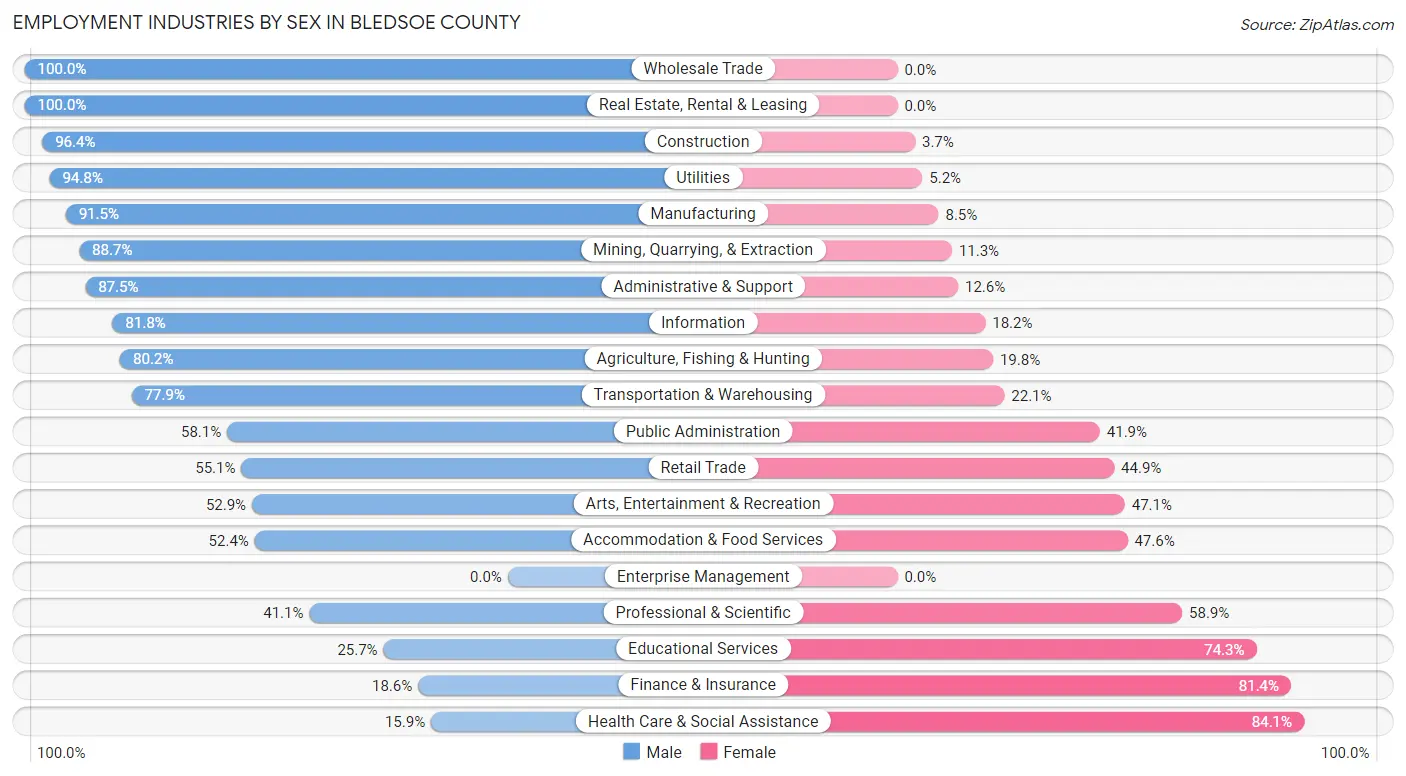
Employment Industries by Sex in Bledsoe County
Employment Industries in Bledsoe County
The major employment industries in Bledsoe County include Manufacturing (858 | 15.3%), Administrative & Support (709 | 12.6%), Construction (631 | 11.2%), Health Care & Social Assistance (510 | 9.1%), and Retail Trade (477 | 8.5%).

Employment Industries by Sex in Bledsoe County
The Bledsoe County industries that see more men than women are Wholesale Trade (100.0%), Real Estate, Rental & Leasing (100.0%), and Construction (96.4%), whereas the industries that tend to have a higher number of women are Health Care & Social Assistance (84.1%), Finance & Insurance (81.4%), and Educational Services (74.3%).
| Industry | Male | Female |
| Agriculture, Fishing & Hunting | 369 (80.2%) | 91 (19.8%) |
| Mining, Quarrying, & Extraction | 55 (88.7%) | 7 (11.3%) |
| Construction | 608 (96.4%) | 23 (3.6%) |
| Manufacturing | 785 (91.5%) | 73 (8.5%) |
| Wholesale Trade | 23 (100.0%) | 0 (0.0%) |
| Retail Trade | 263 (55.1%) | 214 (44.9%) |
| Transportation & Warehousing | 95 (77.9%) | 27 (22.1%) |
| Utilities | 147 (94.8%) | 8 (5.2%) |
| Information | 9 (81.8%) | 2 (18.2%) |
| Finance & Insurance | 26 (18.6%) | 114 (81.4%) |
| Real Estate, Rental & Leasing | 104 (100.0%) | 0 (0.0%) |
| Professional & Scientific | 46 (41.1%) | 66 (58.9%) |
| Enterprise Management | 0 (0.0%) | 0 (0.0%) |
| Administrative & Support | 620 (87.5%) | 89 (12.6%) |
| Educational Services | 71 (25.7%) | 205 (74.3%) |
| Health Care & Social Assistance | 81 (15.9%) | 429 (84.1%) |
| Arts, Entertainment & Recreation | 45 (52.9%) | 40 (47.1%) |
| Accommodation & Food Services | 143 (52.4%) | 130 (47.6%) |
| Public Administration | 183 (58.1%) | 132 (41.9%) |
| Total | 3,792 (67.5%) | 1,825 (32.5%) |
Education in Bledsoe County
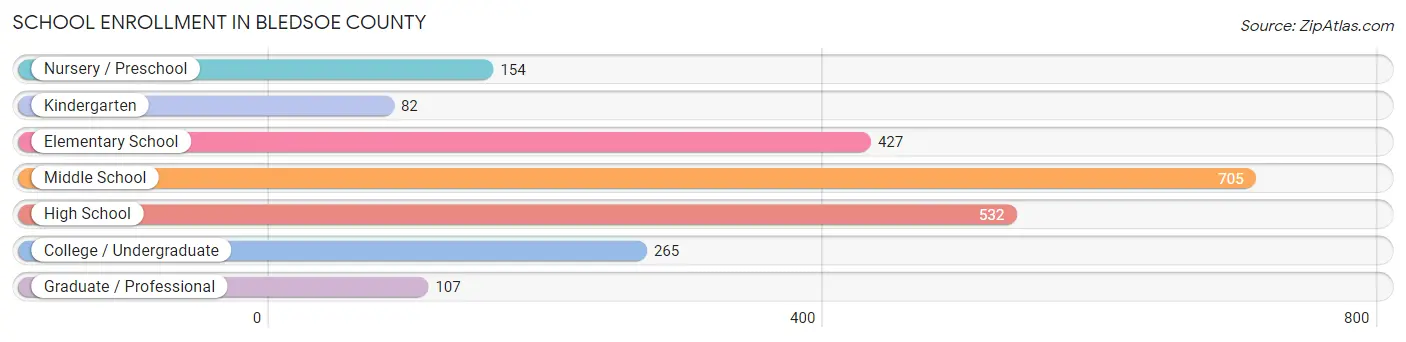
School Enrollment in Bledsoe County
The most common levels of schooling among the 2,272 students in Bledsoe County are middle school (705 | 31.0%), high school (532 | 23.4%), and elementary school (427 | 18.8%).
| School Level | # Students | % Students |
| Nursery / Preschool | 154 | 6.8% |
| Kindergarten | 82 | 3.6% |
| Elementary School | 427 | 18.8% |
| Middle School | 705 | 31.0% |
| High School | 532 | 23.4% |
| College / Undergraduate | 265 | 11.7% |
| Graduate / Professional | 107 | 4.7% |
| Total | 2,272 | 100.0% |
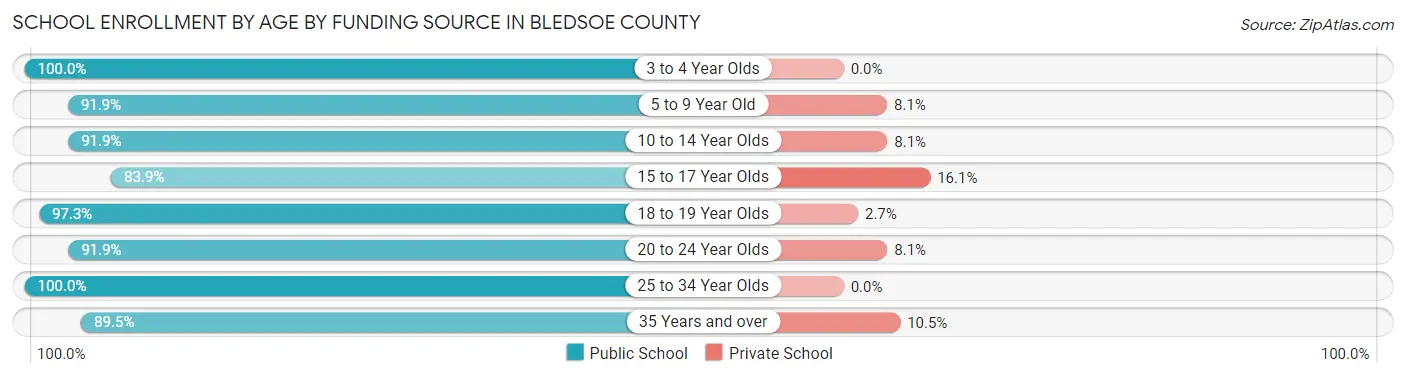
School Enrollment by Age by Funding Source in Bledsoe County
Out of a total of 2,272 students who are enrolled in schools in Bledsoe County, 184 (8.1%) attend a private institution, while the remaining 2,088 (91.9%) are enrolled in public schools. The age group of 15 to 17 year olds has the highest likelihood of being enrolled in private schools, with 59 (16.1% in the age bracket) enrolled. Conversely, the age group of 3 to 4 year olds has the lowest likelihood of being enrolled in a private school, with 153 (100.0% in the age bracket) attending a public institution.
| Age Bracket | Public School | Private School |
| 3 to 4 Year Olds | 153 (100.0%) | 0 (0.0%) |
| 5 to 9 Year Old | 445 (91.9%) | 39 (8.1%) |
| 10 to 14 Year Olds | 746 (91.9%) | 66 (8.1%) |
| 15 to 17 Year Olds | 307 (83.9%) | 59 (16.1%) |
| 18 to 19 Year Olds | 109 (97.3%) | 3 (2.7%) |
| 20 to 24 Year Olds | 113 (91.9%) | 10 (8.1%) |
| 25 to 34 Year Olds | 146 (100.0%) | 0 (0.0%) |
| 35 Years and over | 68 (89.5%) | 8 (10.5%) |
| Total | 2,088 (91.9%) | 184 (8.1%) |
Educational Attainment by Field of Study in Bledsoe County
Education (290 | 22.5%), science & technology (164 | 12.7%), engineering (146 | 11.3%), business (119 | 9.2%), and psychology (111 | 8.6%) are the most common fields of study among 1,291 individuals in Bledsoe County who have obtained a bachelor's degree or higher.
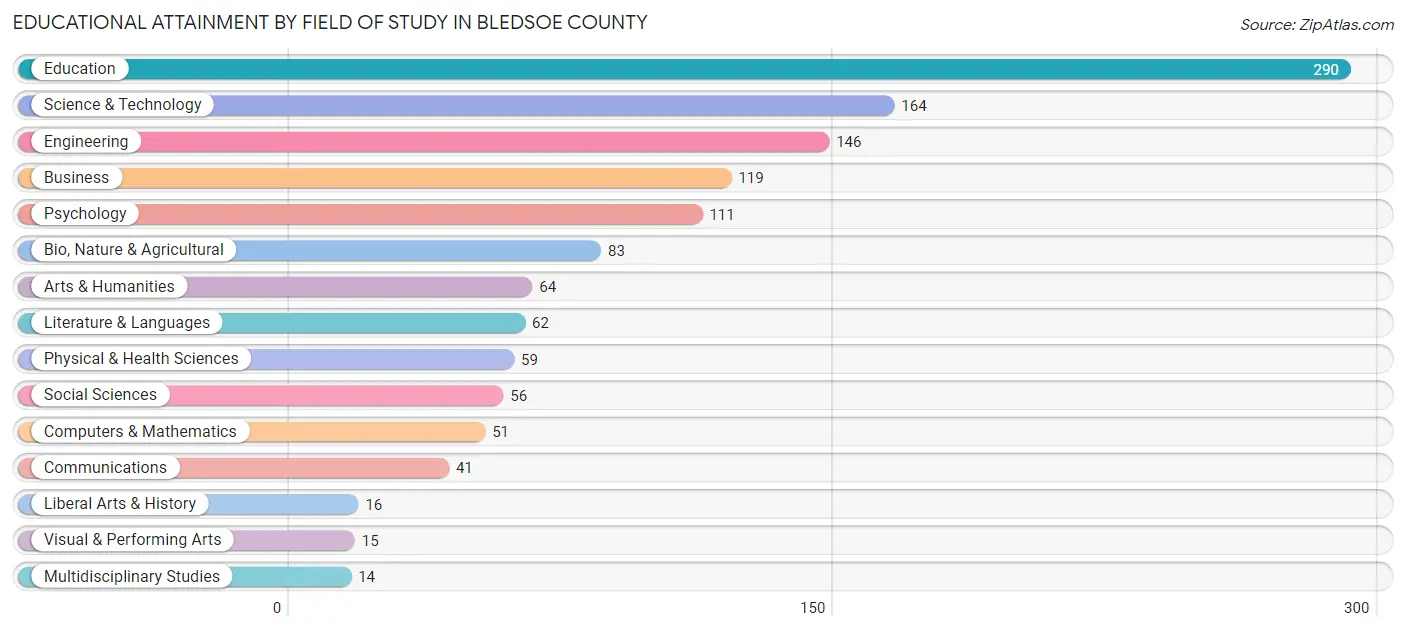
| Field of Study | # Graduates | % Graduates |
| Computers & Mathematics | 51 | 4.0% |
| Bio, Nature & Agricultural | 83 | 6.4% |
| Physical & Health Sciences | 59 | 4.6% |
| Psychology | 111 | 8.6% |
| Social Sciences | 56 | 4.3% |
| Engineering | 146 | 11.3% |
| Multidisciplinary Studies | 14 | 1.1% |
| Science & Technology | 164 | 12.7% |
| Business | 119 | 9.2% |
| Education | 290 | 22.5% |
| Literature & Languages | 62 | 4.8% |
| Liberal Arts & History | 16 | 1.2% |
| Visual & Performing Arts | 15 | 1.2% |
| Communications | 41 | 3.2% |
| Arts & Humanities | 64 | 5.0% |
| Total | 1,291 | 100.0% |
Transportation & Commute in Bledsoe County
Vehicle Availability by Sex in Bledsoe County
The most prevalent vehicle ownership categories in Bledsoe County are males with 2 vehicles (1,164, accounting for 31.3%) and females with 2 vehicles (412, making up 65.6%).
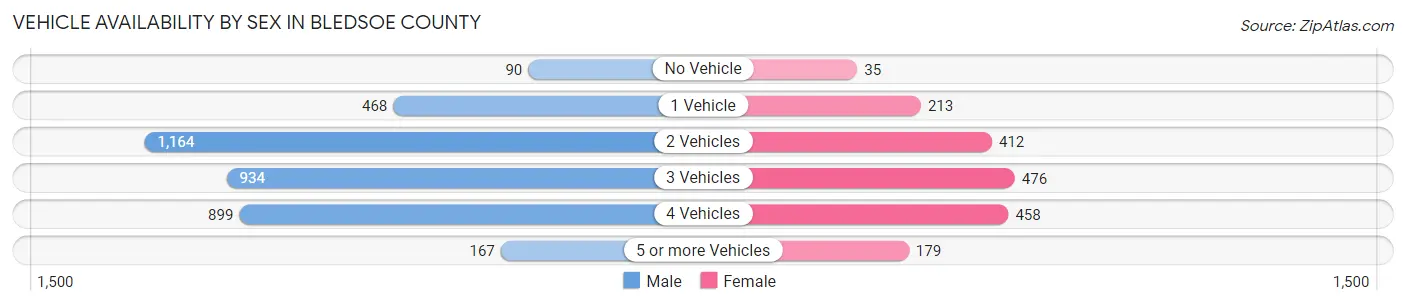
| Vehicles Available | Male | Female |
| No Vehicle | 90 (2.4%) | 35 (2.0%) |
| 1 Vehicle | 468 (12.6%) | 213 (12.0%) |
| 2 Vehicles | 1,164 (31.3%) | 412 (23.2%) |
| 3 Vehicles | 934 (25.1%) | 476 (26.9%) |
| 4 Vehicles | 899 (24.1%) | 458 (25.8%) |
| 5 or more Vehicles | 167 (4.5%) | 179 (10.1%) |
| Total | 3,722 (100.0%) | 1,773 (100.0%) |
Commute Time in Bledsoe County
The most frequently occuring commute durations in Bledsoe County are 15 to 19 minutes (947 commuters, 18.2%), 30 to 34 minutes (781 commuters, 15.0%), and 45 to 59 minutes (756 commuters, 14.5%).
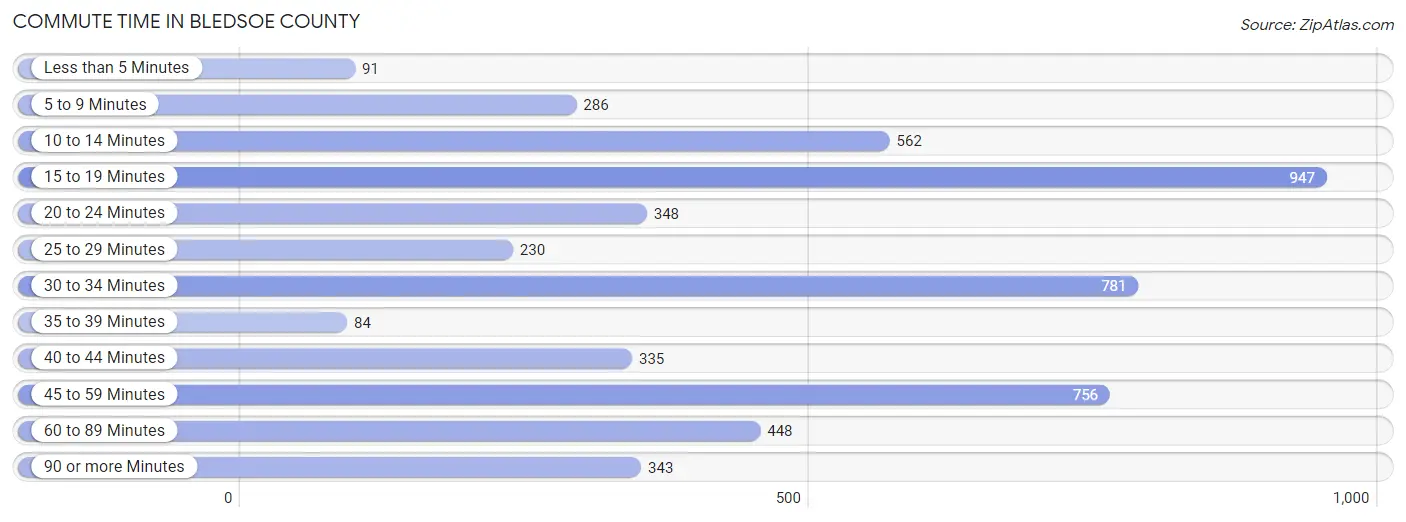
| Commute Time | # Commuters | % Commuters |
| Less than 5 Minutes | 91 | 1.8% |
| 5 to 9 Minutes | 286 | 5.5% |
| 10 to 14 Minutes | 562 | 10.8% |
| 15 to 19 Minutes | 947 | 18.2% |
| 20 to 24 Minutes | 348 | 6.7% |
| 25 to 29 Minutes | 230 | 4.4% |
| 30 to 34 Minutes | 781 | 15.0% |
| 35 to 39 Minutes | 84 | 1.6% |
| 40 to 44 Minutes | 335 | 6.4% |
| 45 to 59 Minutes | 756 | 14.5% |
| 60 to 89 Minutes | 448 | 8.6% |
| 90 or more Minutes | 343 | 6.6% |
Commute Time by Sex in Bledsoe County
The most common commute times in Bledsoe County are 15 to 19 minutes (765 commuters, 21.6%) for males and 30 to 34 minutes (377 commuters, 22.6%) for females.
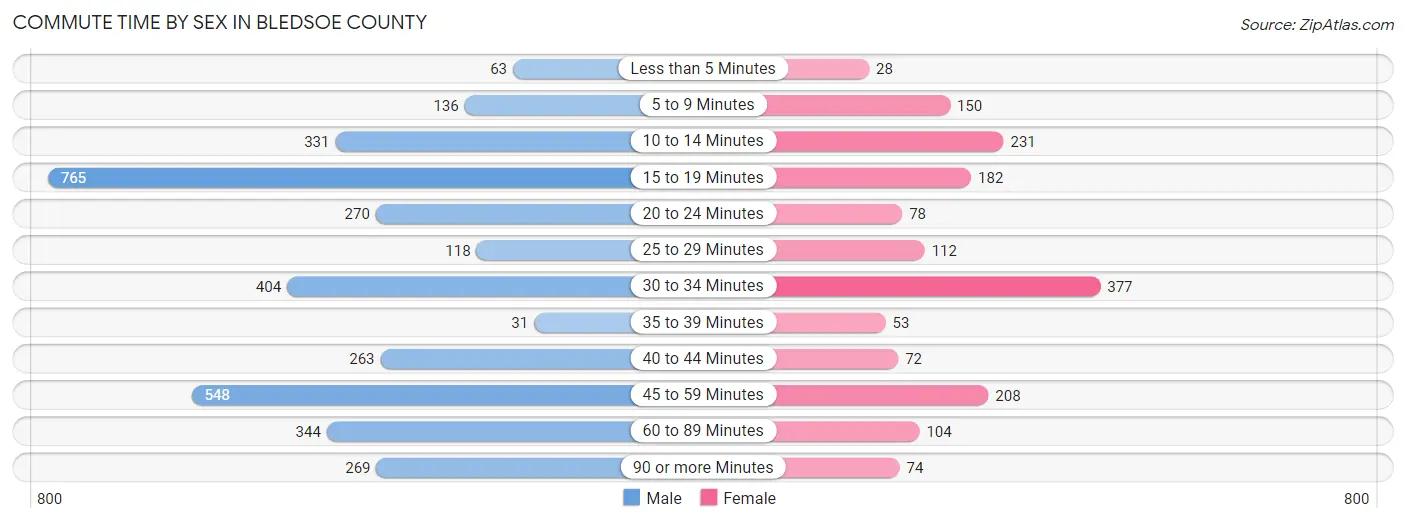
| Commute Time | Male | Female |
| Less than 5 Minutes | 63 (1.8%) | 28 (1.7%) |
| 5 to 9 Minutes | 136 (3.8%) | 150 (9.0%) |
| 10 to 14 Minutes | 331 (9.3%) | 231 (13.8%) |
| 15 to 19 Minutes | 765 (21.6%) | 182 (10.9%) |
| 20 to 24 Minutes | 270 (7.6%) | 78 (4.7%) |
| 25 to 29 Minutes | 118 (3.3%) | 112 (6.7%) |
| 30 to 34 Minutes | 404 (11.4%) | 377 (22.6%) |
| 35 to 39 Minutes | 31 (0.9%) | 53 (3.2%) |
| 40 to 44 Minutes | 263 (7.4%) | 72 (4.3%) |
| 45 to 59 Minutes | 548 (15.5%) | 208 (12.5%) |
| 60 to 89 Minutes | 344 (9.7%) | 104 (6.2%) |
| 90 or more Minutes | 269 (7.6%) | 74 (4.4%) |
Time of Departure to Work by Sex in Bledsoe County
The most frequent times of departure to work in Bledsoe County are 7:00 AM to 7:29 AM (674, 19.0%) for males and 7:00 AM to 7:29 AM (400, 24.0%) for females.
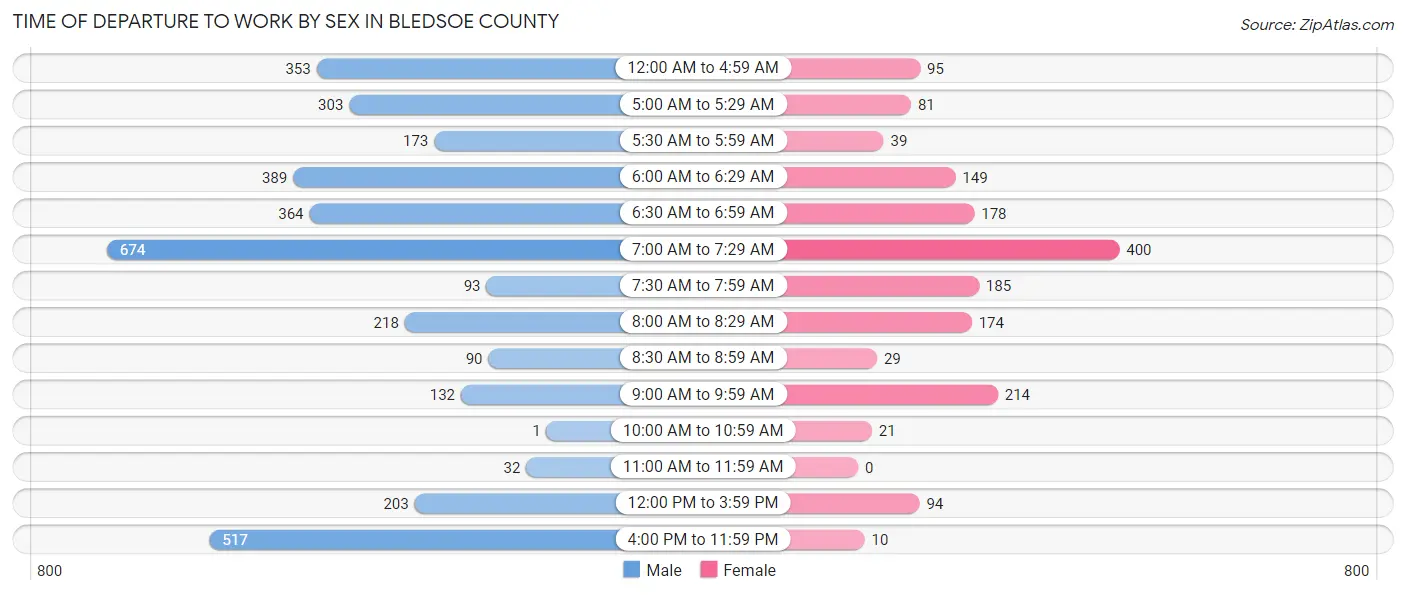
| Time of Departure | Male | Female |
| 12:00 AM to 4:59 AM | 353 (10.0%) | 95 (5.7%) |
| 5:00 AM to 5:29 AM | 303 (8.6%) | 81 (4.9%) |
| 5:30 AM to 5:59 AM | 173 (4.9%) | 39 (2.3%) |
| 6:00 AM to 6:29 AM | 389 (11.0%) | 149 (8.9%) |
| 6:30 AM to 6:59 AM | 364 (10.3%) | 178 (10.7%) |
| 7:00 AM to 7:29 AM | 674 (19.0%) | 400 (24.0%) |
| 7:30 AM to 7:59 AM | 93 (2.6%) | 185 (11.1%) |
| 8:00 AM to 8:29 AM | 218 (6.1%) | 174 (10.4%) |
| 8:30 AM to 8:59 AM | 90 (2.5%) | 29 (1.7%) |
| 9:00 AM to 9:59 AM | 132 (3.7%) | 214 (12.8%) |
| 10:00 AM to 10:59 AM | 1 (0.0%) | 21 (1.3%) |
| 11:00 AM to 11:59 AM | 32 (0.9%) | 0 (0.0%) |
| 12:00 PM to 3:59 PM | 203 (5.7%) | 94 (5.6%) |
| 4:00 PM to 11:59 PM | 517 (14.6%) | 10 (0.6%) |
| Total | 3,542 (100.0%) | 1,669 (100.0%) |
Housing Occupancy in Bledsoe County
Occupancy by Ownership in Bledsoe County
Of the total 4,851 dwellings in Bledsoe County, owner-occupied units account for 3,912 (80.6%), while renter-occupied units make up 939 (19.4%).
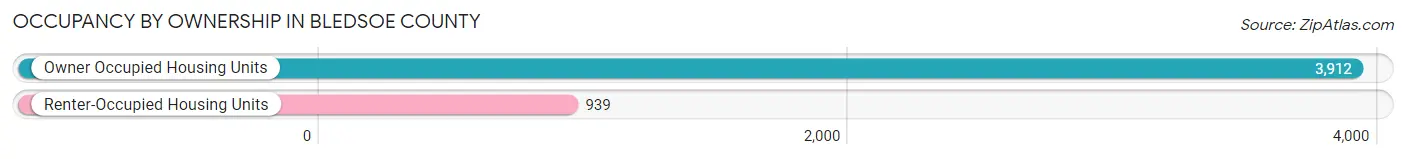
| Occupancy | # Housing Units | % Housing Units |
| Owner Occupied Housing Units | 3,912 | 80.6% |
| Renter-Occupied Housing Units | 939 | 19.4% |
| Total Occupied Housing Units | 4,851 | 100.0% |
Occupancy by Household Size in Bledsoe County
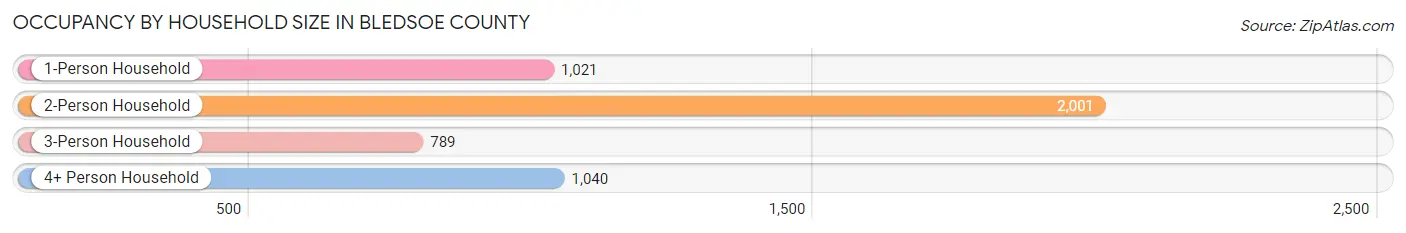
| Household Size | # Housing Units | % Housing Units |
| 1-Person Household | 1,021 | 21.0% |
| 2-Person Household | 2,001 | 41.2% |
| 3-Person Household | 789 | 16.3% |
| 4+ Person Household | 1,040 | 21.4% |
| Total Housing Units | 4,851 | 100.0% |
Occupancy by Ownership by Household Size in Bledsoe County
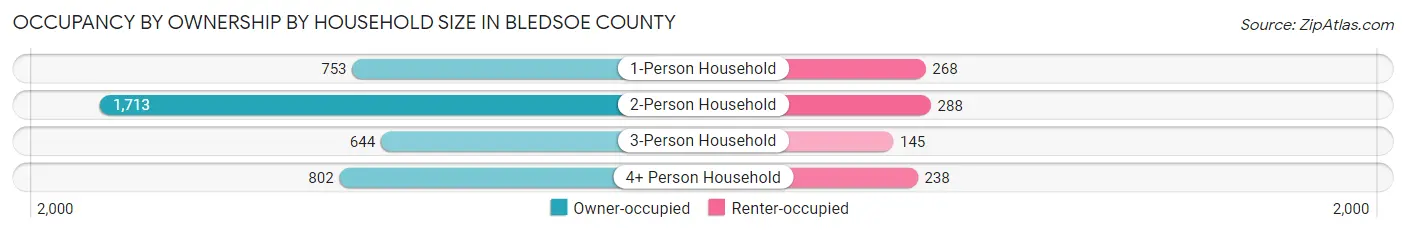
| Household Size | Owner-occupied | Renter-occupied |
| 1-Person Household | 753 (73.8%) | 268 (26.3%) |
| 2-Person Household | 1,713 (85.6%) | 288 (14.4%) |
| 3-Person Household | 644 (81.6%) | 145 (18.4%) |
| 4+ Person Household | 802 (77.1%) | 238 (22.9%) |
| Total Housing Units | 3,912 (80.6%) | 939 (19.4%) |
Occupancy by Educational Attainment in Bledsoe County
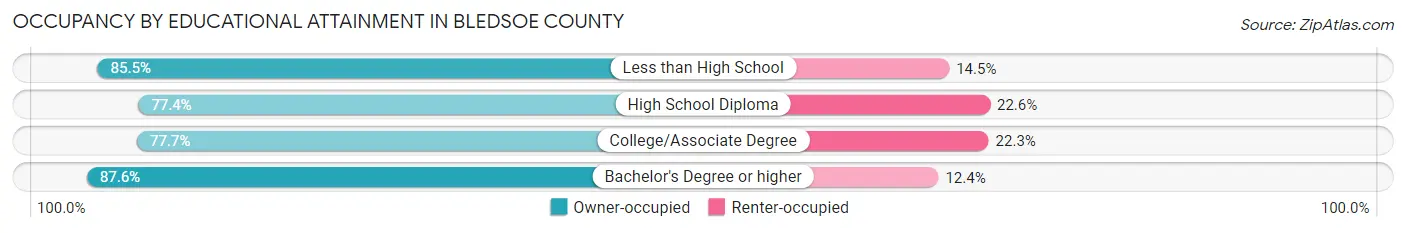
| Household Size | Owner-occupied | Renter-occupied |
| Less than High School | 767 (85.5%) | 130 (14.5%) |
| High School Diploma | 1,551 (77.4%) | 452 (22.6%) |
| College/Associate Degree | 906 (77.7%) | 260 (22.3%) |
| Bachelor's Degree or higher | 688 (87.6%) | 97 (12.4%) |
Occupancy by Age of Householder in Bledsoe County
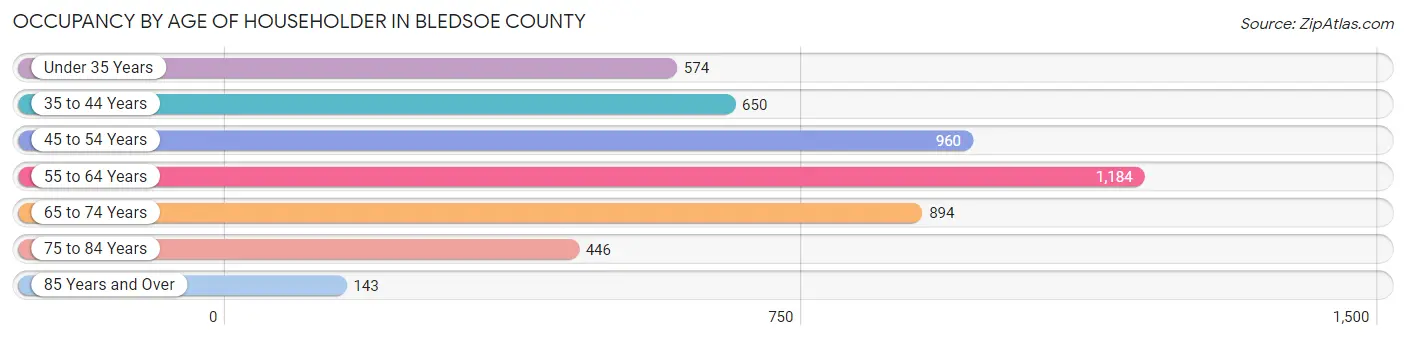
| Age Bracket | # Households | % Households |
| Under 35 Years | 574 | 11.8% |
| 35 to 44 Years | 650 | 13.4% |
| 45 to 54 Years | 960 | 19.8% |
| 55 to 64 Years | 1,184 | 24.4% |
| 65 to 74 Years | 894 | 18.4% |
| 75 to 84 Years | 446 | 9.2% |
| 85 Years and Over | 143 | 2.9% |
| Total | 4,851 | 100.0% |
Housing Finances in Bledsoe County
Median Income by Occupancy in Bledsoe County
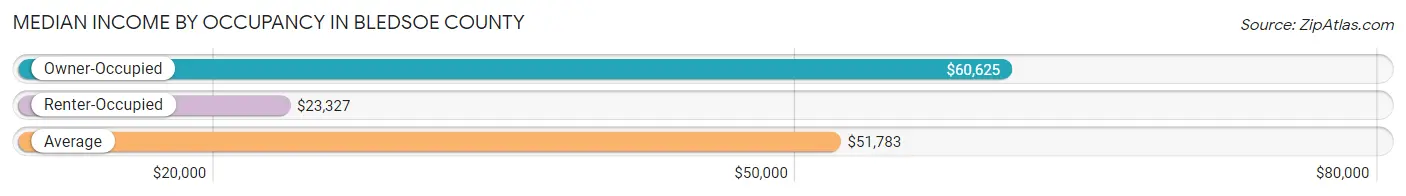
| Occupancy Type | # Households | Median Income |
| Owner-Occupied | 3,912 (80.6%) | $60,625 |
| Renter-Occupied | 939 (19.4%) | $23,327 |
| Average | 4,851 (100.0%) | $51,783 |
Occupancy by Householder Income Bracket in Bledsoe County
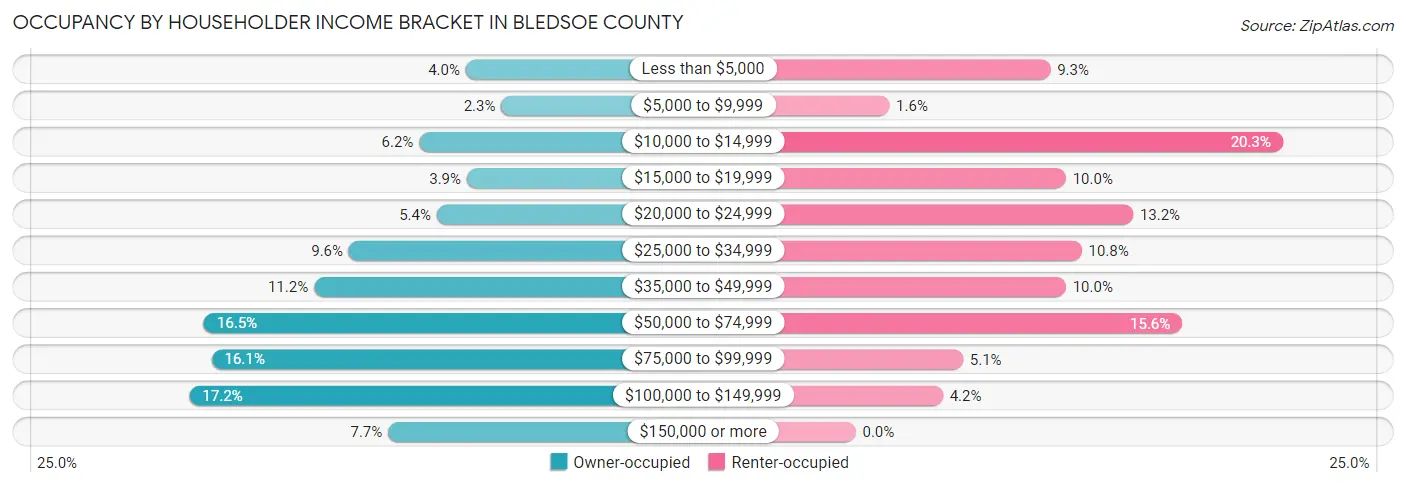
| Income Bracket | Owner-occupied | Renter-occupied |
| Less than $5,000 | 156 (4.0%) | 87 (9.3%) |
| $5,000 to $9,999 | 90 (2.3%) | 15 (1.6%) |
| $10,000 to $14,999 | 243 (6.2%) | 191 (20.3%) |
| $15,000 to $19,999 | 154 (3.9%) | 94 (10.0%) |
| $20,000 to $24,999 | 210 (5.4%) | 124 (13.2%) |
| $25,000 to $34,999 | 374 (9.6%) | 101 (10.8%) |
| $35,000 to $49,999 | 439 (11.2%) | 94 (10.0%) |
| $50,000 to $74,999 | 644 (16.5%) | 146 (15.5%) |
| $75,000 to $99,999 | 630 (16.1%) | 48 (5.1%) |
| $100,000 to $149,999 | 671 (17.2%) | 39 (4.2%) |
| $150,000 or more | 301 (7.7%) | 0 (0.0%) |
| Total | 3,912 (100.0%) | 939 (100.0%) |
Monthly Housing Cost Tiers in Bledsoe County
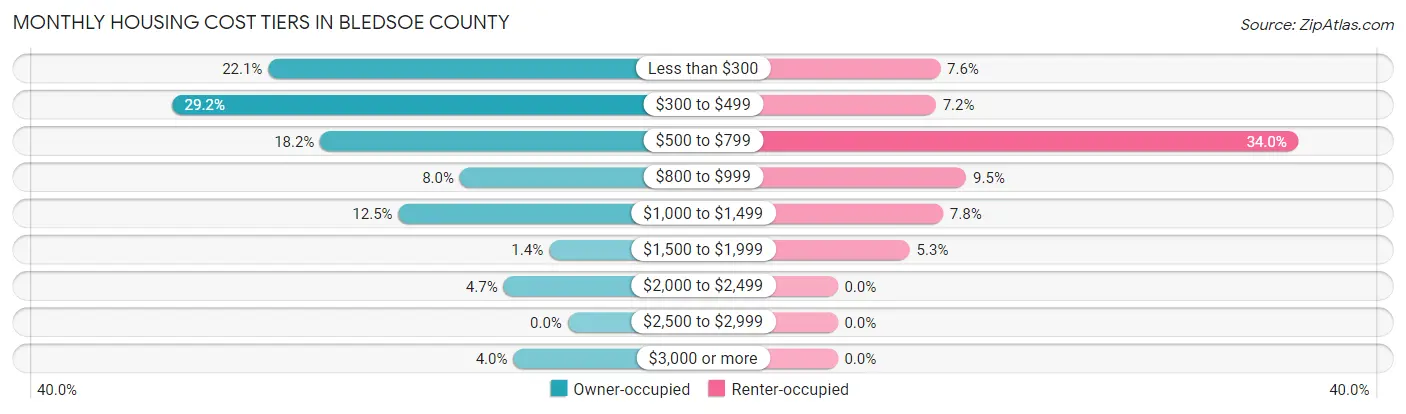
| Monthly Cost | Owner-occupied | Renter-occupied |
| Less than $300 | 863 (22.1%) | 71 (7.6%) |
| $300 to $499 | 1,141 (29.2%) | 68 (7.2%) |
| $500 to $799 | 713 (18.2%) | 319 (34.0%) |
| $800 to $999 | 311 (8.0%) | 89 (9.5%) |
| $1,000 to $1,499 | 488 (12.5%) | 73 (7.8%) |
| $1,500 to $1,999 | 54 (1.4%) | 50 (5.3%) |
| $2,000 to $2,499 | 185 (4.7%) | 0 (0.0%) |
| $2,500 to $2,999 | 0 (0.0%) | 0 (0.0%) |
| $3,000 or more | 157 (4.0%) | 0 (0.0%) |
| Total | 3,912 (100.0%) | 939 (100.0%) |
Physical Housing Characteristics in Bledsoe County
Housing Structures in Bledsoe County
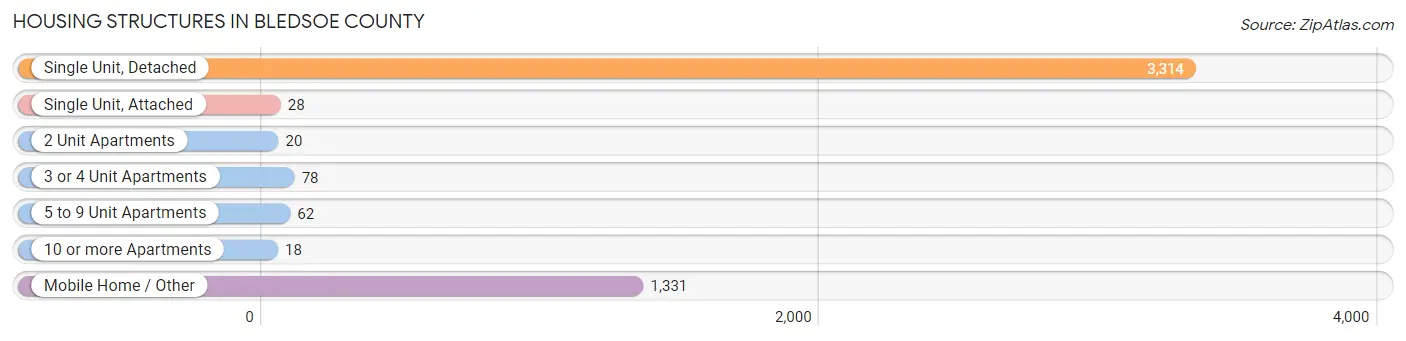
| Structure Type | # Housing Units | % Housing Units |
| Single Unit, Detached | 3,314 | 68.3% |
| Single Unit, Attached | 28 | 0.6% |
| 2 Unit Apartments | 20 | 0.4% |
| 3 or 4 Unit Apartments | 78 | 1.6% |
| 5 to 9 Unit Apartments | 62 | 1.3% |
| 10 or more Apartments | 18 | 0.4% |
| Mobile Home / Other | 1,331 | 27.4% |
| Total | 4,851 | 100.0% |
Housing Structures by Occupancy in Bledsoe County
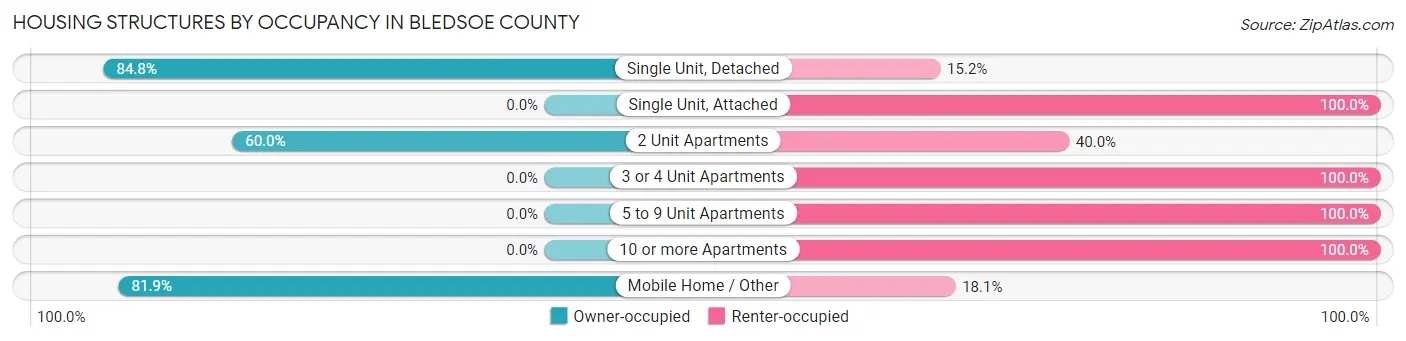
| Structure Type | Owner-occupied | Renter-occupied |
| Single Unit, Detached | 2,810 (84.8%) | 504 (15.2%) |
| Single Unit, Attached | 0 (0.0%) | 28 (100.0%) |
| 2 Unit Apartments | 12 (60.0%) | 8 (40.0%) |
| 3 or 4 Unit Apartments | 0 (0.0%) | 78 (100.0%) |
| 5 to 9 Unit Apartments | 0 (0.0%) | 62 (100.0%) |
| 10 or more Apartments | 0 (0.0%) | 18 (100.0%) |
| Mobile Home / Other | 1,090 (81.9%) | 241 (18.1%) |
| Total | 3,912 (80.6%) | 939 (19.4%) |
Housing Structures by Number of Rooms in Bledsoe County
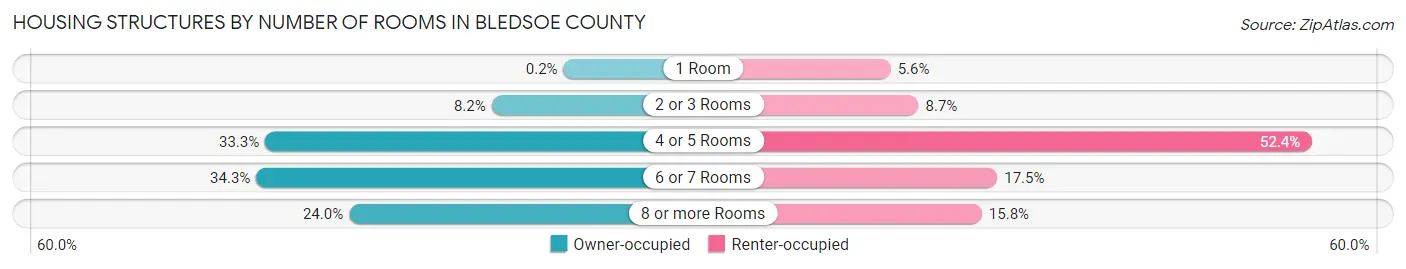
| Number of Rooms | Owner-occupied | Renter-occupied |
| 1 Room | 8 (0.2%) | 53 (5.6%) |
| 2 or 3 Rooms | 320 (8.2%) | 82 (8.7%) |
| 4 or 5 Rooms | 1,303 (33.3%) | 492 (52.4%) |
| 6 or 7 Rooms | 1,342 (34.3%) | 164 (17.5%) |
| 8 or more Rooms | 939 (24.0%) | 148 (15.8%) |
| Total | 3,912 (100.0%) | 939 (100.0%) |
Housing Structure by Heating Type in Bledsoe County
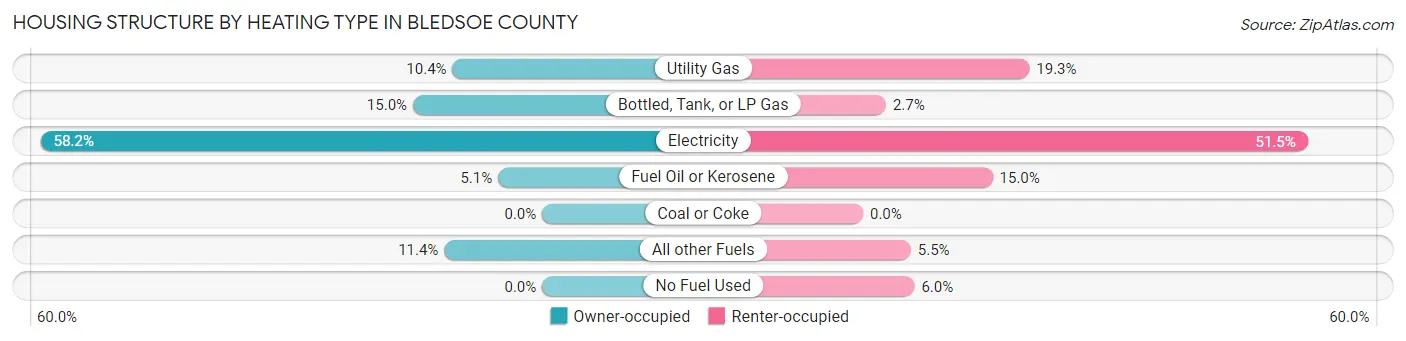
| Heating Type | Owner-occupied | Renter-occupied |
| Utility Gas | 407 (10.4%) | 181 (19.3%) |
| Bottled, Tank, or LP Gas | 586 (15.0%) | 25 (2.7%) |
| Electricity | 2,275 (58.2%) | 484 (51.5%) |
| Fuel Oil or Kerosene | 200 (5.1%) | 141 (15.0%) |
| Coal or Coke | 0 (0.0%) | 0 (0.0%) |
| All other Fuels | 444 (11.4%) | 52 (5.5%) |
| No Fuel Used | 0 (0.0%) | 56 (6.0%) |
| Total | 3,912 (100.0%) | 939 (100.0%) |
Household Vehicle Usage in Bledsoe County
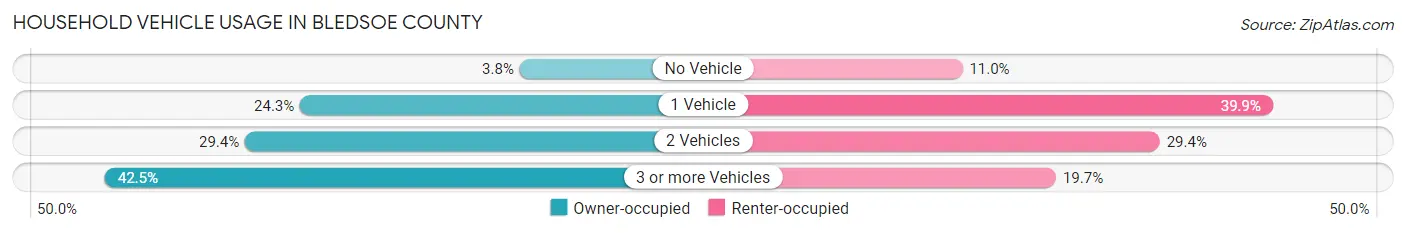
| Vehicles per Household | Owner-occupied | Renter-occupied |
| No Vehicle | 148 (3.8%) | 103 (11.0%) |
| 1 Vehicle | 950 (24.3%) | 375 (39.9%) |
| 2 Vehicles | 1,151 (29.4%) | 276 (29.4%) |
| 3 or more Vehicles | 1,663 (42.5%) | 185 (19.7%) |
| Total | 3,912 (100.0%) | 939 (100.0%) |
Real Estate & Mortgages in Bledsoe County
Real Estate and Mortgage Overview in Bledsoe County
| Characteristic | Without Mortgage | With Mortgage |
| Housing Units | 2,383 | 1,529 |
| Median Property Value | $129,500 | $175,400 |
| Median Household Income | $47,776 | $87 |
| Monthly Housing Costs | $333 | $157 |
| Real Estate Taxes | $576 | $0 |
Property Value by Mortgage Status in Bledsoe County
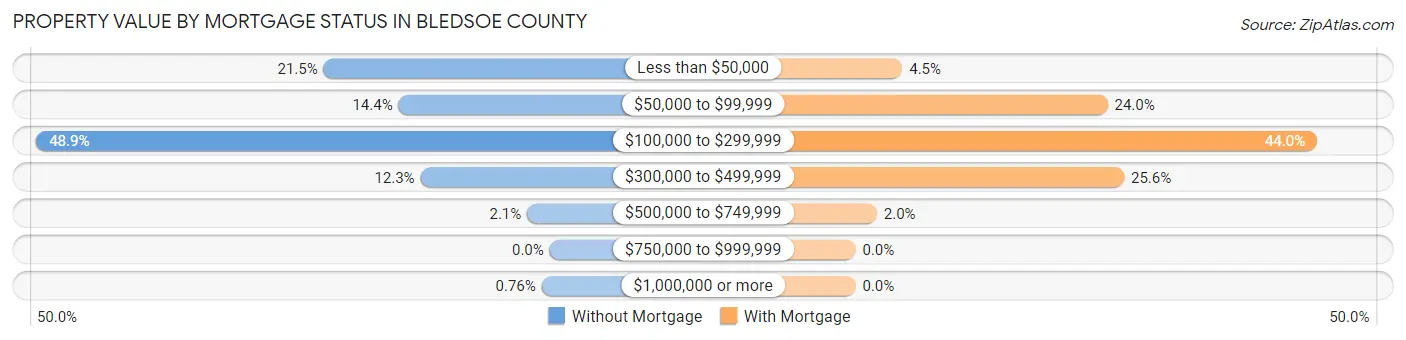
| Property Value | Without Mortgage | With Mortgage |
| Less than $50,000 | 513 (21.5%) | 68 (4.4%) |
| $50,000 to $99,999 | 343 (14.4%) | 367 (24.0%) |
| $100,000 to $299,999 | 1,165 (48.9%) | 672 (44.0%) |
| $300,000 to $499,999 | 293 (12.3%) | 391 (25.6%) |
| $500,000 to $749,999 | 51 (2.1%) | 31 (2.0%) |
| $750,000 to $999,999 | 0 (0.0%) | 0 (0.0%) |
| $1,000,000 or more | 18 (0.8%) | 0 (0.0%) |
| Total | 2,383 (100.0%) | 1,529 (100.0%) |
Household Income by Mortgage Status in Bledsoe County
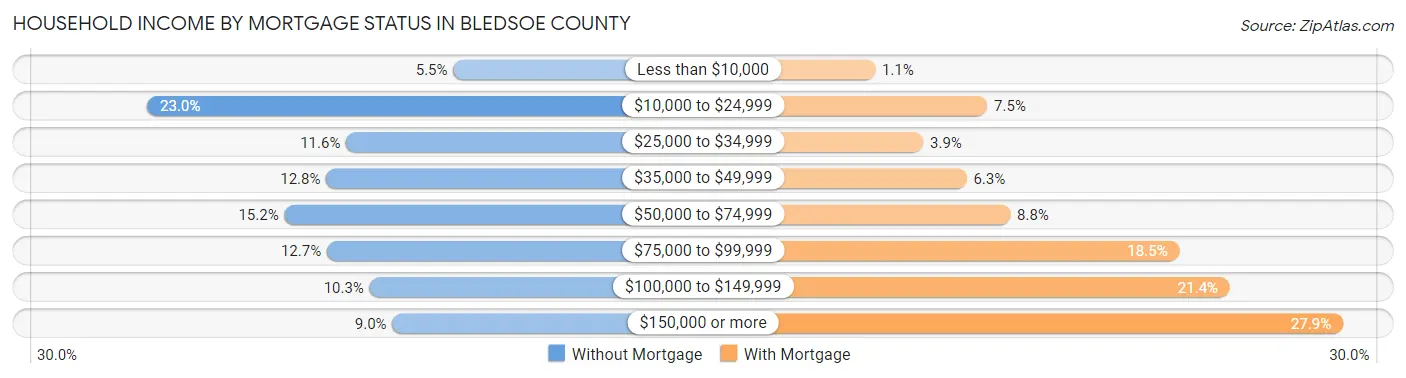
| Household Income | Without Mortgage | With Mortgage |
| Less than $10,000 | 131 (5.5%) | 17 (1.1%) |
| $10,000 to $24,999 | 548 (23.0%) | 115 (7.5%) |
| $25,000 to $34,999 | 277 (11.6%) | 59 (3.9%) |
| $35,000 to $49,999 | 304 (12.8%) | 97 (6.3%) |
| $50,000 to $74,999 | 361 (15.1%) | 135 (8.8%) |
| $75,000 to $99,999 | 303 (12.7%) | 283 (18.5%) |
| $100,000 to $149,999 | 245 (10.3%) | 327 (21.4%) |
| $150,000 or more | 214 (9.0%) | 426 (27.9%) |
| Total | 2,383 (100.0%) | 1,529 (100.0%) |
Property Value to Household Income Ratio in Bledsoe County
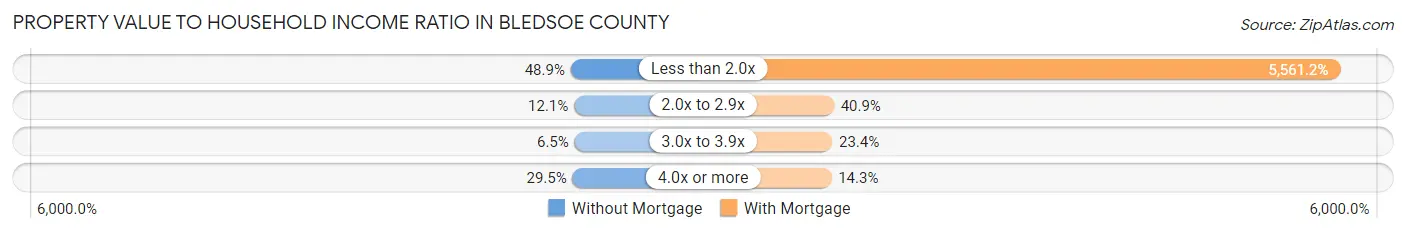
| Value-to-Income Ratio | Without Mortgage | With Mortgage |
| Less than 2.0x | 1,164 (48.8%) | 85,030 (5,561.1%) |
| 2.0x to 2.9x | 289 (12.1%) | 626 (40.9%) |
| 3.0x to 3.9x | 155 (6.5%) | 358 (23.4%) |
| 4.0x or more | 703 (29.5%) | 218 (14.3%) |
| Total | 2,383 (100.0%) | 1,529 (100.0%) |
Real Estate Taxes by Mortgage Status in Bledsoe County

| Property Taxes | Without Mortgage | With Mortgage |
| Less than $800 | 1,477 (62.0%) | 8 (0.5%) |
| $800 to $1,499 | 529 (22.2%) | 752 (49.2%) |
| $800 to $1,499 | 159 (6.7%) | 499 (32.6%) |
| Total | 2,383 (100.0%) | 1,529 (100.0%) |
Health & Disability in Bledsoe County
Health Insurance Coverage by Age in Bledsoe County
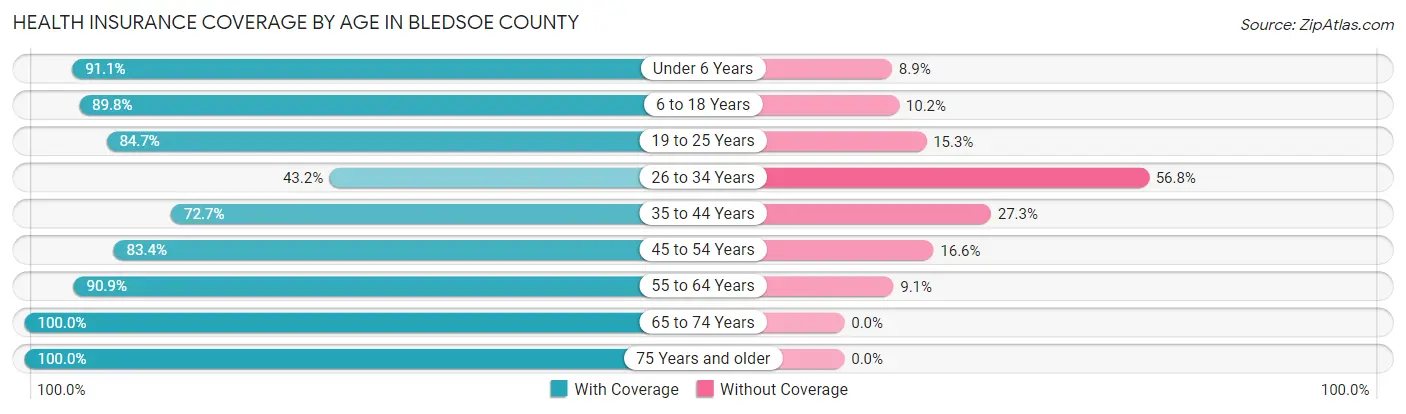
| Age Bracket | With Coverage | Without Coverage |
| Under 6 Years | 616 (91.1%) | 60 (8.9%) |
| 6 to 18 Years | 1,723 (89.8%) | 195 (10.2%) |
| 19 to 25 Years | 710 (84.7%) | 128 (15.3%) |
| 26 to 34 Years | 723 (43.2%) | 949 (56.8%) |
| 35 to 44 Years | 1,277 (72.7%) | 480 (27.3%) |
| 45 to 54 Years | 1,591 (83.4%) | 317 (16.6%) |
| 55 to 64 Years | 1,938 (90.9%) | 195 (9.1%) |
| 65 to 74 Years | 1,594 (100.0%) | 0 (0.0%) |
| 75 Years and older | 1,147 (100.0%) | 0 (0.0%) |
| Total | 11,319 (83.0%) | 2,324 (17.0%) |
Health Insurance Coverage by Citizenship Status in Bledsoe County
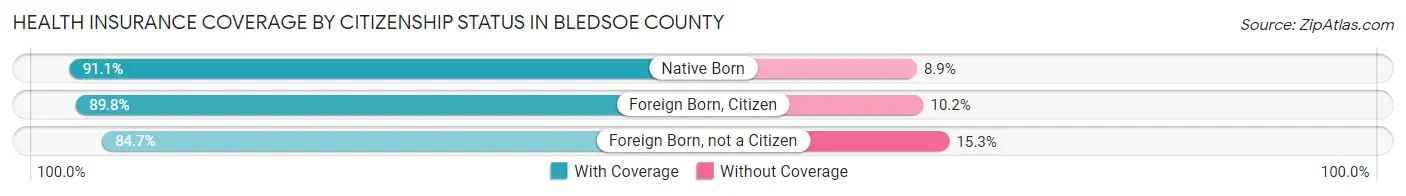
| Citizenship Status | With Coverage | Without Coverage |
| Native Born | 616 (91.1%) | 60 (8.9%) |
| Foreign Born, Citizen | 1,723 (89.8%) | 195 (10.2%) |
| Foreign Born, not a Citizen | 710 (84.7%) | 128 (15.3%) |
Health Insurance Coverage by Household Income in Bledsoe County
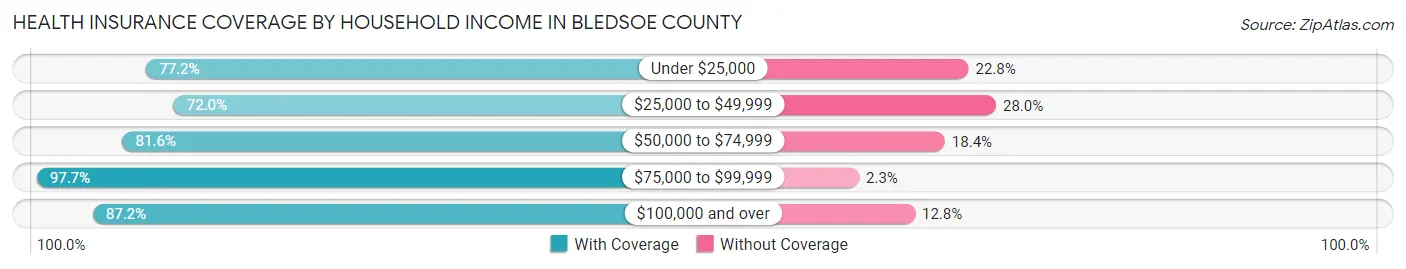
| Household Income | With Coverage | Without Coverage |
| Under $25,000 | 2,348 (77.2%) | 694 (22.8%) |
| $25,000 to $49,999 | 1,785 (72.0%) | 693 (28.0%) |
| $50,000 to $74,999 | 1,874 (81.6%) | 422 (18.4%) |
| $75,000 to $99,999 | 2,125 (97.7%) | 50 (2.3%) |
| $100,000 and over | 3,170 (87.2%) | 465 (12.8%) |
Public vs Private Health Insurance Coverage by Age in Bledsoe County
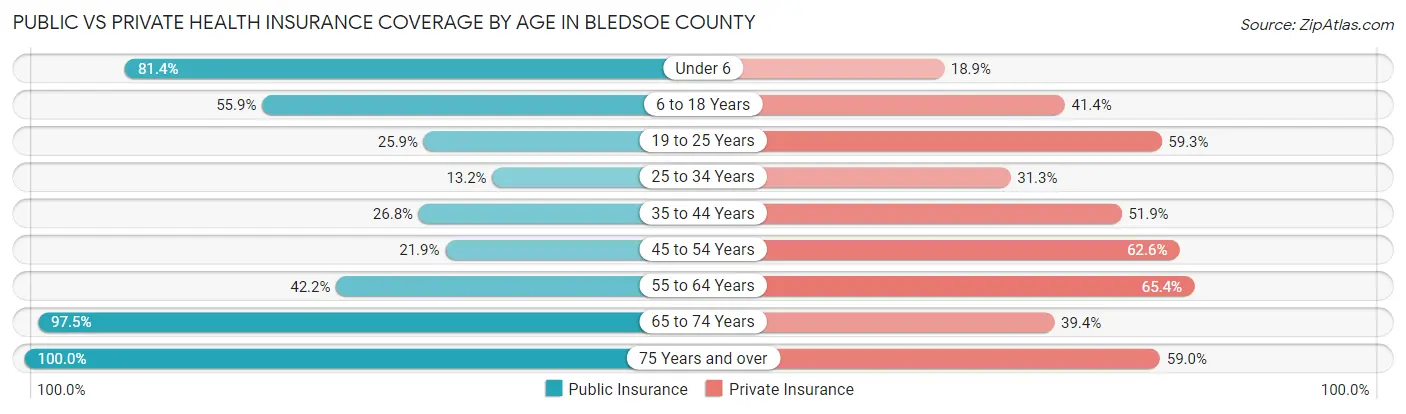
| Age Bracket | Public Insurance | Private Insurance |
| Under 6 | 550 (81.4%) | 128 (18.9%) |
| 6 to 18 Years | 1,072 (55.9%) | 793 (41.3%) |
| 19 to 25 Years | 217 (25.9%) | 497 (59.3%) |
| 25 to 34 Years | 220 (13.2%) | 523 (31.3%) |
| 35 to 44 Years | 471 (26.8%) | 912 (51.9%) |
| 45 to 54 Years | 418 (21.9%) | 1,195 (62.6%) |
| 55 to 64 Years | 899 (42.1%) | 1,394 (65.3%) |
| 65 to 74 Years | 1,554 (97.5%) | 628 (39.4%) |
| 75 Years and over | 1,147 (100.0%) | 677 (59.0%) |
| Total | 6,548 (48.0%) | 6,747 (49.4%) |
Disability Status by Sex by Age in Bledsoe County
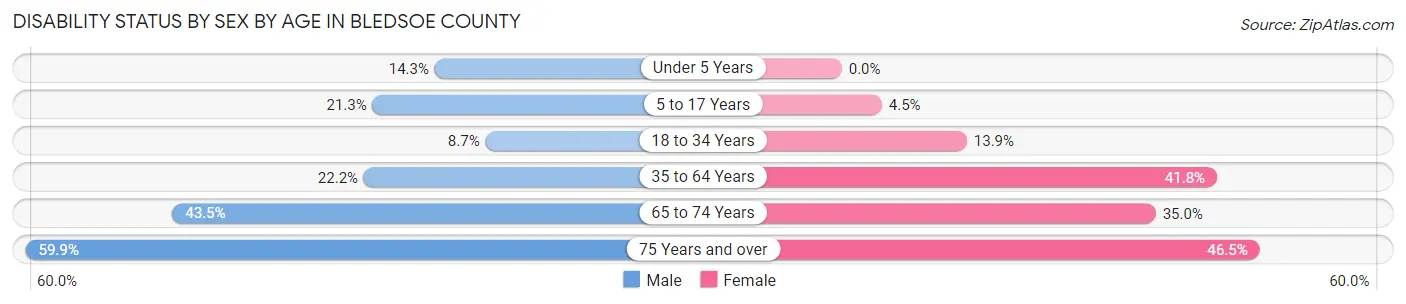
| Age Bracket | Male | Female |
| Under 5 Years | 56 (14.3%) | 0 (0.0%) |
| 5 to 17 Years | 217 (21.2%) | 33 (4.5%) |
| 18 to 34 Years | 141 (8.7%) | 150 (13.9%) |
| 35 to 64 Years | 717 (22.2%) | 1,073 (41.8%) |
| 65 to 74 Years | 354 (43.5%) | 273 (35.0%) |
| 75 Years and over | 342 (59.9%) | 268 (46.5%) |
Disability Class by Sex by Age in Bledsoe County
Disability Class: Hearing Difficulty
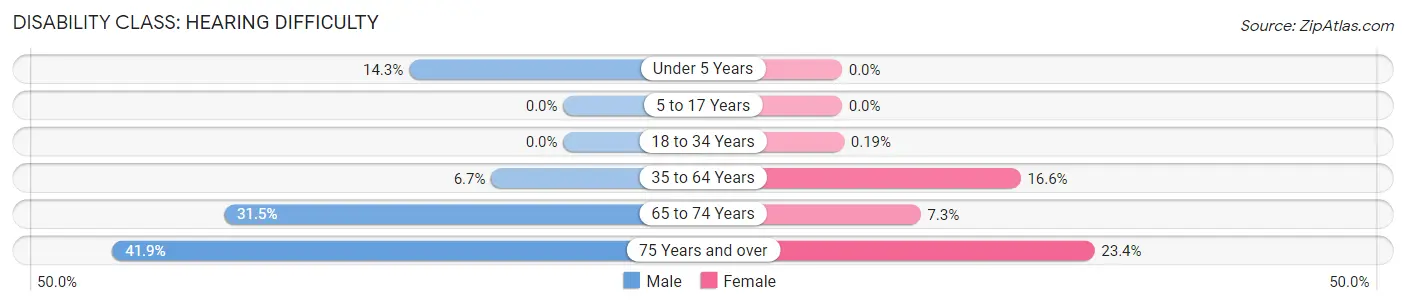
| Age Bracket | Male | Female |
| Under 5 Years | 56 (14.3%) | 0 (0.0%) |
| 5 to 17 Years | 0 (0.0%) | 0 (0.0%) |
| 18 to 34 Years | 0 (0.0%) | 2 (0.2%) |
| 35 to 64 Years | 216 (6.7%) | 426 (16.6%) |
| 65 to 74 Years | 256 (31.5%) | 57 (7.3%) |
| 75 Years and over | 239 (41.9%) | 135 (23.4%) |
Disability Class: Vision Difficulty
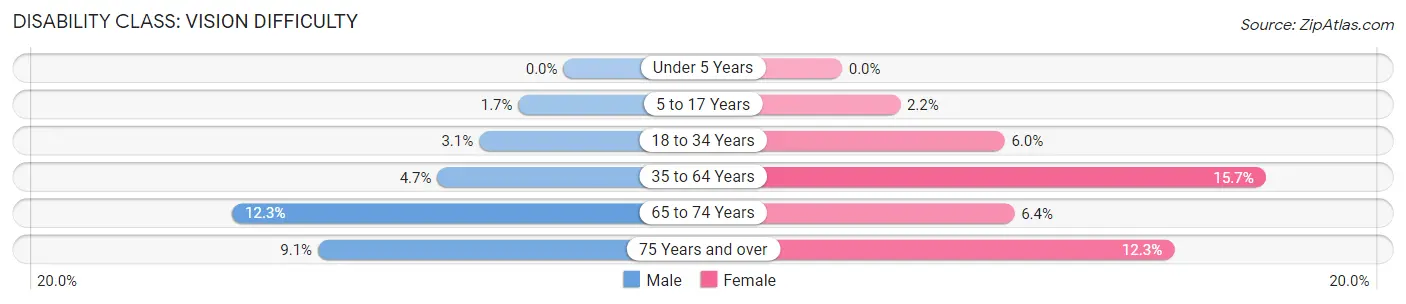
| Age Bracket | Male | Female |
| Under 5 Years | 0 (0.0%) | 0 (0.0%) |
| 5 to 17 Years | 17 (1.7%) | 16 (2.2%) |
| 18 to 34 Years | 51 (3.1%) | 65 (6.0%) |
| 35 to 64 Years | 151 (4.7%) | 404 (15.7%) |
| 65 to 74 Years | 100 (12.3%) | 50 (6.4%) |
| 75 Years and over | 52 (9.1%) | 71 (12.3%) |
Disability Class: Cognitive Difficulty
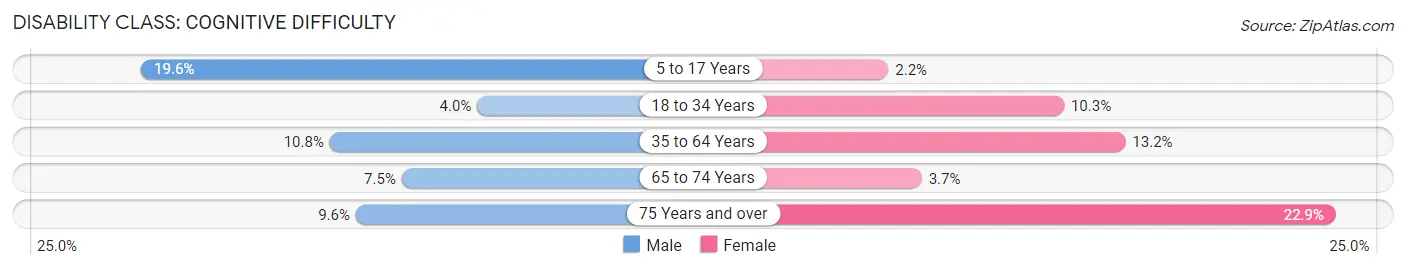
| Age Bracket | Male | Female |
| 5 to 17 Years | 200 (19.6%) | 16 (2.2%) |
| 18 to 34 Years | 65 (4.0%) | 111 (10.3%) |
| 35 to 64 Years | 350 (10.8%) | 338 (13.2%) |
| 65 to 74 Years | 61 (7.5%) | 29 (3.7%) |
| 75 Years and over | 55 (9.6%) | 132 (22.9%) |
Disability Class: Ambulatory Difficulty
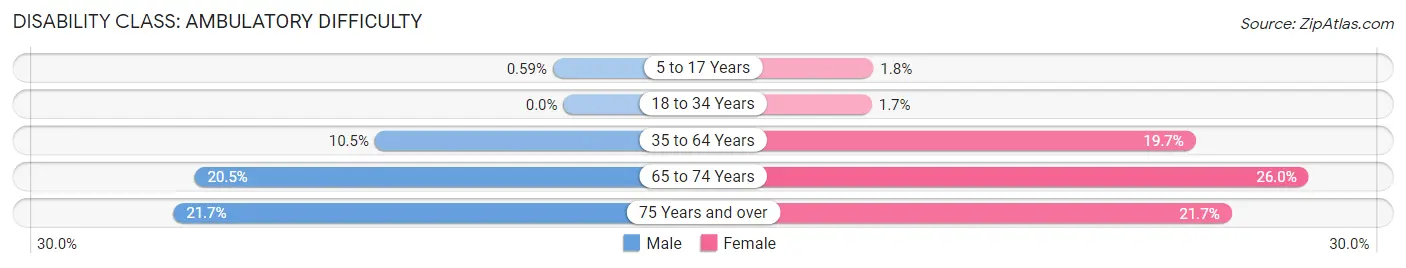
| Age Bracket | Male | Female |
| 5 to 17 Years | 6 (0.6%) | 13 (1.8%) |
| 18 to 34 Years | 0 (0.0%) | 18 (1.7%) |
| 35 to 64 Years | 339 (10.5%) | 506 (19.7%) |
| 65 to 74 Years | 167 (20.5%) | 203 (26.0%) |
| 75 Years and over | 124 (21.7%) | 125 (21.7%) |
Disability Class: Self-Care Difficulty
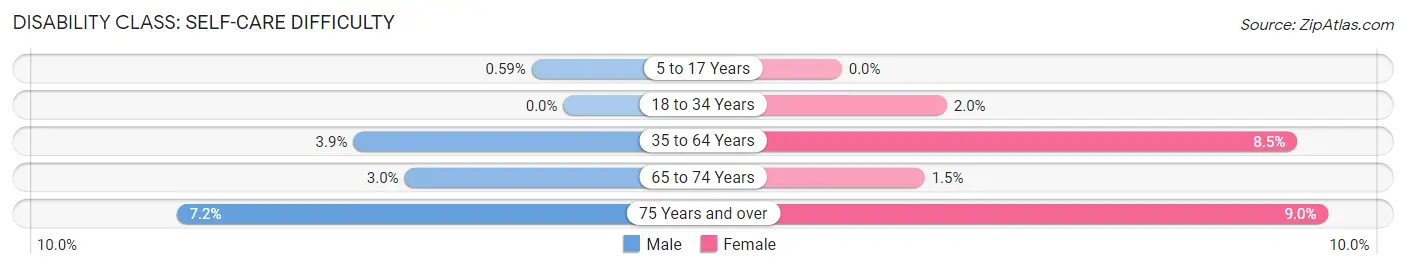
| Age Bracket | Male | Female |
| 5 to 17 Years | 6 (0.6%) | 0 (0.0%) |
| 18 to 34 Years | 0 (0.0%) | 21 (1.9%) |
| 35 to 64 Years | 126 (3.9%) | 217 (8.5%) |
| 65 to 74 Years | 24 (2.9%) | 12 (1.5%) |
| 75 Years and over | 41 (7.2%) | 52 (9.0%) |
Technology Access in Bledsoe County
Computing Device Access in Bledsoe County
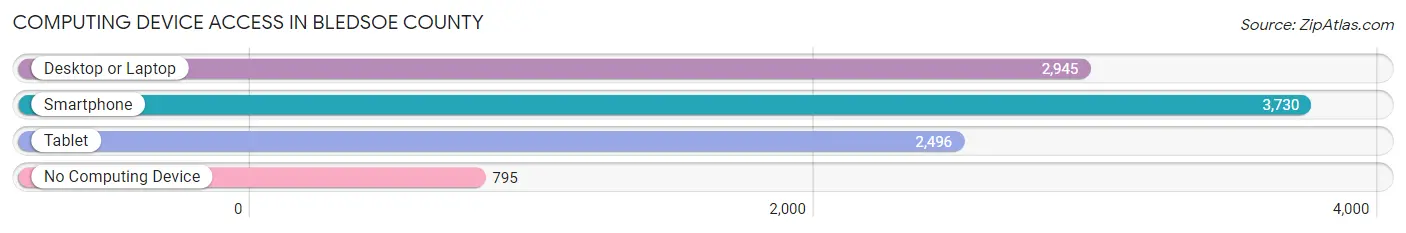
| Device Type | # Households | % Households |
| Desktop or Laptop | 2,945 | 60.7% |
| Smartphone | 3,730 | 76.9% |
| Tablet | 2,496 | 51.4% |
| No Computing Device | 795 | 16.4% |
| Total | 4,851 | 100.0% |
Internet Access in Bledsoe County
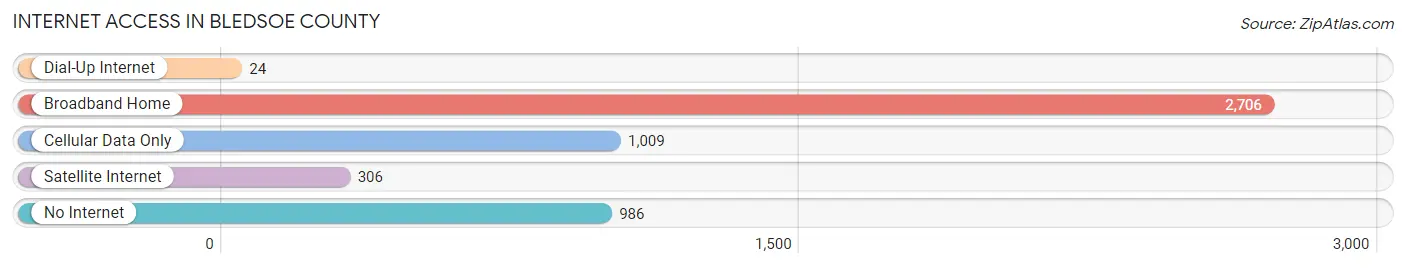
| Internet Type | # Households | % Households |
| Dial-Up Internet | 24 | 0.5% |
| Broadband Home | 2,706 | 55.8% |
| Cellular Data Only | 1,009 | 20.8% |
| Satellite Internet | 306 | 6.3% |
| No Internet | 986 | 20.3% |
| Total | 4,851 | 100.0% |
Bledsoe County Summary
Bledsoe County is located in the southeastern corner of Tennessee, and is part of the Chattanooga Metropolitan Statistical Area. It is bordered by Rhea County to the north, Sequatchie County to the east, Marion County to the south, and Hamilton County to the west. The county seat is Pikeville, and the largest city is Pikeville. The county was named for Anthony Bledsoe, a Revolutionary War veteran and early settler of the area.
History
The area that is now Bledsoe County was originally inhabited by the Cherokee and Creek Native American tribes. The first European settlers arrived in the area in the late 1700s, and the county was officially established in 1807. The county was named for Anthony Bledsoe, a Revolutionary War veteran and early settler of the area.
During the Civil War, Bledsoe County was a Confederate stronghold. The Battle of Bledsoe's Lick was fought in the county in 1863, and the Battle of Raccoon Mountain was fought nearby in 1864.
Geography
Bledsoe County is located in the southeastern corner of Tennessee, and is part of the Chattanooga Metropolitan Statistical Area. It is bordered by Rhea County to the north, Sequatchie County to the east, Marion County to the south, and Hamilton County to the west. The county has a total area of 437 square miles, of which 434 square miles is land and 3 square miles is water. The county is located in the Cumberland Plateau region of Tennessee, and is characterized by rolling hills and valleys. The highest point in the county is Raccoon Mountain, which has an elevation of 2,400 feet.
Economy
The economy of Bledsoe County is largely based on agriculture and manufacturing. The county is home to several large farms, and the main crops grown in the area are corn, soybeans, and hay. The county is also home to several manufacturing companies, including a paper mill, a furniture factory, and a plastics factory.
Demographics
As of the 2010 census, there were 12,876 people, 4,945 households, and 3,541 families living in Bledsoe County. The population density was 29.6 people per square mile. The racial makeup of the county was 95.3% White, 1.7% African American, 0.3% Native American, 0.2% Asian, 0.1% Pacific Islander, 1.2% from other races, and 1.2% from two or more races. Hispanic or Latino of any race were 2.7% of the population.
The median income for a household in the county was $32,917, and the median income for a family was $41,945. The per capita income for the county was $17,845. About 17.2% of families and 21.3% of the population were below the poverty line, including 28.2% of those under age 18 and 16.2% of those age 65 or over.
Common Questions
What is the Total Population of Bledsoe County?
Total Population of Bledsoe County is 14,816.
What is the Total Male Population of Bledsoe County?
Total Male Population of Bledsoe County is 8,744.
What is the Total Female Population of Bledsoe County?
Total Female Population of Bledsoe County is 6,072.
What is the Ratio of Males per 100 Females in Bledsoe County?
There are 144.01 Males per 100 Females in Bledsoe County.
What is the Ratio of Females per 100 Males in Bledsoe County?
There are 69.44 Females per 100 Males in Bledsoe County.
What is the Median Population Age in Bledsoe County?
Median Population Age in Bledsoe County is 44.6 Years.
What is the Average Family Size in Bledsoe County
Average Family Size in Bledsoe County is 3.1 People.
What is the Average Household Size in Bledsoe County
Average Household Size in Bledsoe County is 2.8 People.
What is Per Capita Income in Bledsoe County?
Per Capita income in Bledsoe County is $24,241.
What is the Median Family Income in Bledsoe County?
Median Family Income in Bledsoe County is $59,695.
What is the Median Household income in Bledsoe County?
Median Household Income in Bledsoe County is $51,783.
What is Income or Wage Gap in Bledsoe County?
Income or Wage Gap in Bledsoe County is 33.6%.
Women in Bledsoe County earn 66.4 cents for every dollar earned by a man.
What is Family Income Deficit in Bledsoe County?
Family Income Deficit in Bledsoe County is $11,245.
Families that are below poverty line in Bledsoe County earn $11,245 less on average than the poverty threshold level.
What is Inequality or Gini Index in Bledsoe County?
Inequality or Gini Index in Bledsoe County is 0.45.
How Large is the Labor Force in Bledsoe County?
There are 6,031 People in the Labor Forcein in Bledsoe County.
What is the Percentage of People in the Labor Force in Bledsoe County?
47.7% of People are in the Labor Force in Bledsoe County.
What is the Unemployment Rate in Bledsoe County?
Unemployment Rate in Bledsoe County is 6.7%.