Bedford County, TN
Bedford County Map
Bedford County Overview
50,533
TOTAL POPULATION
25,432
MALE POPULATION
25,101
FEMALE POPULATION
101.32
MALES / 100 FEMALES
98.70
FEMALES / 100 MALES
37.9
MEDIAN AGE
3.2
AVG FAMILY SIZE
2.7
AVG HOUSEHOLD SIZE
$28,520
PER CAPITA INCOME
$71,159
AVG FAMILY INCOME
$59,955
AVG HOUSEHOLD INCOME
24.2%
WAGE / INCOME GAP [ % ]
75.8¢/ $1
WAGE / INCOME GAP [ $ ]
$9,385
FAMILY INCOME DEFICIT
0.41
INEQUALITY / GINI INDEX
24,456
LABOR FORCE [ PEOPLE ]
62.1%
PERCENT IN LABOR FORCE
4.6%
UNEMPLOYMENT RATE
Race in Bedford County
The most populous races in Bedford County are White / Caucasian (41,327 | 81.8%), Hispanic or Latino (6,857 | 13.6%), and Two or more Races (3,669 | 7.3%).

| Race | # Population | % Population |
| Asian | 169 | 0.3% |
| Black / African American | 3,267 | 6.5% |
| Hawaiian / Pacific | 0 | 0.0% |
| Hispanic or Latino | 6,857 | 13.6% |
| Native / Alaskan | 513 | 1.0% |
| White / Caucasian | 41,327 | 81.8% |
| Two or more Races | 3,669 | 7.3% |
| Some other Race | 1,588 | 3.1% |
| Total | 50,533 | 100.0% |
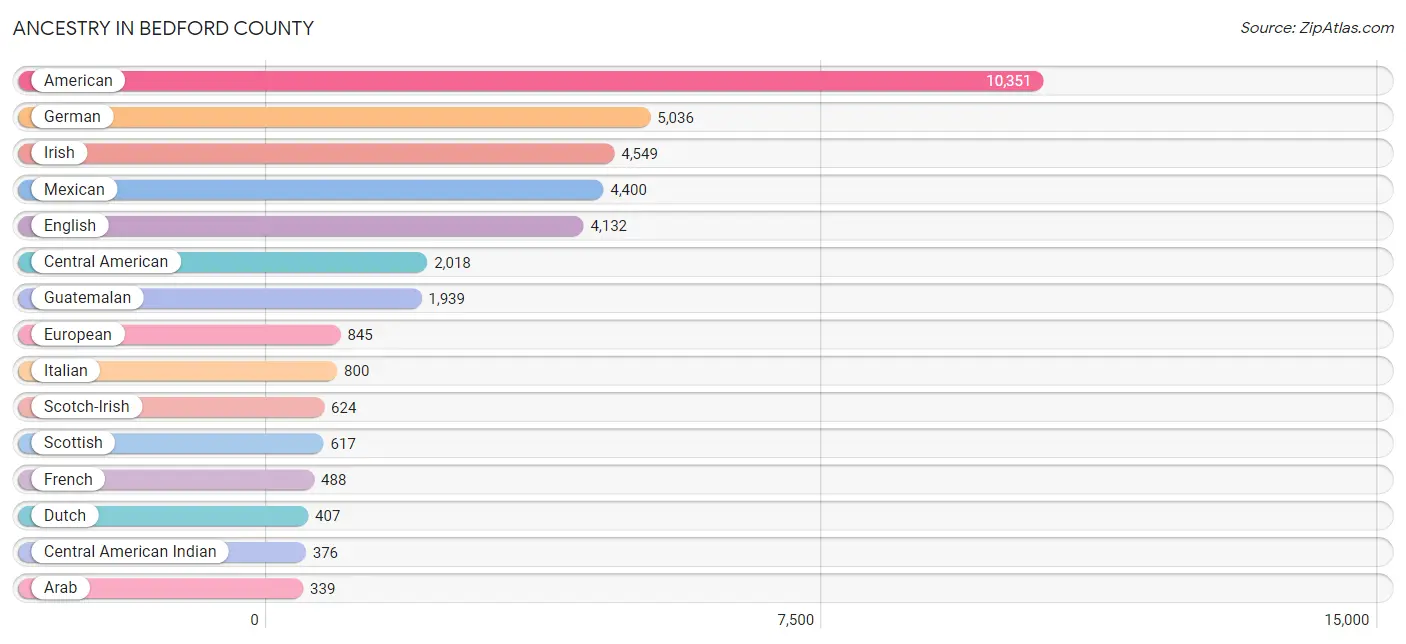
Ancestry in Bedford County
The most populous ancestries reported in Bedford County are American (10,351 | 20.5%), German (5,036 | 10.0%), Irish (4,549 | 9.0%), Mexican (4,400 | 8.7%), and English (4,132 | 8.2%), together accounting for 56.3% of all Bedford County residents.
| Ancestry | # Population | % Population |
| African | 160 | 0.3% |
| American | 10,351 | 20.5% |
| Apache | 12 | 0.0% |
| Arab | 339 | 0.7% |
| Australian | 11 | 0.0% |
| Austrian | 35 | 0.1% |
| Bhutanese | 29 | 0.1% |
| Blackfeet | 17 | 0.0% |
| British | 160 | 0.3% |
| Burmese | 168 | 0.3% |
| Canadian | 23 | 0.1% |
| Central American | 2,018 | 4.0% |
| Central American Indian | 376 | 0.7% |
| Cherokee | 125 | 0.3% |
| Chickasaw | 3 | 0.0% |
| Choctaw | 1 | 0.0% |
| Croatian | 12 | 0.0% |
| Cuban | 56 | 0.1% |
| Czech | 69 | 0.1% |
| Danish | 93 | 0.2% |
| Dominican | 28 | 0.1% |
| Dutch | 407 | 0.8% |
| Eastern European | 104 | 0.2% |
| Ecuadorian | 96 | 0.2% |
| English | 4,132 | 8.2% |
| Estonian | 7 | 0.0% |
| European | 845 | 1.7% |
| Finnish | 22 | 0.0% |
| French | 488 | 1.0% |
| French Canadian | 102 | 0.2% |
| German | 5,036 | 10.0% |
| Greek | 52 | 0.1% |
| Guatemalan | 1,939 | 3.8% |
| Hungarian | 54 | 0.1% |
| Indian (Asian) | 155 | 0.3% |
| Irish | 4,549 | 9.0% |
| Iroquois | 17 | 0.0% |
| Italian | 800 | 1.6% |
| Korean | 331 | 0.7% |
| Lebanese | 7 | 0.0% |
| Lithuanian | 36 | 0.1% |
| Mexican | 4,400 | 8.7% |
| Mexican American Indian | 4 | 0.0% |
| Native Hawaiian | 36 | 0.1% |
| Navajo | 76 | 0.2% |
| Nigerian | 13 | 0.0% |
| Northern European | 11 | 0.0% |
| Norwegian | 178 | 0.4% |
| Peruvian | 62 | 0.1% |
| Polish | 254 | 0.5% |
| Portuguese | 60 | 0.1% |
| Puerto Rican | 97 | 0.2% |
| Romanian | 18 | 0.0% |
| Russian | 32 | 0.1% |
| Salvadoran | 79 | 0.2% |
| Scandinavian | 86 | 0.2% |
| Scotch-Irish | 624 | 1.2% |
| Scottish | 617 | 1.2% |
| Sioux | 91 | 0.2% |
| Somali | 63 | 0.1% |
| South American | 158 | 0.3% |
| Spaniard | 11 | 0.0% |
| Spanish | 4 | 0.0% |
| Subsaharan African | 252 | 0.5% |
| Swedish | 134 | 0.3% |
| Swiss | 6 | 0.0% |
| Welsh | 108 | 0.2% | View All 67 Rows |
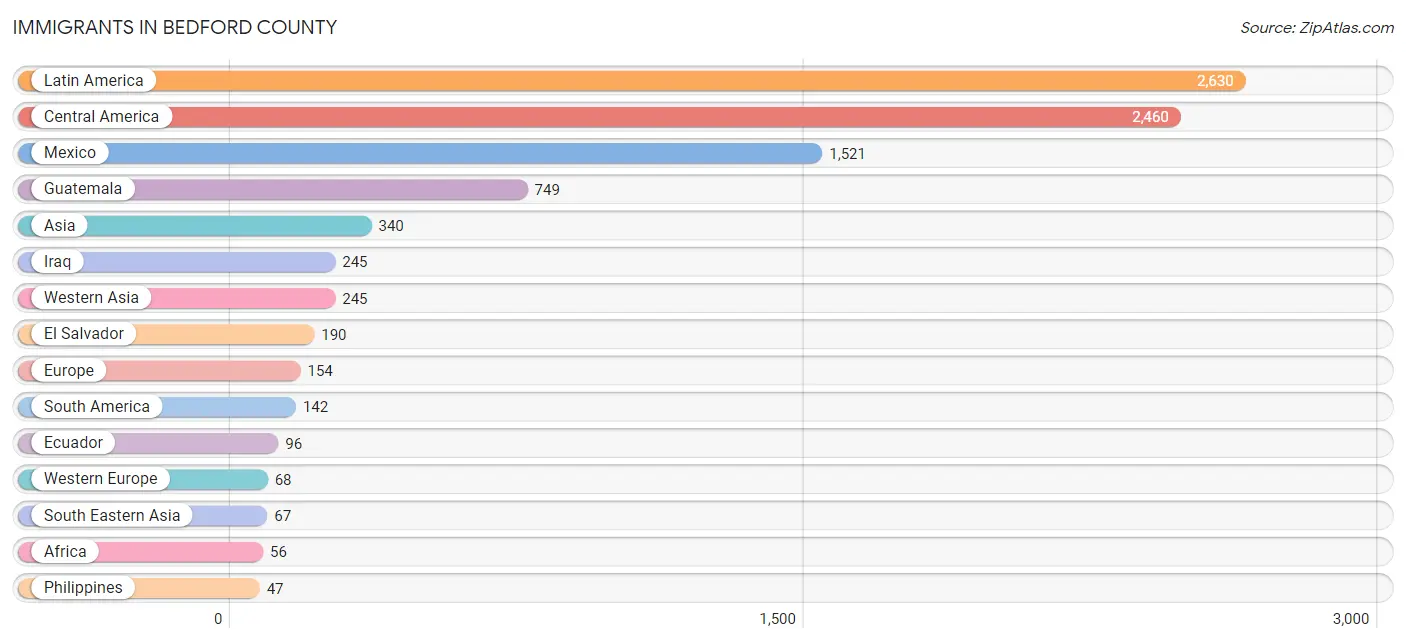
Immigrants in Bedford County
The most numerous immigrant groups reported in Bedford County came from Latin America (2,630 | 5.2%), Central America (2,460 | 4.9%), Mexico (1,521 | 3.0%), Guatemala (749 | 1.5%), and Asia (340 | 0.7%), together accounting for 15.2% of all Bedford County residents.
| Immigration Origin | # Population | % Population |
| Africa | 56 | 0.1% |
| Asia | 340 | 0.7% |
| Azores | 28 | 0.1% |
| Bolivia | 19 | 0.0% |
| Brazil | 27 | 0.1% |
| Cameroon | 7 | 0.0% |
| Canada | 31 | 0.1% |
| Caribbean | 28 | 0.1% |
| Central America | 2,460 | 4.9% |
| Dominican Republic | 28 | 0.1% |
| Eastern Africa | 42 | 0.1% |
| Eastern Asia | 28 | 0.1% |
| Eastern Europe | 13 | 0.0% |
| Ecuador | 96 | 0.2% |
| El Salvador | 190 | 0.4% |
| England | 10 | 0.0% |
| Europe | 154 | 0.3% |
| France | 22 | 0.0% |
| Germany | 46 | 0.1% |
| Guatemala | 749 | 1.5% |
| Iraq | 245 | 0.5% |
| Italy | 11 | 0.0% |
| Korea | 28 | 0.1% |
| Latin America | 2,630 | 5.2% |
| Malaysia | 20 | 0.0% |
| Mexico | 1,521 | 3.0% |
| Middle Africa | 7 | 0.0% |
| Northern Europe | 34 | 0.1% |
| Philippines | 47 | 0.1% |
| Portugal | 28 | 0.1% |
| Russia | 3 | 0.0% |
| Somalia | 42 | 0.1% |
| South Africa | 7 | 0.0% |
| South America | 142 | 0.3% |
| South Eastern Asia | 67 | 0.1% |
| Southern Europe | 39 | 0.1% |
| Sweden | 6 | 0.0% |
| Ukraine | 10 | 0.0% |
| Western Asia | 245 | 0.5% |
| Western Europe | 68 | 0.1% | View All 40 Rows |
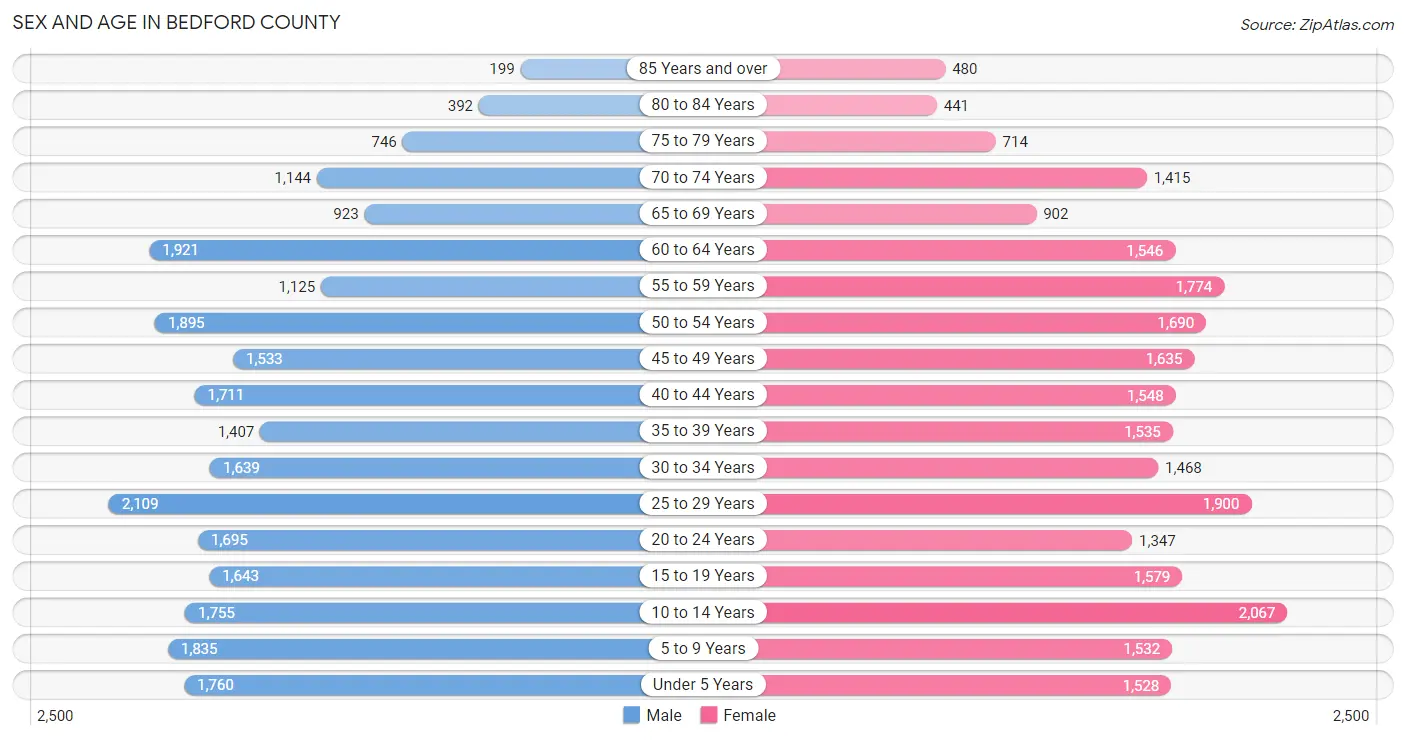
Sex and Age in Bedford County
Sex and Age in Bedford County
The most populous age groups in Bedford County are 25 to 29 Years (2,109 | 8.3%) for men and 10 to 14 Years (2,067 | 8.2%) for women.
| Age Bracket | Male | Female |
| Under 5 Years | 1,760 (6.9%) | 1,528 (6.1%) |
| 5 to 9 Years | 1,835 (7.2%) | 1,532 (6.1%) |
| 10 to 14 Years | 1,755 (6.9%) | 2,067 (8.2%) |
| 15 to 19 Years | 1,643 (6.5%) | 1,579 (6.3%) |
| 20 to 24 Years | 1,695 (6.7%) | 1,347 (5.4%) |
| 25 to 29 Years | 2,109 (8.3%) | 1,900 (7.6%) |
| 30 to 34 Years | 1,639 (6.4%) | 1,468 (5.9%) |
| 35 to 39 Years | 1,407 (5.5%) | 1,535 (6.1%) |
| 40 to 44 Years | 1,711 (6.7%) | 1,548 (6.2%) |
| 45 to 49 Years | 1,533 (6.0%) | 1,635 (6.5%) |
| 50 to 54 Years | 1,895 (7.4%) | 1,690 (6.7%) |
| 55 to 59 Years | 1,125 (4.4%) | 1,774 (7.1%) |
| 60 to 64 Years | 1,921 (7.5%) | 1,546 (6.2%) |
| 65 to 69 Years | 923 (3.6%) | 902 (3.6%) |
| 70 to 74 Years | 1,144 (4.5%) | 1,415 (5.6%) |
| 75 to 79 Years | 746 (2.9%) | 714 (2.8%) |
| 80 to 84 Years | 392 (1.5%) | 441 (1.8%) |
| 85 Years and over | 199 (0.8%) | 480 (1.9%) |
| Total | 25,432 (100.0%) | 25,101 (100.0%) |
Families and Households in Bedford County
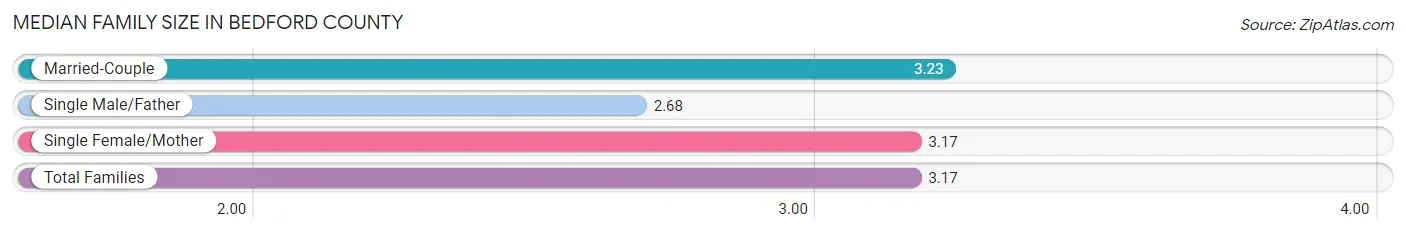
Median Family Size in Bedford County
The median family size in Bedford County is 3.17 persons per family, with married-couple families (9,099 | 69.1%) accounting for the largest median family size of 3.23 persons per family. On the other hand, single male/father families (1,238 | 9.4%) represent the smallest median family size with 2.68 persons per family.
| Family Type | # Families | Family Size |
| Married-Couple | 9,099 (69.1%) | 3.23 |
| Single Male/Father | 1,238 (9.4%) | 2.68 |
| Single Female/Mother | 2,824 (21.5%) | 3.17 |
| Total Families | 13,161 (100.0%) | 3.17 |
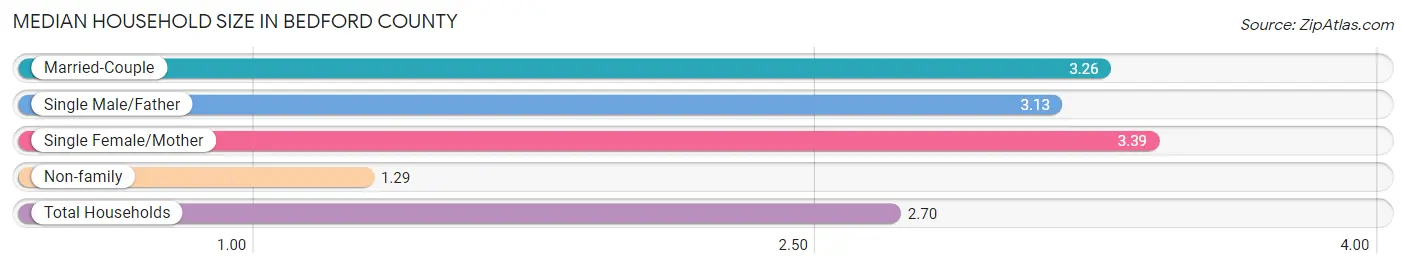
Median Household Size in Bedford County
The median household size in Bedford County is 2.70 persons per household, with single female/mother households (2,824 | 15.3%) accounting for the largest median household size of 3.39 persons per household. non-family households (5,308 | 28.7%) represent the smallest median household size with 1.29 persons per household.
| Household Type | # Households | Household Size |
| Married-Couple | 9,099 (49.3%) | 3.26 |
| Single Male/Father | 1,238 (6.7%) | 3.13 |
| Single Female/Mother | 2,824 (15.3%) | 3.39 |
| Non-family | 5,308 (28.7%) | 1.29 |
| Total Households | 18,469 (100.0%) | 2.70 |
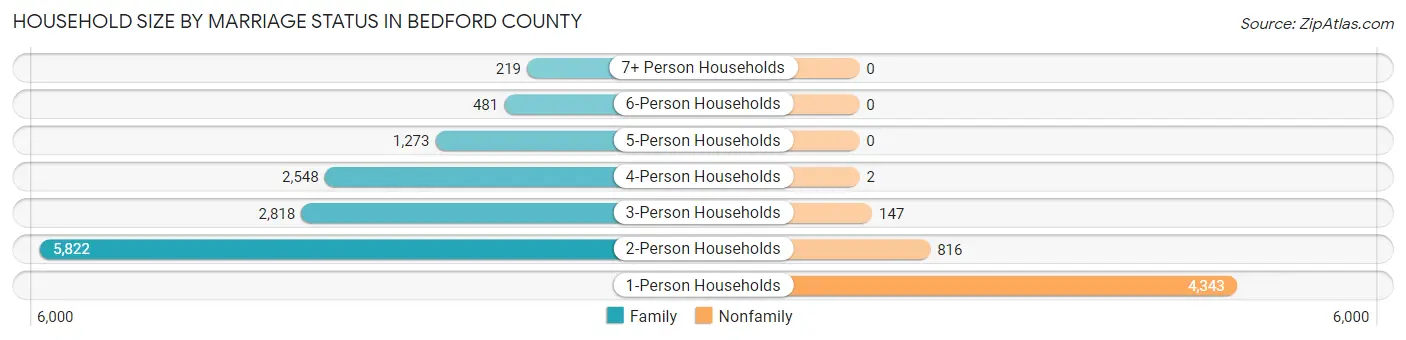
Household Size by Marriage Status in Bedford County
Out of a total of 18,469 households in Bedford County, 13,161 (71.3%) are family households, while 5,308 (28.7%) are nonfamily households. The most numerous type of family households are 2-person households, comprising 5,822, and the most common type of nonfamily households are 1-person households, comprising 4,343.
| Household Size | Family Households | Nonfamily Households |
| 1-Person Households | - | 4,343 (23.5%) |
| 2-Person Households | 5,822 (31.5%) | 816 (4.4%) |
| 3-Person Households | 2,818 (15.3%) | 147 (0.8%) |
| 4-Person Households | 2,548 (13.8%) | 2 (0.0%) |
| 5-Person Households | 1,273 (6.9%) | 0 (0.0%) |
| 6-Person Households | 481 (2.6%) | 0 (0.0%) |
| 7+ Person Households | 219 (1.2%) | 0 (0.0%) |
| Total | 13,161 (71.3%) | 5,308 (28.7%) |
Female Fertility in Bedford County
Fertility by Age in Bedford County
Average fertility rate in Bedford County is 70.0 births per 1,000 women. Women in the age bracket of 20 to 34 years have the highest fertility rate with 138.0 births per 1,000 women. Women in the age bracket of 20 to 34 years acount for 81.8% of all women with births.

| Age Bracket | Women with Births | Births / 1,000 Women |
| 15 to 19 years | 0 (0.0%) | 0.0 |
| 20 to 34 years | 649 (81.8%) | 138.0 |
| 35 to 50 years | 144 (18.2%) | 29.0 |
| Total | 793 (100.0%) | 70.0 |
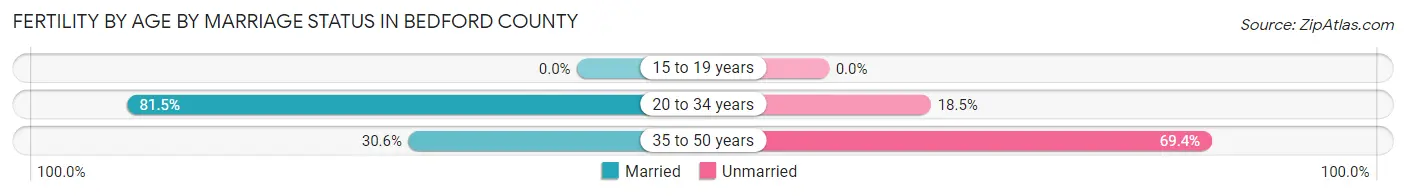
Fertility by Age by Marriage Status in Bedford County
72.3% of women with births (793) in Bedford County are married. The highest percentage of unmarried women with births falls into 35 to 50 years age bracket with 69.4% of them unmarried at the time of birth, while the lowest percentage of unmarried women with births belong to 20 to 34 years age bracket with 18.5% of them unmarried.
| Age Bracket | Married | Unmarried |
| 15 to 19 years | 0 (0.0%) | 0 (0.0%) |
| 20 to 34 years | 529 (81.5%) | 120 (18.5%) |
| 35 to 50 years | 44 (30.6%) | 100 (69.4%) |
| Total | 573 (72.3%) | 220 (27.7%) |
Fertility by Education in Bedford County
Average fertility rate in Bedford County is 70.0 births per 1,000 women. Women with the education attainment of college or associate's degree have the highest fertility rate of 99.0 births per 1,000 women, while women with the education attainment of graduate degree have the lowest fertility at 9.0 births per 1,000 women. Women with the education attainment of college or associate's degree represent 41.7% of all women with births.
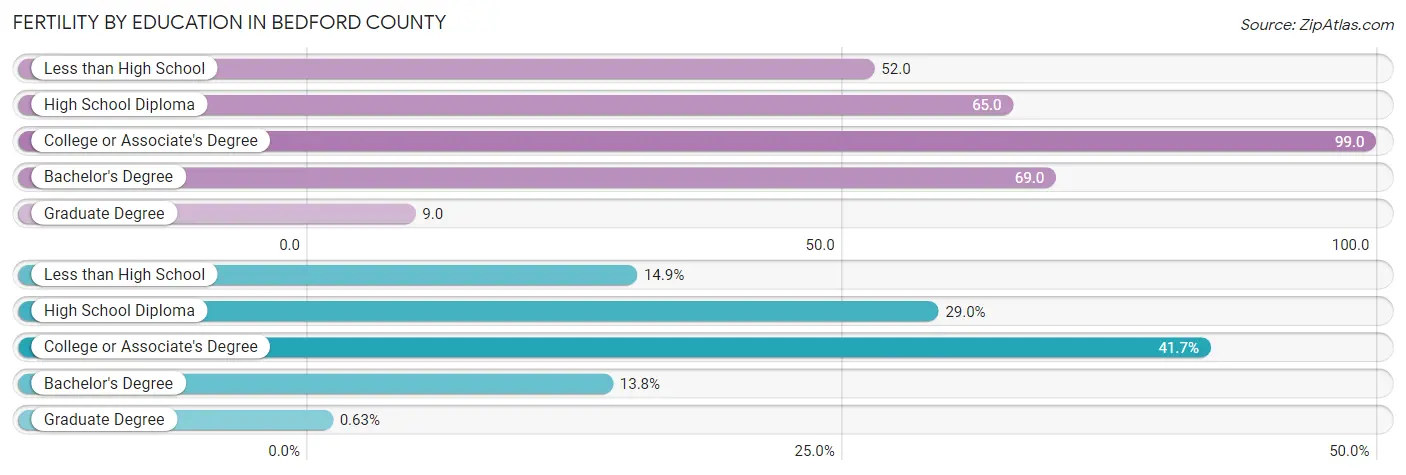
| Educational Attainment | Women with Births | Births / 1,000 Women |
| Less than High School | 118 (14.9%) | 52.0 |
| High School Diploma | 230 (29.0%) | 65.0 |
| College or Associate's Degree | 331 (41.7%) | 99.0 |
| Bachelor's Degree | 109 (13.8%) | 69.0 |
| Graduate Degree | 5 (0.6%) | 9.0 |
| Total | 793 (100.0%) | 70.0 |
Fertility by Education by Marriage Status in Bedford County
27.7% of women with births in Bedford County are unmarried. Women with the educational attainment of bachelor's degree are most likely to be married with 100.0% of them married at childbirth, while women with the educational attainment of high school diploma are least likely to be married with 37.4% of them unmarried at childbirth.
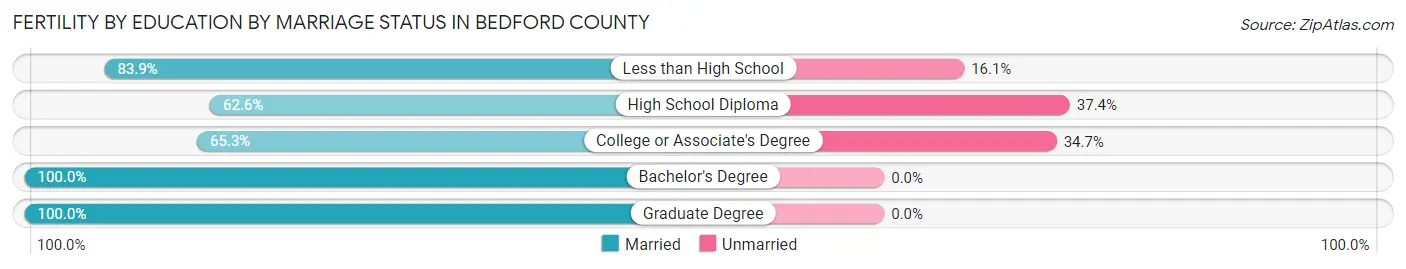
| Educational Attainment | Married | Unmarried |
| Less than High School | 99 (83.9%) | 19 (16.1%) |
| High School Diploma | 144 (62.6%) | 86 (37.4%) |
| College or Associate's Degree | 216 (65.3%) | 115 (34.7%) |
| Bachelor's Degree | 109 (100.0%) | 0 (0.0%) |
| Graduate Degree | 5 (100.0%) | 0 (0.0%) |
| Total | 573 (72.3%) | 220 (27.7%) |
Income in Bedford County
Income Overview in Bedford County
Per Capita Income in Bedford County is $28,520, while median incomes of families and households are $71,159 and $59,955 respectively.
| Characteristic | Number | Measure |
| Per Capita Income | 50,533 | $28,520 |
| Median Family Income | 13,161 | $71,159 |
| Mean Family Income | 13,161 | $84,134 |
| Median Household Income | 18,469 | $59,955 |
| Mean Household Income | 18,469 | $76,520 |
| Income Deficit | 13,161 | $9,385 |
| Wage / Income Gap (%) | 50,533 | 24.20% |
| Wage / Income Gap ($) | 50,533 | 75.80¢ per $1 |
| Gini / Inequality Index | 50,533 | 0.41 |
Earnings by Sex in Bedford County
Average Earnings in Bedford County are $33,930, $38,507 for men and $29,188 for women, a difference of 24.2%.
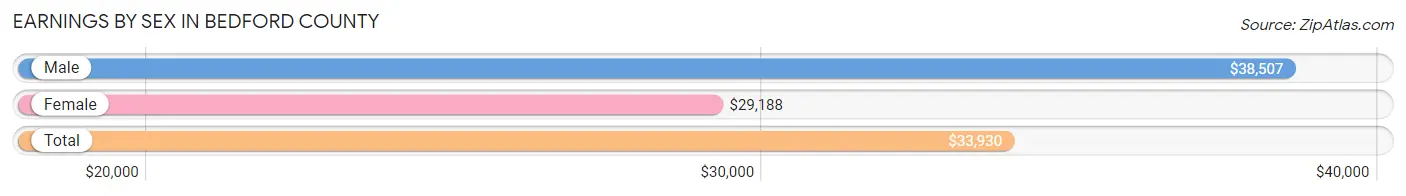
| Sex | Number | Average Earnings |
| Male | 14,131 (54.5%) | $38,507 |
| Female | 11,795 (45.5%) | $29,188 |
| Total | 25,926 (100.0%) | $33,930 |
Earnings by Sex by Income Bracket in Bedford County
The most common earnings brackets in Bedford County are $55,000 to $64,999 for men (1,497 | 10.6%) and $35,000 to $39,999 for women (1,049 | 8.9%).
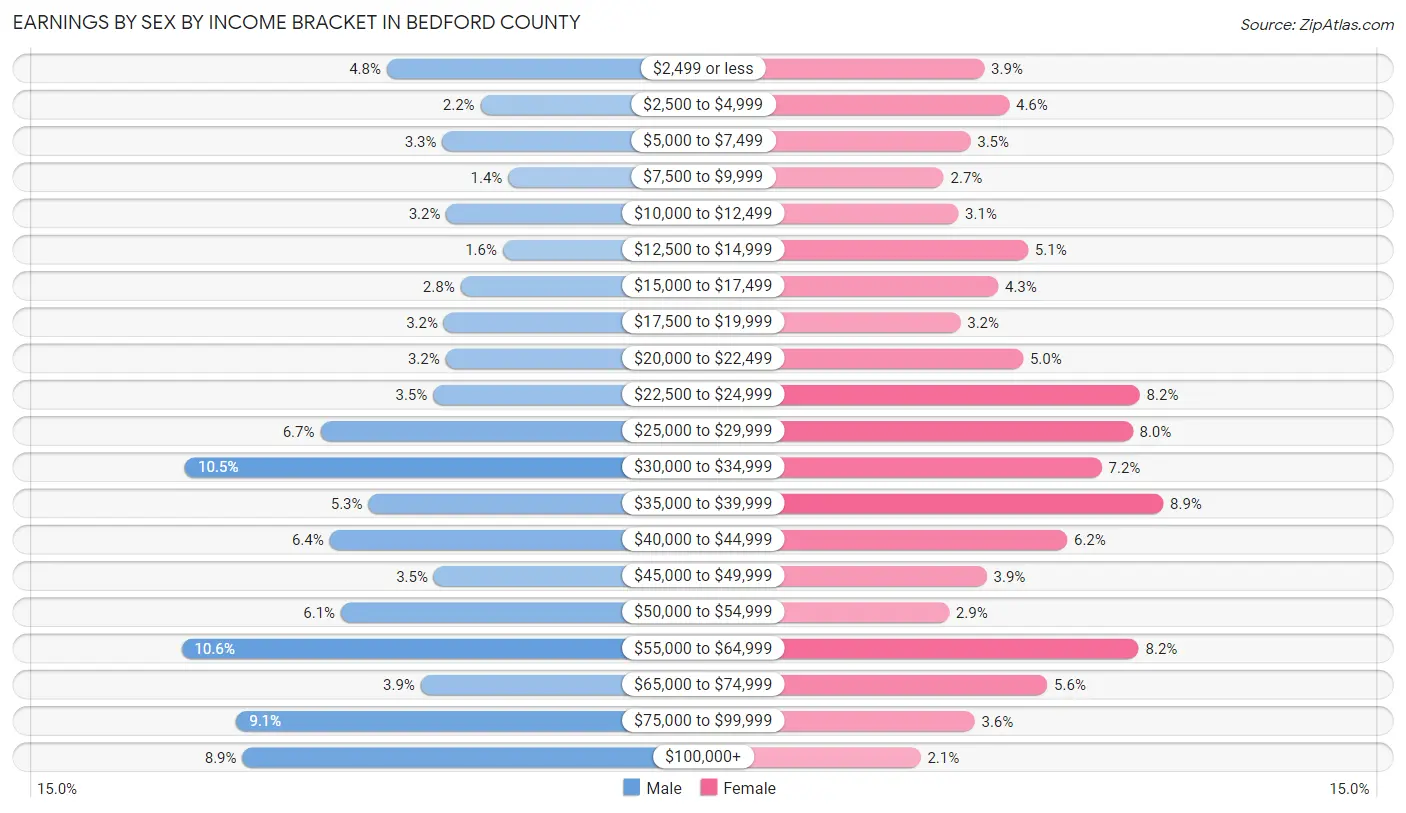
| Income | Male | Female |
| $2,499 or less | 681 (4.8%) | 455 (3.9%) |
| $2,500 to $4,999 | 310 (2.2%) | 538 (4.6%) |
| $5,000 to $7,499 | 460 (3.3%) | 409 (3.5%) |
| $7,500 to $9,999 | 199 (1.4%) | 321 (2.7%) |
| $10,000 to $12,499 | 445 (3.2%) | 369 (3.1%) |
| $12,500 to $14,999 | 221 (1.6%) | 600 (5.1%) |
| $15,000 to $17,499 | 389 (2.8%) | 501 (4.3%) |
| $17,500 to $19,999 | 455 (3.2%) | 376 (3.2%) |
| $20,000 to $22,499 | 448 (3.2%) | 584 (5.0%) |
| $22,500 to $24,999 | 497 (3.5%) | 971 (8.2%) |
| $25,000 to $29,999 | 946 (6.7%) | 947 (8.0%) |
| $30,000 to $34,999 | 1,482 (10.5%) | 844 (7.2%) |
| $35,000 to $39,999 | 754 (5.3%) | 1,049 (8.9%) |
| $40,000 to $44,999 | 909 (6.4%) | 730 (6.2%) |
| $45,000 to $49,999 | 494 (3.5%) | 463 (3.9%) |
| $50,000 to $54,999 | 863 (6.1%) | 339 (2.9%) |
| $55,000 to $64,999 | 1,497 (10.6%) | 967 (8.2%) |
| $65,000 to $74,999 | 547 (3.9%) | 664 (5.6%) |
| $75,000 to $99,999 | 1,279 (9.0%) | 424 (3.6%) |
| $100,000+ | 1,255 (8.9%) | 244 (2.1%) |
| Total | 14,131 (100.0%) | 11,795 (100.0%) |
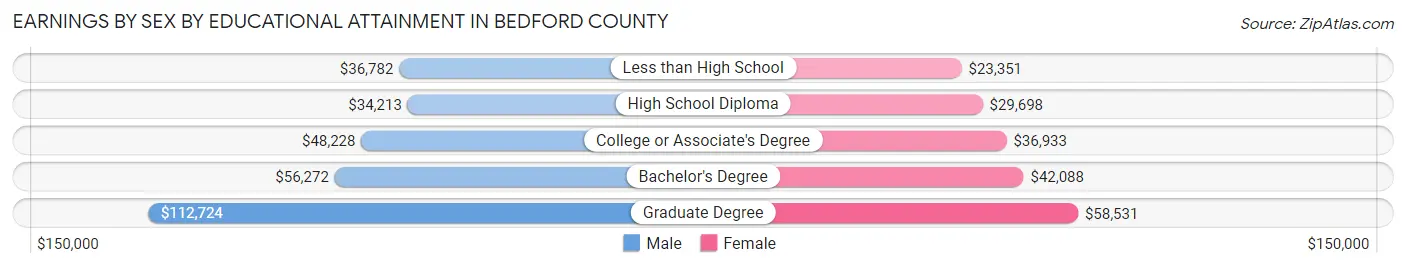
Earnings by Sex by Educational Attainment in Bedford County
Average earnings in Bedford County are $42,672 for men and $33,299 for women, a difference of 22.0%. Men with an educational attainment of graduate degree enjoy the highest average annual earnings of $112,724, while those with high school diploma education earn the least with $34,213. Women with an educational attainment of graduate degree earn the most with the average annual earnings of $58,531, while those with less than high school education have the smallest earnings of $23,351.
| Educational Attainment | Male Income | Female Income |
| Less than High School | $36,782 | $23,351 |
| High School Diploma | $34,213 | $29,698 |
| College or Associate's Degree | $48,228 | $36,933 |
| Bachelor's Degree | $56,272 | $42,088 |
| Graduate Degree | $112,724 | $58,531 |
| Total | $42,672 | $33,299 |
Family Income in Bedford County
Family Income Brackets in Bedford County
According to the Bedford County family income data, there are 2,566 families falling into the $75,000 to $99,999 income range, which is the most common income bracket and makes up 19.5% of all families. Conversely, the less than $10,000 income bracket is the least frequent group with only 329 families (2.5%) belonging to this category.

| Income Bracket | # Families | % Families |
| Less than $10,000 | 329 | 2.5% |
| $10,000 to $14,999 | 447 | 3.4% |
| $15,000 to $24,999 | 948 | 7.2% |
| $25,000 to $34,999 | 855 | 6.5% |
| $35,000 to $49,999 | 1,803 | 13.7% |
| $50,000 to $74,999 | 2,553 | 19.4% |
| $75,000 to $99,999 | 2,566 | 19.5% |
| $100,000 to $149,999 | 2,251 | 17.1% |
| $150,000 to $199,999 | 816 | 6.2% |
| $200,000+ | 619 | 4.7% |
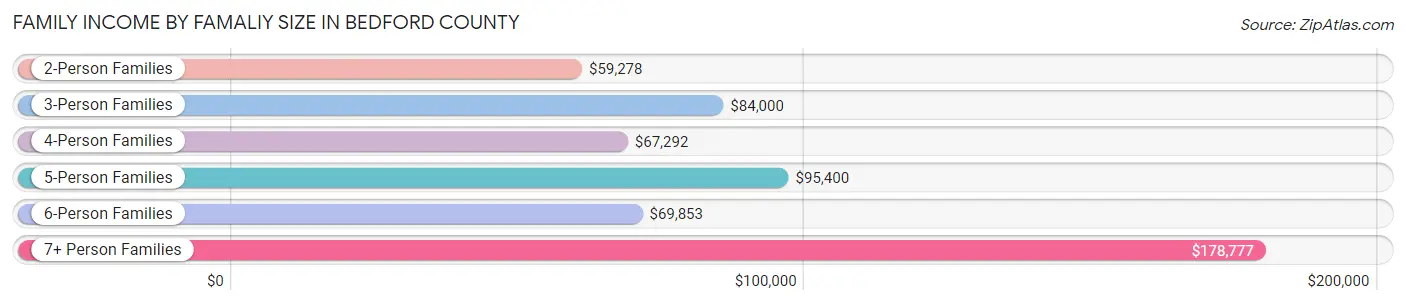
Family Income by Famaliy Size in Bedford County
7+ person families (174 | 1.3%) account for the highest median family income in Bedford County with $178,777 per family, while 2-person families (6,246 | 47.5%) have the highest median income of $29,639 per family member.
| Income Bracket | # Families | Median Income |
| 2-Person Families | 6,246 (47.5%) | $59,278 |
| 3-Person Families | 2,760 (21.0%) | $84,000 |
| 4-Person Families | 2,494 (19.0%) | $67,292 |
| 5-Person Families | 1,117 (8.5%) | $95,400 |
| 6-Person Families | 370 (2.8%) | $69,853 |
| 7+ Person Families | 174 (1.3%) | $178,777 |
| Total | 13,161 (100.0%) | $71,159 |
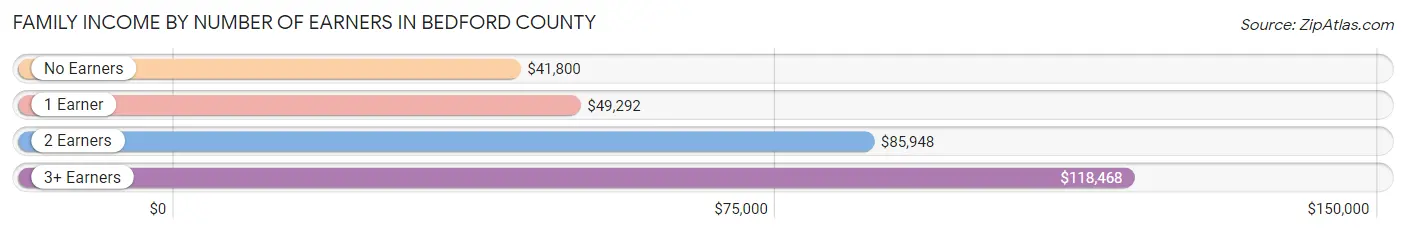
Family Income by Number of Earners in Bedford County
The median family income in Bedford County is $71,159, with families comprising 3+ earners (1,781) having the highest median family income of $118,468, while families with no earners (2,270) have the lowest median family income of $41,800, accounting for 13.5% and 17.2% of families, respectively.
| Number of Earners | # Families | Median Income |
| No Earners | 2,270 (17.2%) | $41,800 |
| 1 Earner | 4,323 (32.9%) | $49,292 |
| 2 Earners | 4,787 (36.4%) | $85,948 |
| 3+ Earners | 1,781 (13.5%) | $118,468 |
| Total | 13,161 (100.0%) | $71,159 |
Household Income in Bedford County
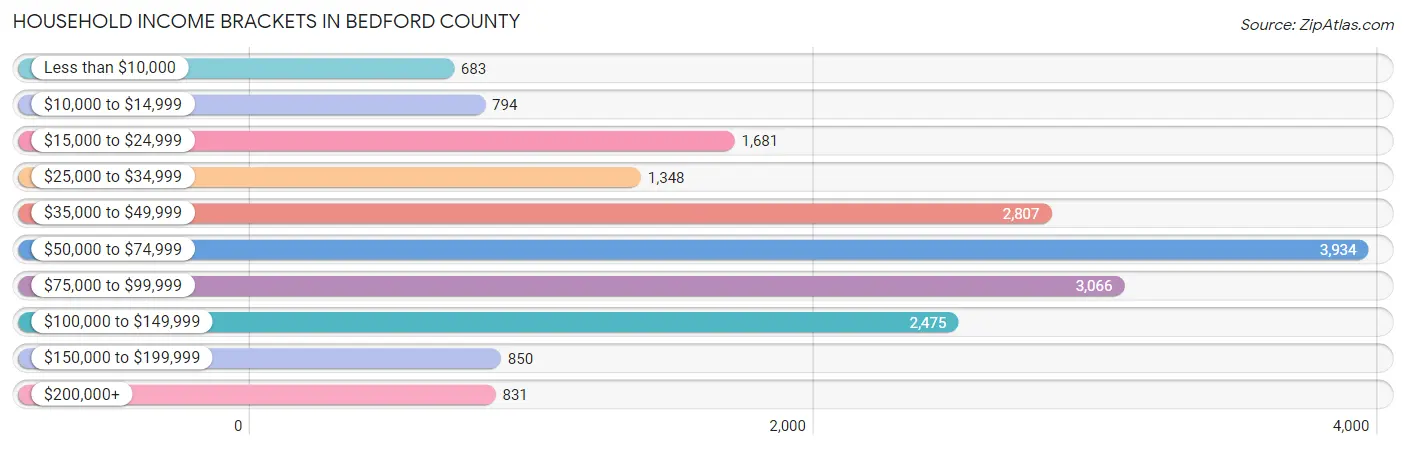
Household Income Brackets in Bedford County
With 3,934 households falling in the category, the $50,000 to $74,999 income range is the most frequent in Bedford County, accounting for 21.3% of all households. In contrast, only 683 households (3.7%) fall into the less than $10,000 income bracket, making it the least populous group.
| Income Bracket | # Households | % Households |
| Less than $10,000 | 683 | 3.7% |
| $10,000 to $14,999 | 794 | 4.3% |
| $15,000 to $24,999 | 1,681 | 9.1% |
| $25,000 to $34,999 | 1,348 | 7.3% |
| $35,000 to $49,999 | 2,807 | 15.2% |
| $50,000 to $74,999 | 3,934 | 21.3% |
| $75,000 to $99,999 | 3,066 | 16.6% |
| $100,000 to $149,999 | 2,475 | 13.4% |
| $150,000 to $199,999 | 850 | 4.6% |
| $200,000+ | 831 | 4.5% |
Household Income by Householder Age in Bedford County
The median household income in Bedford County is $59,955, with the highest median household income of $69,279 found in the 25 to 44 years age bracket for the primary householder. A total of 6,201 households (33.6%) fall into this category. Meanwhile, the 15 to 24 years age bracket for the primary householder has the lowest median household income of $48,920, with 534 households (2.9%) in this group.
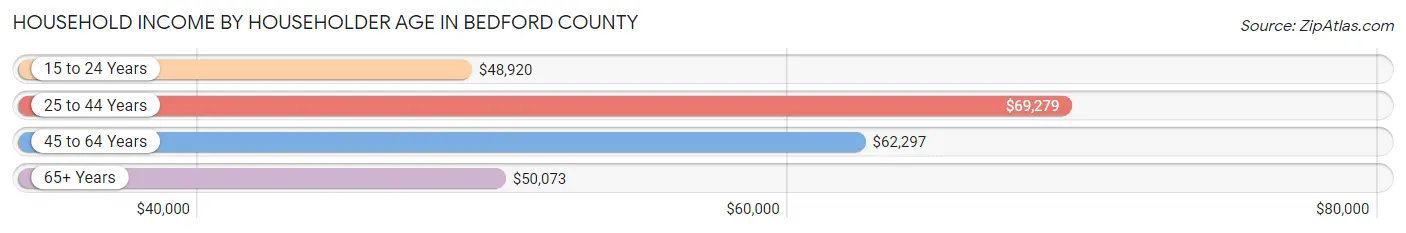
| Income Bracket | # Households | Median Income |
| 15 to 24 Years | 534 (2.9%) | $48,920 |
| 25 to 44 Years | 6,201 (33.6%) | $69,279 |
| 45 to 64 Years | 6,970 (37.7%) | $62,297 |
| 65+ Years | 4,764 (25.8%) | $50,073 |
| Total | 18,469 (100.0%) | $59,955 |
Poverty in Bedford County
Income Below Poverty by Sex and Age in Bedford County
With 10.7% poverty level for males and 14.1% for females among the residents of Bedford County, 5 year old males and 5 year old females are the most vulnerable to poverty, with 109 males (28.3%) and 146 females (39.0%) in their respective age groups living below the poverty level.
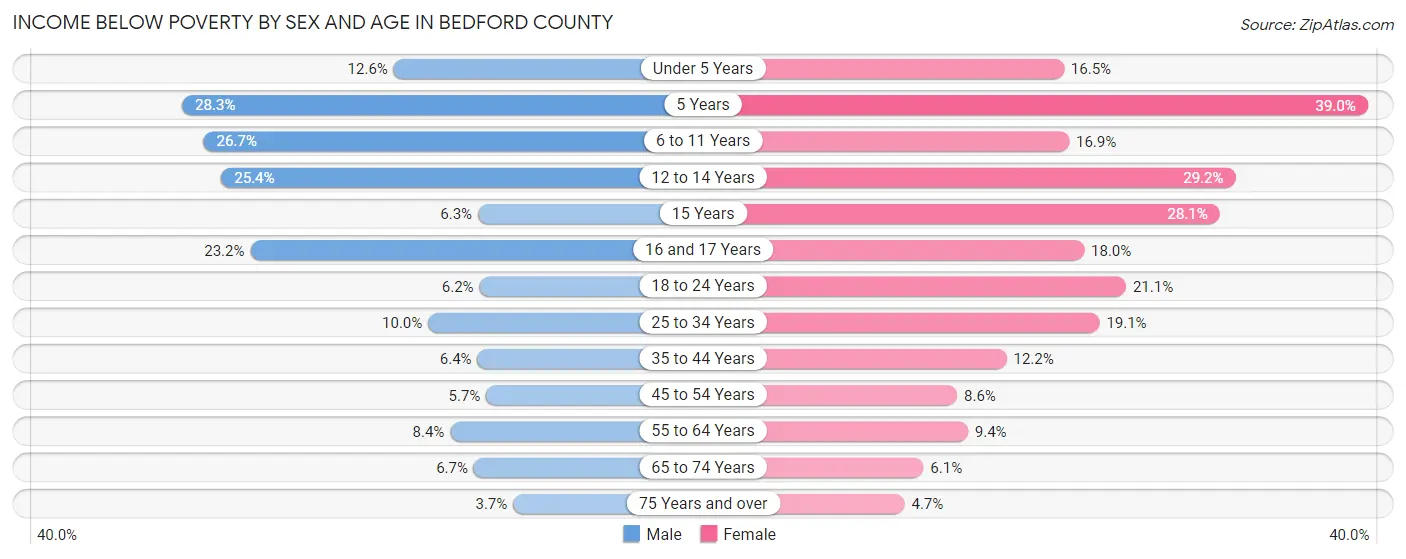
| Age Bracket | Male | Female |
| Under 5 Years | 219 (12.6%) | 252 (16.5%) |
| 5 Years | 109 (28.3%) | 146 (39.0%) |
| 6 to 11 Years | 555 (26.7%) | 325 (16.9%) |
| 12 to 14 Years | 258 (25.4%) | 354 (29.2%) |
| 15 Years | 22 (6.3%) | 92 (28.1%) |
| 16 and 17 Years | 172 (23.2%) | 138 (18.0%) |
| 18 to 24 Years | 134 (6.2%) | 377 (21.1%) |
| 25 to 34 Years | 368 (10.0%) | 640 (19.1%) |
| 35 to 44 Years | 195 (6.4%) | 377 (12.2%) |
| 45 to 54 Years | 196 (5.7%) | 284 (8.6%) |
| 55 to 64 Years | 255 (8.4%) | 310 (9.4%) |
| 65 to 74 Years | 136 (6.7%) | 140 (6.1%) |
| 75 Years and over | 49 (3.7%) | 72 (4.7%) |
| Total | 2,668 (10.7%) | 3,507 (14.1%) |
Income Above Poverty by Sex and Age in Bedford County
According to the poverty statistics in Bedford County, males aged 75 years and over and females aged 75 years and over are the age groups that are most secure financially, with 96.3% of males and 95.3% of females in these age groups living above the poverty line.

| Age Bracket | Male | Female |
| Under 5 Years | 1,519 (87.4%) | 1,276 (83.5%) |
| 5 Years | 276 (71.7%) | 228 (61.0%) |
| 6 to 11 Years | 1,523 (73.3%) | 1,602 (83.1%) |
| 12 to 14 Years | 758 (74.6%) | 858 (70.8%) |
| 15 Years | 325 (93.7%) | 236 (72.0%) |
| 16 and 17 Years | 568 (76.8%) | 629 (82.0%) |
| 18 to 24 Years | 2,016 (93.8%) | 1,410 (78.9%) |
| 25 to 34 Years | 3,299 (90.0%) | 2,705 (80.9%) |
| 35 to 44 Years | 2,863 (93.6%) | 2,706 (87.8%) |
| 45 to 54 Years | 3,225 (94.3%) | 3,033 (91.4%) |
| 55 to 64 Years | 2,780 (91.6%) | 3,003 (90.6%) |
| 65 to 74 Years | 1,910 (93.3%) | 2,170 (93.9%) |
| 75 Years and over | 1,265 (96.3%) | 1,474 (95.3%) |
| Total | 22,327 (89.3%) | 21,330 (85.9%) |
Income Below Poverty Among Married-Couple Families in Bedford County
The poverty statistics for married-couple families in Bedford County show that 1.9% or 169 of the total 9,099 families live below the poverty line. Families with 3 or 4 children have the highest poverty rate of 3.0%, comprising of 23 families. On the other hand, families with 5 or more children have the lowest poverty rate of 0.0%, which includes 0 families.
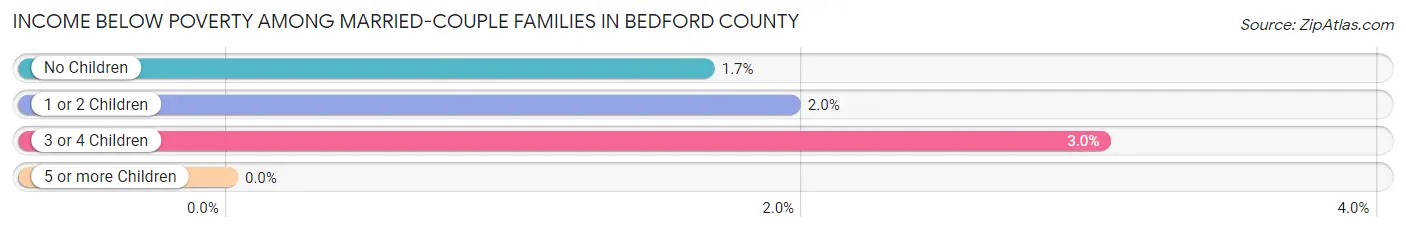
| Children | Above Poverty | Below Poverty |
| No Children | 5,613 (98.3%) | 95 (1.7%) |
| 1 or 2 Children | 2,552 (98.0%) | 51 (2.0%) |
| 3 or 4 Children | 733 (97.0%) | 23 (3.0%) |
| 5 or more Children | 32 (100.0%) | 0 (0.0%) |
| Total | 8,930 (98.1%) | 169 (1.9%) |
Income Below Poverty Among Single-Parent Households in Bedford County
According to the poverty data in Bedford County, 30.6% or 379 single-father households and 31.7% or 896 single-mother households are living below the poverty line. Among single-father households, those with 1 or 2 children have the highest poverty rate, with 308 households (44.8%) experiencing poverty. Likewise, among single-mother households, those with 3 or 4 children have the highest poverty rate, with 474 households (65.7%) falling below the poverty line.
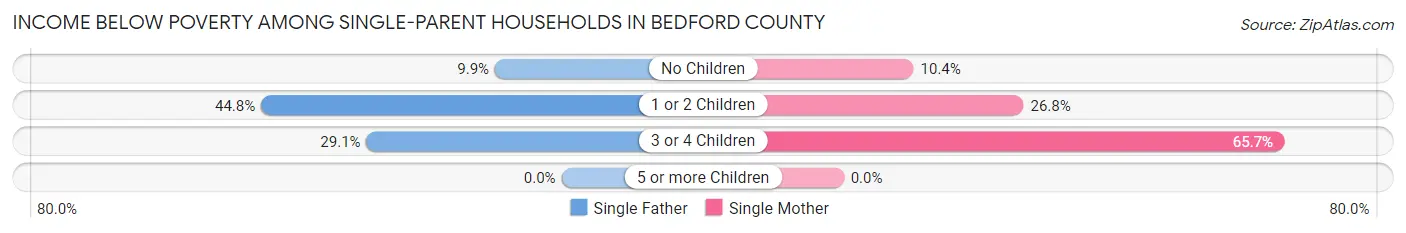
| Children | Single Father | Single Mother |
| No Children | 46 (9.9%) | 90 (10.4%) |
| 1 or 2 Children | 308 (44.8%) | 332 (26.8%) |
| 3 or 4 Children | 25 (29.1%) | 474 (65.7%) |
| 5 or more Children | 0 (0.0%) | 0 (0.0%) |
| Total | 379 (30.6%) | 896 (31.7%) |
Income Below Poverty Among Married-Couple vs Single-Parent Households in Bedford County
The poverty data for Bedford County shows that 169 of the married-couple family households (1.9%) and 1,275 of the single-parent households (31.4%) are living below the poverty level. Within the married-couple family households, those with 3 or 4 children have the highest poverty rate, with 23 households (3.0%) falling below the poverty line. Among the single-parent households, those with 3 or 4 children have the highest poverty rate, with 499 household (61.8%) living below poverty.
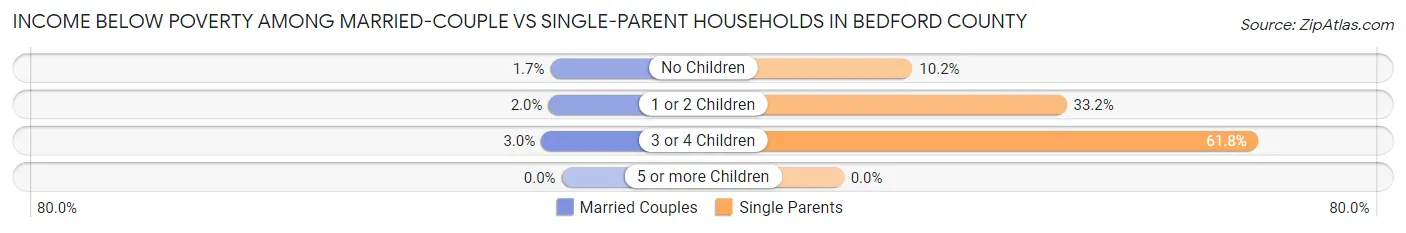
| Children | Married-Couple Families | Single-Parent Households |
| No Children | 95 (1.7%) | 136 (10.2%) |
| 1 or 2 Children | 51 (2.0%) | 640 (33.2%) |
| 3 or 4 Children | 23 (3.0%) | 499 (61.8%) |
| 5 or more Children | 0 (0.0%) | 0 (0.0%) |
| Total | 169 (1.9%) | 1,275 (31.4%) |
Employment Characteristics in Bedford County
Employment by Class of Employer in Bedford County
Among the 22,971 employed individuals in Bedford County, private company employees (16,725 | 72.8%), local government employees (2,157 | 9.4%), and self-employed (not incorporated) (1,560 | 6.8%) make up the most common classes of employment.
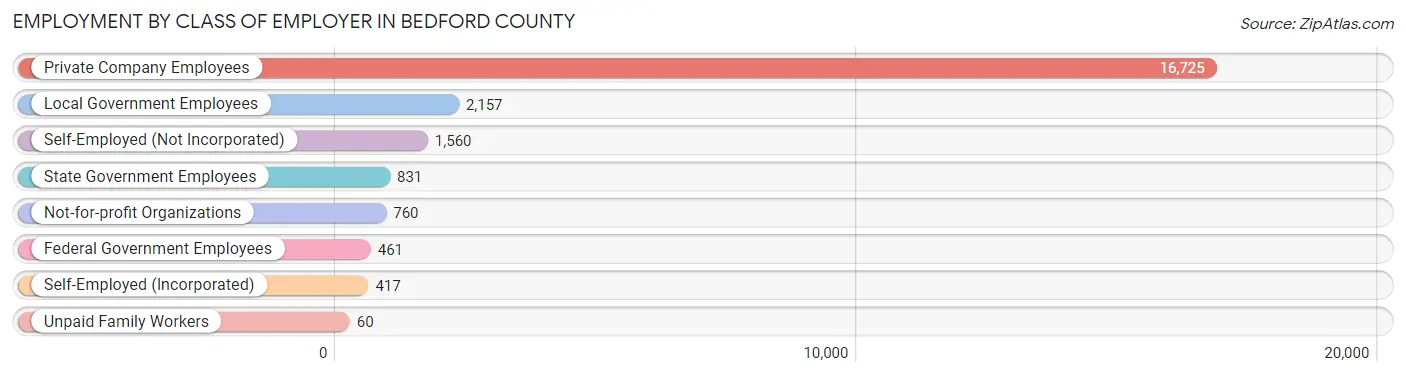
| Employer Class | # Employees | % Employees |
| Private Company Employees | 16,725 | 72.8% |
| Self-Employed (Incorporated) | 417 | 1.8% |
| Self-Employed (Not Incorporated) | 1,560 | 6.8% |
| Not-for-profit Organizations | 760 | 3.3% |
| Local Government Employees | 2,157 | 9.4% |
| State Government Employees | 831 | 3.6% |
| Federal Government Employees | 461 | 2.0% |
| Unpaid Family Workers | 60 | 0.3% |
| Total | 22,971 | 100.0% |
Employment Status by Age in Bedford County
According to the labor force statistics for Bedford County, out of the total population over 16 years of age (39,381), 62.1% or 24,456 individuals are in the labor force, with 4.6% or 1,125 of them unemployed. The age group with the highest labor force participation rate is 30 to 34 years, with 84.5% or 2,625 individuals in the labor force. Within the labor force, the 16 to 19 years age range has the highest percentage of unemployed individuals, with 17.7% or 186 of them being unemployed.

| Age Bracket | In Labor Force | Unemployed |
| 16 to 19 Years | 1,049 (41.2%) | 186 (17.7%) |
| 20 to 24 Years | 2,275 (74.8%) | 187 (8.2%) |
| 25 to 29 Years | 3,163 (78.9%) | 218 (6.9%) |
| 30 to 34 Years | 2,625 (84.5%) | 84 (3.2%) |
| 35 to 44 Years | 4,979 (80.3%) | 154 (3.1%) |
| 45 to 54 Years | 5,099 (75.5%) | 107 (2.1%) |
| 55 to 59 Years | 1,983 (68.4%) | 65 (3.3%) |
| 60 to 64 Years | 1,855 (53.5%) | 37 (2.0%) |
| 65 to 74 Years | 1,061 (24.2%) | 84 (7.9%) |
| 75 Years and over | 377 (12.7%) | 0 (0.0%) |
| Total | 24,456 (62.1%) | 1,125 (4.6%) |
Employment Status by Educational Attainment in Bedford County
According to labor force statistics for Bedford County, 74.5% of individuals (19,695) out of the total population between 25 and 64 years of age (26,436) are in the labor force, with 3.4% or 670 of them being unemployed. The group with the highest labor force participation rate are those with the educational attainment of bachelor's degree or higher, with 85.0% or 3,854 individuals in the labor force. Within the labor force, individuals with college / associate degree education have the highest percentage of unemployment, with 5.4% or 295 of them being unemployed.
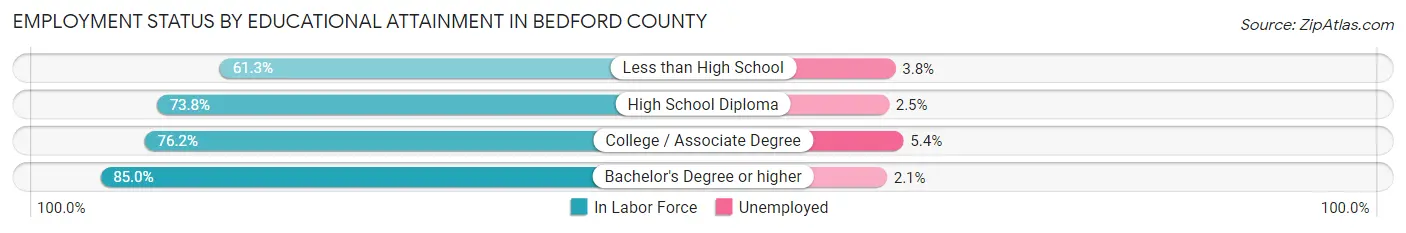
| Educational Attainment | In Labor Force | Unemployed |
| Less than High School | 2,384 (61.3%) | 148 (3.8%) |
| High School Diploma | 7,995 (73.8%) | 271 (2.5%) |
| College / Associate Degree | 5,470 (76.2%) | 388 (5.4%) |
| Bachelor's Degree or higher | 3,854 (85.0%) | 95 (2.1%) |
| Total | 19,695 (74.5%) | 899 (3.4%) |
Employment Occupations by Sex in Bedford County
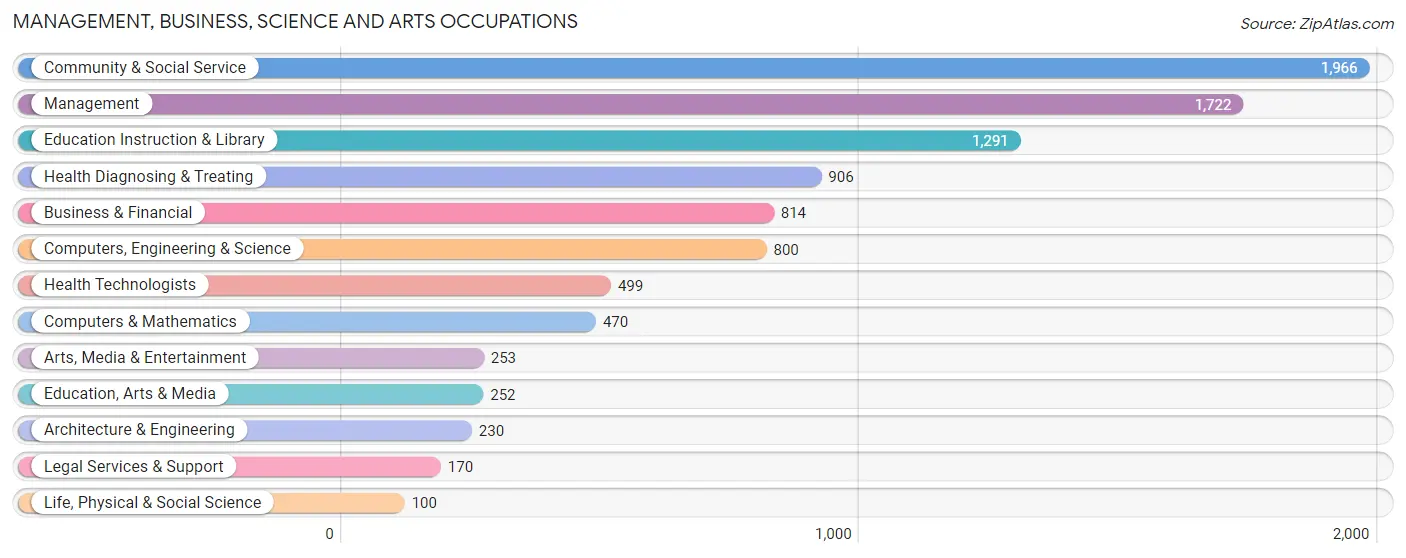
Management, Business, Science and Arts Occupations
The most common Management, Business, Science and Arts occupations in Bedford County are Community & Social Service (1,966 | 8.4%), Management (1,722 | 7.4%), Education Instruction & Library (1,291 | 5.5%), Health Diagnosing & Treating (906 | 3.9%), and Business & Financial (814 | 3.5%).
Management, Business, Science and Arts Occupations by Sex
Within the Management, Business, Science and Arts occupations in Bedford County, the most male-oriented occupations are Architecture & Engineering (82.2%), Computers & Mathematics (77.4%), and Computers, Engineering & Science (75.7%), while the most female-oriented occupations are Health Diagnosing & Treating (78.7%), Arts, Media & Entertainment (76.3%), and Business & Financial (71.1%).
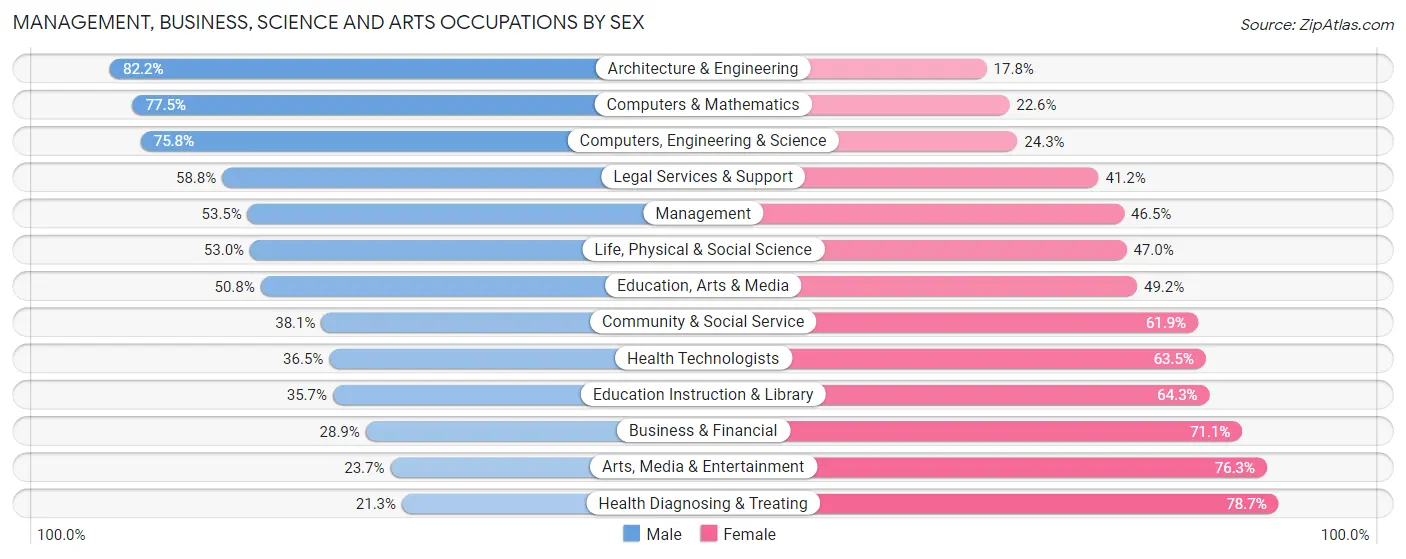
| Occupation | Male | Female |
| Management | 921 (53.5%) | 801 (46.5%) |
| Business & Financial | 235 (28.9%) | 579 (71.1%) |
| Computers, Engineering & Science | 606 (75.7%) | 194 (24.2%) |
| Computers & Mathematics | 364 (77.4%) | 106 (22.6%) |
| Architecture & Engineering | 189 (82.2%) | 41 (17.8%) |
| Life, Physical & Social Science | 53 (53.0%) | 47 (47.0%) |
| Community & Social Service | 749 (38.1%) | 1,217 (61.9%) |
| Education, Arts & Media | 128 (50.8%) | 124 (49.2%) |
| Legal Services & Support | 100 (58.8%) | 70 (41.2%) |
| Education Instruction & Library | 461 (35.7%) | 830 (64.3%) |
| Arts, Media & Entertainment | 60 (23.7%) | 193 (76.3%) |
| Health Diagnosing & Treating | 193 (21.3%) | 713 (78.7%) |
| Health Technologists | 182 (36.5%) | 317 (63.5%) |
| Total (Category) | 2,704 (43.6%) | 3,504 (56.4%) |
| Total (Overall) | 12,905 (55.3%) | 10,422 (44.7%) |
Services Occupations
The most common Services occupations in Bedford County are Cleaning & Maintenance (1,392 | 6.0%), Food Preparation & Serving (1,190 | 5.1%), Security & Protection (515 | 2.2%), Healthcare Support (488 | 2.1%), and Personal Care & Service (486 | 2.1%).

Services Occupations by Sex
Within the Services occupations in Bedford County, the most male-oriented occupations are Firefighting & Prevention (81.7%), Security & Protection (70.5%), and Law Enforcement (62.3%), while the most female-oriented occupations are Healthcare Support (92.4%), Food Preparation & Serving (64.0%), and Personal Care & Service (48.6%).
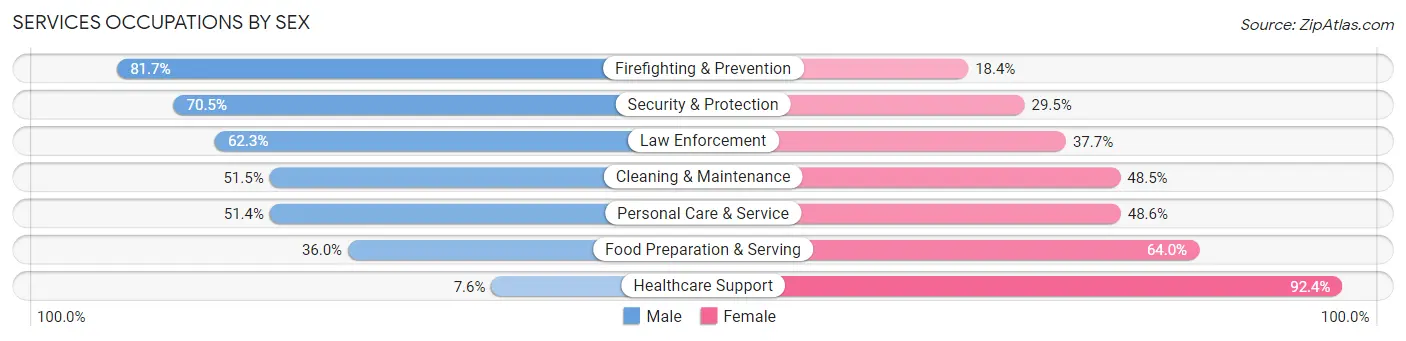
| Occupation | Male | Female |
| Healthcare Support | 37 (7.6%) | 451 (92.4%) |
| Security & Protection | 363 (70.5%) | 152 (29.5%) |
| Firefighting & Prevention | 178 (81.7%) | 40 (18.3%) |
| Law Enforcement | 185 (62.3%) | 112 (37.7%) |
| Food Preparation & Serving | 428 (36.0%) | 762 (64.0%) |
| Cleaning & Maintenance | 717 (51.5%) | 675 (48.5%) |
| Personal Care & Service | 250 (51.4%) | 236 (48.6%) |
| Total (Category) | 1,795 (44.1%) | 2,276 (55.9%) |
| Total (Overall) | 12,905 (55.3%) | 10,422 (44.7%) |
Sales and Office Occupations
The most common Sales and Office occupations in Bedford County are Office & Administration (2,554 | 11.0%), and Sales & Related (1,713 | 7.3%).

Sales and Office Occupations by Sex
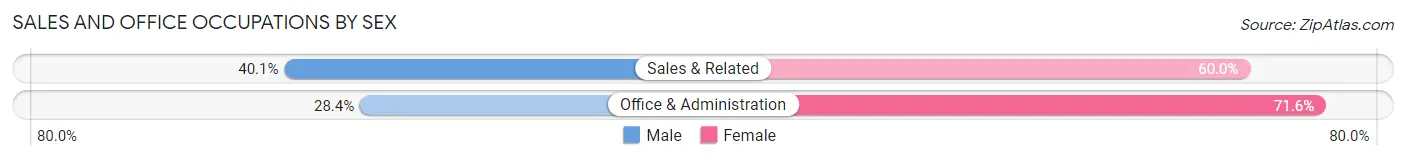
| Occupation | Male | Female |
| Sales & Related | 686 (40.1%) | 1,027 (60.0%) |
| Office & Administration | 725 (28.4%) | 1,829 (71.6%) |
| Total (Category) | 1,411 (33.1%) | 2,856 (66.9%) |
| Total (Overall) | 12,905 (55.3%) | 10,422 (44.7%) |
Natural Resources, Construction and Maintenance Occupations
The most common Natural Resources, Construction and Maintenance occupations in Bedford County are Construction & Extraction (1,923 | 8.2%), Installation, Maintenance & Repair (1,287 | 5.5%), and Farming, Fishing & Forestry (71 | 0.3%).
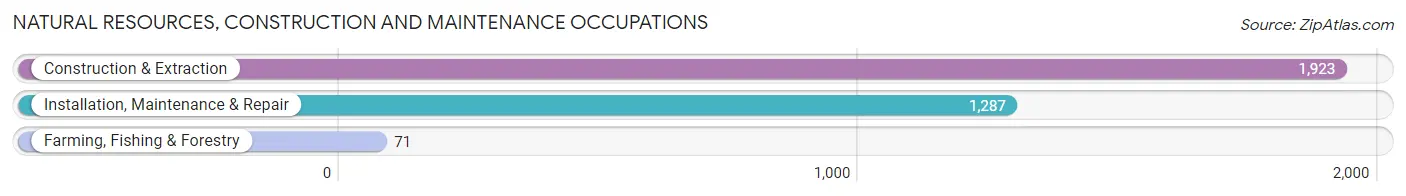
Natural Resources, Construction and Maintenance Occupations by Sex
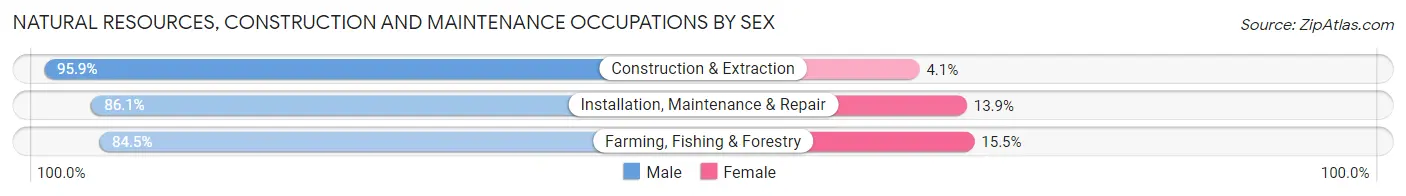
| Occupation | Male | Female |
| Farming, Fishing & Forestry | 60 (84.5%) | 11 (15.5%) |
| Construction & Extraction | 1,845 (95.9%) | 78 (4.1%) |
| Installation, Maintenance & Repair | 1,108 (86.1%) | 179 (13.9%) |
| Total (Category) | 3,013 (91.8%) | 268 (8.2%) |
| Total (Overall) | 12,905 (55.3%) | 10,422 (44.7%) |
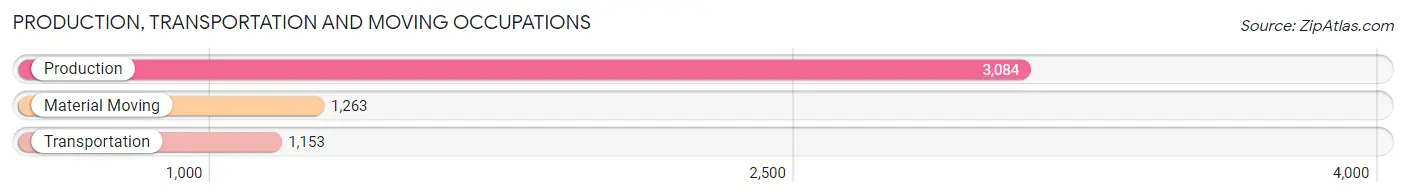
Production, Transportation and Moving Occupations
The most common Production, Transportation and Moving occupations in Bedford County are Production (3,084 | 13.2%), Material Moving (1,263 | 5.4%), and Transportation (1,153 | 4.9%).
Production, Transportation and Moving Occupations by Sex
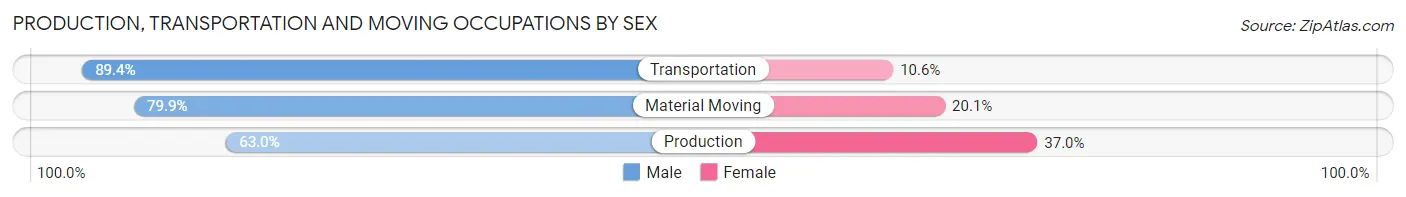
| Occupation | Male | Female |
| Production | 1,942 (63.0%) | 1,142 (37.0%) |
| Transportation | 1,031 (89.4%) | 122 (10.6%) |
| Material Moving | 1,009 (79.9%) | 254 (20.1%) |
| Total (Category) | 3,982 (72.4%) | 1,518 (27.6%) |
| Total (Overall) | 12,905 (55.3%) | 10,422 (44.7%) |
Employment Industries by Sex in Bedford County
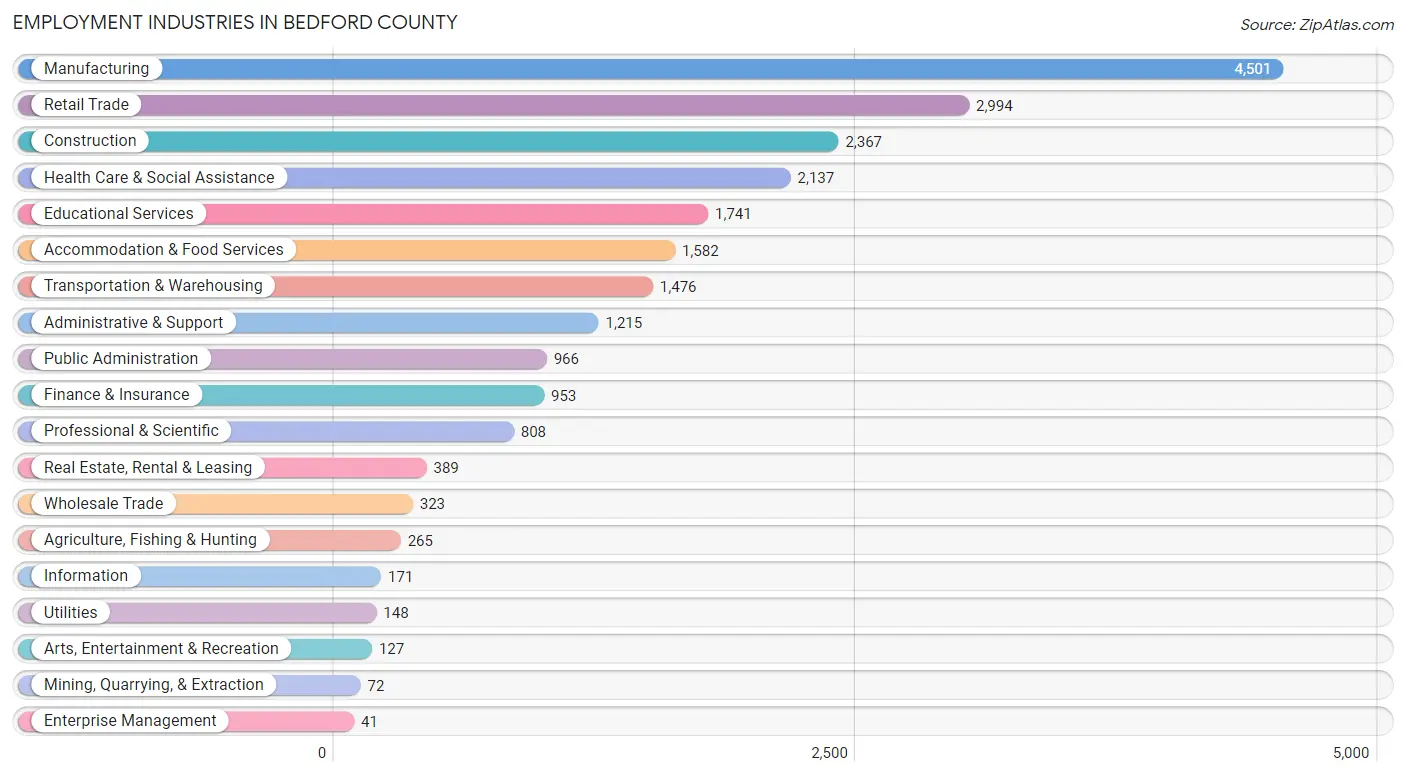
Employment Industries in Bedford County
The major employment industries in Bedford County include Manufacturing (4,501 | 19.3%), Retail Trade (2,994 | 12.8%), Construction (2,367 | 10.2%), Health Care & Social Assistance (2,137 | 9.2%), and Educational Services (1,741 | 7.5%).
Employment Industries by Sex in Bedford County
The Bedford County industries that see more men than women are Mining, Quarrying, & Extraction (100.0%), Construction (92.0%), and Utilities (85.8%), whereas the industries that tend to have a higher number of women are Educational Services (68.7%), Health Care & Social Assistance (68.2%), and Finance & Insurance (65.7%).
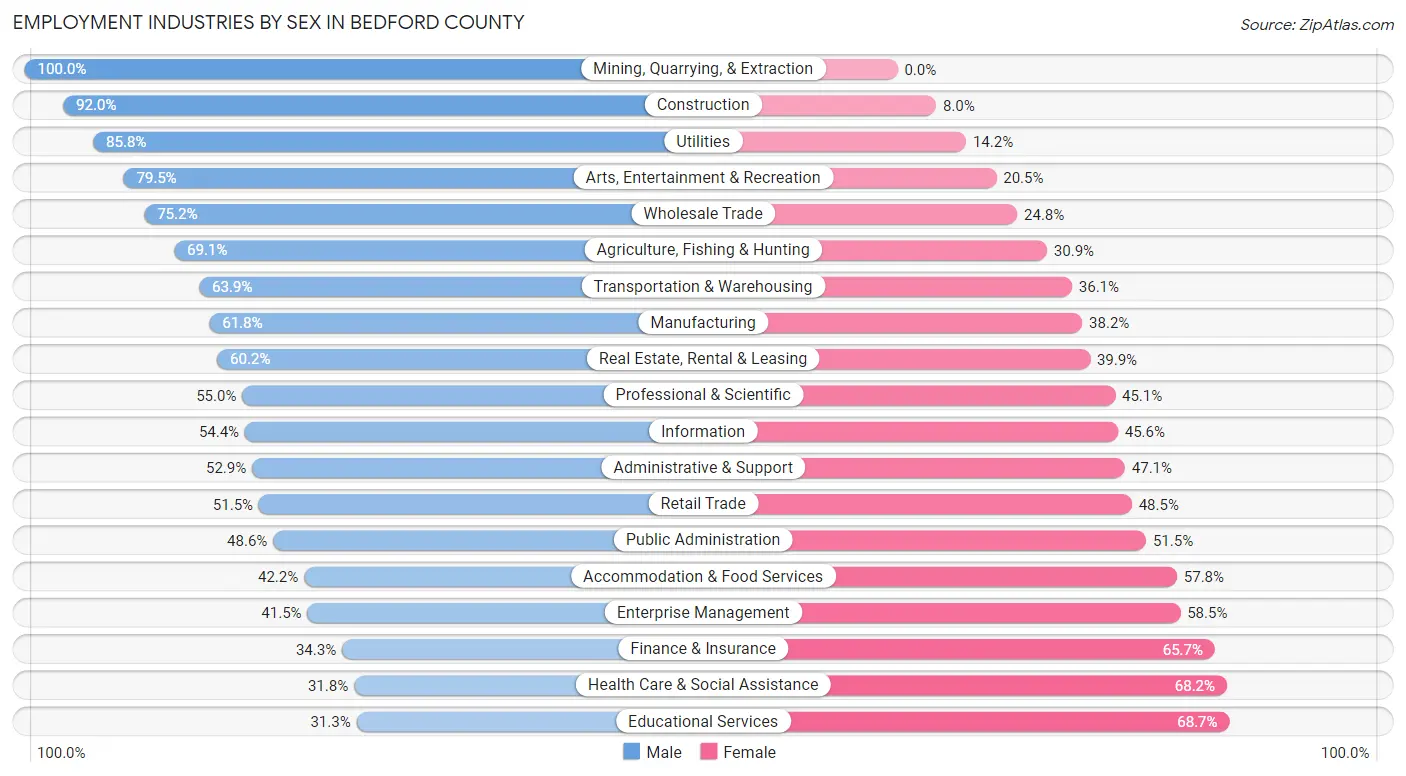
| Industry | Male | Female |
| Agriculture, Fishing & Hunting | 183 (69.1%) | 82 (30.9%) |
| Mining, Quarrying, & Extraction | 72 (100.0%) | 0 (0.0%) |
| Construction | 2,178 (92.0%) | 189 (8.0%) |
| Manufacturing | 2,780 (61.8%) | 1,721 (38.2%) |
| Wholesale Trade | 243 (75.2%) | 80 (24.8%) |
| Retail Trade | 1,542 (51.5%) | 1,452 (48.5%) |
| Transportation & Warehousing | 943 (63.9%) | 533 (36.1%) |
| Utilities | 127 (85.8%) | 21 (14.2%) |
| Information | 93 (54.4%) | 78 (45.6%) |
| Finance & Insurance | 327 (34.3%) | 626 (65.7%) |
| Real Estate, Rental & Leasing | 234 (60.2%) | 155 (39.9%) |
| Professional & Scientific | 444 (54.9%) | 364 (45.1%) |
| Enterprise Management | 17 (41.5%) | 24 (58.5%) |
| Administrative & Support | 643 (52.9%) | 572 (47.1%) |
| Educational Services | 545 (31.3%) | 1,196 (68.7%) |
| Health Care & Social Assistance | 680 (31.8%) | 1,457 (68.2%) |
| Arts, Entertainment & Recreation | 101 (79.5%) | 26 (20.5%) |
| Accommodation & Food Services | 667 (42.2%) | 915 (57.8%) |
| Public Administration | 469 (48.5%) | 497 (51.4%) |
| Total | 12,905 (55.3%) | 10,422 (44.7%) |
Education in Bedford County
School Enrollment in Bedford County
The most common levels of schooling among the 11,267 students in Bedford County are middle school (3,198 | 28.4%), high school (2,848 | 25.3%), and elementary school (2,619 | 23.2%).

| School Level | # Students | % Students |
| Nursery / Preschool | 448 | 4.0% |
| Kindergarten | 620 | 5.5% |
| Elementary School | 2,619 | 23.2% |
| Middle School | 3,198 | 28.4% |
| High School | 2,848 | 25.3% |
| College / Undergraduate | 1,362 | 12.1% |
| Graduate / Professional | 172 | 1.5% |
| Total | 11,267 | 100.0% |
School Enrollment by Age by Funding Source in Bedford County
Out of a total of 11,267 students who are enrolled in schools in Bedford County, 1,510 (13.4%) attend a private institution, while the remaining 9,757 (86.6%) are enrolled in public schools. The age group of 3 to 4 year olds has the highest likelihood of being enrolled in private schools, with 148 (58.5% in the age bracket) enrolled. Conversely, the age group of 18 to 19 year olds has the lowest likelihood of being enrolled in a private school, with 614 (94.0% in the age bracket) attending a public institution.
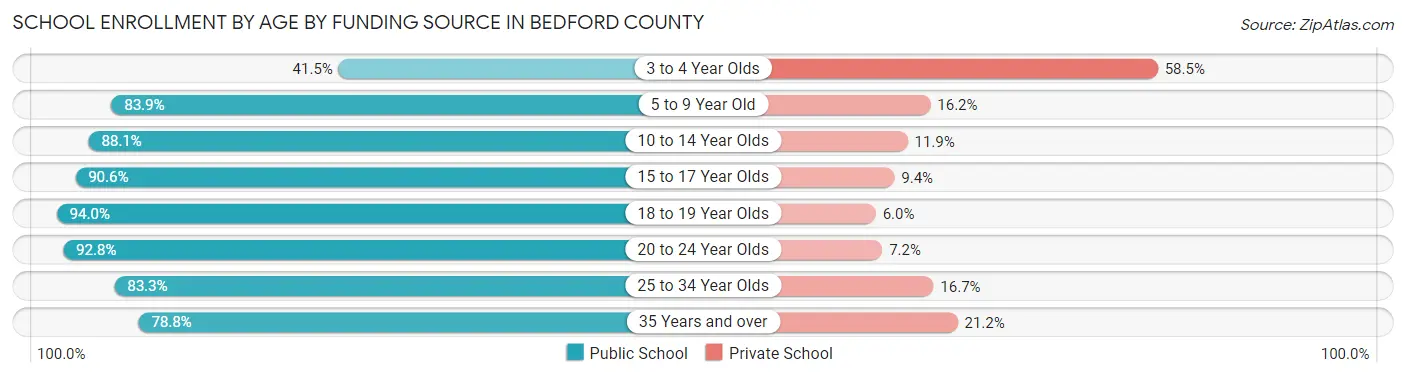
| Age Bracket | Public School | Private School |
| 3 to 4 Year Olds | 105 (41.5%) | 148 (58.5%) |
| 5 to 9 Year Old | 2,590 (83.9%) | 499 (16.2%) |
| 10 to 14 Year Olds | 3,264 (88.1%) | 441 (11.9%) |
| 15 to 17 Year Olds | 1,908 (90.6%) | 199 (9.4%) |
| 18 to 19 Year Olds | 614 (94.0%) | 39 (6.0%) |
| 20 to 24 Year Olds | 685 (92.8%) | 53 (7.2%) |
| 25 to 34 Year Olds | 354 (83.3%) | 71 (16.7%) |
| 35 Years and over | 234 (78.8%) | 63 (21.2%) |
| Total | 9,757 (86.6%) | 1,510 (13.4%) |
Educational Attainment by Field of Study in Bedford County
Business (1,254 | 19.9%), education (1,172 | 18.6%), science & technology (581 | 9.2%), bio, nature & agricultural (474 | 7.5%), and liberal arts & history (404 | 6.4%) are the most common fields of study among 6,313 individuals in Bedford County who have obtained a bachelor's degree or higher.
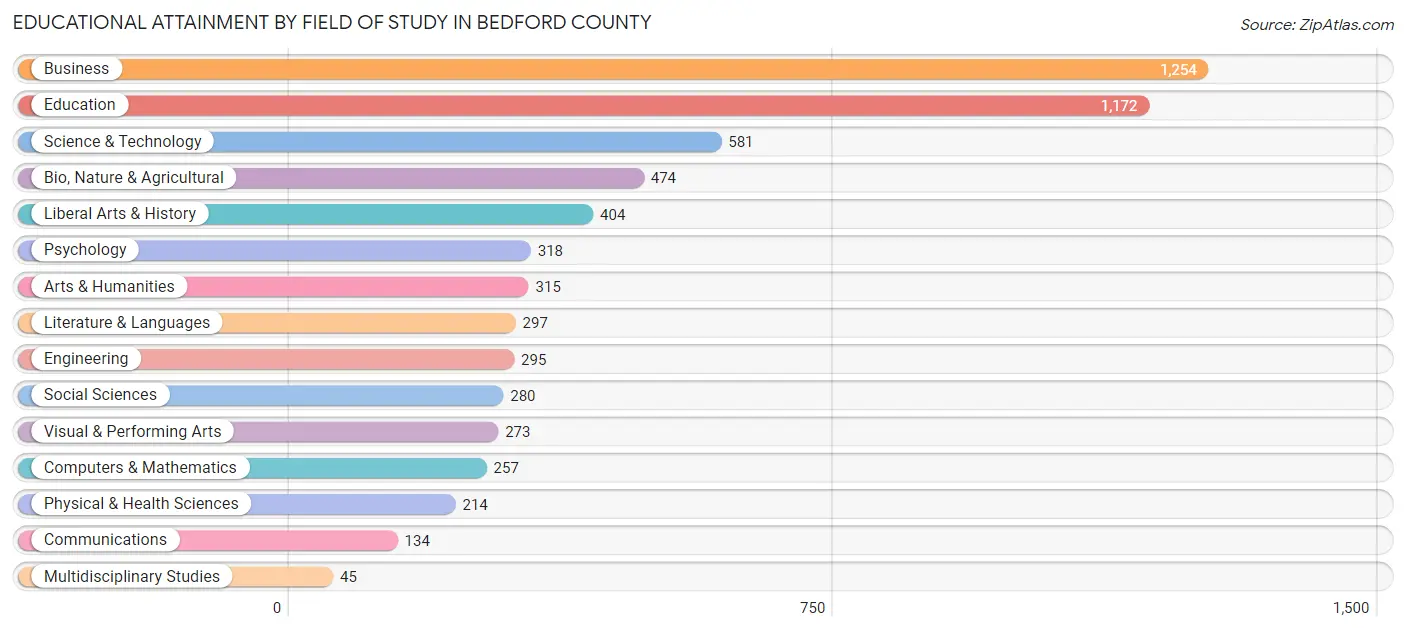
| Field of Study | # Graduates | % Graduates |
| Computers & Mathematics | 257 | 4.1% |
| Bio, Nature & Agricultural | 474 | 7.5% |
| Physical & Health Sciences | 214 | 3.4% |
| Psychology | 318 | 5.0% |
| Social Sciences | 280 | 4.4% |
| Engineering | 295 | 4.7% |
| Multidisciplinary Studies | 45 | 0.7% |
| Science & Technology | 581 | 9.2% |
| Business | 1,254 | 19.9% |
| Education | 1,172 | 18.6% |
| Literature & Languages | 297 | 4.7% |
| Liberal Arts & History | 404 | 6.4% |
| Visual & Performing Arts | 273 | 4.3% |
| Communications | 134 | 2.1% |
| Arts & Humanities | 315 | 5.0% |
| Total | 6,313 | 100.0% |
Transportation & Commute in Bedford County
Vehicle Availability by Sex in Bedford County
The most prevalent vehicle ownership categories in Bedford County are males with 2 vehicles (4,185, accounting for 33.3%) and females with 2 vehicles (3,417, making up 40.6%).
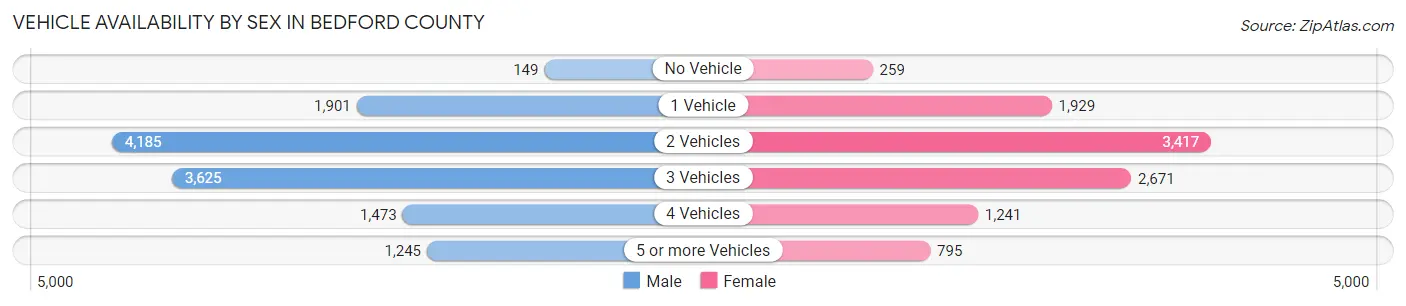
| Vehicles Available | Male | Female |
| No Vehicle | 149 (1.2%) | 259 (2.5%) |
| 1 Vehicle | 1,901 (15.1%) | 1,929 (18.7%) |
| 2 Vehicles | 4,185 (33.3%) | 3,417 (33.1%) |
| 3 Vehicles | 3,625 (28.8%) | 2,671 (25.9%) |
| 4 Vehicles | 1,473 (11.7%) | 1,241 (12.0%) |
| 5 or more Vehicles | 1,245 (9.9%) | 795 (7.7%) |
| Total | 12,578 (100.0%) | 10,312 (100.0%) |
Commute Time in Bedford County
The most frequently occuring commute durations in Bedford County are 15 to 19 minutes (3,390 commuters, 15.8%), 10 to 14 minutes (3,197 commuters, 14.8%), and 5 to 9 minutes (2,917 commuters, 13.6%).
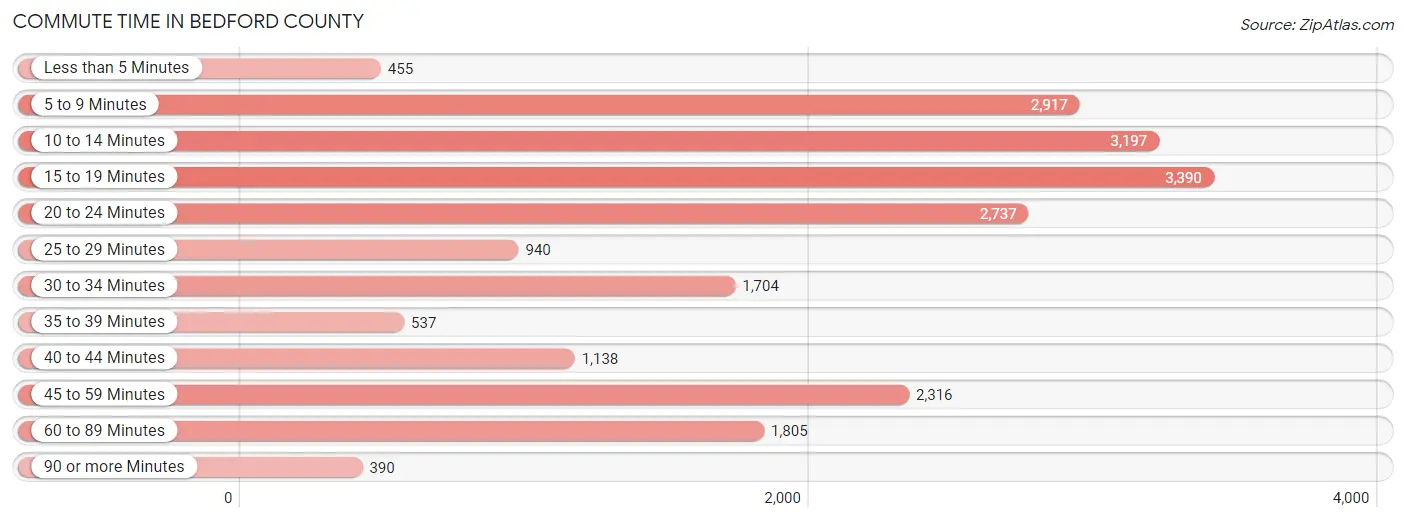
| Commute Time | # Commuters | % Commuters |
| Less than 5 Minutes | 455 | 2.1% |
| 5 to 9 Minutes | 2,917 | 13.6% |
| 10 to 14 Minutes | 3,197 | 14.8% |
| 15 to 19 Minutes | 3,390 | 15.8% |
| 20 to 24 Minutes | 2,737 | 12.7% |
| 25 to 29 Minutes | 940 | 4.4% |
| 30 to 34 Minutes | 1,704 | 7.9% |
| 35 to 39 Minutes | 537 | 2.5% |
| 40 to 44 Minutes | 1,138 | 5.3% |
| 45 to 59 Minutes | 2,316 | 10.8% |
| 60 to 89 Minutes | 1,805 | 8.4% |
| 90 or more Minutes | 390 | 1.8% |
Commute Time by Sex in Bedford County
The most common commute times in Bedford County are 10 to 14 minutes (1,677 commuters, 14.1%) for males and 15 to 19 minutes (1,747 commuters, 18.1%) for females.
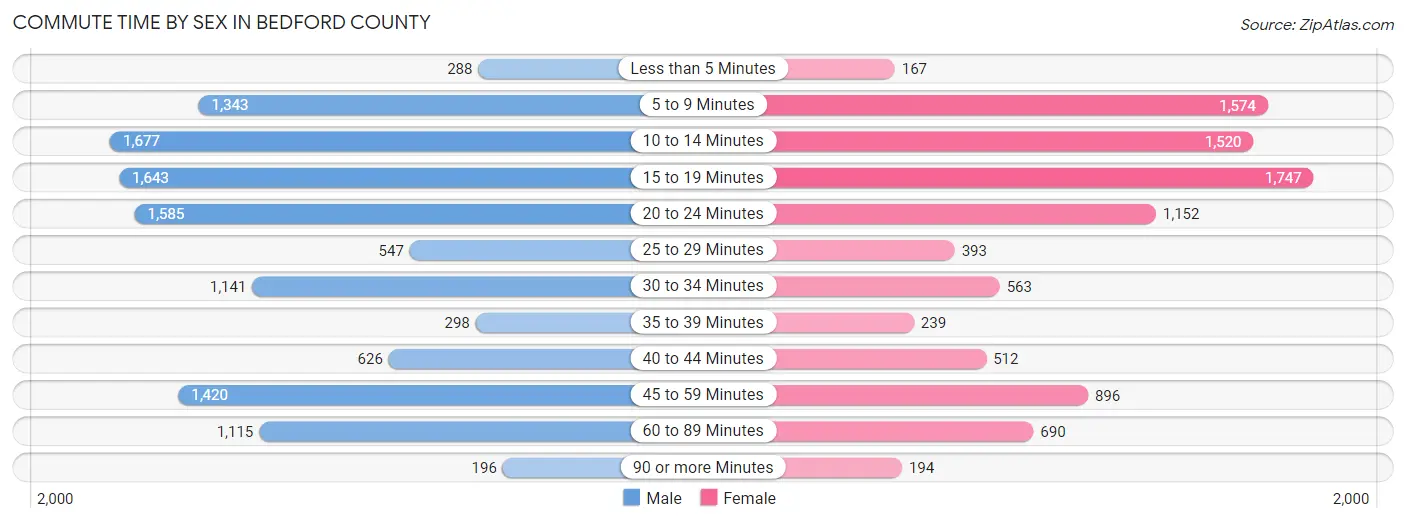
| Commute Time | Male | Female |
| Less than 5 Minutes | 288 (2.4%) | 167 (1.7%) |
| 5 to 9 Minutes | 1,343 (11.3%) | 1,574 (16.3%) |
| 10 to 14 Minutes | 1,677 (14.1%) | 1,520 (15.8%) |
| 15 to 19 Minutes | 1,643 (13.8%) | 1,747 (18.1%) |
| 20 to 24 Minutes | 1,585 (13.3%) | 1,152 (11.9%) |
| 25 to 29 Minutes | 547 (4.6%) | 393 (4.1%) |
| 30 to 34 Minutes | 1,141 (9.6%) | 563 (5.8%) |
| 35 to 39 Minutes | 298 (2.5%) | 239 (2.5%) |
| 40 to 44 Minutes | 626 (5.3%) | 512 (5.3%) |
| 45 to 59 Minutes | 1,420 (11.9%) | 896 (9.3%) |
| 60 to 89 Minutes | 1,115 (9.4%) | 690 (7.1%) |
| 90 or more Minutes | 196 (1.7%) | 194 (2.0%) |
Time of Departure to Work by Sex in Bedford County
The most frequent times of departure to work in Bedford County are 6:30 AM to 6:59 AM (2,208, 18.6%) for males and 6:30 AM to 6:59 AM (1,431, 14.8%) for females.
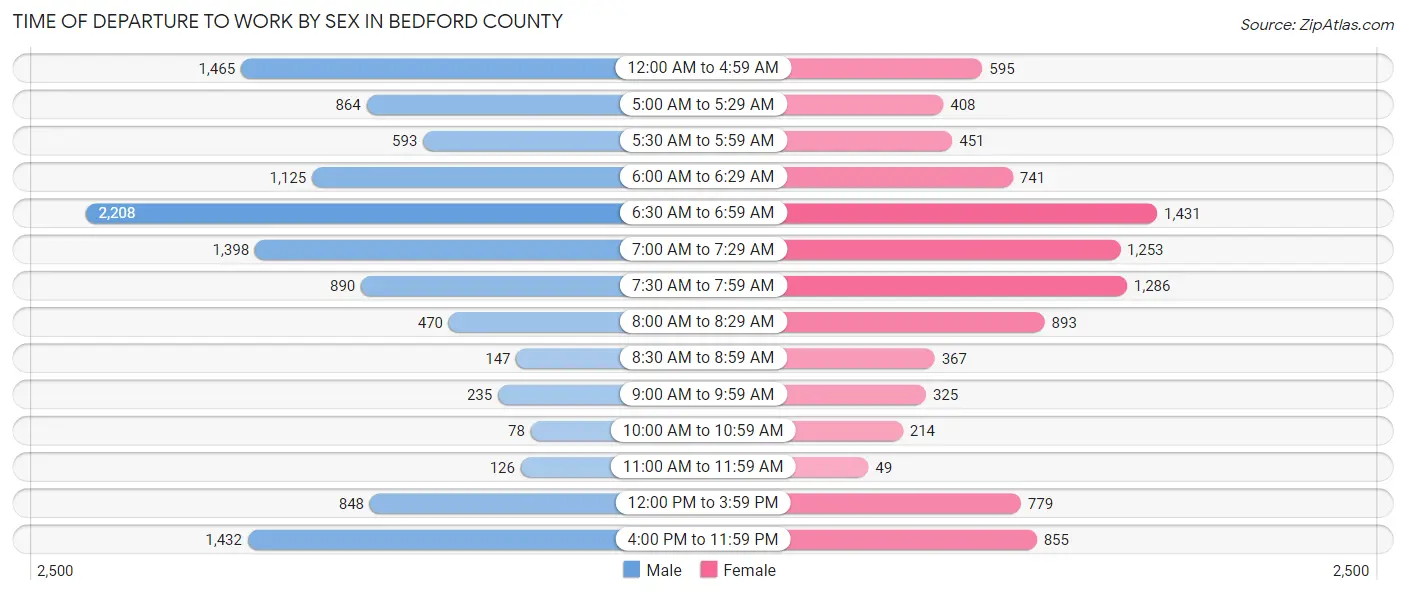
| Time of Departure | Male | Female |
| 12:00 AM to 4:59 AM | 1,465 (12.3%) | 595 (6.2%) |
| 5:00 AM to 5:29 AM | 864 (7.3%) | 408 (4.2%) |
| 5:30 AM to 5:59 AM | 593 (5.0%) | 451 (4.7%) |
| 6:00 AM to 6:29 AM | 1,125 (9.5%) | 741 (7.7%) |
| 6:30 AM to 6:59 AM | 2,208 (18.6%) | 1,431 (14.8%) |
| 7:00 AM to 7:29 AM | 1,398 (11.8%) | 1,253 (13.0%) |
| 7:30 AM to 7:59 AM | 890 (7.5%) | 1,286 (13.3%) |
| 8:00 AM to 8:29 AM | 470 (4.0%) | 893 (9.3%) |
| 8:30 AM to 8:59 AM | 147 (1.2%) | 367 (3.8%) |
| 9:00 AM to 9:59 AM | 235 (2.0%) | 325 (3.4%) |
| 10:00 AM to 10:59 AM | 78 (0.7%) | 214 (2.2%) |
| 11:00 AM to 11:59 AM | 126 (1.1%) | 49 (0.5%) |
| 12:00 PM to 3:59 PM | 848 (7.1%) | 779 (8.1%) |
| 4:00 PM to 11:59 PM | 1,432 (12.0%) | 855 (8.9%) |
| Total | 11,879 (100.0%) | 9,647 (100.0%) |
Housing Occupancy in Bedford County
Occupancy by Ownership in Bedford County
Of the total 18,469 dwellings in Bedford County, owner-occupied units account for 12,998 (70.4%), while renter-occupied units make up 5,471 (29.6%).
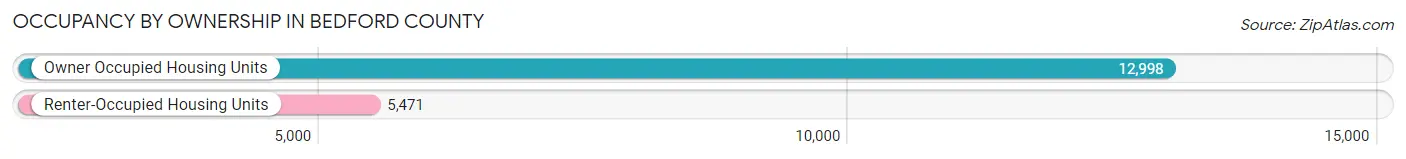
| Occupancy | # Housing Units | % Housing Units |
| Owner Occupied Housing Units | 12,998 | 70.4% |
| Renter-Occupied Housing Units | 5,471 | 29.6% |
| Total Occupied Housing Units | 18,469 | 100.0% |
Occupancy by Household Size in Bedford County
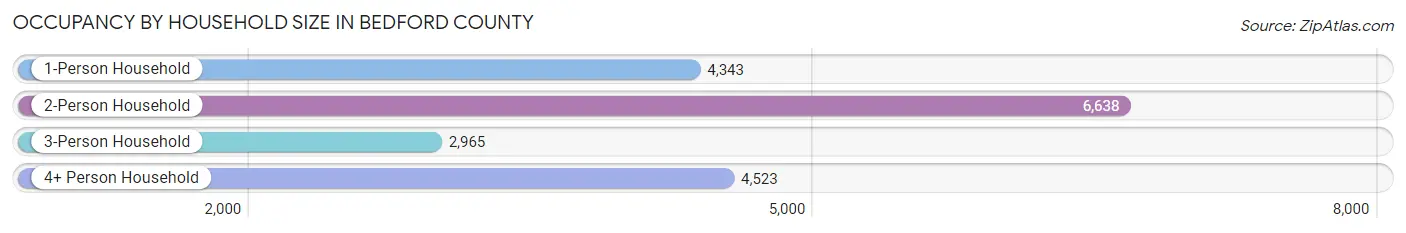
| Household Size | # Housing Units | % Housing Units |
| 1-Person Household | 4,343 | 23.5% |
| 2-Person Household | 6,638 | 35.9% |
| 3-Person Household | 2,965 | 16.1% |
| 4+ Person Household | 4,523 | 24.5% |
| Total Housing Units | 18,469 | 100.0% |
Occupancy by Ownership by Household Size in Bedford County
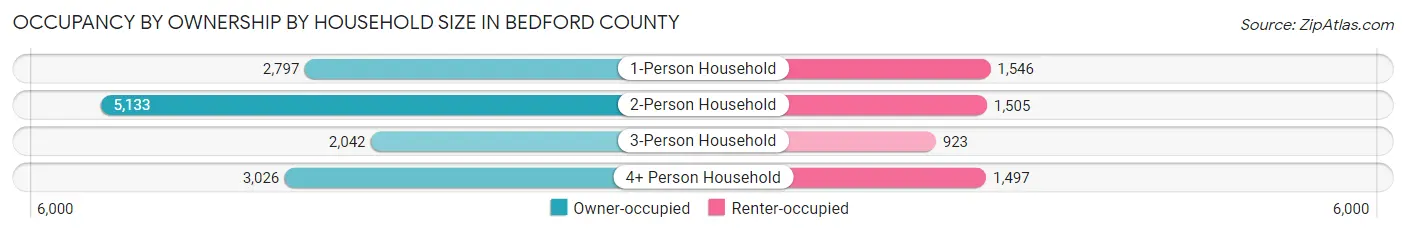
| Household Size | Owner-occupied | Renter-occupied |
| 1-Person Household | 2,797 (64.4%) | 1,546 (35.6%) |
| 2-Person Household | 5,133 (77.3%) | 1,505 (22.7%) |
| 3-Person Household | 2,042 (68.9%) | 923 (31.1%) |
| 4+ Person Household | 3,026 (66.9%) | 1,497 (33.1%) |
| Total Housing Units | 12,998 (70.4%) | 5,471 (29.6%) |
Occupancy by Educational Attainment in Bedford County
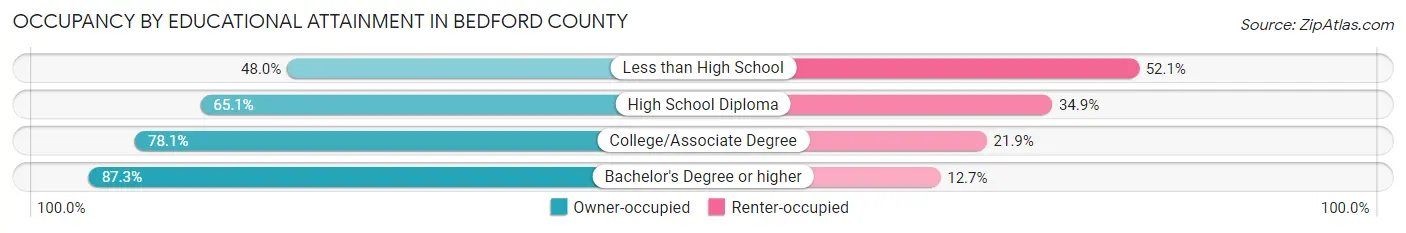
| Household Size | Owner-occupied | Renter-occupied |
| Less than High School | 1,274 (47.9%) | 1,383 (52.0%) |
| High School Diploma | 4,662 (65.1%) | 2,495 (34.9%) |
| College/Associate Degree | 4,187 (78.1%) | 1,174 (21.9%) |
| Bachelor's Degree or higher | 2,875 (87.3%) | 419 (12.7%) |
Occupancy by Age of Householder in Bedford County

| Age Bracket | # Households | % Households |
| Under 35 Years | 3,471 | 18.8% |
| 35 to 44 Years | 3,264 | 17.7% |
| 45 to 54 Years | 3,310 | 17.9% |
| 55 to 64 Years | 3,660 | 19.8% |
| 65 to 74 Years | 2,924 | 15.8% |
| 75 to 84 Years | 1,432 | 7.7% |
| 85 Years and Over | 408 | 2.2% |
| Total | 18,469 | 100.0% |
Housing Finances in Bedford County
Median Income by Occupancy in Bedford County

| Occupancy Type | # Households | Median Income |
| Owner-Occupied | 12,998 (70.4%) | $71,843 |
| Renter-Occupied | 5,471 (29.6%) | $43,461 |
| Average | 18,469 (100.0%) | $59,955 |
Occupancy by Householder Income Bracket in Bedford County
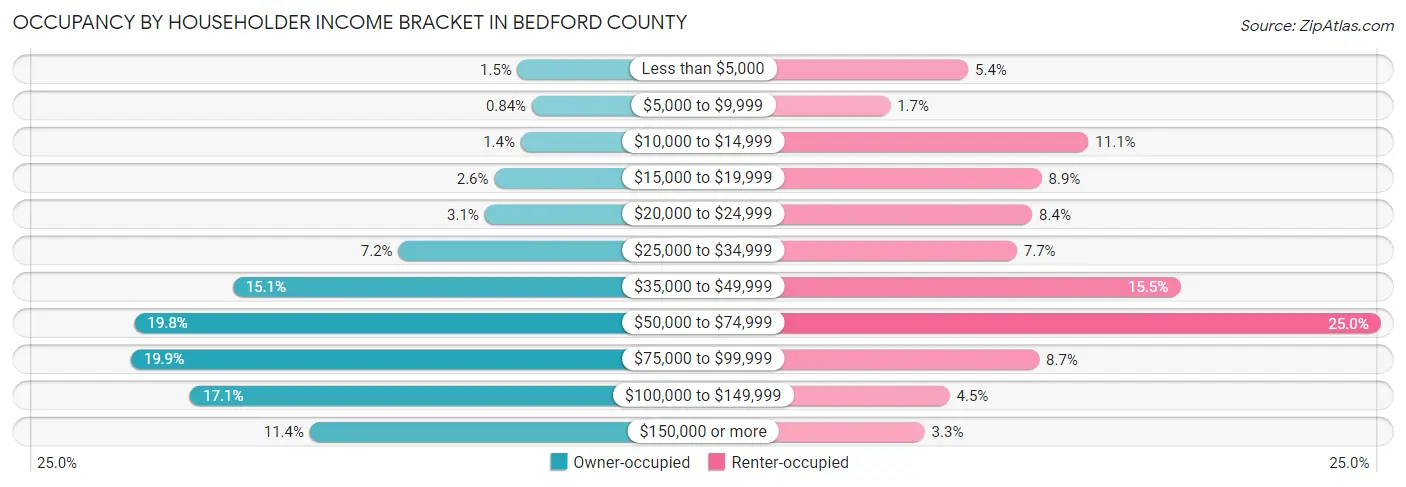
| Income Bracket | Owner-occupied | Renter-occupied |
| Less than $5,000 | 198 (1.5%) | 293 (5.4%) |
| $5,000 to $9,999 | 109 (0.8%) | 90 (1.7%) |
| $10,000 to $14,999 | 178 (1.4%) | 607 (11.1%) |
| $15,000 to $19,999 | 342 (2.6%) | 485 (8.9%) |
| $20,000 to $24,999 | 402 (3.1%) | 460 (8.4%) |
| $25,000 to $34,999 | 936 (7.2%) | 420 (7.7%) |
| $35,000 to $49,999 | 1,961 (15.1%) | 845 (15.4%) |
| $50,000 to $74,999 | 2,570 (19.8%) | 1,368 (25.0%) |
| $75,000 to $99,999 | 2,592 (19.9%) | 478 (8.7%) |
| $100,000 to $149,999 | 2,225 (17.1%) | 245 (4.5%) |
| $150,000 or more | 1,485 (11.4%) | 180 (3.3%) |
| Total | 12,998 (100.0%) | 5,471 (100.0%) |
Monthly Housing Cost Tiers in Bedford County
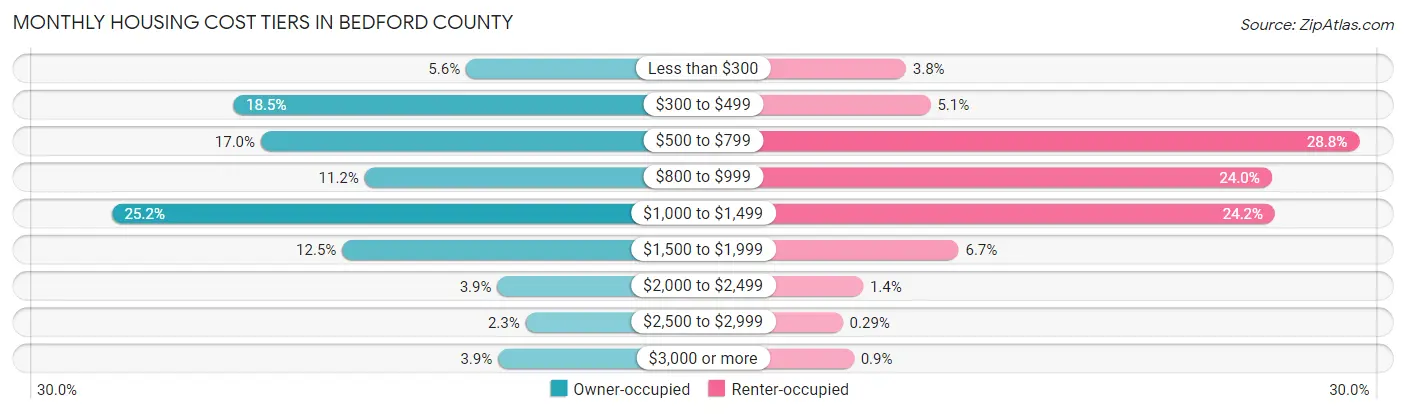
| Monthly Cost | Owner-occupied | Renter-occupied |
| Less than $300 | 730 (5.6%) | 207 (3.8%) |
| $300 to $499 | 2,402 (18.5%) | 281 (5.1%) |
| $500 to $799 | 2,203 (17.0%) | 1,576 (28.8%) |
| $800 to $999 | 1,458 (11.2%) | 1,312 (24.0%) |
| $1,000 to $1,499 | 3,275 (25.2%) | 1,322 (24.2%) |
| $1,500 to $1,999 | 1,620 (12.5%) | 366 (6.7%) |
| $2,000 to $2,499 | 506 (3.9%) | 77 (1.4%) |
| $2,500 to $2,999 | 303 (2.3%) | 16 (0.3%) |
| $3,000 or more | 501 (3.8%) | 49 (0.9%) |
| Total | 12,998 (100.0%) | 5,471 (100.0%) |
Physical Housing Characteristics in Bedford County
Housing Structures in Bedford County

| Structure Type | # Housing Units | % Housing Units |
| Single Unit, Detached | 14,033 | 76.0% |
| Single Unit, Attached | 163 | 0.9% |
| 2 Unit Apartments | 515 | 2.8% |
| 3 or 4 Unit Apartments | 364 | 2.0% |
| 5 to 9 Unit Apartments | 588 | 3.2% |
| 10 or more Apartments | 485 | 2.6% |
| Mobile Home / Other | 2,321 | 12.6% |
| Total | 18,469 | 100.0% |
Housing Structures by Occupancy in Bedford County

| Structure Type | Owner-occupied | Renter-occupied |
| Single Unit, Detached | 11,697 (83.4%) | 2,336 (16.7%) |
| Single Unit, Attached | 97 (59.5%) | 66 (40.5%) |
| 2 Unit Apartments | 2 (0.4%) | 513 (99.6%) |
| 3 or 4 Unit Apartments | 0 (0.0%) | 364 (100.0%) |
| 5 to 9 Unit Apartments | 20 (3.4%) | 568 (96.6%) |
| 10 or more Apartments | 0 (0.0%) | 485 (100.0%) |
| Mobile Home / Other | 1,182 (50.9%) | 1,139 (49.1%) |
| Total | 12,998 (70.4%) | 5,471 (29.6%) |
Housing Structures by Number of Rooms in Bedford County
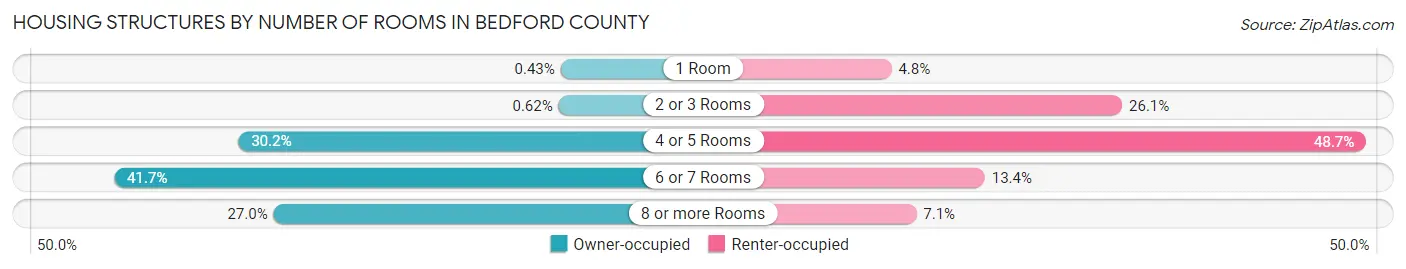
| Number of Rooms | Owner-occupied | Renter-occupied |
| 1 Room | 56 (0.4%) | 261 (4.8%) |
| 2 or 3 Rooms | 81 (0.6%) | 1,428 (26.1%) |
| 4 or 5 Rooms | 3,930 (30.2%) | 2,662 (48.7%) |
| 6 or 7 Rooms | 5,424 (41.7%) | 733 (13.4%) |
| 8 or more Rooms | 3,507 (27.0%) | 387 (7.1%) |
| Total | 12,998 (100.0%) | 5,471 (100.0%) |
Housing Structure by Heating Type in Bedford County
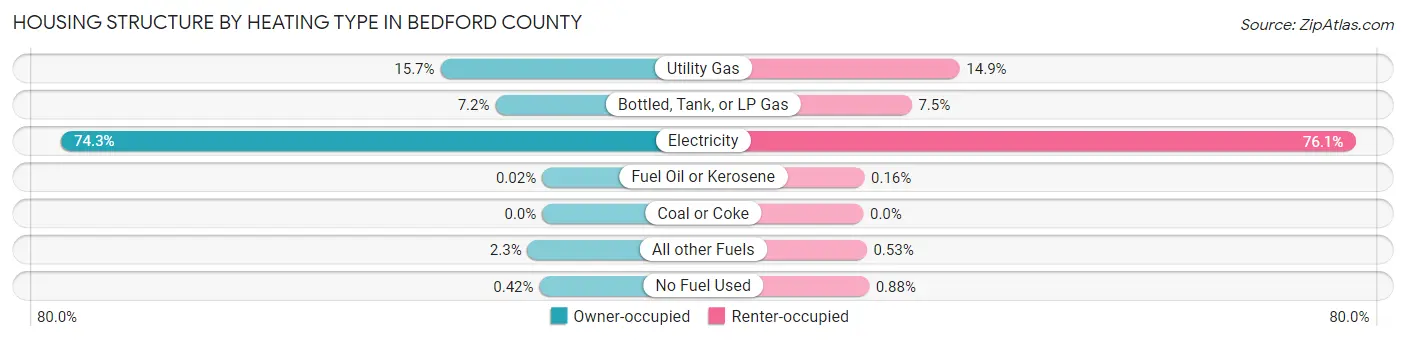
| Heating Type | Owner-occupied | Renter-occupied |
| Utility Gas | 2,045 (15.7%) | 815 (14.9%) |
| Bottled, Tank, or LP Gas | 940 (7.2%) | 409 (7.5%) |
| Electricity | 9,663 (74.3%) | 4,161 (76.1%) |
| Fuel Oil or Kerosene | 2 (0.0%) | 9 (0.2%) |
| Coal or Coke | 0 (0.0%) | 0 (0.0%) |
| All other Fuels | 294 (2.3%) | 29 (0.5%) |
| No Fuel Used | 54 (0.4%) | 48 (0.9%) |
| Total | 12,998 (100.0%) | 5,471 (100.0%) |
Household Vehicle Usage in Bedford County
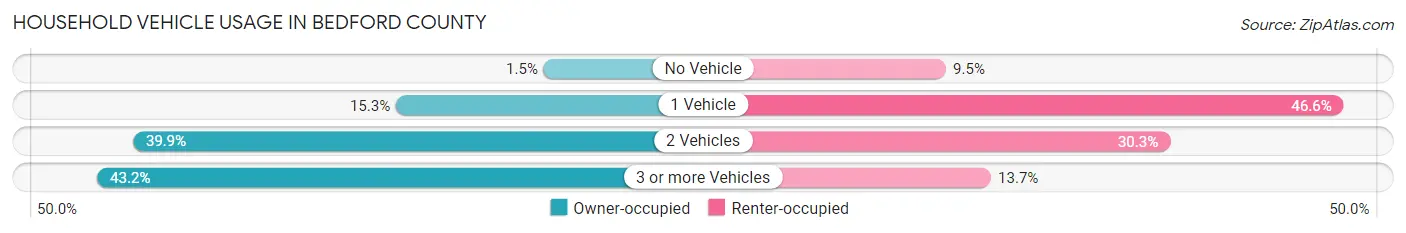
| Vehicles per Household | Owner-occupied | Renter-occupied |
| No Vehicle | 200 (1.5%) | 517 (9.5%) |
| 1 Vehicle | 1,993 (15.3%) | 2,547 (46.6%) |
| 2 Vehicles | 5,186 (39.9%) | 1,660 (30.3%) |
| 3 or more Vehicles | 5,619 (43.2%) | 747 (13.7%) |
| Total | 12,998 (100.0%) | 5,471 (100.0%) |
Real Estate & Mortgages in Bedford County
Real Estate and Mortgage Overview in Bedford County
| Characteristic | Without Mortgage | With Mortgage |
| Housing Units | 4,958 | 8,040 |
| Median Property Value | $198,400 | $229,300 |
| Median Household Income | $57,205 | $1,161 |
| Monthly Housing Costs | $456 | $428 |
| Real Estate Taxes | $1,157 | $113 |
Property Value by Mortgage Status in Bedford County

| Property Value | Without Mortgage | With Mortgage |
| Less than $50,000 | 289 (5.8%) | 103 (1.3%) |
| $50,000 to $99,999 | 878 (17.7%) | 746 (9.3%) |
| $100,000 to $299,999 | 2,337 (47.1%) | 4,659 (58.0%) |
| $300,000 to $499,999 | 690 (13.9%) | 1,697 (21.1%) |
| $500,000 to $749,999 | 440 (8.9%) | 531 (6.6%) |
| $750,000 to $999,999 | 91 (1.8%) | 235 (2.9%) |
| $1,000,000 or more | 233 (4.7%) | 69 (0.9%) |
| Total | 4,958 (100.0%) | 8,040 (100.0%) |
Household Income by Mortgage Status in Bedford County
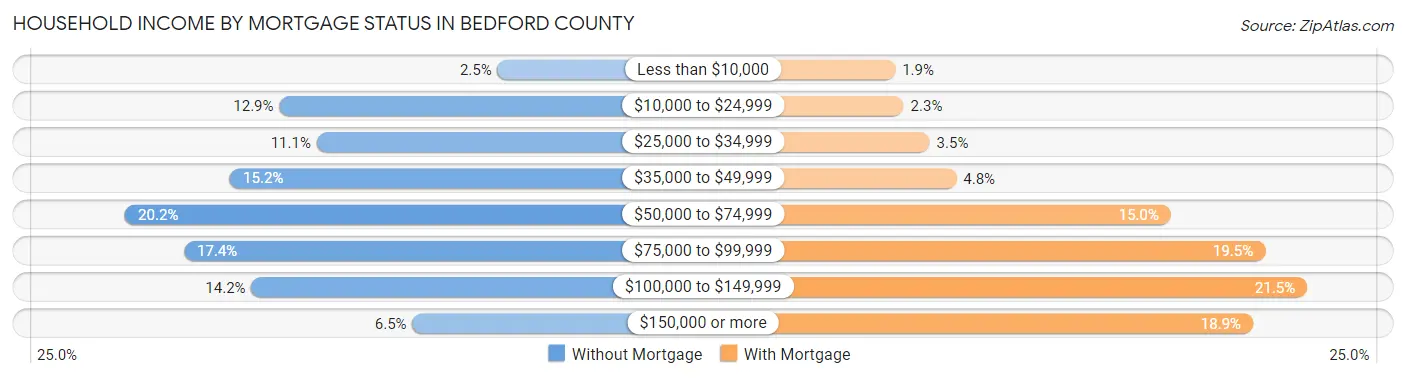
| Household Income | Without Mortgage | With Mortgage |
| Less than $10,000 | 123 (2.5%) | 152 (1.9%) |
| $10,000 to $24,999 | 638 (12.9%) | 184 (2.3%) |
| $25,000 to $34,999 | 550 (11.1%) | 284 (3.5%) |
| $35,000 to $49,999 | 754 (15.2%) | 386 (4.8%) |
| $50,000 to $74,999 | 1,002 (20.2%) | 1,207 (15.0%) |
| $75,000 to $99,999 | 863 (17.4%) | 1,568 (19.5%) |
| $100,000 to $149,999 | 704 (14.2%) | 1,729 (21.5%) |
| $150,000 or more | 324 (6.5%) | 1,521 (18.9%) |
| Total | 4,958 (100.0%) | 8,040 (100.0%) |
Property Value to Household Income Ratio in Bedford County

| Value-to-Income Ratio | Without Mortgage | With Mortgage |
| Less than 2.0x | 1,469 (29.6%) | 79,422 (987.8%) |
| 2.0x to 2.9x | 800 (16.1%) | 2,228 (27.7%) |
| 3.0x to 3.9x | 633 (12.8%) | 1,896 (23.6%) |
| 4.0x or more | 2,020 (40.7%) | 1,278 (15.9%) |
| Total | 4,958 (100.0%) | 8,040 (100.0%) |
Real Estate Taxes by Mortgage Status in Bedford County
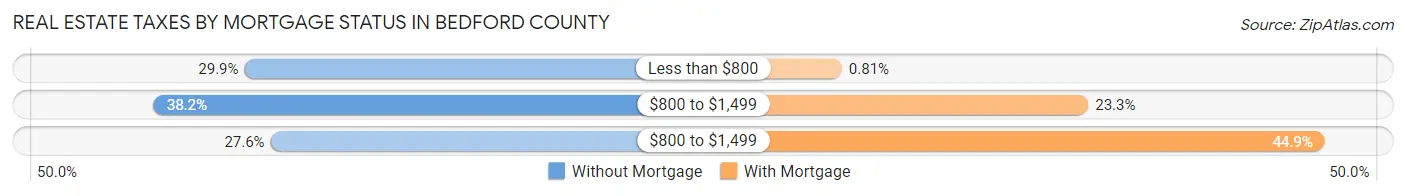
| Property Taxes | Without Mortgage | With Mortgage |
| Less than $800 | 1,484 (29.9%) | 65 (0.8%) |
| $800 to $1,499 | 1,894 (38.2%) | 1,874 (23.3%) |
| $800 to $1,499 | 1,366 (27.6%) | 3,610 (44.9%) |
| Total | 4,958 (100.0%) | 8,040 (100.0%) |
Health & Disability in Bedford County
Health Insurance Coverage by Age in Bedford County

| Age Bracket | With Coverage | Without Coverage |
| Under 6 Years | 3,750 (91.6%) | 344 (8.4%) |
| 6 to 18 Years | 8,203 (89.9%) | 924 (10.1%) |
| 19 to 25 Years | 3,235 (77.2%) | 953 (22.8%) |
| 26 to 34 Years | 4,825 (77.5%) | 1,401 (22.5%) |
| 35 to 44 Years | 5,000 (81.5%) | 1,132 (18.5%) |
| 45 to 54 Years | 5,263 (78.1%) | 1,475 (21.9%) |
| 55 to 64 Years | 5,645 (88.9%) | 703 (11.1%) |
| 65 to 74 Years | 4,356 (100.0%) | 0 (0.0%) |
| 75 Years and older | 2,860 (100.0%) | 0 (0.0%) |
| Total | 43,137 (86.2%) | 6,932 (13.8%) |
Health Insurance Coverage by Citizenship Status in Bedford County
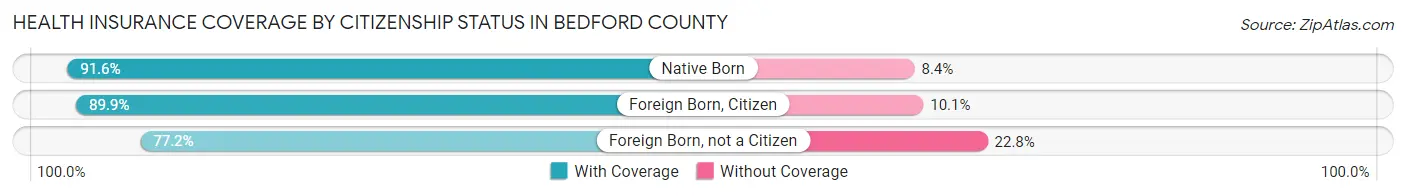
| Citizenship Status | With Coverage | Without Coverage |
| Native Born | 3,750 (91.6%) | 344 (8.4%) |
| Foreign Born, Citizen | 8,203 (89.9%) | 924 (10.1%) |
| Foreign Born, not a Citizen | 3,235 (77.2%) | 953 (22.8%) |
Health Insurance Coverage by Household Income in Bedford County

| Household Income | With Coverage | Without Coverage |
| Under $25,000 | 4,797 (81.8%) | 1,069 (18.2%) |
| $25,000 to $49,999 | 7,424 (80.3%) | 1,819 (19.7%) |
| $50,000 to $74,999 | 8,854 (83.0%) | 1,814 (17.0%) |
| $75,000 to $99,999 | 8,487 (90.3%) | 910 (9.7%) |
| $100,000 and over | 13,460 (91.3%) | 1,274 (8.6%) |
Public vs Private Health Insurance Coverage by Age in Bedford County
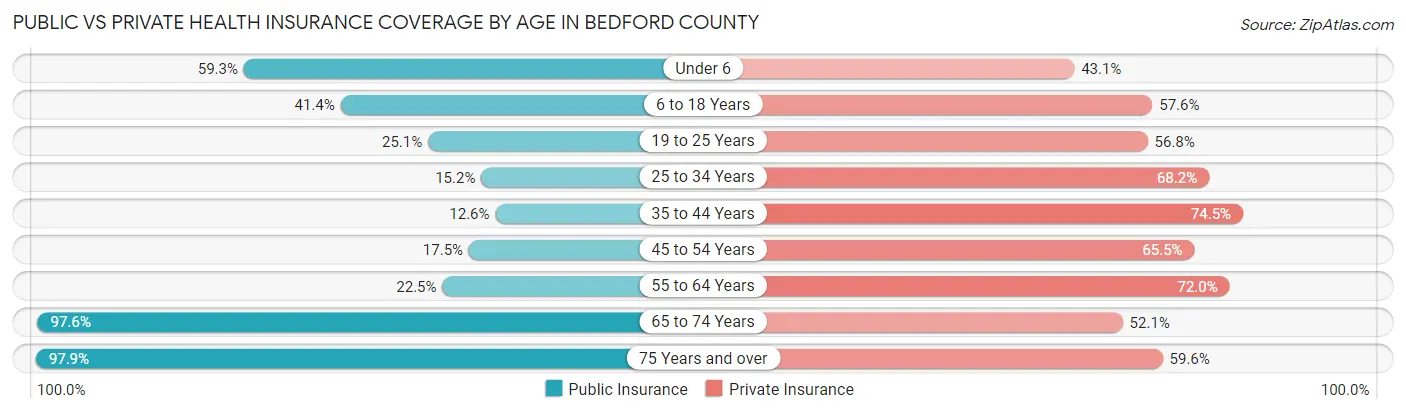
| Age Bracket | Public Insurance | Private Insurance |
| Under 6 | 2,428 (59.3%) | 1,766 (43.1%) |
| 6 to 18 Years | 3,775 (41.4%) | 5,260 (57.6%) |
| 19 to 25 Years | 1,052 (25.1%) | 2,377 (56.8%) |
| 25 to 34 Years | 949 (15.2%) | 4,243 (68.1%) |
| 35 to 44 Years | 774 (12.6%) | 4,565 (74.5%) |
| 45 to 54 Years | 1,181 (17.5%) | 4,410 (65.4%) |
| 55 to 64 Years | 1,426 (22.5%) | 4,568 (72.0%) |
| 65 to 74 Years | 4,251 (97.6%) | 2,271 (52.1%) |
| 75 Years and over | 2,800 (97.9%) | 1,703 (59.6%) |
| Total | 18,636 (37.2%) | 31,163 (62.2%) |
Disability Status by Sex by Age in Bedford County
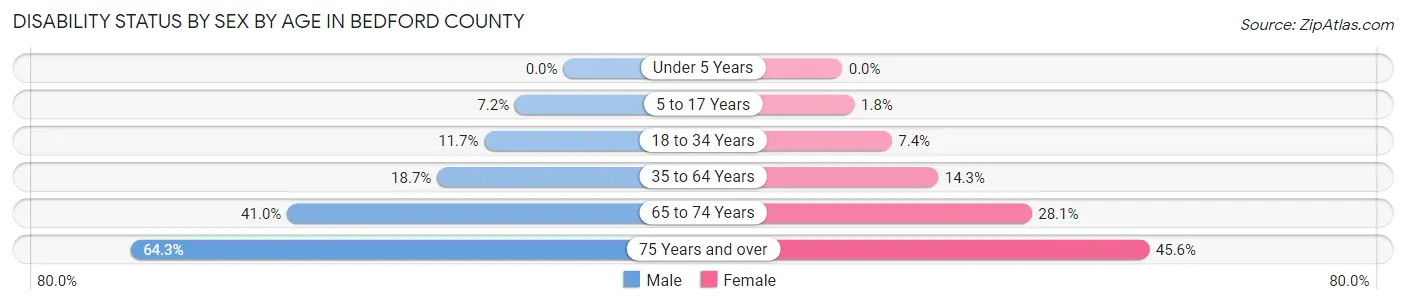
| Age Bracket | Male | Female |
| Under 5 Years | 0 (0.0%) | 0 (0.0%) |
| 5 to 17 Years | 336 (7.2%) | 86 (1.8%) |
| 18 to 34 Years | 683 (11.7%) | 379 (7.4%) |
| 35 to 64 Years | 1,781 (18.7%) | 1,384 (14.2%) |
| 65 to 74 Years | 839 (41.0%) | 650 (28.1%) |
| 75 Years and over | 845 (64.3%) | 705 (45.6%) |
Disability Class by Sex by Age in Bedford County
Disability Class: Hearing Difficulty

| Age Bracket | Male | Female |
| Under 5 Years | 0 (0.0%) | 0 (0.0%) |
| 5 to 17 Years | 79 (1.7%) | 0 (0.0%) |
| 18 to 34 Years | 93 (1.6%) | 85 (1.7%) |
| 35 to 64 Years | 425 (4.5%) | 242 (2.5%) |
| 65 to 74 Years | 396 (19.4%) | 100 (4.3%) |
| 75 Years and over | 432 (32.9%) | 252 (16.3%) |
Disability Class: Vision Difficulty
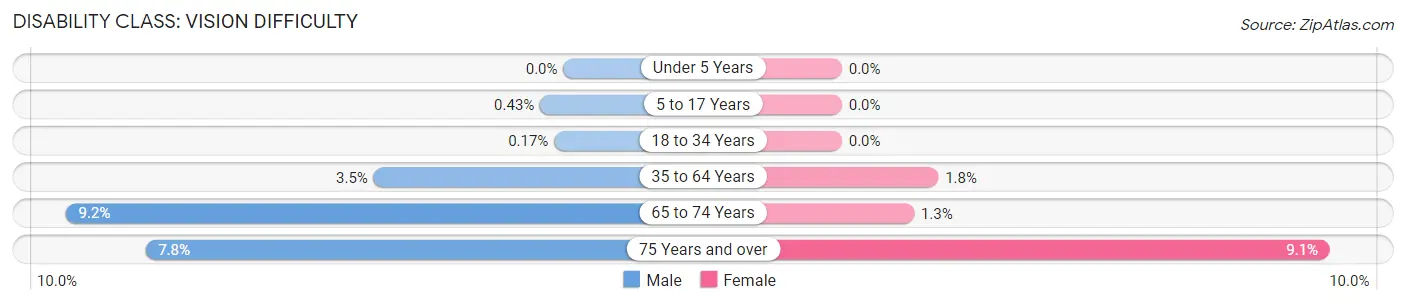
| Age Bracket | Male | Female |
| Under 5 Years | 0 (0.0%) | 0 (0.0%) |
| 5 to 17 Years | 20 (0.4%) | 0 (0.0%) |
| 18 to 34 Years | 10 (0.2%) | 0 (0.0%) |
| 35 to 64 Years | 335 (3.5%) | 174 (1.8%) |
| 65 to 74 Years | 189 (9.2%) | 31 (1.3%) |
| 75 Years and over | 102 (7.8%) | 140 (9.1%) |
Disability Class: Cognitive Difficulty
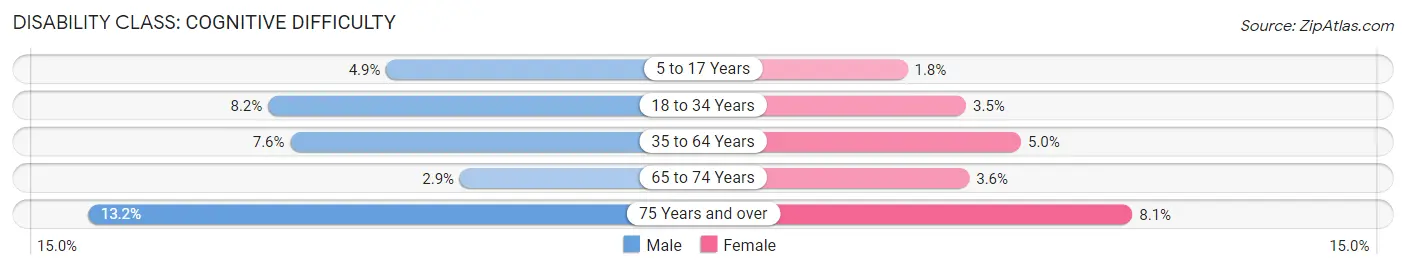
| Age Bracket | Male | Female |
| 5 to 17 Years | 231 (4.9%) | 86 (1.8%) |
| 18 to 34 Years | 478 (8.2%) | 178 (3.5%) |
| 35 to 64 Years | 722 (7.6%) | 485 (5.0%) |
| 65 to 74 Years | 59 (2.9%) | 82 (3.5%) |
| 75 Years and over | 174 (13.2%) | 125 (8.1%) |
Disability Class: Ambulatory Difficulty
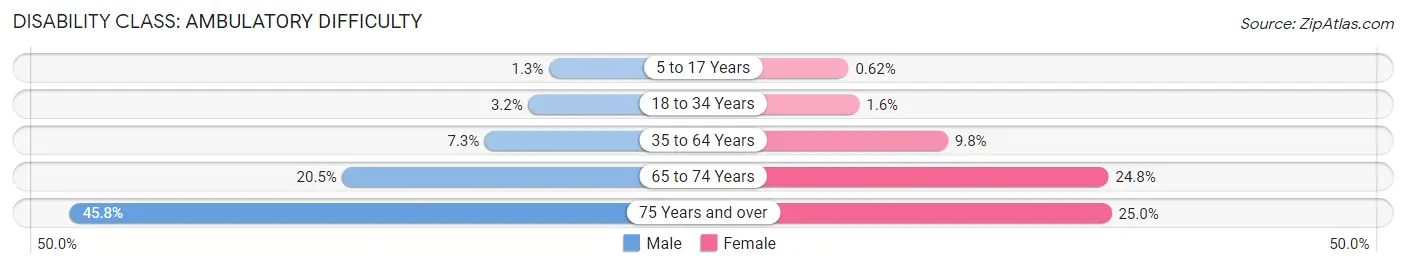
| Age Bracket | Male | Female |
| 5 to 17 Years | 62 (1.3%) | 29 (0.6%) |
| 18 to 34 Years | 188 (3.2%) | 84 (1.6%) |
| 35 to 64 Years | 691 (7.3%) | 956 (9.8%) |
| 65 to 74 Years | 419 (20.5%) | 572 (24.8%) |
| 75 Years and over | 602 (45.8%) | 387 (25.0%) |
Disability Class: Self-Care Difficulty
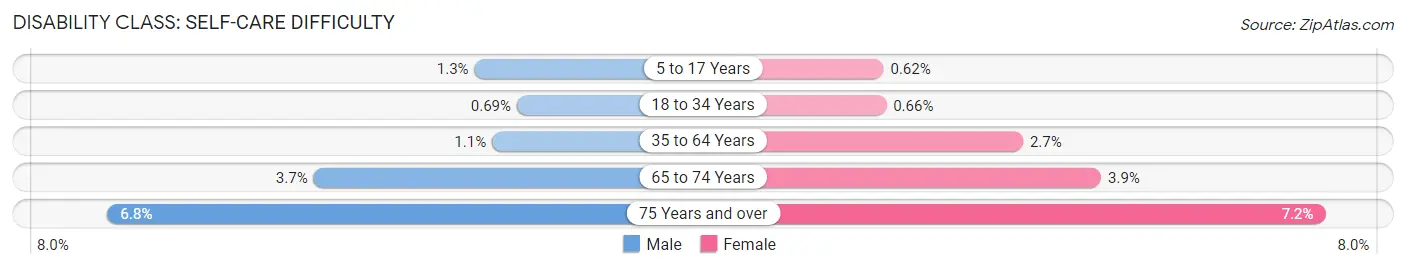
| Age Bracket | Male | Female |
| 5 to 17 Years | 62 (1.3%) | 29 (0.6%) |
| 18 to 34 Years | 40 (0.7%) | 34 (0.7%) |
| 35 to 64 Years | 101 (1.1%) | 261 (2.7%) |
| 65 to 74 Years | 76 (3.7%) | 89 (3.8%) |
| 75 Years and over | 89 (6.8%) | 111 (7.2%) |
Technology Access in Bedford County
Computing Device Access in Bedford County
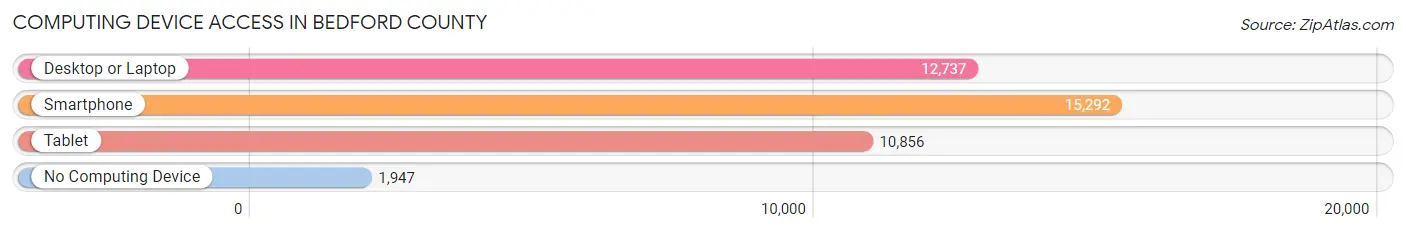
| Device Type | # Households | % Households |
| Desktop or Laptop | 12,737 | 69.0% |
| Smartphone | 15,292 | 82.8% |
| Tablet | 10,856 | 58.8% |
| No Computing Device | 1,947 | 10.5% |
| Total | 18,469 | 100.0% |
Internet Access in Bedford County
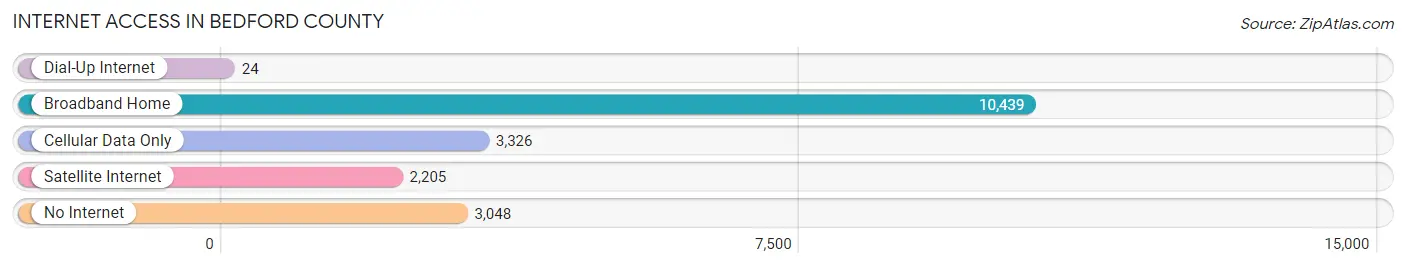
| Internet Type | # Households | % Households |
| Dial-Up Internet | 24 | 0.1% |
| Broadband Home | 10,439 | 56.5% |
| Cellular Data Only | 3,326 | 18.0% |
| Satellite Internet | 2,205 | 11.9% |
| No Internet | 3,048 | 16.5% |
| Total | 18,469 | 100.0% |
Bedford County Summary
Bedford County is located in the state of Tennessee in the United States. It is situated in the south-central part of the state, and is bordered by Moore County to the north, Marshall County to the east, Rutherford County to the south, and Coffee and Franklin Counties to the west. The county seat is Shelbyville, and the largest city is Shelbyville. As of the 2010 census, the population of Bedford County was 45,058.
Geography
Bedford County is located in the Highland Rim region of Tennessee, and is characterized by rolling hills and valleys. The Duck River, which is the longest river in the state, runs through the county. The county is also home to several lakes, including Normandy Lake, Tims Ford Lake, and Woods Reservoir. The county has a total area of 517 square miles, of which 514 square miles is land and 3 square miles is water.
History
Bedford County was established in 1807 from parts of Rutherford and Lincoln Counties. It was named after Thomas Bedford, a Revolutionary War veteran and early settler of the area. The county was initially divided into three districts, but was later divided into five districts.
The county was home to several Native American tribes, including the Chickasaw, Cherokee, and Shawnee. The first European settlers arrived in the area in the late 1700s, and the county was officially established in 1807.
During the Civil War, Bedford County was the site of several battles, including the Battle of Shelbyville and the Battle of Bell Buckle. After the war, the county experienced a period of economic growth, with the development of the railroad and the establishment of several factories.
Economy
The economy of Bedford County is largely based on agriculture and manufacturing. The county is home to several large farms, and is a major producer of soybeans, corn, and hay. The county is also home to several manufacturing companies, including a large automotive parts plant and a furniture factory.
The county is also home to several tourist attractions, including the Tennessee Walking Horse National Celebration, the Shelbyville Horse Show, and the Tennessee Walking Horse Museum.
Demographics
As of the 2010 census, the population of Bedford County was 45,058. The racial makeup of the county was 87.3% White, 8.7% African American, 0.4% Native American, 0.7% Asian, 0.1% Pacific Islander, 1.3% from other races, and 1.5% from two or more races. Hispanic or Latino of any race were 3.2% of the population.
The median income for a household in the county was $41,945, and the median income for a family was $50,945. The per capita income for the county was $20,945. About 11.3% of families and 14.7% of the population were below the poverty line, including 19.2% of those under age 18 and 11.2% of those age 65 or over.
Common Questions
What is the Total Population of Bedford County?
Total Population of Bedford County is 50,533.
What is the Total Male Population of Bedford County?
Total Male Population of Bedford County is 25,432.
What is the Total Female Population of Bedford County?
Total Female Population of Bedford County is 25,101.
What is the Ratio of Males per 100 Females in Bedford County?
There are 101.32 Males per 100 Females in Bedford County.
What is the Ratio of Females per 100 Males in Bedford County?
There are 98.70 Females per 100 Males in Bedford County.
What is the Median Population Age in Bedford County?
Median Population Age in Bedford County is 37.9 Years.
What is the Average Family Size in Bedford County
Average Family Size in Bedford County is 3.2 People.
What is the Average Household Size in Bedford County
Average Household Size in Bedford County is 2.7 People.
What is Per Capita Income in Bedford County?
Per Capita income in Bedford County is $28,520.
What is the Median Family Income in Bedford County?
Median Family Income in Bedford County is $71,159.
What is the Median Household income in Bedford County?
Median Household Income in Bedford County is $59,955.
What is Income or Wage Gap in Bedford County?
Income or Wage Gap in Bedford County is 24.2%.
Women in Bedford County earn 75.8 cents for every dollar earned by a man.
What is Family Income Deficit in Bedford County?
Family Income Deficit in Bedford County is $9,385.
Families that are below poverty line in Bedford County earn $9,385 less on average than the poverty threshold level.
What is Inequality or Gini Index in Bedford County?
Inequality or Gini Index in Bedford County is 0.41.
How Large is the Labor Force in Bedford County?
There are 24,456 People in the Labor Forcein in Bedford County.
What is the Percentage of People in the Labor Force in Bedford County?
62.1% of People are in the Labor Force in Bedford County.
What is the Unemployment Rate in Bedford County?
Unemployment Rate in Bedford County is 4.6%.