Anderson County, TN
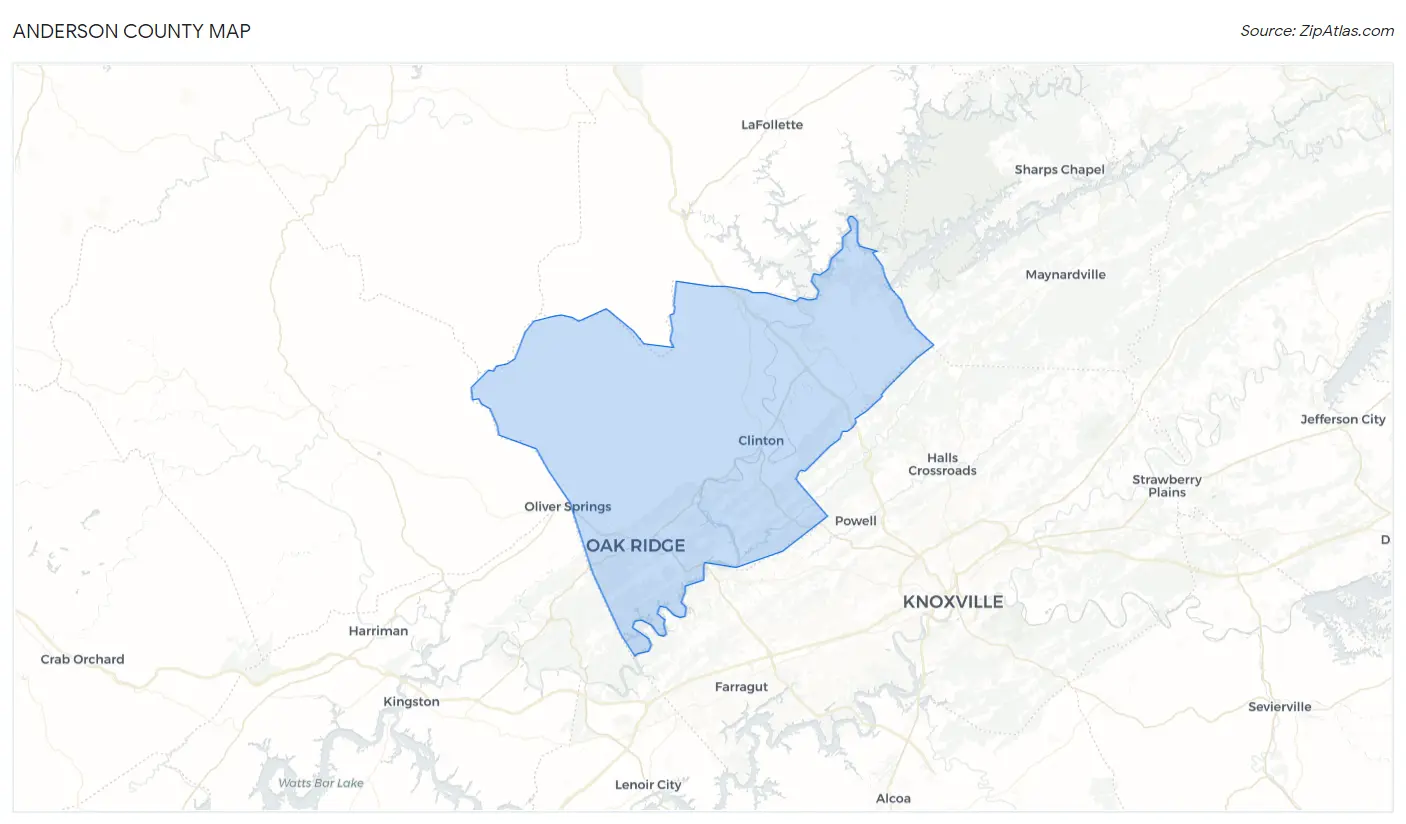
Anderson County Map
Anderson County Overview
77,337
TOTAL POPULATION
37,953
MALE POPULATION
39,384
FEMALE POPULATION
96.37
MALES / 100 FEMALES
103.77
FEMALES / 100 MALES
42.1
MEDIAN AGE
3.0
AVG FAMILY SIZE
2.4
AVG HOUSEHOLD SIZE
$32,803
PER CAPITA INCOME
$75,637
AVG FAMILY INCOME
$60,633
AVG HOUSEHOLD INCOME
25.9%
WAGE / INCOME GAP [ % ]
74.1¢/ $1
WAGE / INCOME GAP [ $ ]
$10,027
FAMILY INCOME DEFICIT
0.45
INEQUALITY / GINI INDEX
34,917
LABOR FORCE [ PEOPLE ]
55.6%
PERCENT IN LABOR FORCE
5.4%
UNEMPLOYMENT RATE
Anderson County Area Codes
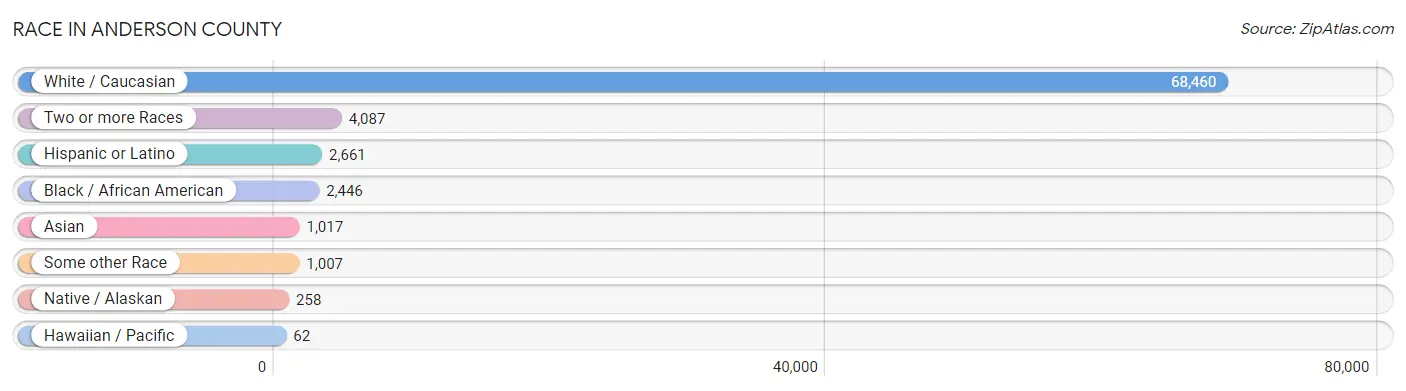
Race in Anderson County
The most populous races in Anderson County are White / Caucasian (68,460 | 88.5%), Two or more Races (4,087 | 5.3%), and Hispanic or Latino (2,661 | 3.4%).
| Race | # Population | % Population |
| Asian | 1,017 | 1.3% |
| Black / African American | 2,446 | 3.2% |
| Hawaiian / Pacific | 62 | 0.1% |
| Hispanic or Latino | 2,661 | 3.4% |
| Native / Alaskan | 258 | 0.3% |
| White / Caucasian | 68,460 | 88.5% |
| Two or more Races | 4,087 | 5.3% |
| Some other Race | 1,007 | 1.3% |
| Total | 77,337 | 100.0% |
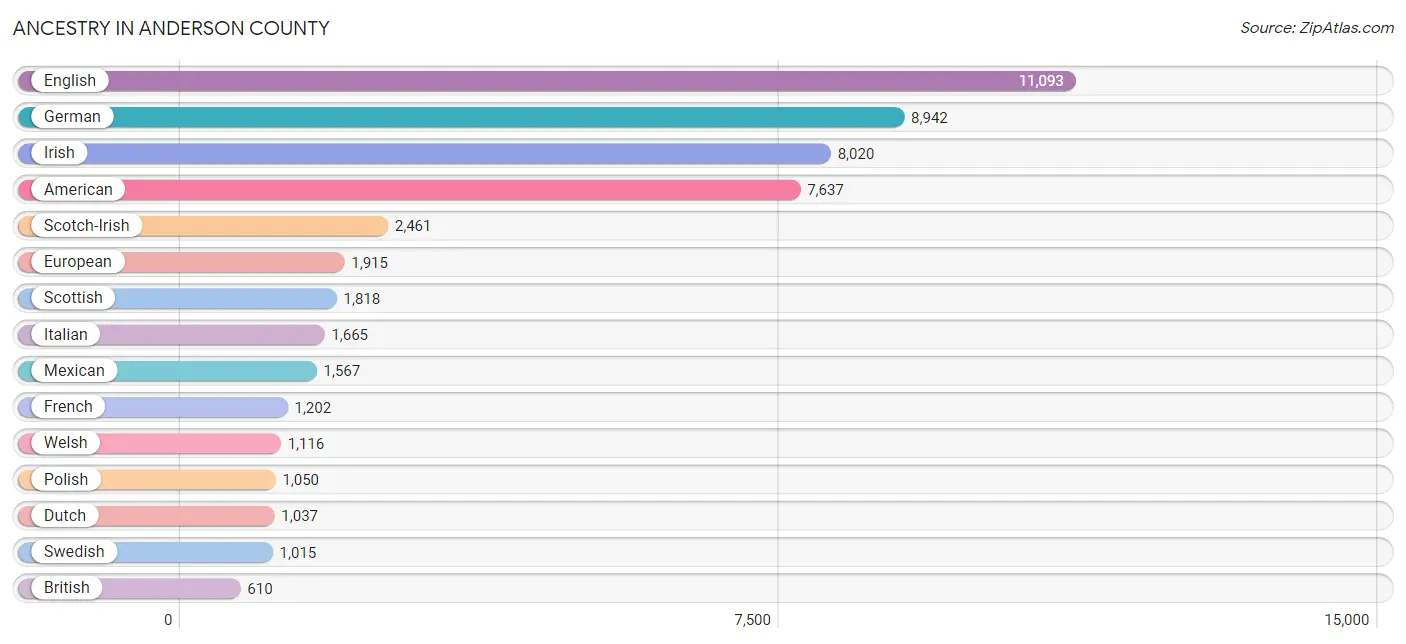
Ancestry in Anderson County
The most populous ancestries reported in Anderson County are English (11,093 | 14.3%), German (8,942 | 11.6%), Irish (8,020 | 10.4%), American (7,637 | 9.9%), and Scotch-Irish (2,461 | 3.2%), together accounting for 49.3% of all Anderson County residents.
| Ancestry | # Population | % Population |
| African | 231 | 0.3% |
| Alaska Native | 26 | 0.0% |
| American | 7,637 | 9.9% |
| Arab | 117 | 0.2% |
| Argentinean | 21 | 0.0% |
| Armenian | 21 | 0.0% |
| Austrian | 32 | 0.0% |
| Belgian | 8 | 0.0% |
| Bhutanese | 54 | 0.1% |
| Blackfeet | 30 | 0.0% |
| Brazilian | 78 | 0.1% |
| British | 610 | 0.8% |
| British West Indian | 14 | 0.0% |
| Burmese | 209 | 0.3% |
| Cajun | 8 | 0.0% |
| Canadian | 104 | 0.1% |
| Central American | 551 | 0.7% |
| Central American Indian | 62 | 0.1% |
| Cherokee | 348 | 0.4% |
| Cheyenne | 4 | 0.0% |
| Choctaw | 26 | 0.0% |
| Comanche | 19 | 0.0% |
| Cuban | 227 | 0.3% |
| Czech | 132 | 0.2% |
| Czechoslovakian | 38 | 0.1% |
| Danish | 91 | 0.1% |
| Dominican | 8 | 0.0% |
| Dutch | 1,037 | 1.3% |
| Dutch West Indian | 38 | 0.1% |
| Eastern European | 168 | 0.2% |
| Egyptian | 66 | 0.1% |
| English | 11,093 | 14.3% |
| European | 1,915 | 2.5% |
| Filipino | 23 | 0.0% |
| Finnish | 22 | 0.0% |
| French | 1,202 | 1.5% |
| French Canadian | 249 | 0.3% |
| German | 8,942 | 11.6% |
| German Russian | 27 | 0.0% |
| Ghanaian | 7 | 0.0% |
| Greek | 99 | 0.1% |
| Guatemalan | 91 | 0.1% |
| Honduran | 344 | 0.4% |
| Hopi | 4 | 0.0% |
| Hungarian | 136 | 0.2% |
| Indian (Asian) | 420 | 0.5% |
| Inupiat | 5 | 0.0% |
| Iranian | 9 | 0.0% |
| Irish | 8,020 | 10.4% |
| Italian | 1,665 | 2.1% |
| Jamaican | 14 | 0.0% |
| Japanese | 14 | 0.0% |
| Kenyan | 6 | 0.0% |
| Korean | 257 | 0.3% |
| Latvian | 10 | 0.0% |
| Lebanese | 16 | 0.0% |
| Liberian | 45 | 0.1% |
| Lithuanian | 58 | 0.1% |
| Mexican | 1,567 | 2.0% |
| Mexican American Indian | 25 | 0.0% |
| Moroccan | 12 | 0.0% |
| Native Hawaiian | 65 | 0.1% |
| Navajo | 17 | 0.0% |
| Northern European | 358 | 0.5% |
| Norwegian | 320 | 0.4% |
| Pakistani | 84 | 0.1% |
| Peruvian | 113 | 0.2% |
| Polish | 1,050 | 1.4% |
| Portuguese | 40 | 0.1% |
| Puerto Rican | 107 | 0.1% |
| Romanian | 145 | 0.2% |
| Russian | 508 | 0.7% |
| Salvadoran | 116 | 0.2% |
| Samoan | 12 | 0.0% |
| Scandinavian | 113 | 0.2% |
| Scotch-Irish | 2,461 | 3.2% |
| Scottish | 1,818 | 2.4% |
| Sioux | 3 | 0.0% |
| Slovak | 48 | 0.1% |
| South African | 83 | 0.1% |
| South American | 141 | 0.2% |
| South American Indian | 23 | 0.0% |
| Spaniard | 16 | 0.0% |
| Spanish | 13 | 0.0% |
| Sri Lankan | 87 | 0.1% |
| Subsaharan African | 409 | 0.5% |
| Swedish | 1,015 | 1.3% |
| Swiss | 191 | 0.3% |
| Syrian | 23 | 0.0% |
| Thai | 160 | 0.2% |
| Ukrainian | 31 | 0.0% |
| Uruguayan | 7 | 0.0% |
| Vietnamese | 20 | 0.0% |
| Welsh | 1,116 | 1.4% |
| West Indian | 74 | 0.1% | View All 95 Rows |
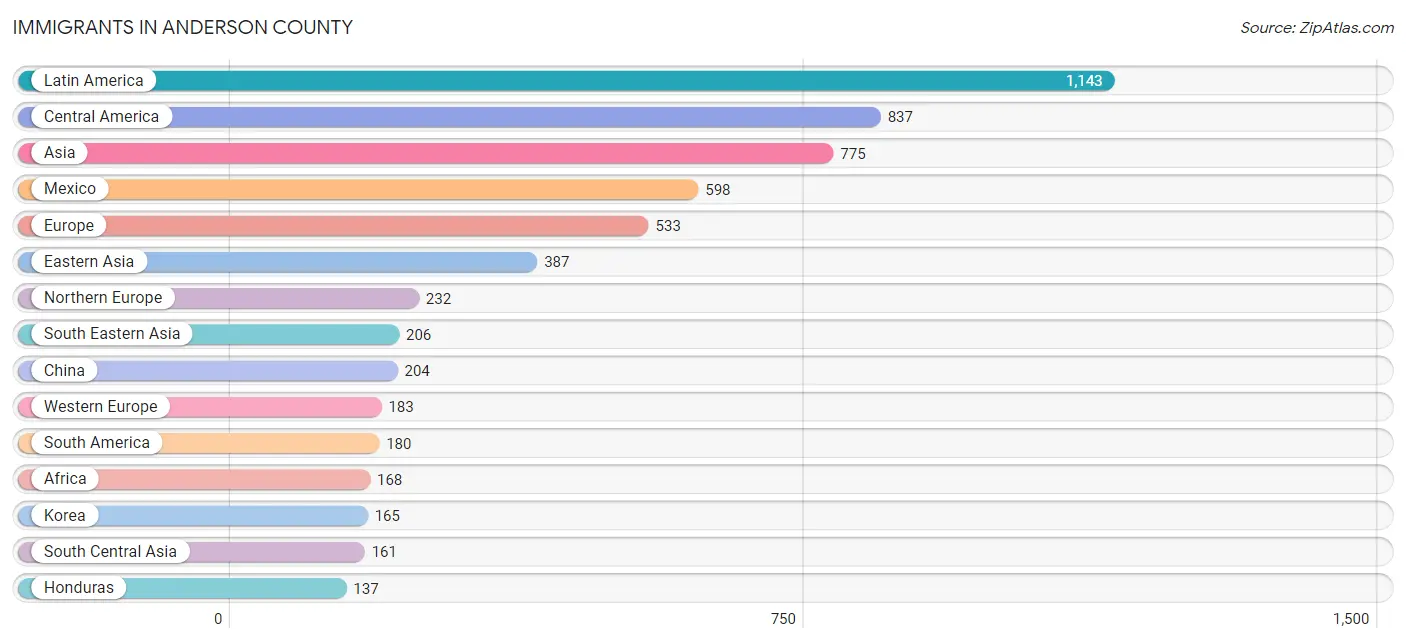
Immigrants in Anderson County
The most numerous immigrant groups reported in Anderson County came from Latin America (1,143 | 1.5%), Central America (837 | 1.1%), Asia (775 | 1.0%), Mexico (598 | 0.8%), and Europe (533 | 0.7%), together accounting for 5.0% of all Anderson County residents.
| Immigration Origin | # Population | % Population |
| Africa | 168 | 0.2% |
| Argentina | 22 | 0.0% |
| Armenia | 21 | 0.0% |
| Asia | 775 | 1.0% |
| Bangladesh | 20 | 0.0% |
| Brazil | 78 | 0.1% |
| Canada | 60 | 0.1% |
| Caribbean | 126 | 0.2% |
| Central America | 837 | 1.1% |
| China | 204 | 0.3% |
| Cuba | 80 | 0.1% |
| Czechoslovakia | 26 | 0.0% |
| Denmark | 33 | 0.0% |
| Eastern Africa | 6 | 0.0% |
| Eastern Asia | 387 | 0.5% |
| Eastern Europe | 95 | 0.1% |
| Egypt | 15 | 0.0% |
| El Salvador | 46 | 0.1% |
| England | 92 | 0.1% |
| Europe | 533 | 0.7% |
| France | 46 | 0.1% |
| Germany | 114 | 0.2% |
| Ghana | 7 | 0.0% |
| Greece | 23 | 0.0% |
| Guatemala | 50 | 0.1% |
| Haiti | 7 | 0.0% |
| Honduras | 137 | 0.2% |
| Hungary | 18 | 0.0% |
| India | 129 | 0.2% |
| Iran | 9 | 0.0% |
| Ireland | 6 | 0.0% |
| Jamaica | 21 | 0.0% |
| Japan | 18 | 0.0% |
| Kenya | 6 | 0.0% |
| Korea | 165 | 0.2% |
| Laos | 11 | 0.0% |
| Latin America | 1,143 | 1.5% |
| Liberia | 45 | 0.1% |
| Mexico | 598 | 0.8% |
| Morocco | 12 | 0.0% |
| Netherlands | 5 | 0.0% |
| Northern Africa | 27 | 0.0% |
| Northern Europe | 232 | 0.3% |
| Panama | 6 | 0.0% |
| Peru | 65 | 0.1% |
| Philippines | 64 | 0.1% |
| Russia | 27 | 0.0% |
| South Africa | 83 | 0.1% |
| South America | 180 | 0.2% |
| South Central Asia | 161 | 0.2% |
| South Eastern Asia | 206 | 0.3% |
| Southern Europe | 23 | 0.0% |
| Sri Lanka | 3 | 0.0% |
| Sweden | 19 | 0.0% |
| Switzerland | 18 | 0.0% |
| Taiwan | 33 | 0.0% |
| Thailand | 44 | 0.1% |
| Ukraine | 16 | 0.0% |
| Uruguay | 7 | 0.0% |
| Venezuela | 8 | 0.0% |
| Vietnam | 87 | 0.1% |
| Western Africa | 52 | 0.1% |
| Western Asia | 21 | 0.0% |
| Western Europe | 183 | 0.2% | View All 64 Rows |
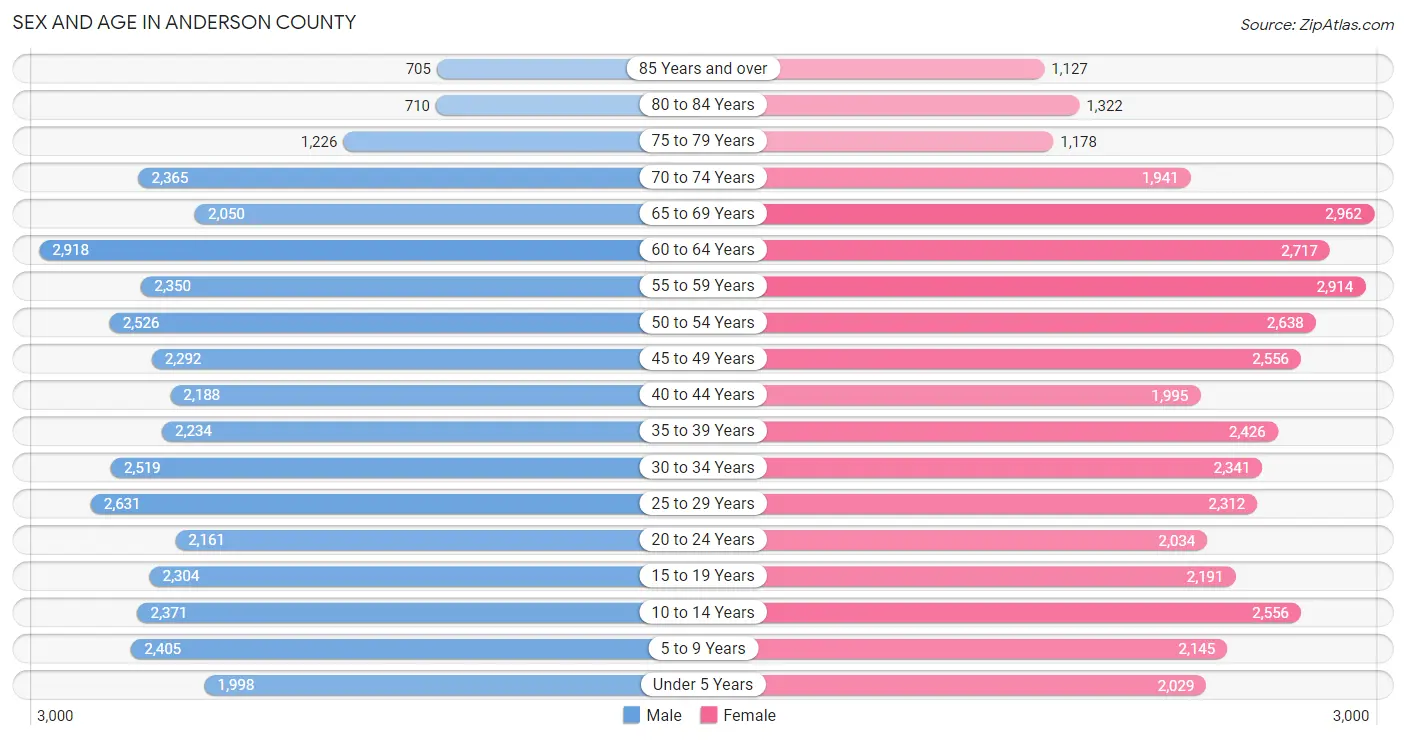
Sex and Age in Anderson County
Sex and Age in Anderson County
The most populous age groups in Anderson County are 60 to 64 Years (2,918 | 7.7%) for men and 65 to 69 Years (2,962 | 7.5%) for women.
| Age Bracket | Male | Female |
| Under 5 Years | 1,998 (5.3%) | 2,029 (5.1%) |
| 5 to 9 Years | 2,405 (6.3%) | 2,145 (5.4%) |
| 10 to 14 Years | 2,371 (6.2%) | 2,556 (6.5%) |
| 15 to 19 Years | 2,304 (6.1%) | 2,191 (5.6%) |
| 20 to 24 Years | 2,161 (5.7%) | 2,034 (5.2%) |
| 25 to 29 Years | 2,631 (6.9%) | 2,312 (5.9%) |
| 30 to 34 Years | 2,519 (6.6%) | 2,341 (5.9%) |
| 35 to 39 Years | 2,234 (5.9%) | 2,426 (6.2%) |
| 40 to 44 Years | 2,188 (5.8%) | 1,995 (5.1%) |
| 45 to 49 Years | 2,292 (6.0%) | 2,556 (6.5%) |
| 50 to 54 Years | 2,526 (6.7%) | 2,638 (6.7%) |
| 55 to 59 Years | 2,350 (6.2%) | 2,914 (7.4%) |
| 60 to 64 Years | 2,918 (7.7%) | 2,717 (6.9%) |
| 65 to 69 Years | 2,050 (5.4%) | 2,962 (7.5%) |
| 70 to 74 Years | 2,365 (6.2%) | 1,941 (4.9%) |
| 75 to 79 Years | 1,226 (3.2%) | 1,178 (3.0%) |
| 80 to 84 Years | 710 (1.9%) | 1,322 (3.4%) |
| 85 Years and over | 705 (1.9%) | 1,127 (2.9%) |
| Total | 37,953 (100.0%) | 39,384 (100.0%) |
Families and Households in Anderson County
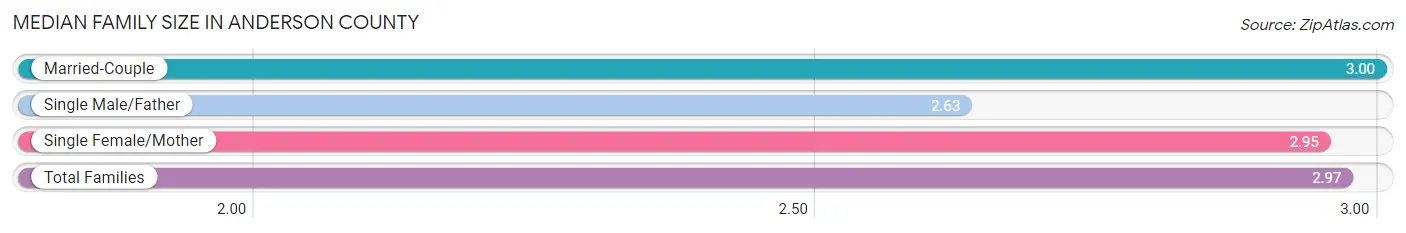
Median Family Size in Anderson County
The median family size in Anderson County is 2.97 persons per family, with married-couple families (15,335 | 75.1%) accounting for the largest median family size of 3 persons per family. On the other hand, single male/father families (1,395 | 6.8%) represent the smallest median family size with 2.63 persons per family.
| Family Type | # Families | Family Size |
| Married-Couple | 15,335 (75.1%) | 3.00 |
| Single Male/Father | 1,395 (6.8%) | 2.63 |
| Single Female/Mother | 3,678 (18.0%) | 2.95 |
| Total Families | 20,408 (100.0%) | 2.97 |
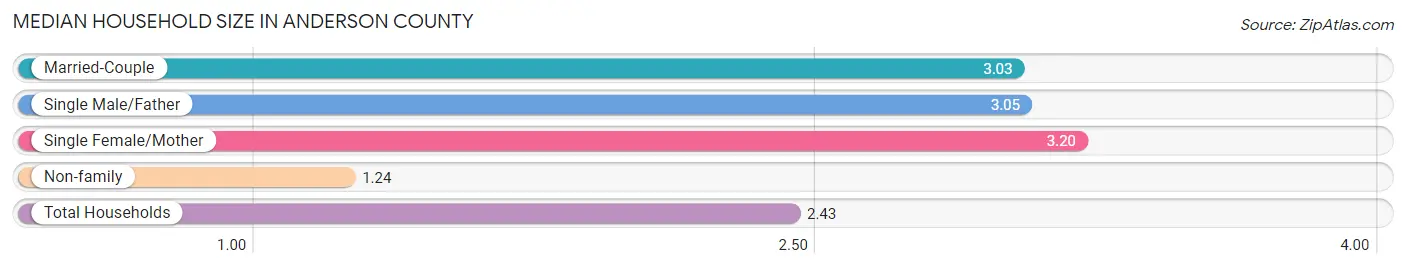
Median Household Size in Anderson County
The median household size in Anderson County is 2.43 persons per household, with single female/mother households (3,678 | 11.8%) accounting for the largest median household size of 3.2 persons per household. non-family households (10,867 | 34.7%) represent the smallest median household size with 1.24 persons per household.
| Household Type | # Households | Household Size |
| Married-Couple | 15,335 (49.0%) | 3.03 |
| Single Male/Father | 1,395 (4.5%) | 3.05 |
| Single Female/Mother | 3,678 (11.8%) | 3.20 |
| Non-family | 10,867 (34.7%) | 1.24 |
| Total Households | 31,275 (100.0%) | 2.43 |
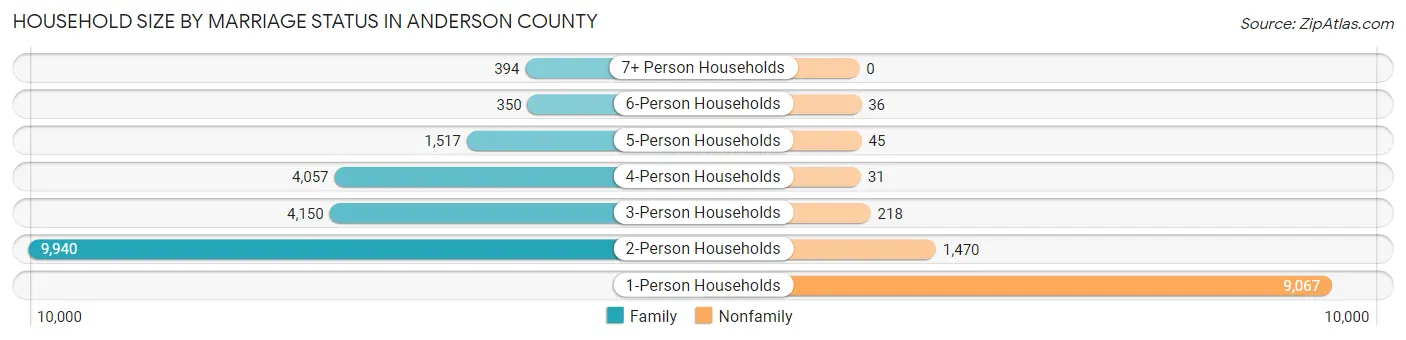
Household Size by Marriage Status in Anderson County
Out of a total of 31,275 households in Anderson County, 20,408 (65.2%) are family households, while 10,867 (34.7%) are nonfamily households. The most numerous type of family households are 2-person households, comprising 9,940, and the most common type of nonfamily households are 1-person households, comprising 9,067.
| Household Size | Family Households | Nonfamily Households |
| 1-Person Households | - | 9,067 (29.0%) |
| 2-Person Households | 9,940 (31.8%) | 1,470 (4.7%) |
| 3-Person Households | 4,150 (13.3%) | 218 (0.7%) |
| 4-Person Households | 4,057 (13.0%) | 31 (0.1%) |
| 5-Person Households | 1,517 (4.9%) | 45 (0.1%) |
| 6-Person Households | 350 (1.1%) | 36 (0.1%) |
| 7+ Person Households | 394 (1.3%) | 0 (0.0%) |
| Total | 20,408 (65.2%) | 10,867 (34.7%) |
Female Fertility in Anderson County
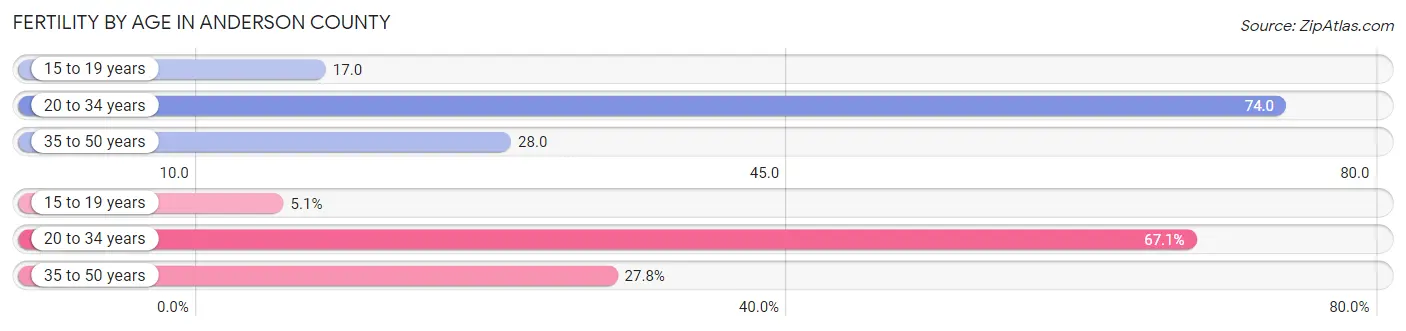
Fertility by Age in Anderson County
Average fertility rate in Anderson County is 45.0 births per 1,000 women. Women in the age bracket of 20 to 34 years have the highest fertility rate with 74.0 births per 1,000 women. Women in the age bracket of 20 to 34 years acount for 67.1% of all women with births.
| Age Bracket | Women with Births | Births / 1,000 Women |
| 15 to 19 years | 38 (5.1%) | 17.0 |
| 20 to 34 years | 497 (67.1%) | 74.0 |
| 35 to 50 years | 206 (27.8%) | 28.0 |
| Total | 741 (100.0%) | 45.0 |
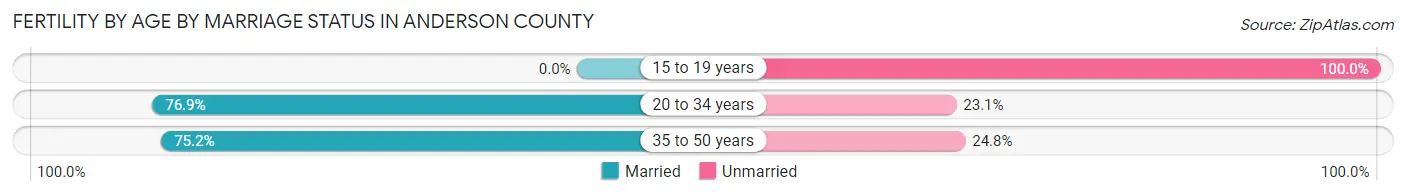
Fertility by Age by Marriage Status in Anderson County
72.5% of women with births (741) in Anderson County are married. The highest percentage of unmarried women with births falls into 15 to 19 years age bracket with 100.0% of them unmarried at the time of birth, while the lowest percentage of unmarried women with births belong to 20 to 34 years age bracket with 23.1% of them unmarried.
| Age Bracket | Married | Unmarried |
| 15 to 19 years | 0 (0.0%) | 38 (100.0%) |
| 20 to 34 years | 382 (76.9%) | 115 (23.1%) |
| 35 to 50 years | 155 (75.2%) | 51 (24.8%) |
| Total | 537 (72.5%) | 204 (27.5%) |
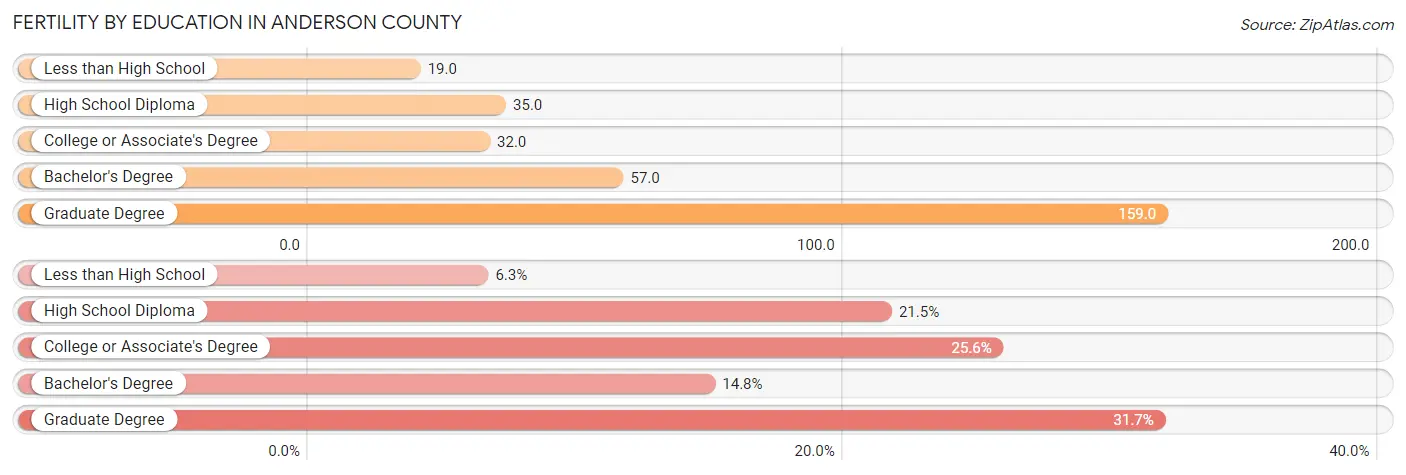
Fertility by Education in Anderson County
Average fertility rate in Anderson County is 45.0 births per 1,000 women. Women with the education attainment of graduate degree have the highest fertility rate of 159.0 births per 1,000 women, while women with the education attainment of less than high school have the lowest fertility at 19.0 births per 1,000 women. Women with the education attainment of graduate degree represent 31.7% of all women with births.
| Educational Attainment | Women with Births | Births / 1,000 Women |
| Less than High School | 47 (6.3%) | 19.0 |
| High School Diploma | 159 (21.5%) | 35.0 |
| College or Associate's Degree | 190 (25.6%) | 32.0 |
| Bachelor's Degree | 110 (14.8%) | 57.0 |
| Graduate Degree | 235 (31.7%) | 159.0 |
| Total | 741 (100.0%) | 45.0 |
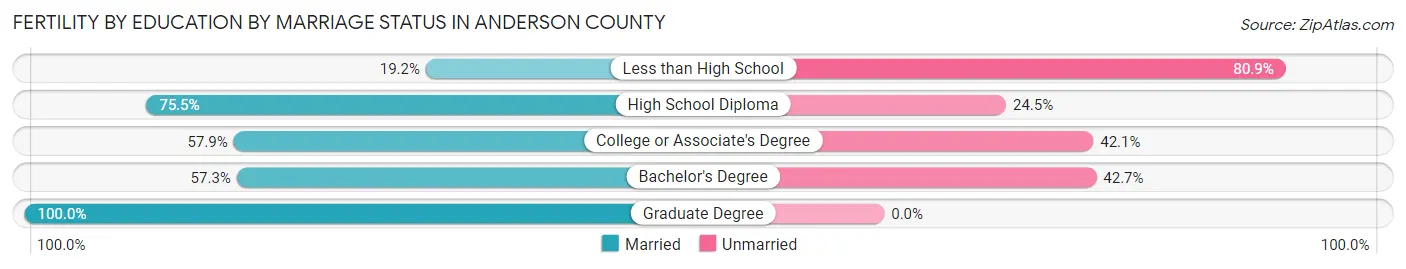
Fertility by Education by Marriage Status in Anderson County
27.5% of women with births in Anderson County are unmarried. Women with the educational attainment of graduate degree are most likely to be married with 100.0% of them married at childbirth, while women with the educational attainment of less than high school are least likely to be married with 80.8% of them unmarried at childbirth.
| Educational Attainment | Married | Unmarried |
| Less than High School | 9 (19.2%) | 38 (80.8%) |
| High School Diploma | 120 (75.5%) | 39 (24.5%) |
| College or Associate's Degree | 110 (57.9%) | 80 (42.1%) |
| Bachelor's Degree | 63 (57.3%) | 47 (42.7%) |
| Graduate Degree | 235 (100.0%) | 0 (0.0%) |
| Total | 537 (72.5%) | 204 (27.5%) |
Income in Anderson County
Income Overview in Anderson County
Per Capita Income in Anderson County is $32,803, while median incomes of families and households are $75,637 and $60,633 respectively.
| Characteristic | Number | Measure |
| Per Capita Income | 77,337 | $32,803 |
| Median Family Income | 20,408 | $75,637 |
| Mean Family Income | 20,408 | $94,271 |
| Median Household Income | 31,275 | $60,633 |
| Mean Household Income | 31,275 | $79,591 |
| Income Deficit | 20,408 | $10,027 |
| Wage / Income Gap (%) | 77,337 | 25.88% |
| Wage / Income Gap ($) | 77,337 | 74.12¢ per $1 |
| Gini / Inequality Index | 77,337 | 0.45 |
Earnings by Sex in Anderson County
Average Earnings in Anderson County are $38,084, $43,629 for men and $32,339 for women, a difference of 25.9%.
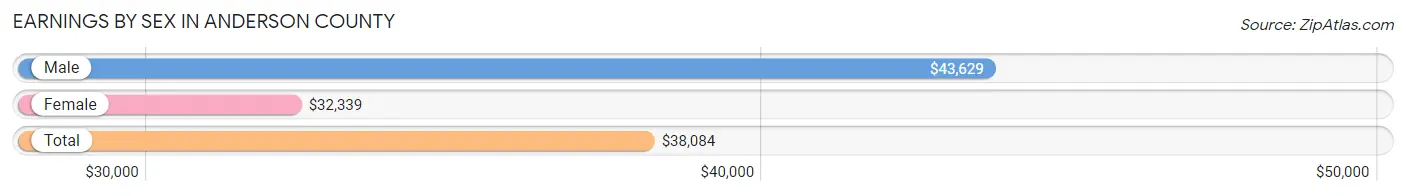
| Sex | Number | Average Earnings |
| Male | 19,431 (52.8%) | $43,629 |
| Female | 17,392 (47.2%) | $32,339 |
| Total | 36,823 (100.0%) | $38,084 |
Earnings by Sex by Income Bracket in Anderson County
The most common earnings brackets in Anderson County are $100,000+ for men (3,049 | 15.7%) and $35,000 to $39,999 for women (1,412 | 8.1%).
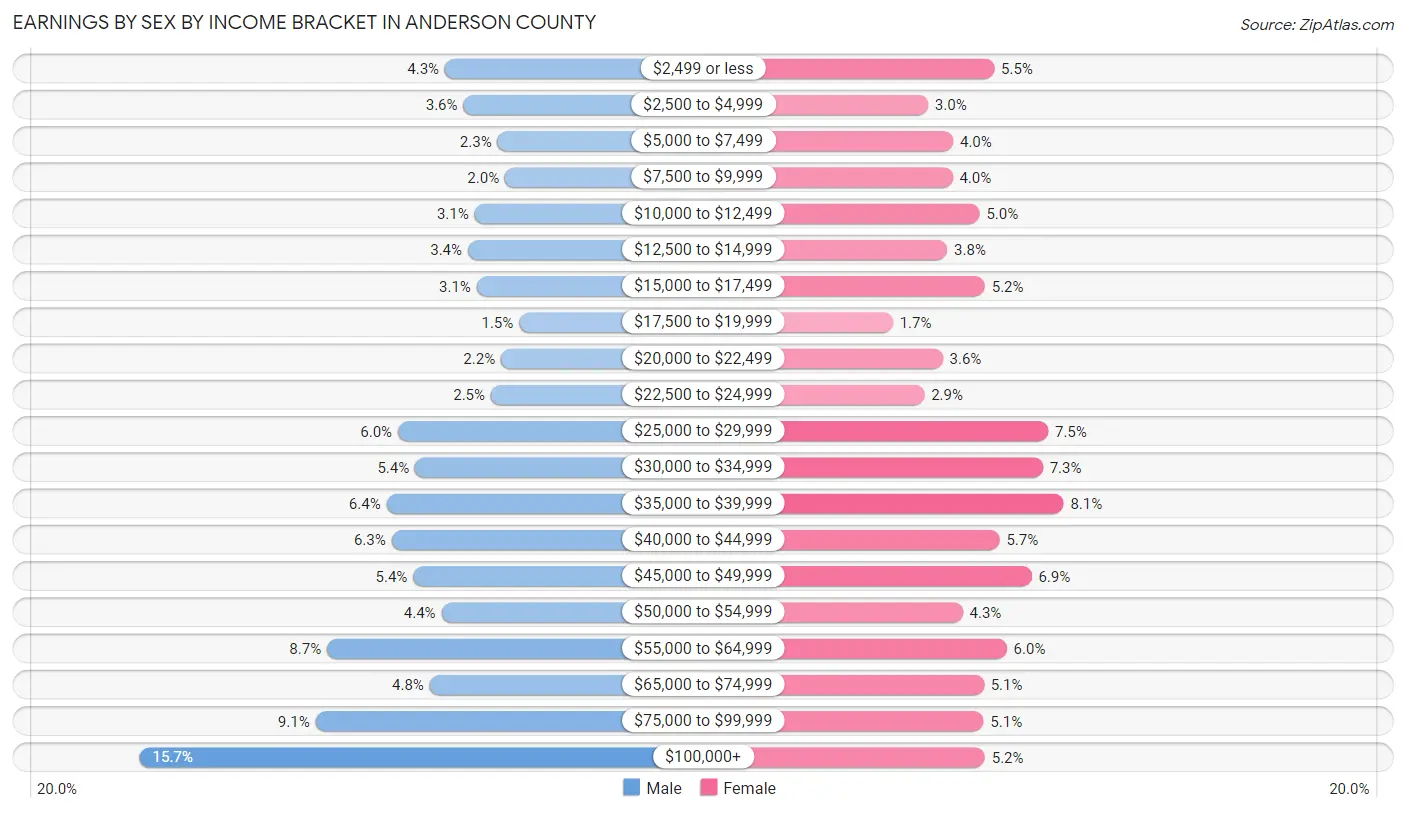
| Income | Male | Female |
| $2,499 or less | 826 (4.3%) | 960 (5.5%) |
| $2,500 to $4,999 | 691 (3.6%) | 529 (3.0%) |
| $5,000 to $7,499 | 443 (2.3%) | 692 (4.0%) |
| $7,500 to $9,999 | 389 (2.0%) | 689 (4.0%) |
| $10,000 to $12,499 | 610 (3.1%) | 865 (5.0%) |
| $12,500 to $14,999 | 659 (3.4%) | 654 (3.8%) |
| $15,000 to $17,499 | 595 (3.1%) | 899 (5.2%) |
| $17,500 to $19,999 | 285 (1.5%) | 299 (1.7%) |
| $20,000 to $22,499 | 418 (2.1%) | 624 (3.6%) |
| $22,500 to $24,999 | 491 (2.5%) | 505 (2.9%) |
| $25,000 to $29,999 | 1,168 (6.0%) | 1,312 (7.5%) |
| $30,000 to $34,999 | 1,043 (5.4%) | 1,277 (7.3%) |
| $35,000 to $39,999 | 1,252 (6.4%) | 1,412 (8.1%) |
| $40,000 to $44,999 | 1,214 (6.2%) | 995 (5.7%) |
| $45,000 to $49,999 | 1,057 (5.4%) | 1,203 (6.9%) |
| $50,000 to $54,999 | 852 (4.4%) | 754 (4.3%) |
| $55,000 to $64,999 | 1,684 (8.7%) | 1,041 (6.0%) |
| $65,000 to $74,999 | 936 (4.8%) | 892 (5.1%) |
| $75,000 to $99,999 | 1,769 (9.1%) | 891 (5.1%) |
| $100,000+ | 3,049 (15.7%) | 899 (5.2%) |
| Total | 19,431 (100.0%) | 17,392 (100.0%) |
Earnings by Sex by Educational Attainment in Anderson County
Average earnings in Anderson County are $48,059 for men and $36,416 for women, a difference of 24.2%. Men with an educational attainment of graduate degree enjoy the highest average annual earnings of $106,453, while those with less than high school education earn the least with $27,868. Women with an educational attainment of graduate degree earn the most with the average annual earnings of $50,697, while those with less than high school education have the smallest earnings of $28,546.
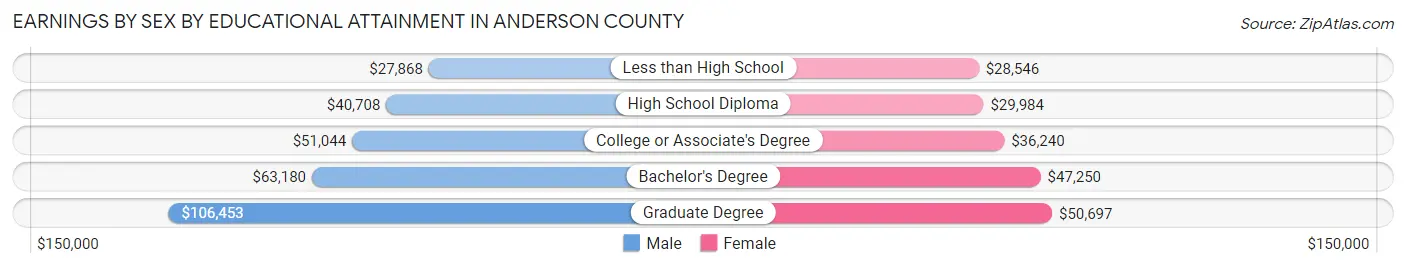
| Educational Attainment | Male Income | Female Income |
| Less than High School | $27,868 | $28,546 |
| High School Diploma | $40,708 | $29,984 |
| College or Associate's Degree | $51,044 | $36,240 |
| Bachelor's Degree | $63,180 | $47,250 |
| Graduate Degree | $106,453 | $50,697 |
| Total | $48,059 | $36,416 |
Family Income in Anderson County
Family Income Brackets in Anderson County
According to the Anderson County family income data, there are 3,735 families falling into the $50,000 to $74,999 income range, which is the most common income bracket and makes up 18.3% of all families. Conversely, the $10,000 to $14,999 income bracket is the least frequent group with only 531 families (2.6%) belonging to this category.
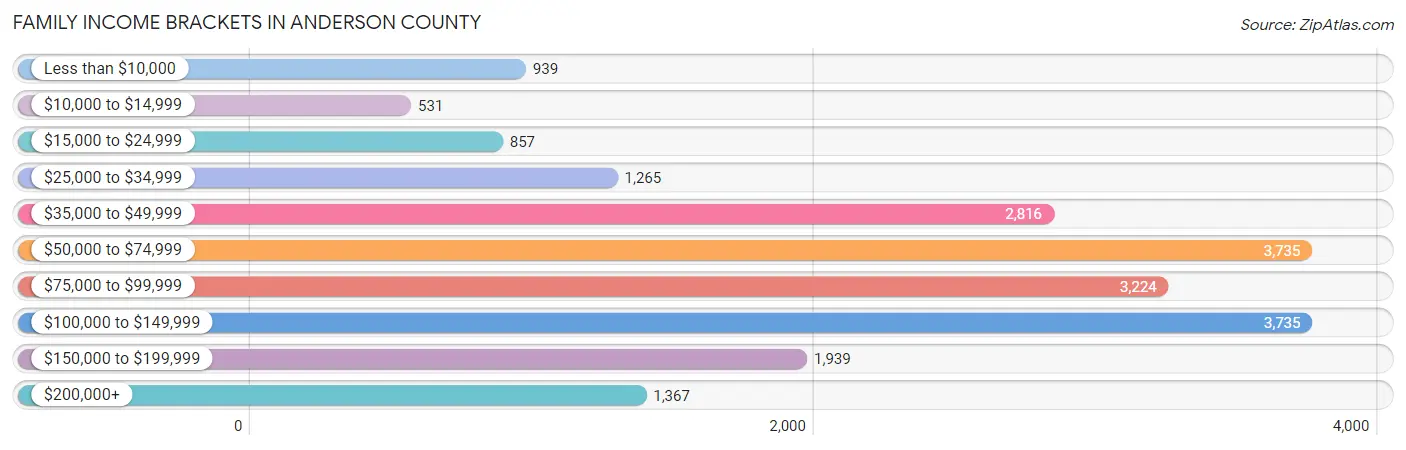
| Income Bracket | # Families | % Families |
| Less than $10,000 | 939 | 4.6% |
| $10,000 to $14,999 | 531 | 2.6% |
| $15,000 to $24,999 | 857 | 4.2% |
| $25,000 to $34,999 | 1,265 | 6.2% |
| $35,000 to $49,999 | 2,816 | 13.8% |
| $50,000 to $74,999 | 3,735 | 18.3% |
| $75,000 to $99,999 | 3,224 | 15.8% |
| $100,000 to $149,999 | 3,735 | 18.3% |
| $150,000 to $199,999 | 1,939 | 9.5% |
| $200,000+ | 1,367 | 6.7% |
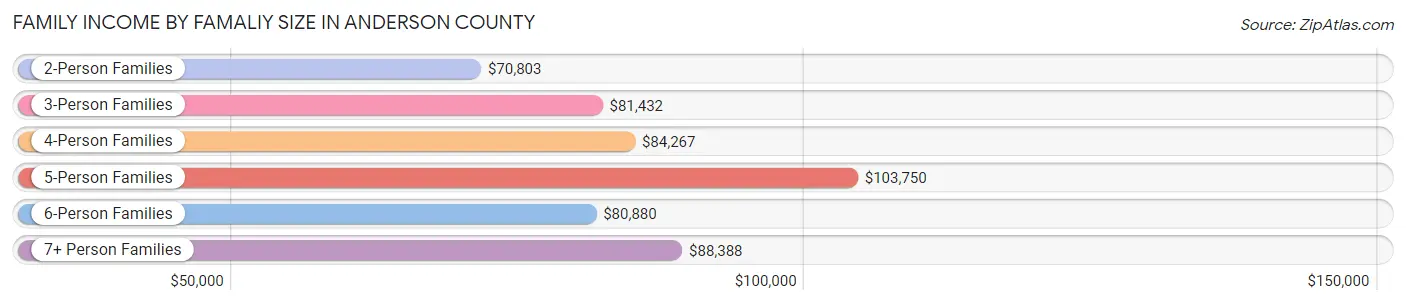
Family Income by Famaliy Size in Anderson County
5-person families (1,330 | 6.5%) account for the highest median family income in Anderson County with $103,750 per family, while 2-person families (10,595 | 51.9%) have the highest median income of $35,402 per family member.
| Income Bracket | # Families | Median Income |
| 2-Person Families | 10,595 (51.9%) | $70,803 |
| 3-Person Families | 4,287 (21.0%) | $81,432 |
| 4-Person Families | 3,554 (17.4%) | $84,267 |
| 5-Person Families | 1,330 (6.5%) | $103,750 |
| 6-Person Families | 353 (1.7%) | $80,880 |
| 7+ Person Families | 289 (1.4%) | $88,388 |
| Total | 20,408 (100.0%) | $75,637 |
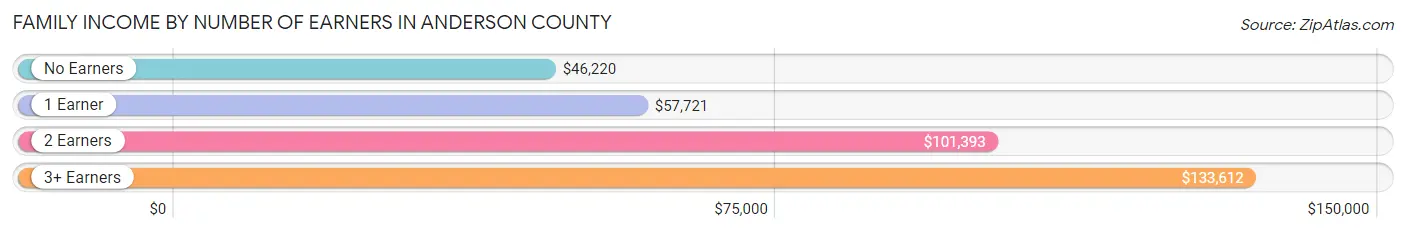
Family Income by Number of Earners in Anderson County
The median family income in Anderson County is $75,637, with families comprising 3+ earners (1,505) having the highest median family income of $133,612, while families with no earners (4,181) have the lowest median family income of $46,220, accounting for 7.4% and 20.5% of families, respectively.
| Number of Earners | # Families | Median Income |
| No Earners | 4,181 (20.5%) | $46,220 |
| 1 Earner | 7,012 (34.4%) | $57,721 |
| 2 Earners | 7,710 (37.8%) | $101,393 |
| 3+ Earners | 1,505 (7.4%) | $133,612 |
| Total | 20,408 (100.0%) | $75,637 |
Household Income in Anderson County
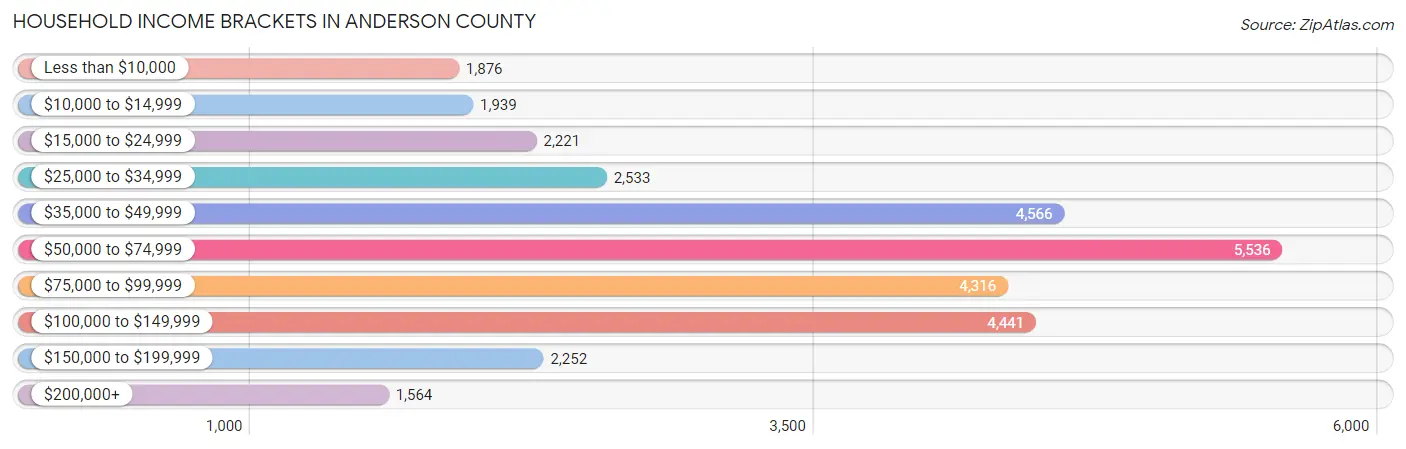
Household Income Brackets in Anderson County
With 5,536 households falling in the category, the $50,000 to $74,999 income range is the most frequent in Anderson County, accounting for 17.7% of all households. In contrast, only 1,564 households (5.0%) fall into the $200,000+ income bracket, making it the least populous group.
| Income Bracket | # Households | % Households |
| Less than $10,000 | 1,876 | 6.0% |
| $10,000 to $14,999 | 1,939 | 6.2% |
| $15,000 to $24,999 | 2,221 | 7.1% |
| $25,000 to $34,999 | 2,533 | 8.1% |
| $35,000 to $49,999 | 4,566 | 14.6% |
| $50,000 to $74,999 | 5,536 | 17.7% |
| $75,000 to $99,999 | 4,316 | 13.8% |
| $100,000 to $149,999 | 4,441 | 14.2% |
| $150,000 to $199,999 | 2,252 | 7.2% |
| $200,000+ | 1,564 | 5.0% |
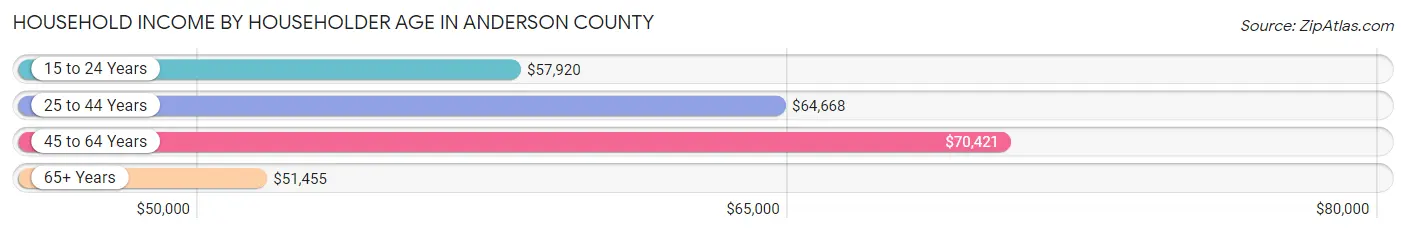
Household Income by Householder Age in Anderson County
The median household income in Anderson County is $60,633, with the highest median household income of $70,421 found in the 45 to 64 years age bracket for the primary householder. A total of 11,321 households (36.2%) fall into this category. Meanwhile, the 65+ years age bracket for the primary householder has the lowest median household income of $51,455, with 9,963 households (31.9%) in this group.
| Income Bracket | # Households | Median Income |
| 15 to 24 Years | 1,141 (3.6%) | $57,920 |
| 25 to 44 Years | 8,850 (28.3%) | $64,668 |
| 45 to 64 Years | 11,321 (36.2%) | $70,421 |
| 65+ Years | 9,963 (31.9%) | $51,455 |
| Total | 31,275 (100.0%) | $60,633 |
Poverty in Anderson County
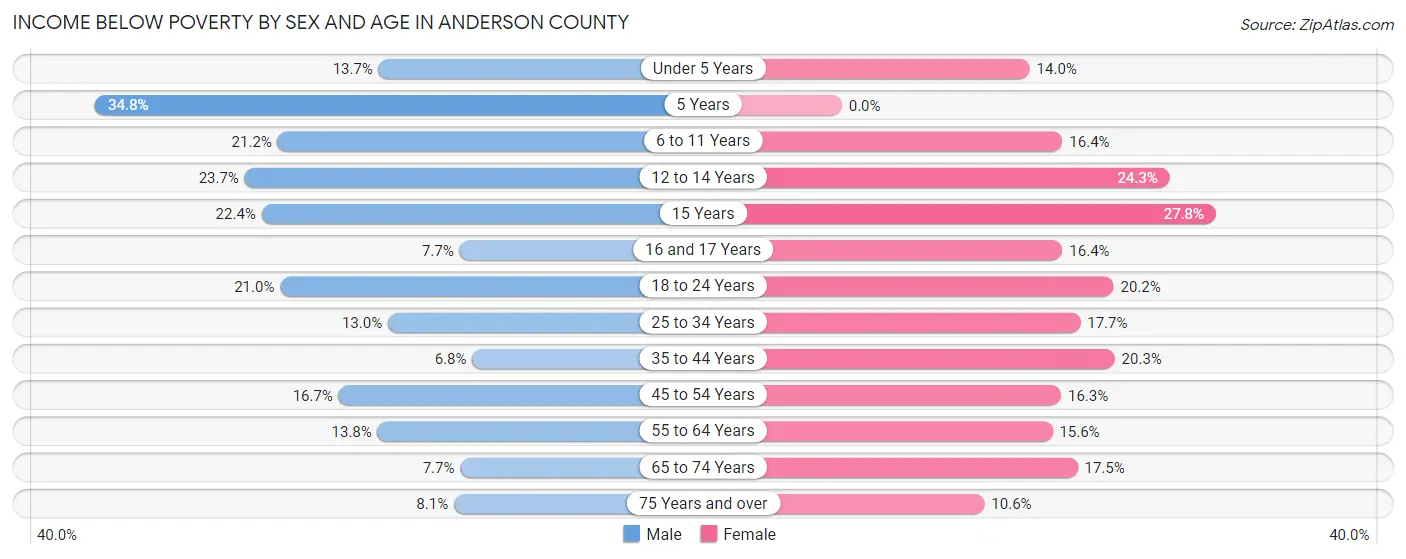
Income Below Poverty by Sex and Age in Anderson County
With 13.8% poverty level for males and 16.9% for females among the residents of Anderson County, 5 year old males and 15 year old females are the most vulnerable to poverty, with 162 males (34.8%) and 148 females (27.8%) in their respective age groups living below the poverty level.
| Age Bracket | Male | Female |
| Under 5 Years | 274 (13.7%) | 264 (14.0%) |
| 5 Years | 162 (34.8%) | 0 (0.0%) |
| 6 to 11 Years | 587 (21.2%) | 433 (16.4%) |
| 12 to 14 Years | 339 (23.7%) | 352 (24.3%) |
| 15 Years | 112 (22.4%) | 148 (27.8%) |
| 16 and 17 Years | 76 (7.7%) | 143 (16.4%) |
| 18 to 24 Years | 604 (21.0%) | 532 (20.2%) |
| 25 to 34 Years | 653 (13.0%) | 817 (17.7%) |
| 35 to 44 Years | 292 (6.8%) | 887 (20.3%) |
| 45 to 54 Years | 796 (16.7%) | 838 (16.3%) |
| 55 to 64 Years | 721 (13.8%) | 878 (15.6%) |
| 65 to 74 Years | 330 (7.6%) | 844 (17.5%) |
| 75 Years and over | 211 (8.1%) | 367 (10.6%) |
| Total | 5,157 (13.8%) | 6,503 (16.9%) |
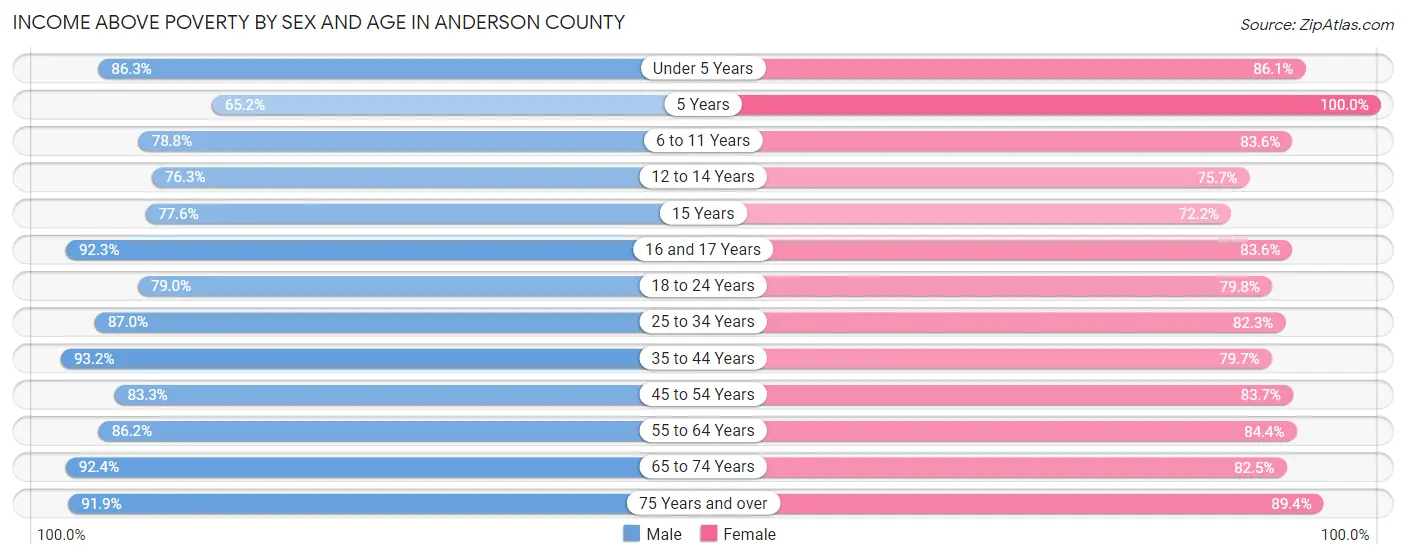
Income Above Poverty by Sex and Age in Anderson County
According to the poverty statistics in Anderson County, males aged 35 to 44 years and females aged 5 years are the age groups that are most secure financially, with 93.2% of males and 100.0% of females in these age groups living above the poverty line.
| Age Bracket | Male | Female |
| Under 5 Years | 1,724 (86.3%) | 1,628 (86.1%) |
| 5 Years | 304 (65.2%) | 399 (100.0%) |
| 6 to 11 Years | 2,181 (78.8%) | 2,211 (83.6%) |
| 12 to 14 Years | 1,094 (76.3%) | 1,094 (75.7%) |
| 15 Years | 388 (77.6%) | 385 (72.2%) |
| 16 and 17 Years | 910 (92.3%) | 730 (83.6%) |
| 18 to 24 Years | 2,270 (79.0%) | 2,104 (79.8%) |
| 25 to 34 Years | 4,362 (87.0%) | 3,795 (82.3%) |
| 35 to 44 Years | 4,027 (93.2%) | 3,491 (79.7%) |
| 45 to 54 Years | 3,976 (83.3%) | 4,308 (83.7%) |
| 55 to 64 Years | 4,506 (86.2%) | 4,736 (84.4%) |
| 65 to 74 Years | 3,981 (92.3%) | 3,978 (82.5%) |
| 75 Years and over | 2,387 (91.9%) | 3,097 (89.4%) |
| Total | 32,110 (86.2%) | 31,956 (83.1%) |
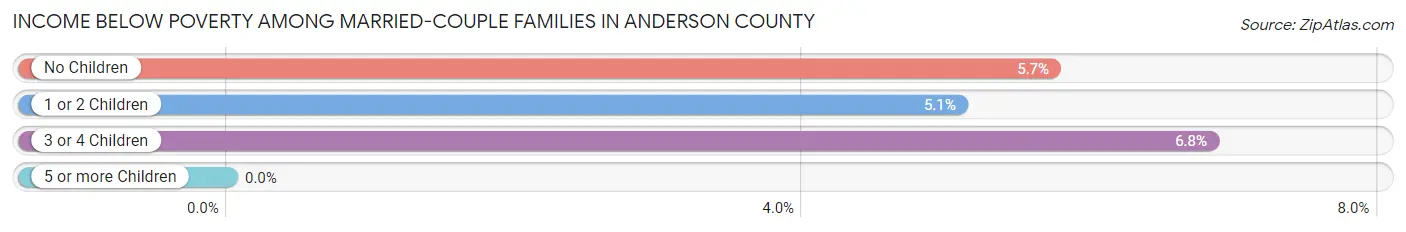
Income Below Poverty Among Married-Couple Families in Anderson County
The poverty statistics for married-couple families in Anderson County show that 5.5% or 849 of the total 15,335 families live below the poverty line. Families with 3 or 4 children have the highest poverty rate of 6.8%, comprising of 65 families. On the other hand, families with 5 or more children have the lowest poverty rate of 0.0%, which includes 0 families.
| Children | Above Poverty | Below Poverty |
| No Children | 9,092 (94.3%) | 553 (5.7%) |
| 1 or 2 Children | 4,312 (94.9%) | 231 (5.1%) |
| 3 or 4 Children | 886 (93.2%) | 65 (6.8%) |
| 5 or more Children | 196 (100.0%) | 0 (0.0%) |
| Total | 14,486 (94.5%) | 849 (5.5%) |
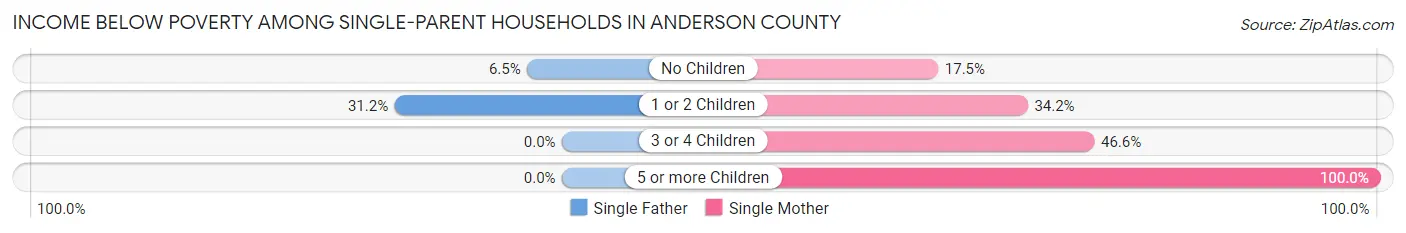
Income Below Poverty Among Single-Parent Households in Anderson County
According to the poverty data in Anderson County, 16.1% or 224 single-father households and 30.4% or 1,120 single-mother households are living below the poverty line. Among single-father households, those with 1 or 2 children have the highest poverty rate, with 171 households (31.2%) experiencing poverty. Likewise, among single-mother households, those with 5 or more children have the highest poverty rate, with 17 households (100.0%) falling below the poverty line.
| Children | Single Father | Single Mother |
| No Children | 53 (6.5%) | 212 (17.5%) |
| 1 or 2 Children | 171 (31.2%) | 697 (34.2%) |
| 3 or 4 Children | 0 (0.0%) | 194 (46.6%) |
| 5 or more Children | 0 (0.0%) | 17 (100.0%) |
| Total | 224 (16.1%) | 1,120 (30.4%) |
Income Below Poverty Among Married-Couple vs Single-Parent Households in Anderson County
The poverty data for Anderson County shows that 849 of the married-couple family households (5.5%) and 1,344 of the single-parent households (26.5%) are living below the poverty level. Within the married-couple family households, those with 3 or 4 children have the highest poverty rate, with 65 households (6.8%) falling below the poverty line. Among the single-parent households, those with 5 or more children have the highest poverty rate, with 17 household (100.0%) living below poverty.
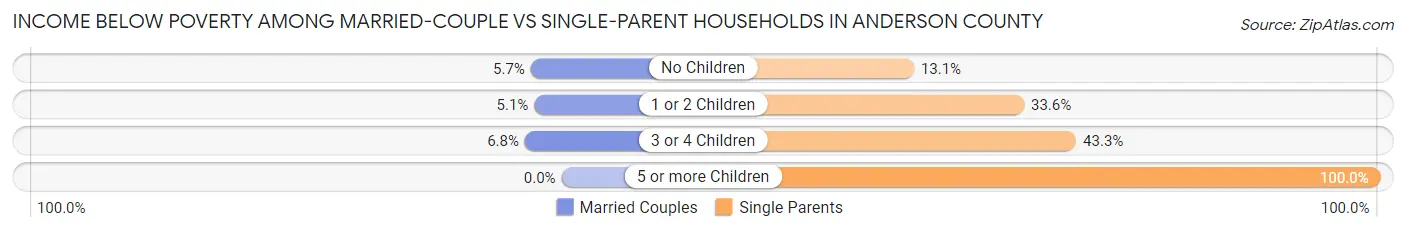
| Children | Married-Couple Families | Single-Parent Households |
| No Children | 553 (5.7%) | 265 (13.1%) |
| 1 or 2 Children | 231 (5.1%) | 868 (33.6%) |
| 3 or 4 Children | 65 (6.8%) | 194 (43.3%) |
| 5 or more Children | 0 (0.0%) | 17 (100.0%) |
| Total | 849 (5.5%) | 1,344 (26.5%) |
Employment Characteristics in Anderson County
Employment by Class of Employer in Anderson County
Among the 32,457 employed individuals in Anderson County, private company employees (21,818 | 67.2%), not-for-profit organizations (3,176 | 9.8%), and self-employed (not incorporated) (2,035 | 6.3%) make up the most common classes of employment.
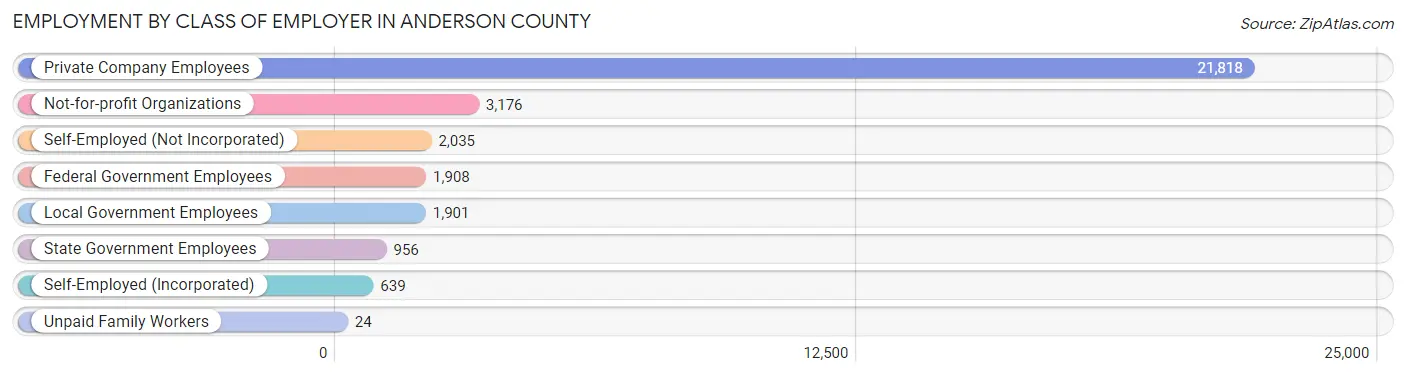
| Employer Class | # Employees | % Employees |
| Private Company Employees | 21,818 | 67.2% |
| Self-Employed (Incorporated) | 639 | 2.0% |
| Self-Employed (Not Incorporated) | 2,035 | 6.3% |
| Not-for-profit Organizations | 3,176 | 9.8% |
| Local Government Employees | 1,901 | 5.9% |
| State Government Employees | 956 | 2.9% |
| Federal Government Employees | 1,908 | 5.9% |
| Unpaid Family Workers | 24 | 0.1% |
| Total | 32,457 | 100.0% |
Employment Status by Age in Anderson County
According to the labor force statistics for Anderson County, out of the total population over 16 years of age (62,800), 55.6% or 34,917 individuals are in the labor force, with 5.4% or 1,886 of them unemployed. The age group with the highest labor force participation rate is 30 to 34 years, with 86.4% or 4,199 individuals in the labor force. Within the labor force, the 16 to 19 years age range has the highest percentage of unemployed individuals, with 12.9% or 158 of them being unemployed.
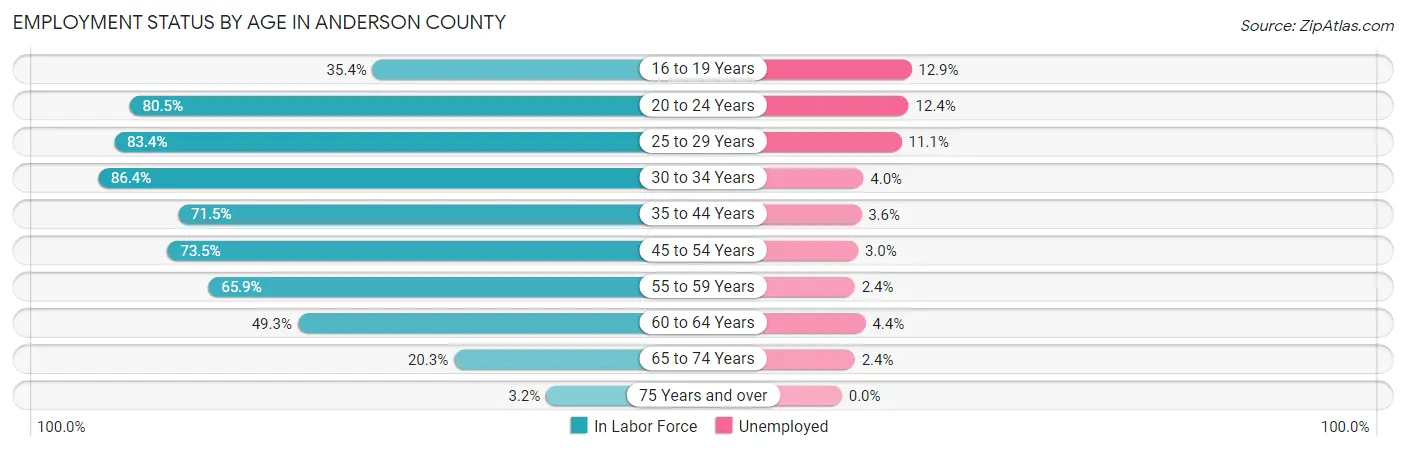
| Age Bracket | In Labor Force | Unemployed |
| 16 to 19 Years | 1,226 (35.4%) | 158 (12.9%) |
| 20 to 24 Years | 3,377 (80.5%) | 419 (12.4%) |
| 25 to 29 Years | 4,122 (83.4%) | 458 (11.1%) |
| 30 to 34 Years | 4,199 (86.4%) | 168 (4.0%) |
| 35 to 44 Years | 6,323 (71.5%) | 228 (3.6%) |
| 45 to 54 Years | 7,359 (73.5%) | 221 (3.0%) |
| 55 to 59 Years | 3,469 (65.9%) | 83 (2.4%) |
| 60 to 64 Years | 2,778 (49.3%) | 122 (4.4%) |
| 65 to 74 Years | 1,892 (20.3%) | 45 (2.4%) |
| 75 Years and over | 201 (3.2%) | 0 (0.0%) |
| Total | 34,917 (55.6%) | 1,886 (5.4%) |
Employment Status by Educational Attainment in Anderson County
According to labor force statistics for Anderson County, 71.4% of individuals (28,244) out of the total population between 25 and 64 years of age (39,557) are in the labor force, with 4.5% or 1,271 of them being unemployed. The group with the highest labor force participation rate are those with the educational attainment of bachelor's degree or higher, with 82.8% or 7,742 individuals in the labor force. Within the labor force, individuals with high school diploma education have the highest percentage of unemployment, with 6.0% or 518 of them being unemployed.
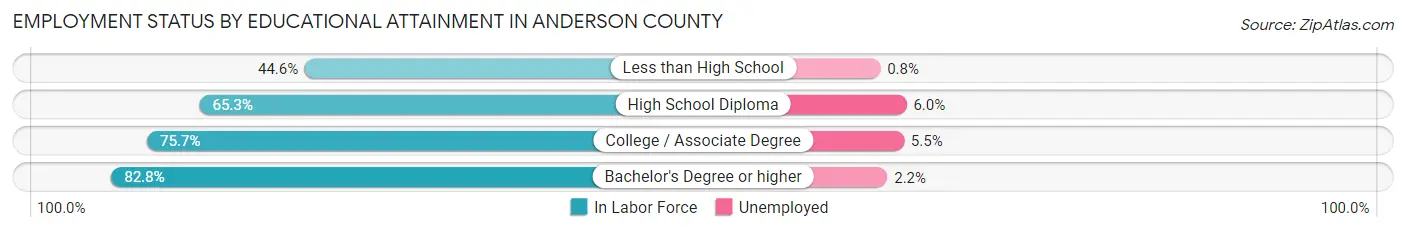
| Educational Attainment | In Labor Force | Unemployed |
| Less than High School | 1,427 (44.6%) | 26 (0.8%) |
| High School Diploma | 8,632 (65.3%) | 793 (6.0%) |
| College / Associate Degree | 10,438 (75.7%) | 758 (5.5%) |
| Bachelor's Degree or higher | 7,742 (82.8%) | 206 (2.2%) |
| Total | 28,244 (71.4%) | 1,780 (4.5%) |
Employment Occupations by Sex in Anderson County
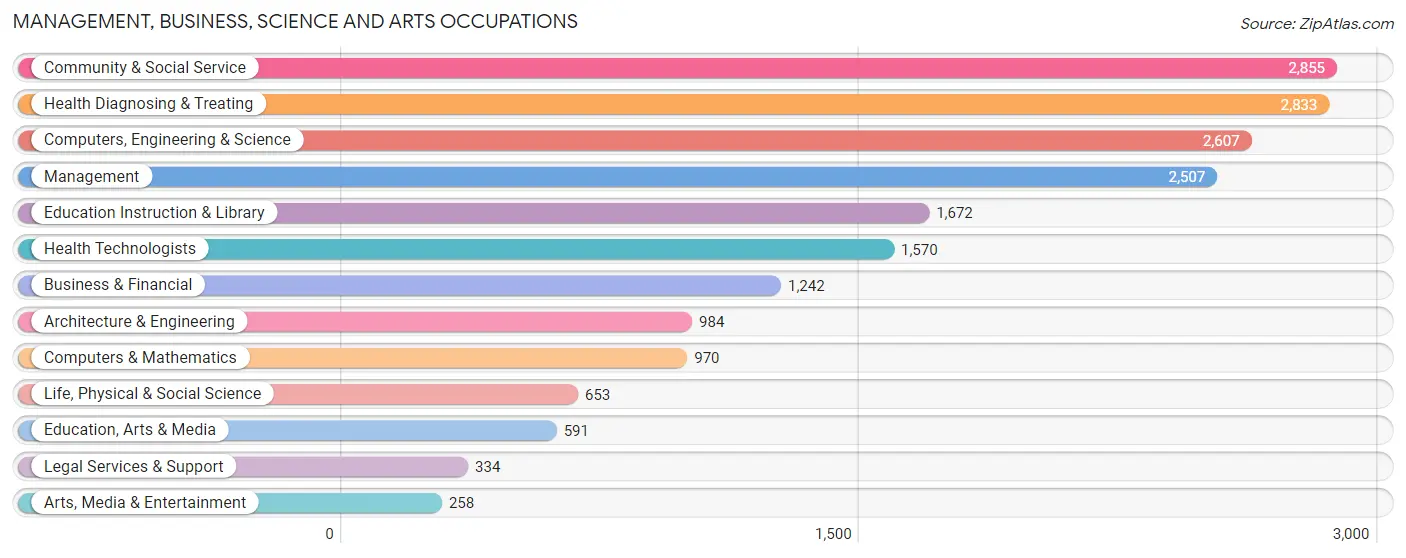
Management, Business, Science and Arts Occupations
The most common Management, Business, Science and Arts occupations in Anderson County are Community & Social Service (2,855 | 8.7%), Health Diagnosing & Treating (2,833 | 8.6%), Computers, Engineering & Science (2,607 | 7.9%), Management (2,507 | 7.6%), and Education Instruction & Library (1,672 | 5.1%).
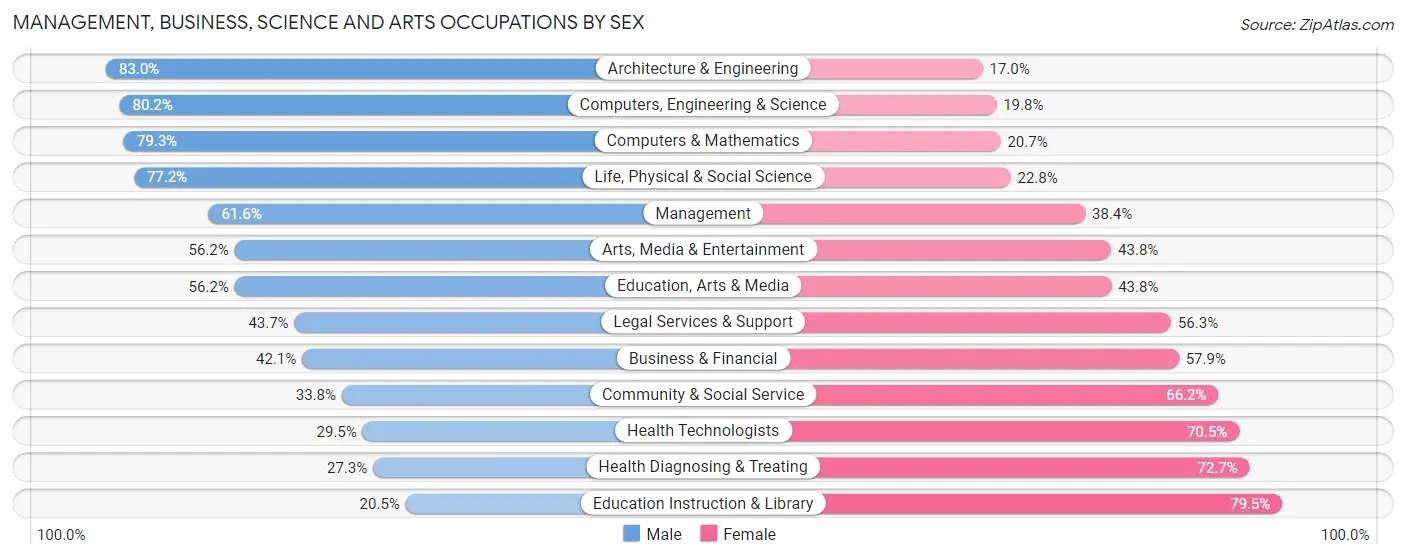
Management, Business, Science and Arts Occupations by Sex
Within the Management, Business, Science and Arts occupations in Anderson County, the most male-oriented occupations are Architecture & Engineering (83.0%), Computers, Engineering & Science (80.2%), and Computers & Mathematics (79.3%), while the most female-oriented occupations are Education Instruction & Library (79.5%), Health Diagnosing & Treating (72.7%), and Health Technologists (70.5%).
| Occupation | Male | Female |
| Management | 1,545 (61.6%) | 962 (38.4%) |
| Business & Financial | 523 (42.1%) | 719 (57.9%) |
| Computers, Engineering & Science | 2,090 (80.2%) | 517 (19.8%) |
| Computers & Mathematics | 769 (79.3%) | 201 (20.7%) |
| Architecture & Engineering | 817 (83.0%) | 167 (17.0%) |
| Life, Physical & Social Science | 504 (77.2%) | 149 (22.8%) |
| Community & Social Service | 966 (33.8%) | 1,889 (66.2%) |
| Education, Arts & Media | 332 (56.2%) | 259 (43.8%) |
| Legal Services & Support | 146 (43.7%) | 188 (56.3%) |
| Education Instruction & Library | 343 (20.5%) | 1,329 (79.5%) |
| Arts, Media & Entertainment | 145 (56.2%) | 113 (43.8%) |
| Health Diagnosing & Treating | 774 (27.3%) | 2,059 (72.7%) |
| Health Technologists | 463 (29.5%) | 1,107 (70.5%) |
| Total (Category) | 5,898 (49.0%) | 6,146 (51.0%) |
| Total (Overall) | 17,812 (54.1%) | 15,135 (45.9%) |
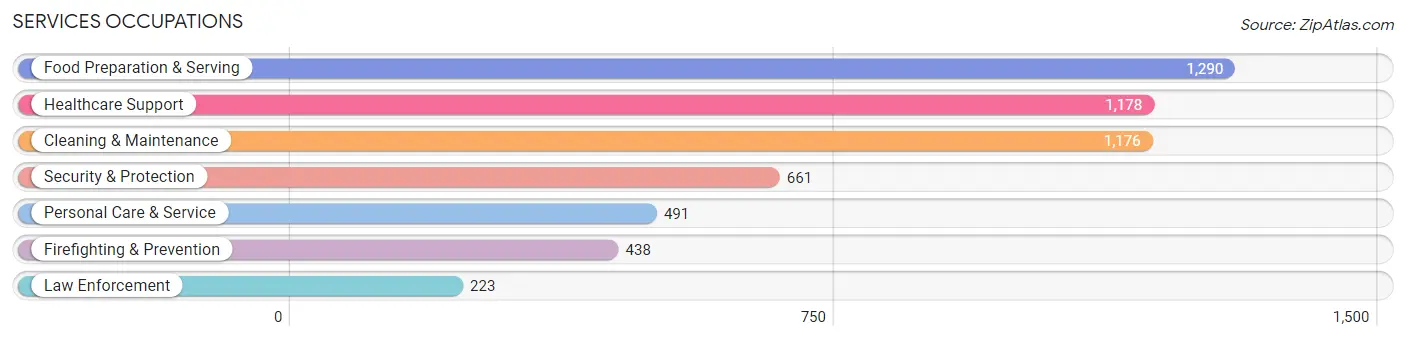
Services Occupations
The most common Services occupations in Anderson County are Food Preparation & Serving (1,290 | 3.9%), Healthcare Support (1,178 | 3.6%), Cleaning & Maintenance (1,176 | 3.6%), Security & Protection (661 | 2.0%), and Personal Care & Service (491 | 1.5%).
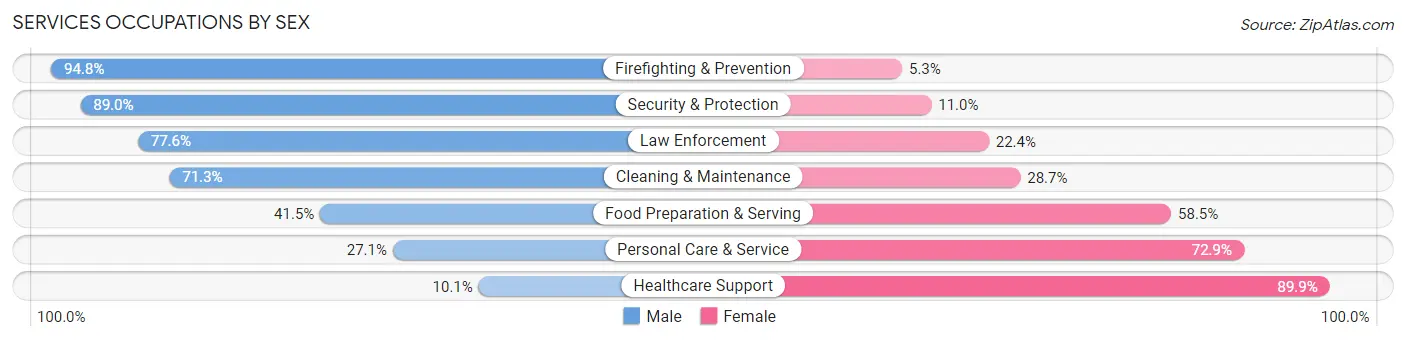
Services Occupations by Sex
Within the Services occupations in Anderson County, the most male-oriented occupations are Firefighting & Prevention (94.8%), Security & Protection (89.0%), and Law Enforcement (77.6%), while the most female-oriented occupations are Healthcare Support (89.9%), Personal Care & Service (72.9%), and Food Preparation & Serving (58.5%).
| Occupation | Male | Female |
| Healthcare Support | 119 (10.1%) | 1,059 (89.9%) |
| Security & Protection | 588 (89.0%) | 73 (11.0%) |
| Firefighting & Prevention | 415 (94.8%) | 23 (5.2%) |
| Law Enforcement | 173 (77.6%) | 50 (22.4%) |
| Food Preparation & Serving | 535 (41.5%) | 755 (58.5%) |
| Cleaning & Maintenance | 839 (71.3%) | 337 (28.7%) |
| Personal Care & Service | 133 (27.1%) | 358 (72.9%) |
| Total (Category) | 2,214 (46.2%) | 2,582 (53.8%) |
| Total (Overall) | 17,812 (54.1%) | 15,135 (45.9%) |
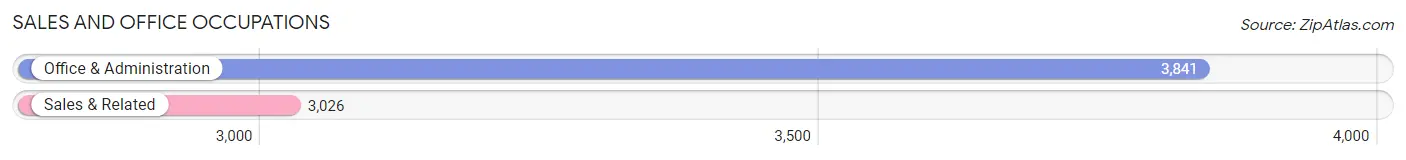
Sales and Office Occupations
The most common Sales and Office occupations in Anderson County are Office & Administration (3,841 | 11.7%), and Sales & Related (3,026 | 9.2%).
Sales and Office Occupations by Sex
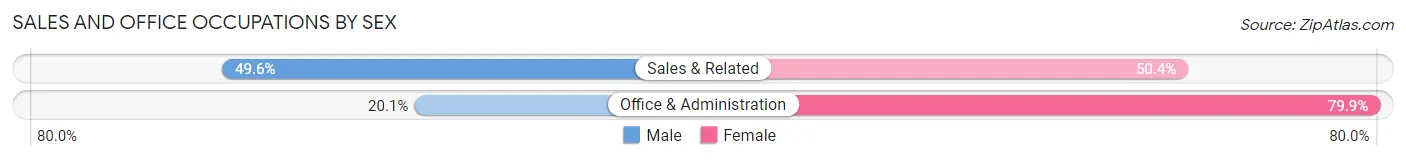
| Occupation | Male | Female |
| Sales & Related | 1,501 (49.6%) | 1,525 (50.4%) |
| Office & Administration | 771 (20.1%) | 3,070 (79.9%) |
| Total (Category) | 2,272 (33.1%) | 4,595 (66.9%) |
| Total (Overall) | 17,812 (54.1%) | 15,135 (45.9%) |
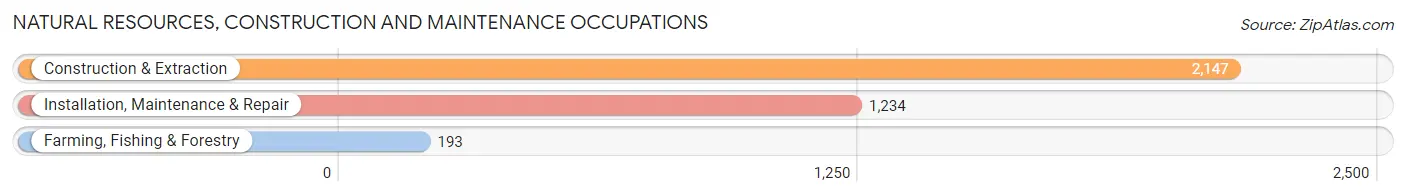
Natural Resources, Construction and Maintenance Occupations
The most common Natural Resources, Construction and Maintenance occupations in Anderson County are Construction & Extraction (2,147 | 6.5%), Installation, Maintenance & Repair (1,234 | 3.7%), and Farming, Fishing & Forestry (193 | 0.6%).
Natural Resources, Construction and Maintenance Occupations by Sex
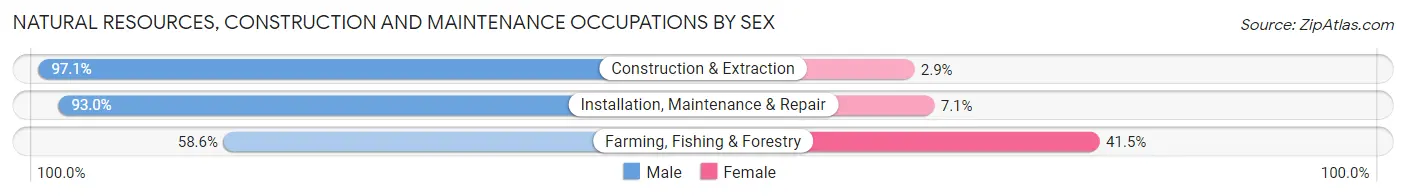
| Occupation | Male | Female |
| Farming, Fishing & Forestry | 113 (58.6%) | 80 (41.4%) |
| Construction & Extraction | 2,085 (97.1%) | 62 (2.9%) |
| Installation, Maintenance & Repair | 1,147 (92.9%) | 87 (7.0%) |
| Total (Category) | 3,345 (93.6%) | 229 (6.4%) |
| Total (Overall) | 17,812 (54.1%) | 15,135 (45.9%) |
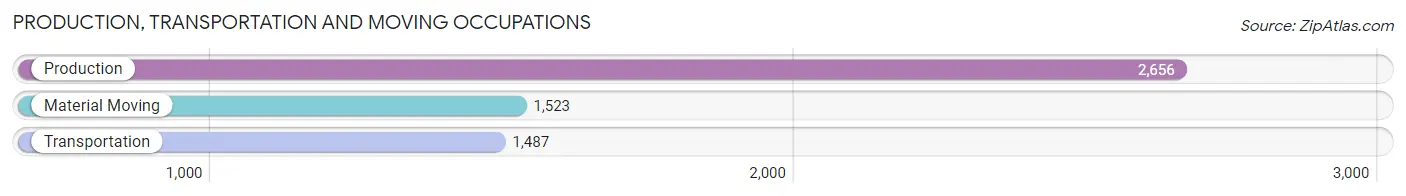
Production, Transportation and Moving Occupations
The most common Production, Transportation and Moving occupations in Anderson County are Production (2,656 | 8.1%), Material Moving (1,523 | 4.6%), and Transportation (1,487 | 4.5%).
Production, Transportation and Moving Occupations by Sex
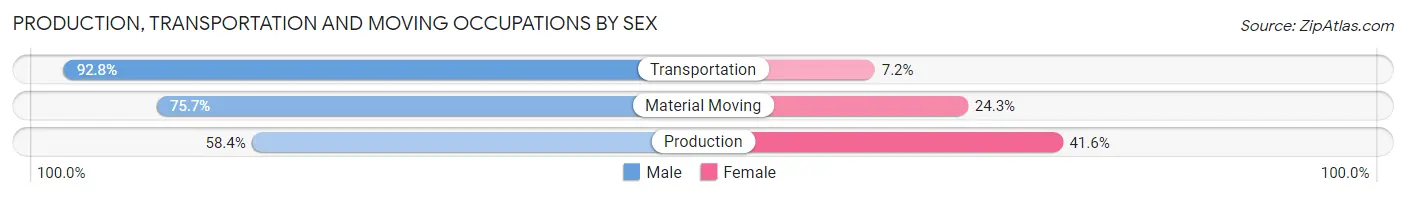
| Occupation | Male | Female |
| Production | 1,550 (58.4%) | 1,106 (41.6%) |
| Transportation | 1,380 (92.8%) | 107 (7.2%) |
| Material Moving | 1,153 (75.7%) | 370 (24.3%) |
| Total (Category) | 4,083 (72.1%) | 1,583 (27.9%) |
| Total (Overall) | 17,812 (54.1%) | 15,135 (45.9%) |
Employment Industries by Sex in Anderson County
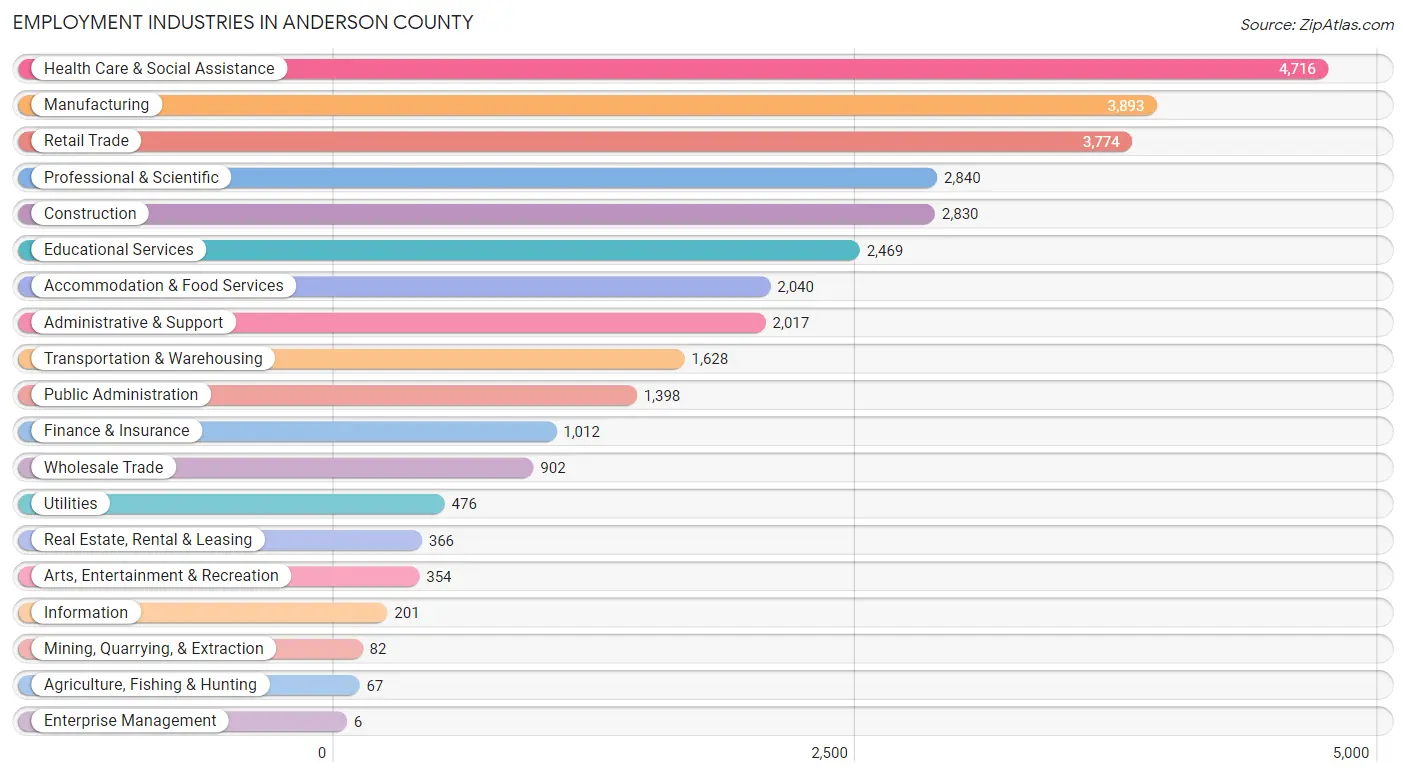
Employment Industries in Anderson County
The major employment industries in Anderson County include Health Care & Social Assistance (4,716 | 14.3%), Manufacturing (3,893 | 11.8%), Retail Trade (3,774 | 11.5%), Professional & Scientific (2,840 | 8.6%), and Construction (2,830 | 8.6%).
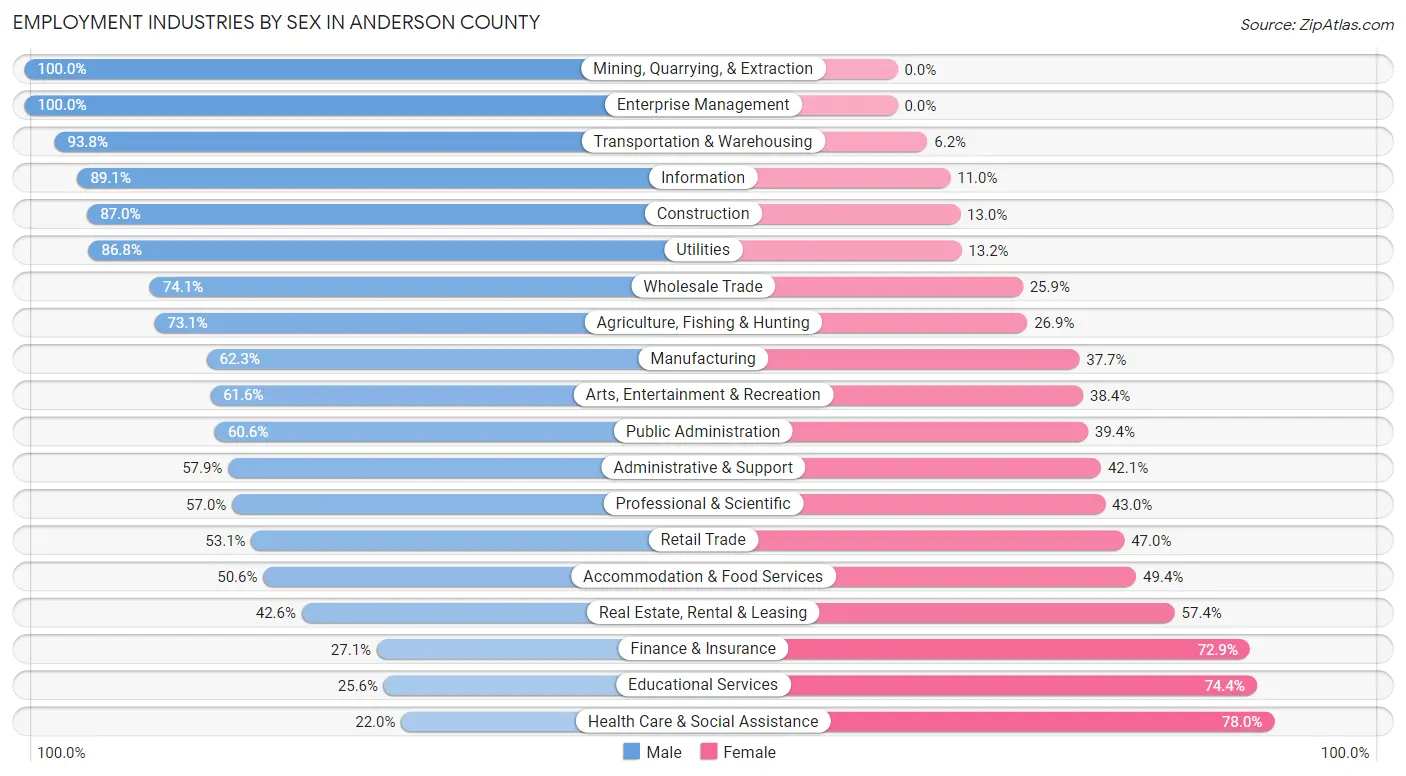
Employment Industries by Sex in Anderson County
The Anderson County industries that see more men than women are Mining, Quarrying, & Extraction (100.0%), Enterprise Management (100.0%), and Transportation & Warehousing (93.8%), whereas the industries that tend to have a higher number of women are Health Care & Social Assistance (78.0%), Educational Services (74.4%), and Finance & Insurance (72.9%).
| Industry | Male | Female |
| Agriculture, Fishing & Hunting | 49 (73.1%) | 18 (26.9%) |
| Mining, Quarrying, & Extraction | 82 (100.0%) | 0 (0.0%) |
| Construction | 2,463 (87.0%) | 367 (13.0%) |
| Manufacturing | 2,427 (62.3%) | 1,466 (37.7%) |
| Wholesale Trade | 668 (74.1%) | 234 (25.9%) |
| Retail Trade | 2,002 (53.0%) | 1,772 (46.9%) |
| Transportation & Warehousing | 1,527 (93.8%) | 101 (6.2%) |
| Utilities | 413 (86.8%) | 63 (13.2%) |
| Information | 179 (89.0%) | 22 (11.0%) |
| Finance & Insurance | 274 (27.1%) | 738 (72.9%) |
| Real Estate, Rental & Leasing | 156 (42.6%) | 210 (57.4%) |
| Professional & Scientific | 1,620 (57.0%) | 1,220 (43.0%) |
| Enterprise Management | 6 (100.0%) | 0 (0.0%) |
| Administrative & Support | 1,167 (57.9%) | 850 (42.1%) |
| Educational Services | 633 (25.6%) | 1,836 (74.4%) |
| Health Care & Social Assistance | 1,039 (22.0%) | 3,677 (78.0%) |
| Arts, Entertainment & Recreation | 218 (61.6%) | 136 (38.4%) |
| Accommodation & Food Services | 1,032 (50.6%) | 1,008 (49.4%) |
| Public Administration | 847 (60.6%) | 551 (39.4%) |
| Total | 17,812 (54.1%) | 15,135 (45.9%) |
Education in Anderson County
School Enrollment in Anderson County
The most common levels of schooling among the 16,476 students in Anderson County are high school (4,263 | 25.9%), middle school (3,547 | 21.5%), and elementary school (3,543 | 21.5%).
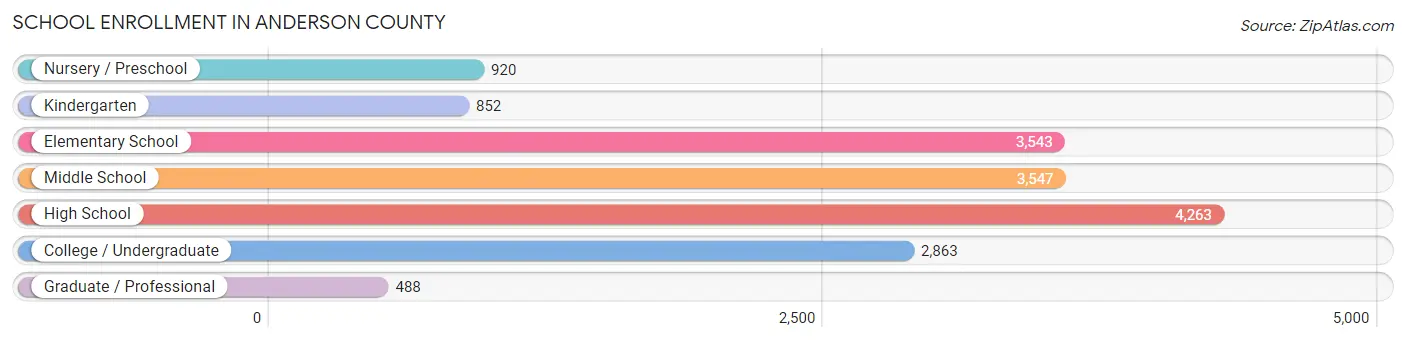
| School Level | # Students | % Students |
| Nursery / Preschool | 920 | 5.6% |
| Kindergarten | 852 | 5.2% |
| Elementary School | 3,543 | 21.5% |
| Middle School | 3,547 | 21.5% |
| High School | 4,263 | 25.9% |
| College / Undergraduate | 2,863 | 17.4% |
| Graduate / Professional | 488 | 3.0% |
| Total | 16,476 | 100.0% |
School Enrollment by Age by Funding Source in Anderson County
Out of a total of 16,476 students who are enrolled in schools in Anderson County, 2,883 (17.5%) attend a private institution, while the remaining 13,593 (82.5%) are enrolled in public schools. The age group of 20 to 24 year olds has the highest likelihood of being enrolled in private schools, with 406 (31.2% in the age bracket) enrolled. Conversely, the age group of 10 to 14 year olds has the lowest likelihood of being enrolled in a private school, with 4,103 (86.9% in the age bracket) attending a public institution.
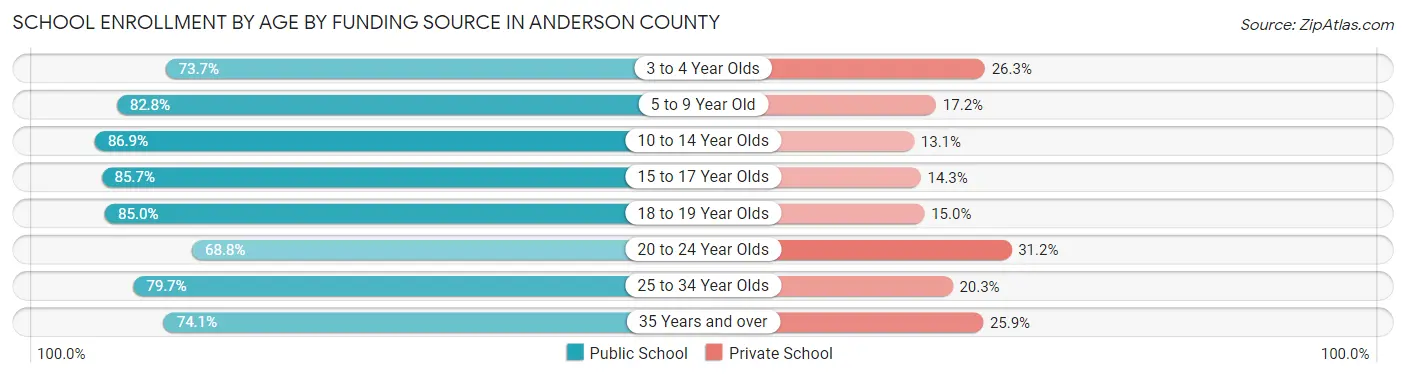
| Age Bracket | Public School | Private School |
| 3 to 4 Year Olds | 522 (73.7%) | 186 (26.3%) |
| 5 to 9 Year Old | 3,379 (82.8%) | 701 (17.2%) |
| 10 to 14 Year Olds | 4,103 (86.9%) | 617 (13.1%) |
| 15 to 17 Year Olds | 2,492 (85.7%) | 417 (14.3%) |
| 18 to 19 Year Olds | 844 (85.0%) | 149 (15.0%) |
| 20 to 24 Year Olds | 895 (68.8%) | 406 (31.2%) |
| 25 to 34 Year Olds | 811 (79.7%) | 206 (20.3%) |
| 35 Years and over | 554 (74.1%) | 194 (25.9%) |
| Total | 13,593 (82.5%) | 2,883 (17.5%) |
Educational Attainment by Field of Study in Anderson County
Business (2,214 | 15.2%), engineering (1,738 | 11.9%), education (1,629 | 11.2%), science & technology (1,499 | 10.3%), and bio, nature & agricultural (1,406 | 9.7%) are the most common fields of study among 14,546 individuals in Anderson County who have obtained a bachelor's degree or higher.
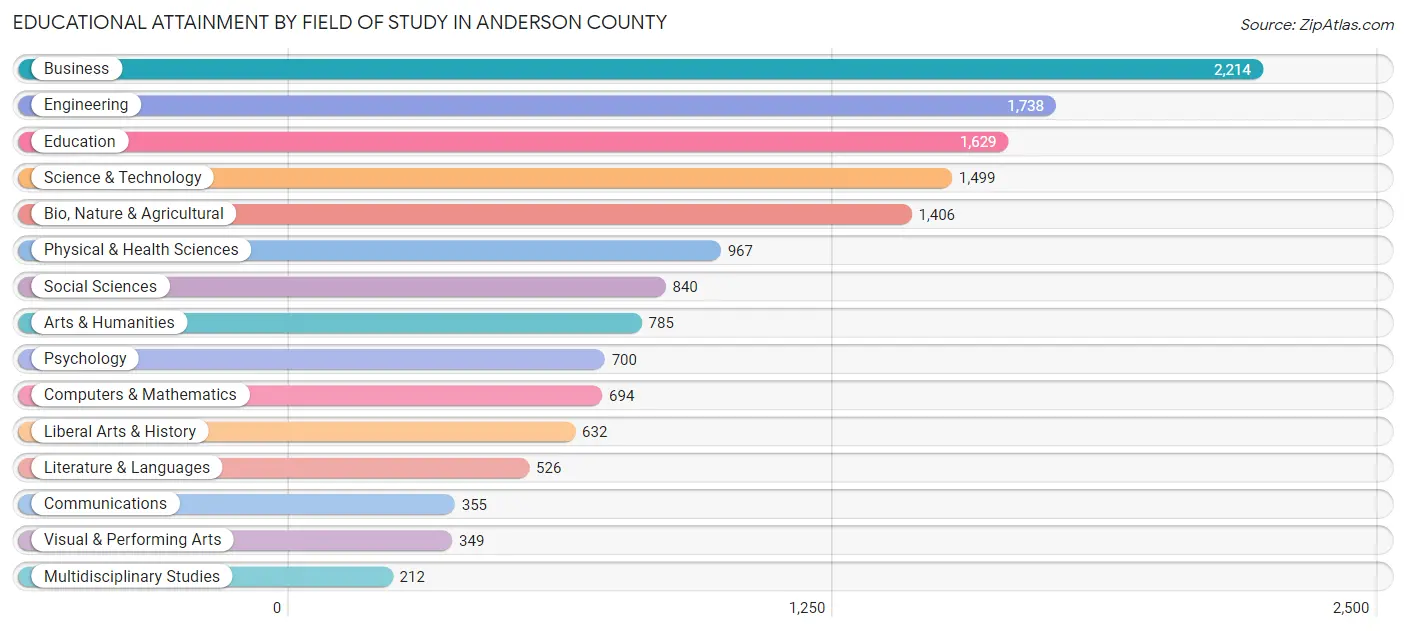
| Field of Study | # Graduates | % Graduates |
| Computers & Mathematics | 694 | 4.8% |
| Bio, Nature & Agricultural | 1,406 | 9.7% |
| Physical & Health Sciences | 967 | 6.7% |
| Psychology | 700 | 4.8% |
| Social Sciences | 840 | 5.8% |
| Engineering | 1,738 | 11.9% |
| Multidisciplinary Studies | 212 | 1.5% |
| Science & Technology | 1,499 | 10.3% |
| Business | 2,214 | 15.2% |
| Education | 1,629 | 11.2% |
| Literature & Languages | 526 | 3.6% |
| Liberal Arts & History | 632 | 4.3% |
| Visual & Performing Arts | 349 | 2.4% |
| Communications | 355 | 2.4% |
| Arts & Humanities | 785 | 5.4% |
| Total | 14,546 | 100.0% |
Transportation & Commute in Anderson County
Vehicle Availability by Sex in Anderson County
The most prevalent vehicle ownership categories in Anderson County are males with 2 vehicles (6,129, accounting for 35.0%) and females with 2 vehicles (5,315, making up 41.3%).
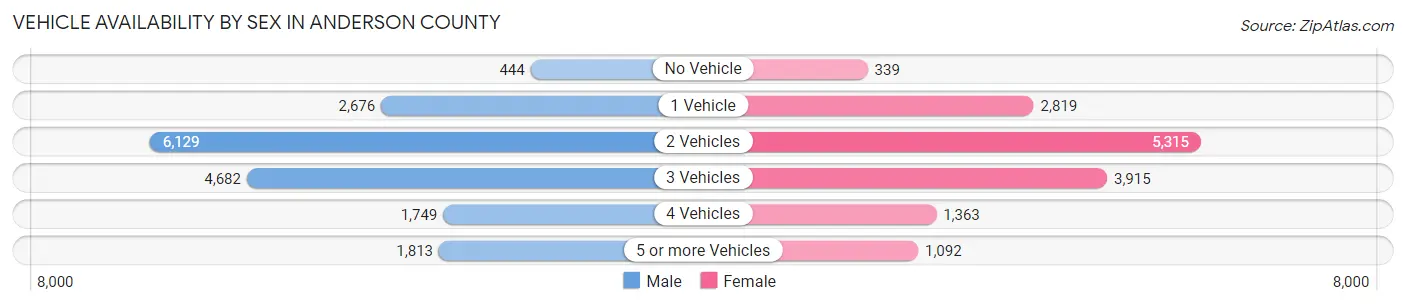
| Vehicles Available | Male | Female |
| No Vehicle | 444 (2.5%) | 339 (2.3%) |
| 1 Vehicle | 2,676 (15.3%) | 2,819 (19.0%) |
| 2 Vehicles | 6,129 (35.0%) | 5,315 (35.8%) |
| 3 Vehicles | 4,682 (26.8%) | 3,915 (26.4%) |
| 4 Vehicles | 1,749 (10.0%) | 1,363 (9.2%) |
| 5 or more Vehicles | 1,813 (10.4%) | 1,092 (7.4%) |
| Total | 17,493 (100.0%) | 14,843 (100.0%) |
Commute Time in Anderson County
The most frequently occuring commute durations in Anderson County are 30 to 34 minutes (5,089 commuters, 17.3%), 15 to 19 minutes (4,339 commuters, 14.7%), and 20 to 24 minutes (4,220 commuters, 14.3%).
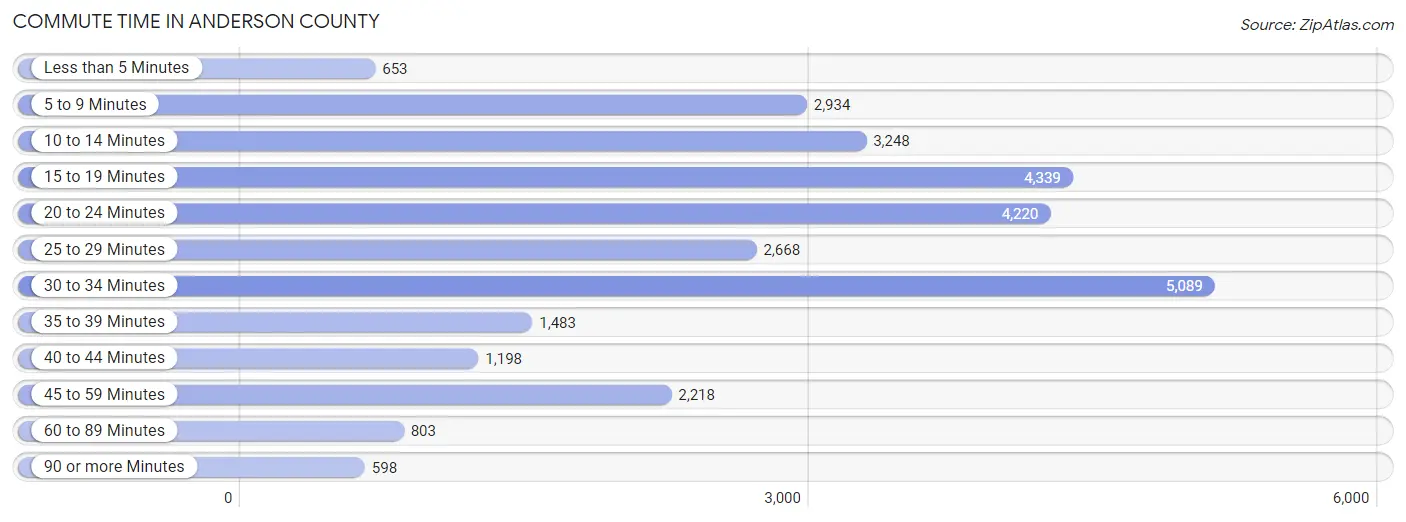
| Commute Time | # Commuters | % Commuters |
| Less than 5 Minutes | 653 | 2.2% |
| 5 to 9 Minutes | 2,934 | 10.0% |
| 10 to 14 Minutes | 3,248 | 11.0% |
| 15 to 19 Minutes | 4,339 | 14.7% |
| 20 to 24 Minutes | 4,220 | 14.3% |
| 25 to 29 Minutes | 2,668 | 9.1% |
| 30 to 34 Minutes | 5,089 | 17.3% |
| 35 to 39 Minutes | 1,483 | 5.0% |
| 40 to 44 Minutes | 1,198 | 4.1% |
| 45 to 59 Minutes | 2,218 | 7.5% |
| 60 to 89 Minutes | 803 | 2.7% |
| 90 or more Minutes | 598 | 2.0% |
Commute Time by Sex in Anderson County
The most common commute times in Anderson County are 30 to 34 minutes (2,952 commuters, 18.3%) for males and 30 to 34 minutes (2,137 commuters, 16.0%) for females.
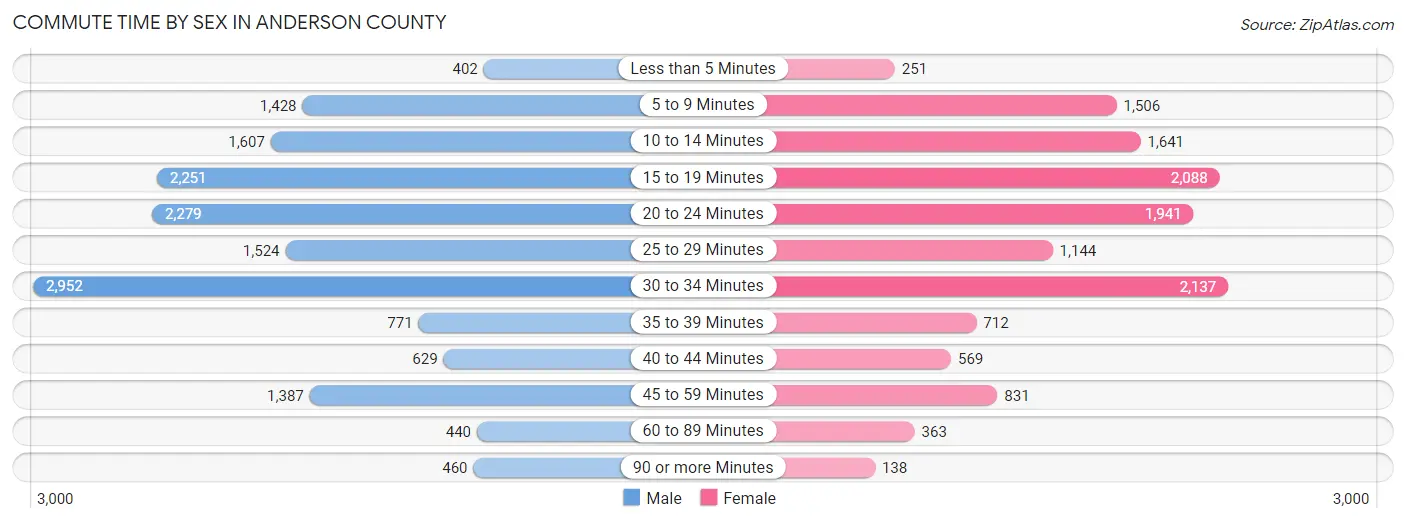
| Commute Time | Male | Female |
| Less than 5 Minutes | 402 (2.5%) | 251 (1.9%) |
| 5 to 9 Minutes | 1,428 (8.8%) | 1,506 (11.3%) |
| 10 to 14 Minutes | 1,607 (10.0%) | 1,641 (12.3%) |
| 15 to 19 Minutes | 2,251 (14.0%) | 2,088 (15.7%) |
| 20 to 24 Minutes | 2,279 (14.1%) | 1,941 (14.6%) |
| 25 to 29 Minutes | 1,524 (9.5%) | 1,144 (8.6%) |
| 30 to 34 Minutes | 2,952 (18.3%) | 2,137 (16.0%) |
| 35 to 39 Minutes | 771 (4.8%) | 712 (5.3%) |
| 40 to 44 Minutes | 629 (3.9%) | 569 (4.3%) |
| 45 to 59 Minutes | 1,387 (8.6%) | 831 (6.2%) |
| 60 to 89 Minutes | 440 (2.7%) | 363 (2.7%) |
| 90 or more Minutes | 460 (2.9%) | 138 (1.0%) |
Time of Departure to Work by Sex in Anderson County
The most frequent times of departure to work in Anderson County are 6:00 AM to 6:29 AM (2,534, 15.7%) for males and 7:00 AM to 7:29 AM (2,318, 17.4%) for females.
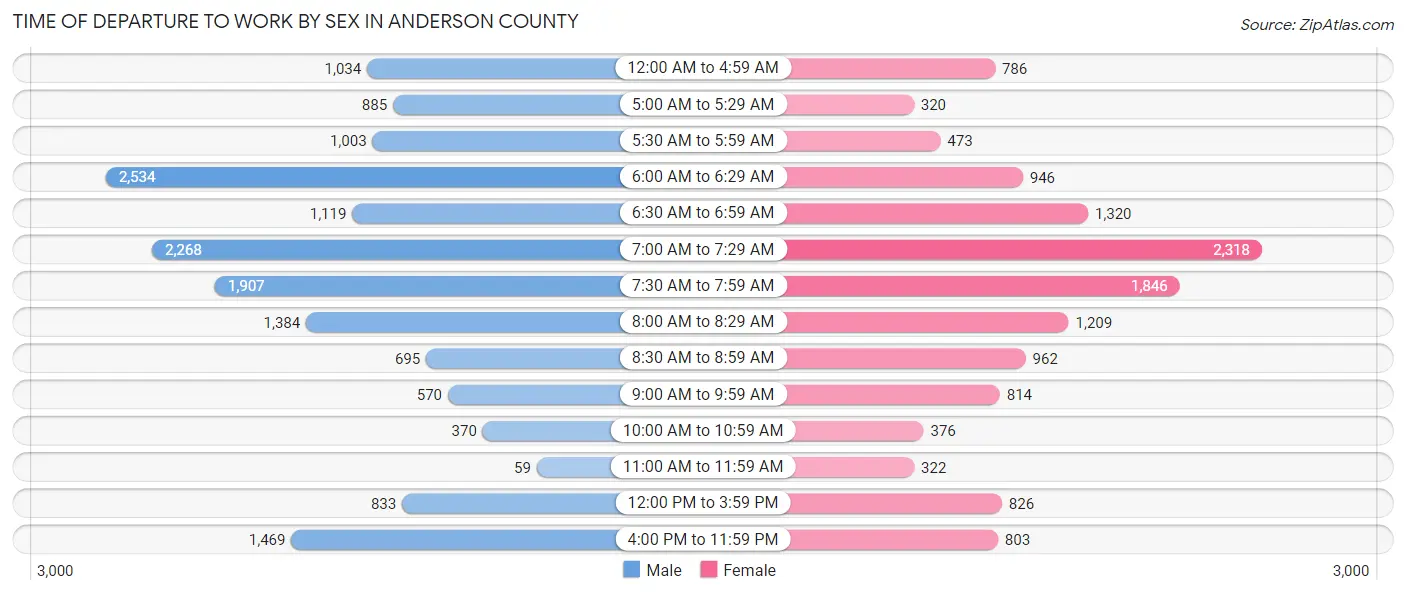
| Time of Departure | Male | Female |
| 12:00 AM to 4:59 AM | 1,034 (6.4%) | 786 (5.9%) |
| 5:00 AM to 5:29 AM | 885 (5.5%) | 320 (2.4%) |
| 5:30 AM to 5:59 AM | 1,003 (6.2%) | 473 (3.5%) |
| 6:00 AM to 6:29 AM | 2,534 (15.7%) | 946 (7.1%) |
| 6:30 AM to 6:59 AM | 1,119 (6.9%) | 1,320 (9.9%) |
| 7:00 AM to 7:29 AM | 2,268 (14.1%) | 2,318 (17.4%) |
| 7:30 AM to 7:59 AM | 1,907 (11.8%) | 1,846 (13.9%) |
| 8:00 AM to 8:29 AM | 1,384 (8.6%) | 1,209 (9.1%) |
| 8:30 AM to 8:59 AM | 695 (4.3%) | 962 (7.2%) |
| 9:00 AM to 9:59 AM | 570 (3.5%) | 814 (6.1%) |
| 10:00 AM to 10:59 AM | 370 (2.3%) | 376 (2.8%) |
| 11:00 AM to 11:59 AM | 59 (0.4%) | 322 (2.4%) |
| 12:00 PM to 3:59 PM | 833 (5.2%) | 826 (6.2%) |
| 4:00 PM to 11:59 PM | 1,469 (9.1%) | 803 (6.0%) |
| Total | 16,130 (100.0%) | 13,321 (100.0%) |
Housing Occupancy in Anderson County
Occupancy by Ownership in Anderson County
Of the total 31,275 dwellings in Anderson County, owner-occupied units account for 21,844 (69.8%), while renter-occupied units make up 9,431 (30.2%).
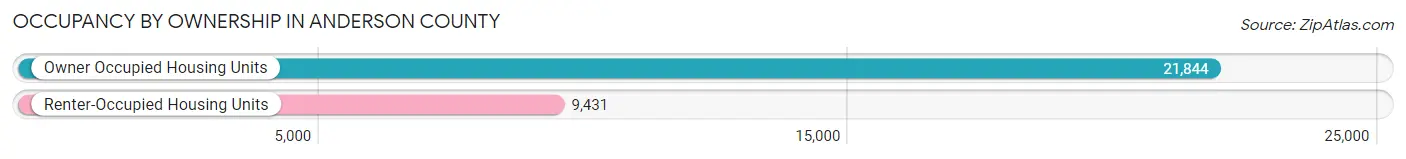
| Occupancy | # Housing Units | % Housing Units |
| Owner Occupied Housing Units | 21,844 | 69.8% |
| Renter-Occupied Housing Units | 9,431 | 30.2% |
| Total Occupied Housing Units | 31,275 | 100.0% |
Occupancy by Household Size in Anderson County
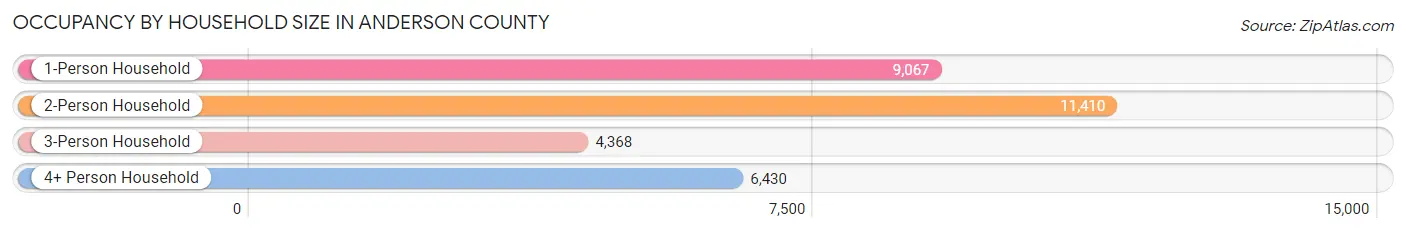
| Household Size | # Housing Units | % Housing Units |
| 1-Person Household | 9,067 | 29.0% |
| 2-Person Household | 11,410 | 36.5% |
| 3-Person Household | 4,368 | 14.0% |
| 4+ Person Household | 6,430 | 20.6% |
| Total Housing Units | 31,275 | 100.0% |
Occupancy by Ownership by Household Size in Anderson County
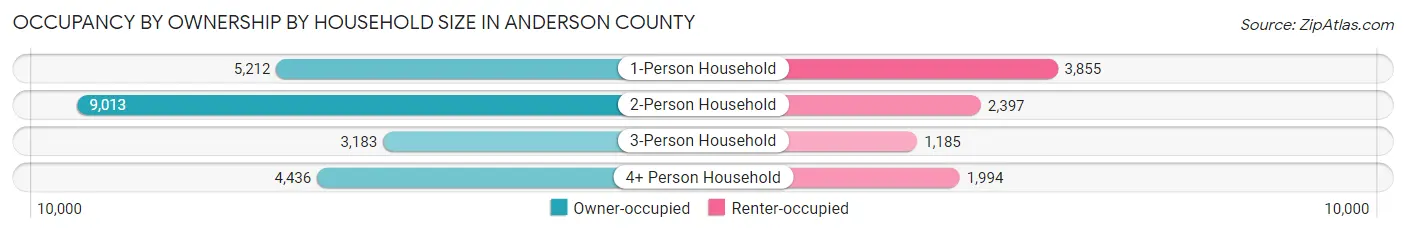
| Household Size | Owner-occupied | Renter-occupied |
| 1-Person Household | 5,212 (57.5%) | 3,855 (42.5%) |
| 2-Person Household | 9,013 (79.0%) | 2,397 (21.0%) |
| 3-Person Household | 3,183 (72.9%) | 1,185 (27.1%) |
| 4+ Person Household | 4,436 (69.0%) | 1,994 (31.0%) |
| Total Housing Units | 21,844 (69.8%) | 9,431 (30.2%) |
Occupancy by Educational Attainment in Anderson County
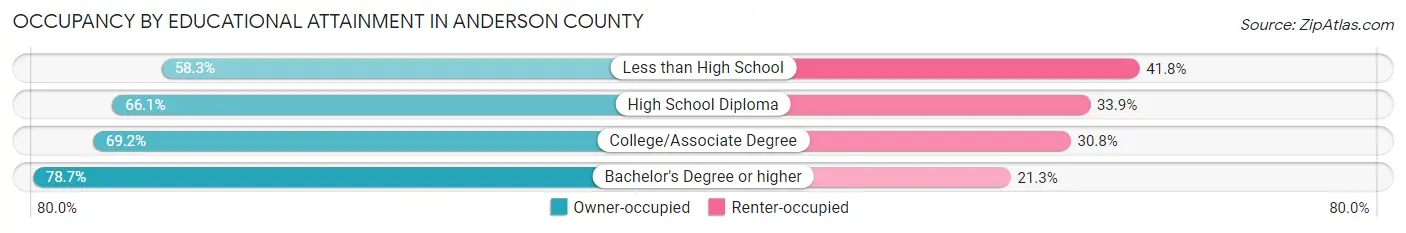
| Household Size | Owner-occupied | Renter-occupied |
| Less than High School | 1,518 (58.3%) | 1,088 (41.7%) |
| High School Diploma | 6,154 (66.1%) | 3,158 (33.9%) |
| College/Associate Degree | 7,703 (69.2%) | 3,433 (30.8%) |
| Bachelor's Degree or higher | 6,469 (78.7%) | 1,752 (21.3%) |
Occupancy by Age of Householder in Anderson County
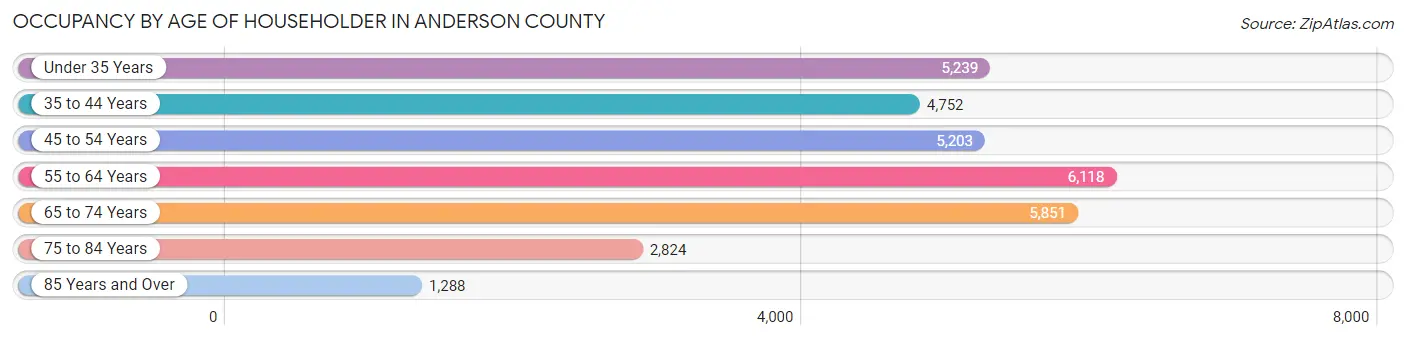
| Age Bracket | # Households | % Households |
| Under 35 Years | 5,239 | 16.8% |
| 35 to 44 Years | 4,752 | 15.2% |
| 45 to 54 Years | 5,203 | 16.6% |
| 55 to 64 Years | 6,118 | 19.6% |
| 65 to 74 Years | 5,851 | 18.7% |
| 75 to 84 Years | 2,824 | 9.0% |
| 85 Years and Over | 1,288 | 4.1% |
| Total | 31,275 | 100.0% |
Housing Finances in Anderson County
Median Income by Occupancy in Anderson County
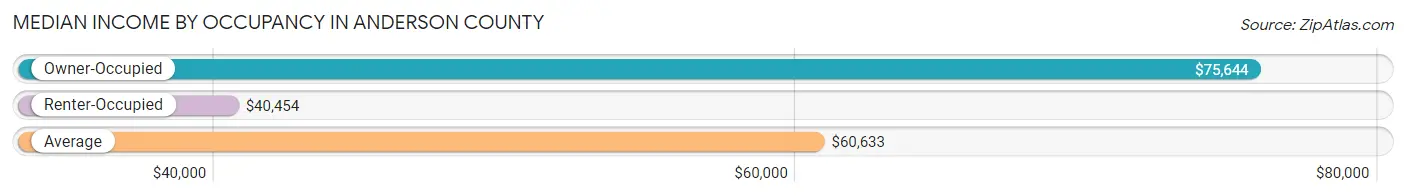
| Occupancy Type | # Households | Median Income |
| Owner-Occupied | 21,844 (69.8%) | $75,644 |
| Renter-Occupied | 9,431 (30.2%) | $40,454 |
| Average | 31,275 (100.0%) | $60,633 |
Occupancy by Householder Income Bracket in Anderson County
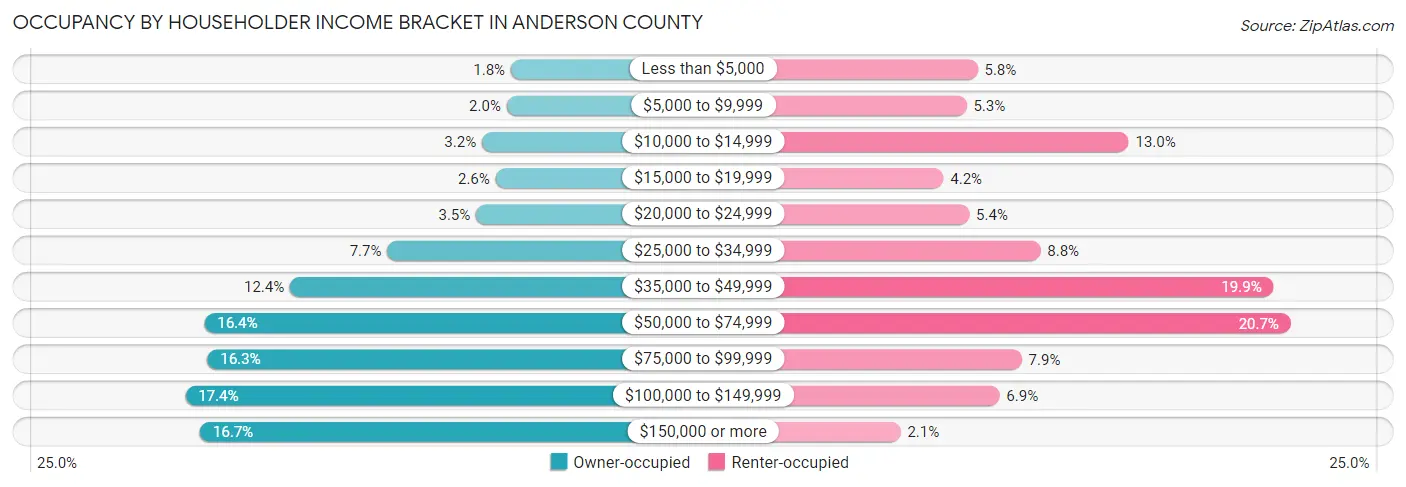
| Income Bracket | Owner-occupied | Renter-occupied |
| Less than $5,000 | 401 (1.8%) | 548 (5.8%) |
| $5,000 to $9,999 | 445 (2.0%) | 498 (5.3%) |
| $10,000 to $14,999 | 703 (3.2%) | 1,226 (13.0%) |
| $15,000 to $19,999 | 562 (2.6%) | 394 (4.2%) |
| $20,000 to $24,999 | 765 (3.5%) | 510 (5.4%) |
| $25,000 to $34,999 | 1,688 (7.7%) | 830 (8.8%) |
| $35,000 to $49,999 | 2,699 (12.4%) | 1,877 (19.9%) |
| $50,000 to $74,999 | 3,591 (16.4%) | 1,954 (20.7%) |
| $75,000 to $99,999 | 3,561 (16.3%) | 746 (7.9%) |
| $100,000 to $149,999 | 3,791 (17.3%) | 646 (6.9%) |
| $150,000 or more | 3,638 (16.7%) | 202 (2.1%) |
| Total | 21,844 (100.0%) | 9,431 (100.0%) |
Monthly Housing Cost Tiers in Anderson County
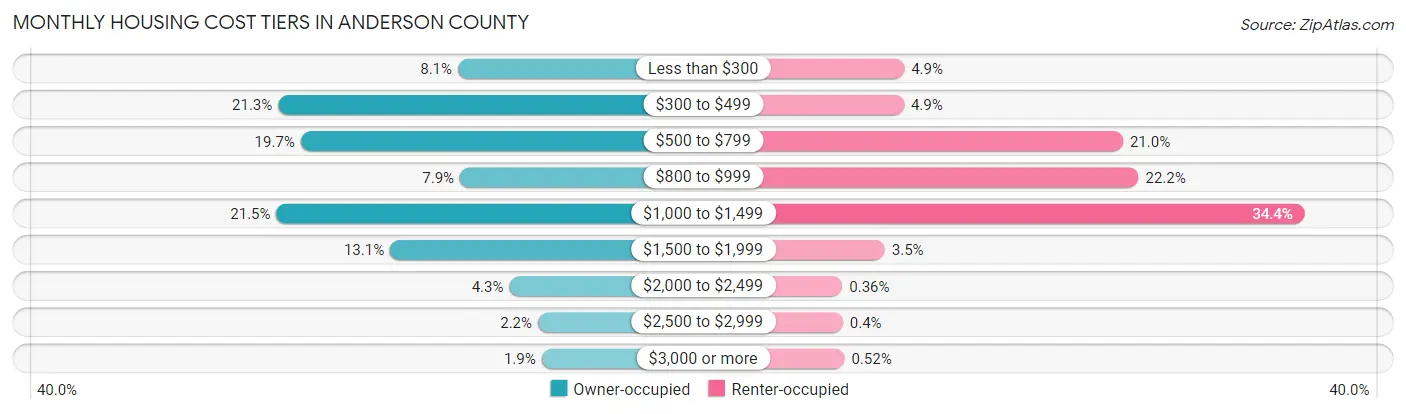
| Monthly Cost | Owner-occupied | Renter-occupied |
| Less than $300 | 1,767 (8.1%) | 464 (4.9%) |
| $300 to $499 | 4,659 (21.3%) | 462 (4.9%) |
| $500 to $799 | 4,296 (19.7%) | 1,983 (21.0%) |
| $800 to $999 | 1,735 (7.9%) | 2,092 (22.2%) |
| $1,000 to $1,499 | 4,687 (21.5%) | 3,245 (34.4%) |
| $1,500 to $1,999 | 2,859 (13.1%) | 329 (3.5%) |
| $2,000 to $2,499 | 939 (4.3%) | 34 (0.4%) |
| $2,500 to $2,999 | 480 (2.2%) | 38 (0.4%) |
| $3,000 or more | 422 (1.9%) | 49 (0.5%) |
| Total | 21,844 (100.0%) | 9,431 (100.0%) |
Physical Housing Characteristics in Anderson County
Housing Structures in Anderson County
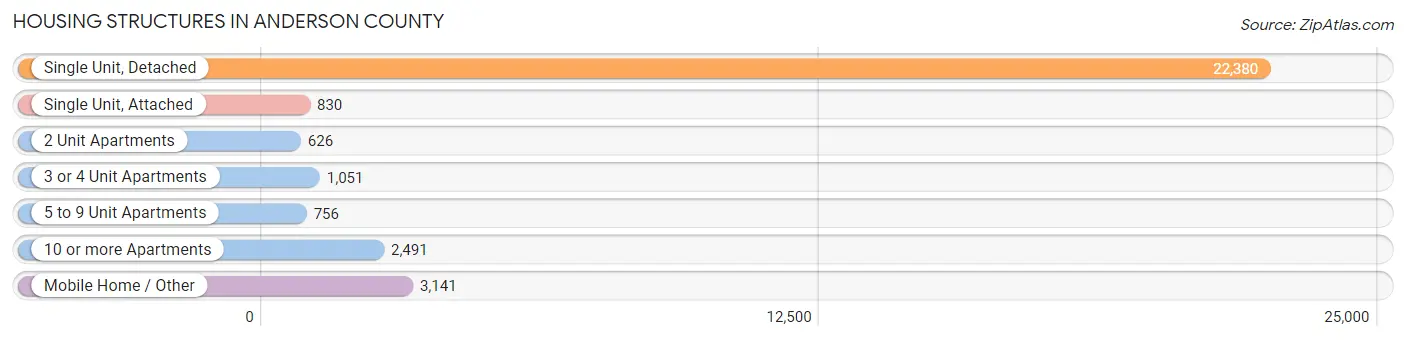
| Structure Type | # Housing Units | % Housing Units |
| Single Unit, Detached | 22,380 | 71.6% |
| Single Unit, Attached | 830 | 2.6% |
| 2 Unit Apartments | 626 | 2.0% |
| 3 or 4 Unit Apartments | 1,051 | 3.4% |
| 5 to 9 Unit Apartments | 756 | 2.4% |
| 10 or more Apartments | 2,491 | 8.0% |
| Mobile Home / Other | 3,141 | 10.0% |
| Total | 31,275 | 100.0% |
Housing Structures by Occupancy in Anderson County
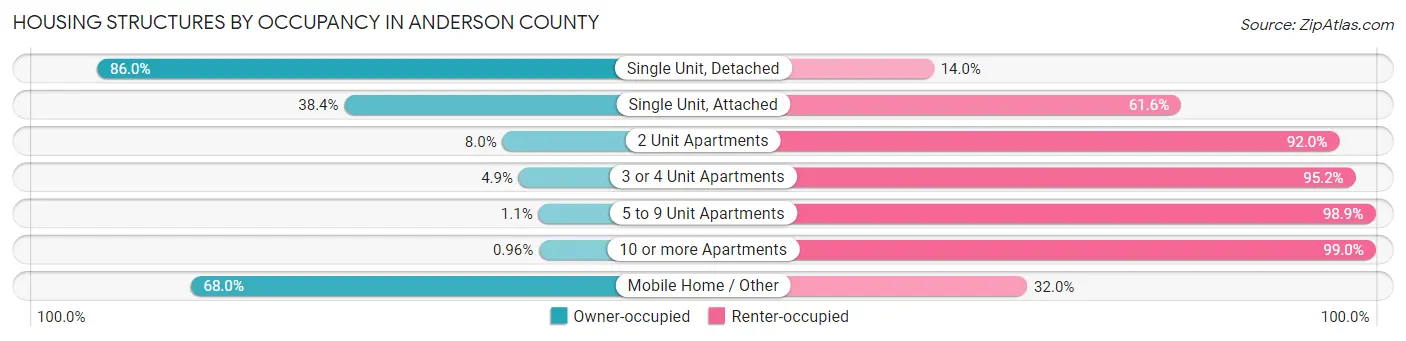
| Structure Type | Owner-occupied | Renter-occupied |
| Single Unit, Detached | 19,255 (86.0%) | 3,125 (14.0%) |
| Single Unit, Attached | 319 (38.4%) | 511 (61.6%) |
| 2 Unit Apartments | 50 (8.0%) | 576 (92.0%) |
| 3 or 4 Unit Apartments | 51 (4.9%) | 1,000 (95.2%) |
| 5 to 9 Unit Apartments | 8 (1.1%) | 748 (98.9%) |
| 10 or more Apartments | 24 (1.0%) | 2,467 (99.0%) |
| Mobile Home / Other | 2,137 (68.0%) | 1,004 (32.0%) |
| Total | 21,844 (69.8%) | 9,431 (30.2%) |
Housing Structures by Number of Rooms in Anderson County
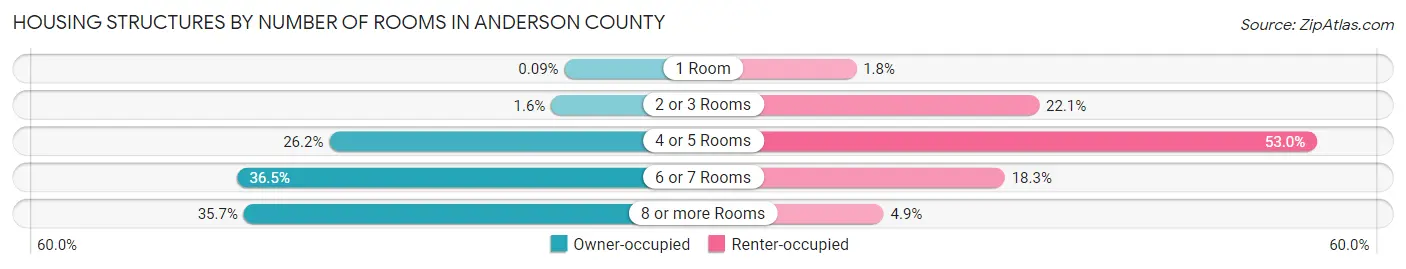
| Number of Rooms | Owner-occupied | Renter-occupied |
| 1 Room | 20 (0.1%) | 171 (1.8%) |
| 2 or 3 Rooms | 341 (1.6%) | 2,084 (22.1%) |
| 4 or 5 Rooms | 5,720 (26.2%) | 4,994 (52.9%) |
| 6 or 7 Rooms | 7,969 (36.5%) | 1,725 (18.3%) |
| 8 or more Rooms | 7,794 (35.7%) | 457 (4.9%) |
| Total | 21,844 (100.0%) | 9,431 (100.0%) |
Housing Structure by Heating Type in Anderson County
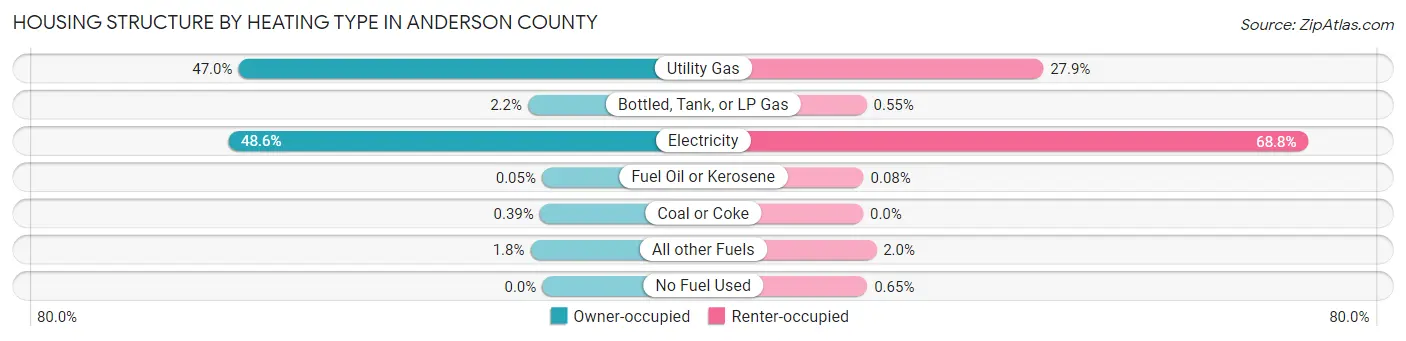
| Heating Type | Owner-occupied | Renter-occupied |
| Utility Gas | 10,261 (47.0%) | 2,627 (27.9%) |
| Bottled, Tank, or LP Gas | 482 (2.2%) | 52 (0.5%) |
| Electricity | 10,606 (48.5%) | 6,491 (68.8%) |
| Fuel Oil or Kerosene | 12 (0.1%) | 8 (0.1%) |
| Coal or Coke | 86 (0.4%) | 0 (0.0%) |
| All other Fuels | 397 (1.8%) | 192 (2.0%) |
| No Fuel Used | 0 (0.0%) | 61 (0.6%) |
| Total | 21,844 (100.0%) | 9,431 (100.0%) |
Household Vehicle Usage in Anderson County
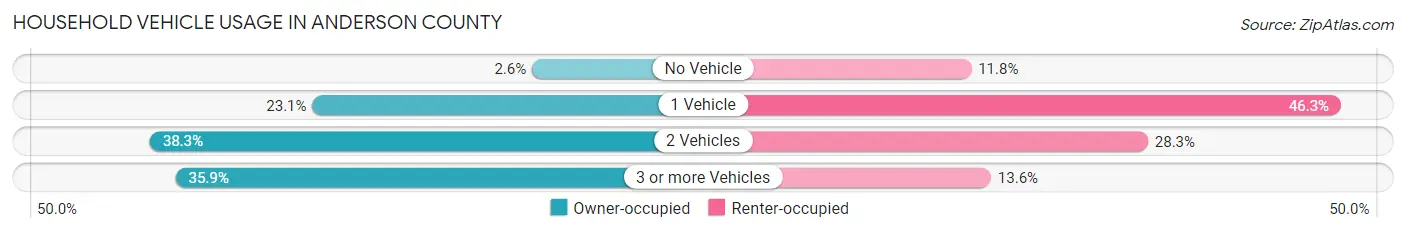
| Vehicles per Household | Owner-occupied | Renter-occupied |
| No Vehicle | 575 (2.6%) | 1,112 (11.8%) |
| 1 Vehicle | 5,055 (23.1%) | 4,367 (46.3%) |
| 2 Vehicles | 8,369 (38.3%) | 2,667 (28.3%) |
| 3 or more Vehicles | 7,845 (35.9%) | 1,285 (13.6%) |
| Total | 21,844 (100.0%) | 9,431 (100.0%) |
Real Estate & Mortgages in Anderson County
Real Estate and Mortgage Overview in Anderson County
| Characteristic | Without Mortgage | With Mortgage |
| Housing Units | 10,446 | 11,398 |
| Median Property Value | $168,600 | $214,700 |
| Median Household Income | $57,557 | $2,450 |
| Monthly Housing Costs | $450 | $412 |
| Real Estate Taxes | $1,267 | $359 |
Property Value by Mortgage Status in Anderson County
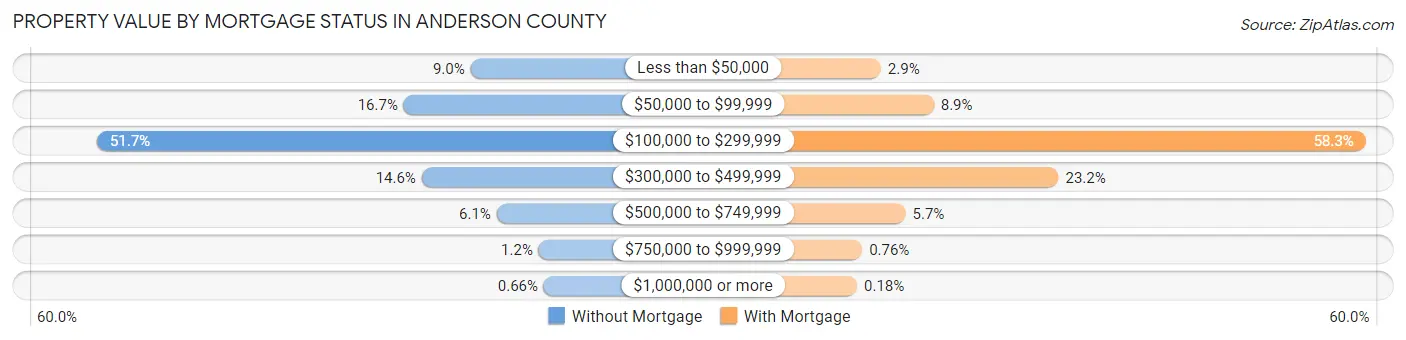
| Property Value | Without Mortgage | With Mortgage |
| Less than $50,000 | 943 (9.0%) | 330 (2.9%) |
| $50,000 to $99,999 | 1,741 (16.7%) | 1,019 (8.9%) |
| $100,000 to $299,999 | 5,404 (51.7%) | 6,645 (58.3%) |
| $300,000 to $499,999 | 1,527 (14.6%) | 2,644 (23.2%) |
| $500,000 to $749,999 | 632 (6.0%) | 652 (5.7%) |
| $750,000 to $999,999 | 130 (1.2%) | 87 (0.8%) |
| $1,000,000 or more | 69 (0.7%) | 21 (0.2%) |
| Total | 10,446 (100.0%) | 11,398 (100.0%) |
Household Income by Mortgage Status in Anderson County
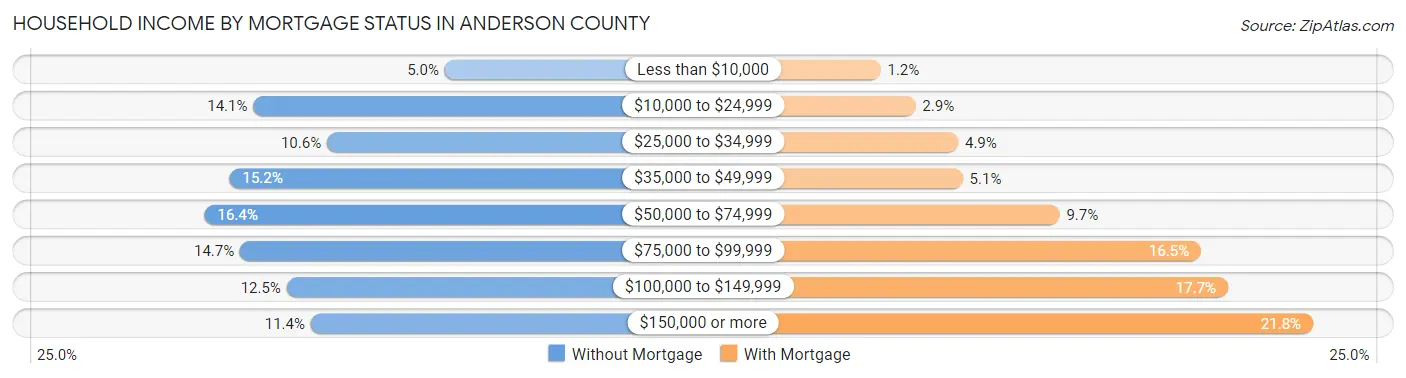
| Household Income | Without Mortgage | With Mortgage |
| Less than $10,000 | 521 (5.0%) | 136 (1.2%) |
| $10,000 to $24,999 | 1,474 (14.1%) | 325 (2.9%) |
| $25,000 to $34,999 | 1,107 (10.6%) | 556 (4.9%) |
| $35,000 to $49,999 | 1,592 (15.2%) | 581 (5.1%) |
| $50,000 to $74,999 | 1,716 (16.4%) | 1,107 (9.7%) |
| $75,000 to $99,999 | 1,540 (14.7%) | 1,875 (16.5%) |
| $100,000 to $149,999 | 1,308 (12.5%) | 2,021 (17.7%) |
| $150,000 or more | 1,188 (11.4%) | 2,483 (21.8%) |
| Total | 10,446 (100.0%) | 11,398 (100.0%) |
Property Value to Household Income Ratio in Anderson County
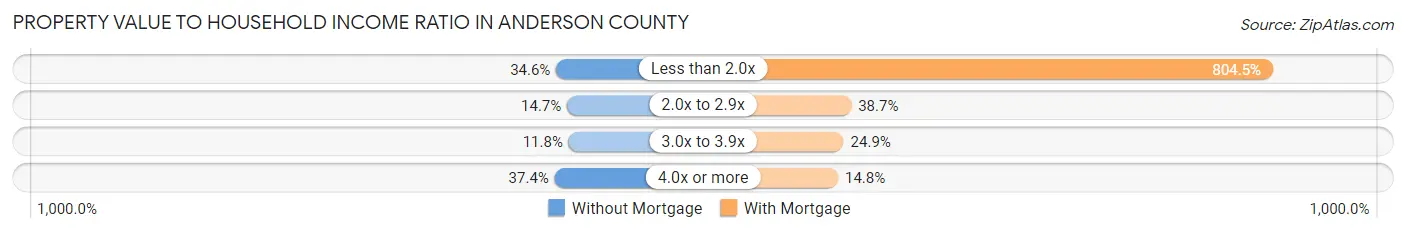
| Value-to-Income Ratio | Without Mortgage | With Mortgage |
| Less than 2.0x | 3,609 (34.5%) | 91,701 (804.5%) |
| 2.0x to 2.9x | 1,537 (14.7%) | 4,412 (38.7%) |
| 3.0x to 3.9x | 1,234 (11.8%) | 2,840 (24.9%) |
| 4.0x or more | 3,902 (37.3%) | 1,685 (14.8%) |
| Total | 10,446 (100.0%) | 11,398 (100.0%) |
Real Estate Taxes by Mortgage Status in Anderson County
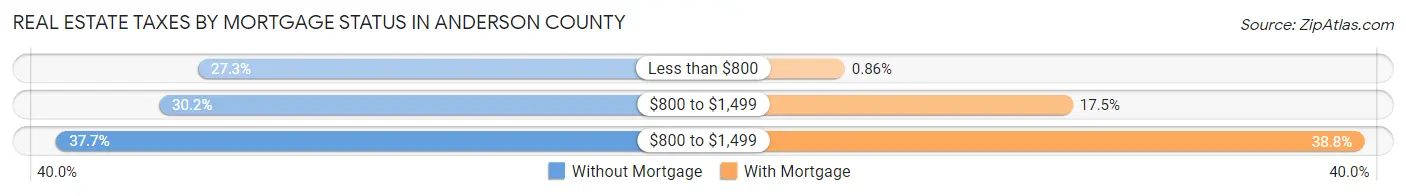
| Property Taxes | Without Mortgage | With Mortgage |
| Less than $800 | 2,856 (27.3%) | 98 (0.9%) |
| $800 to $1,499 | 3,152 (30.2%) | 1,997 (17.5%) |
| $800 to $1,499 | 3,936 (37.7%) | 4,421 (38.8%) |
| Total | 10,446 (100.0%) | 11,398 (100.0%) |
Health & Disability in Anderson County
Health Insurance Coverage by Age in Anderson County
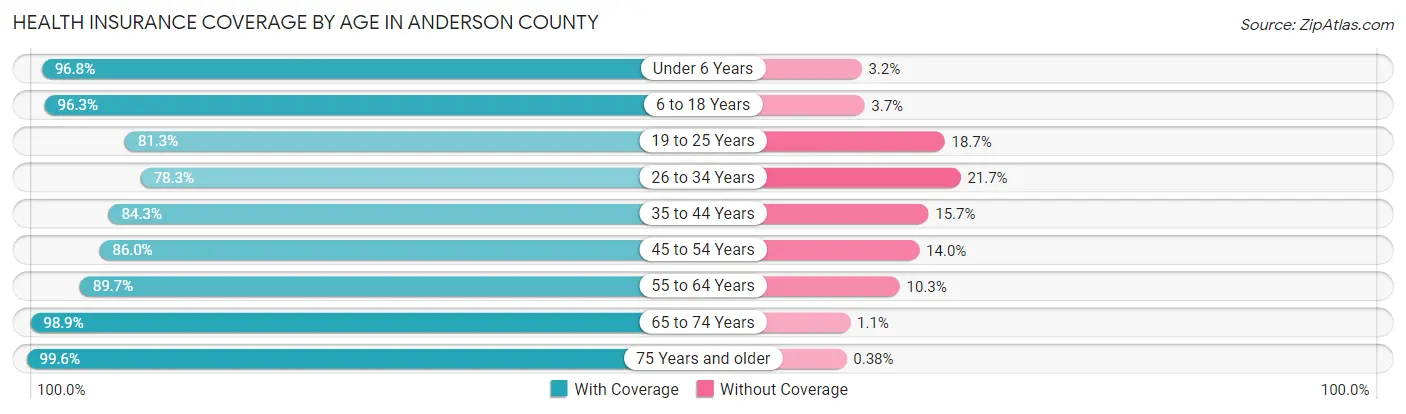
| Age Bracket | With Coverage | Without Coverage |
| Under 6 Years | 4,750 (96.8%) | 157 (3.2%) |
| 6 to 18 Years | 11,861 (96.3%) | 461 (3.7%) |
| 19 to 25 Years | 4,727 (81.3%) | 1,087 (18.7%) |
| 26 to 34 Years | 6,742 (78.3%) | 1,864 (21.7%) |
| 35 to 44 Years | 7,334 (84.3%) | 1,363 (15.7%) |
| 45 to 54 Years | 8,530 (86.0%) | 1,384 (14.0%) |
| 55 to 64 Years | 9,724 (89.7%) | 1,117 (10.3%) |
| 65 to 74 Years | 9,034 (98.9%) | 99 (1.1%) |
| 75 Years and older | 6,039 (99.6%) | 23 (0.4%) |
| Total | 68,741 (90.1%) | 7,555 (9.9%) |
Health Insurance Coverage by Citizenship Status in Anderson County
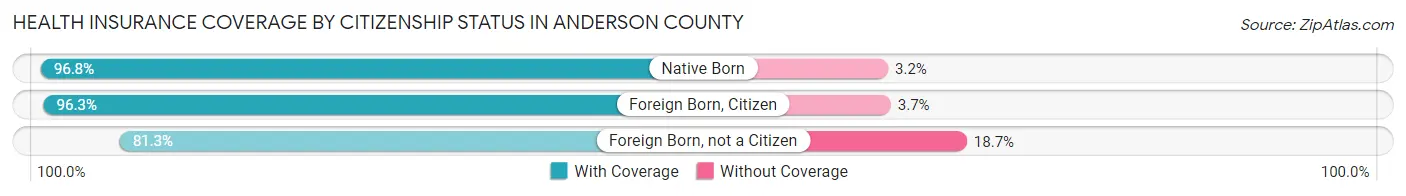
| Citizenship Status | With Coverage | Without Coverage |
| Native Born | 4,750 (96.8%) | 157 (3.2%) |
| Foreign Born, Citizen | 11,861 (96.3%) | 461 (3.7%) |
| Foreign Born, not a Citizen | 4,727 (81.3%) | 1,087 (18.7%) |
Health Insurance Coverage by Household Income in Anderson County
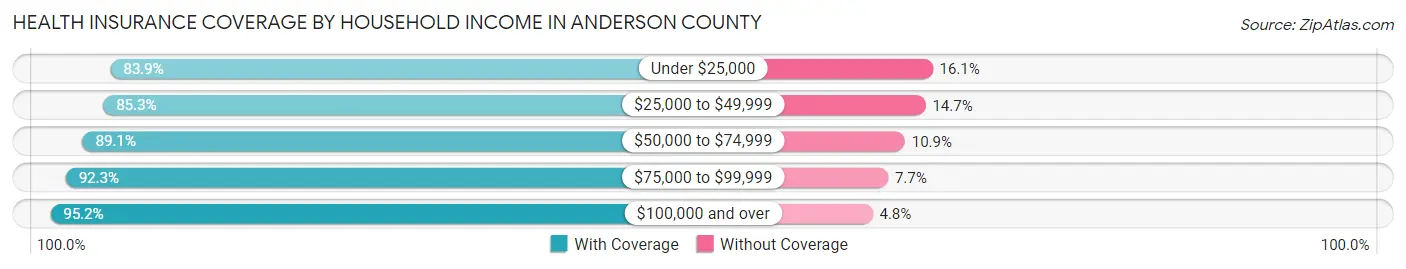
| Household Income | With Coverage | Without Coverage |
| Under $25,000 | 8,637 (83.9%) | 1,652 (16.1%) |
| $25,000 to $49,999 | 13,395 (85.3%) | 2,315 (14.7%) |
| $50,000 to $74,999 | 12,189 (89.1%) | 1,487 (10.9%) |
| $75,000 to $99,999 | 10,730 (92.3%) | 897 (7.7%) |
| $100,000 and over | 23,425 (95.2%) | 1,186 (4.8%) |
Public vs Private Health Insurance Coverage by Age in Anderson County
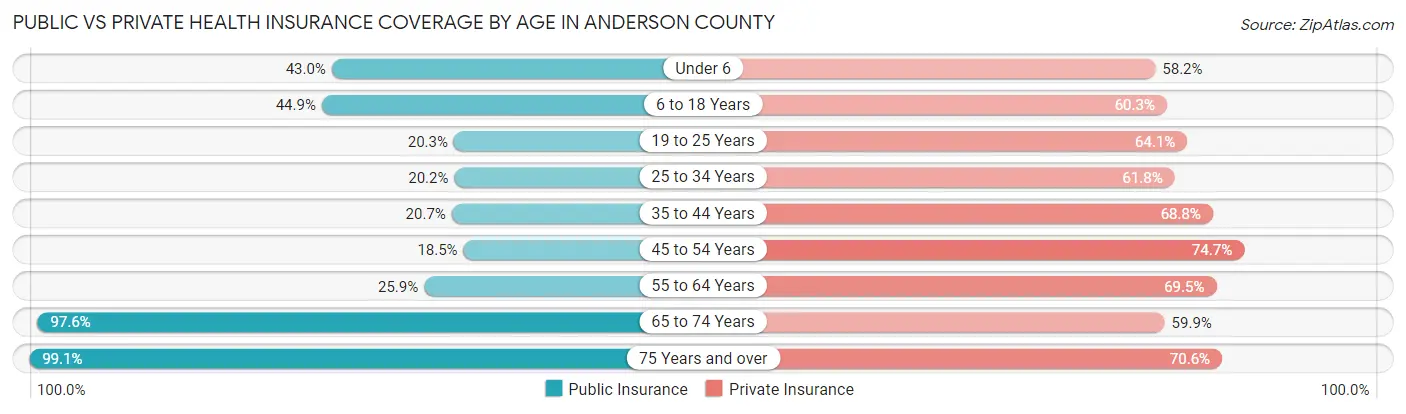
| Age Bracket | Public Insurance | Private Insurance |
| Under 6 | 2,110 (43.0%) | 2,856 (58.2%) |
| 6 to 18 Years | 5,527 (44.9%) | 7,432 (60.3%) |
| 19 to 25 Years | 1,182 (20.3%) | 3,727 (64.1%) |
| 25 to 34 Years | 1,742 (20.2%) | 5,315 (61.8%) |
| 35 to 44 Years | 1,803 (20.7%) | 5,987 (68.8%) |
| 45 to 54 Years | 1,838 (18.5%) | 7,402 (74.7%) |
| 55 to 64 Years | 2,802 (25.9%) | 7,535 (69.5%) |
| 65 to 74 Years | 8,916 (97.6%) | 5,473 (59.9%) |
| 75 Years and over | 6,010 (99.1%) | 4,277 (70.6%) |
| Total | 31,930 (41.8%) | 50,004 (65.5%) |
Disability Status by Sex by Age in Anderson County
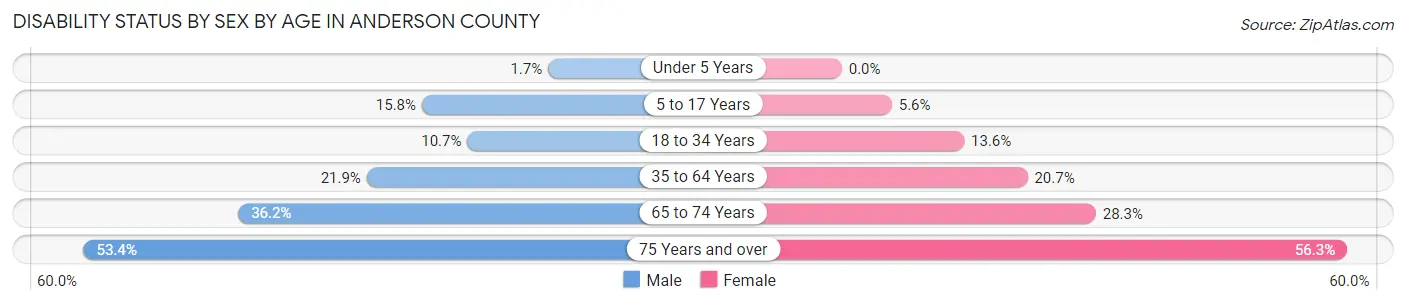
| Age Bracket | Male | Female |
| Under 5 Years | 34 (1.7%) | 0 (0.0%) |
| 5 to 17 Years | 987 (15.8%) | 340 (5.6%) |
| 18 to 34 Years | 848 (10.7%) | 998 (13.6%) |
| 35 to 64 Years | 3,135 (21.9%) | 3,131 (20.7%) |
| 65 to 74 Years | 1,561 (36.2%) | 1,364 (28.3%) |
| 75 Years and over | 1,388 (53.4%) | 1,949 (56.3%) |
Disability Class by Sex by Age in Anderson County
Disability Class: Hearing Difficulty
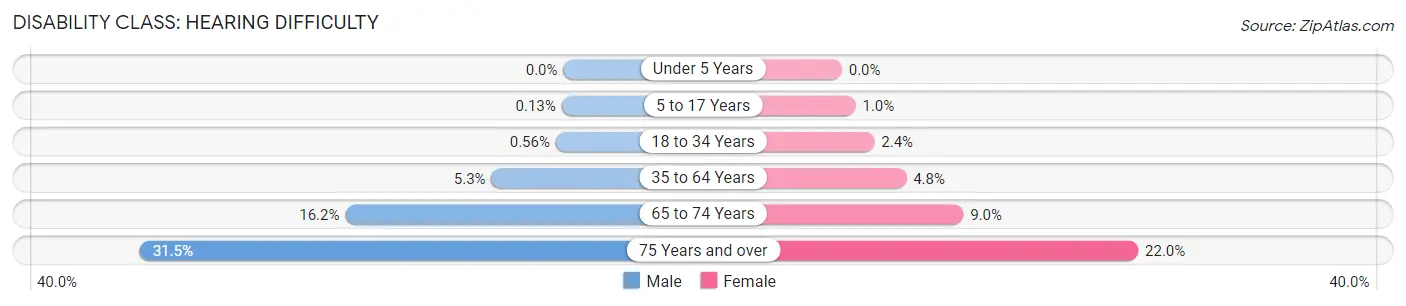
| Age Bracket | Male | Female |
| Under 5 Years | 0 (0.0%) | 0 (0.0%) |
| 5 to 17 Years | 8 (0.1%) | 62 (1.0%) |
| 18 to 34 Years | 44 (0.6%) | 177 (2.4%) |
| 35 to 64 Years | 765 (5.3%) | 723 (4.8%) |
| 65 to 74 Years | 698 (16.2%) | 435 (9.0%) |
| 75 Years and over | 817 (31.5%) | 762 (22.0%) |
Disability Class: Vision Difficulty
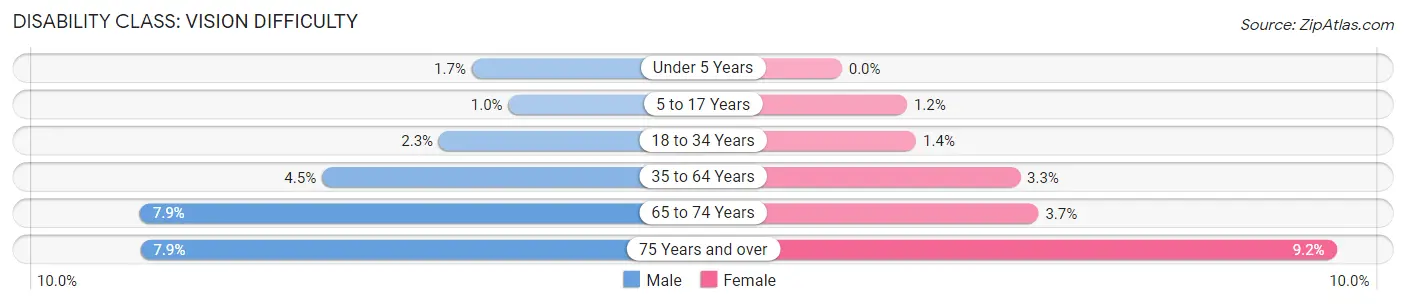
| Age Bracket | Male | Female |
| Under 5 Years | 34 (1.7%) | 0 (0.0%) |
| 5 to 17 Years | 64 (1.0%) | 74 (1.2%) |
| 18 to 34 Years | 183 (2.3%) | 101 (1.4%) |
| 35 to 64 Years | 641 (4.5%) | 501 (3.3%) |
| 65 to 74 Years | 339 (7.9%) | 176 (3.6%) |
| 75 Years and over | 204 (7.9%) | 318 (9.2%) |
Disability Class: Cognitive Difficulty
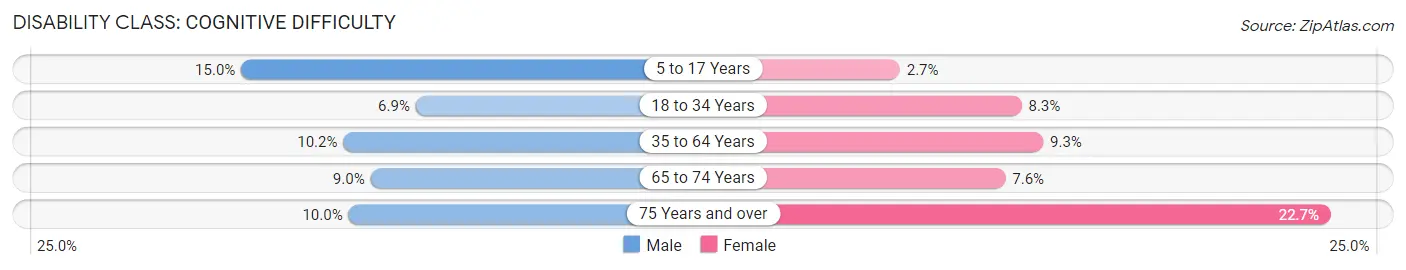
| Age Bracket | Male | Female |
| 5 to 17 Years | 936 (14.9%) | 164 (2.7%) |
| 18 to 34 Years | 543 (6.9%) | 611 (8.3%) |
| 35 to 64 Years | 1,462 (10.2%) | 1,414 (9.3%) |
| 65 to 74 Years | 386 (8.9%) | 366 (7.6%) |
| 75 Years and over | 259 (10.0%) | 786 (22.7%) |
Disability Class: Ambulatory Difficulty
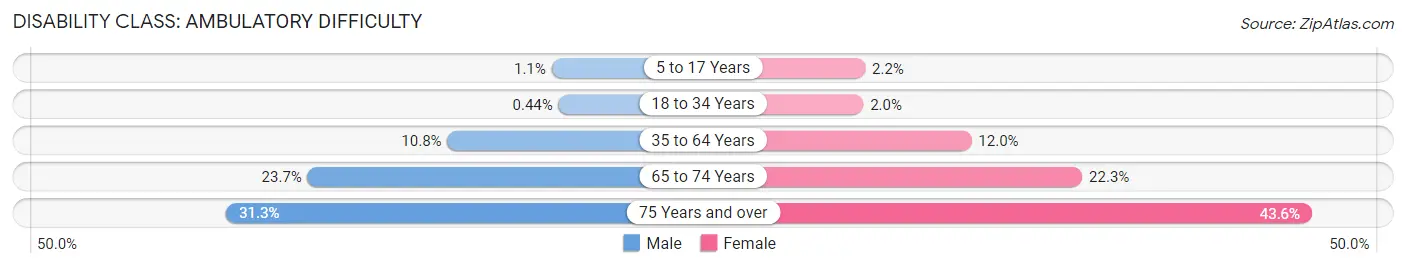
| Age Bracket | Male | Female |
| 5 to 17 Years | 68 (1.1%) | 132 (2.2%) |
| 18 to 34 Years | 35 (0.4%) | 146 (2.0%) |
| 35 to 64 Years | 1,540 (10.8%) | 1,821 (12.0%) |
| 65 to 74 Years | 1,023 (23.7%) | 1,076 (22.3%) |
| 75 Years and over | 813 (31.3%) | 1,511 (43.6%) |
Disability Class: Self-Care Difficulty
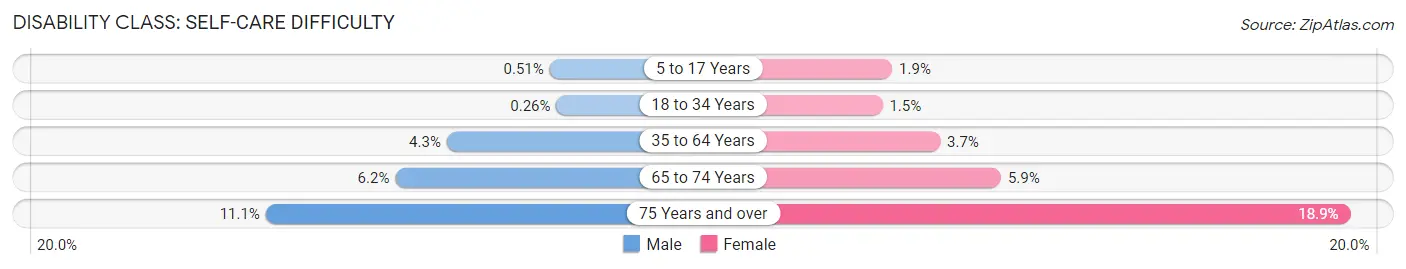
| Age Bracket | Male | Female |
| 5 to 17 Years | 32 (0.5%) | 114 (1.9%) |
| 18 to 34 Years | 21 (0.3%) | 111 (1.5%) |
| 35 to 64 Years | 620 (4.3%) | 552 (3.6%) |
| 65 to 74 Years | 269 (6.2%) | 285 (5.9%) |
| 75 Years and over | 287 (11.1%) | 654 (18.9%) |
Technology Access in Anderson County
Computing Device Access in Anderson County
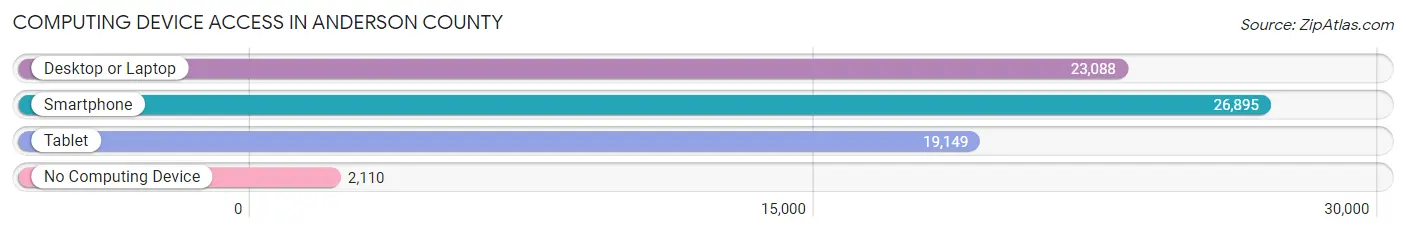
| Device Type | # Households | % Households |
| Desktop or Laptop | 23,088 | 73.8% |
| Smartphone | 26,895 | 86.0% |
| Tablet | 19,149 | 61.2% |
| No Computing Device | 2,110 | 6.8% |
| Total | 31,275 | 100.0% |
Internet Access in Anderson County
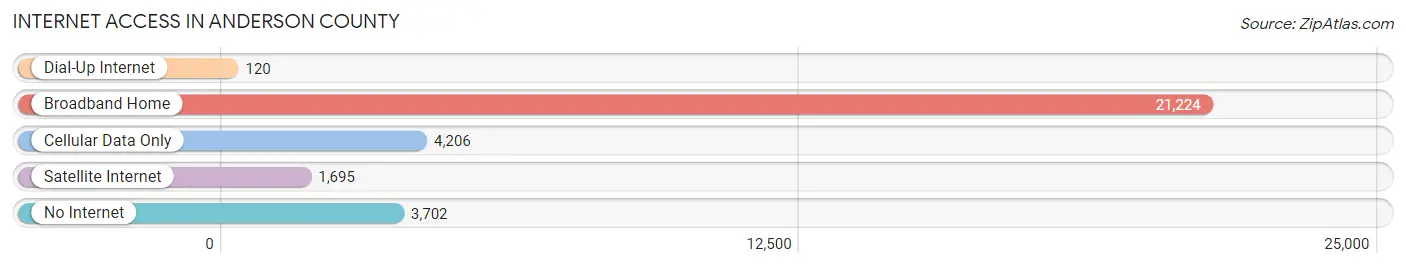
| Internet Type | # Households | % Households |
| Dial-Up Internet | 120 | 0.4% |
| Broadband Home | 21,224 | 67.9% |
| Cellular Data Only | 4,206 | 13.5% |
| Satellite Internet | 1,695 | 5.4% |
| No Internet | 3,702 | 11.8% |
| Total | 31,275 | 100.0% |
Anderson County Summary
Anderson County is located in the eastern part of Tennessee, and is part of the Knoxville Metropolitan Statistical Area. It is bordered by Knox, Roane, Morgan, Scott, and Campbell counties. The county seat is Clinton, and the largest city is Oak Ridge. The county was established in 1801 and named for Joseph Anderson, a state senator and judge.
Geography
Anderson County is located in the Appalachian Mountains region of Tennessee. It is situated in the Ridge and Valley region of the Appalachian Mountains, and is characterized by rolling hills and valleys. The county is drained by the Clinch River, which flows through the county from north to south. The county has a total area of 437 square miles, of which 434 square miles is land and 3 square miles is water.
The highest point in the county is located at the summit of Black Mountain, which has an elevation of 2,890 feet. The lowest point is located at the confluence of the Clinch and Tennessee Rivers, which has an elevation of 860 feet.
Climate
Anderson County has a humid subtropical climate, with hot, humid summers and mild winters. The average annual temperature is 57°F, and the average annual precipitation is 48 inches.
Demographics
As of the 2010 census, there were 75,129 people, 28,945 households, and 20,845 families residing in the county. The population density was 173 people per square mile. The racial makeup of the county was 92.2% White, 4.2% African American, 0.5% Native American, 1.2% Asian, 0.1% Pacific Islander, 0.7% from other races, and 1.1% from two or more races. Hispanic or Latino of any race were 2.2% of the population.
The median income for a household in the county was $45,945, and the median income for a family was $54,817. The per capita income for the county was $22,945. About 8.7% of families and 11.3% of the population were below the poverty line, including 15.2% of those under age 18 and 8.2% of those age 65 or over.
Economy
The economy of Anderson County is largely based on manufacturing and services. The county is home to several large manufacturing companies, including the Oak Ridge National Laboratory, the Y-12 National Security Complex, and the K-25 Site. The county is also home to several large retail stores, including Walmart, Target, and Lowe's.
The county is also home to several higher education institutions, including the University of Tennessee, Roane State Community College, and Tennessee Technological University.
The county is served by two major highways, Interstate 75 and U.S. Route 441. The county is also served by several airports, including the Knoxville McGhee Tyson Airport, the Oak Ridge Municipal Airport, and the Clinton Municipal Airport.
Conclusion
Anderson County is a rural county located in the eastern part of Tennessee. It is part of the Knoxville Metropolitan Statistical Area, and is bordered by Knox, Roane, Morgan, Scott, and Campbell counties. The county has a humid subtropical climate, with hot, humid summers and mild winters. The population of the county was 75,129 as of the 2010 census, and the median income for a household was $45,945. The economy of the county is largely based on manufacturing and services, and the county is served by two major highways and several airports.
Common Questions
What is the Total Population of Anderson County?
Total Population of Anderson County is 77,337.
What is the Total Male Population of Anderson County?
Total Male Population of Anderson County is 37,953.
What is the Total Female Population of Anderson County?
Total Female Population of Anderson County is 39,384.
What is the Ratio of Males per 100 Females in Anderson County?
There are 96.37 Males per 100 Females in Anderson County.
What is the Ratio of Females per 100 Males in Anderson County?
There are 103.77 Females per 100 Males in Anderson County.
What is the Median Population Age in Anderson County?
Median Population Age in Anderson County is 42.1 Years.
What is the Average Family Size in Anderson County
Average Family Size in Anderson County is 3.0 People.
What is the Average Household Size in Anderson County
Average Household Size in Anderson County is 2.4 People.
What is Per Capita Income in Anderson County?
Per Capita income in Anderson County is $32,803.
What is the Median Family Income in Anderson County?
Median Family Income in Anderson County is $75,637.
What is the Median Household income in Anderson County?
Median Household Income in Anderson County is $60,633.
What is Income or Wage Gap in Anderson County?
Income or Wage Gap in Anderson County is 25.9%.
Women in Anderson County earn 74.1 cents for every dollar earned by a man.
What is Family Income Deficit in Anderson County?
Family Income Deficit in Anderson County is $10,027.
Families that are below poverty line in Anderson County earn $10,027 less on average than the poverty threshold level.
What is Inequality or Gini Index in Anderson County?
Inequality or Gini Index in Anderson County is 0.45.
How Large is the Labor Force in Anderson County?
There are 34,917 People in the Labor Forcein in Anderson County.
What is the Percentage of People in the Labor Force in Anderson County?
55.6% of People are in the Labor Force in Anderson County.
What is the Unemployment Rate in Anderson County?
Unemployment Rate in Anderson County is 5.4%.