Nesika Beach, OR
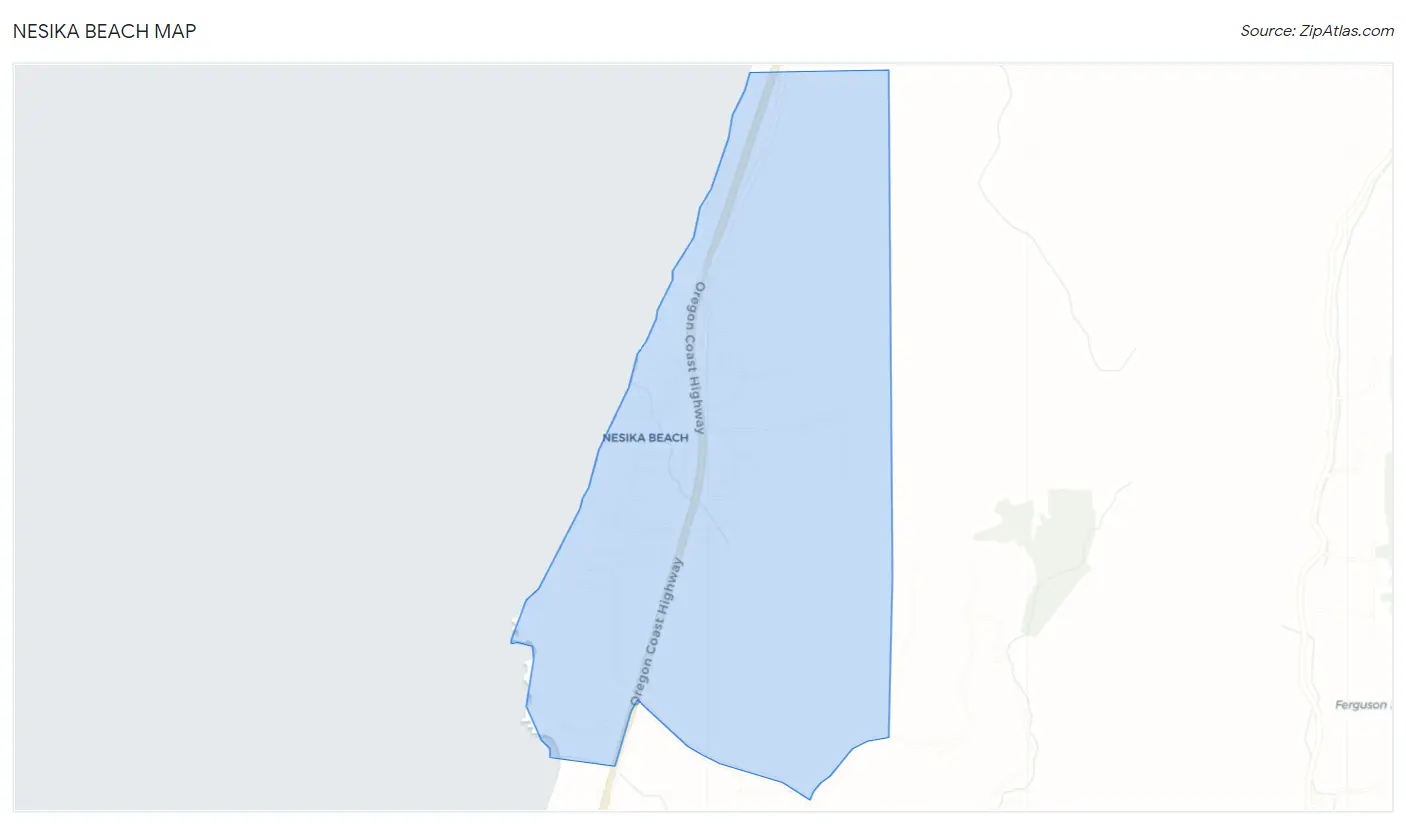
Nesika Beach Map
Nesika Beach Overview
355
TOTAL POPULATION
203
MALE POPULATION
152
FEMALE POPULATION
133.55
MALES / 100 FEMALES
74.88
FEMALES / 100 MALES
65.0
MEDIAN AGE
2.1
AVG FAMILY SIZE
2.0
AVG HOUSEHOLD SIZE
$35,382
PER CAPITA INCOME
$82,589
AVG FAMILY INCOME
$68,261
AVG HOUSEHOLD INCOME
0.17
INEQUALITY / GINI INDEX
83
LABOR FORCE [ PEOPLE ]
23.4%
PERCENT IN LABOR FORCE
3.6%
UNEMPLOYMENT RATE
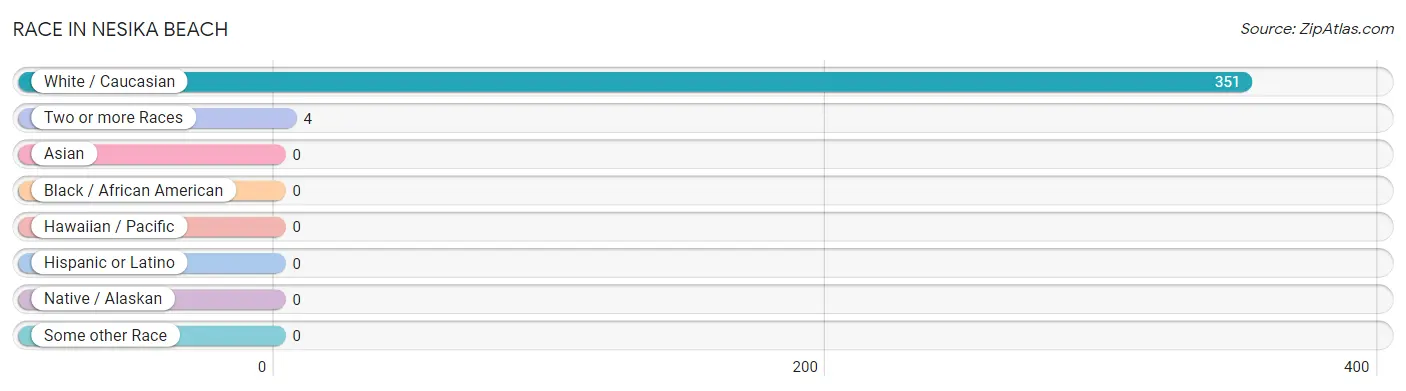
Race in Nesika Beach
The most populous races in Nesika Beach are White / Caucasian (351 | 98.9%), and Two or more Races (4 | 1.1%).
| Race | # Population | % Population |
| Asian | 0 | 0.0% |
| Black / African American | 0 | 0.0% |
| Hawaiian / Pacific | 0 | 0.0% |
| Hispanic or Latino | 0 | 0.0% |
| Native / Alaskan | 0 | 0.0% |
| White / Caucasian | 351 | 98.9% |
| Two or more Races | 4 | 1.1% |
| Some other Race | 0 | 0.0% |
| Total | 355 | 100.0% |
Ancestry in Nesika Beach
The most populous ancestries reported in Nesika Beach are English (44 | 12.4%), Norwegian (28 | 7.9%), German (25 | 7.0%), Portuguese (19 | 5.3%), and Slovene (14 | 3.9%), together accounting for 36.6% of all Nesika Beach residents.
| Ancestry | # Population | % Population |
| English | 44 | 12.4% |
| German | 25 | 7.0% |
| Indian (Asian) | 1 | 0.3% |
| Irish | 4 | 1.1% |
| Italian | 11 | 3.1% |
| Norwegian | 28 | 7.9% |
| Portuguese | 19 | 5.3% |
| Scotch-Irish | 7 | 2.0% |
| Slovene | 14 | 3.9% |
| Thai | 3 | 0.9% |
| Welsh | 14 | 3.9% | View All 11 Rows |
Immigrants in Nesika Beach

| Immigration Origin | # Population | % Population | View All 0 Rows |
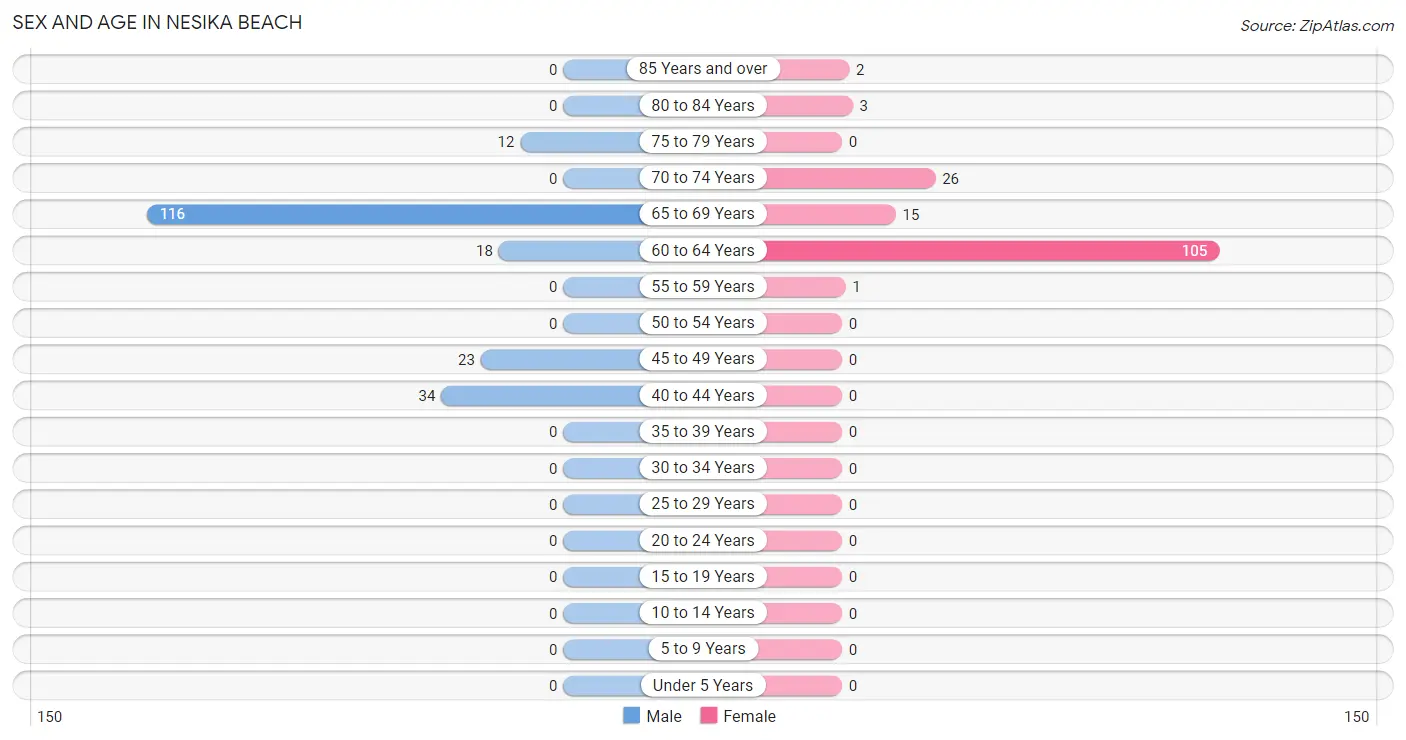
Sex and Age in Nesika Beach
Sex and Age in Nesika Beach
The most populous age groups in Nesika Beach are 65 to 69 Years (116 | 57.1%) for men and 60 to 64 Years (105 | 69.1%) for women.
| Age Bracket | Male | Female |
| Under 5 Years | 0 (0.0%) | 0 (0.0%) |
| 5 to 9 Years | 0 (0.0%) | 0 (0.0%) |
| 10 to 14 Years | 0 (0.0%) | 0 (0.0%) |
| 15 to 19 Years | 0 (0.0%) | 0 (0.0%) |
| 20 to 24 Years | 0 (0.0%) | 0 (0.0%) |
| 25 to 29 Years | 0 (0.0%) | 0 (0.0%) |
| 30 to 34 Years | 0 (0.0%) | 0 (0.0%) |
| 35 to 39 Years | 0 (0.0%) | 0 (0.0%) |
| 40 to 44 Years | 34 (16.8%) | 0 (0.0%) |
| 45 to 49 Years | 23 (11.3%) | 0 (0.0%) |
| 50 to 54 Years | 0 (0.0%) | 0 (0.0%) |
| 55 to 59 Years | 0 (0.0%) | 1 (0.7%) |
| 60 to 64 Years | 18 (8.9%) | 105 (69.1%) |
| 65 to 69 Years | 116 (57.1%) | 15 (9.9%) |
| 70 to 74 Years | 0 (0.0%) | 26 (17.1%) |
| 75 to 79 Years | 12 (5.9%) | 0 (0.0%) |
| 80 to 84 Years | 0 (0.0%) | 3 (2.0%) |
| 85 Years and over | 0 (0.0%) | 2 (1.3%) |
| Total | 203 (100.0%) | 152 (100.0%) |
Families and Households in Nesika Beach
Median Family Size in Nesika Beach
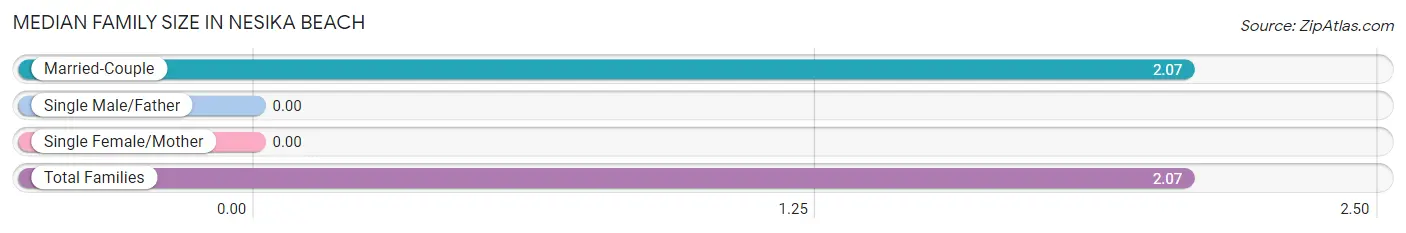
| Family Type | # Families | Family Size |
| Married-Couple | 134 (100.0%) | 2.07 |
| Single Male/Father | 0 (0.0%) | - |
| Single Female/Mother | 0 (0.0%) | - |
| Total Families | 134 (100.0%) | 2.07 |
Median Household Size in Nesika Beach
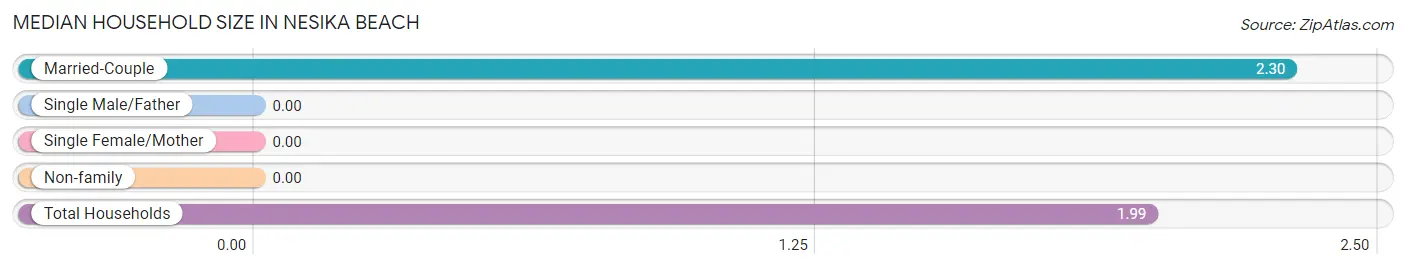
| Household Type | # Households | Household Size |
| Married-Couple | 134 (76.1%) | 2.30 |
| Single Male/Father | 0 (0.0%) | - |
| Single Female/Mother | 0 (0.0%) | - |
| Non-family | 42 (23.9%) | - |
| Total Households | 176 (100.0%) | 1.99 |
Household Size by Marriage Status in Nesika Beach
Out of a total of 176 households in Nesika Beach, 134 (76.1%) are family households, while 42 (23.9%) are nonfamily households. The most numerous type of family households are 2-person households, comprising 90, and the most common type of nonfamily households are 1-person households, comprising 42.
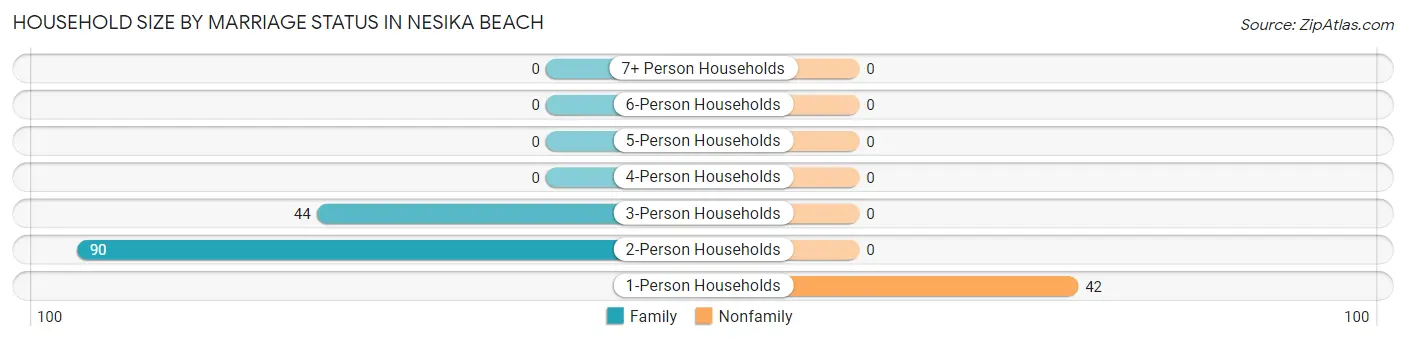
| Household Size | Family Households | Nonfamily Households |
| 1-Person Households | - | 42 (23.9%) |
| 2-Person Households | 90 (51.1%) | 0 (0.0%) |
| 3-Person Households | 44 (25.0%) | 0 (0.0%) |
| 4-Person Households | 0 (0.0%) | 0 (0.0%) |
| 5-Person Households | 0 (0.0%) | 0 (0.0%) |
| 6-Person Households | 0 (0.0%) | 0 (0.0%) |
| 7+ Person Households | 0 (0.0%) | 0 (0.0%) |
| Total | 134 (76.1%) | 42 (23.9%) |
Female Fertility in Nesika Beach
Fertility by Age in Nesika Beach
| Age Bracket | Women with Births | Births / 1,000 Women |
| 15 to 19 years | 0 (0.0%) | 0.0 |
| 20 to 34 years | 0 (0.0%) | 0.0 |
| 35 to 50 years | 0 (0.0%) | 0.0 |
| Total | 0 (0.0%) | 0.0 |
Fertility by Age by Marriage Status in Nesika Beach
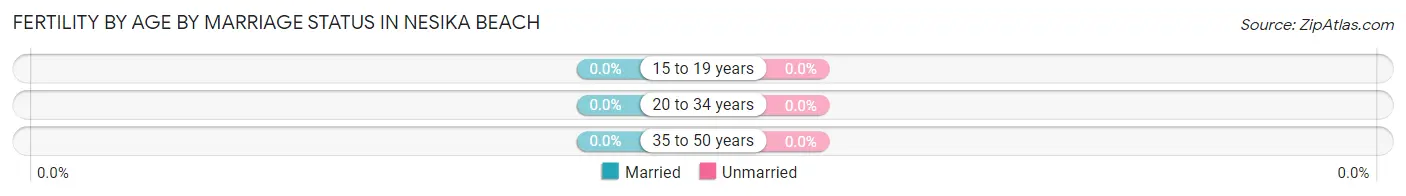
| Age Bracket | Married | Unmarried |
| 15 to 19 years | 0 (0.0%) | 0 (0.0%) |
| 20 to 34 years | 0 (0.0%) | 0 (0.0%) |
| 35 to 50 years | 0 (0.0%) | 0 (0.0%) |
| Total | 0 (0.0%) | 0 (0.0%) |
Fertility by Education in Nesika Beach
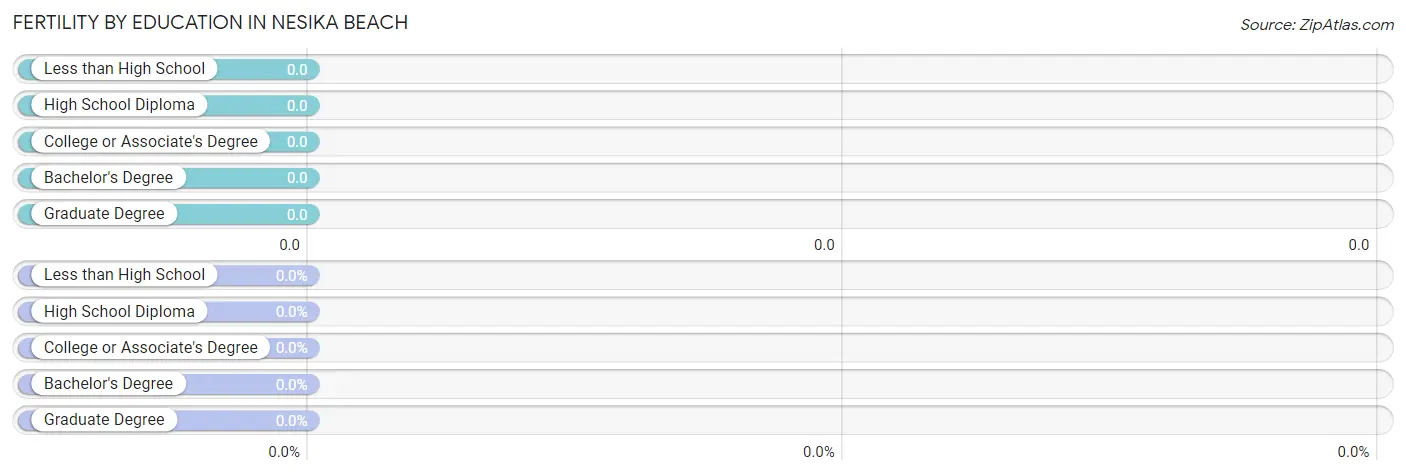
| Educational Attainment | Women with Births | Births / 1,000 Women |
| Less than High School | 0 (0.0%) | 0.0 |
| High School Diploma | 0 (0.0%) | 0.0 |
| College or Associate's Degree | 0 (0.0%) | 0.0 |
| Bachelor's Degree | 0 (0.0%) | 0.0 |
| Graduate Degree | 0 (0.0%) | 0.0 |
| Total | 0 (0.0%) | 0.0 |
Fertility by Education by Marriage Status in Nesika Beach
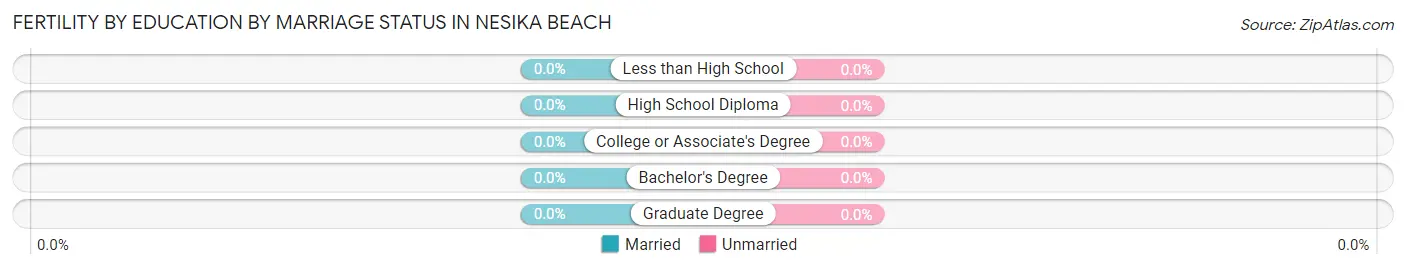
| Educational Attainment | Married | Unmarried |
| Less than High School | 0 (0.0%) | 0 (0.0%) |
| High School Diploma | 0 (0.0%) | 0 (0.0%) |
| College or Associate's Degree | 0 (0.0%) | 0 (0.0%) |
| Bachelor's Degree | 0 (0.0%) | 0 (0.0%) |
| Graduate Degree | 0 (0.0%) | 0 (0.0%) |
| Total | 0 (0.0%) | 0 (0.0%) |
Income in Nesika Beach
Income Overview in Nesika Beach
Per Capita Income in Nesika Beach is $35,382, while median incomes of families and households are $82,589 and $68,261 respectively.
| Characteristic | Number | Measure |
| Per Capita Income | 355 | $35,382 |
| Median Family Income | 134 | $82,589 |
| Mean Family Income | 134 | $74,464 |
| Median Household Income | 176 | $68,261 |
| Mean Household Income | 176 | $67,970 |
| Income Deficit | 134 | $0 |
| Wage / Income Gap (%) | 355 | 0.00% |
| Wage / Income Gap ($) | 355 | 100.00¢ per $1 |
| Gini / Inequality Index | 355 | 0.17 |
Earnings by Sex in Nesika Beach
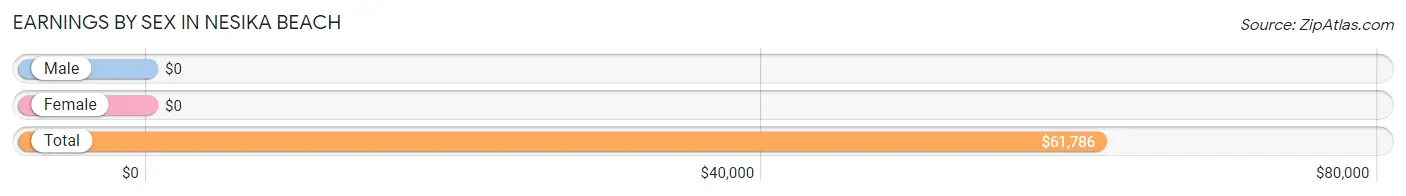
| Sex | Number | Average Earnings |
| Male | 23 (28.7%) | $0 |
| Female | 57 (71.3%) | $0 |
| Total | 80 (100.0%) | $61,786 |
Earnings by Sex by Income Bracket in Nesika Beach
The most common earnings brackets in Nesika Beach are $65,000 to $74,999 for men (23 | 100.0%) and $55,000 to $64,999 for women (56 | 98.3%).
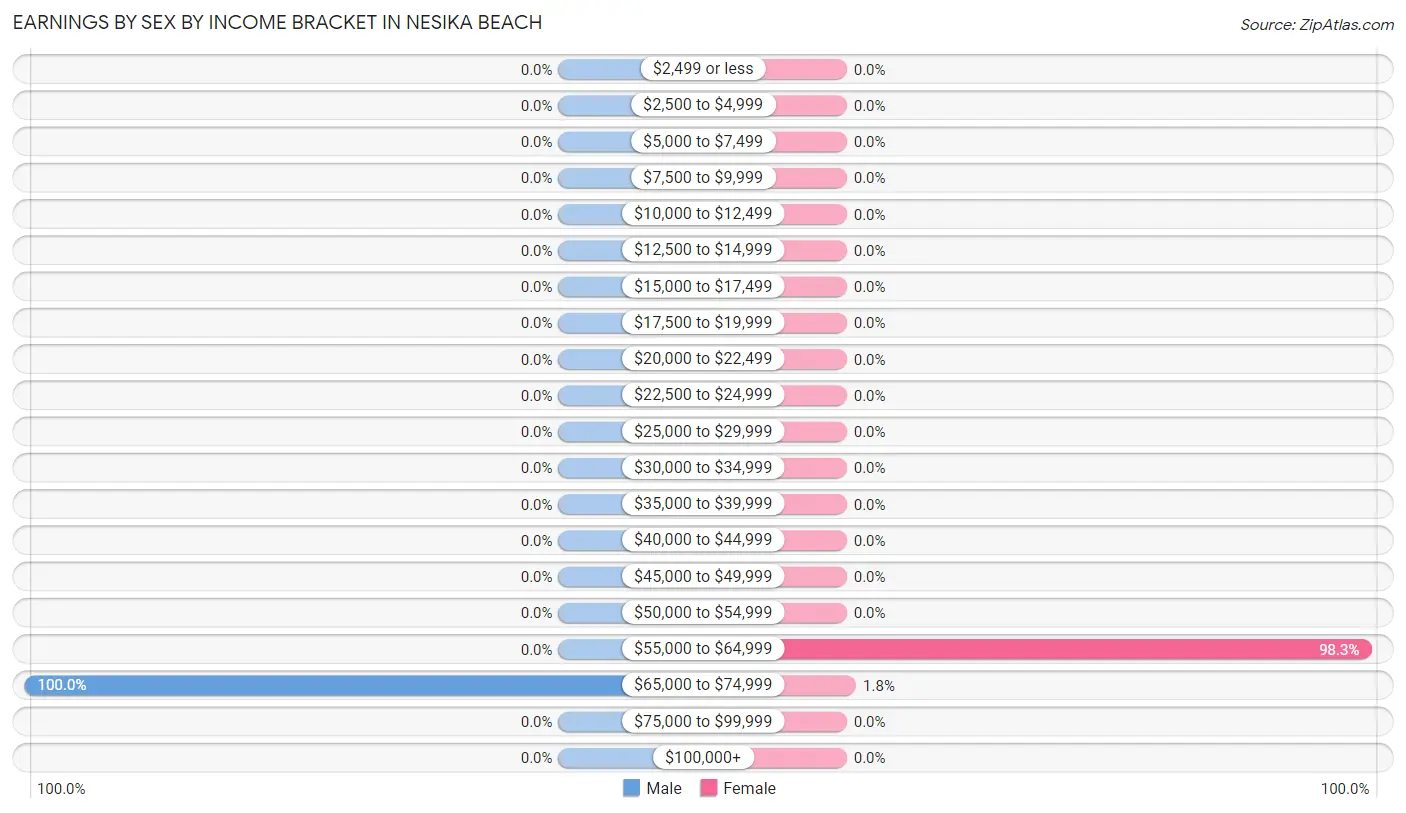
| Income | Male | Female |
| $2,499 or less | 0 (0.0%) | 0 (0.0%) |
| $2,500 to $4,999 | 0 (0.0%) | 0 (0.0%) |
| $5,000 to $7,499 | 0 (0.0%) | 0 (0.0%) |
| $7,500 to $9,999 | 0 (0.0%) | 0 (0.0%) |
| $10,000 to $12,499 | 0 (0.0%) | 0 (0.0%) |
| $12,500 to $14,999 | 0 (0.0%) | 0 (0.0%) |
| $15,000 to $17,499 | 0 (0.0%) | 0 (0.0%) |
| $17,500 to $19,999 | 0 (0.0%) | 0 (0.0%) |
| $20,000 to $22,499 | 0 (0.0%) | 0 (0.0%) |
| $22,500 to $24,999 | 0 (0.0%) | 0 (0.0%) |
| $25,000 to $29,999 | 0 (0.0%) | 0 (0.0%) |
| $30,000 to $34,999 | 0 (0.0%) | 0 (0.0%) |
| $35,000 to $39,999 | 0 (0.0%) | 0 (0.0%) |
| $40,000 to $44,999 | 0 (0.0%) | 0 (0.0%) |
| $45,000 to $49,999 | 0 (0.0%) | 0 (0.0%) |
| $50,000 to $54,999 | 0 (0.0%) | 0 (0.0%) |
| $55,000 to $64,999 | 0 (0.0%) | 56 (98.3%) |
| $65,000 to $74,999 | 23 (100.0%) | 1 (1.8%) |
| $75,000 to $99,999 | 0 (0.0%) | 0 (0.0%) |
| $100,000+ | 0 (0.0%) | 0 (0.0%) |
| Total | 23 (100.0%) | 57 (100.0%) |
Earnings by Sex by Educational Attainment in Nesika Beach
| Educational Attainment | Male Income | Female Income |
| Less than High School | - | - |
| High School Diploma | - | - |
| College or Associate's Degree | - | - |
| Bachelor's Degree | - | - |
| Graduate Degree | - | - |
| Total | - | - |
Family Income in Nesika Beach
Family Income Brackets in Nesika Beach
According to the Nesika Beach family income data, there are 66 families falling into the $75,000 to $99,999 income range, which is the most common income bracket and makes up 49.2% of all families.
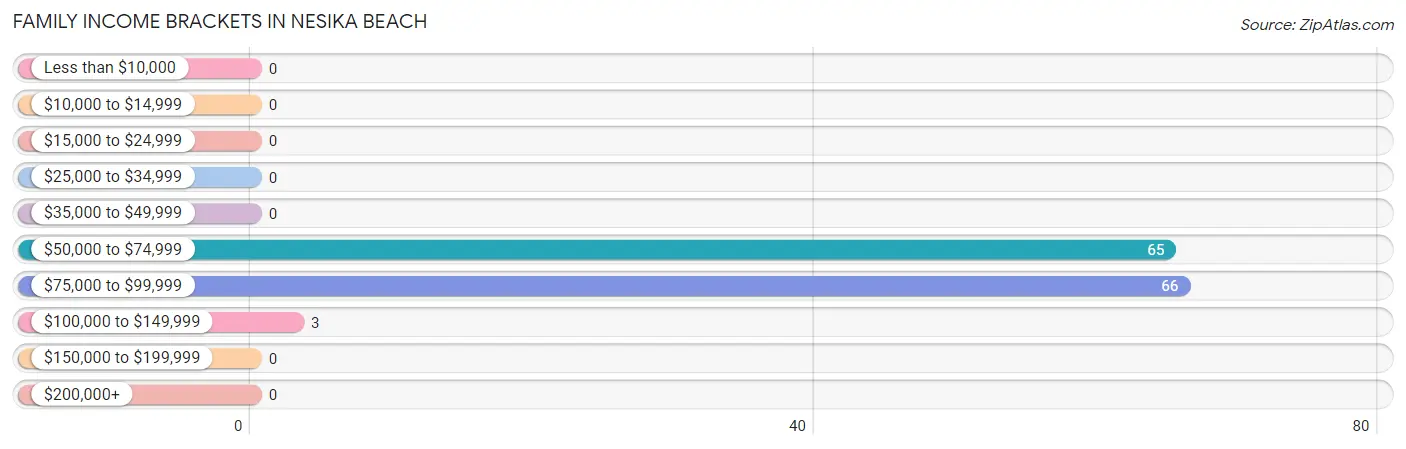
| Income Bracket | # Families | % Families |
| Less than $10,000 | 0 | 0.0% |
| $10,000 to $14,999 | 0 | 0.0% |
| $15,000 to $24,999 | 0 | 0.0% |
| $25,000 to $34,999 | 0 | 0.0% |
| $35,000 to $49,999 | 0 | 0.0% |
| $50,000 to $74,999 | 65 | 48.5% |
| $75,000 to $99,999 | 66 | 49.3% |
| $100,000 to $149,999 | 3 | 2.2% |
| $150,000 to $199,999 | 0 | 0.0% |
| $200,000+ | 0 | 0.0% |
Family Income by Famaliy Size in Nesika Beach
2-person families (134 | 100.0%) account for the highest median family income in Nesika Beach with $82,589 per family, while 2-person families (134 | 100.0%) have the highest median income of $41,294 per family member.
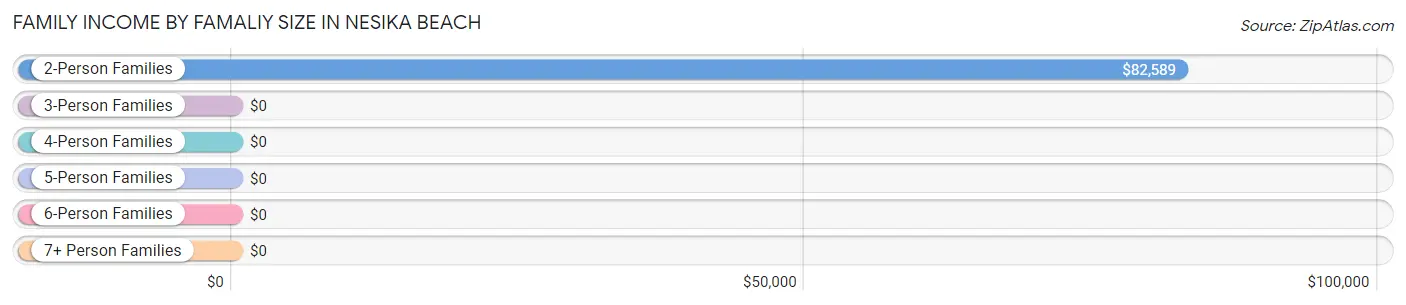
| Income Bracket | # Families | Median Income |
| 2-Person Families | 134 (100.0%) | $82,589 |
| 3-Person Families | 0 (0.0%) | $0 |
| 4-Person Families | 0 (0.0%) | $0 |
| 5-Person Families | 0 (0.0%) | $0 |
| 6-Person Families | 0 (0.0%) | $0 |
| 7+ Person Families | 0 (0.0%) | $0 |
| Total | 134 (100.0%) | $82,589 |
Family Income by Number of Earners in Nesika Beach
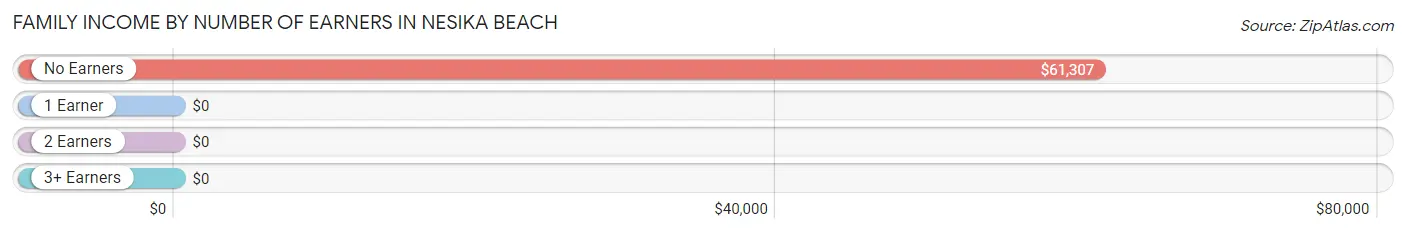
| Number of Earners | # Families | Median Income |
| No Earners | 74 (55.2%) | $61,307 |
| 1 Earner | 60 (44.8%) | $0 |
| 2 Earners | 0 (0.0%) | $0 |
| 3+ Earners | 0 (0.0%) | $0 |
| Total | 134 (100.0%) | $82,589 |
Household Income in Nesika Beach
Household Income Brackets in Nesika Beach
With 88 households falling in the category, the $50,000 to $74,999 income range is the most frequent in Nesika Beach, accounting for 50.0% of all households.
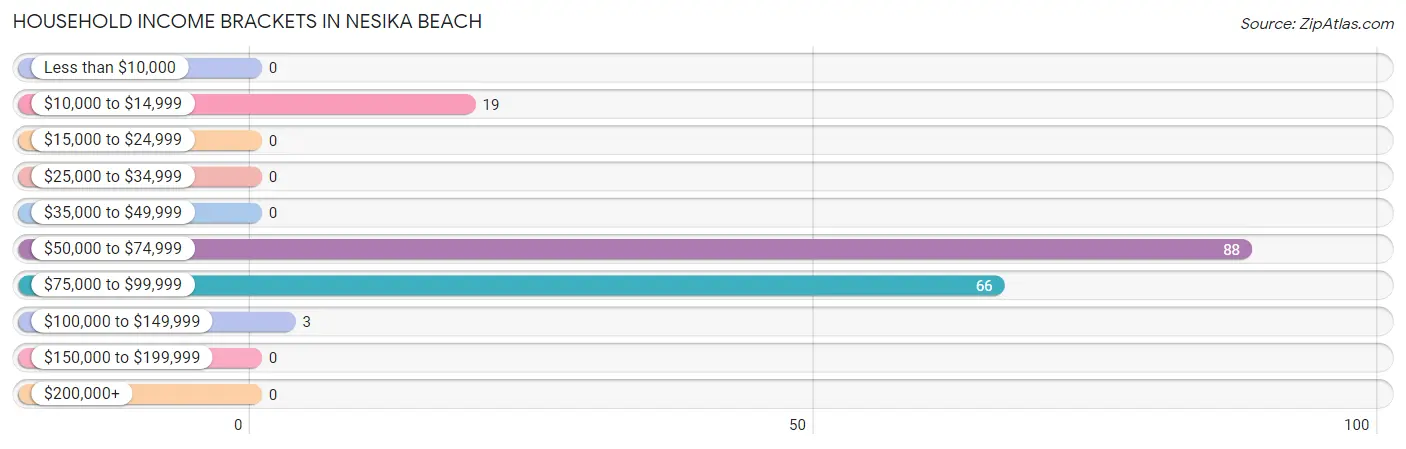
| Income Bracket | # Households | % Households |
| Less than $10,000 | 0 | 0.0% |
| $10,000 to $14,999 | 19 | 10.8% |
| $15,000 to $24,999 | 0 | 0.0% |
| $25,000 to $34,999 | 0 | 0.0% |
| $35,000 to $49,999 | 0 | 0.0% |
| $50,000 to $74,999 | 88 | 50.0% |
| $75,000 to $99,999 | 66 | 37.5% |
| $100,000 to $149,999 | 3 | 1.7% |
| $150,000 to $199,999 | 0 | 0.0% |
| $200,000+ | 0 | 0.0% |
Household Income by Householder Age in Nesika Beach
The median household income in Nesika Beach is $68,261, with the highest median household income of $82,835 found in the 45 to 64 years age bracket for the primary householder. A total of 103 households (58.5%) fall into this category.
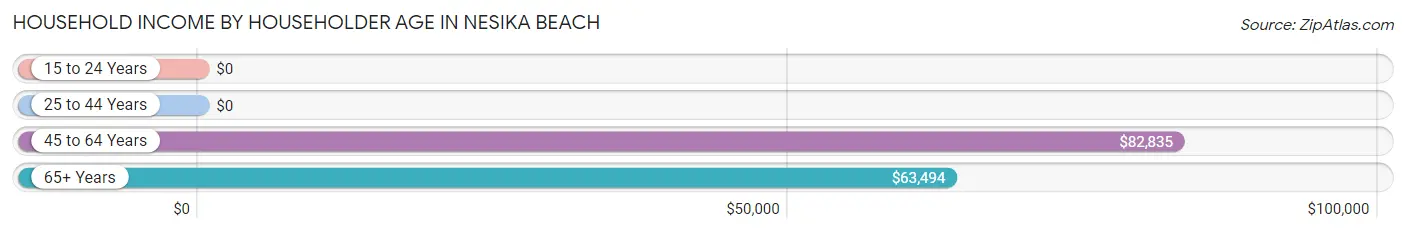
| Income Bracket | # Households | Median Income |
| 15 to 24 Years | 0 (0.0%) | $0 |
| 25 to 44 Years | 0 (0.0%) | $0 |
| 45 to 64 Years | 103 (58.5%) | $82,835 |
| 65+ Years | 73 (41.5%) | $63,494 |
| Total | 176 (100.0%) | $68,261 |
Poverty in Nesika Beach
Income Below Poverty by Sex and Age in Nesika Beach
With 16.8% poverty level for males and 13.8% for females among the residents of Nesika Beach, 35 to 44 year old males and 65 to 74 year old females are the most vulnerable to poverty, with 34 males (100.0%) and 19 females (46.3%) in their respective age groups living below the poverty level.
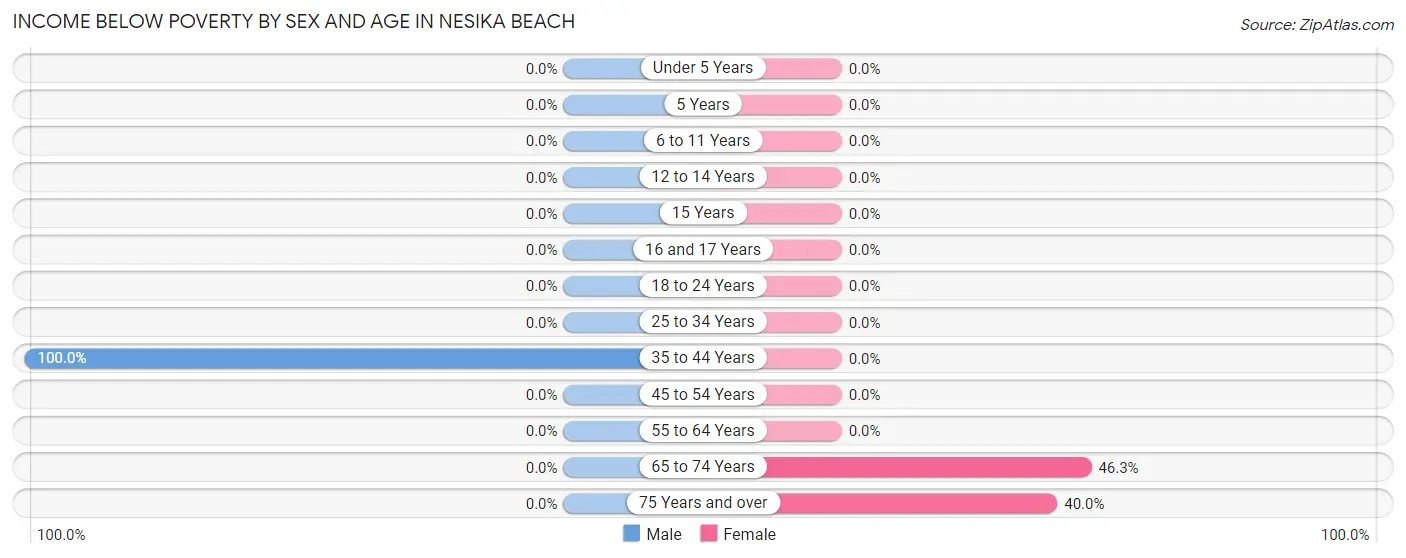
| Age Bracket | Male | Female |
| Under 5 Years | 0 (0.0%) | 0 (0.0%) |
| 5 Years | 0 (0.0%) | 0 (0.0%) |
| 6 to 11 Years | 0 (0.0%) | 0 (0.0%) |
| 12 to 14 Years | 0 (0.0%) | 0 (0.0%) |
| 15 Years | 0 (0.0%) | 0 (0.0%) |
| 16 and 17 Years | 0 (0.0%) | 0 (0.0%) |
| 18 to 24 Years | 0 (0.0%) | 0 (0.0%) |
| 25 to 34 Years | 0 (0.0%) | 0 (0.0%) |
| 35 to 44 Years | 34 (100.0%) | 0 (0.0%) |
| 45 to 54 Years | 0 (0.0%) | 0 (0.0%) |
| 55 to 64 Years | 0 (0.0%) | 0 (0.0%) |
| 65 to 74 Years | 0 (0.0%) | 19 (46.3%) |
| 75 Years and over | 0 (0.0%) | 2 (40.0%) |
| Total | 34 (16.8%) | 21 (13.8%) |
Income Above Poverty by Sex and Age in Nesika Beach
According to the poverty statistics in Nesika Beach, males aged 45 to 54 years and females aged 55 to 64 years are the age groups that are most secure financially, with 100.0% of males and 100.0% of females in these age groups living above the poverty line.
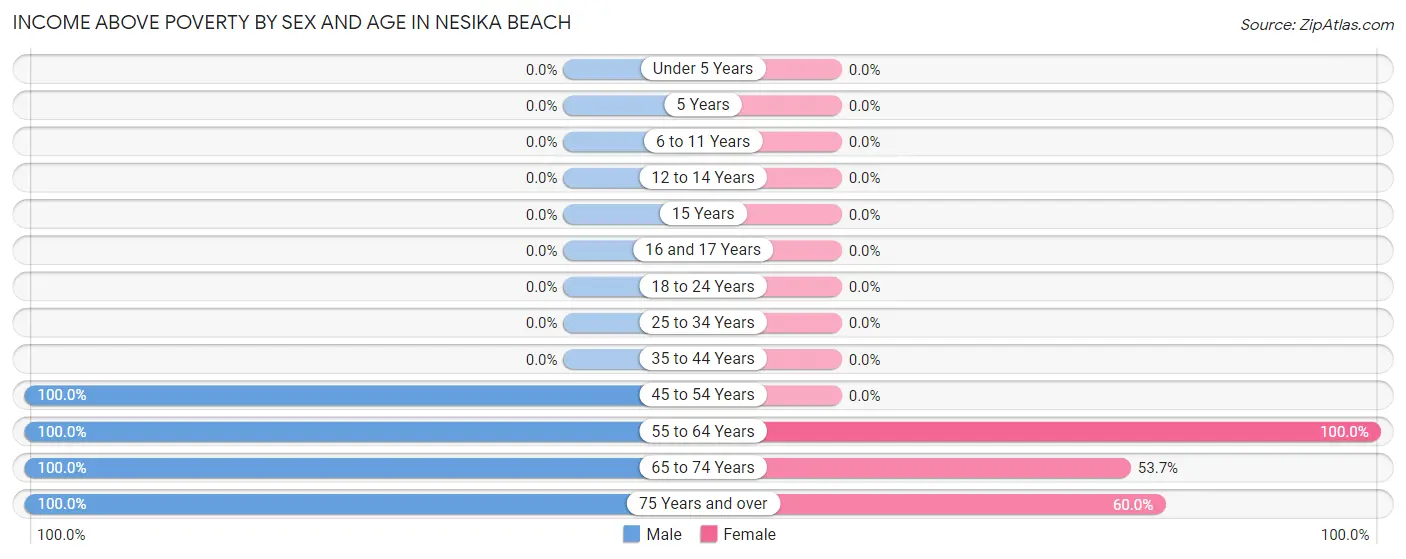
| Age Bracket | Male | Female |
| Under 5 Years | 0 (0.0%) | 0 (0.0%) |
| 5 Years | 0 (0.0%) | 0 (0.0%) |
| 6 to 11 Years | 0 (0.0%) | 0 (0.0%) |
| 12 to 14 Years | 0 (0.0%) | 0 (0.0%) |
| 15 Years | 0 (0.0%) | 0 (0.0%) |
| 16 and 17 Years | 0 (0.0%) | 0 (0.0%) |
| 18 to 24 Years | 0 (0.0%) | 0 (0.0%) |
| 25 to 34 Years | 0 (0.0%) | 0 (0.0%) |
| 35 to 44 Years | 0 (0.0%) | 0 (0.0%) |
| 45 to 54 Years | 23 (100.0%) | 0 (0.0%) |
| 55 to 64 Years | 18 (100.0%) | 106 (100.0%) |
| 65 to 74 Years | 116 (100.0%) | 22 (53.7%) |
| 75 Years and over | 12 (100.0%) | 3 (60.0%) |
| Total | 169 (83.3%) | 131 (86.2%) |
Income Below Poverty Among Married-Couple Families in Nesika Beach
| Children | Above Poverty | Below Poverty |
| No Children | 134 (100.0%) | 0 (0.0%) |
| 1 or 2 Children | 0 (0.0%) | 0 (0.0%) |
| 3 or 4 Children | 0 (0.0%) | 0 (0.0%) |
| 5 or more Children | 0 (0.0%) | 0 (0.0%) |
| Total | 134 (100.0%) | 0 (0.0%) |
Income Below Poverty Among Single-Parent Households in Nesika Beach
| Children | Single Father | Single Mother |
| No Children | 0 (0.0%) | 0 (0.0%) |
| 1 or 2 Children | 0 (0.0%) | 0 (0.0%) |
| 3 or 4 Children | 0 (0.0%) | 0 (0.0%) |
| 5 or more Children | 0 (0.0%) | 0 (0.0%) |
| Total | 0 (0.0%) | 0 (0.0%) |
Income Below Poverty Among Married-Couple vs Single-Parent Households in Nesika Beach
| Children | Married-Couple Families | Single-Parent Households |
| No Children | 0 (0.0%) | 0 (0.0%) |
| 1 or 2 Children | 0 (0.0%) | 0 (0.0%) |
| 3 or 4 Children | 0 (0.0%) | 0 (0.0%) |
| 5 or more Children | 0 (0.0%) | 0 (0.0%) |
| Total | 0 (0.0%) | 0 (0.0%) |
Employment Characteristics in Nesika Beach
Employment by Class of Employer in Nesika Beach
Among the 57 employed individuals in Nesika Beach, federal government employees (56 | 98.3%), and local government employees (1 | 1.8%) make up the most common classes of employment.
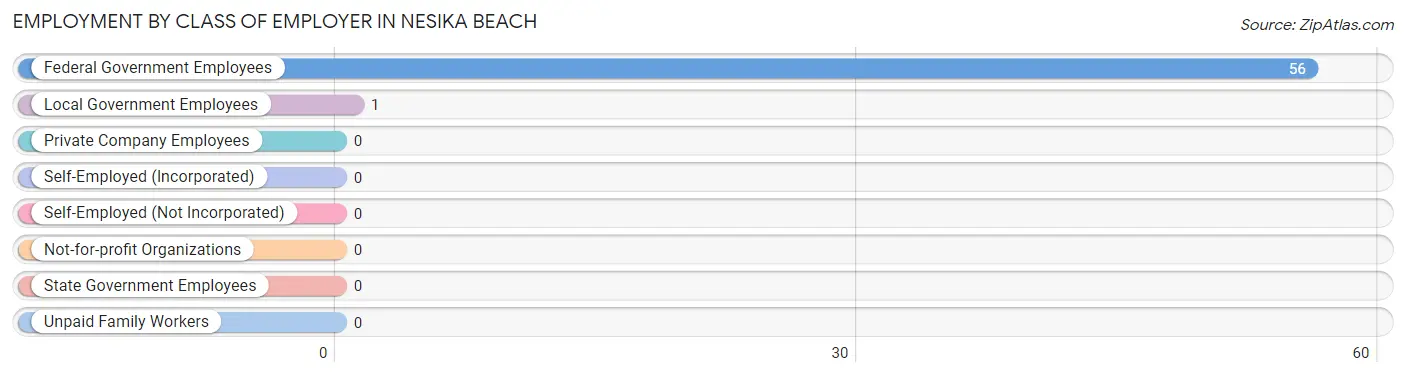
| Employer Class | # Employees | % Employees |
| Private Company Employees | 0 | 0.0% |
| Self-Employed (Incorporated) | 0 | 0.0% |
| Self-Employed (Not Incorporated) | 0 | 0.0% |
| Not-for-profit Organizations | 0 | 0.0% |
| Local Government Employees | 1 | 1.8% |
| State Government Employees | 0 | 0.0% |
| Federal Government Employees | 56 | 98.3% |
| Unpaid Family Workers | 0 | 0.0% |
| Total | 57 | 100.0% |
Employment Status by Age in Nesika Beach
According to the labor force statistics for Nesika Beach, out of the total population over 16 years of age (355), 23.4% or 83 individuals are in the labor force, with 3.6% or 3 of them unemployed. The age group with the highest labor force participation rate is 45 to 54 years, with 100.0% or 23 individuals in the labor force. Within the labor force, the 35 to 44 years age range has the highest percentage of unemployed individuals, with 100.0% or 3 of them being unemployed.
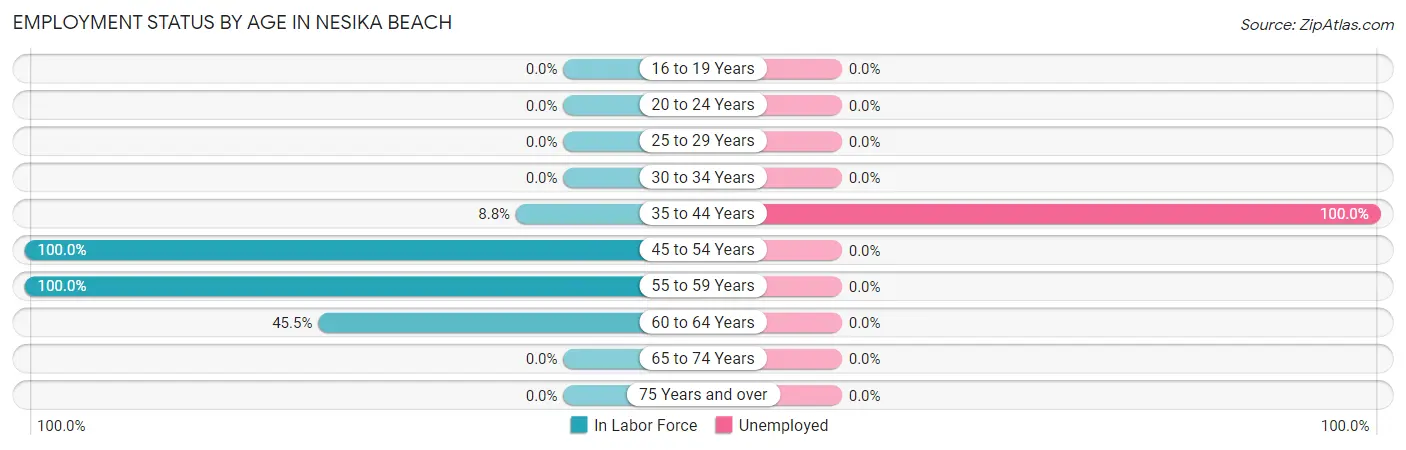
| Age Bracket | In Labor Force | Unemployed |
| 16 to 19 Years | 0 (0.0%) | 0 (0.0%) |
| 20 to 24 Years | 0 (0.0%) | 0 (0.0%) |
| 25 to 29 Years | 0 (0.0%) | 0 (0.0%) |
| 30 to 34 Years | 0 (0.0%) | 0 (0.0%) |
| 35 to 44 Years | 3 (8.8%) | 3 (100.0%) |
| 45 to 54 Years | 23 (100.0%) | 0 (0.0%) |
| 55 to 59 Years | 1 (100.0%) | 0 (0.0%) |
| 60 to 64 Years | 56 (45.5%) | 0 (0.0%) |
| 65 to 74 Years | 0 (0.0%) | 0 (0.0%) |
| 75 Years and over | 0 (0.0%) | 0 (0.0%) |
| Total | 83 (23.4%) | 3 (3.6%) |
Employment Status by Educational Attainment in Nesika Beach
According to labor force statistics for Nesika Beach, 45.9% of individuals (83) out of the total population between 25 and 64 years of age (181) are in the labor force, with 3.6% or 3 of them being unemployed. The group with the highest labor force participation rate are those with the educational attainment of college / associate degree, with 92.9% or 79 individuals in the labor force. Within the labor force, individuals with high school diploma education have the highest percentage of unemployment, with 100.0% or 3 of them being unemployed.
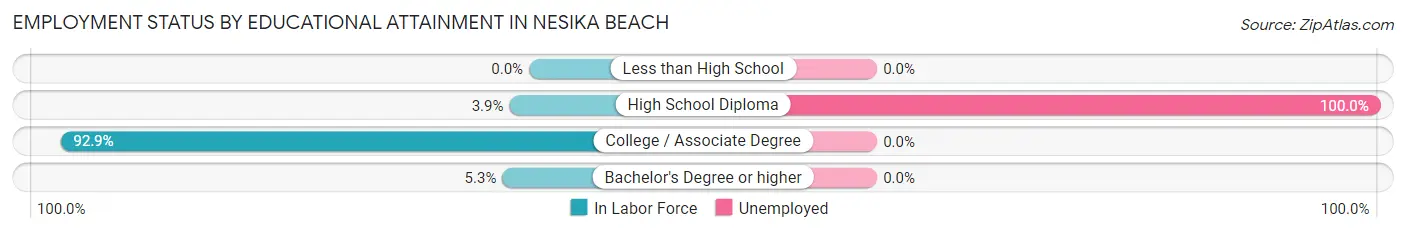
| Educational Attainment | In Labor Force | Unemployed |
| Less than High School | 0 (0.0%) | 0 (0.0%) |
| High School Diploma | 3 (3.9%) | 77 (100.0%) |
| College / Associate Degree | 79 (92.9%) | 0 (0.0%) |
| Bachelor's Degree or higher | 1 (5.3%) | 0 (0.0%) |
| Total | 83 (45.9%) | 7 (3.6%) |
Employment Occupations by Sex in Nesika Beach
Management, Business, Science and Arts Occupations
The most common Management, Business, Science and Arts occupations in Nesika Beach are Management (56 | 70.0%), Community & Social Service (1 | 1.3%), and Education Instruction & Library (1 | 1.3%).
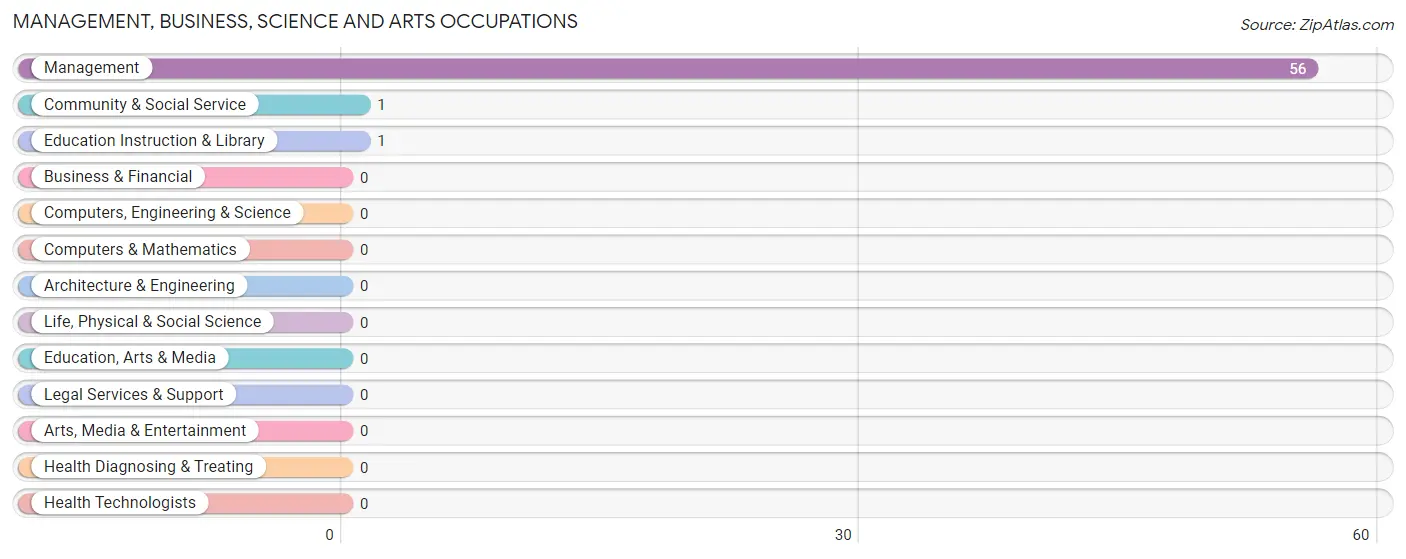
Management, Business, Science and Arts Occupations by Sex
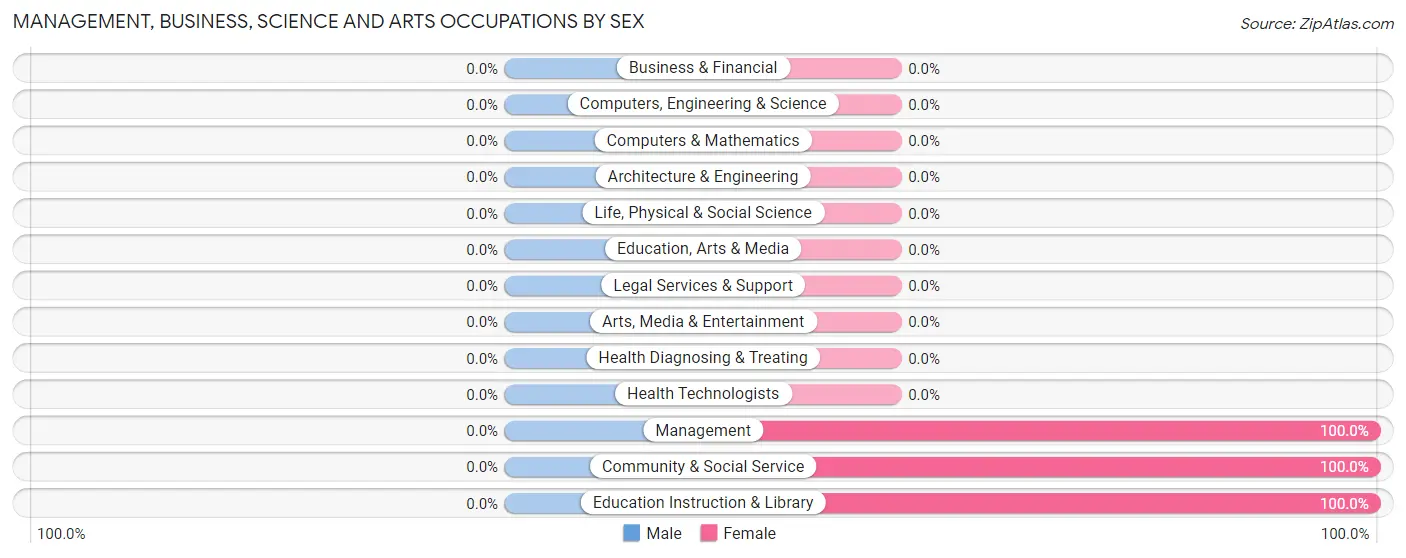
| Occupation | Male | Female |
| Management | 0 (0.0%) | 56 (100.0%) |
| Business & Financial | 0 (0.0%) | 0 (0.0%) |
| Computers, Engineering & Science | 0 (0.0%) | 0 (0.0%) |
| Computers & Mathematics | 0 (0.0%) | 0 (0.0%) |
| Architecture & Engineering | 0 (0.0%) | 0 (0.0%) |
| Life, Physical & Social Science | 0 (0.0%) | 0 (0.0%) |
| Community & Social Service | 0 (0.0%) | 1 (100.0%) |
| Education, Arts & Media | 0 (0.0%) | 0 (0.0%) |
| Legal Services & Support | 0 (0.0%) | 0 (0.0%) |
| Education Instruction & Library | 0 (0.0%) | 1 (100.0%) |
| Arts, Media & Entertainment | 0 (0.0%) | 0 (0.0%) |
| Health Diagnosing & Treating | 0 (0.0%) | 0 (0.0%) |
| Health Technologists | 0 (0.0%) | 0 (0.0%) |
| Total (Category) | 0 (0.0%) | 57 (100.0%) |
| Total (Overall) | 23 (28.7%) | 57 (71.3%) |
Services Occupations
Services Occupations by Sex
| Occupation | Male | Female |
| Healthcare Support | 0 (0.0%) | 0 (0.0%) |
| Security & Protection | 0 (0.0%) | 0 (0.0%) |
| Firefighting & Prevention | 0 (0.0%) | 0 (0.0%) |
| Law Enforcement | 0 (0.0%) | 0 (0.0%) |
| Food Preparation & Serving | 0 (0.0%) | 0 (0.0%) |
| Cleaning & Maintenance | 0 (0.0%) | 0 (0.0%) |
| Personal Care & Service | 0 (0.0%) | 0 (0.0%) |
| Total (Category) | 0 (0.0%) | 0 (0.0%) |
| Total (Overall) | 23 (28.7%) | 57 (71.3%) |
Sales and Office Occupations
Sales and Office Occupations by Sex
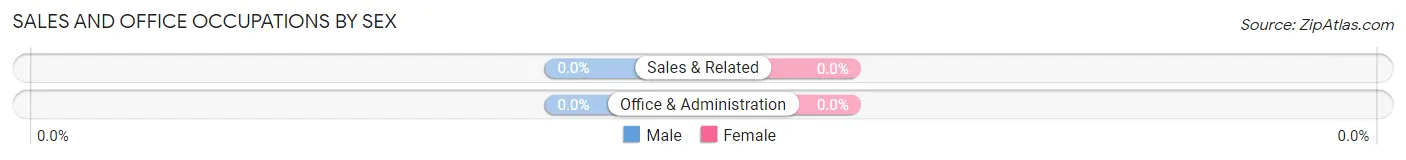
| Occupation | Male | Female |
| Sales & Related | 0 (0.0%) | 0 (0.0%) |
| Office & Administration | 0 (0.0%) | 0 (0.0%) |
| Total (Category) | 0 (0.0%) | 0 (0.0%) |
| Total (Overall) | 23 (28.7%) | 57 (71.3%) |
Natural Resources, Construction and Maintenance Occupations
The most common Natural Resources, Construction and Maintenance occupations in Nesika Beach are , and Installation, Maintenance & Repair (23 | 28.7%).
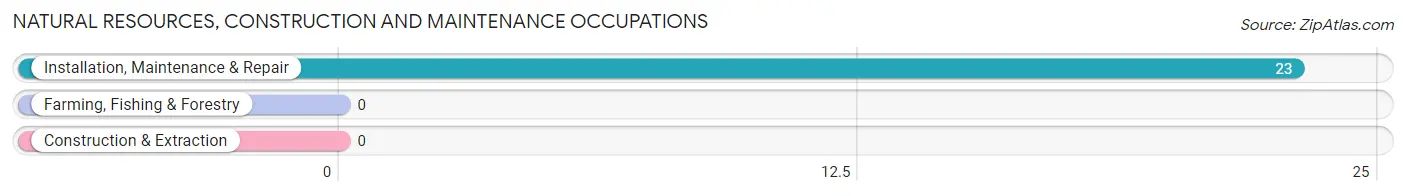
Natural Resources, Construction and Maintenance Occupations by Sex
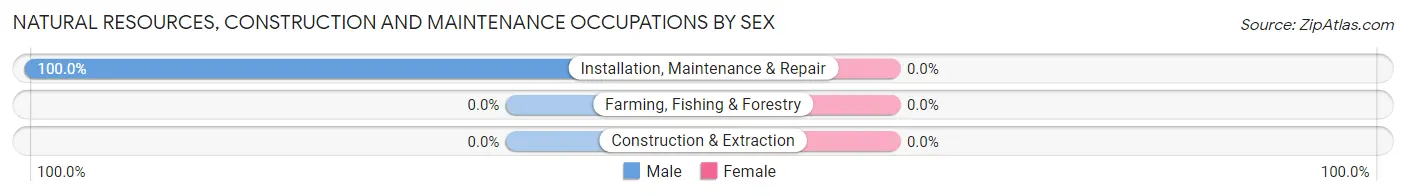
| Occupation | Male | Female |
| Farming, Fishing & Forestry | 0 (0.0%) | 0 (0.0%) |
| Construction & Extraction | 0 (0.0%) | 0 (0.0%) |
| Installation, Maintenance & Repair | 23 (100.0%) | 0 (0.0%) |
| Total (Category) | 23 (100.0%) | 0 (0.0%) |
| Total (Overall) | 23 (28.7%) | 57 (71.3%) |
Production, Transportation and Moving Occupations
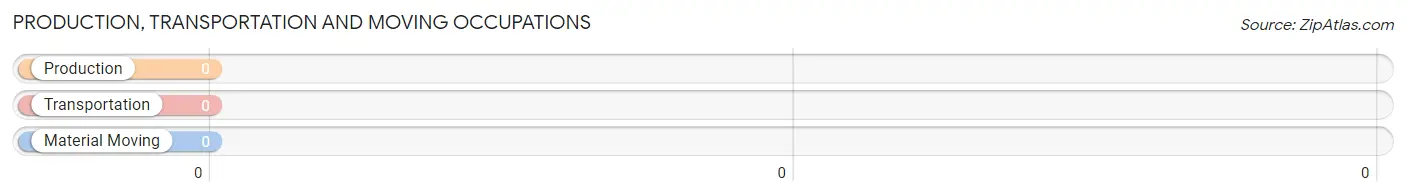
Production, Transportation and Moving Occupations by Sex
| Occupation | Male | Female |
| Production | 0 (0.0%) | 0 (0.0%) |
| Transportation | 0 (0.0%) | 0 (0.0%) |
| Material Moving | 0 (0.0%) | 0 (0.0%) |
| Total (Category) | 0 (0.0%) | 0 (0.0%) |
| Total (Overall) | 23 (28.7%) | 57 (71.3%) |
Employment Industries by Sex in Nesika Beach
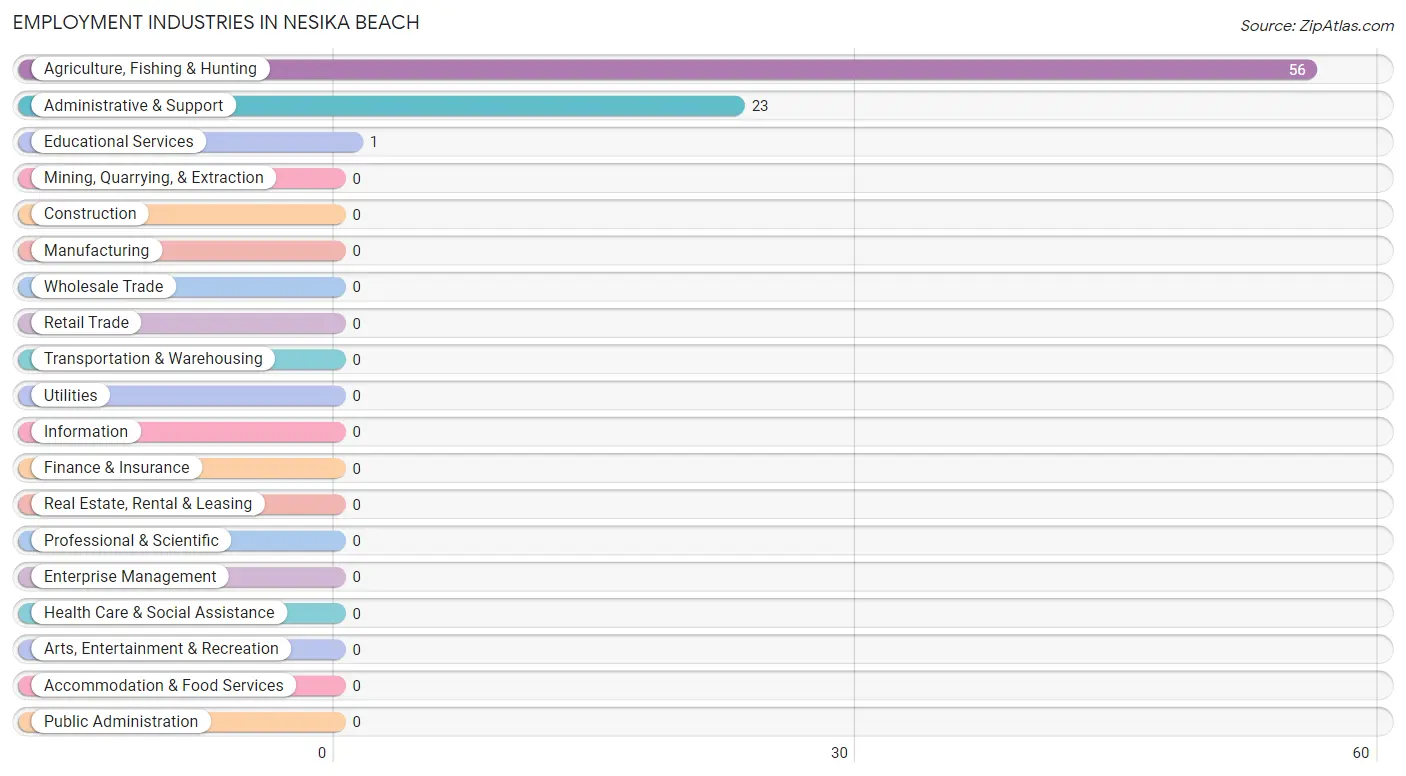
Employment Industries in Nesika Beach
The major employment industries in Nesika Beach include Agriculture, Fishing & Hunting (56 | 70.0%), Administrative & Support (23 | 28.7%), and Educational Services (1 | 1.3%).
Employment Industries by Sex in Nesika Beach
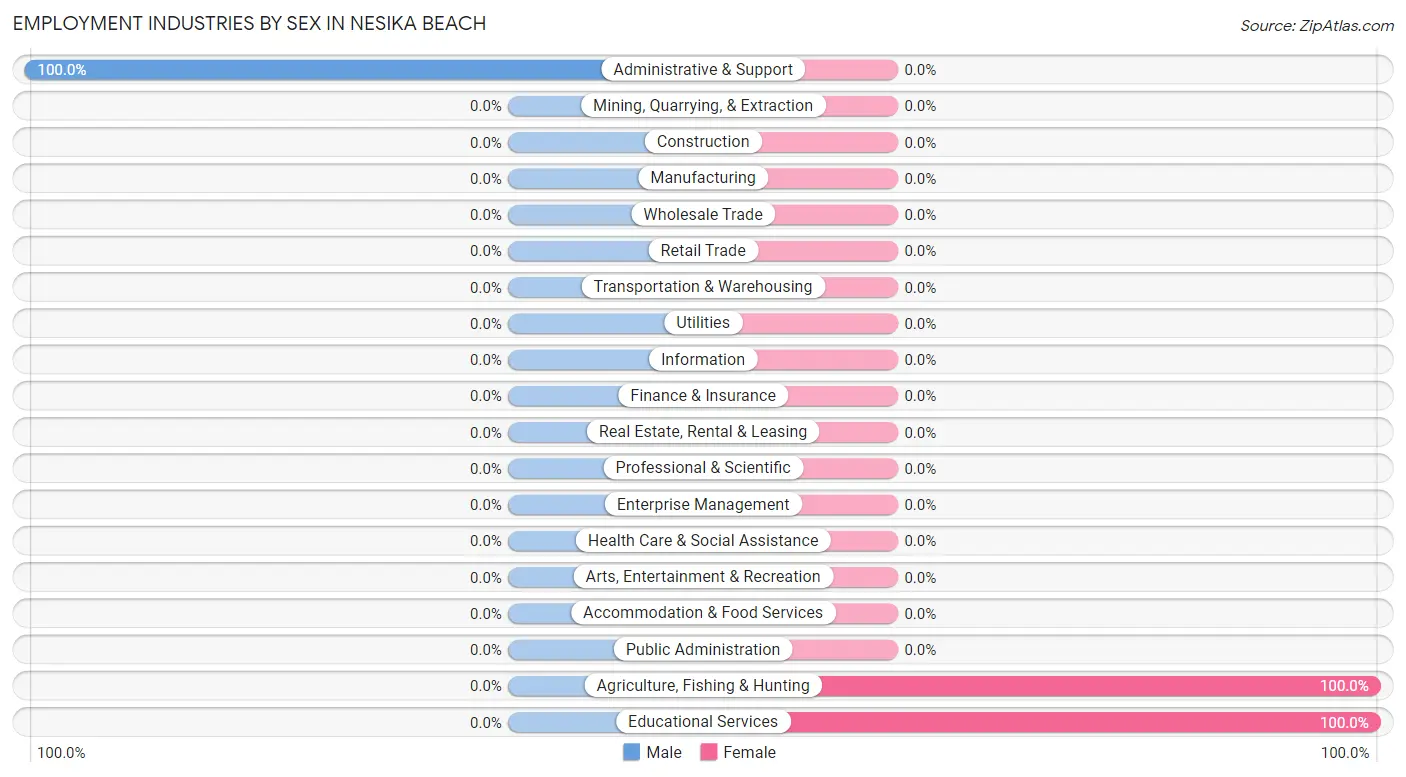
| Industry | Male | Female |
| Agriculture, Fishing & Hunting | 0 (0.0%) | 56 (100.0%) |
| Mining, Quarrying, & Extraction | 0 (0.0%) | 0 (0.0%) |
| Construction | 0 (0.0%) | 0 (0.0%) |
| Manufacturing | 0 (0.0%) | 0 (0.0%) |
| Wholesale Trade | 0 (0.0%) | 0 (0.0%) |
| Retail Trade | 0 (0.0%) | 0 (0.0%) |
| Transportation & Warehousing | 0 (0.0%) | 0 (0.0%) |
| Utilities | 0 (0.0%) | 0 (0.0%) |
| Information | 0 (0.0%) | 0 (0.0%) |
| Finance & Insurance | 0 (0.0%) | 0 (0.0%) |
| Real Estate, Rental & Leasing | 0 (0.0%) | 0 (0.0%) |
| Professional & Scientific | 0 (0.0%) | 0 (0.0%) |
| Enterprise Management | 0 (0.0%) | 0 (0.0%) |
| Administrative & Support | 23 (100.0%) | 0 (0.0%) |
| Educational Services | 0 (0.0%) | 1 (100.0%) |
| Health Care & Social Assistance | 0 (0.0%) | 0 (0.0%) |
| Arts, Entertainment & Recreation | 0 (0.0%) | 0 (0.0%) |
| Accommodation & Food Services | 0 (0.0%) | 0 (0.0%) |
| Public Administration | 0 (0.0%) | 0 (0.0%) |
| Total | 23 (28.7%) | 57 (71.3%) |
Education in Nesika Beach
School Enrollment in Nesika Beach
| School Level | # Students | % Students |
| Nursery / Preschool | 0 | 0.0% |
| Kindergarten | 0 | 0.0% |
| Elementary School | 0 | 0.0% |
| Middle School | 0 | 0.0% |
| High School | 0 | 0.0% |
| College / Undergraduate | 0 | 0.0% |
| Graduate / Professional | 0 | 0.0% |
| Total | 0 | 0.0% |
School Enrollment by Age by Funding Source in Nesika Beach
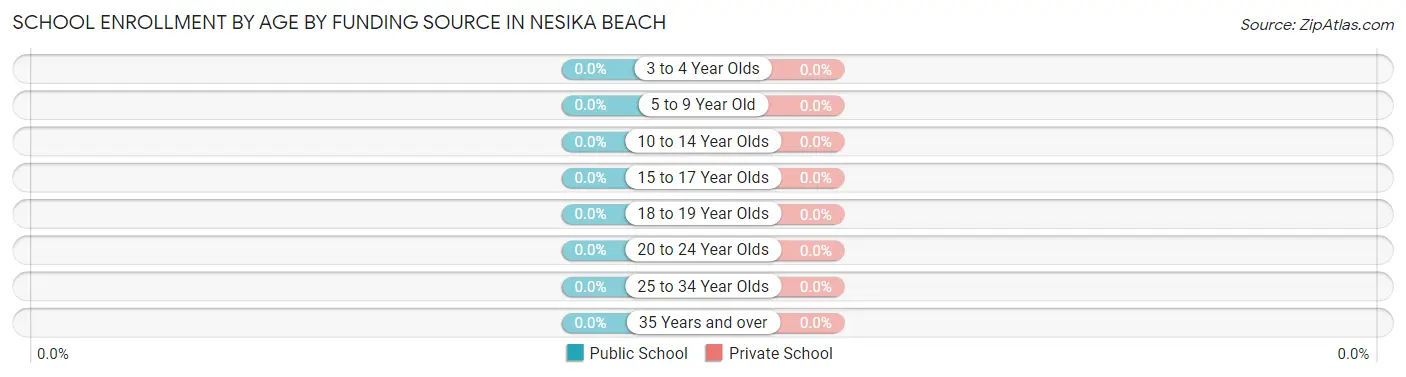
| Age Bracket | Public School | Private School |
| 3 to 4 Year Olds | 0 (0.0%) | 0 (0.0%) |
| 5 to 9 Year Old | 0 (0.0%) | 0 (0.0%) |
| 10 to 14 Year Olds | 0 (0.0%) | 0 (0.0%) |
| 15 to 17 Year Olds | 0 (0.0%) | 0 (0.0%) |
| 18 to 19 Year Olds | 0 (0.0%) | 0 (0.0%) |
| 20 to 24 Year Olds | 0 (0.0%) | 0 (0.0%) |
| 25 to 34 Year Olds | 0 (0.0%) | 0 (0.0%) |
| 35 Years and over | 0 (0.0%) | 0 (0.0%) |
| Total | 0 (0.0%) | 0 (0.0%) |
Educational Attainment by Field of Study in Nesika Beach
Arts & humanities (44 | 44.0%), business (19 | 19.0%), bio, nature & agricultural (14 | 14.0%), social sciences (10 | 10.0%), and engineering (7 | 7.0%) are the most common fields of study among 100 individuals in Nesika Beach who have obtained a bachelor's degree or higher.
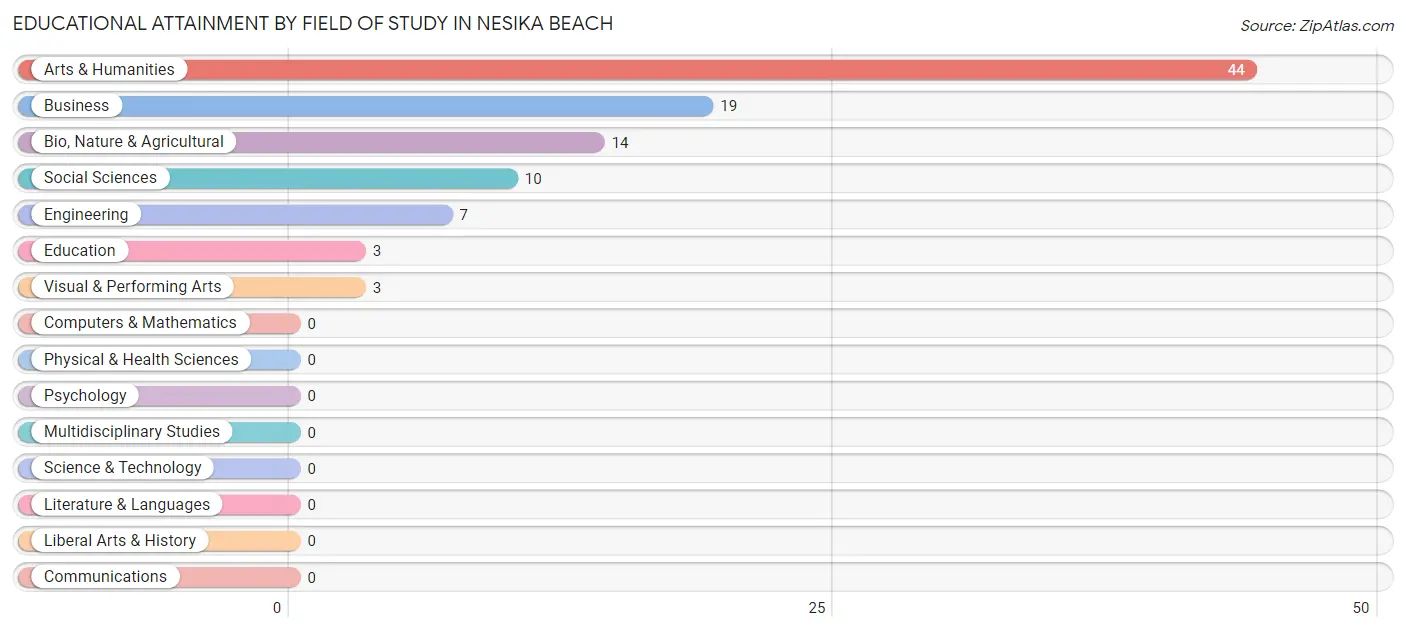
| Field of Study | # Graduates | % Graduates |
| Computers & Mathematics | 0 | 0.0% |
| Bio, Nature & Agricultural | 14 | 14.0% |
| Physical & Health Sciences | 0 | 0.0% |
| Psychology | 0 | 0.0% |
| Social Sciences | 10 | 10.0% |
| Engineering | 7 | 7.0% |
| Multidisciplinary Studies | 0 | 0.0% |
| Science & Technology | 0 | 0.0% |
| Business | 19 | 19.0% |
| Education | 3 | 3.0% |
| Literature & Languages | 0 | 0.0% |
| Liberal Arts & History | 0 | 0.0% |
| Visual & Performing Arts | 3 | 3.0% |
| Communications | 0 | 0.0% |
| Arts & Humanities | 44 | 44.0% |
| Total | 100 | 100.0% |
Transportation & Commute in Nesika Beach
Vehicle Availability by Sex in Nesika Beach
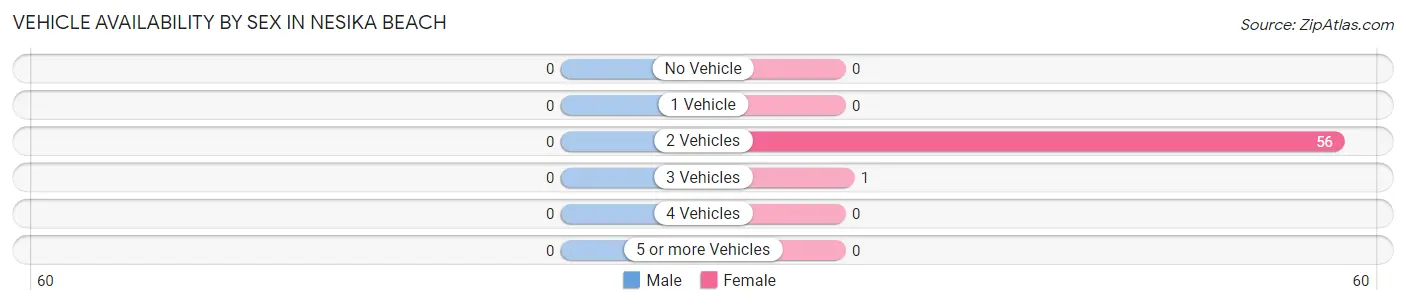
| Vehicles Available | Male | Female |
| No Vehicle | 0 (0.0%) | 0 (0.0%) |
| 1 Vehicle | 0 (0.0%) | 0 (0.0%) |
| 2 Vehicles | 0 (0.0%) | 56 (98.3%) |
| 3 Vehicles | 0 (0.0%) | 1 (1.8%) |
| 4 Vehicles | 0 (0.0%) | 0 (0.0%) |
| 5 or more Vehicles | 0 (0.0%) | 0 (0.0%) |
| Total | 0 (0.0%) | 57 (100.0%) |
Commute Time in Nesika Beach
The most frequently occuring commute durations in Nesika Beach are 20 to 24 minutes (56 commuters, 98.3%), 15 to 19 minutes (1 commuters, 1.8%), and less than 5 minutes (0 commuters, 0.0%).
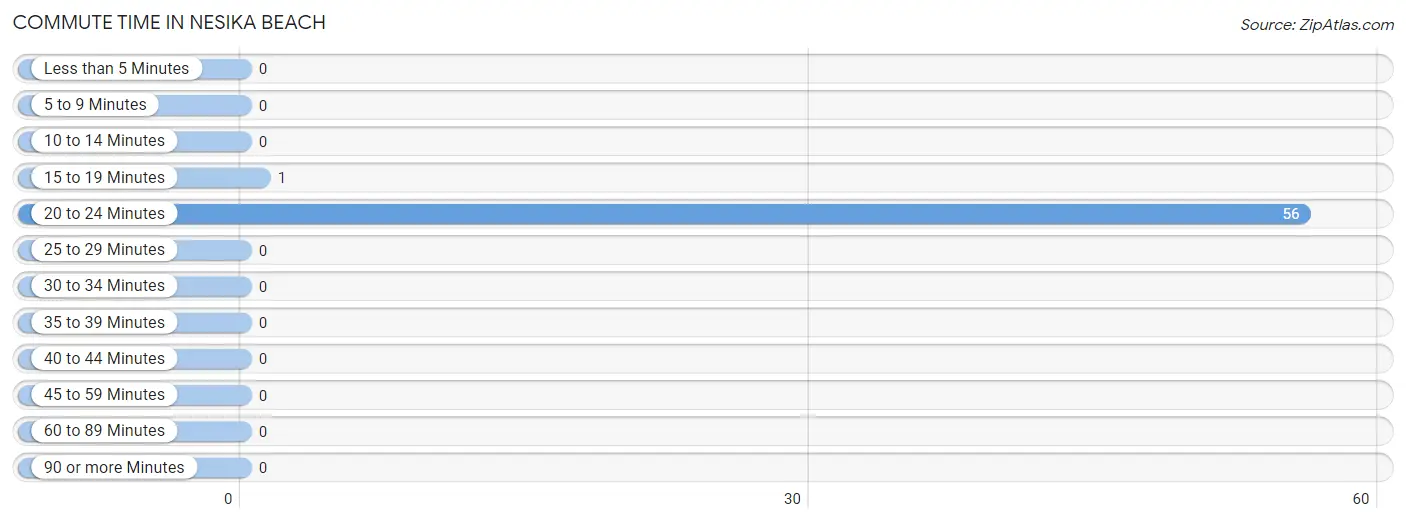
| Commute Time | # Commuters | % Commuters |
| Less than 5 Minutes | 0 | 0.0% |
| 5 to 9 Minutes | 0 | 0.0% |
| 10 to 14 Minutes | 0 | 0.0% |
| 15 to 19 Minutes | 1 | 1.8% |
| 20 to 24 Minutes | 56 | 98.3% |
| 25 to 29 Minutes | 0 | 0.0% |
| 30 to 34 Minutes | 0 | 0.0% |
| 35 to 39 Minutes | 0 | 0.0% |
| 40 to 44 Minutes | 0 | 0.0% |
| 45 to 59 Minutes | 0 | 0.0% |
| 60 to 89 Minutes | 0 | 0.0% |
| 90 or more Minutes | 0 | 0.0% |
Commute Time by Sex in Nesika Beach
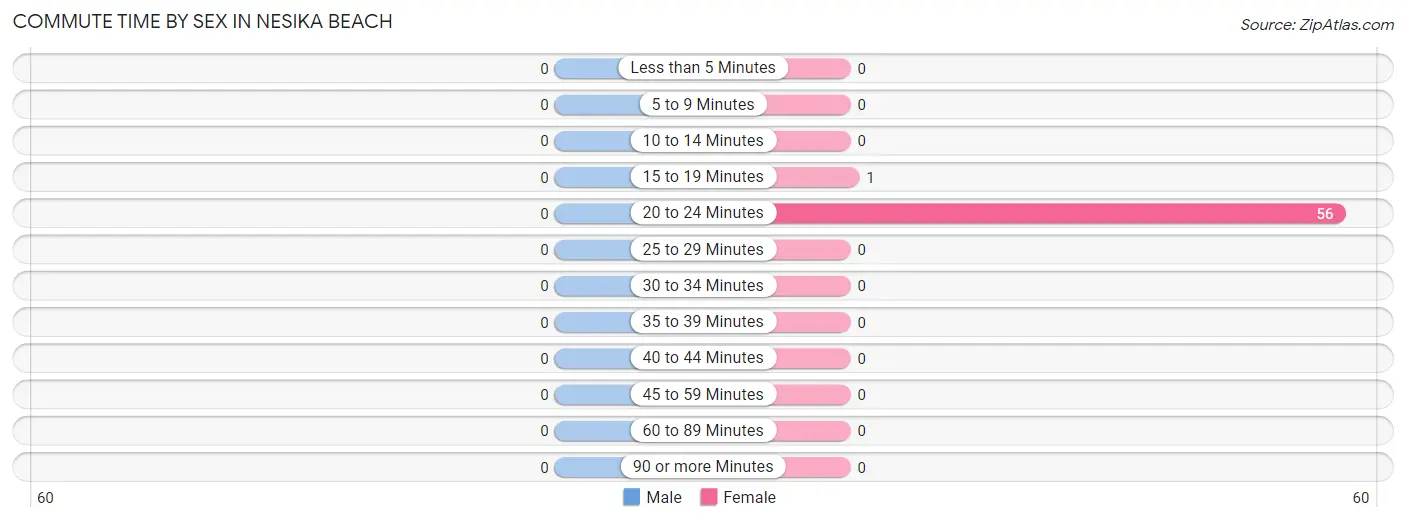
| Commute Time | Male | Female |
| Less than 5 Minutes | 0 (0.0%) | 0 (0.0%) |
| 5 to 9 Minutes | 0 (0.0%) | 0 (0.0%) |
| 10 to 14 Minutes | 0 (0.0%) | 0 (0.0%) |
| 15 to 19 Minutes | 0 (0.0%) | 1 (1.8%) |
| 20 to 24 Minutes | 0 (0.0%) | 56 (98.3%) |
| 25 to 29 Minutes | 0 (0.0%) | 0 (0.0%) |
| 30 to 34 Minutes | 0 (0.0%) | 0 (0.0%) |
| 35 to 39 Minutes | 0 (0.0%) | 0 (0.0%) |
| 40 to 44 Minutes | 0 (0.0%) | 0 (0.0%) |
| 45 to 59 Minutes | 0 (0.0%) | 0 (0.0%) |
| 60 to 89 Minutes | 0 (0.0%) | 0 (0.0%) |
| 90 or more Minutes | 0 (0.0%) | 0 (0.0%) |
Time of Departure to Work by Sex in Nesika Beach
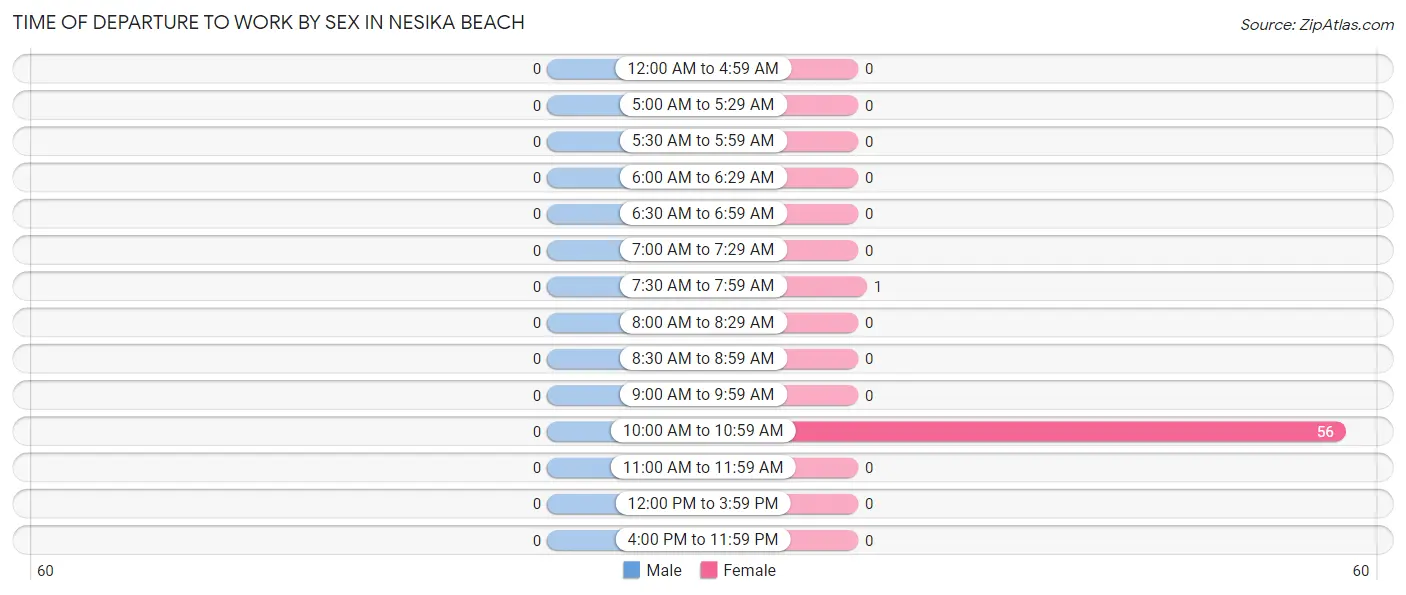
| Time of Departure | Male | Female |
| 12:00 AM to 4:59 AM | 0 (0.0%) | 0 (0.0%) |
| 5:00 AM to 5:29 AM | 0 (0.0%) | 0 (0.0%) |
| 5:30 AM to 5:59 AM | 0 (0.0%) | 0 (0.0%) |
| 6:00 AM to 6:29 AM | 0 (0.0%) | 0 (0.0%) |
| 6:30 AM to 6:59 AM | 0 (0.0%) | 0 (0.0%) |
| 7:00 AM to 7:29 AM | 0 (0.0%) | 0 (0.0%) |
| 7:30 AM to 7:59 AM | 0 (0.0%) | 1 (1.8%) |
| 8:00 AM to 8:29 AM | 0 (0.0%) | 0 (0.0%) |
| 8:30 AM to 8:59 AM | 0 (0.0%) | 0 (0.0%) |
| 9:00 AM to 9:59 AM | 0 (0.0%) | 0 (0.0%) |
| 10:00 AM to 10:59 AM | 0 (0.0%) | 56 (98.3%) |
| 11:00 AM to 11:59 AM | 0 (0.0%) | 0 (0.0%) |
| 12:00 PM to 3:59 PM | 0 (0.0%) | 0 (0.0%) |
| 4:00 PM to 11:59 PM | 0 (0.0%) | 0 (0.0%) |
| Total | 0 (0.0%) | 57 (100.0%) |
Housing Occupancy in Nesika Beach
Occupancy by Ownership in Nesika Beach
Of the total 176 dwellings in Nesika Beach, owner-occupied units account for 132 (75.0%), while renter-occupied units make up 44 (25.0%).
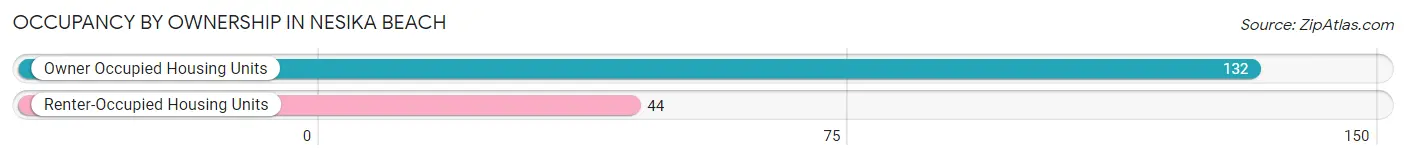
| Occupancy | # Housing Units | % Housing Units |
| Owner Occupied Housing Units | 132 | 75.0% |
| Renter-Occupied Housing Units | 44 | 25.0% |
| Total Occupied Housing Units | 176 | 100.0% |
Occupancy by Household Size in Nesika Beach
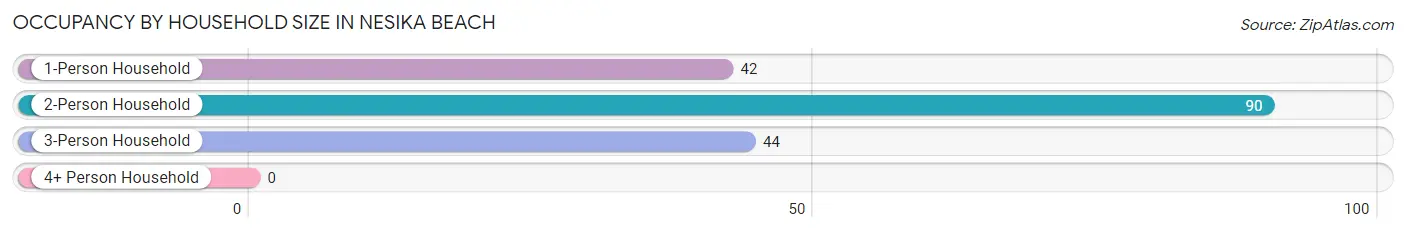
| Household Size | # Housing Units | % Housing Units |
| 1-Person Household | 42 | 23.9% |
| 2-Person Household | 90 | 51.1% |
| 3-Person Household | 44 | 25.0% |
| 4+ Person Household | 0 | 0.0% |
| Total Housing Units | 176 | 100.0% |
Occupancy by Ownership by Household Size in Nesika Beach
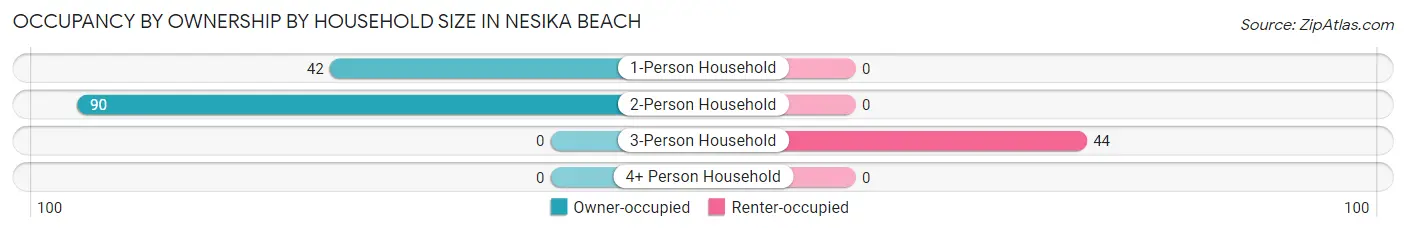
| Household Size | Owner-occupied | Renter-occupied |
| 1-Person Household | 42 (100.0%) | 0 (0.0%) |
| 2-Person Household | 90 (100.0%) | 0 (0.0%) |
| 3-Person Household | 0 (0.0%) | 44 (100.0%) |
| 4+ Person Household | 0 (0.0%) | 0 (0.0%) |
| Total Housing Units | 132 (75.0%) | 44 (25.0%) |
Occupancy by Educational Attainment in Nesika Beach
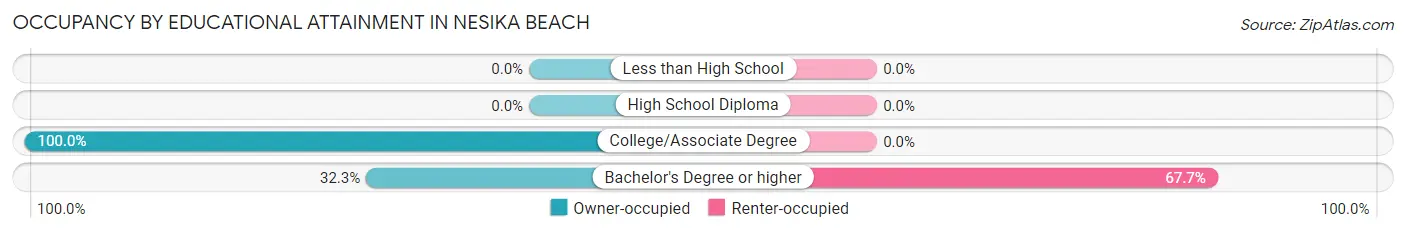
| Household Size | Owner-occupied | Renter-occupied |
| Less than High School | 0 (0.0%) | 0 (0.0%) |
| High School Diploma | 0 (0.0%) | 0 (0.0%) |
| College/Associate Degree | 111 (100.0%) | 0 (0.0%) |
| Bachelor's Degree or higher | 21 (32.3%) | 44 (67.7%) |
Occupancy by Age of Householder in Nesika Beach
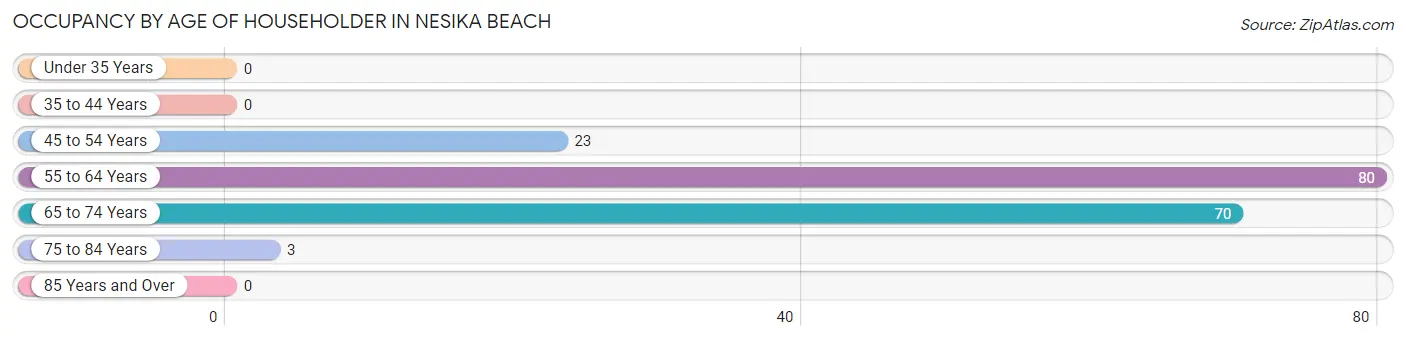
| Age Bracket | # Households | % Households |
| Under 35 Years | 0 | 0.0% |
| 35 to 44 Years | 0 | 0.0% |
| 45 to 54 Years | 23 | 13.1% |
| 55 to 64 Years | 80 | 45.5% |
| 65 to 74 Years | 70 | 39.8% |
| 75 to 84 Years | 3 | 1.7% |
| 85 Years and Over | 0 | 0.0% |
| Total | 176 | 100.0% |
Housing Finances in Nesika Beach
Median Income by Occupancy in Nesika Beach
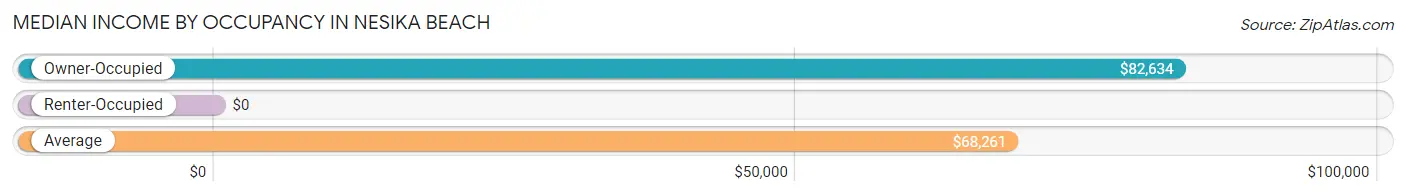
| Occupancy Type | # Households | Median Income |
| Owner-Occupied | 132 (75.0%) | $82,634 |
| Renter-Occupied | 44 (25.0%) | $0 |
| Average | 176 (100.0%) | $68,261 |
Occupancy by Householder Income Bracket in Nesika Beach
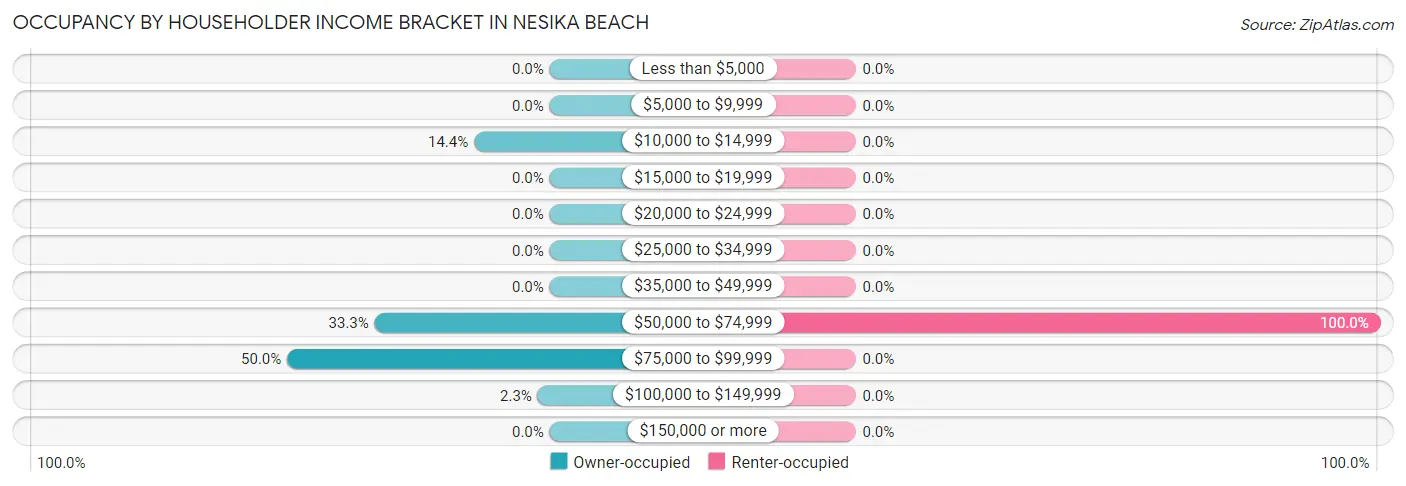
| Income Bracket | Owner-occupied | Renter-occupied |
| Less than $5,000 | 0 (0.0%) | 0 (0.0%) |
| $5,000 to $9,999 | 0 (0.0%) | 0 (0.0%) |
| $10,000 to $14,999 | 19 (14.4%) | 0 (0.0%) |
| $15,000 to $19,999 | 0 (0.0%) | 0 (0.0%) |
| $20,000 to $24,999 | 0 (0.0%) | 0 (0.0%) |
| $25,000 to $34,999 | 0 (0.0%) | 0 (0.0%) |
| $35,000 to $49,999 | 0 (0.0%) | 0 (0.0%) |
| $50,000 to $74,999 | 44 (33.3%) | 44 (100.0%) |
| $75,000 to $99,999 | 66 (50.0%) | 0 (0.0%) |
| $100,000 to $149,999 | 3 (2.3%) | 0 (0.0%) |
| $150,000 or more | 0 (0.0%) | 0 (0.0%) |
| Total | 132 (100.0%) | 44 (100.0%) |
Monthly Housing Cost Tiers in Nesika Beach
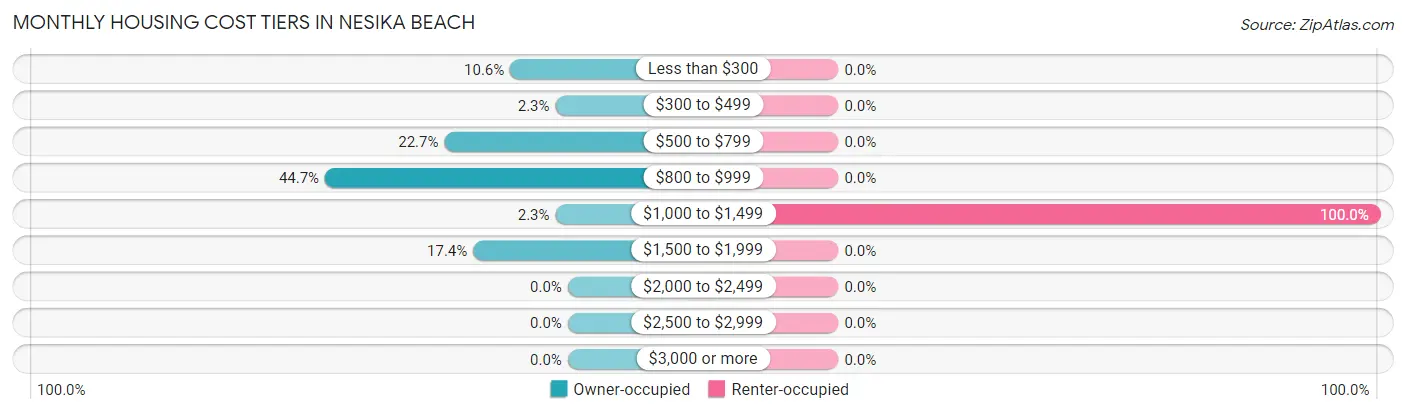
| Monthly Cost | Owner-occupied | Renter-occupied |
| Less than $300 | 14 (10.6%) | 0 (0.0%) |
| $300 to $499 | 3 (2.3%) | 0 (0.0%) |
| $500 to $799 | 30 (22.7%) | 0 (0.0%) |
| $800 to $999 | 59 (44.7%) | 0 (0.0%) |
| $1,000 to $1,499 | 3 (2.3%) | 44 (100.0%) |
| $1,500 to $1,999 | 23 (17.4%) | 0 (0.0%) |
| $2,000 to $2,499 | 0 (0.0%) | 0 (0.0%) |
| $2,500 to $2,999 | 0 (0.0%) | 0 (0.0%) |
| $3,000 or more | 0 (0.0%) | 0 (0.0%) |
| Total | 132 (100.0%) | 44 (100.0%) |
Physical Housing Characteristics in Nesika Beach
Housing Structures in Nesika Beach
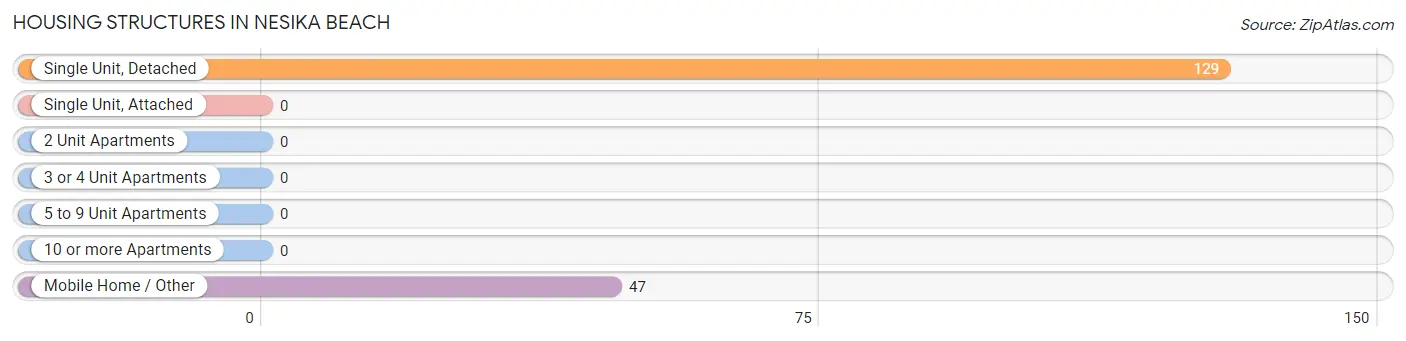
| Structure Type | # Housing Units | % Housing Units |
| Single Unit, Detached | 129 | 73.3% |
| Single Unit, Attached | 0 | 0.0% |
| 2 Unit Apartments | 0 | 0.0% |
| 3 or 4 Unit Apartments | 0 | 0.0% |
| 5 to 9 Unit Apartments | 0 | 0.0% |
| 10 or more Apartments | 0 | 0.0% |
| Mobile Home / Other | 47 | 26.7% |
| Total | 176 | 100.0% |
Housing Structures by Occupancy in Nesika Beach
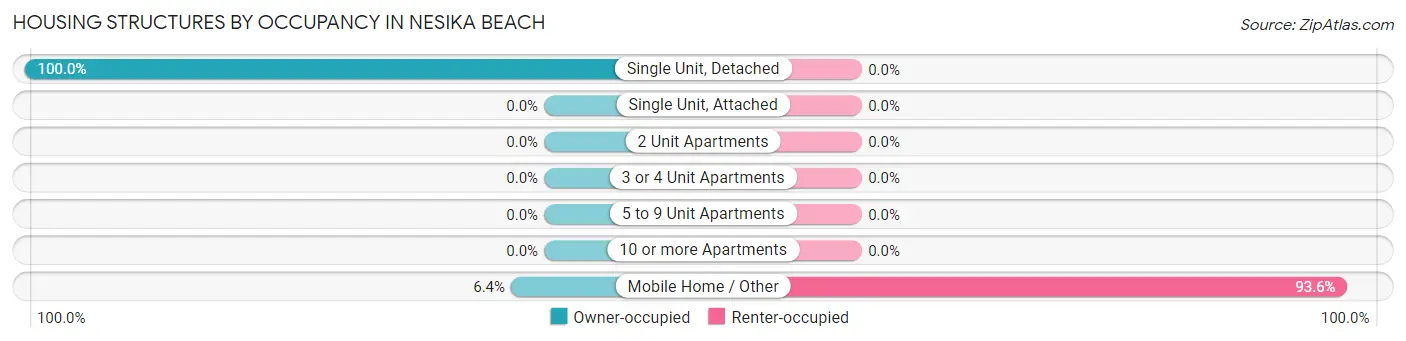
| Structure Type | Owner-occupied | Renter-occupied |
| Single Unit, Detached | 129 (100.0%) | 0 (0.0%) |
| Single Unit, Attached | 0 (0.0%) | 0 (0.0%) |
| 2 Unit Apartments | 0 (0.0%) | 0 (0.0%) |
| 3 or 4 Unit Apartments | 0 (0.0%) | 0 (0.0%) |
| 5 to 9 Unit Apartments | 0 (0.0%) | 0 (0.0%) |
| 10 or more Apartments | 0 (0.0%) | 0 (0.0%) |
| Mobile Home / Other | 3 (6.4%) | 44 (93.6%) |
| Total | 132 (75.0%) | 44 (25.0%) |
Housing Structures by Number of Rooms in Nesika Beach
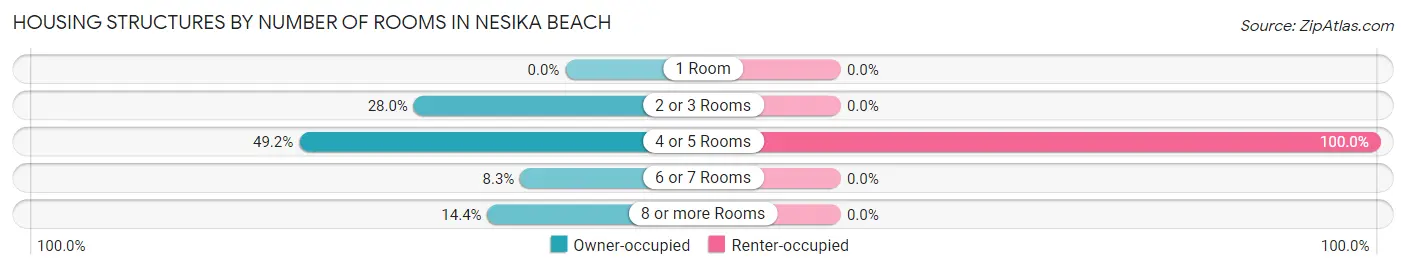
| Number of Rooms | Owner-occupied | Renter-occupied |
| 1 Room | 0 (0.0%) | 0 (0.0%) |
| 2 or 3 Rooms | 37 (28.0%) | 0 (0.0%) |
| 4 or 5 Rooms | 65 (49.2%) | 44 (100.0%) |
| 6 or 7 Rooms | 11 (8.3%) | 0 (0.0%) |
| 8 or more Rooms | 19 (14.4%) | 0 (0.0%) |
| Total | 132 (100.0%) | 44 (100.0%) |
Housing Structure by Heating Type in Nesika Beach
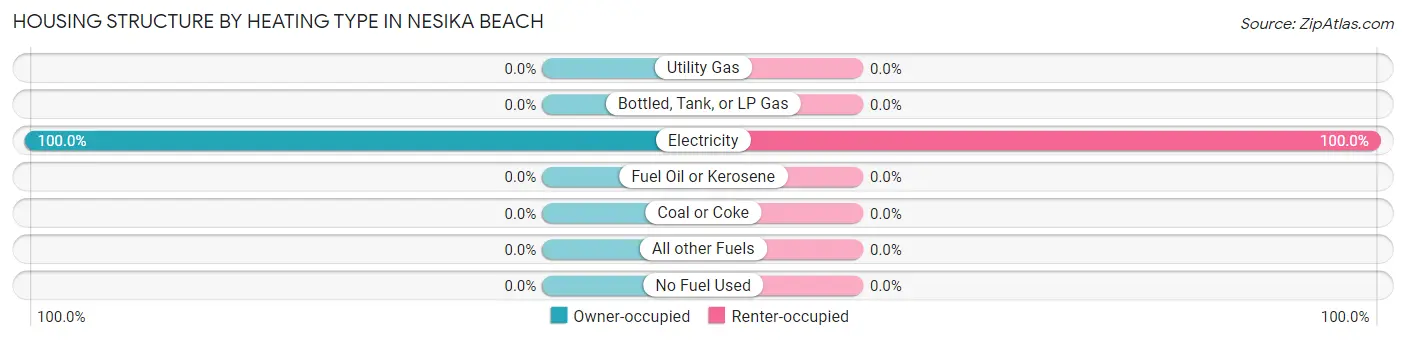
| Heating Type | Owner-occupied | Renter-occupied |
| Utility Gas | 0 (0.0%) | 0 (0.0%) |
| Bottled, Tank, or LP Gas | 0 (0.0%) | 0 (0.0%) |
| Electricity | 132 (100.0%) | 44 (100.0%) |
| Fuel Oil or Kerosene | 0 (0.0%) | 0 (0.0%) |
| Coal or Coke | 0 (0.0%) | 0 (0.0%) |
| All other Fuels | 0 (0.0%) | 0 (0.0%) |
| No Fuel Used | 0 (0.0%) | 0 (0.0%) |
| Total | 132 (100.0%) | 44 (100.0%) |
Household Vehicle Usage in Nesika Beach
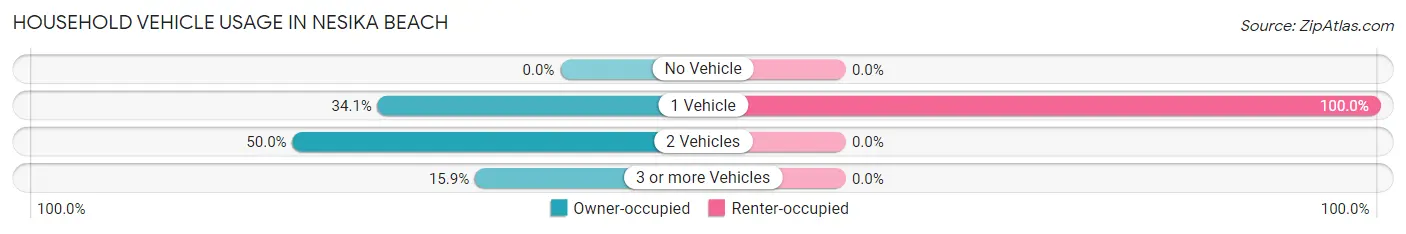
| Vehicles per Household | Owner-occupied | Renter-occupied |
| No Vehicle | 0 (0.0%) | 0 (0.0%) |
| 1 Vehicle | 45 (34.1%) | 44 (100.0%) |
| 2 Vehicles | 66 (50.0%) | 0 (0.0%) |
| 3 or more Vehicles | 21 (15.9%) | 0 (0.0%) |
| Total | 132 (100.0%) | 44 (100.0%) |
Real Estate & Mortgages in Nesika Beach
Real Estate and Mortgage Overview in Nesika Beach
| Characteristic | Without Mortgage | With Mortgage |
| Housing Units | 47 | 85 |
| Median Property Value | $443,200 | $0 |
| Median Household Income | - | - |
| Monthly Housing Costs | $613 | $0 |
| Real Estate Taxes | $1,707 | $0 |
Property Value by Mortgage Status in Nesika Beach
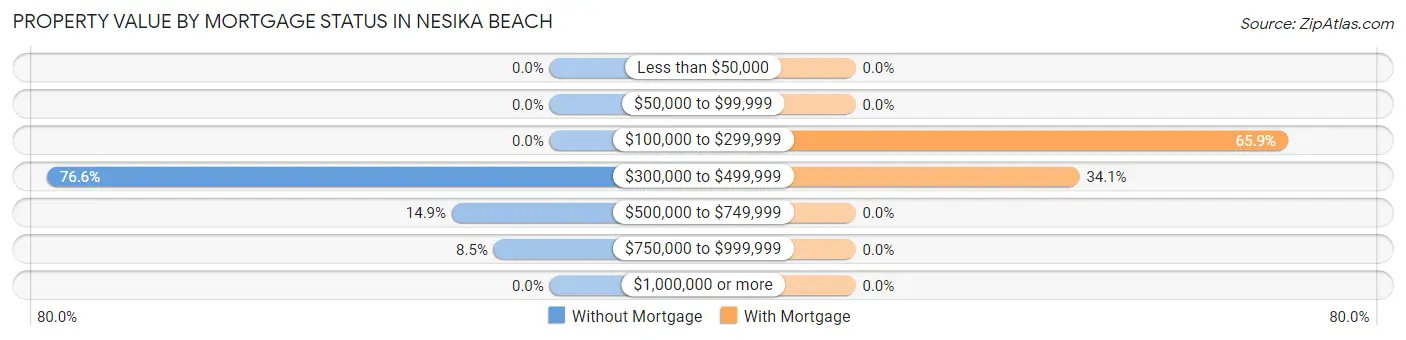
| Property Value | Without Mortgage | With Mortgage |
| Less than $50,000 | 0 (0.0%) | 0 (0.0%) |
| $50,000 to $99,999 | 0 (0.0%) | 0 (0.0%) |
| $100,000 to $299,999 | 0 (0.0%) | 56 (65.9%) |
| $300,000 to $499,999 | 36 (76.6%) | 29 (34.1%) |
| $500,000 to $749,999 | 7 (14.9%) | 0 (0.0%) |
| $750,000 to $999,999 | 4 (8.5%) | 0 (0.0%) |
| $1,000,000 or more | 0 (0.0%) | 0 (0.0%) |
| Total | 47 (100.0%) | 85 (100.0%) |
Household Income by Mortgage Status in Nesika Beach
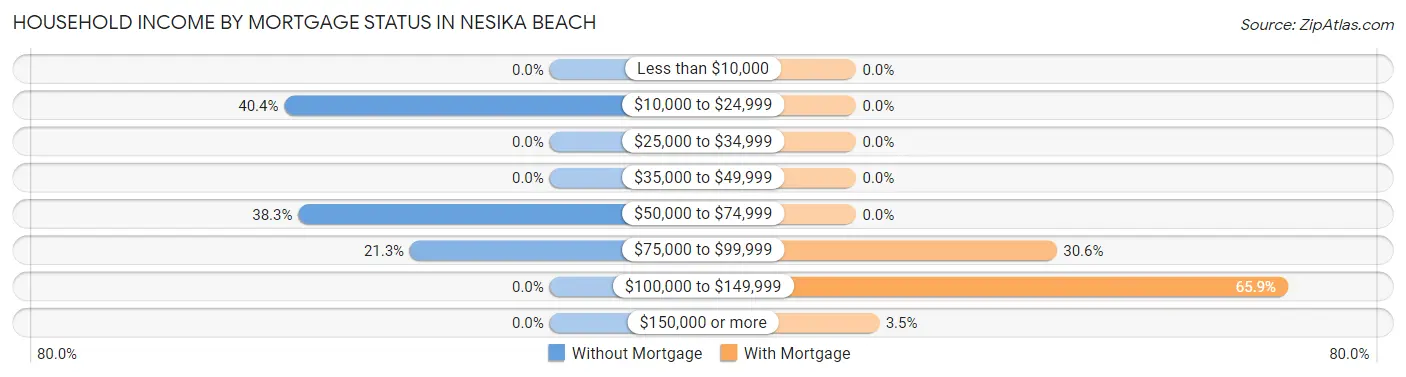
| Household Income | Without Mortgage | With Mortgage |
| Less than $10,000 | 0 (0.0%) | 0 (0.0%) |
| $10,000 to $24,999 | 19 (40.4%) | 0 (0.0%) |
| $25,000 to $34,999 | 0 (0.0%) | 0 (0.0%) |
| $35,000 to $49,999 | 0 (0.0%) | 0 (0.0%) |
| $50,000 to $74,999 | 18 (38.3%) | 0 (0.0%) |
| $75,000 to $99,999 | 10 (21.3%) | 26 (30.6%) |
| $100,000 to $149,999 | 0 (0.0%) | 56 (65.9%) |
| $150,000 or more | 0 (0.0%) | 3 (3.5%) |
| Total | 47 (100.0%) | 85 (100.0%) |
Property Value to Household Income Ratio in Nesika Beach
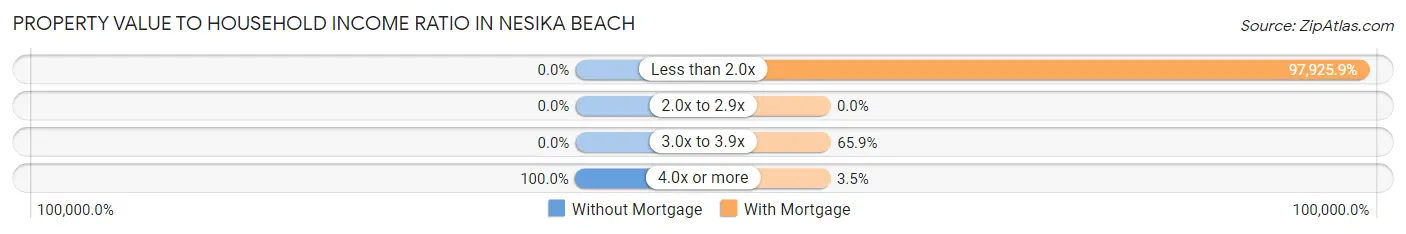
| Value-to-Income Ratio | Without Mortgage | With Mortgage |
| Less than 2.0x | 0 (0.0%) | 83,237 (97,925.9%) |
| 2.0x to 2.9x | 0 (0.0%) | 0 (0.0%) |
| 3.0x to 3.9x | 0 (0.0%) | 56 (65.9%) |
| 4.0x or more | 47 (100.0%) | 3 (3.5%) |
| Total | 47 (100.0%) | 85 (100.0%) |
Real Estate Taxes by Mortgage Status in Nesika Beach
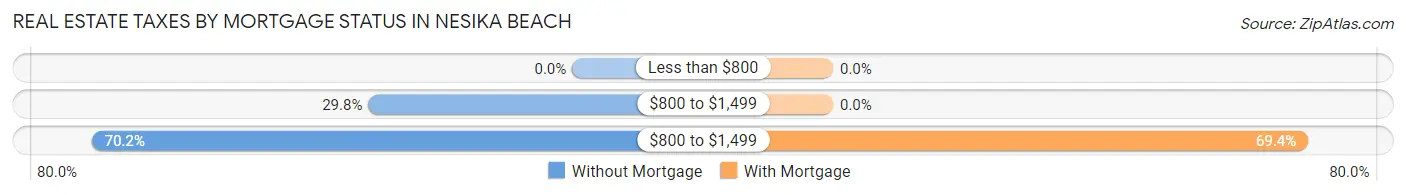
| Property Taxes | Without Mortgage | With Mortgage |
| Less than $800 | 0 (0.0%) | 0 (0.0%) |
| $800 to $1,499 | 14 (29.8%) | 0 (0.0%) |
| $800 to $1,499 | 33 (70.2%) | 59 (69.4%) |
| Total | 47 (100.0%) | 85 (100.0%) |
Health & Disability in Nesika Beach
Health Insurance Coverage by Age in Nesika Beach
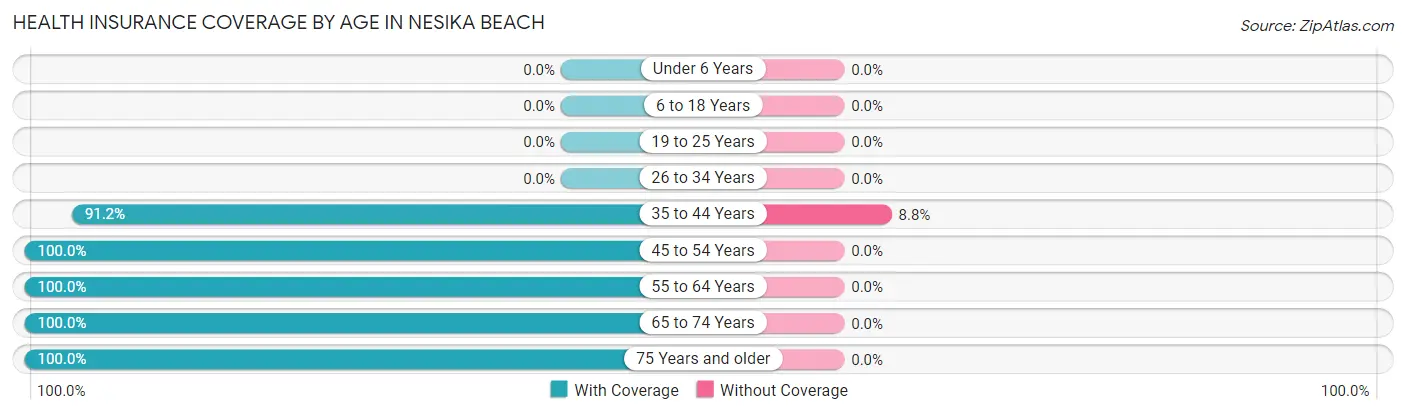
| Age Bracket | With Coverage | Without Coverage |
| Under 6 Years | 0 (0.0%) | 0 (0.0%) |
| 6 to 18 Years | 0 (0.0%) | 0 (0.0%) |
| 19 to 25 Years | 0 (0.0%) | 0 (0.0%) |
| 26 to 34 Years | 0 (0.0%) | 0 (0.0%) |
| 35 to 44 Years | 31 (91.2%) | 3 (8.8%) |
| 45 to 54 Years | 23 (100.0%) | 0 (0.0%) |
| 55 to 64 Years | 124 (100.0%) | 0 (0.0%) |
| 65 to 74 Years | 157 (100.0%) | 0 (0.0%) |
| 75 Years and older | 17 (100.0%) | 0 (0.0%) |
| Total | 352 (99.2%) | 3 (0.9%) |
Health Insurance Coverage by Citizenship Status in Nesika Beach
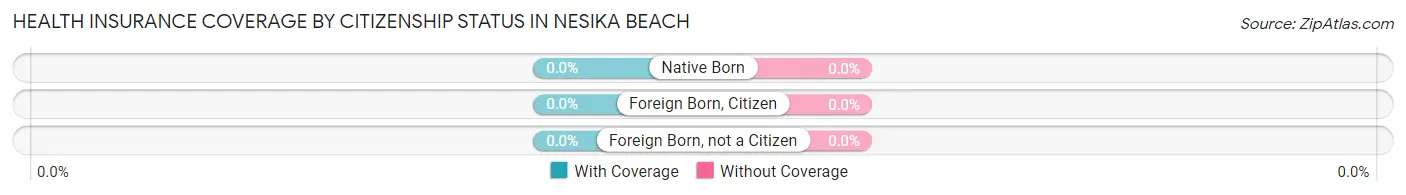
| Citizenship Status | With Coverage | Without Coverage |
| Native Born | 0 (0.0%) | 0 (0.0%) |
| Foreign Born, Citizen | 0 (0.0%) | 0 (0.0%) |
| Foreign Born, not a Citizen | 0 (0.0%) | 0 (0.0%) |
Health Insurance Coverage by Household Income in Nesika Beach
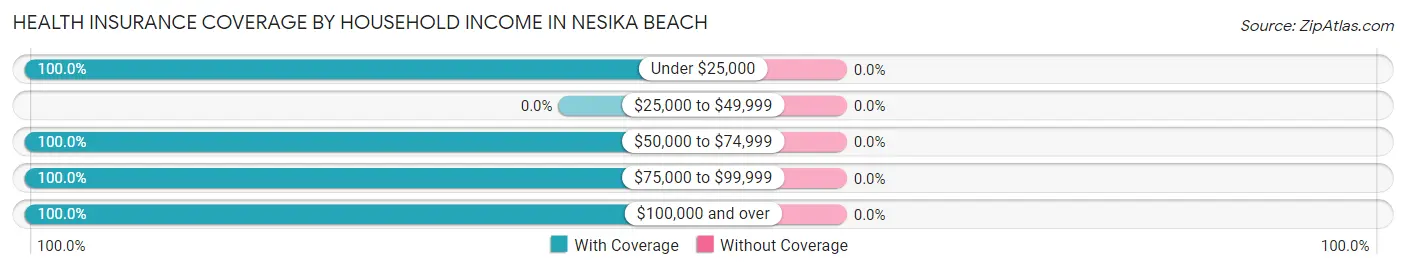
| Household Income | With Coverage | Without Coverage |
| Under $25,000 | 19 (100.0%) | 0 (0.0%) |
| $25,000 to $49,999 | 0 (0.0%) | 0 (0.0%) |
| $50,000 to $74,999 | 192 (100.0%) | 0 (0.0%) |
| $75,000 to $99,999 | 132 (100.0%) | 0 (0.0%) |
| $100,000 and over | 7 (100.0%) | 0 (0.0%) |
Public vs Private Health Insurance Coverage by Age in Nesika Beach
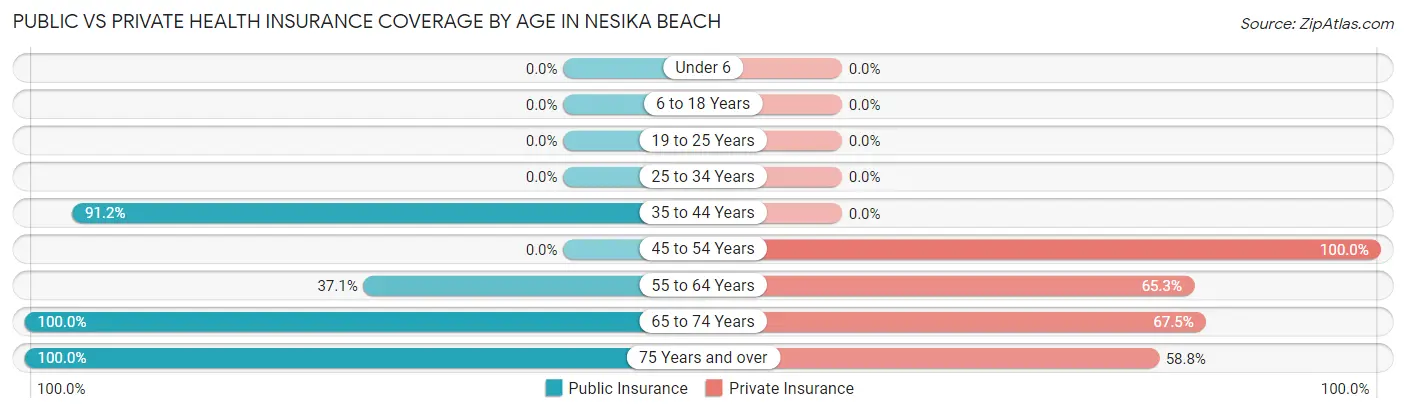
| Age Bracket | Public Insurance | Private Insurance |
| Under 6 | 0 (0.0%) | 0 (0.0%) |
| 6 to 18 Years | 0 (0.0%) | 0 (0.0%) |
| 19 to 25 Years | 0 (0.0%) | 0 (0.0%) |
| 25 to 34 Years | 0 (0.0%) | 0 (0.0%) |
| 35 to 44 Years | 31 (91.2%) | 0 (0.0%) |
| 45 to 54 Years | 0 (0.0%) | 23 (100.0%) |
| 55 to 64 Years | 46 (37.1%) | 81 (65.3%) |
| 65 to 74 Years | 157 (100.0%) | 106 (67.5%) |
| 75 Years and over | 17 (100.0%) | 10 (58.8%) |
| Total | 251 (70.7%) | 220 (62.0%) |
Disability Status by Sex by Age in Nesika Beach
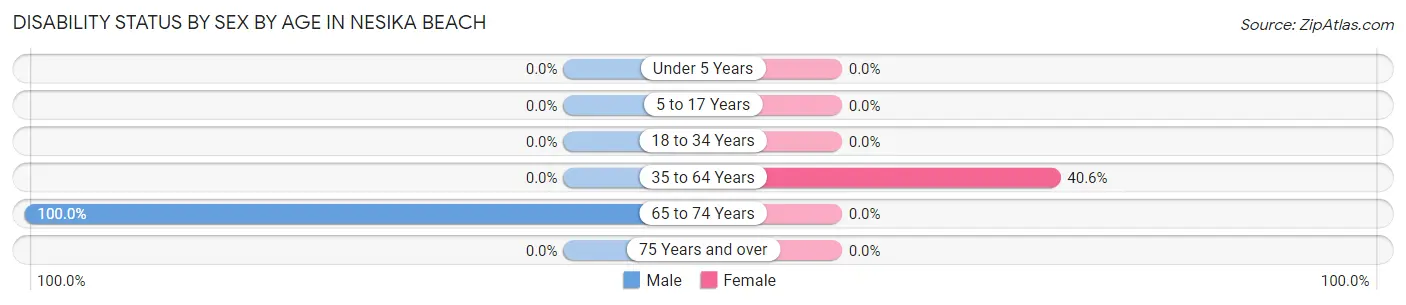
| Age Bracket | Male | Female |
| Under 5 Years | 0 (0.0%) | 0 (0.0%) |
| 5 to 17 Years | 0 (0.0%) | 0 (0.0%) |
| 18 to 34 Years | 0 (0.0%) | 0 (0.0%) |
| 35 to 64 Years | 0 (0.0%) | 43 (40.6%) |
| 65 to 74 Years | 116 (100.0%) | 0 (0.0%) |
| 75 Years and over | 0 (0.0%) | 0 (0.0%) |
Disability Class by Sex by Age in Nesika Beach
Disability Class: Hearing Difficulty
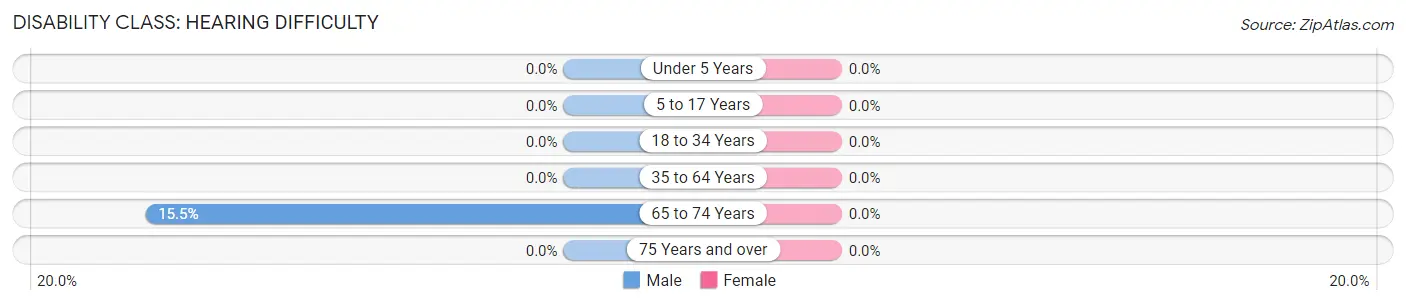
| Age Bracket | Male | Female |
| Under 5 Years | 0 (0.0%) | 0 (0.0%) |
| 5 to 17 Years | 0 (0.0%) | 0 (0.0%) |
| 18 to 34 Years | 0 (0.0%) | 0 (0.0%) |
| 35 to 64 Years | 0 (0.0%) | 0 (0.0%) |
| 65 to 74 Years | 18 (15.5%) | 0 (0.0%) |
| 75 Years and over | 0 (0.0%) | 0 (0.0%) |
Disability Class: Vision Difficulty
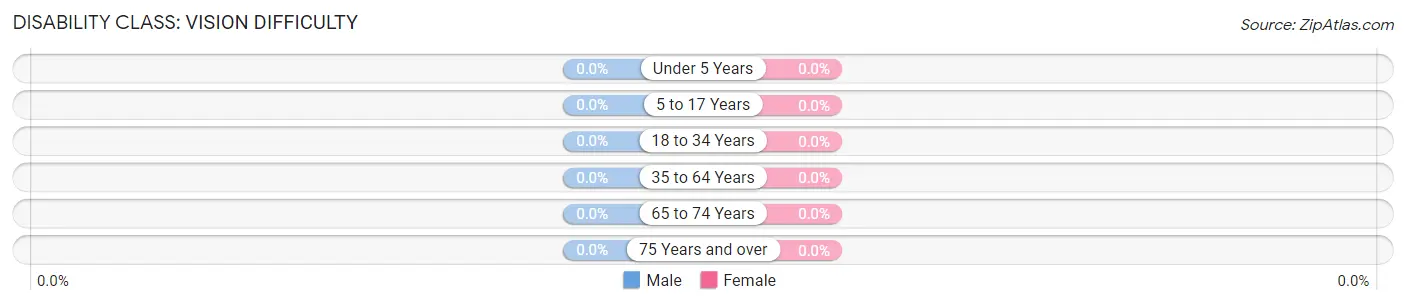
| Age Bracket | Male | Female |
| Under 5 Years | 0 (0.0%) | 0 (0.0%) |
| 5 to 17 Years | 0 (0.0%) | 0 (0.0%) |
| 18 to 34 Years | 0 (0.0%) | 0 (0.0%) |
| 35 to 64 Years | 0 (0.0%) | 0 (0.0%) |
| 65 to 74 Years | 0 (0.0%) | 0 (0.0%) |
| 75 Years and over | 0 (0.0%) | 0 (0.0%) |
Disability Class: Cognitive Difficulty
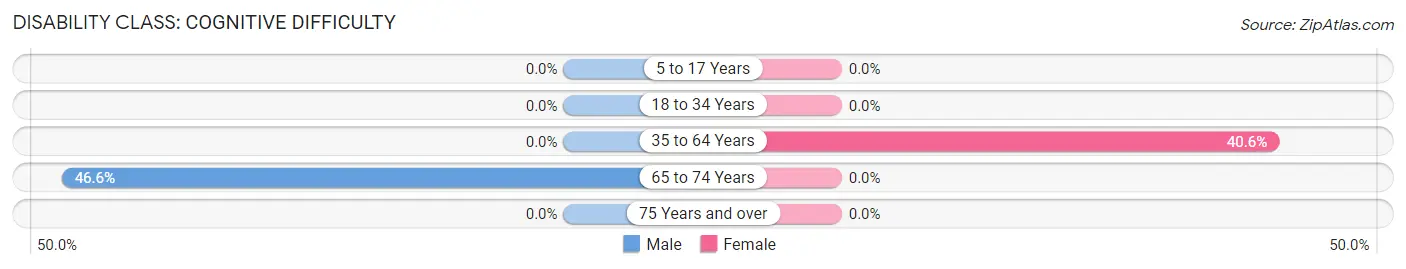
| Age Bracket | Male | Female |
| 5 to 17 Years | 0 (0.0%) | 0 (0.0%) |
| 18 to 34 Years | 0 (0.0%) | 0 (0.0%) |
| 35 to 64 Years | 0 (0.0%) | 43 (40.6%) |
| 65 to 74 Years | 54 (46.6%) | 0 (0.0%) |
| 75 Years and over | 0 (0.0%) | 0 (0.0%) |
Disability Class: Ambulatory Difficulty
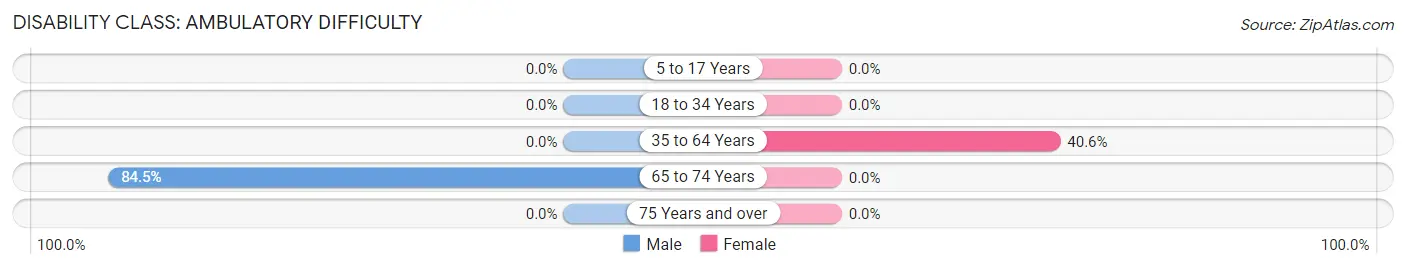
| Age Bracket | Male | Female |
| 5 to 17 Years | 0 (0.0%) | 0 (0.0%) |
| 18 to 34 Years | 0 (0.0%) | 0 (0.0%) |
| 35 to 64 Years | 0 (0.0%) | 43 (40.6%) |
| 65 to 74 Years | 98 (84.5%) | 0 (0.0%) |
| 75 Years and over | 0 (0.0%) | 0 (0.0%) |
Disability Class: Self-Care Difficulty

| Age Bracket | Male | Female |
| 5 to 17 Years | 0 (0.0%) | 0 (0.0%) |
| 18 to 34 Years | 0 (0.0%) | 0 (0.0%) |
| 35 to 64 Years | 0 (0.0%) | 43 (40.6%) |
| 65 to 74 Years | 98 (84.5%) | 0 (0.0%) |
| 75 Years and over | 0 (0.0%) | 0 (0.0%) |
Technology Access in Nesika Beach
Computing Device Access in Nesika Beach
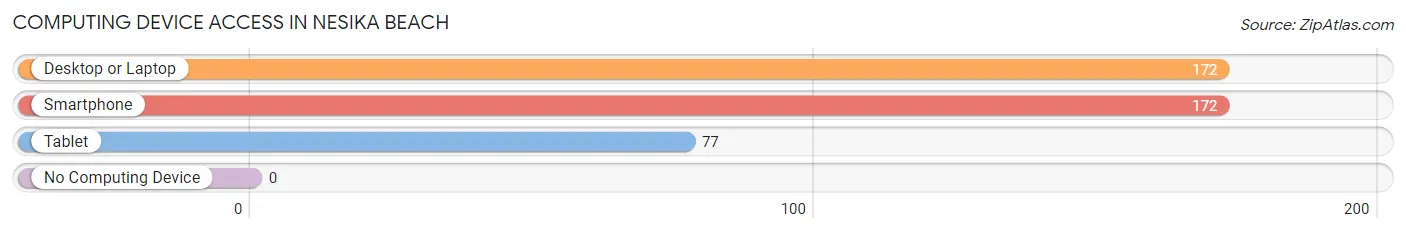
| Device Type | # Households | % Households |
| Desktop or Laptop | 172 | 97.7% |
| Smartphone | 172 | 97.7% |
| Tablet | 77 | 43.8% |
| No Computing Device | 0 | 0.0% |
| Total | 176 | 100.0% |
Internet Access in Nesika Beach
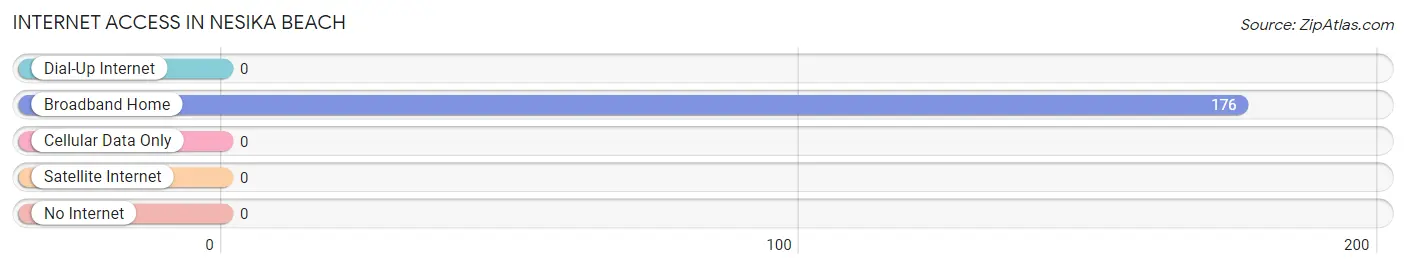
| Internet Type | # Households | % Households |
| Dial-Up Internet | 0 | 0.0% |
| Broadband Home | 176 | 100.0% |
| Cellular Data Only | 0 | 0.0% |
| Satellite Internet | 0 | 0.0% |
| No Internet | 0 | 0.0% |
| Total | 176 | 100.0% |
Nesika Beach Summary
Nesika Beach is a small unincorporated community located in Tillamook County, Oregon, United States. It is situated on the Pacific Ocean, approximately 10 miles south of the city of Tillamook. The community is located on the northern end of the Three Capes Scenic Loop, a popular tourist destination.
History
Nesika Beach was originally inhabited by the Tillamook people, who were part of the larger Chinookan tribe. The area was first explored by Europeans in 1788, when the British explorer Captain Robert Gray sailed into Tillamook Bay. The area was later settled by European settlers in the mid-1800s, and the community of Nesika Beach was established in the early 1900s.
The name “Nesika” is derived from the Chinookan word for “our people”. The community was originally a fishing village, and the local economy was largely based on the harvesting of salmon and other fish from the nearby ocean.
Geography
Nesika Beach is located in the northern part of Tillamook County, Oregon, approximately 10 miles south of the city of Tillamook. The community is situated on the Pacific Ocean, and is part of the Three Capes Scenic Loop, a popular tourist destination.
The area is characterized by a rugged coastline, with rocky cliffs and sandy beaches. The nearby ocean provides a variety of recreational activities, including fishing, boating, and surfing. The area is also home to a variety of wildlife, including sea lions, seals, and whales.
Economy
The economy of Nesika Beach is largely based on tourism. The area is a popular destination for visitors from around the world, who come to enjoy the scenic beauty of the coastline and the variety of recreational activities available.
The local economy is also supported by the fishing industry, which harvests a variety of fish from the nearby ocean. The area is also home to a number of small businesses, including restaurants, gift shops, and art galleries.
Demographics
As of the 2010 census, the population of Nesika Beach was 545. The racial makeup of the community was 94.2% White, 0.7% African American, 0.4% Native American, 0.7% Asian, 0.2% Pacific Islander, and 3.0% from other races. The median household income was $41,250, and the median family income was $50,000.
Conclusion
Nesika Beach is a small unincorporated community located in Tillamook County, Oregon. The area is characterized by a rugged coastline, with rocky cliffs and sandy beaches. The local economy is largely based on tourism and fishing, and the area is a popular destination for visitors from around the world. The population of Nesika Beach was 545 as of the 2010 census, and the median household income was $41,250.
Common Questions
What is the Total Population of Nesika Beach?
Total Population of Nesika Beach is 355.
What is the Total Male Population of Nesika Beach?
Total Male Population of Nesika Beach is 203.
What is the Total Female Population of Nesika Beach?
Total Female Population of Nesika Beach is 152.
What is the Ratio of Males per 100 Females in Nesika Beach?
There are 133.55 Males per 100 Females in Nesika Beach.
What is the Ratio of Females per 100 Males in Nesika Beach?
There are 74.88 Females per 100 Males in Nesika Beach.
What is the Median Population Age in Nesika Beach?
Median Population Age in Nesika Beach is 65.0 Years.
What is the Average Family Size in Nesika Beach
Average Family Size in Nesika Beach is 2.1 People.
What is the Average Household Size in Nesika Beach
Average Household Size in Nesika Beach is 2.0 People.
What is Per Capita Income in Nesika Beach?
Per Capita income in Nesika Beach is $35,382.
What is the Median Family Income in Nesika Beach?
Median Family Income in Nesika Beach is $82,589.
What is the Median Household income in Nesika Beach?
Median Household Income in Nesika Beach is $68,261.
What is Inequality or Gini Index in Nesika Beach?
Inequality or Gini Index in Nesika Beach is 0.17.
How Large is the Labor Force in Nesika Beach?
There are 83 People in the Labor Forcein in Nesika Beach.
What is the Percentage of People in the Labor Force in Nesika Beach?
23.4% of People are in the Labor Force in Nesika Beach.
What is the Unemployment Rate in Nesika Beach?
Unemployment Rate in Nesika Beach is 3.6%.