Helix, OR
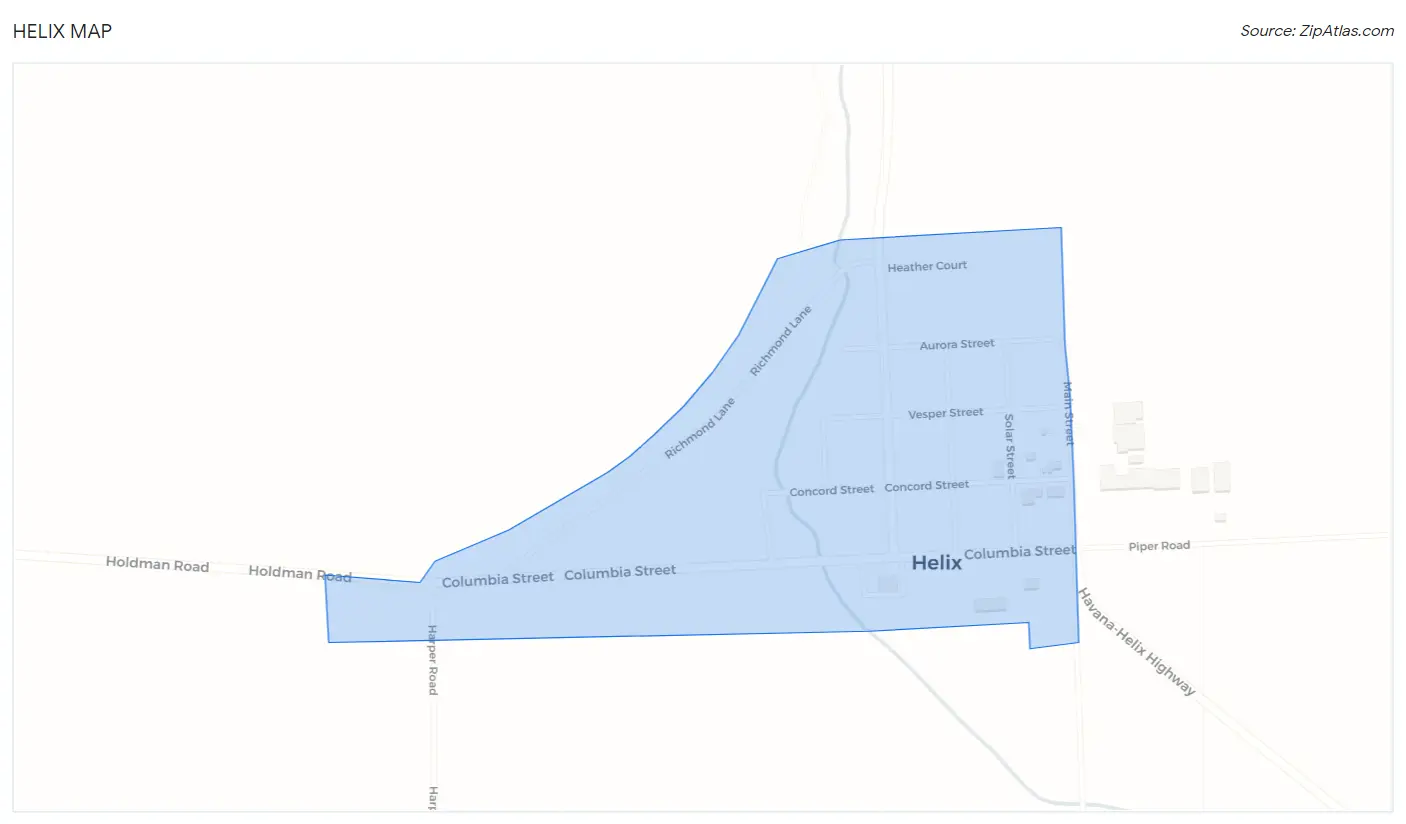
Helix Map
Helix Overview
358
TOTAL POPULATION
132
MALE POPULATION
226
FEMALE POPULATION
58.41
MALES / 100 FEMALES
171.21
FEMALES / 100 MALES
41.2
MEDIAN AGE
2.8
AVG FAMILY SIZE
2.5
AVG HOUSEHOLD SIZE
$38,020
PER CAPITA INCOME
$177,904
AVG FAMILY INCOME
$177,669
AVG HOUSEHOLD INCOME
71.2%
WAGE / INCOME GAP [ % ]
28.8¢/ $1
WAGE / INCOME GAP [ $ ]
0.28
INEQUALITY / GINI INDEX
198
LABOR FORCE [ PEOPLE ]
66.4%
PERCENT IN LABOR FORCE
1.5%
UNEMPLOYMENT RATE
Helix Zip Codes
Helix Area Codes
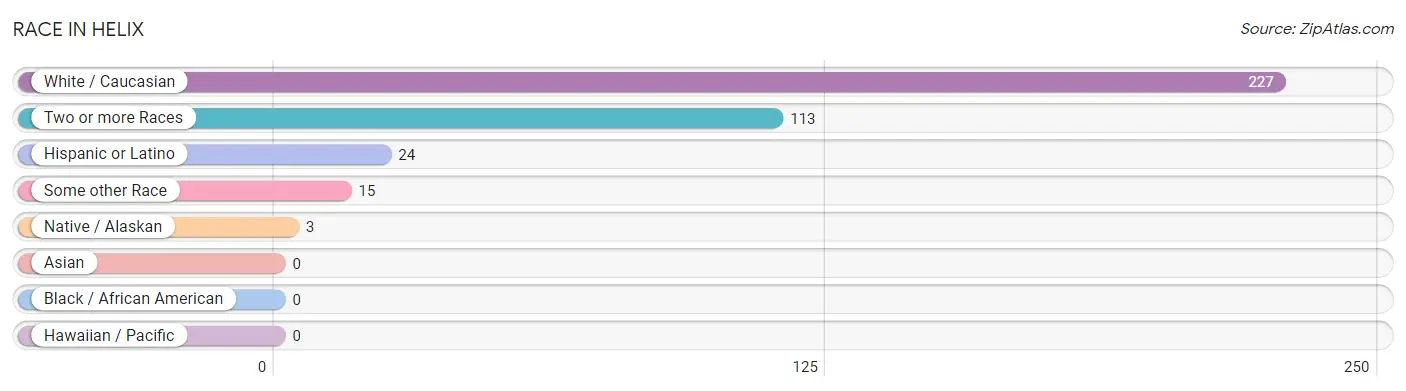
Race in Helix
The most populous races in Helix are White / Caucasian (227 | 63.4%), Two or more Races (113 | 31.6%), and Hispanic or Latino (24 | 6.7%).
| Race | # Population | % Population |
| Asian | 0 | 0.0% |
| Black / African American | 0 | 0.0% |
| Hawaiian / Pacific | 0 | 0.0% |
| Hispanic or Latino | 24 | 6.7% |
| Native / Alaskan | 3 | 0.8% |
| White / Caucasian | 227 | 63.4% |
| Two or more Races | 113 | 31.6% |
| Some other Race | 15 | 4.2% |
| Total | 358 | 100.0% |
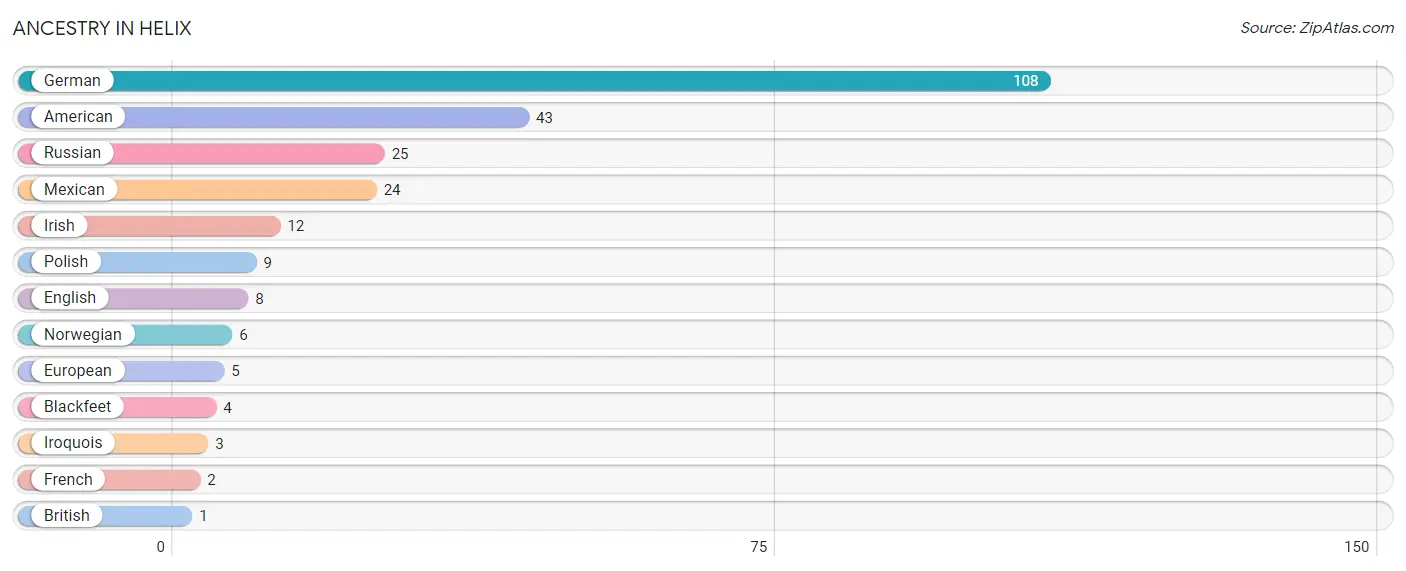
Ancestry in Helix
The most populous ancestries reported in Helix are German (108 | 30.2%), American (43 | 12.0%), Russian (25 | 7.0%), Mexican (24 | 6.7%), and Irish (12 | 3.4%), together accounting for 59.2% of all Helix residents.
| Ancestry | # Population | % Population |
| American | 43 | 12.0% |
| Blackfeet | 4 | 1.1% |
| British | 1 | 0.3% |
| English | 8 | 2.2% |
| European | 5 | 1.4% |
| French | 2 | 0.6% |
| German | 108 | 30.2% |
| Irish | 12 | 3.4% |
| Iroquois | 3 | 0.8% |
| Mexican | 24 | 6.7% |
| Norwegian | 6 | 1.7% |
| Polish | 9 | 2.5% |
| Russian | 25 | 7.0% | View All 13 Rows |
Immigrants in Helix

| Immigration Origin | # Population | % Population | View All 0 Rows |
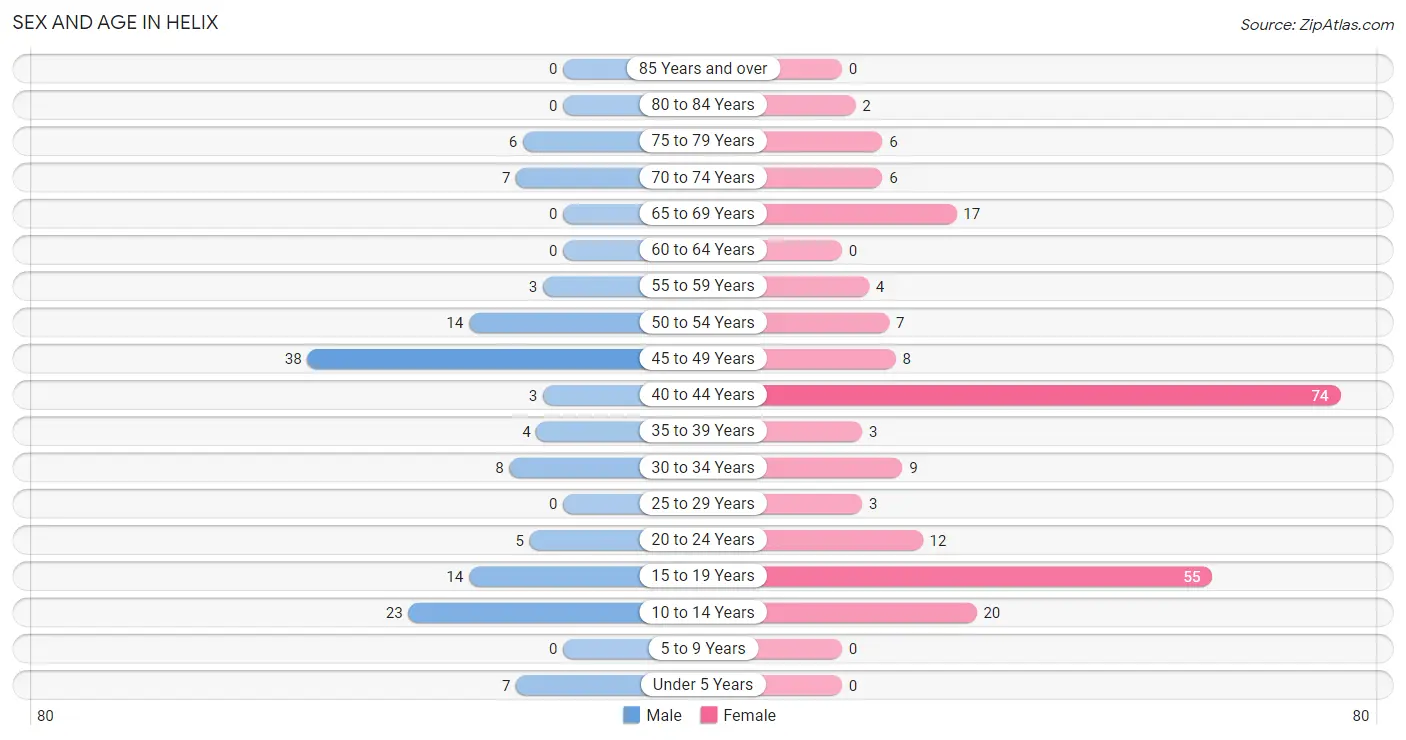
Sex and Age in Helix
Sex and Age in Helix
The most populous age groups in Helix are 45 to 49 Years (38 | 28.8%) for men and 40 to 44 Years (74 | 32.7%) for women.
| Age Bracket | Male | Female |
| Under 5 Years | 7 (5.3%) | 0 (0.0%) |
| 5 to 9 Years | 0 (0.0%) | 0 (0.0%) |
| 10 to 14 Years | 23 (17.4%) | 20 (8.8%) |
| 15 to 19 Years | 14 (10.6%) | 55 (24.3%) |
| 20 to 24 Years | 5 (3.8%) | 12 (5.3%) |
| 25 to 29 Years | 0 (0.0%) | 3 (1.3%) |
| 30 to 34 Years | 8 (6.1%) | 9 (4.0%) |
| 35 to 39 Years | 4 (3.0%) | 3 (1.3%) |
| 40 to 44 Years | 3 (2.3%) | 74 (32.7%) |
| 45 to 49 Years | 38 (28.8%) | 8 (3.5%) |
| 50 to 54 Years | 14 (10.6%) | 7 (3.1%) |
| 55 to 59 Years | 3 (2.3%) | 4 (1.8%) |
| 60 to 64 Years | 0 (0.0%) | 0 (0.0%) |
| 65 to 69 Years | 0 (0.0%) | 17 (7.5%) |
| 70 to 74 Years | 7 (5.3%) | 6 (2.6%) |
| 75 to 79 Years | 6 (4.5%) | 6 (2.6%) |
| 80 to 84 Years | 0 (0.0%) | 2 (0.9%) |
| 85 Years and over | 0 (0.0%) | 0 (0.0%) |
| Total | 132 (100.0%) | 226 (100.0%) |
Families and Households in Helix
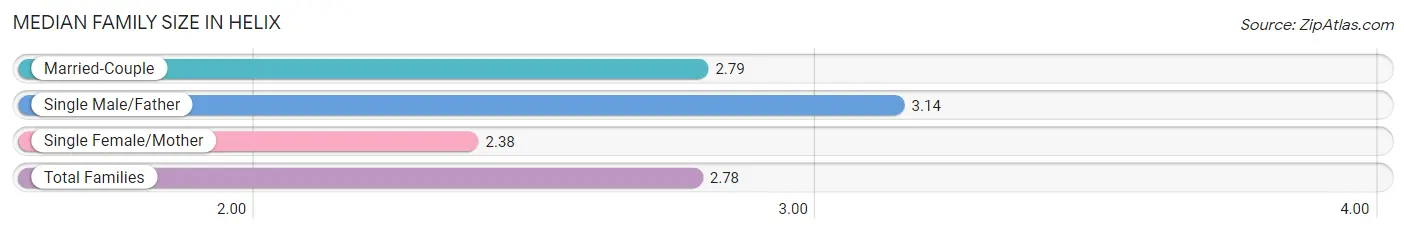
Median Family Size in Helix
The median family size in Helix is 2.78 persons per family, with single male/father families (7 | 5.8%) accounting for the largest median family size of 3.14 persons per family. On the other hand, single female/mother families (8 | 6.7%) represent the smallest median family size with 2.38 persons per family.
| Family Type | # Families | Family Size |
| Married-Couple | 105 (87.5%) | 2.79 |
| Single Male/Father | 7 (5.8%) | 3.14 |
| Single Female/Mother | 8 (6.7%) | 2.38 |
| Total Families | 120 (100.0%) | 2.78 |
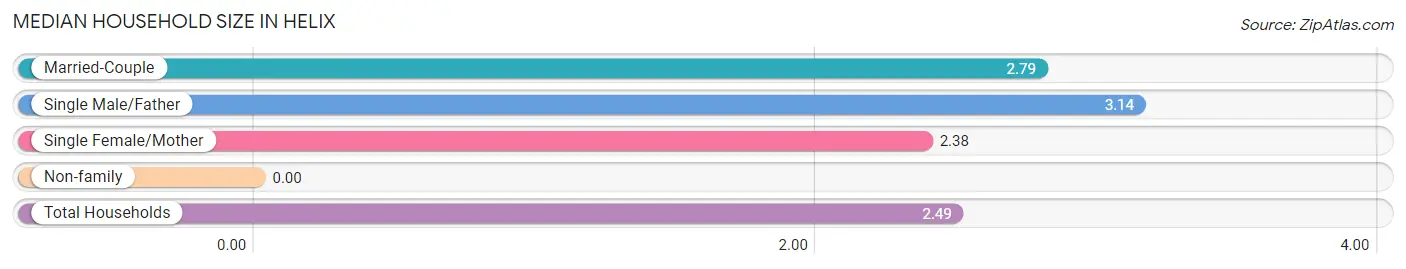
Median Household Size in Helix
| Household Type | # Households | Household Size |
| Married-Couple | 105 (72.9%) | 2.79 |
| Single Male/Father | 7 (4.9%) | 3.14 |
| Single Female/Mother | 8 (5.6%) | 2.38 |
| Non-family | 24 (16.7%) | - |
| Total Households | 144 (100.0%) | 2.49 |
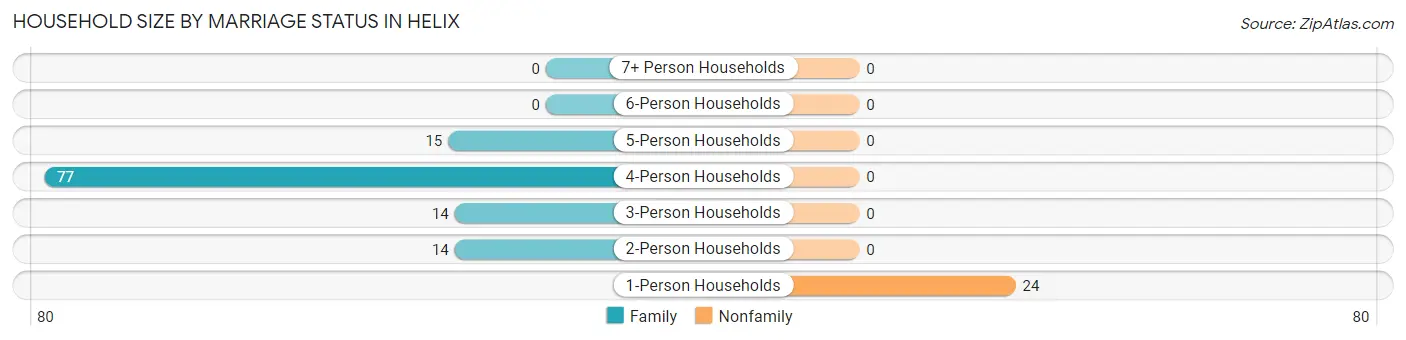
Household Size by Marriage Status in Helix
Out of a total of 144 households in Helix, 120 (83.3%) are family households, while 24 (16.7%) are nonfamily households. The most numerous type of family households are 4-person households, comprising 77, and the most common type of nonfamily households are 1-person households, comprising 24.
| Household Size | Family Households | Nonfamily Households |
| 1-Person Households | - | 24 (16.7%) |
| 2-Person Households | 14 (9.7%) | 0 (0.0%) |
| 3-Person Households | 14 (9.7%) | 0 (0.0%) |
| 4-Person Households | 77 (53.5%) | 0 (0.0%) |
| 5-Person Households | 15 (10.4%) | 0 (0.0%) |
| 6-Person Households | 0 (0.0%) | 0 (0.0%) |
| 7+ Person Households | 0 (0.0%) | 0 (0.0%) |
| Total | 120 (83.3%) | 24 (16.7%) |
Female Fertility in Helix
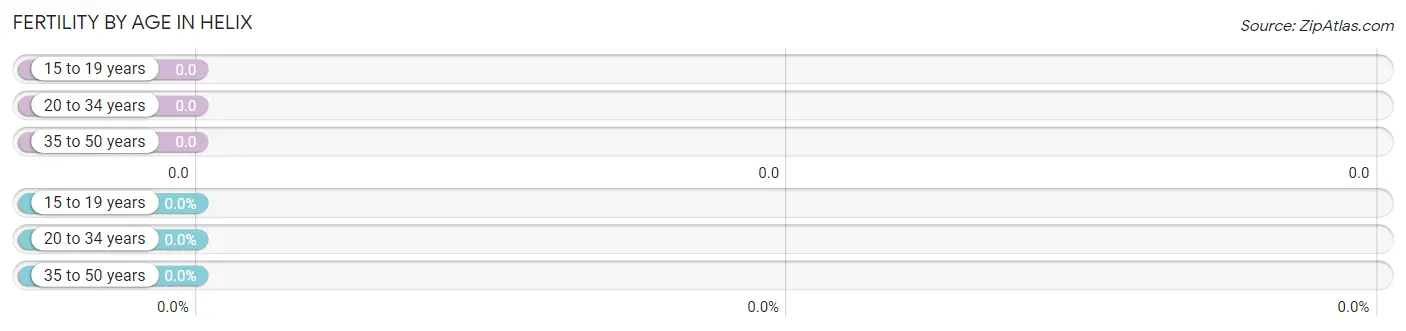
Fertility by Age in Helix
| Age Bracket | Women with Births | Births / 1,000 Women |
| 15 to 19 years | 0 (0.0%) | 0.0 |
| 20 to 34 years | 0 (0.0%) | 0.0 |
| 35 to 50 years | 0 (0.0%) | 0.0 |
| Total | 0 (0.0%) | 0.0 |
Fertility by Age by Marriage Status in Helix
| Age Bracket | Married | Unmarried |
| 15 to 19 years | 0 (0.0%) | 0 (0.0%) |
| 20 to 34 years | 0 (0.0%) | 0 (0.0%) |
| 35 to 50 years | 0 (0.0%) | 0 (0.0%) |
| Total | 0 (0.0%) | 0 (0.0%) |
Fertility by Education in Helix
| Educational Attainment | Women with Births | Births / 1,000 Women |
| Less than High School | 0 (0.0%) | 0.0 |
| High School Diploma | 0 (0.0%) | 0.0 |
| College or Associate's Degree | 0 (0.0%) | 0.0 |
| Bachelor's Degree | 0 (0.0%) | 0.0 |
| Graduate Degree | 0 (0.0%) | 0.0 |
| Total | 0 (0.0%) | 0.0 |
Fertility by Education by Marriage Status in Helix
| Educational Attainment | Married | Unmarried |
| Less than High School | 0 (0.0%) | 0 (0.0%) |
| High School Diploma | 0 (0.0%) | 0 (0.0%) |
| College or Associate's Degree | 0 (0.0%) | 0 (0.0%) |
| Bachelor's Degree | 0 (0.0%) | 0 (0.0%) |
| Graduate Degree | 0 (0.0%) | 0 (0.0%) |
| Total | 0 (0.0%) | 0 (0.0%) |
Income in Helix
Income Overview in Helix
Per Capita Income in Helix is $38,020, while median incomes of families and households are $177,904 and $177,669 respectively.
| Characteristic | Number | Measure |
| Per Capita Income | 358 | $38,020 |
| Median Family Income | 120 | $177,904 |
| Mean Family Income | 120 | $136,815 |
| Median Household Income | 144 | $177,669 |
| Mean Household Income | 144 | $124,570 |
| Income Deficit | 120 | $0 |
| Wage / Income Gap (%) | 358 | 71.17% |
| Wage / Income Gap ($) | 358 | 28.83¢ per $1 |
| Gini / Inequality Index | 358 | 0.28 |
Earnings by Sex in Helix
Average Earnings in Helix are $21,950, $72,763 for men and $20,974 for women, a difference of 71.2%.
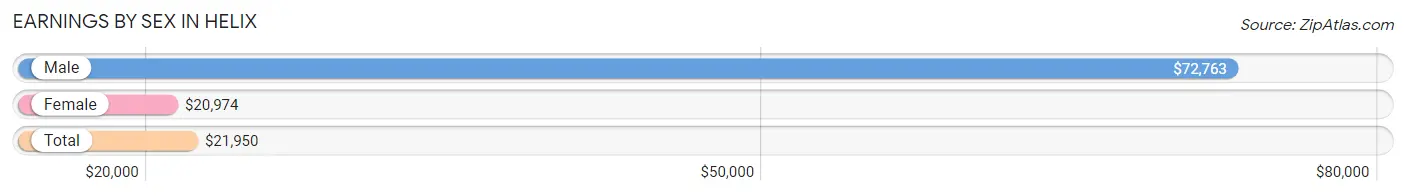
| Sex | Number | Average Earnings |
| Male | 74 (35.4%) | $72,763 |
| Female | 135 (64.6%) | $20,974 |
| Total | 209 (100.0%) | $21,950 |
Earnings by Sex by Income Bracket in Helix
The most common earnings brackets in Helix are $65,000 to $74,999 for men (51 | 68.9%) and $20,000 to $22,499 for women (68 | 50.4%).
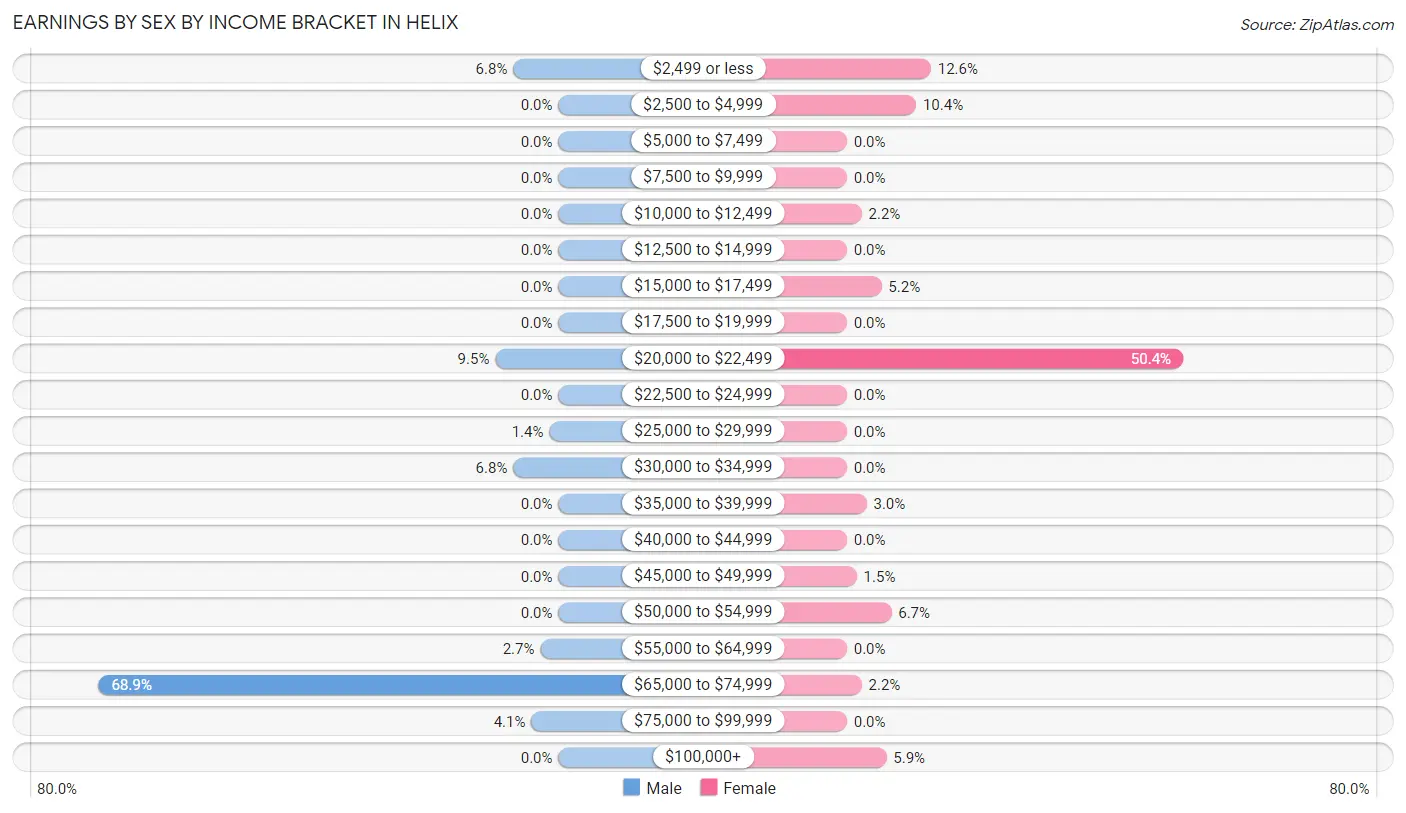
| Income | Male | Female |
| $2,499 or less | 5 (6.8%) | 17 (12.6%) |
| $2,500 to $4,999 | 0 (0.0%) | 14 (10.4%) |
| $5,000 to $7,499 | 0 (0.0%) | 0 (0.0%) |
| $7,500 to $9,999 | 0 (0.0%) | 0 (0.0%) |
| $10,000 to $12,499 | 0 (0.0%) | 3 (2.2%) |
| $12,500 to $14,999 | 0 (0.0%) | 0 (0.0%) |
| $15,000 to $17,499 | 0 (0.0%) | 7 (5.2%) |
| $17,500 to $19,999 | 0 (0.0%) | 0 (0.0%) |
| $20,000 to $22,499 | 7 (9.5%) | 68 (50.4%) |
| $22,500 to $24,999 | 0 (0.0%) | 0 (0.0%) |
| $25,000 to $29,999 | 1 (1.3%) | 0 (0.0%) |
| $30,000 to $34,999 | 5 (6.8%) | 0 (0.0%) |
| $35,000 to $39,999 | 0 (0.0%) | 4 (3.0%) |
| $40,000 to $44,999 | 0 (0.0%) | 0 (0.0%) |
| $45,000 to $49,999 | 0 (0.0%) | 2 (1.5%) |
| $50,000 to $54,999 | 0 (0.0%) | 9 (6.7%) |
| $55,000 to $64,999 | 2 (2.7%) | 0 (0.0%) |
| $65,000 to $74,999 | 51 (68.9%) | 3 (2.2%) |
| $75,000 to $99,999 | 3 (4.1%) | 0 (0.0%) |
| $100,000+ | 0 (0.0%) | 8 (5.9%) |
| Total | 74 (100.0%) | 135 (100.0%) |
Earnings by Sex by Educational Attainment in Helix
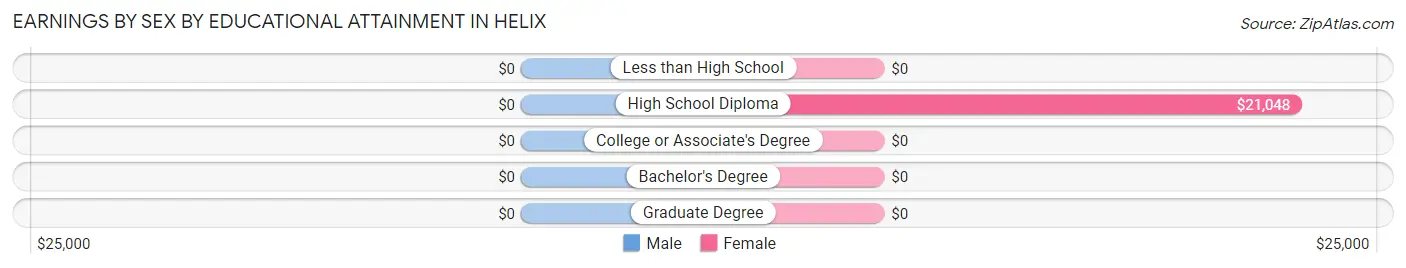
| Educational Attainment | Male Income | Female Income |
| Less than High School | - | - |
| High School Diploma | - | - |
| College or Associate's Degree | - | - |
| Bachelor's Degree | - | - |
| Graduate Degree | - | - |
| Total | $73,092 | $21,195 |
Family Income in Helix
Family Income Brackets in Helix
According to the Helix family income data, there are 73 families falling into the $150,000 to $199,999 income range, which is the most common income bracket and makes up 60.8% of all families.
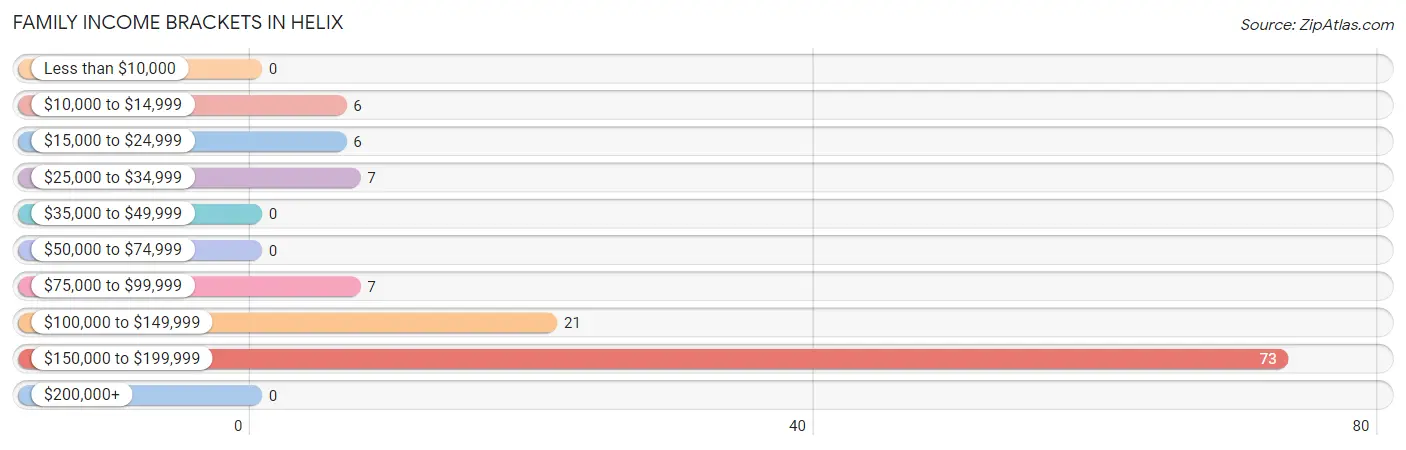
| Income Bracket | # Families | % Families |
| Less than $10,000 | 0 | 0.0% |
| $10,000 to $14,999 | 6 | 5.0% |
| $15,000 to $24,999 | 6 | 5.0% |
| $25,000 to $34,999 | 7 | 5.8% |
| $35,000 to $49,999 | 0 | 0.0% |
| $50,000 to $74,999 | 0 | 0.0% |
| $75,000 to $99,999 | 7 | 5.8% |
| $100,000 to $149,999 | 21 | 17.5% |
| $150,000 to $199,999 | 73 | 60.8% |
| $200,000+ | 0 | 0.0% |
Family Income by Famaliy Size in Helix
4-person families (77 | 64.2%) account for the highest median family income in Helix with $178,585 per family, while 4-person families (77 | 64.2%) have the highest median income of $44,646 per family member.
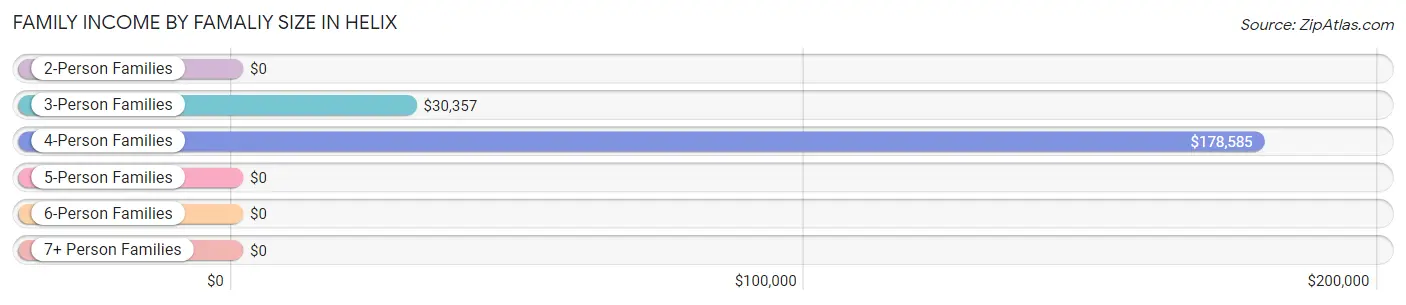
| Income Bracket | # Families | Median Income |
| 2-Person Families | 14 (11.7%) | $0 |
| 3-Person Families | 14 (11.7%) | $30,357 |
| 4-Person Families | 77 (64.2%) | $178,585 |
| 5-Person Families | 15 (12.5%) | $0 |
| 6-Person Families | 0 (0.0%) | $0 |
| 7+ Person Families | 0 (0.0%) | $0 |
| Total | 120 (100.0%) | $177,904 |
Family Income by Number of Earners in Helix
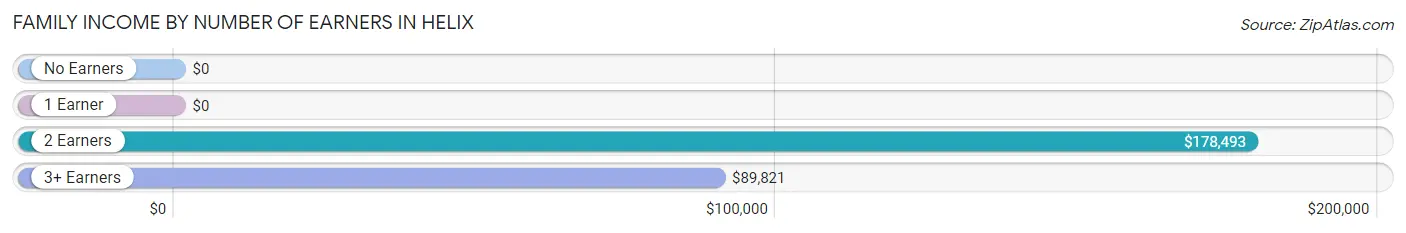
| Number of Earners | # Families | Median Income |
| No Earners | 12 (10.0%) | $0 |
| 1 Earner | 13 (10.8%) | $0 |
| 2 Earners | 82 (68.3%) | $178,493 |
| 3+ Earners | 13 (10.8%) | $89,821 |
| Total | 120 (100.0%) | $177,904 |
Household Income in Helix
Household Income Brackets in Helix
With 79 households falling in the category, the $150,000 to $199,999 income range is the most frequent in Helix, accounting for 54.9% of all households.
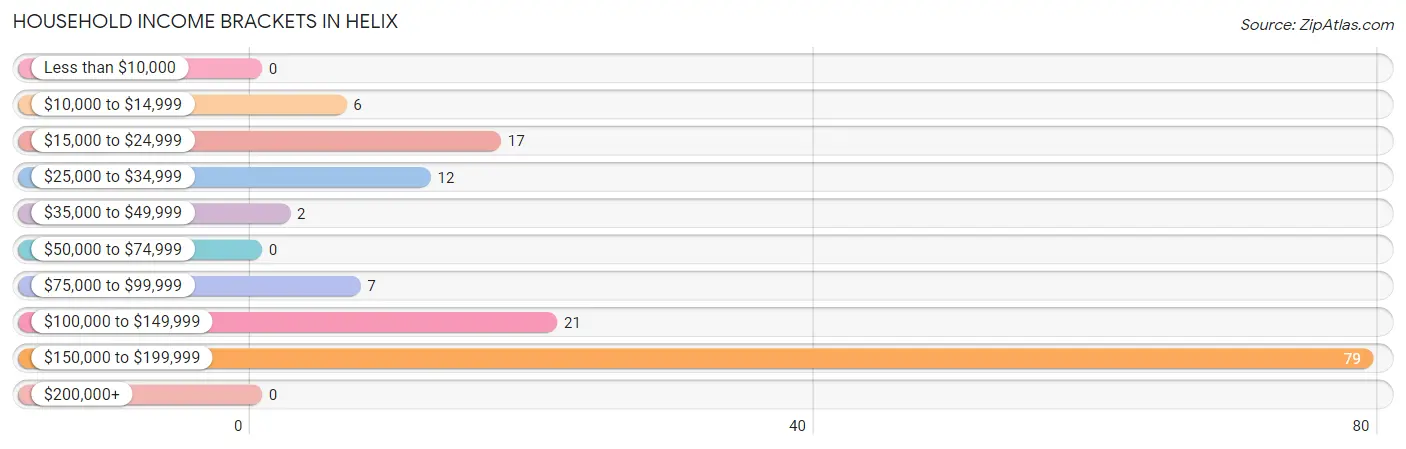
| Income Bracket | # Households | % Households |
| Less than $10,000 | 0 | 0.0% |
| $10,000 to $14,999 | 6 | 4.2% |
| $15,000 to $24,999 | 17 | 11.8% |
| $25,000 to $34,999 | 12 | 8.3% |
| $35,000 to $49,999 | 2 | 1.4% |
| $50,000 to $74,999 | 0 | 0.0% |
| $75,000 to $99,999 | 7 | 4.9% |
| $100,000 to $149,999 | 21 | 14.6% |
| $150,000 to $199,999 | 79 | 54.9% |
| $200,000+ | 0 | 0.0% |
Household Income by Householder Age in Helix
The median household income in Helix is $177,669, with the highest median household income of $178,585 found in the 25 to 44 years age bracket for the primary householder. A total of 83 households (57.6%) fall into this category. Meanwhile, the 15 to 24 years age bracket for the primary householder has the lowest median household income of $0, with 5 households (3.5%) in this group.
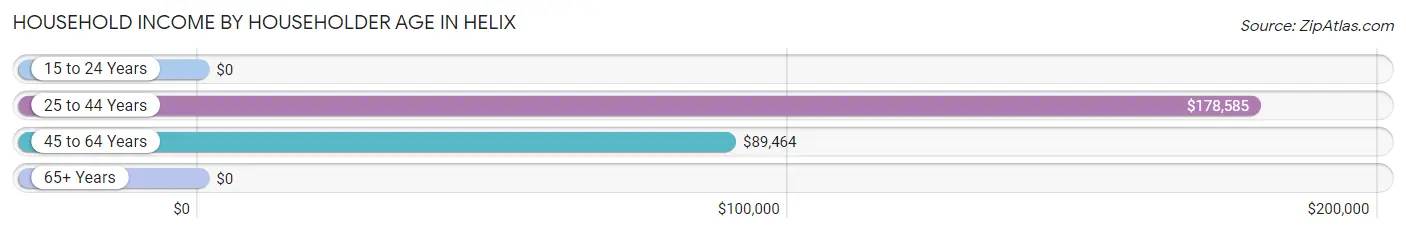
| Income Bracket | # Households | Median Income |
| 15 to 24 Years | 5 (3.5%) | $0 |
| 25 to 44 Years | 83 (57.6%) | $178,585 |
| 45 to 64 Years | 25 (17.4%) | $89,464 |
| 65+ Years | 31 (21.5%) | $0 |
| Total | 144 (100.0%) | $177,669 |
Poverty in Helix
Income Below Poverty by Sex and Age in Helix
With 14.4% poverty level for males and 13.7% for females among the residents of Helix, 15 year old males and 75 year old and over females are the most vulnerable to poverty, with 9 males (100.0%) and 6 females (75.0%) in their respective age groups living below the poverty level.
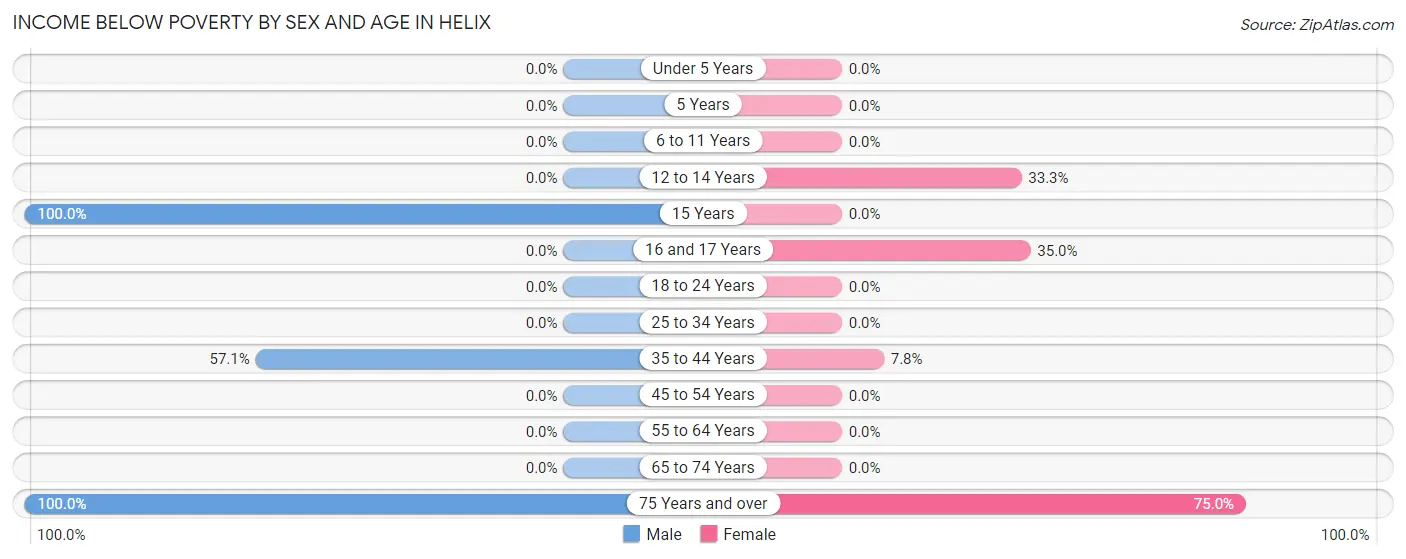
| Age Bracket | Male | Female |
| Under 5 Years | 0 (0.0%) | 0 (0.0%) |
| 5 Years | 0 (0.0%) | 0 (0.0%) |
| 6 to 11 Years | 0 (0.0%) | 0 (0.0%) |
| 12 to 14 Years | 0 (0.0%) | 5 (33.3%) |
| 15 Years | 9 (100.0%) | 0 (0.0%) |
| 16 and 17 Years | 0 (0.0%) | 14 (35.0%) |
| 18 to 24 Years | 0 (0.0%) | 0 (0.0%) |
| 25 to 34 Years | 0 (0.0%) | 0 (0.0%) |
| 35 to 44 Years | 4 (57.1%) | 6 (7.8%) |
| 45 to 54 Years | 0 (0.0%) | 0 (0.0%) |
| 55 to 64 Years | 0 (0.0%) | 0 (0.0%) |
| 65 to 74 Years | 0 (0.0%) | 0 (0.0%) |
| 75 Years and over | 6 (100.0%) | 6 (75.0%) |
| Total | 19 (14.4%) | 31 (13.7%) |
Income Above Poverty by Sex and Age in Helix
According to the poverty statistics in Helix, males aged under 5 years and females aged 6 to 11 years are the age groups that are most secure financially, with 100.0% of males and 100.0% of females in these age groups living above the poverty line.
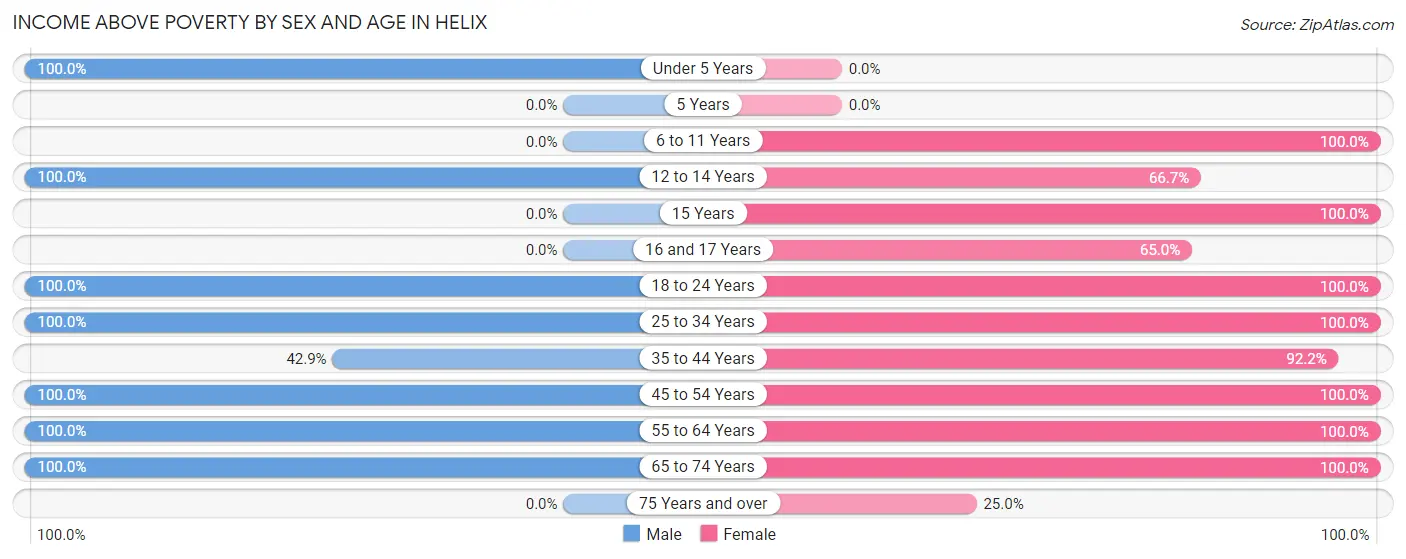
| Age Bracket | Male | Female |
| Under 5 Years | 7 (100.0%) | 0 (0.0%) |
| 5 Years | 0 (0.0%) | 0 (0.0%) |
| 6 to 11 Years | 0 (0.0%) | 5 (100.0%) |
| 12 to 14 Years | 23 (100.0%) | 10 (66.7%) |
| 15 Years | 0 (0.0%) | 1 (100.0%) |
| 16 and 17 Years | 0 (0.0%) | 26 (65.0%) |
| 18 to 24 Years | 10 (100.0%) | 26 (100.0%) |
| 25 to 34 Years | 8 (100.0%) | 12 (100.0%) |
| 35 to 44 Years | 3 (42.9%) | 71 (92.2%) |
| 45 to 54 Years | 52 (100.0%) | 15 (100.0%) |
| 55 to 64 Years | 3 (100.0%) | 4 (100.0%) |
| 65 to 74 Years | 7 (100.0%) | 23 (100.0%) |
| 75 Years and over | 0 (0.0%) | 2 (25.0%) |
| Total | 113 (85.6%) | 195 (86.3%) |
Income Below Poverty Among Married-Couple Families in Helix
The poverty statistics for married-couple families in Helix show that 11.4% or 12 of the total 105 families live below the poverty line. Families with 3 or 4 children have the highest poverty rate of 50.0%, comprising of 6 families. On the other hand, families with no children have the lowest poverty rate of 0.0%, which includes 0 families.
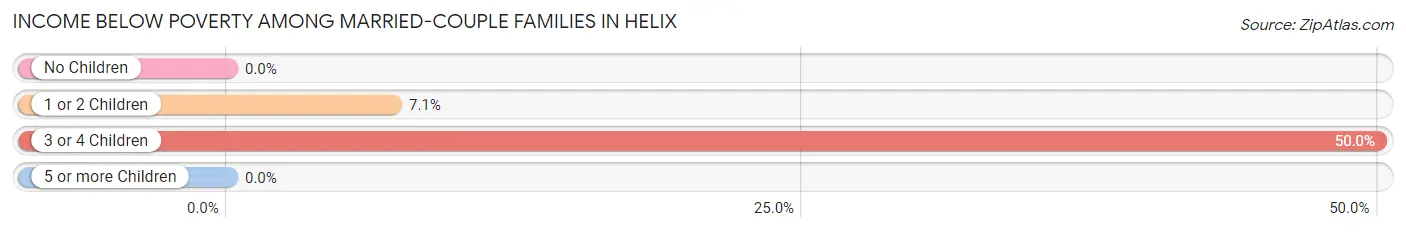
| Children | Above Poverty | Below Poverty |
| No Children | 9 (100.0%) | 0 (0.0%) |
| 1 or 2 Children | 78 (92.9%) | 6 (7.1%) |
| 3 or 4 Children | 6 (50.0%) | 6 (50.0%) |
| 5 or more Children | 0 (0.0%) | 0 (0.0%) |
| Total | 93 (88.6%) | 12 (11.4%) |
Income Below Poverty Among Single-Parent Households in Helix
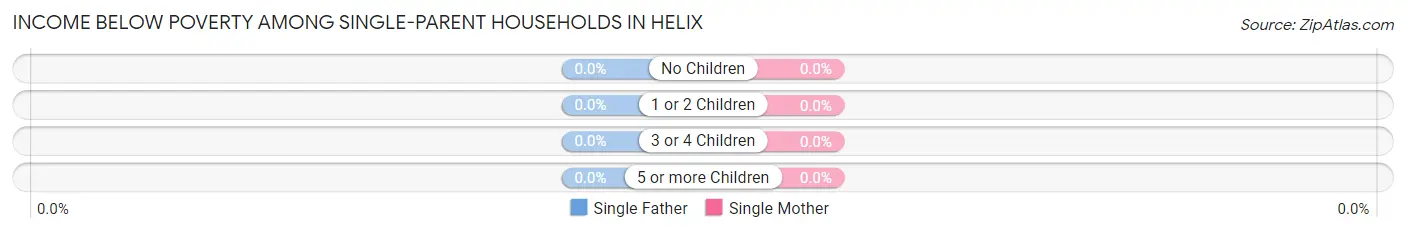
| Children | Single Father | Single Mother |
| No Children | 0 (0.0%) | 0 (0.0%) |
| 1 or 2 Children | 0 (0.0%) | 0 (0.0%) |
| 3 or 4 Children | 0 (0.0%) | 0 (0.0%) |
| 5 or more Children | 0 (0.0%) | 0 (0.0%) |
| Total | 0 (0.0%) | 0 (0.0%) |
Income Below Poverty Among Married-Couple vs Single-Parent Households in Helix
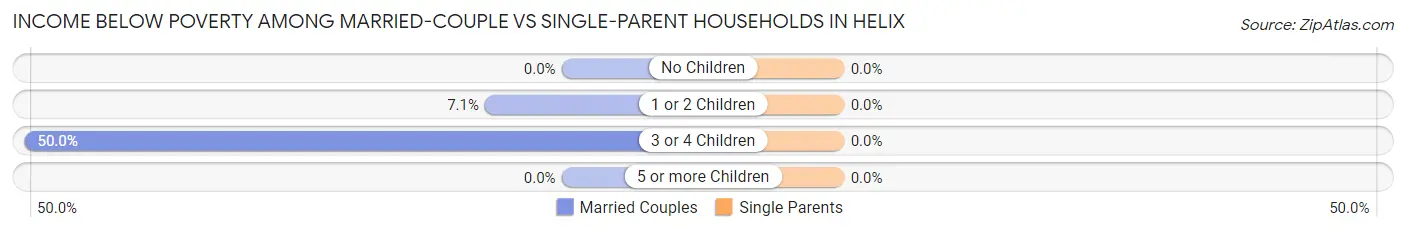
| Children | Married-Couple Families | Single-Parent Households |
| No Children | 0 (0.0%) | 0 (0.0%) |
| 1 or 2 Children | 6 (7.1%) | 0 (0.0%) |
| 3 or 4 Children | 6 (50.0%) | 0 (0.0%) |
| 5 or more Children | 0 (0.0%) | 0 (0.0%) |
| Total | 12 (11.4%) | 0 (0.0%) |
Employment Characteristics in Helix
Employment by Class of Employer in Helix
Among the 173 employed individuals in Helix, self-employed (not incorporated) (68 | 39.3%), private company employees (52 | 30.1%), and local government employees (30 | 17.3%) make up the most common classes of employment.
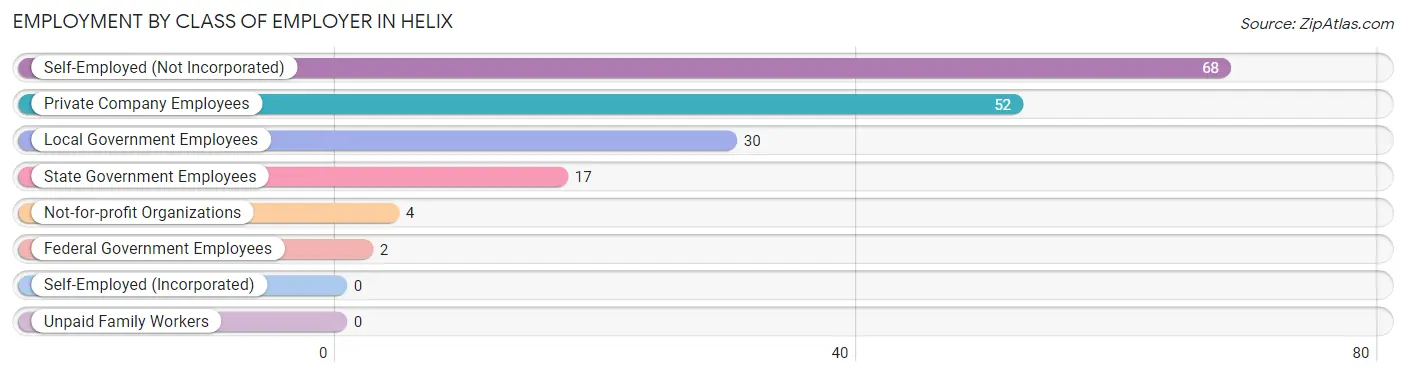
| Employer Class | # Employees | % Employees |
| Private Company Employees | 52 | 30.1% |
| Self-Employed (Incorporated) | 0 | 0.0% |
| Self-Employed (Not Incorporated) | 68 | 39.3% |
| Not-for-profit Organizations | 4 | 2.3% |
| Local Government Employees | 30 | 17.3% |
| State Government Employees | 17 | 9.8% |
| Federal Government Employees | 2 | 1.2% |
| Unpaid Family Workers | 0 | 0.0% |
| Total | 173 | 100.0% |
Employment Status by Age in Helix
According to the labor force statistics for Helix, out of the total population over 16 years of age (298), 66.4% or 198 individuals are in the labor force, with 1.5% or 3 of them unemployed. The age group with the highest labor force participation rate is 25 to 29 years, with 100.0% or 3 individuals in the labor force. Within the labor force, the 16 to 19 years age range has the highest percentage of unemployed individuals, with 21.4% or 3 of them being unemployed.
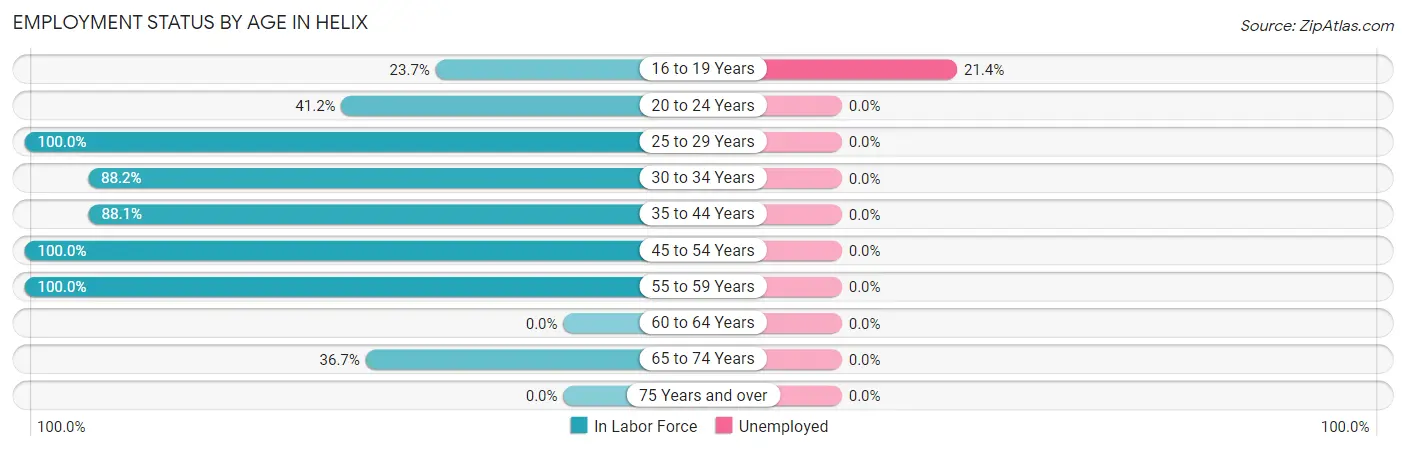
| Age Bracket | In Labor Force | Unemployed |
| 16 to 19 Years | 14 (23.7%) | 3 (21.4%) |
| 20 to 24 Years | 7 (41.2%) | 0 (0.0%) |
| 25 to 29 Years | 3 (100.0%) | 0 (0.0%) |
| 30 to 34 Years | 15 (88.2%) | 0 (0.0%) |
| 35 to 44 Years | 74 (88.1%) | 0 (0.0%) |
| 45 to 54 Years | 67 (100.0%) | 0 (0.0%) |
| 55 to 59 Years | 7 (100.0%) | 0 (0.0%) |
| 60 to 64 Years | 0 (0.0%) | 0 (0.0%) |
| 65 to 74 Years | 11 (36.7%) | 0 (0.0%) |
| 75 Years and over | 0 (0.0%) | 0 (0.0%) |
| Total | 198 (66.4%) | 3 (1.5%) |
Employment Status by Educational Attainment in Helix
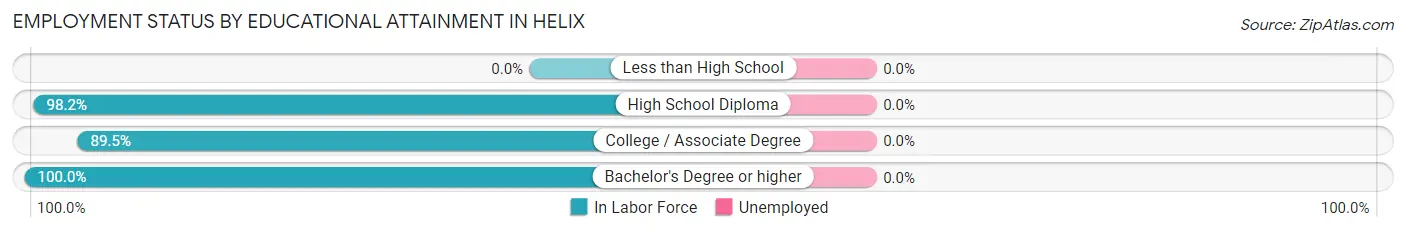
| Educational Attainment | In Labor Force | Unemployed |
| Less than High School | 0 (0.0%) | 0 (0.0%) |
| High School Diploma | 112 (98.2%) | 0 (0.0%) |
| College / Associate Degree | 34 (89.5%) | 0 (0.0%) |
| Bachelor's Degree or higher | 20 (100.0%) | 0 (0.0%) |
| Total | 166 (93.3%) | 0 (0.0%) |
Employment Occupations by Sex in Helix
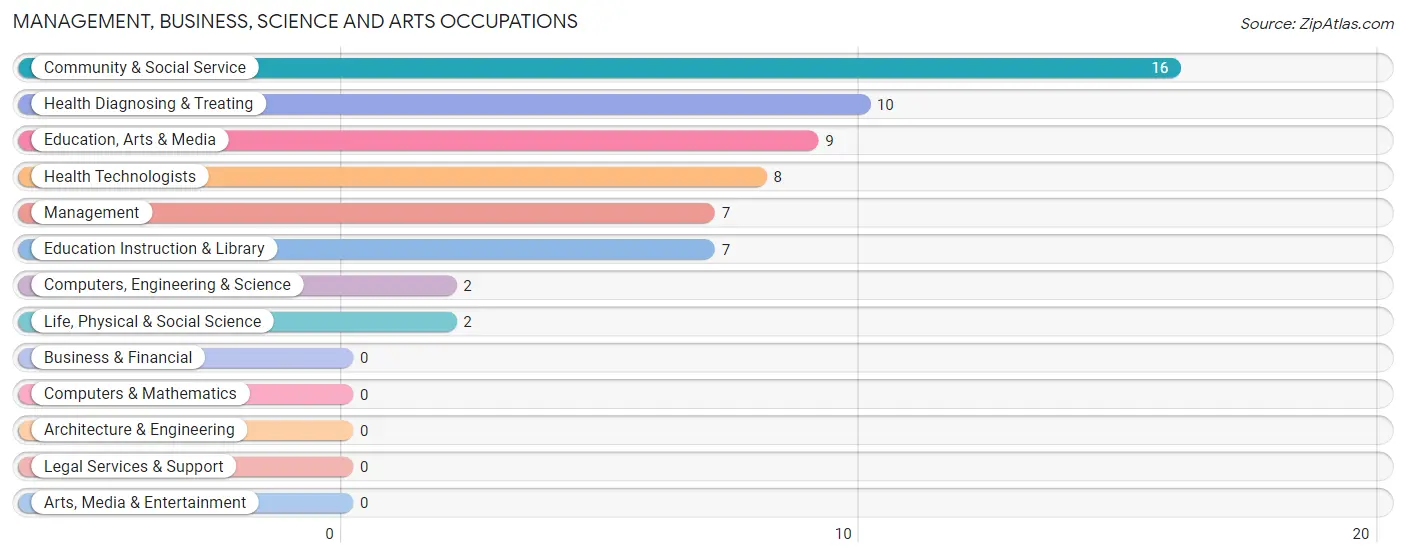
Management, Business, Science and Arts Occupations
The most common Management, Business, Science and Arts occupations in Helix are Community & Social Service (16 | 8.2%), Health Diagnosing & Treating (10 | 5.1%), Education, Arts & Media (9 | 4.6%), Health Technologists (8 | 4.1%), and Management (7 | 3.6%).
Management, Business, Science and Arts Occupations by Sex
Within the Management, Business, Science and Arts occupations in Helix, the most male-oriented occupations are Education Instruction & Library (100.0%), and Community & Social Service (43.8%), while the most female-oriented occupations are Management (100.0%), Computers, Engineering & Science (100.0%), and Life, Physical & Social Science (100.0%).
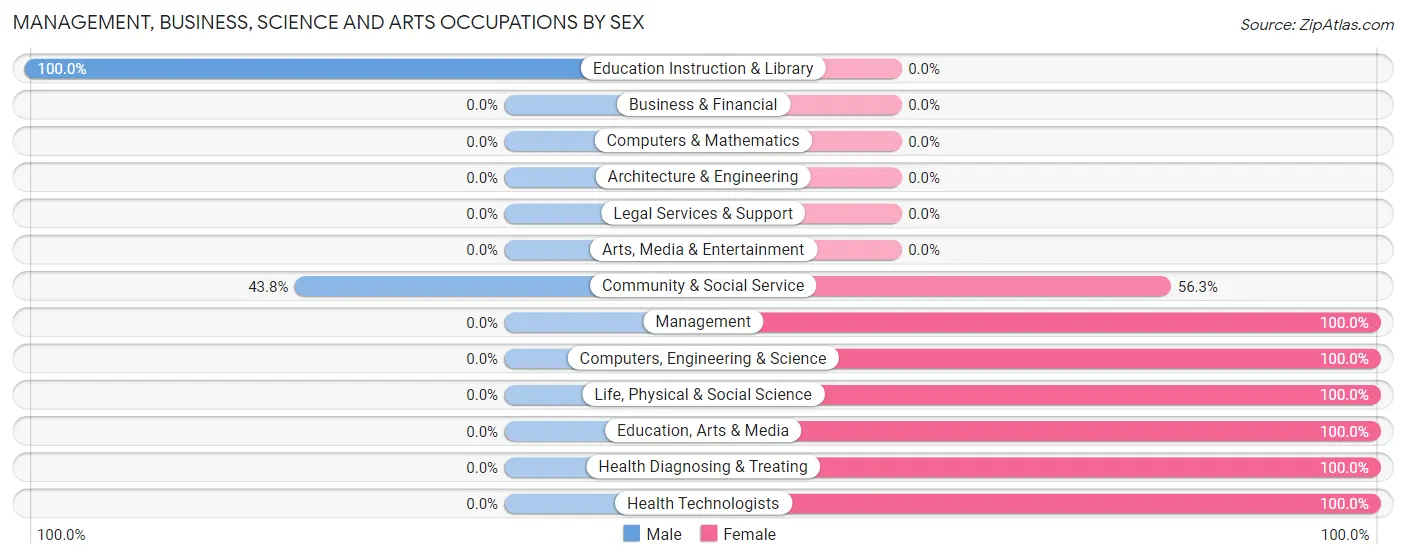
| Occupation | Male | Female |
| Management | 0 (0.0%) | 7 (100.0%) |
| Business & Financial | 0 (0.0%) | 0 (0.0%) |
| Computers, Engineering & Science | 0 (0.0%) | 2 (100.0%) |
| Computers & Mathematics | 0 (0.0%) | 0 (0.0%) |
| Architecture & Engineering | 0 (0.0%) | 0 (0.0%) |
| Life, Physical & Social Science | 0 (0.0%) | 2 (100.0%) |
| Community & Social Service | 7 (43.8%) | 9 (56.2%) |
| Education, Arts & Media | 0 (0.0%) | 9 (100.0%) |
| Legal Services & Support | 0 (0.0%) | 0 (0.0%) |
| Education Instruction & Library | 7 (100.0%) | 0 (0.0%) |
| Arts, Media & Entertainment | 0 (0.0%) | 0 (0.0%) |
| Health Diagnosing & Treating | 0 (0.0%) | 10 (100.0%) |
| Health Technologists | 0 (0.0%) | 8 (100.0%) |
| Total (Category) | 7 (20.0%) | 28 (80.0%) |
| Total (Overall) | 69 (35.4%) | 126 (64.6%) |
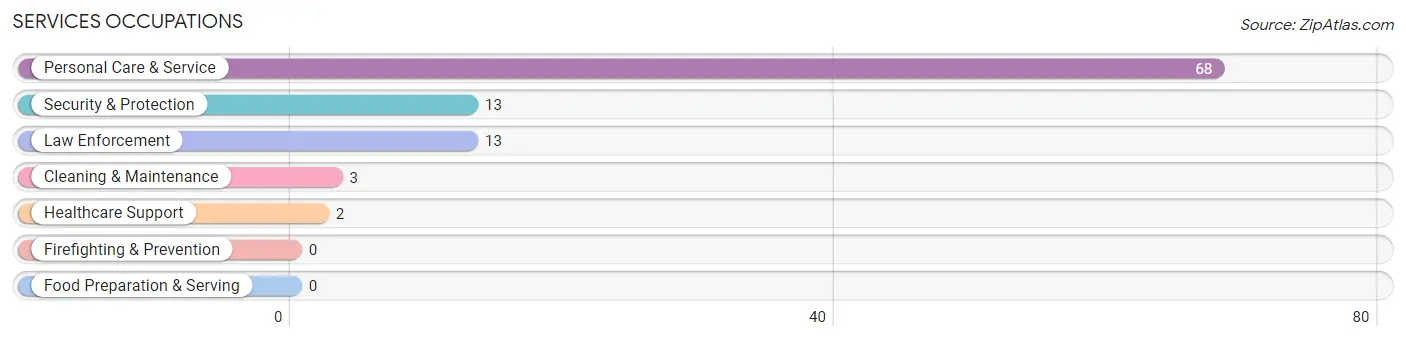
Services Occupations
The most common Services occupations in Helix are Personal Care & Service (68 | 34.9%), Security & Protection (13 | 6.7%), Law Enforcement (13 | 6.7%), Cleaning & Maintenance (3 | 1.5%), and Healthcare Support (2 | 1.0%).
Services Occupations by Sex
Within the Services occupations in Helix, the most male-oriented occupations are Healthcare Support (100.0%), Security & Protection (76.9%), and Law Enforcement (76.9%), while the most female-oriented occupations are Cleaning & Maintenance (100.0%), Personal Care & Service (100.0%), and Security & Protection (23.1%).
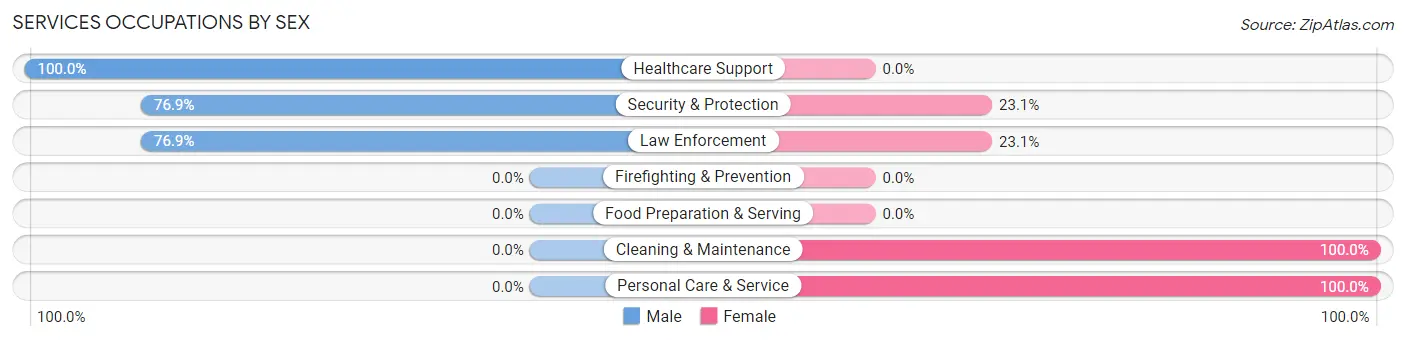
| Occupation | Male | Female |
| Healthcare Support | 2 (100.0%) | 0 (0.0%) |
| Security & Protection | 10 (76.9%) | 3 (23.1%) |
| Firefighting & Prevention | 0 (0.0%) | 0 (0.0%) |
| Law Enforcement | 10 (76.9%) | 3 (23.1%) |
| Food Preparation & Serving | 0 (0.0%) | 0 (0.0%) |
| Cleaning & Maintenance | 0 (0.0%) | 3 (100.0%) |
| Personal Care & Service | 0 (0.0%) | 68 (100.0%) |
| Total (Category) | 12 (14.0%) | 74 (86.1%) |
| Total (Overall) | 69 (35.4%) | 126 (64.6%) |
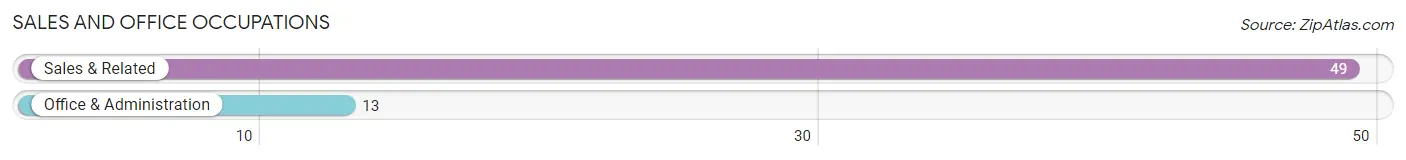
Sales and Office Occupations
The most common Sales and Office occupations in Helix are Sales & Related (49 | 25.1%), and Office & Administration (13 | 6.7%).
Sales and Office Occupations by Sex
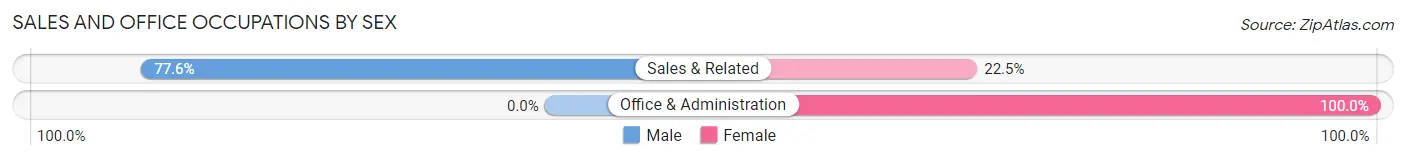
| Occupation | Male | Female |
| Sales & Related | 38 (77.5%) | 11 (22.5%) |
| Office & Administration | 0 (0.0%) | 13 (100.0%) |
| Total (Category) | 38 (61.3%) | 24 (38.7%) |
| Total (Overall) | 69 (35.4%) | 126 (64.6%) |
Natural Resources, Construction and Maintenance Occupations
The most common Natural Resources, Construction and Maintenance occupations in Helix are , and Construction & Extraction (12 | 6.1%).
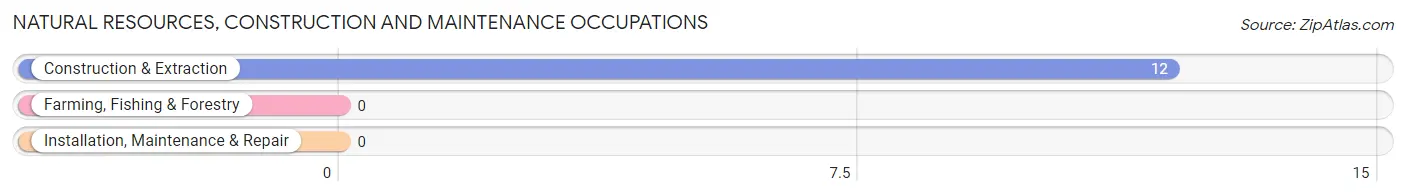
Natural Resources, Construction and Maintenance Occupations by Sex
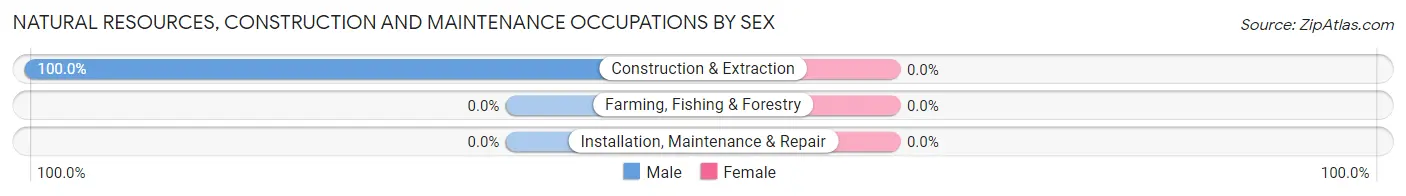
| Occupation | Male | Female |
| Farming, Fishing & Forestry | 0 (0.0%) | 0 (0.0%) |
| Construction & Extraction | 12 (100.0%) | 0 (0.0%) |
| Installation, Maintenance & Repair | 0 (0.0%) | 0 (0.0%) |
| Total (Category) | 12 (100.0%) | 0 (0.0%) |
| Total (Overall) | 69 (35.4%) | 126 (64.6%) |
Production, Transportation and Moving Occupations
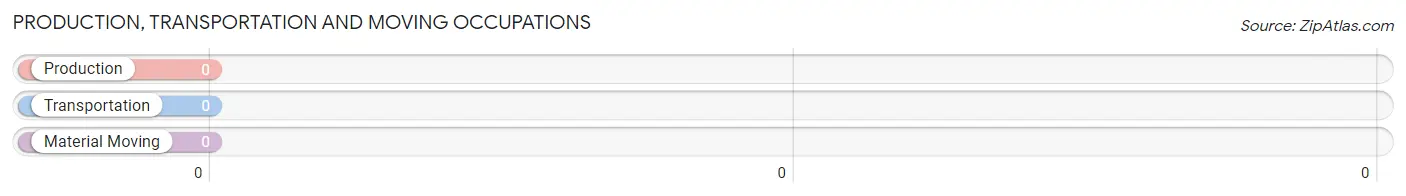
Production, Transportation and Moving Occupations by Sex
| Occupation | Male | Female |
| Production | 0 (0.0%) | 0 (0.0%) |
| Transportation | 0 (0.0%) | 0 (0.0%) |
| Material Moving | 0 (0.0%) | 0 (0.0%) |
| Total (Category) | 0 (0.0%) | 0 (0.0%) |
| Total (Overall) | 69 (35.4%) | 126 (64.6%) |
Employment Industries by Sex in Helix
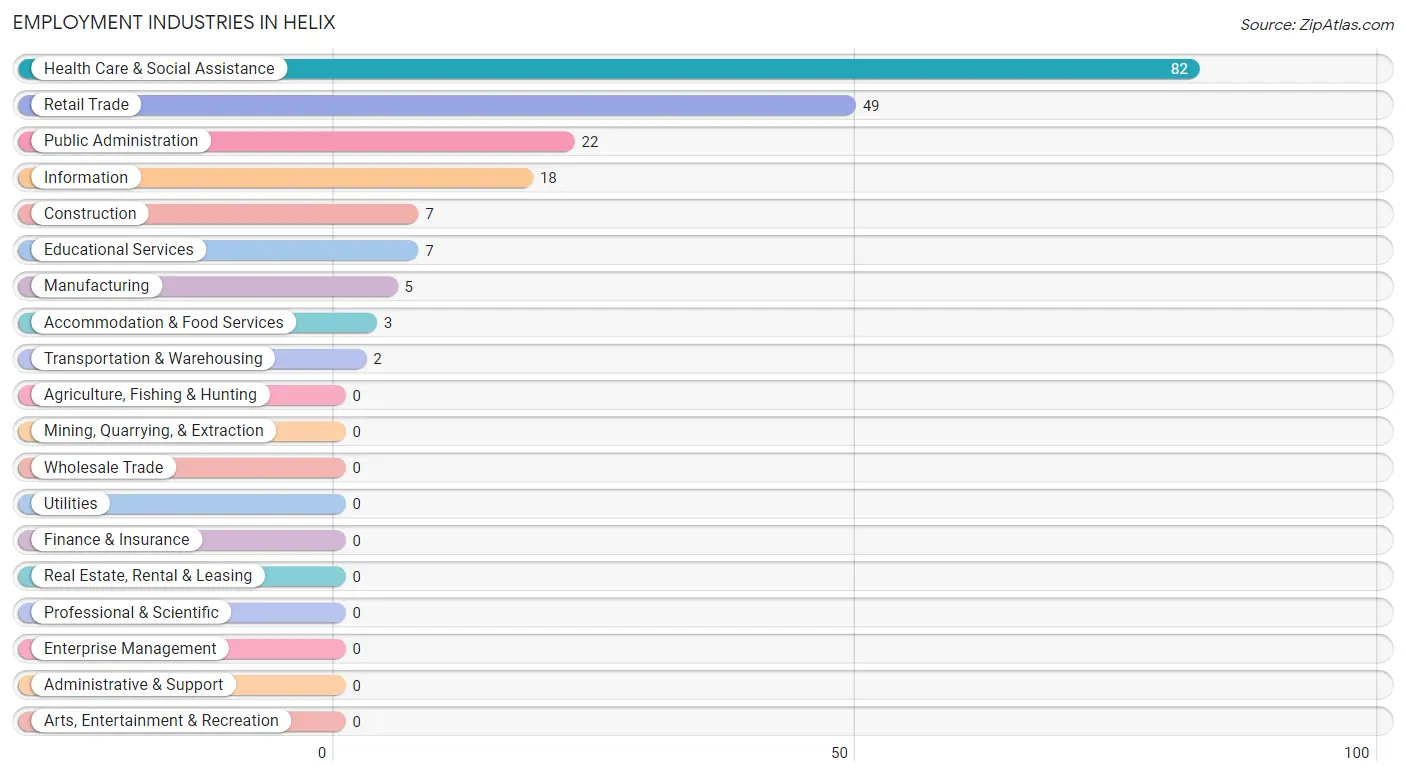
Employment Industries in Helix
The major employment industries in Helix include Health Care & Social Assistance (82 | 42.0%), Retail Trade (49 | 25.1%), Public Administration (22 | 11.3%), Information (18 | 9.2%), and Construction (7 | 3.6%).
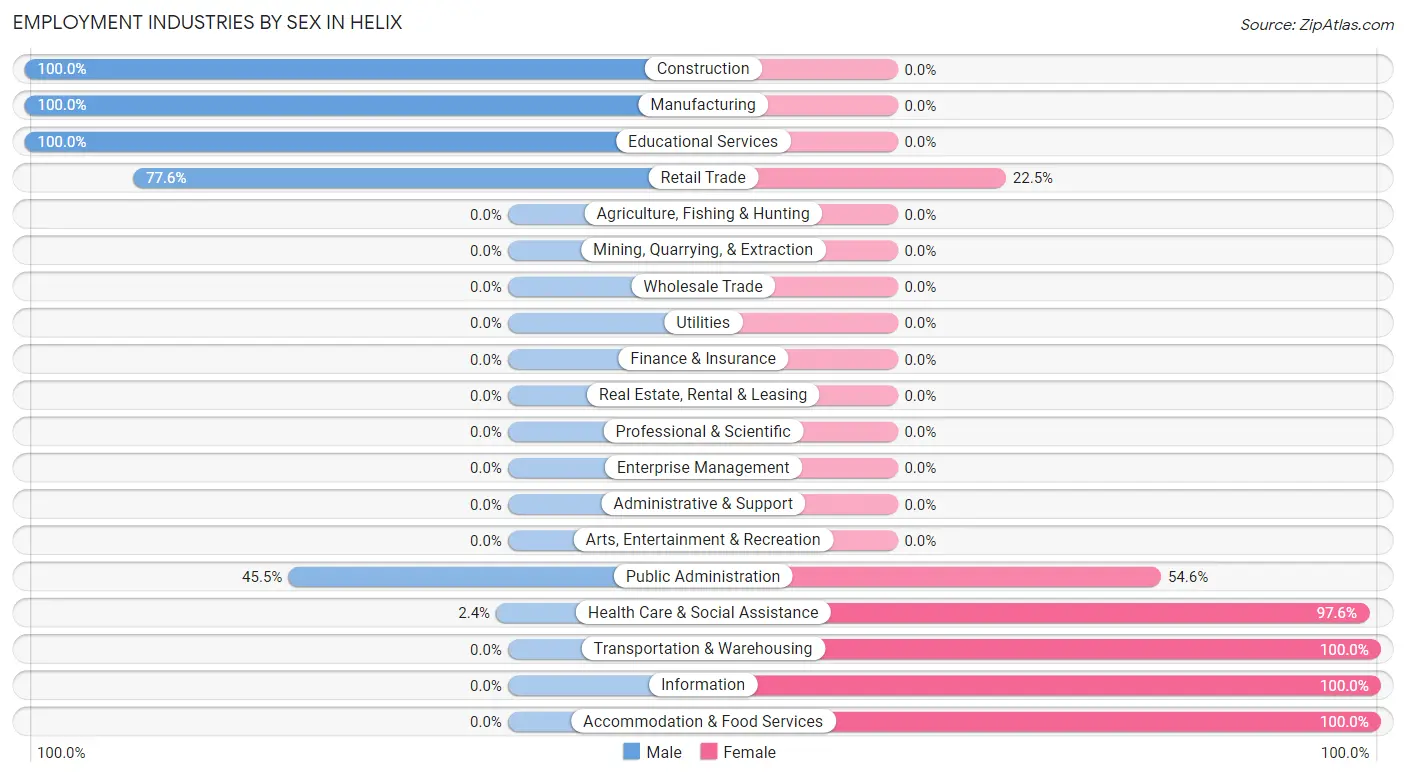
Employment Industries by Sex in Helix
The Helix industries that see more men than women are Construction (100.0%), Manufacturing (100.0%), and Educational Services (100.0%), whereas the industries that tend to have a higher number of women are Transportation & Warehousing (100.0%), Information (100.0%), and Accommodation & Food Services (100.0%).
| Industry | Male | Female |
| Agriculture, Fishing & Hunting | 0 (0.0%) | 0 (0.0%) |
| Mining, Quarrying, & Extraction | 0 (0.0%) | 0 (0.0%) |
| Construction | 7 (100.0%) | 0 (0.0%) |
| Manufacturing | 5 (100.0%) | 0 (0.0%) |
| Wholesale Trade | 0 (0.0%) | 0 (0.0%) |
| Retail Trade | 38 (77.5%) | 11 (22.5%) |
| Transportation & Warehousing | 0 (0.0%) | 2 (100.0%) |
| Utilities | 0 (0.0%) | 0 (0.0%) |
| Information | 0 (0.0%) | 18 (100.0%) |
| Finance & Insurance | 0 (0.0%) | 0 (0.0%) |
| Real Estate, Rental & Leasing | 0 (0.0%) | 0 (0.0%) |
| Professional & Scientific | 0 (0.0%) | 0 (0.0%) |
| Enterprise Management | 0 (0.0%) | 0 (0.0%) |
| Administrative & Support | 0 (0.0%) | 0 (0.0%) |
| Educational Services | 7 (100.0%) | 0 (0.0%) |
| Health Care & Social Assistance | 2 (2.4%) | 80 (97.6%) |
| Arts, Entertainment & Recreation | 0 (0.0%) | 0 (0.0%) |
| Accommodation & Food Services | 0 (0.0%) | 3 (100.0%) |
| Public Administration | 10 (45.5%) | 12 (54.5%) |
| Total | 69 (35.4%) | 126 (64.6%) |
Education in Helix
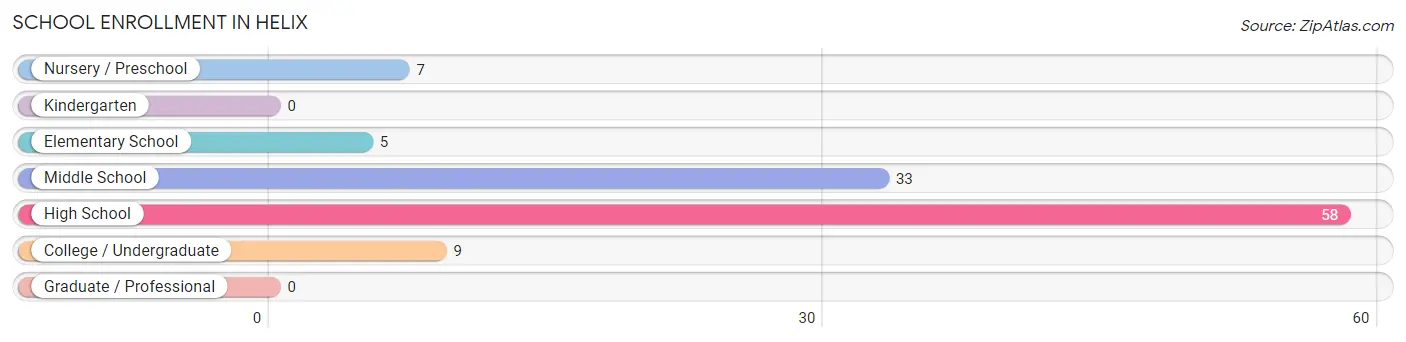
School Enrollment in Helix
The most common levels of schooling among the 112 students in Helix are high school (58 | 51.8%), middle school (33 | 29.5%), and college / undergraduate (9 | 8.0%).
| School Level | # Students | % Students |
| Nursery / Preschool | 7 | 6.2% |
| Kindergarten | 0 | 0.0% |
| Elementary School | 5 | 4.5% |
| Middle School | 33 | 29.5% |
| High School | 58 | 51.8% |
| College / Undergraduate | 9 | 8.0% |
| Graduate / Professional | 0 | 0.0% |
| Total | 112 | 100.0% |
School Enrollment by Age by Funding Source in Helix
Out of a total of 112 students who are enrolled in schools in Helix, 2 (1.8%) attend a private institution, while the remaining 110 (98.2%) are enrolled in public schools. The age group of 35 years and over has the highest likelihood of being enrolled in private schools, with 2 (100.0% in the age bracket) enrolled. Conversely, the age group of 3 to 4 year olds has the lowest likelihood of being enrolled in a private school, with 7 (100.0% in the age bracket) attending a public institution.
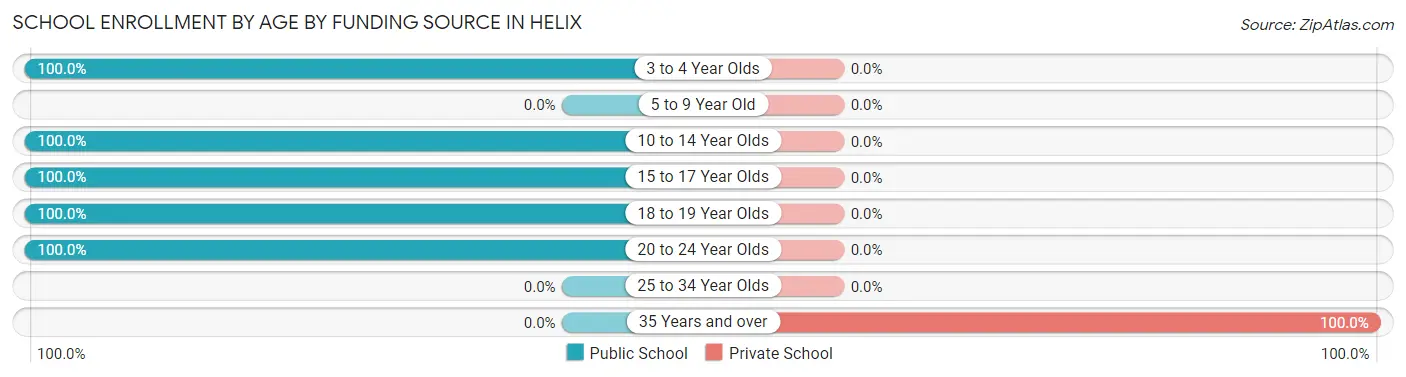
| Age Bracket | Public School | Private School |
| 3 to 4 Year Olds | 7 (100.0%) | 0 (0.0%) |
| 5 to 9 Year Old | 0 (0.0%) | 0 (0.0%) |
| 10 to 14 Year Olds | 38 (100.0%) | 0 (0.0%) |
| 15 to 17 Year Olds | 50 (100.0%) | 0 (0.0%) |
| 18 to 19 Year Olds | 8 (100.0%) | 0 (0.0%) |
| 20 to 24 Year Olds | 7 (100.0%) | 0 (0.0%) |
| 25 to 34 Year Olds | 0 (0.0%) | 0 (0.0%) |
| 35 Years and over | 0 (0.0%) | 2 (100.0%) |
| Total | 110 (98.2%) | 2 (1.8%) |
Educational Attainment by Field of Study in Helix
Psychology (9 | 22.5%), education (9 | 22.5%), computers & mathematics (7 | 17.5%), engineering (7 | 17.5%), and business (6 | 15.0%) are the most common fields of study among 40 individuals in Helix who have obtained a bachelor's degree or higher.
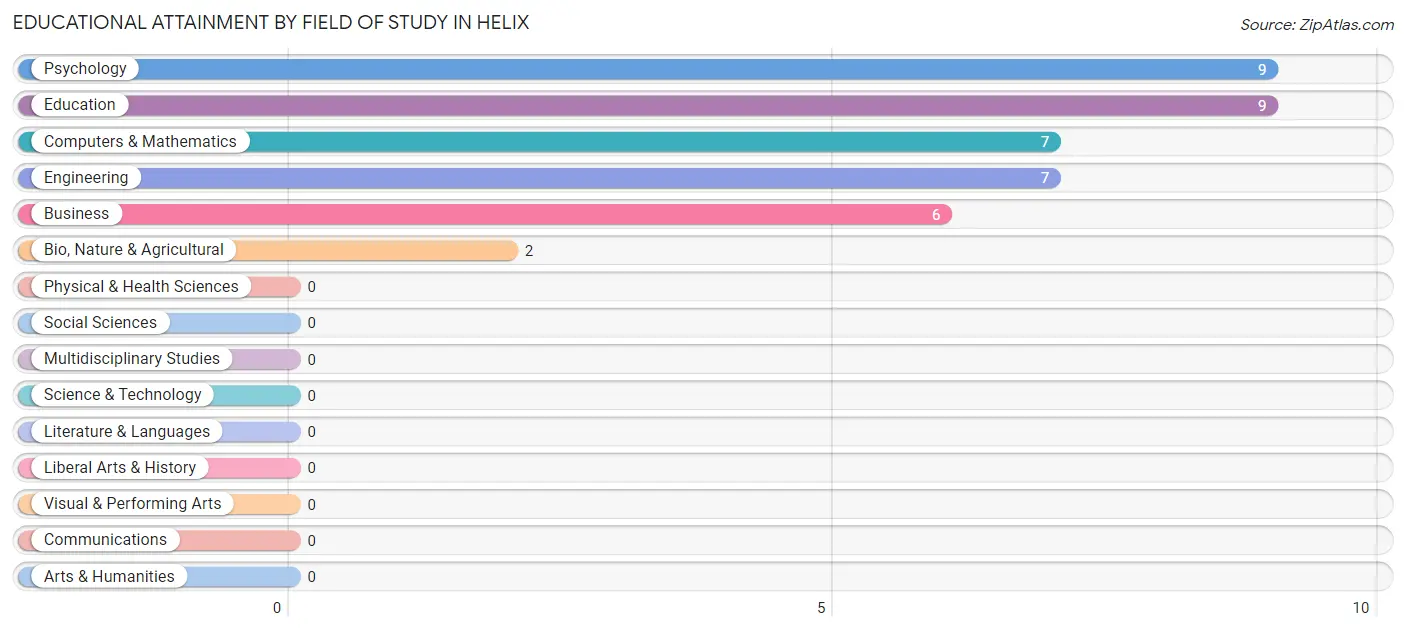
| Field of Study | # Graduates | % Graduates |
| Computers & Mathematics | 7 | 17.5% |
| Bio, Nature & Agricultural | 2 | 5.0% |
| Physical & Health Sciences | 0 | 0.0% |
| Psychology | 9 | 22.5% |
| Social Sciences | 0 | 0.0% |
| Engineering | 7 | 17.5% |
| Multidisciplinary Studies | 0 | 0.0% |
| Science & Technology | 0 | 0.0% |
| Business | 6 | 15.0% |
| Education | 9 | 22.5% |
| Literature & Languages | 0 | 0.0% |
| Liberal Arts & History | 0 | 0.0% |
| Visual & Performing Arts | 0 | 0.0% |
| Communications | 0 | 0.0% |
| Arts & Humanities | 0 | 0.0% |
| Total | 40 | 100.0% |
Transportation & Commute in Helix
Vehicle Availability by Sex in Helix
The most prevalent vehicle ownership categories in Helix are males with 3 vehicles (52, accounting for 75.4%) and females with 3 vehicles (88, making up 50.0%).
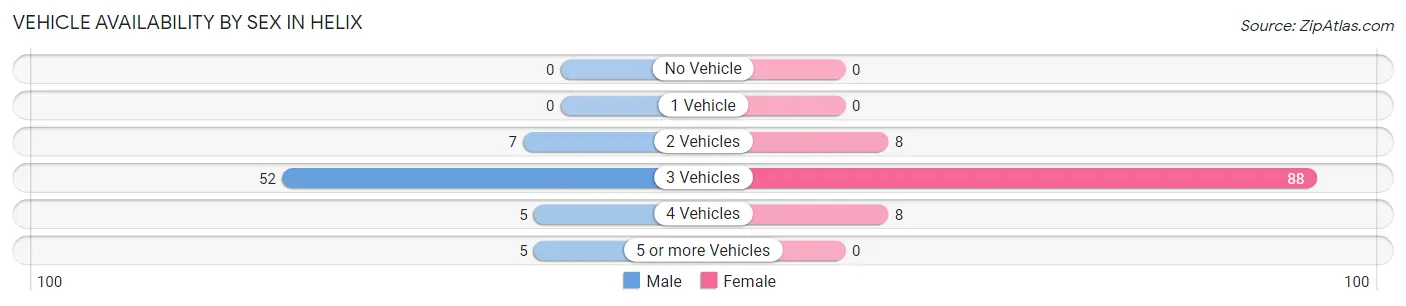
| Vehicles Available | Male | Female |
| No Vehicle | 0 (0.0%) | 0 (0.0%) |
| 1 Vehicle | 0 (0.0%) | 0 (0.0%) |
| 2 Vehicles | 7 (10.1%) | 8 (7.7%) |
| 3 Vehicles | 52 (75.4%) | 88 (84.6%) |
| 4 Vehicles | 5 (7.2%) | 8 (7.7%) |
| 5 or more Vehicles | 5 (7.2%) | 0 (0.0%) |
| Total | 69 (100.0%) | 104 (100.0%) |
Commute Time in Helix
The most frequently occuring commute durations in Helix are 60 to 89 minutes (45 commuters, 42.9%), 5 to 9 minutes (18 commuters, 17.1%), and 20 to 24 minutes (15 commuters, 14.3%).
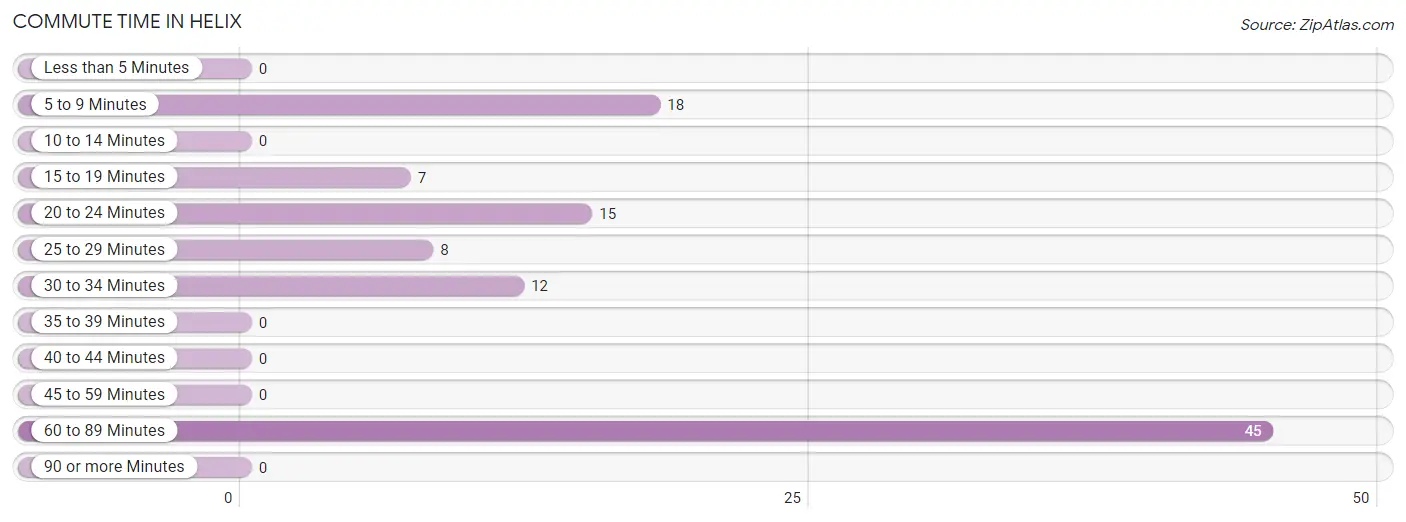
| Commute Time | # Commuters | % Commuters |
| Less than 5 Minutes | 0 | 0.0% |
| 5 to 9 Minutes | 18 | 17.1% |
| 10 to 14 Minutes | 0 | 0.0% |
| 15 to 19 Minutes | 7 | 6.7% |
| 20 to 24 Minutes | 15 | 14.3% |
| 25 to 29 Minutes | 8 | 7.6% |
| 30 to 34 Minutes | 12 | 11.4% |
| 35 to 39 Minutes | 0 | 0.0% |
| 40 to 44 Minutes | 0 | 0.0% |
| 45 to 59 Minutes | 0 | 0.0% |
| 60 to 89 Minutes | 45 | 42.9% |
| 90 or more Minutes | 0 | 0.0% |
Commute Time by Sex in Helix
The most common commute times in Helix are 60 to 89 minutes (40 commuters, 58.0%) for males and 30 to 34 minutes (12 commuters, 33.3%) for females.
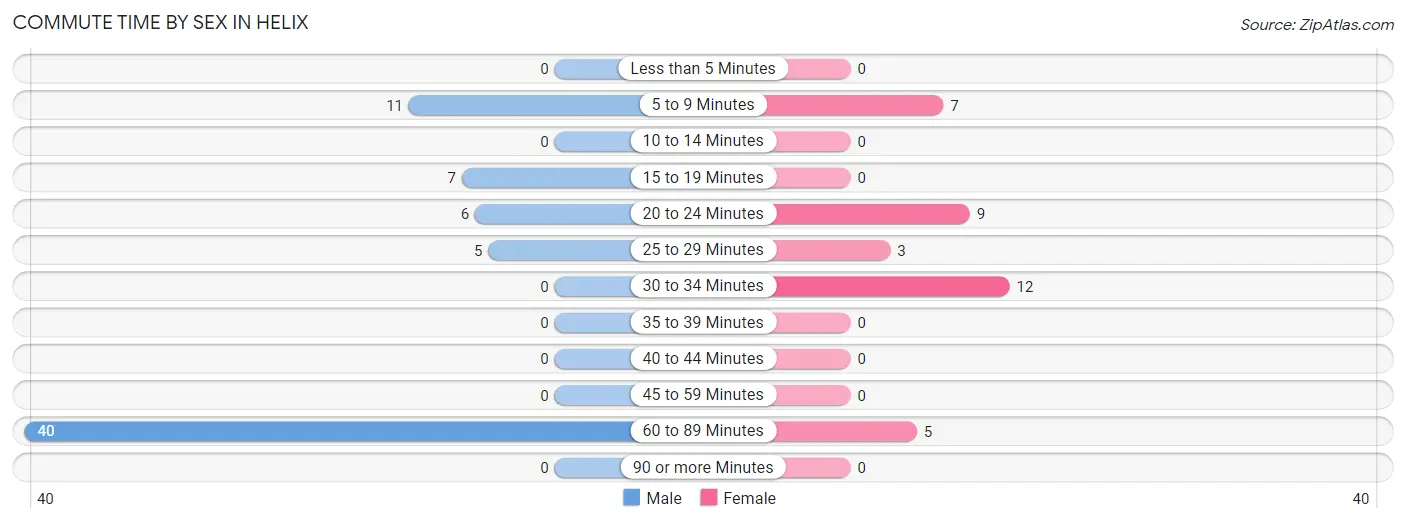
| Commute Time | Male | Female |
| Less than 5 Minutes | 0 (0.0%) | 0 (0.0%) |
| 5 to 9 Minutes | 11 (15.9%) | 7 (19.4%) |
| 10 to 14 Minutes | 0 (0.0%) | 0 (0.0%) |
| 15 to 19 Minutes | 7 (10.1%) | 0 (0.0%) |
| 20 to 24 Minutes | 6 (8.7%) | 9 (25.0%) |
| 25 to 29 Minutes | 5 (7.2%) | 3 (8.3%) |
| 30 to 34 Minutes | 0 (0.0%) | 12 (33.3%) |
| 35 to 39 Minutes | 0 (0.0%) | 0 (0.0%) |
| 40 to 44 Minutes | 0 (0.0%) | 0 (0.0%) |
| 45 to 59 Minutes | 0 (0.0%) | 0 (0.0%) |
| 60 to 89 Minutes | 40 (58.0%) | 5 (13.9%) |
| 90 or more Minutes | 0 (0.0%) | 0 (0.0%) |
Time of Departure to Work by Sex in Helix
The most frequent times of departure to work in Helix are 6:30 AM to 6:59 AM (38, 55.1%) for males and 5:30 AM to 5:59 AM (10, 27.8%) for females.
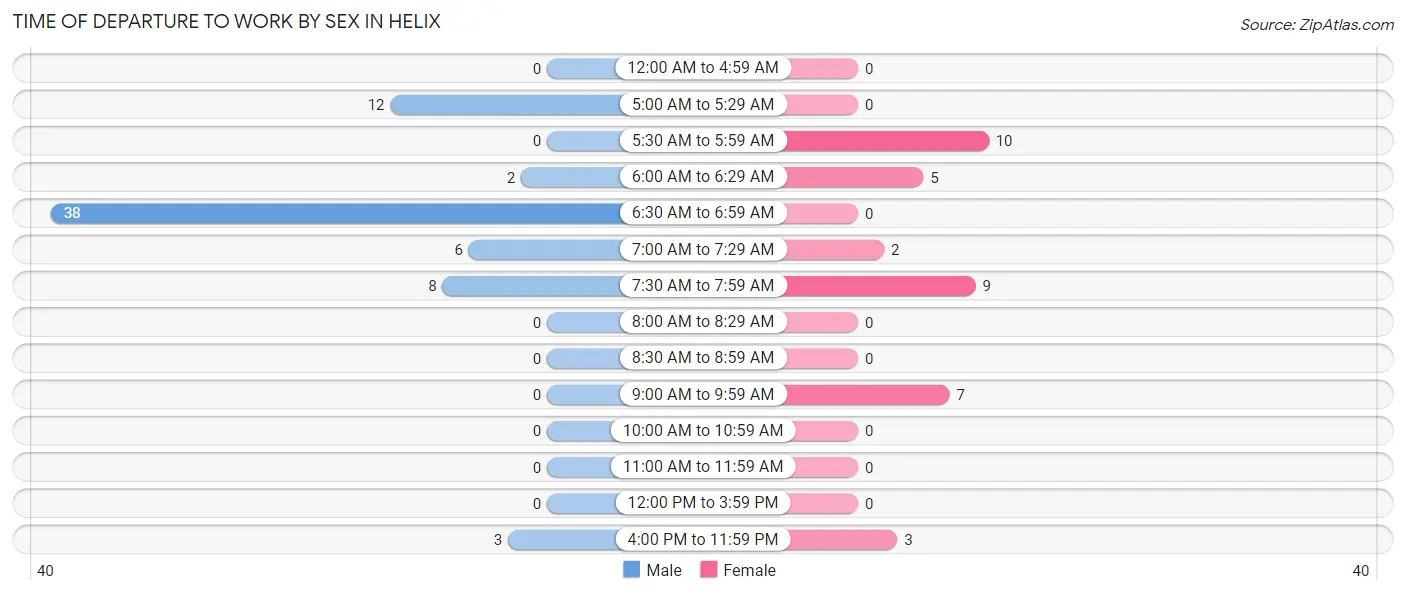
| Time of Departure | Male | Female |
| 12:00 AM to 4:59 AM | 0 (0.0%) | 0 (0.0%) |
| 5:00 AM to 5:29 AM | 12 (17.4%) | 0 (0.0%) |
| 5:30 AM to 5:59 AM | 0 (0.0%) | 10 (27.8%) |
| 6:00 AM to 6:29 AM | 2 (2.9%) | 5 (13.9%) |
| 6:30 AM to 6:59 AM | 38 (55.1%) | 0 (0.0%) |
| 7:00 AM to 7:29 AM | 6 (8.7%) | 2 (5.6%) |
| 7:30 AM to 7:59 AM | 8 (11.6%) | 9 (25.0%) |
| 8:00 AM to 8:29 AM | 0 (0.0%) | 0 (0.0%) |
| 8:30 AM to 8:59 AM | 0 (0.0%) | 0 (0.0%) |
| 9:00 AM to 9:59 AM | 0 (0.0%) | 7 (19.4%) |
| 10:00 AM to 10:59 AM | 0 (0.0%) | 0 (0.0%) |
| 11:00 AM to 11:59 AM | 0 (0.0%) | 0 (0.0%) |
| 12:00 PM to 3:59 PM | 0 (0.0%) | 0 (0.0%) |
| 4:00 PM to 11:59 PM | 3 (4.3%) | 3 (8.3%) |
| Total | 69 (100.0%) | 36 (100.0%) |
Housing Occupancy in Helix
Occupancy by Ownership in Helix
Of the total 144 dwellings in Helix, owner-occupied units account for 132 (91.7%), while renter-occupied units make up 12 (8.3%).
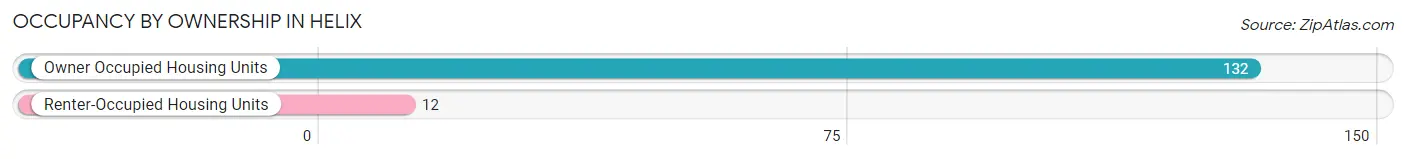
| Occupancy | # Housing Units | % Housing Units |
| Owner Occupied Housing Units | 132 | 91.7% |
| Renter-Occupied Housing Units | 12 | 8.3% |
| Total Occupied Housing Units | 144 | 100.0% |
Occupancy by Household Size in Helix
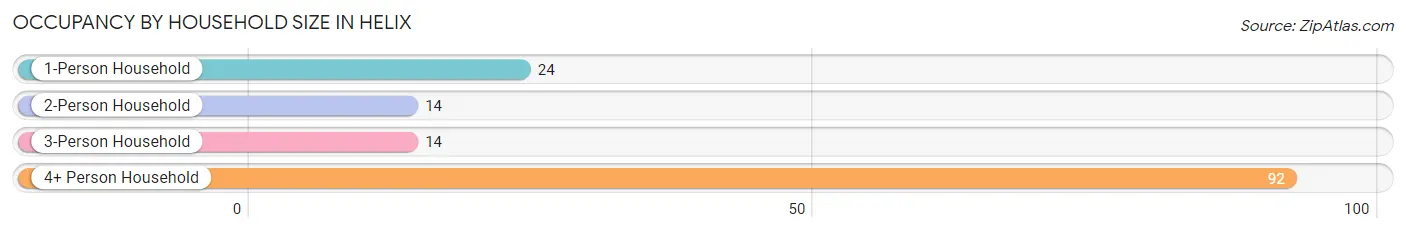
| Household Size | # Housing Units | % Housing Units |
| 1-Person Household | 24 | 16.7% |
| 2-Person Household | 14 | 9.7% |
| 3-Person Household | 14 | 9.7% |
| 4+ Person Household | 92 | 63.9% |
| Total Housing Units | 144 | 100.0% |
Occupancy by Ownership by Household Size in Helix
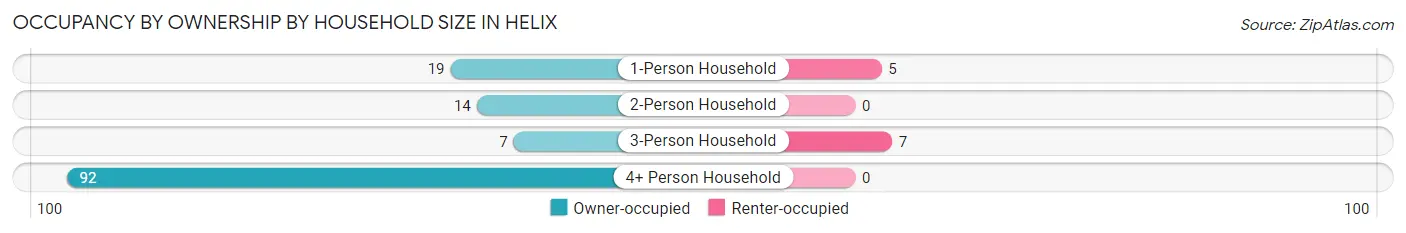
| Household Size | Owner-occupied | Renter-occupied |
| 1-Person Household | 19 (79.2%) | 5 (20.8%) |
| 2-Person Household | 14 (100.0%) | 0 (0.0%) |
| 3-Person Household | 7 (50.0%) | 7 (50.0%) |
| 4+ Person Household | 92 (100.0%) | 0 (0.0%) |
| Total Housing Units | 132 (91.7%) | 12 (8.3%) |
Occupancy by Educational Attainment in Helix
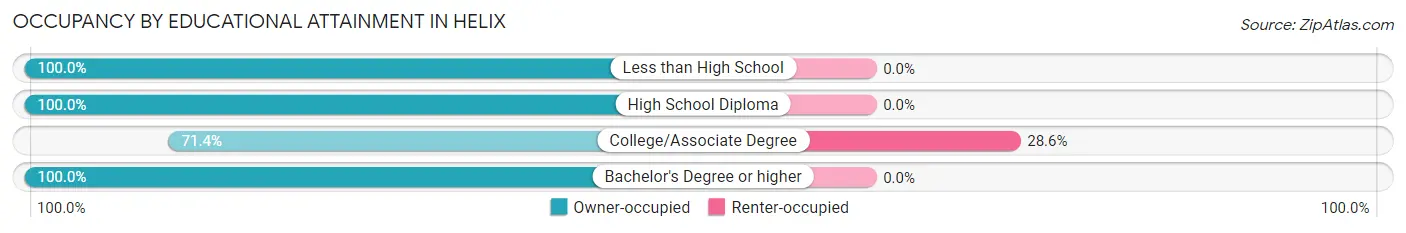
| Household Size | Owner-occupied | Renter-occupied |
| Less than High School | 6 (100.0%) | 0 (0.0%) |
| High School Diploma | 81 (100.0%) | 0 (0.0%) |
| College/Associate Degree | 30 (71.4%) | 12 (28.6%) |
| Bachelor's Degree or higher | 15 (100.0%) | 0 (0.0%) |
Occupancy by Age of Householder in Helix
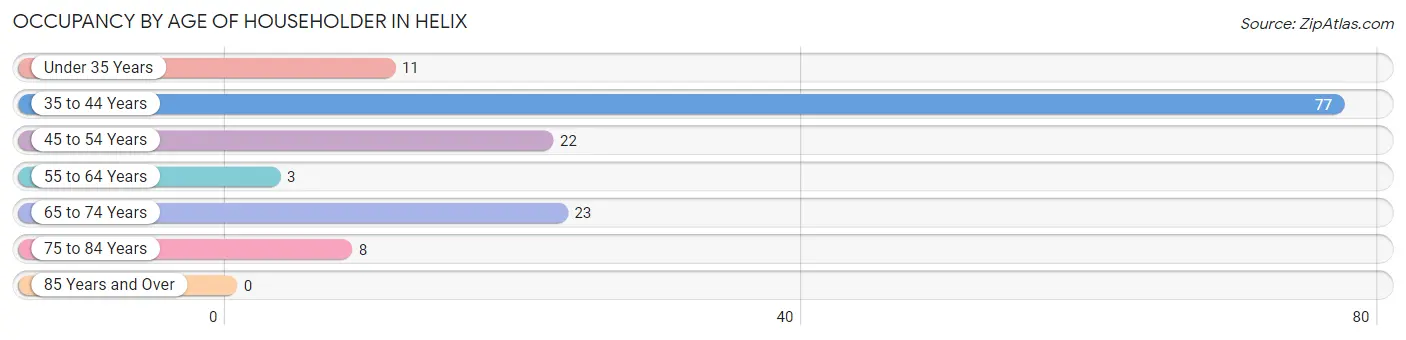
| Age Bracket | # Households | % Households |
| Under 35 Years | 11 | 7.6% |
| 35 to 44 Years | 77 | 53.5% |
| 45 to 54 Years | 22 | 15.3% |
| 55 to 64 Years | 3 | 2.1% |
| 65 to 74 Years | 23 | 16.0% |
| 75 to 84 Years | 8 | 5.6% |
| 85 Years and Over | 0 | 0.0% |
| Total | 144 | 100.0% |
Housing Finances in Helix
Median Income by Occupancy in Helix
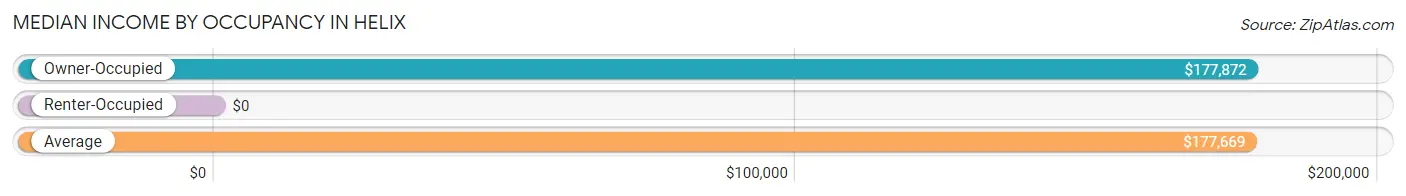
| Occupancy Type | # Households | Median Income |
| Owner-Occupied | 132 (91.7%) | $177,872 |
| Renter-Occupied | 12 (8.3%) | $0 |
| Average | 144 (100.0%) | $177,669 |
Occupancy by Householder Income Bracket in Helix
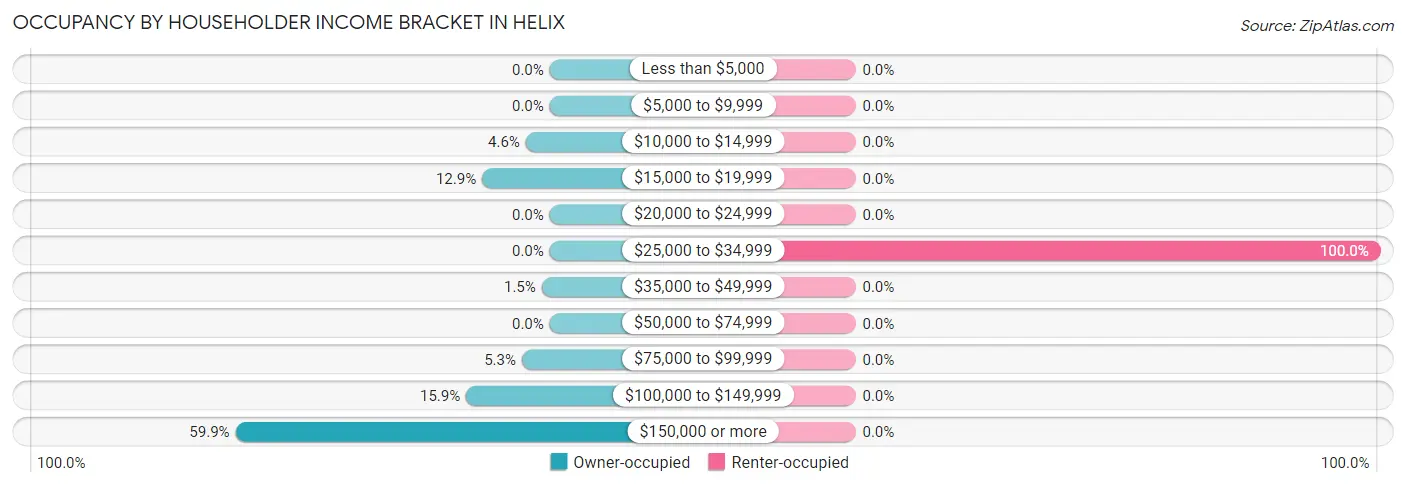
| Income Bracket | Owner-occupied | Renter-occupied |
| Less than $5,000 | 0 (0.0%) | 0 (0.0%) |
| $5,000 to $9,999 | 0 (0.0%) | 0 (0.0%) |
| $10,000 to $14,999 | 6 (4.5%) | 0 (0.0%) |
| $15,000 to $19,999 | 17 (12.9%) | 0 (0.0%) |
| $20,000 to $24,999 | 0 (0.0%) | 0 (0.0%) |
| $25,000 to $34,999 | 0 (0.0%) | 12 (100.0%) |
| $35,000 to $49,999 | 2 (1.5%) | 0 (0.0%) |
| $50,000 to $74,999 | 0 (0.0%) | 0 (0.0%) |
| $75,000 to $99,999 | 7 (5.3%) | 0 (0.0%) |
| $100,000 to $149,999 | 21 (15.9%) | 0 (0.0%) |
| $150,000 or more | 79 (59.9%) | 0 (0.0%) |
| Total | 132 (100.0%) | 12 (100.0%) |
Monthly Housing Cost Tiers in Helix
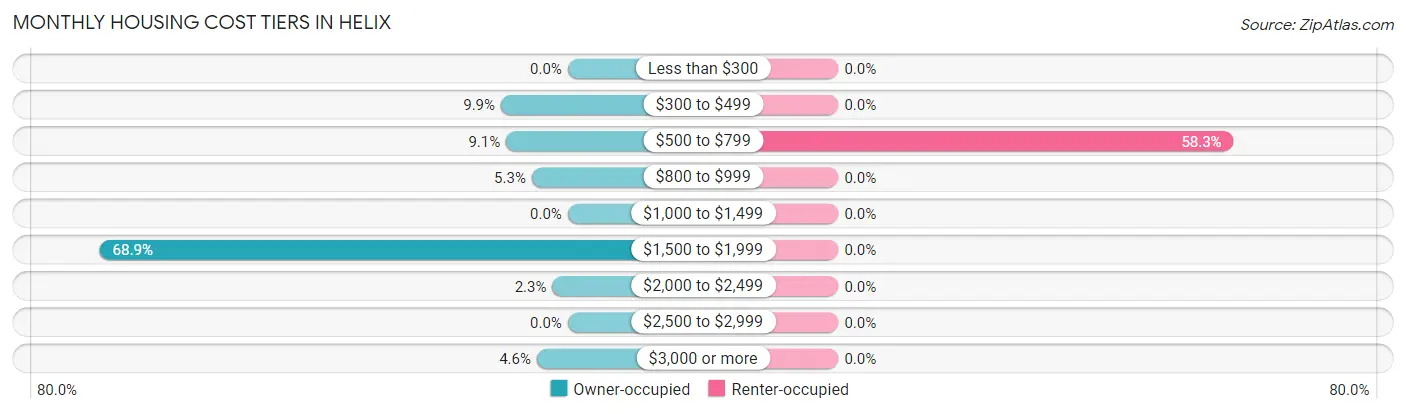
| Monthly Cost | Owner-occupied | Renter-occupied |
| Less than $300 | 0 (0.0%) | 0 (0.0%) |
| $300 to $499 | 13 (9.9%) | 0 (0.0%) |
| $500 to $799 | 12 (9.1%) | 7 (58.3%) |
| $800 to $999 | 7 (5.3%) | 0 (0.0%) |
| $1,000 to $1,499 | 0 (0.0%) | 0 (0.0%) |
| $1,500 to $1,999 | 91 (68.9%) | 0 (0.0%) |
| $2,000 to $2,499 | 3 (2.3%) | 0 (0.0%) |
| $2,500 to $2,999 | 0 (0.0%) | 0 (0.0%) |
| $3,000 or more | 6 (4.5%) | 0 (0.0%) |
| Total | 132 (100.0%) | 12 (100.0%) |
Physical Housing Characteristics in Helix
Housing Structures in Helix
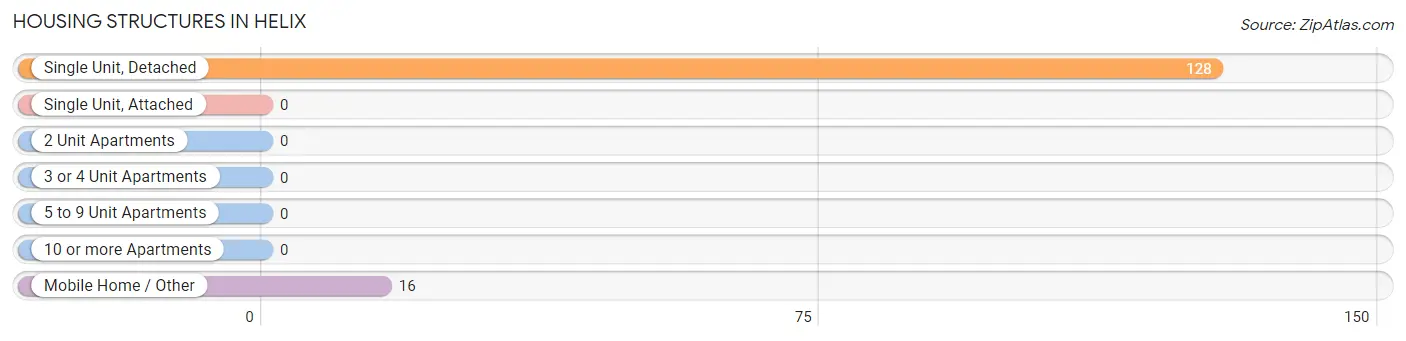
| Structure Type | # Housing Units | % Housing Units |
| Single Unit, Detached | 128 | 88.9% |
| Single Unit, Attached | 0 | 0.0% |
| 2 Unit Apartments | 0 | 0.0% |
| 3 or 4 Unit Apartments | 0 | 0.0% |
| 5 to 9 Unit Apartments | 0 | 0.0% |
| 10 or more Apartments | 0 | 0.0% |
| Mobile Home / Other | 16 | 11.1% |
| Total | 144 | 100.0% |
Housing Structures by Occupancy in Helix
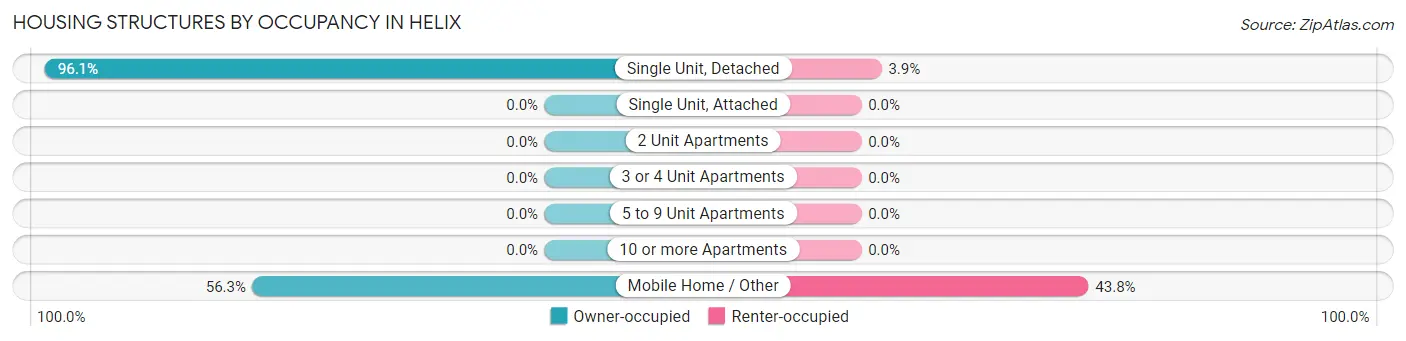
| Structure Type | Owner-occupied | Renter-occupied |
| Single Unit, Detached | 123 (96.1%) | 5 (3.9%) |
| Single Unit, Attached | 0 (0.0%) | 0 (0.0%) |
| 2 Unit Apartments | 0 (0.0%) | 0 (0.0%) |
| 3 or 4 Unit Apartments | 0 (0.0%) | 0 (0.0%) |
| 5 to 9 Unit Apartments | 0 (0.0%) | 0 (0.0%) |
| 10 or more Apartments | 0 (0.0%) | 0 (0.0%) |
| Mobile Home / Other | 9 (56.2%) | 7 (43.8%) |
| Total | 132 (91.7%) | 12 (8.3%) |
Housing Structures by Number of Rooms in Helix
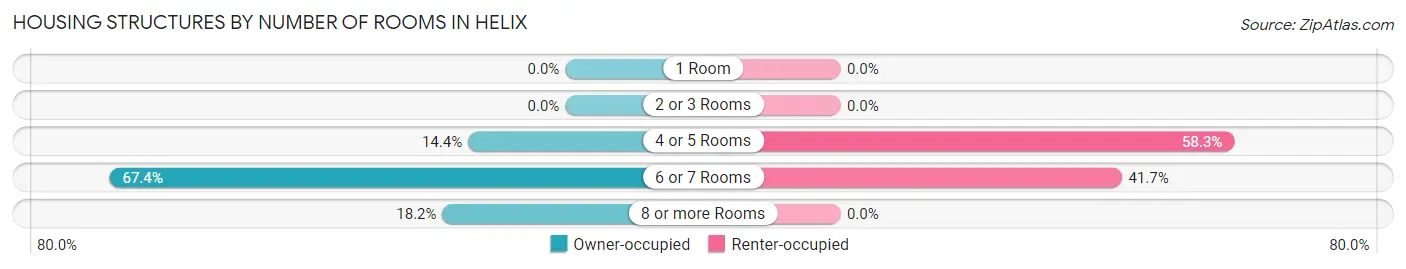
| Number of Rooms | Owner-occupied | Renter-occupied |
| 1 Room | 0 (0.0%) | 0 (0.0%) |
| 2 or 3 Rooms | 0 (0.0%) | 0 (0.0%) |
| 4 or 5 Rooms | 19 (14.4%) | 7 (58.3%) |
| 6 or 7 Rooms | 89 (67.4%) | 5 (41.7%) |
| 8 or more Rooms | 24 (18.2%) | 0 (0.0%) |
| Total | 132 (100.0%) | 12 (100.0%) |
Housing Structure by Heating Type in Helix
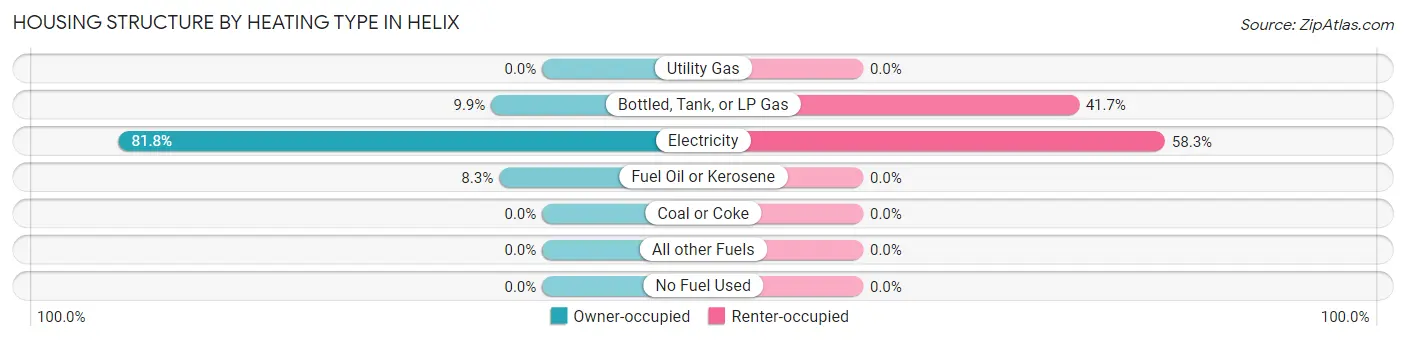
| Heating Type | Owner-occupied | Renter-occupied |
| Utility Gas | 0 (0.0%) | 0 (0.0%) |
| Bottled, Tank, or LP Gas | 13 (9.9%) | 5 (41.7%) |
| Electricity | 108 (81.8%) | 7 (58.3%) |
| Fuel Oil or Kerosene | 11 (8.3%) | 0 (0.0%) |
| Coal or Coke | 0 (0.0%) | 0 (0.0%) |
| All other Fuels | 0 (0.0%) | 0 (0.0%) |
| No Fuel Used | 0 (0.0%) | 0 (0.0%) |
| Total | 132 (100.0%) | 12 (100.0%) |
Household Vehicle Usage in Helix
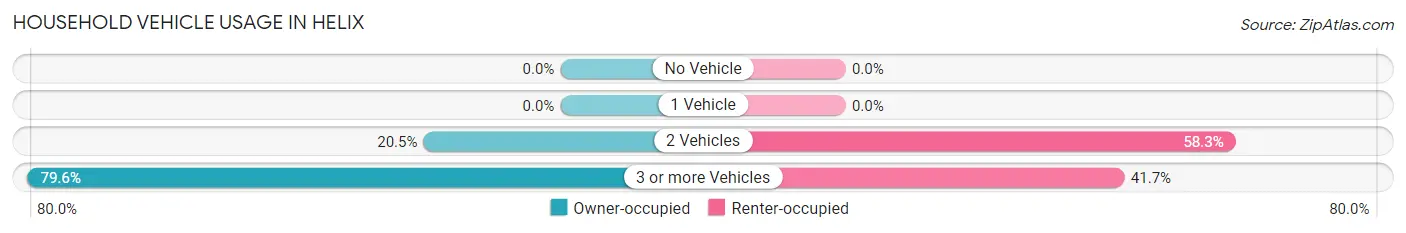
| Vehicles per Household | Owner-occupied | Renter-occupied |
| No Vehicle | 0 (0.0%) | 0 (0.0%) |
| 1 Vehicle | 0 (0.0%) | 0 (0.0%) |
| 2 Vehicles | 27 (20.4%) | 7 (58.3%) |
| 3 or more Vehicles | 105 (79.5%) | 5 (41.7%) |
| Total | 132 (100.0%) | 12 (100.0%) |
Real Estate & Mortgages in Helix
Real Estate and Mortgage Overview in Helix
| Characteristic | Without Mortgage | With Mortgage |
| Housing Units | 32 | 100 |
| Median Property Value | - | - |
| Median Household Income | - | - |
| Monthly Housing Costs | $550 | $6 |
| Real Estate Taxes | - | - |
Property Value by Mortgage Status in Helix
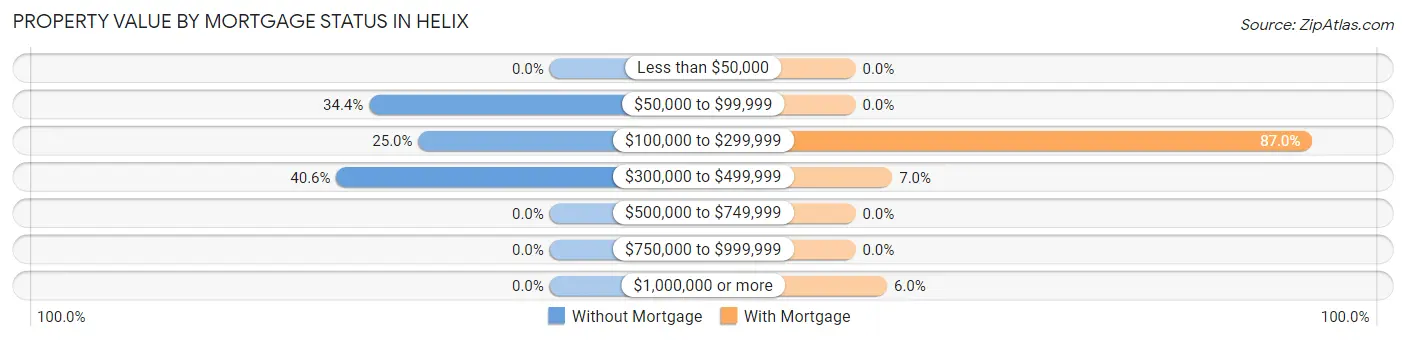
| Property Value | Without Mortgage | With Mortgage |
| Less than $50,000 | 0 (0.0%) | 0 (0.0%) |
| $50,000 to $99,999 | 11 (34.4%) | 0 (0.0%) |
| $100,000 to $299,999 | 8 (25.0%) | 87 (87.0%) |
| $300,000 to $499,999 | 13 (40.6%) | 7 (7.0%) |
| $500,000 to $749,999 | 0 (0.0%) | 0 (0.0%) |
| $750,000 to $999,999 | 0 (0.0%) | 0 (0.0%) |
| $1,000,000 or more | 0 (0.0%) | 6 (6.0%) |
| Total | 32 (100.0%) | 100 (100.0%) |
Household Income by Mortgage Status in Helix
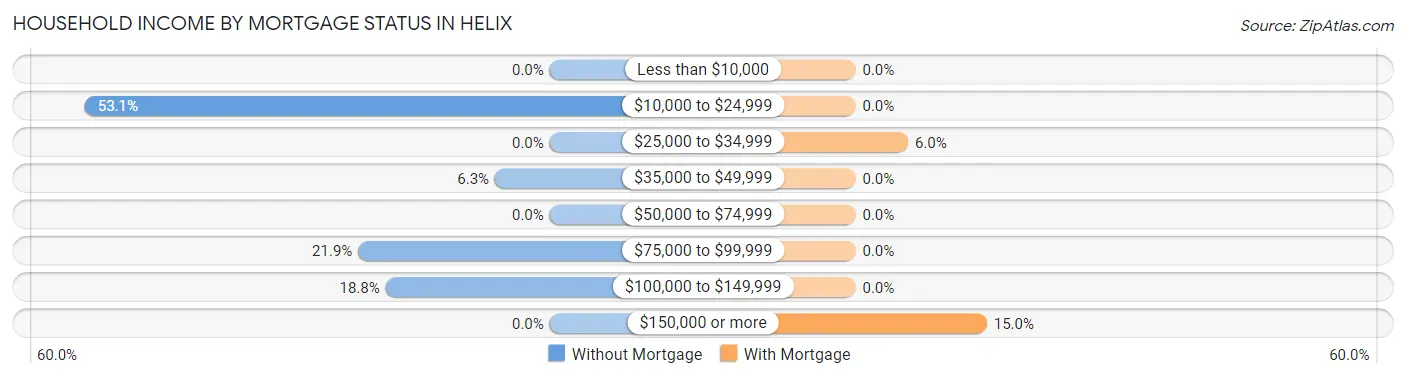
| Household Income | Without Mortgage | With Mortgage |
| Less than $10,000 | 0 (0.0%) | 0 (0.0%) |
| $10,000 to $24,999 | 17 (53.1%) | 0 (0.0%) |
| $25,000 to $34,999 | 0 (0.0%) | 6 (6.0%) |
| $35,000 to $49,999 | 2 (6.2%) | 0 (0.0%) |
| $50,000 to $74,999 | 0 (0.0%) | 0 (0.0%) |
| $75,000 to $99,999 | 7 (21.9%) | 0 (0.0%) |
| $100,000 to $149,999 | 6 (18.8%) | 0 (0.0%) |
| $150,000 or more | 0 (0.0%) | 15 (15.0%) |
| Total | 32 (100.0%) | 100 (100.0%) |
Property Value to Household Income Ratio in Helix
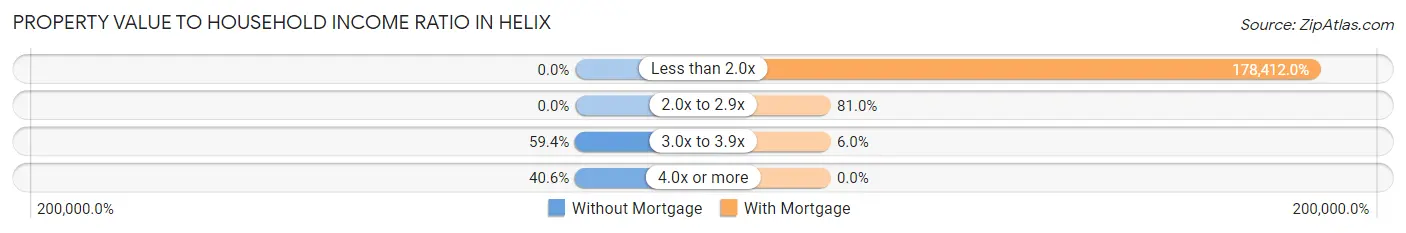
| Value-to-Income Ratio | Without Mortgage | With Mortgage |
| Less than 2.0x | 0 (0.0%) | 178,412 (178,412.0%) |
| 2.0x to 2.9x | 0 (0.0%) | 81 (81.0%) |
| 3.0x to 3.9x | 19 (59.4%) | 6 (6.0%) |
| 4.0x or more | 13 (40.6%) | 0 (0.0%) |
| Total | 32 (100.0%) | 100 (100.0%) |
Real Estate Taxes by Mortgage Status in Helix
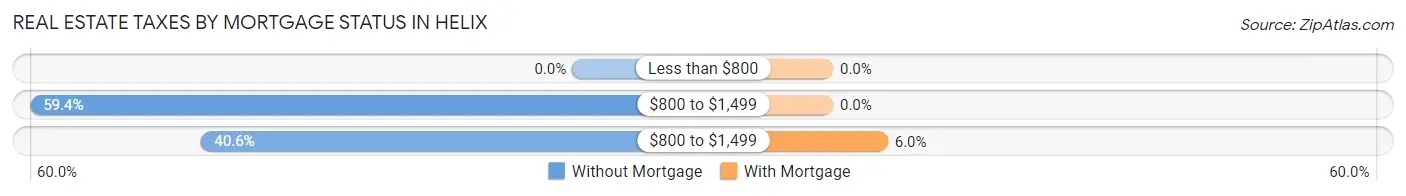
| Property Taxes | Without Mortgage | With Mortgage |
| Less than $800 | 0 (0.0%) | 0 (0.0%) |
| $800 to $1,499 | 19 (59.4%) | 0 (0.0%) |
| $800 to $1,499 | 13 (40.6%) | 6 (6.0%) |
| Total | 32 (100.0%) | 100 (100.0%) |
Health & Disability in Helix
Health Insurance Coverage by Age in Helix
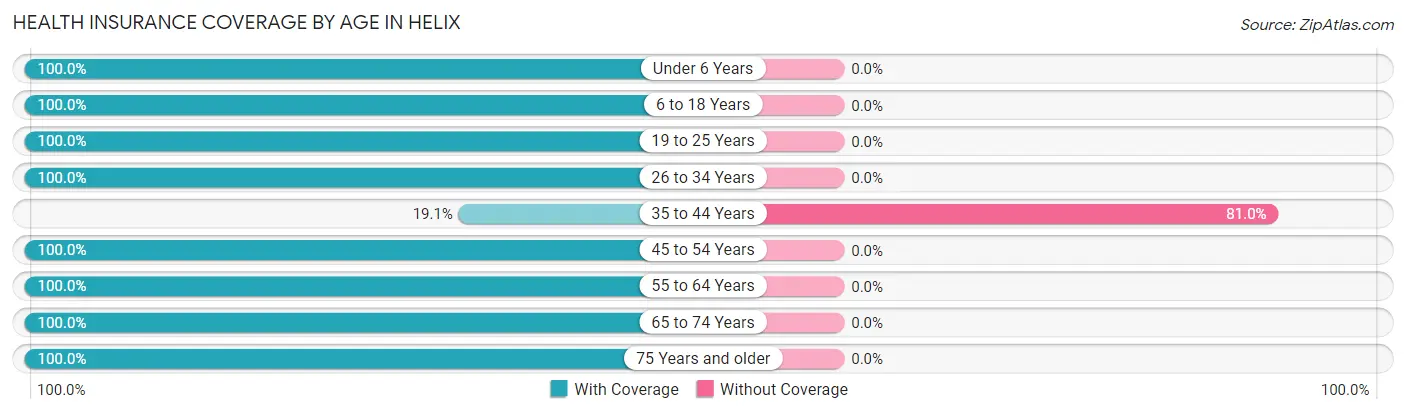
| Age Bracket | With Coverage | Without Coverage |
| Under 6 Years | 7 (100.0%) | 0 (0.0%) |
| 6 to 18 Years | 112 (100.0%) | 0 (0.0%) |
| 19 to 25 Years | 17 (100.0%) | 0 (0.0%) |
| 26 to 34 Years | 20 (100.0%) | 0 (0.0%) |
| 35 to 44 Years | 16 (19.1%) | 68 (80.9%) |
| 45 to 54 Years | 67 (100.0%) | 0 (0.0%) |
| 55 to 64 Years | 7 (100.0%) | 0 (0.0%) |
| 65 to 74 Years | 30 (100.0%) | 0 (0.0%) |
| 75 Years and older | 14 (100.0%) | 0 (0.0%) |
| Total | 290 (81.0%) | 68 (19.0%) |
Health Insurance Coverage by Citizenship Status in Helix
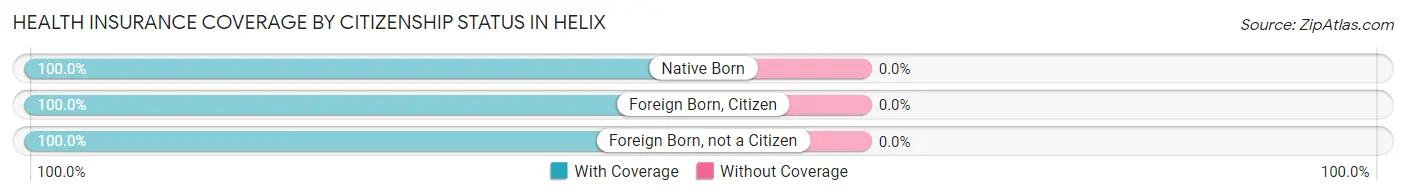
| Citizenship Status | With Coverage | Without Coverage |
| Native Born | 7 (100.0%) | 0 (0.0%) |
| Foreign Born, Citizen | 112 (100.0%) | 0 (0.0%) |
| Foreign Born, not a Citizen | 17 (100.0%) | 0 (0.0%) |
Health Insurance Coverage by Household Income in Helix
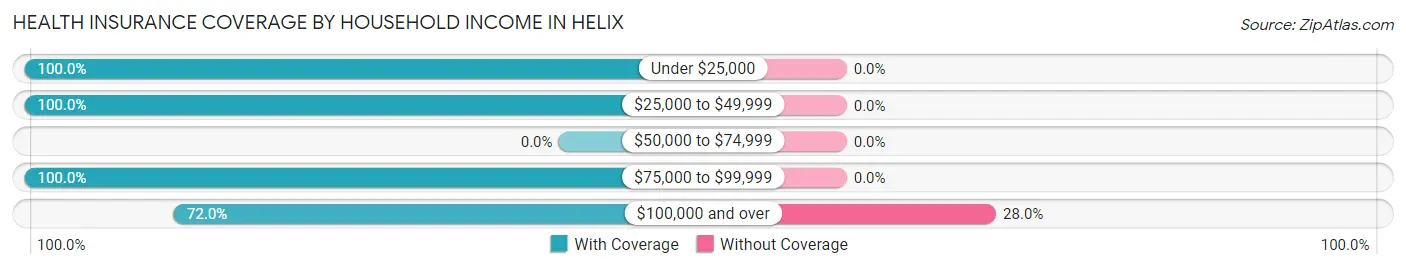
| Household Income | With Coverage | Without Coverage |
| Under $25,000 | 61 (100.0%) | 0 (0.0%) |
| $25,000 to $49,999 | 29 (100.0%) | 0 (0.0%) |
| $50,000 to $74,999 | 0 (0.0%) | 0 (0.0%) |
| $75,000 to $99,999 | 25 (100.0%) | 0 (0.0%) |
| $100,000 and over | 175 (72.0%) | 68 (28.0%) |
Public vs Private Health Insurance Coverage by Age in Helix

| Age Bracket | Public Insurance | Private Insurance |
| Under 6 | 0 (0.0%) | 7 (100.0%) |
| 6 to 18 Years | 14 (12.5%) | 103 (92.0%) |
| 19 to 25 Years | 0 (0.0%) | 17 (100.0%) |
| 25 to 34 Years | 5 (25.0%) | 15 (75.0%) |
| 35 to 44 Years | 0 (0.0%) | 16 (19.1%) |
| 45 to 54 Years | 7 (10.4%) | 67 (100.0%) |
| 55 to 64 Years | 0 (0.0%) | 7 (100.0%) |
| 65 to 74 Years | 30 (100.0%) | 24 (80.0%) |
| 75 Years and over | 14 (100.0%) | 14 (100.0%) |
| Total | 70 (19.6%) | 270 (75.4%) |
Disability Status by Sex by Age in Helix
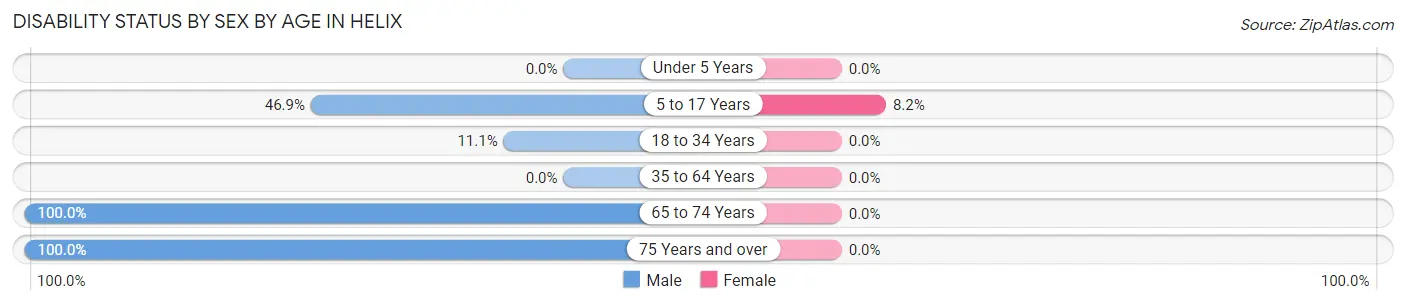
| Age Bracket | Male | Female |
| Under 5 Years | 0 (0.0%) | 0 (0.0%) |
| 5 to 17 Years | 15 (46.9%) | 5 (8.2%) |
| 18 to 34 Years | 2 (11.1%) | 0 (0.0%) |
| 35 to 64 Years | 0 (0.0%) | 0 (0.0%) |
| 65 to 74 Years | 7 (100.0%) | 0 (0.0%) |
| 75 Years and over | 6 (100.0%) | 0 (0.0%) |
Disability Class by Sex by Age in Helix
Disability Class: Hearing Difficulty
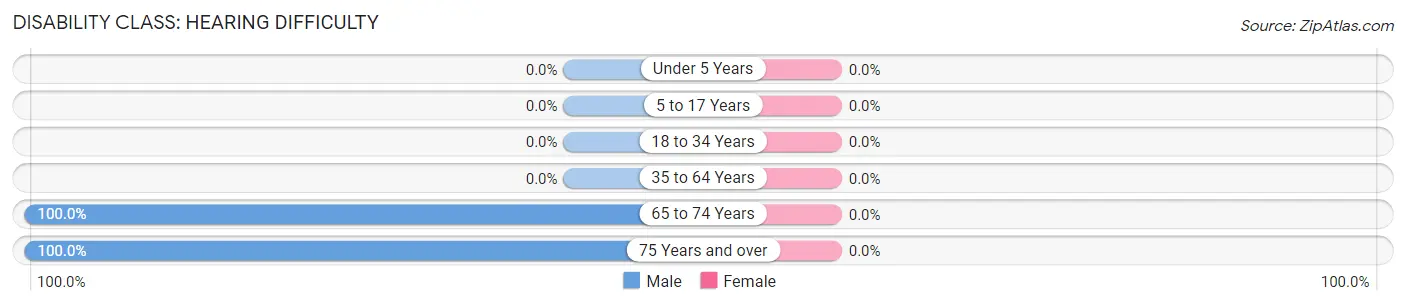
| Age Bracket | Male | Female |
| Under 5 Years | 0 (0.0%) | 0 (0.0%) |
| 5 to 17 Years | 0 (0.0%) | 0 (0.0%) |
| 18 to 34 Years | 0 (0.0%) | 0 (0.0%) |
| 35 to 64 Years | 0 (0.0%) | 0 (0.0%) |
| 65 to 74 Years | 7 (100.0%) | 0 (0.0%) |
| 75 Years and over | 6 (100.0%) | 0 (0.0%) |
Disability Class: Vision Difficulty
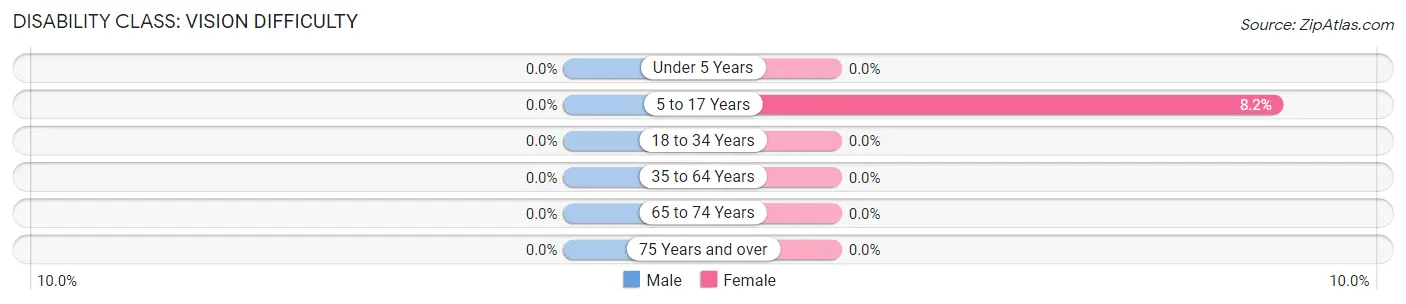
| Age Bracket | Male | Female |
| Under 5 Years | 0 (0.0%) | 0 (0.0%) |
| 5 to 17 Years | 0 (0.0%) | 5 (8.2%) |
| 18 to 34 Years | 0 (0.0%) | 0 (0.0%) |
| 35 to 64 Years | 0 (0.0%) | 0 (0.0%) |
| 65 to 74 Years | 0 (0.0%) | 0 (0.0%) |
| 75 Years and over | 0 (0.0%) | 0 (0.0%) |
Disability Class: Cognitive Difficulty
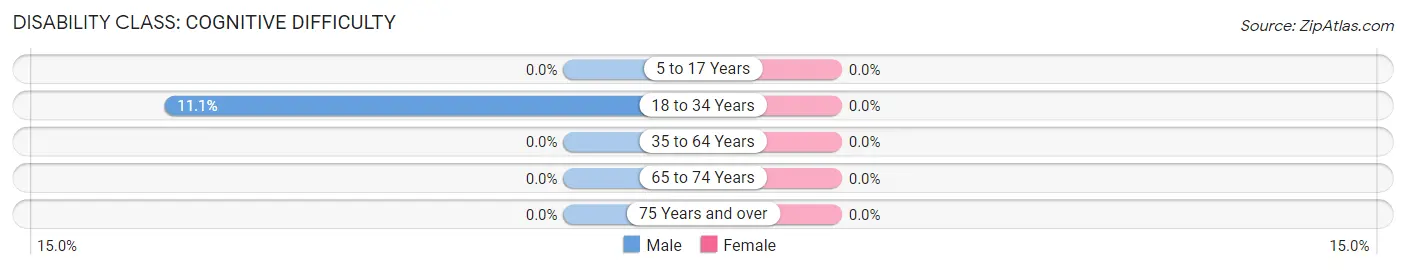
| Age Bracket | Male | Female |
| 5 to 17 Years | 0 (0.0%) | 0 (0.0%) |
| 18 to 34 Years | 2 (11.1%) | 0 (0.0%) |
| 35 to 64 Years | 0 (0.0%) | 0 (0.0%) |
| 65 to 74 Years | 0 (0.0%) | 0 (0.0%) |
| 75 Years and over | 0 (0.0%) | 0 (0.0%) |
Disability Class: Ambulatory Difficulty
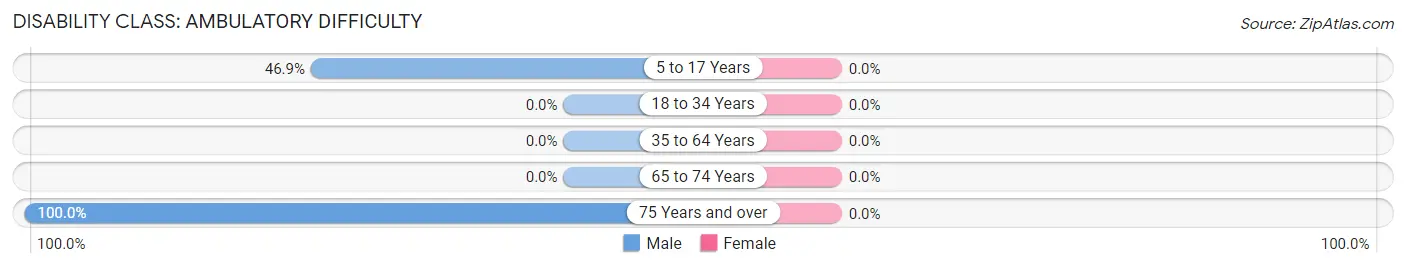
| Age Bracket | Male | Female |
| 5 to 17 Years | 15 (46.9%) | 0 (0.0%) |
| 18 to 34 Years | 0 (0.0%) | 0 (0.0%) |
| 35 to 64 Years | 0 (0.0%) | 0 (0.0%) |
| 65 to 74 Years | 0 (0.0%) | 0 (0.0%) |
| 75 Years and over | 6 (100.0%) | 0 (0.0%) |
Disability Class: Self-Care Difficulty
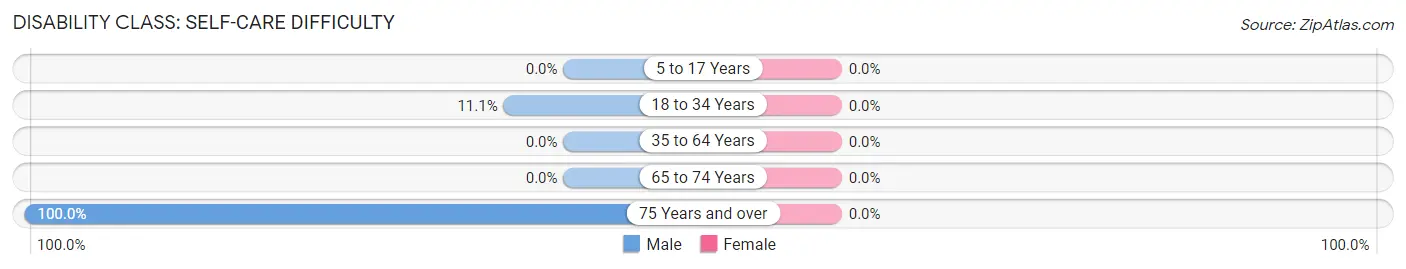
| Age Bracket | Male | Female |
| 5 to 17 Years | 0 (0.0%) | 0 (0.0%) |
| 18 to 34 Years | 2 (11.1%) | 0 (0.0%) |
| 35 to 64 Years | 0 (0.0%) | 0 (0.0%) |
| 65 to 74 Years | 0 (0.0%) | 0 (0.0%) |
| 75 Years and over | 6 (100.0%) | 0 (0.0%) |
Technology Access in Helix
Computing Device Access in Helix
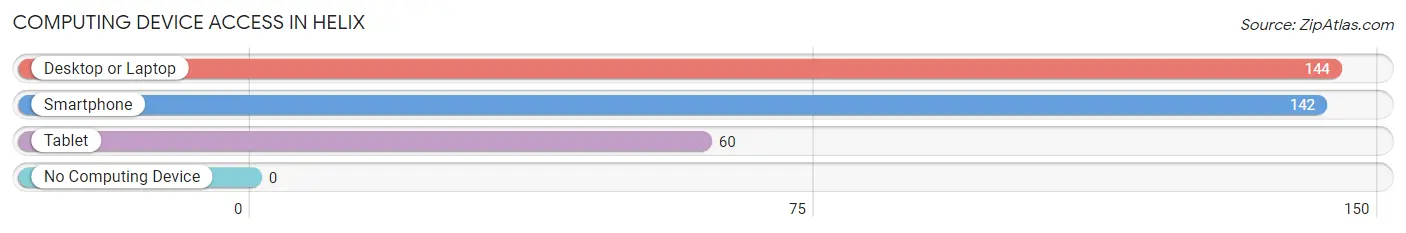
| Device Type | # Households | % Households |
| Desktop or Laptop | 144 | 100.0% |
| Smartphone | 142 | 98.6% |
| Tablet | 60 | 41.7% |
| No Computing Device | 0 | 0.0% |
| Total | 144 | 100.0% |
Internet Access in Helix
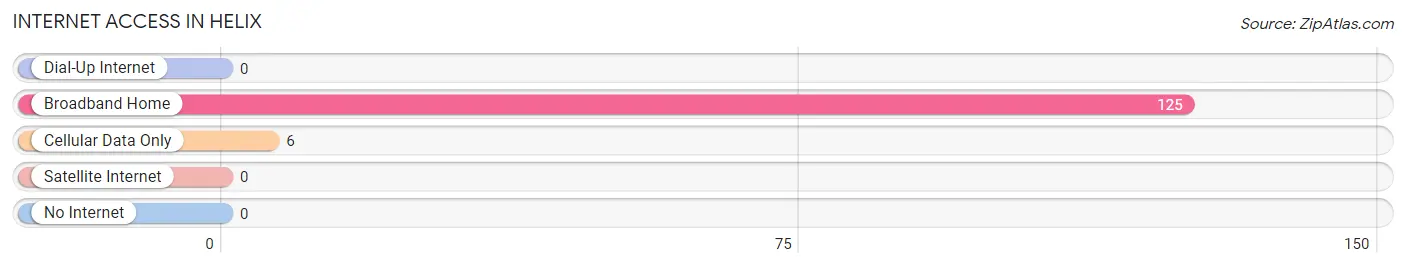
| Internet Type | # Households | % Households |
| Dial-Up Internet | 0 | 0.0% |
| Broadband Home | 125 | 86.8% |
| Cellular Data Only | 6 | 4.2% |
| Satellite Internet | 0 | 0.0% |
| No Internet | 0 | 0.0% |
| Total | 144 | 100.0% |
Helix Summary
Helix is a small city located in Umatilla County, Oregon. It is situated in the foothills of the Blue Mountains, about 20 miles east of Pendleton. The city has a population of about 1,000 people and covers an area of 1.2 square miles.
History
The area around Helix was first settled in the late 1800s by homesteaders. The town was officially founded in 1891 and was named after the nearby Helix Creek. The town was originally a farming community, but in the early 1900s, the railroad came through and the town began to grow. The railroad brought new businesses and industries to the area, including a flour mill, a creamery, and a sawmill.
In the 1920s, Helix was a thriving community with a population of over 1,000 people. The town had a bank, a hotel, a movie theater, and several stores. The town also had a school, a post office, and a library.
In the 1950s, the population of Helix began to decline as people moved away to larger cities. The railroad stopped running through the town in the 1960s, and many of the businesses closed. By the 1970s, the population had dropped to about 500 people.
Geography
Helix is located in the foothills of the Blue Mountains, about 20 miles east of Pendleton. The city is situated at an elevation of 1,890 feet above sea level. The city is surrounded by rolling hills and farmland. The nearby Helix Creek flows through the city and is a popular spot for fishing and swimming.
The climate in Helix is semi-arid, with hot summers and cold winters. The average annual temperature is about 50 degrees Fahrenheit. The average annual precipitation is about 12 inches.
Economy
The economy of Helix is largely based on agriculture. The surrounding area is home to many farms and ranches, and the city is a major producer of wheat, barley, and hay. The city also has a few small businesses, including a grocery store, a hardware store, and a few restaurants.
Demographics
As of the 2010 census, the population of Helix was 1,000 people. The racial makeup of the city was 94.2% White, 0.7% African American, 0.7% Native American, 0.3% Asian, 0.1% Pacific Islander, and 3.1% from other races. The median household income was $37,500, and the median family income was $41,250.
The population of Helix is largely made up of people of European descent. The city also has a small Hispanic population, as well as a few Native American families. The city is served by the Helix School District, which has one elementary school and one high school.
Common Questions
What is the Total Population of Helix?
Total Population of Helix is 358.
What is the Total Male Population of Helix?
Total Male Population of Helix is 132.
What is the Total Female Population of Helix?
Total Female Population of Helix is 226.
What is the Ratio of Males per 100 Females in Helix?
There are 58.41 Males per 100 Females in Helix.
What is the Ratio of Females per 100 Males in Helix?
There are 171.21 Females per 100 Males in Helix.
What is the Median Population Age in Helix?
Median Population Age in Helix is 41.2 Years.
What is the Average Family Size in Helix
Average Family Size in Helix is 2.8 People.
What is the Average Household Size in Helix
Average Household Size in Helix is 2.5 People.
What is Per Capita Income in Helix?
Per Capita income in Helix is $38,020.
What is the Median Family Income in Helix?
Median Family Income in Helix is $177,904.
What is the Median Household income in Helix?
Median Household Income in Helix is $177,669.
What is Income or Wage Gap in Helix?
Income or Wage Gap in Helix is 71.2%.
Women in Helix earn 28.8 cents for every dollar earned by a man.
What is Inequality or Gini Index in Helix?
Inequality or Gini Index in Helix is 0.28.
How Large is the Labor Force in Helix?
There are 198 People in the Labor Forcein in Helix.
What is the Percentage of People in the Labor Force in Helix?
66.4% of People are in the Labor Force in Helix.
What is the Unemployment Rate in Helix?
Unemployment Rate in Helix is 1.5%.