Foots Creek, OR
Foots Creek Map
Foots Creek Overview
983
TOTAL POPULATION
481
MALE POPULATION
502
FEMALE POPULATION
95.82
MALES / 100 FEMALES
104.37
FEMALES / 100 MALES
57.8
MEDIAN AGE
2.5
AVG FAMILY SIZE
2.3
AVG HOUSEHOLD SIZE
$33,530
PER CAPITA INCOME
$68,799
AVG FAMILY INCOME
$68,309
AVG HOUSEHOLD INCOME
0.36
INEQUALITY / GINI INDEX
347
LABOR FORCE [ PEOPLE ]
41.3%
PERCENT IN LABOR FORCE
Race in Foots Creek
The most populous races in Foots Creek are White / Caucasian (904 | 92.0%), Two or more Races (73 | 7.4%), and Hispanic or Latino (12 | 1.2%).
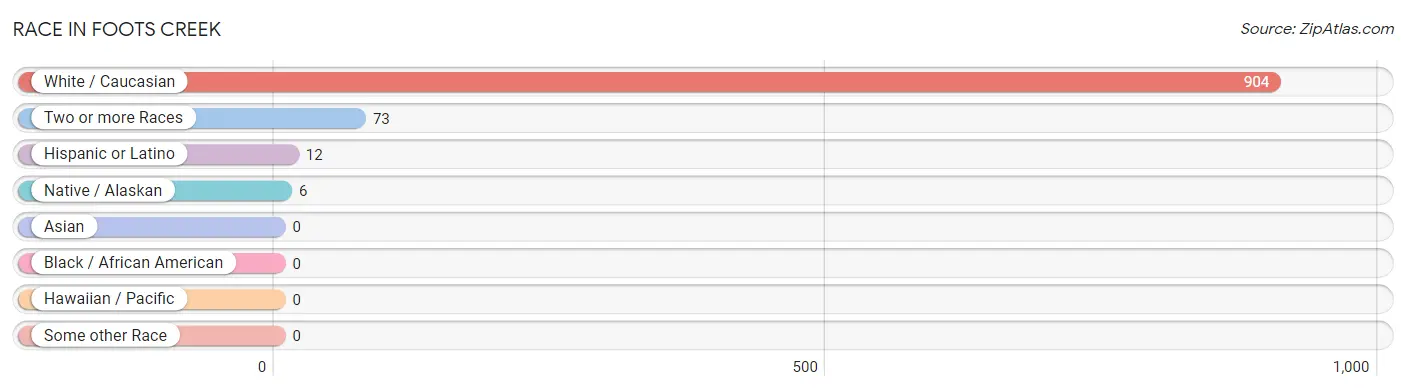
| Race | # Population | % Population |
| Asian | 0 | 0.0% |
| Black / African American | 0 | 0.0% |
| Hawaiian / Pacific | 0 | 0.0% |
| Hispanic or Latino | 12 | 1.2% |
| Native / Alaskan | 6 | 0.6% |
| White / Caucasian | 904 | 92.0% |
| Two or more Races | 73 | 7.4% |
| Some other Race | 0 | 0.0% |
| Total | 983 | 100.0% |
Ancestry in Foots Creek
The most populous ancestries reported in Foots Creek are English (235 | 23.9%), German (206 | 21.0%), American (102 | 10.4%), Irish (95 | 9.7%), and Native Hawaiian (61 | 6.2%), together accounting for 71.1% of all Foots Creek residents.
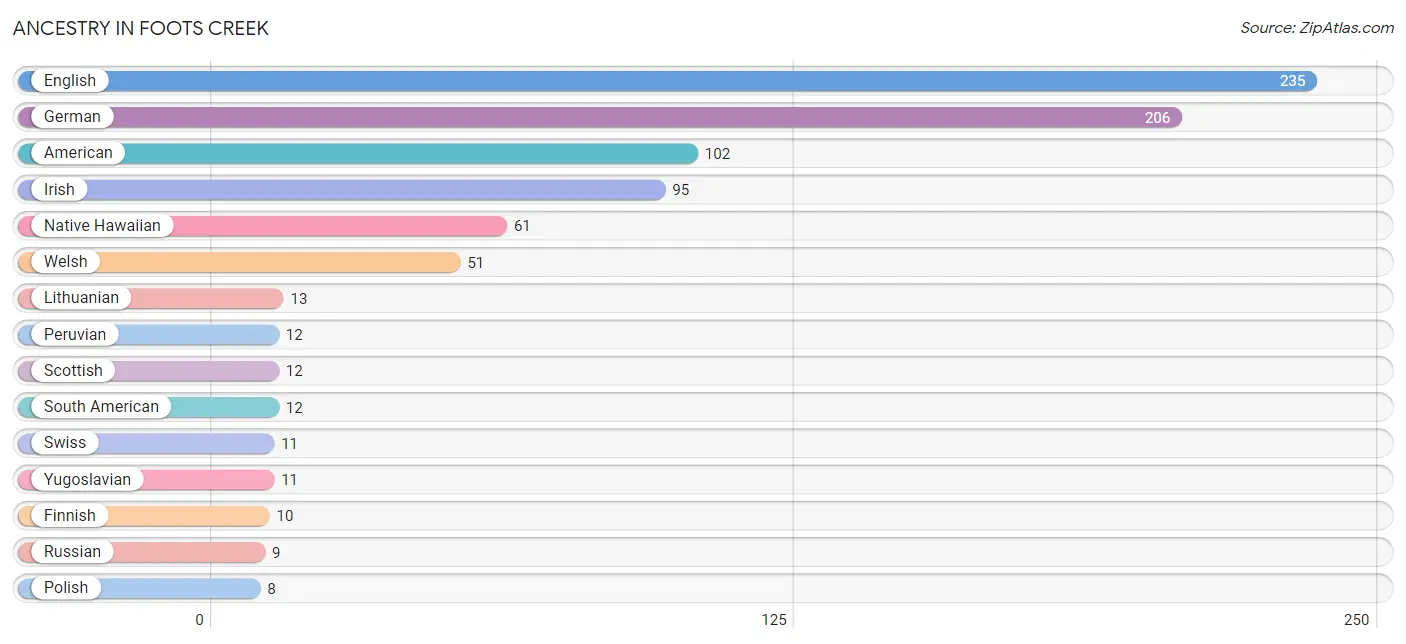
| Ancestry | # Population | % Population |
| American | 102 | 10.4% |
| English | 235 | 23.9% |
| European | 5 | 0.5% |
| Finnish | 10 | 1.0% |
| German | 206 | 21.0% |
| Irish | 95 | 9.7% |
| Italian | 7 | 0.7% |
| Lithuanian | 13 | 1.3% |
| Native Hawaiian | 61 | 6.2% |
| Peruvian | 12 | 1.2% |
| Polish | 8 | 0.8% |
| Russian | 9 | 0.9% |
| Scottish | 12 | 1.2% |
| Sioux | 6 | 0.6% |
| South American | 12 | 1.2% |
| Swiss | 11 | 1.1% |
| Welsh | 51 | 5.2% |
| Yugoslavian | 11 | 1.1% | View All 18 Rows |
Immigrants in Foots Creek
The most numerous immigrant groups reported in Foots Creek came from Latin America (12 | 1.2%), Peru (12 | 1.2%), and South America (12 | 1.2%), together accounting for 3.7% of all Foots Creek residents.
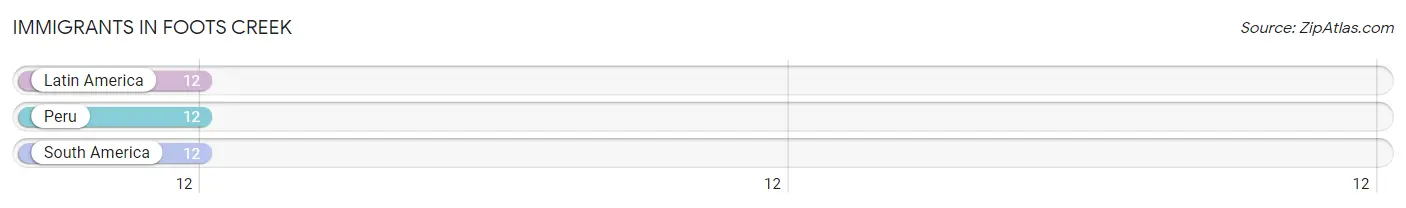
| Immigration Origin | # Population | % Population |
| Latin America | 12 | 1.2% |
| Peru | 12 | 1.2% |
| South America | 12 | 1.2% | View All 3 Rows |
Sex and Age in Foots Creek
Sex and Age in Foots Creek
The most populous age groups in Foots Creek are 65 to 69 Years (106 | 22.0%) for men and 65 to 69 Years (126 | 25.1%) for women.
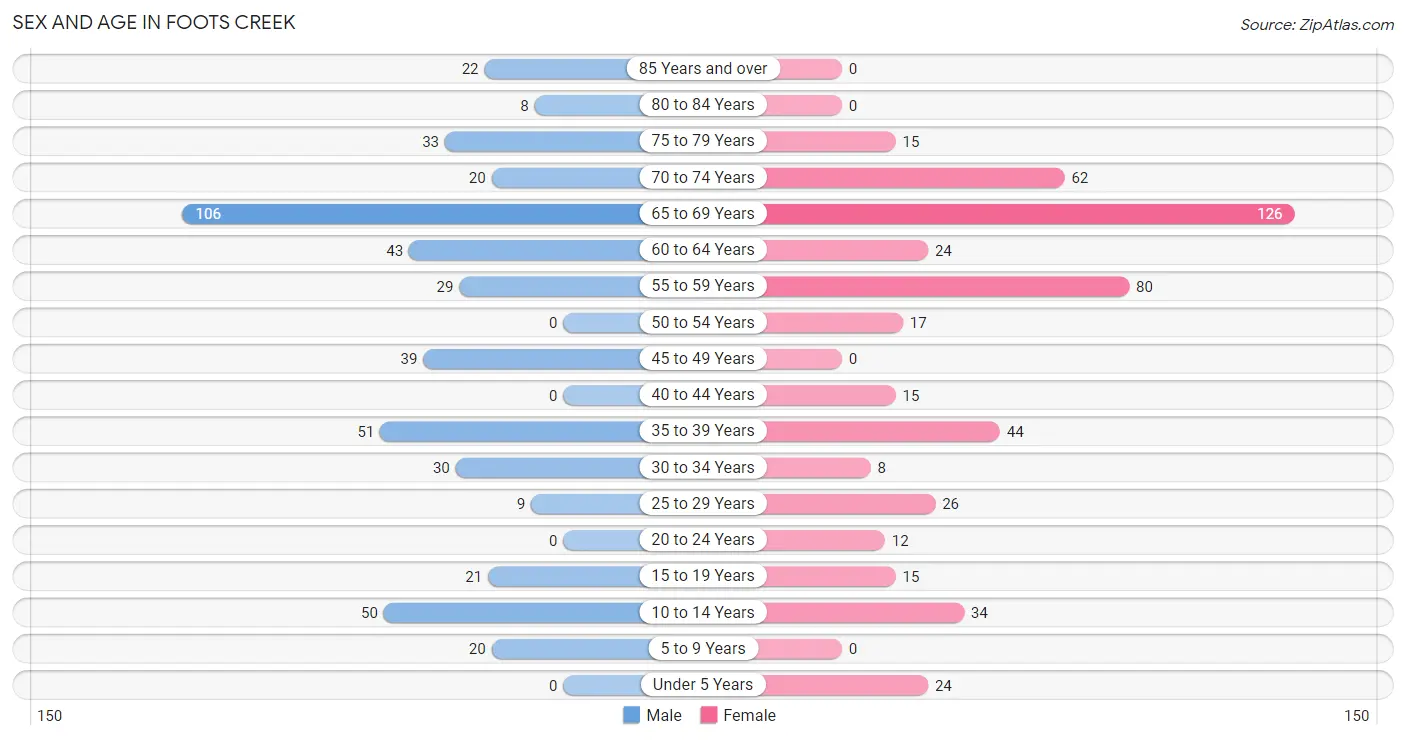
| Age Bracket | Male | Female |
| Under 5 Years | 0 (0.0%) | 24 (4.8%) |
| 5 to 9 Years | 20 (4.2%) | 0 (0.0%) |
| 10 to 14 Years | 50 (10.4%) | 34 (6.8%) |
| 15 to 19 Years | 21 (4.4%) | 15 (3.0%) |
| 20 to 24 Years | 0 (0.0%) | 12 (2.4%) |
| 25 to 29 Years | 9 (1.9%) | 26 (5.2%) |
| 30 to 34 Years | 30 (6.2%) | 8 (1.6%) |
| 35 to 39 Years | 51 (10.6%) | 44 (8.8%) |
| 40 to 44 Years | 0 (0.0%) | 15 (3.0%) |
| 45 to 49 Years | 39 (8.1%) | 0 (0.0%) |
| 50 to 54 Years | 0 (0.0%) | 17 (3.4%) |
| 55 to 59 Years | 29 (6.0%) | 80 (15.9%) |
| 60 to 64 Years | 43 (8.9%) | 24 (4.8%) |
| 65 to 69 Years | 106 (22.0%) | 126 (25.1%) |
| 70 to 74 Years | 20 (4.2%) | 62 (12.3%) |
| 75 to 79 Years | 33 (6.9%) | 15 (3.0%) |
| 80 to 84 Years | 8 (1.7%) | 0 (0.0%) |
| 85 Years and over | 22 (4.6%) | 0 (0.0%) |
| Total | 481 (100.0%) | 502 (100.0%) |
Families and Households in Foots Creek
Median Family Size in Foots Creek
The median family size in Foots Creek is 2.46 persons per family, with single female/mother families (78 | 21.8%) accounting for the largest median family size of 3.08 persons per family. On the other hand, single male/father families (16 | 4.5%) represent the smallest median family size with 2.06 persons per family.
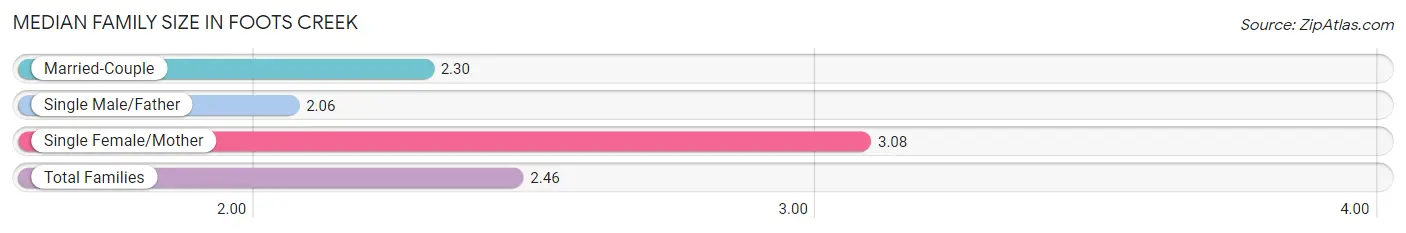
| Family Type | # Families | Family Size |
| Married-Couple | 264 (73.7%) | 2.30 |
| Single Male/Father | 16 (4.5%) | 2.06 |
| Single Female/Mother | 78 (21.8%) | 3.08 |
| Total Families | 358 (100.0%) | 2.46 |
Median Household Size in Foots Creek
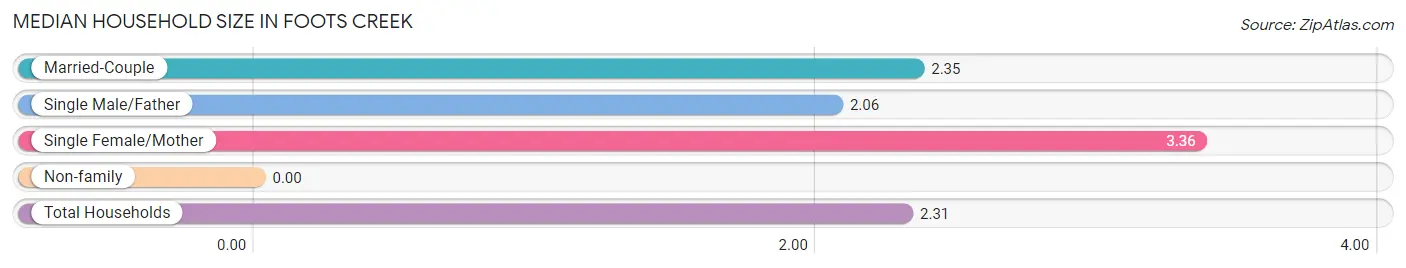
| Household Type | # Households | Household Size |
| Married-Couple | 264 (62.0%) | 2.35 |
| Single Male/Father | 16 (3.8%) | 2.06 |
| Single Female/Mother | 78 (18.3%) | 3.36 |
| Non-family | 68 (16.0%) | - |
| Total Households | 426 (100.0%) | 2.31 |
Household Size by Marriage Status in Foots Creek
Out of a total of 426 households in Foots Creek, 358 (84.0%) are family households, while 68 (16.0%) are nonfamily households. The most numerous type of family households are 2-person households, comprising 253, and the most common type of nonfamily households are 1-person households, comprising 68.
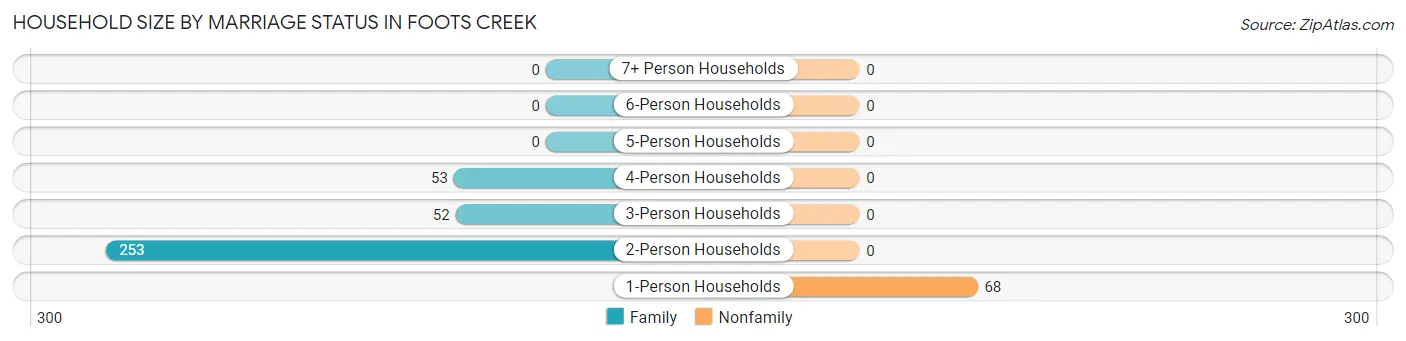
| Household Size | Family Households | Nonfamily Households |
| 1-Person Households | - | 68 (16.0%) |
| 2-Person Households | 253 (59.4%) | 0 (0.0%) |
| 3-Person Households | 52 (12.2%) | 0 (0.0%) |
| 4-Person Households | 53 (12.4%) | 0 (0.0%) |
| 5-Person Households | 0 (0.0%) | 0 (0.0%) |
| 6-Person Households | 0 (0.0%) | 0 (0.0%) |
| 7+ Person Households | 0 (0.0%) | 0 (0.0%) |
| Total | 358 (84.0%) | 68 (16.0%) |
Female Fertility in Foots Creek
Fertility by Age in Foots Creek
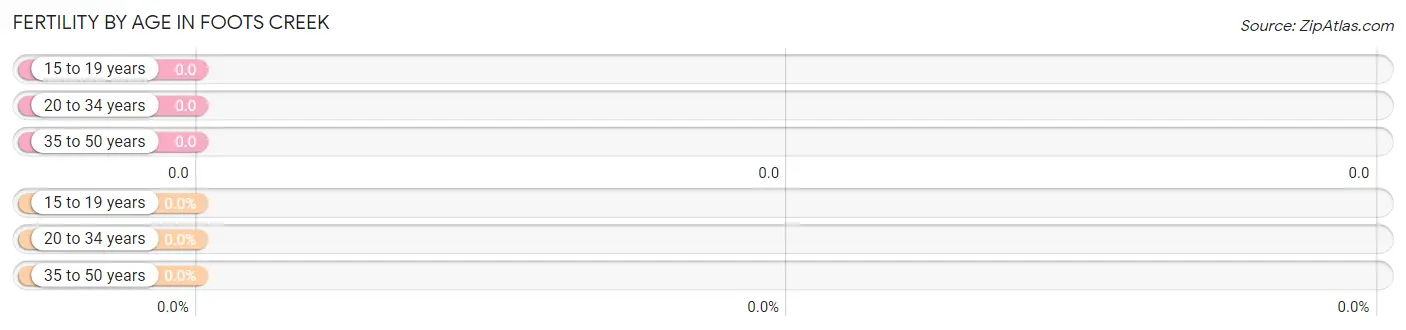
| Age Bracket | Women with Births | Births / 1,000 Women |
| 15 to 19 years | 0 (0.0%) | 0.0 |
| 20 to 34 years | 0 (0.0%) | 0.0 |
| 35 to 50 years | 0 (0.0%) | 0.0 |
| Total | 0 (0.0%) | 0.0 |
Fertility by Age by Marriage Status in Foots Creek
| Age Bracket | Married | Unmarried |
| 15 to 19 years | 0 (0.0%) | 0 (0.0%) |
| 20 to 34 years | 0 (0.0%) | 0 (0.0%) |
| 35 to 50 years | 0 (0.0%) | 0 (0.0%) |
| Total | 0 (0.0%) | 0 (0.0%) |
Fertility by Education in Foots Creek
| Educational Attainment | Women with Births | Births / 1,000 Women |
| Less than High School | 0 (0.0%) | 0.0 |
| High School Diploma | 0 (0.0%) | 0.0 |
| College or Associate's Degree | 0 (0.0%) | 0.0 |
| Bachelor's Degree | 0 (0.0%) | 0.0 |
| Graduate Degree | 0 (0.0%) | 0.0 |
| Total | 0 (0.0%) | 0.0 |
Fertility by Education by Marriage Status in Foots Creek
| Educational Attainment | Married | Unmarried |
| Less than High School | 0 (0.0%) | 0 (0.0%) |
| High School Diploma | 0 (0.0%) | 0 (0.0%) |
| College or Associate's Degree | 0 (0.0%) | 0 (0.0%) |
| Bachelor's Degree | 0 (0.0%) | 0 (0.0%) |
| Graduate Degree | 0 (0.0%) | 0 (0.0%) |
| Total | 0 (0.0%) | 0 (0.0%) |
Income in Foots Creek
Income Overview in Foots Creek
Per Capita Income in Foots Creek is $33,530, while median incomes of families and households are $68,799 and $68,309 respectively.
| Characteristic | Number | Measure |
| Per Capita Income | 983 | $33,530 |
| Median Family Income | 358 | $68,799 |
| Mean Family Income | 358 | $79,970 |
| Median Household Income | 426 | $68,309 |
| Mean Household Income | 426 | $74,086 |
| Income Deficit | 358 | $0 |
| Wage / Income Gap (%) | 983 | 0.00% |
| Wage / Income Gap ($) | 983 | 100.00¢ per $1 |
| Gini / Inequality Index | 983 | 0.36 |
Earnings by Sex in Foots Creek
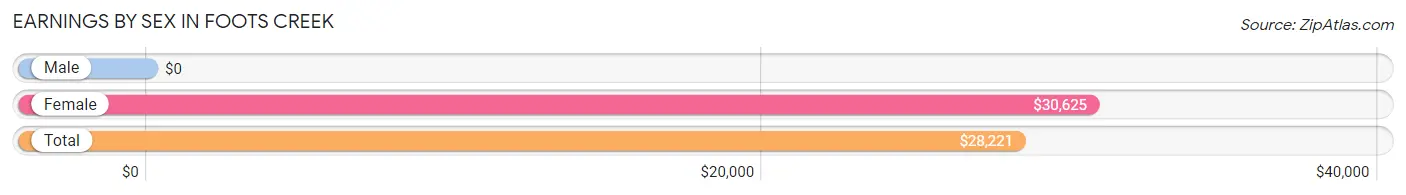
| Sex | Number | Average Earnings |
| Male | 262 (59.1%) | $0 |
| Female | 181 (40.9%) | $30,625 |
| Total | 443 (100.0%) | $28,221 |
Earnings by Sex by Income Bracket in Foots Creek
The most common earnings brackets in Foots Creek are $12,500 to $14,999 for men (87 | 33.2%) and $30,000 to $34,999 for women (58 | 32.0%).
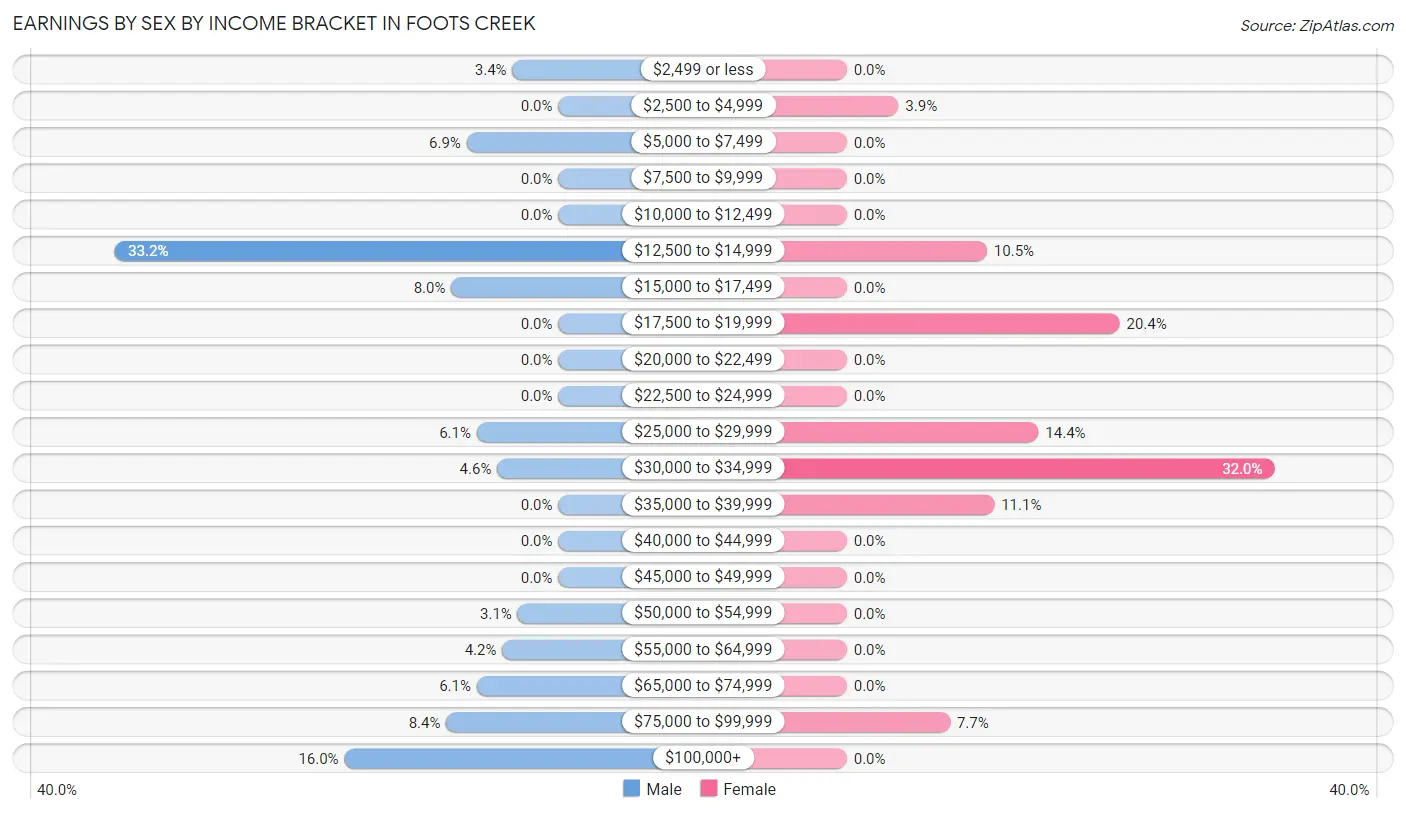
| Income | Male | Female |
| $2,499 or less | 9 (3.4%) | 0 (0.0%) |
| $2,500 to $4,999 | 0 (0.0%) | 7 (3.9%) |
| $5,000 to $7,499 | 18 (6.9%) | 0 (0.0%) |
| $7,500 to $9,999 | 0 (0.0%) | 0 (0.0%) |
| $10,000 to $12,499 | 0 (0.0%) | 0 (0.0%) |
| $12,500 to $14,999 | 87 (33.2%) | 19 (10.5%) |
| $15,000 to $17,499 | 21 (8.0%) | 0 (0.0%) |
| $17,500 to $19,999 | 0 (0.0%) | 37 (20.4%) |
| $20,000 to $22,499 | 0 (0.0%) | 0 (0.0%) |
| $22,500 to $24,999 | 0 (0.0%) | 0 (0.0%) |
| $25,000 to $29,999 | 16 (6.1%) | 26 (14.4%) |
| $30,000 to $34,999 | 12 (4.6%) | 58 (32.0%) |
| $35,000 to $39,999 | 0 (0.0%) | 20 (11.1%) |
| $40,000 to $44,999 | 0 (0.0%) | 0 (0.0%) |
| $45,000 to $49,999 | 0 (0.0%) | 0 (0.0%) |
| $50,000 to $54,999 | 8 (3.0%) | 0 (0.0%) |
| $55,000 to $64,999 | 11 (4.2%) | 0 (0.0%) |
| $65,000 to $74,999 | 16 (6.1%) | 0 (0.0%) |
| $75,000 to $99,999 | 22 (8.4%) | 14 (7.7%) |
| $100,000+ | 42 (16.0%) | 0 (0.0%) |
| Total | 262 (100.0%) | 181 (100.0%) |
Earnings by Sex by Educational Attainment in Foots Creek
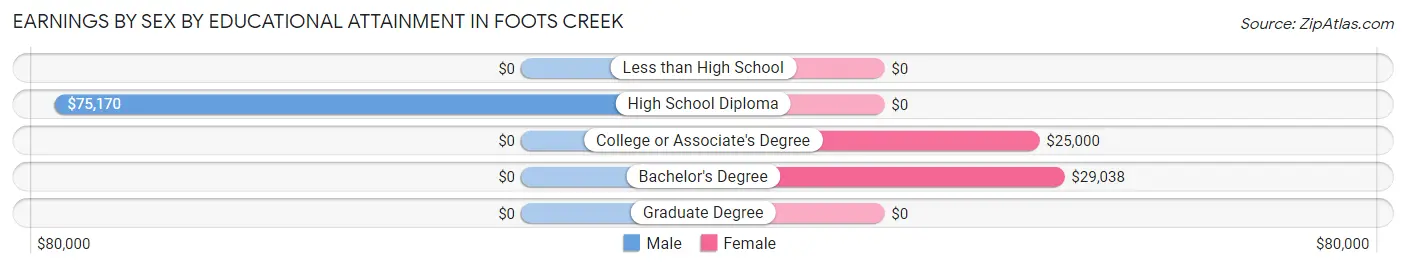
| Educational Attainment | Male Income | Female Income |
| Less than High School | - | - |
| High School Diploma | $75,170 | $0 |
| College or Associate's Degree | - | - |
| Bachelor's Degree | - | - |
| Graduate Degree | - | - |
| Total | - | - |
Family Income in Foots Creek
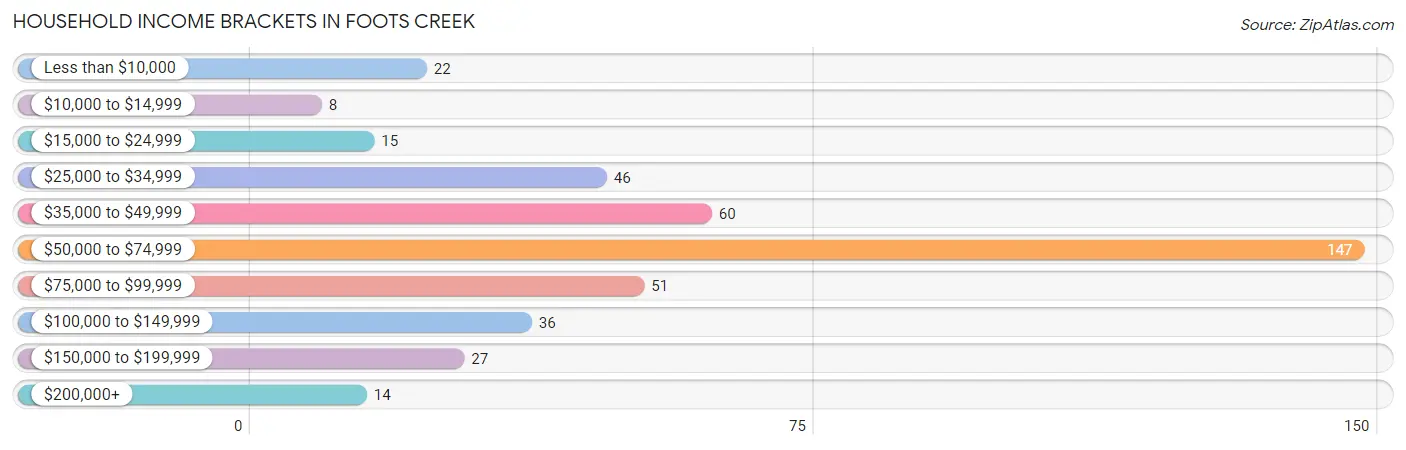
Family Income Brackets in Foots Creek
According to the Foots Creek family income data, there are 147 families falling into the $50,000 to $74,999 income range, which is the most common income bracket and makes up 41.1% of all families.
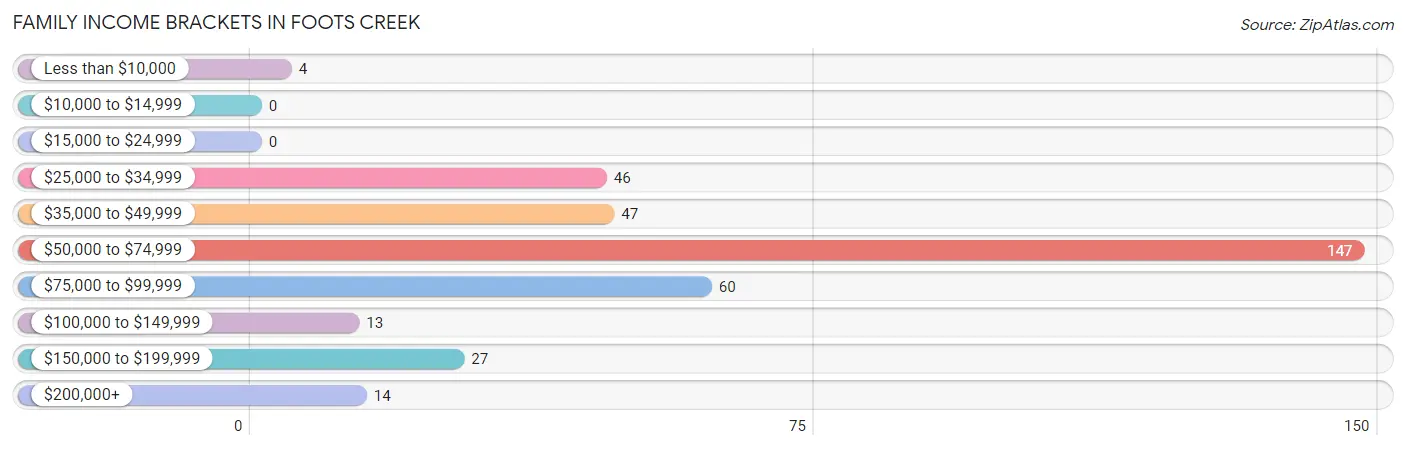
| Income Bracket | # Families | % Families |
| Less than $10,000 | 4 | 1.1% |
| $10,000 to $14,999 | 0 | 0.0% |
| $15,000 to $24,999 | 0 | 0.0% |
| $25,000 to $34,999 | 46 | 12.8% |
| $35,000 to $49,999 | 47 | 13.1% |
| $50,000 to $74,999 | 147 | 41.1% |
| $75,000 to $99,999 | 60 | 16.8% |
| $100,000 to $149,999 | 13 | 3.6% |
| $150,000 to $199,999 | 27 | 7.5% |
| $200,000+ | 14 | 3.9% |
Family Income by Famaliy Size in Foots Creek
3-person families (35 | 9.8%) account for the highest median family income in Foots Creek with $80,568 per family, while 2-person families (279 | 77.9%) have the highest median income of $34,552 per family member.
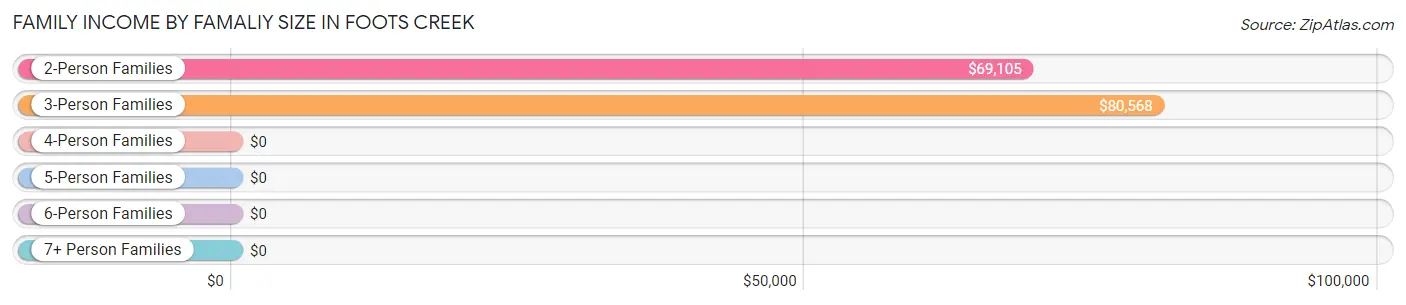
| Income Bracket | # Families | Median Income |
| 2-Person Families | 279 (77.9%) | $69,105 |
| 3-Person Families | 35 (9.8%) | $80,568 |
| 4-Person Families | 44 (12.3%) | $0 |
| 5-Person Families | 0 (0.0%) | $0 |
| 6-Person Families | 0 (0.0%) | $0 |
| 7+ Person Families | 0 (0.0%) | $0 |
| Total | 358 (100.0%) | $68,799 |
Family Income by Number of Earners in Foots Creek
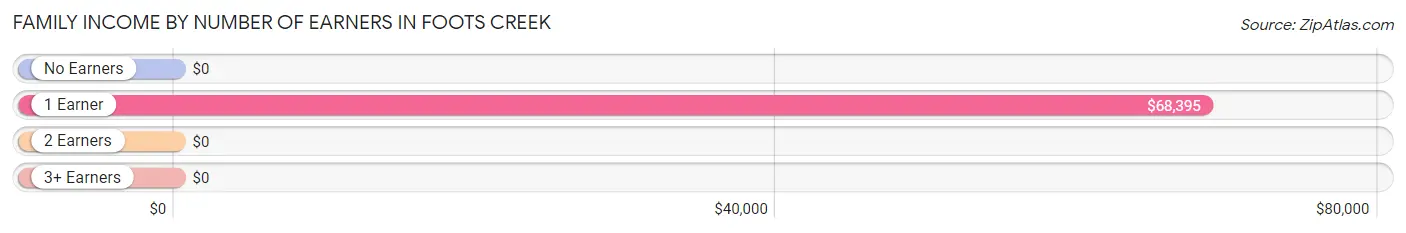
| Number of Earners | # Families | Median Income |
| No Earners | 67 (18.7%) | $0 |
| 1 Earner | 199 (55.6%) | $68,395 |
| 2 Earners | 92 (25.7%) | $0 |
| 3+ Earners | 0 (0.0%) | $0 |
| Total | 358 (100.0%) | $68,799 |
Household Income in Foots Creek
Household Income Brackets in Foots Creek
With 147 households falling in the category, the $50,000 to $74,999 income range is the most frequent in Foots Creek, accounting for 34.5% of all households. In contrast, only 8 households (1.9%) fall into the $10,000 to $14,999 income bracket, making it the least populous group.
| Income Bracket | # Households | % Households |
| Less than $10,000 | 22 | 5.2% |
| $10,000 to $14,999 | 8 | 1.9% |
| $15,000 to $24,999 | 15 | 3.5% |
| $25,000 to $34,999 | 46 | 10.8% |
| $35,000 to $49,999 | 60 | 14.1% |
| $50,000 to $74,999 | 147 | 34.5% |
| $75,000 to $99,999 | 51 | 12.0% |
| $100,000 to $149,999 | 36 | 8.5% |
| $150,000 to $199,999 | 27 | 6.3% |
| $200,000+ | 14 | 3.3% |
Household Income by Householder Age in Foots Creek
The median household income in Foots Creek is $68,309, with the highest median household income of $68,627 found in the 65+ years age bracket for the primary householder. A total of 224 households (52.6%) fall into this category.
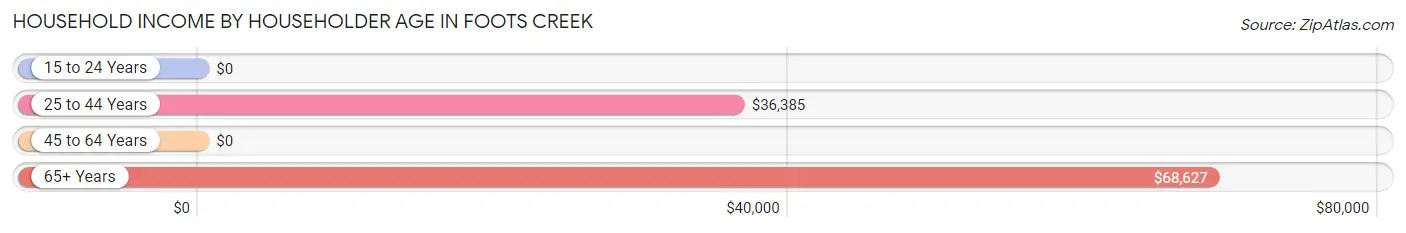
| Income Bracket | # Households | Median Income |
| 15 to 24 Years | 0 (0.0%) | $0 |
| 25 to 44 Years | 93 (21.8%) | $36,385 |
| 45 to 64 Years | 109 (25.6%) | $0 |
| 65+ Years | 224 (52.6%) | $68,627 |
| Total | 426 (100.0%) | $68,309 |
Poverty in Foots Creek
Income Below Poverty by Sex and Age in Foots Creek
With 9.4% poverty level for males and 2.4% for females among the residents of Foots Creek, 45 to 54 year old males and 75 year old and over females are the most vulnerable to poverty, with 23 males (59.0%) and 8 females (53.3%) in their respective age groups living below the poverty level.
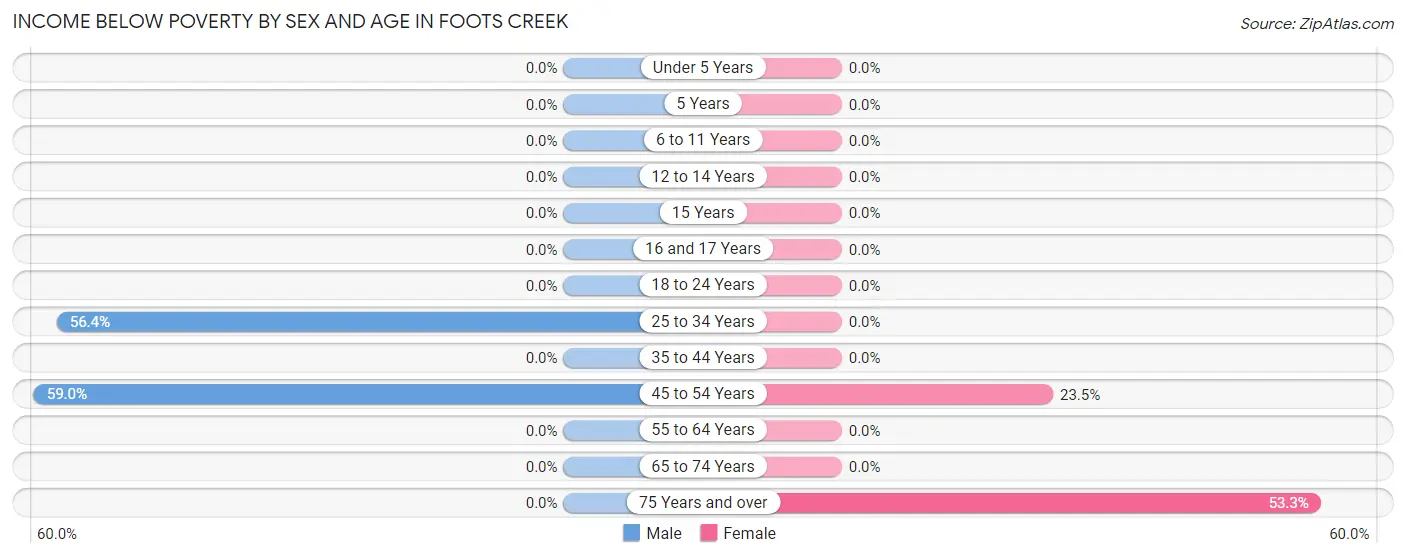
| Age Bracket | Male | Female |
| Under 5 Years | 0 (0.0%) | 0 (0.0%) |
| 5 Years | 0 (0.0%) | 0 (0.0%) |
| 6 to 11 Years | 0 (0.0%) | 0 (0.0%) |
| 12 to 14 Years | 0 (0.0%) | 0 (0.0%) |
| 15 Years | 0 (0.0%) | 0 (0.0%) |
| 16 and 17 Years | 0 (0.0%) | 0 (0.0%) |
| 18 to 24 Years | 0 (0.0%) | 0 (0.0%) |
| 25 to 34 Years | 22 (56.4%) | 0 (0.0%) |
| 35 to 44 Years | 0 (0.0%) | 0 (0.0%) |
| 45 to 54 Years | 23 (59.0%) | 4 (23.5%) |
| 55 to 64 Years | 0 (0.0%) | 0 (0.0%) |
| 65 to 74 Years | 0 (0.0%) | 0 (0.0%) |
| 75 Years and over | 0 (0.0%) | 8 (53.3%) |
| Total | 45 (9.4%) | 12 (2.4%) |
Income Above Poverty by Sex and Age in Foots Creek
According to the poverty statistics in Foots Creek, males aged 6 to 11 years and females aged under 5 years are the age groups that are most secure financially, with 100.0% of males and 100.0% of females in these age groups living above the poverty line.
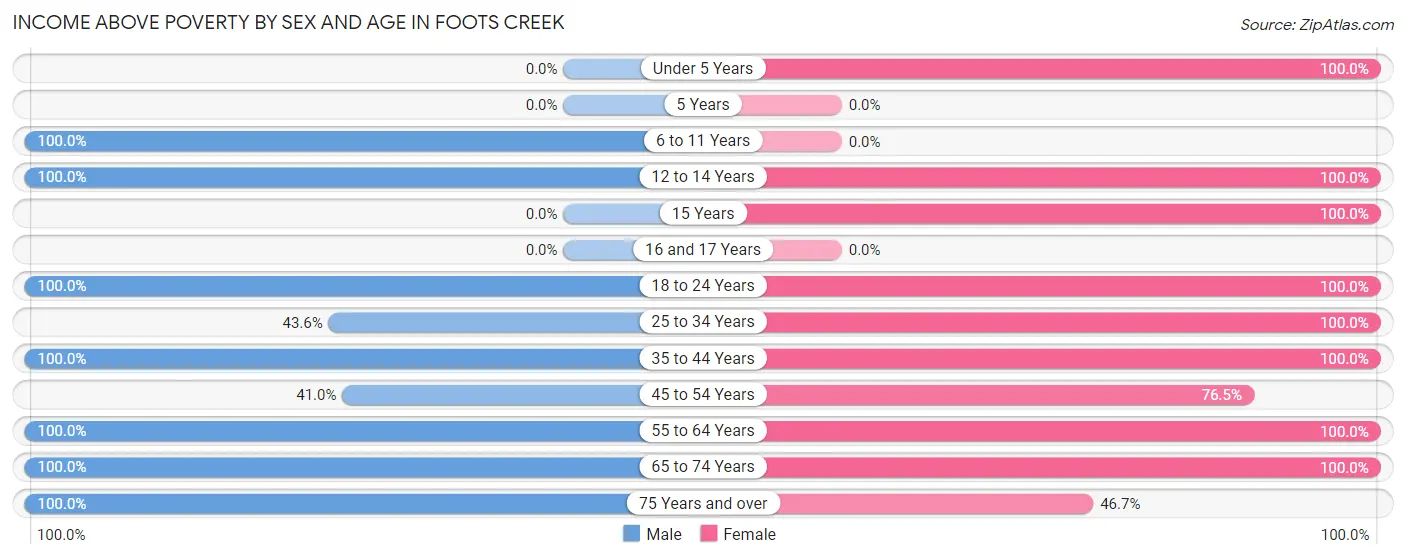
| Age Bracket | Male | Female |
| Under 5 Years | 0 (0.0%) | 24 (100.0%) |
| 5 Years | 0 (0.0%) | 0 (0.0%) |
| 6 to 11 Years | 39 (100.0%) | 0 (0.0%) |
| 12 to 14 Years | 31 (100.0%) | 34 (100.0%) |
| 15 Years | 0 (0.0%) | 15 (100.0%) |
| 16 and 17 Years | 0 (0.0%) | 0 (0.0%) |
| 18 to 24 Years | 21 (100.0%) | 12 (100.0%) |
| 25 to 34 Years | 17 (43.6%) | 34 (100.0%) |
| 35 to 44 Years | 51 (100.0%) | 59 (100.0%) |
| 45 to 54 Years | 16 (41.0%) | 13 (76.5%) |
| 55 to 64 Years | 72 (100.0%) | 104 (100.0%) |
| 65 to 74 Years | 126 (100.0%) | 188 (100.0%) |
| 75 Years and over | 63 (100.0%) | 7 (46.7%) |
| Total | 436 (90.6%) | 490 (97.6%) |
Income Below Poverty Among Married-Couple Families in Foots Creek
The poverty statistics for married-couple families in Foots Creek show that 1.5% or 4 of the total 264 families live below the poverty line. Families with no children have the highest poverty rate of 1.6%, comprising of 4 families. On the other hand, families with 1 or 2 children have the lowest poverty rate of 0.0%, which includes 0 families.
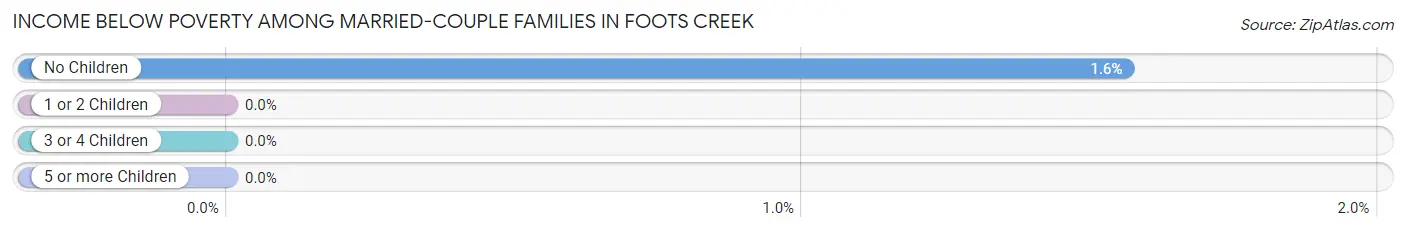
| Children | Above Poverty | Below Poverty |
| No Children | 253 (98.4%) | 4 (1.6%) |
| 1 or 2 Children | 7 (100.0%) | 0 (0.0%) |
| 3 or 4 Children | 0 (0.0%) | 0 (0.0%) |
| 5 or more Children | 0 (0.0%) | 0 (0.0%) |
| Total | 260 (98.5%) | 4 (1.5%) |
Income Below Poverty Among Single-Parent Households in Foots Creek
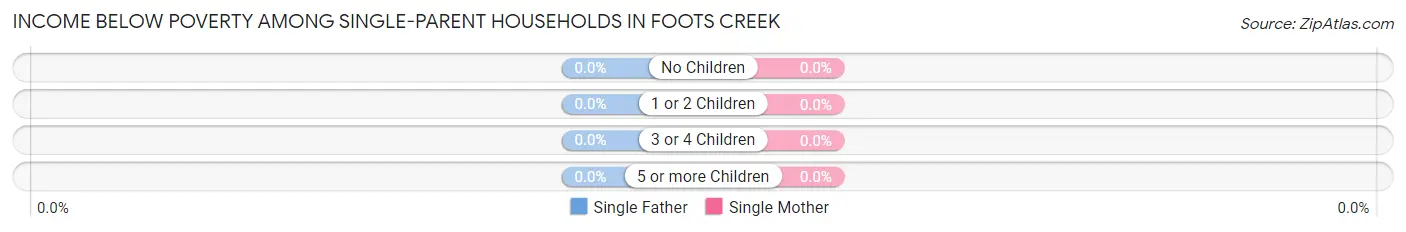
| Children | Single Father | Single Mother |
| No Children | 0 (0.0%) | 0 (0.0%) |
| 1 or 2 Children | 0 (0.0%) | 0 (0.0%) |
| 3 or 4 Children | 0 (0.0%) | 0 (0.0%) |
| 5 or more Children | 0 (0.0%) | 0 (0.0%) |
| Total | 0 (0.0%) | 0 (0.0%) |
Income Below Poverty Among Married-Couple vs Single-Parent Households in Foots Creek
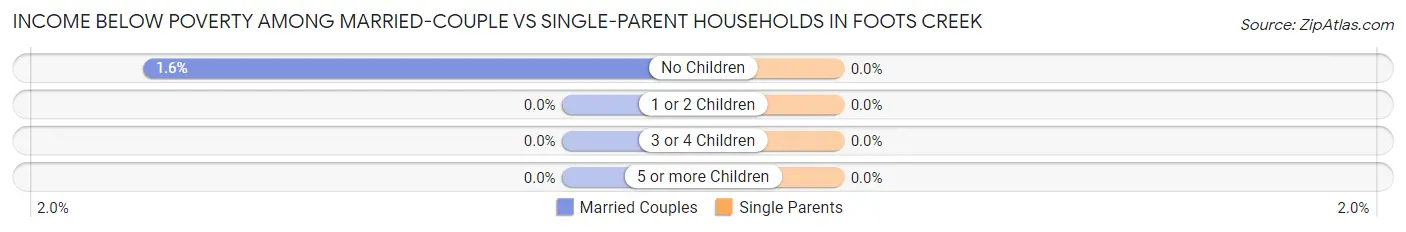
| Children | Married-Couple Families | Single-Parent Households |
| No Children | 4 (1.6%) | 0 (0.0%) |
| 1 or 2 Children | 0 (0.0%) | 0 (0.0%) |
| 3 or 4 Children | 0 (0.0%) | 0 (0.0%) |
| 5 or more Children | 0 (0.0%) | 0 (0.0%) |
| Total | 4 (1.5%) | 0 (0.0%) |
Employment Characteristics in Foots Creek
Employment by Class of Employer in Foots Creek
Among the 347 employed individuals in Foots Creek, private company employees (212 | 61.1%), not-for-profit organizations (49 | 14.1%), and federal government employees (37 | 10.7%) make up the most common classes of employment.
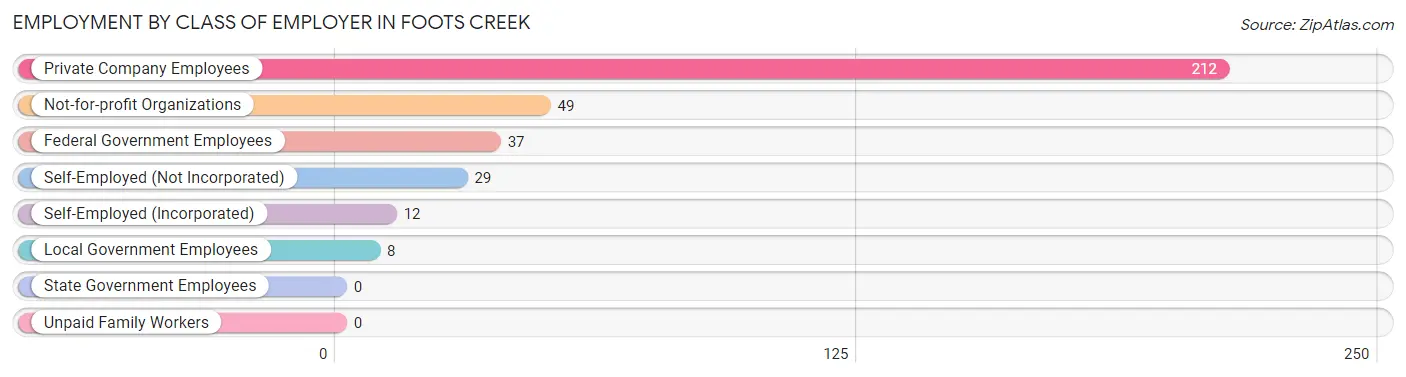
| Employer Class | # Employees | % Employees |
| Private Company Employees | 212 | 61.1% |
| Self-Employed (Incorporated) | 12 | 3.5% |
| Self-Employed (Not Incorporated) | 29 | 8.4% |
| Not-for-profit Organizations | 49 | 14.1% |
| Local Government Employees | 8 | 2.3% |
| State Government Employees | 0 | 0.0% |
| Federal Government Employees | 37 | 10.7% |
| Unpaid Family Workers | 0 | 0.0% |
| Total | 347 | 100.0% |
Employment Status by Age in Foots Creek
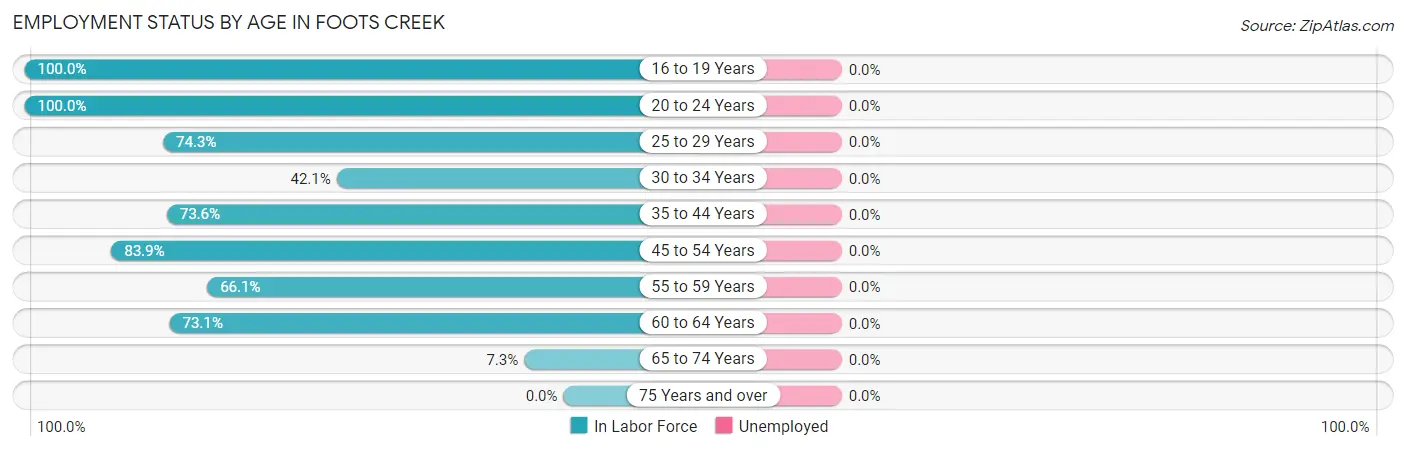
| Age Bracket | In Labor Force | Unemployed |
| 16 to 19 Years | 21 (100.0%) | 0 (0.0%) |
| 20 to 24 Years | 12 (100.0%) | 0 (0.0%) |
| 25 to 29 Years | 26 (74.3%) | 0 (0.0%) |
| 30 to 34 Years | 16 (42.1%) | 0 (0.0%) |
| 35 to 44 Years | 81 (73.6%) | 0 (0.0%) |
| 45 to 54 Years | 47 (83.9%) | 0 (0.0%) |
| 55 to 59 Years | 72 (66.1%) | 0 (0.0%) |
| 60 to 64 Years | 49 (73.1%) | 0 (0.0%) |
| 65 to 74 Years | 23 (7.3%) | 0 (0.0%) |
| 75 Years and over | 0 (0.0%) | 0 (0.0%) |
| Total | 347 (41.3%) | 0 (0.0%) |
Employment Status by Educational Attainment in Foots Creek
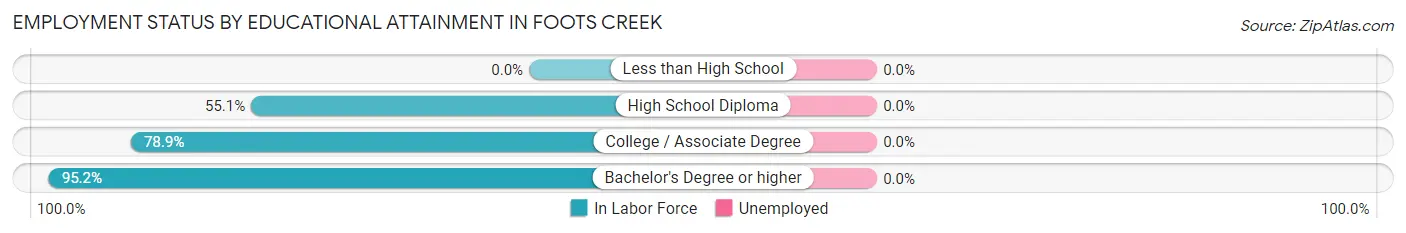
| Educational Attainment | In Labor Force | Unemployed |
| Less than High School | 0 (0.0%) | 0 (0.0%) |
| High School Diploma | 54 (55.1%) | 0 (0.0%) |
| College / Associate Degree | 157 (78.9%) | 0 (0.0%) |
| Bachelor's Degree or higher | 80 (95.2%) | 0 (0.0%) |
| Total | 291 (70.1%) | 0 (0.0%) |
Employment Occupations by Sex in Foots Creek
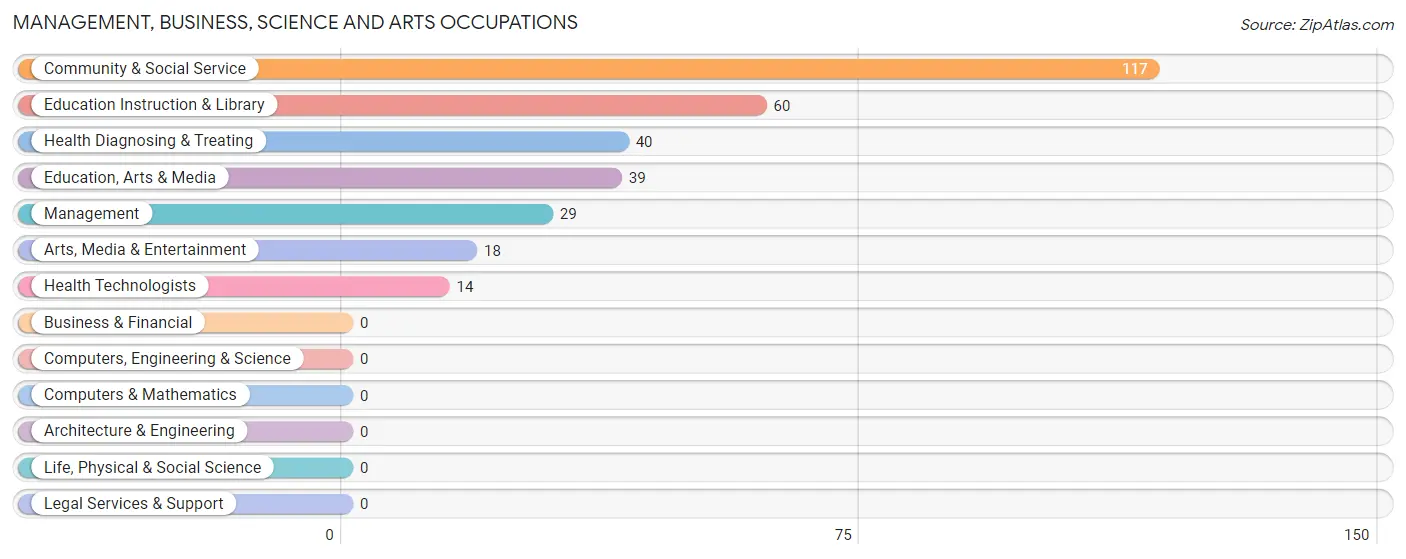
Management, Business, Science and Arts Occupations
The most common Management, Business, Science and Arts occupations in Foots Creek are Community & Social Service (117 | 33.7%), Education Instruction & Library (60 | 17.3%), Health Diagnosing & Treating (40 | 11.5%), Education, Arts & Media (39 | 11.2%), and Management (29 | 8.4%).
Management, Business, Science and Arts Occupations by Sex
Within the Management, Business, Science and Arts occupations in Foots Creek, the most male-oriented occupations are Management (100.0%), Arts, Media & Entertainment (100.0%), and Community & Social Service (15.4%), while the most female-oriented occupations are Education, Arts & Media (100.0%), Education Instruction & Library (100.0%), and Health Diagnosing & Treating (100.0%).
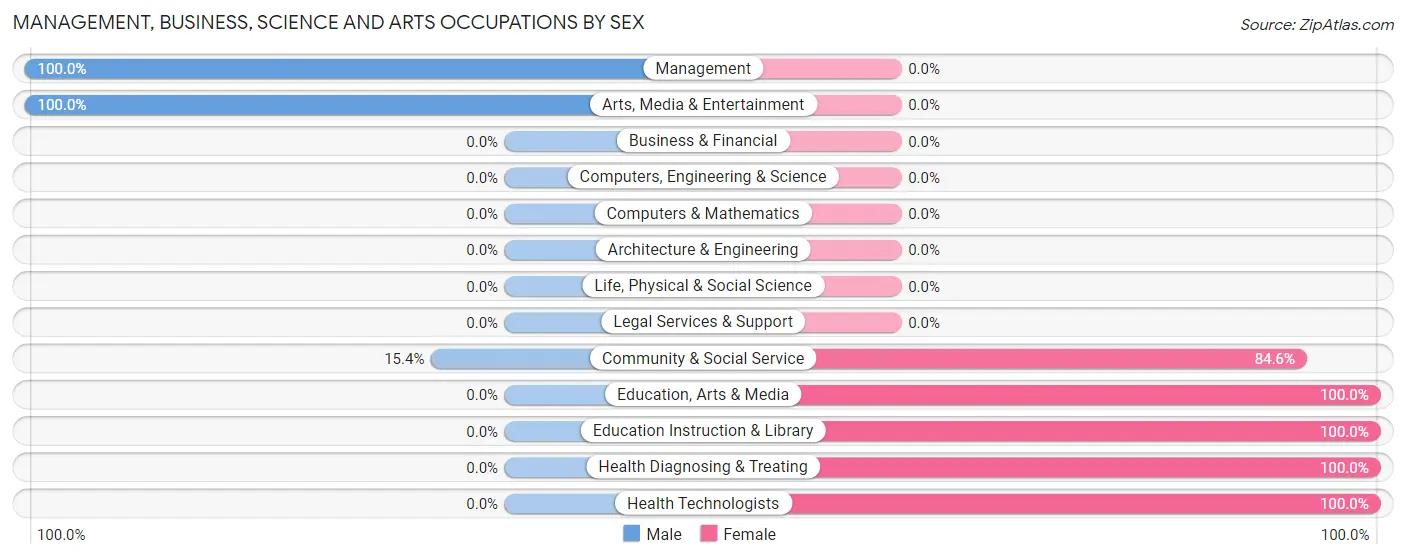
| Occupation | Male | Female |
| Management | 29 (100.0%) | 0 (0.0%) |
| Business & Financial | 0 (0.0%) | 0 (0.0%) |
| Computers, Engineering & Science | 0 (0.0%) | 0 (0.0%) |
| Computers & Mathematics | 0 (0.0%) | 0 (0.0%) |
| Architecture & Engineering | 0 (0.0%) | 0 (0.0%) |
| Life, Physical & Social Science | 0 (0.0%) | 0 (0.0%) |
| Community & Social Service | 18 (15.4%) | 99 (84.6%) |
| Education, Arts & Media | 0 (0.0%) | 39 (100.0%) |
| Legal Services & Support | 0 (0.0%) | 0 (0.0%) |
| Education Instruction & Library | 0 (0.0%) | 60 (100.0%) |
| Arts, Media & Entertainment | 18 (100.0%) | 0 (0.0%) |
| Health Diagnosing & Treating | 0 (0.0%) | 40 (100.0%) |
| Health Technologists | 0 (0.0%) | 14 (100.0%) |
| Total (Category) | 47 (25.3%) | 139 (74.7%) |
| Total (Overall) | 166 (47.8%) | 181 (52.2%) |
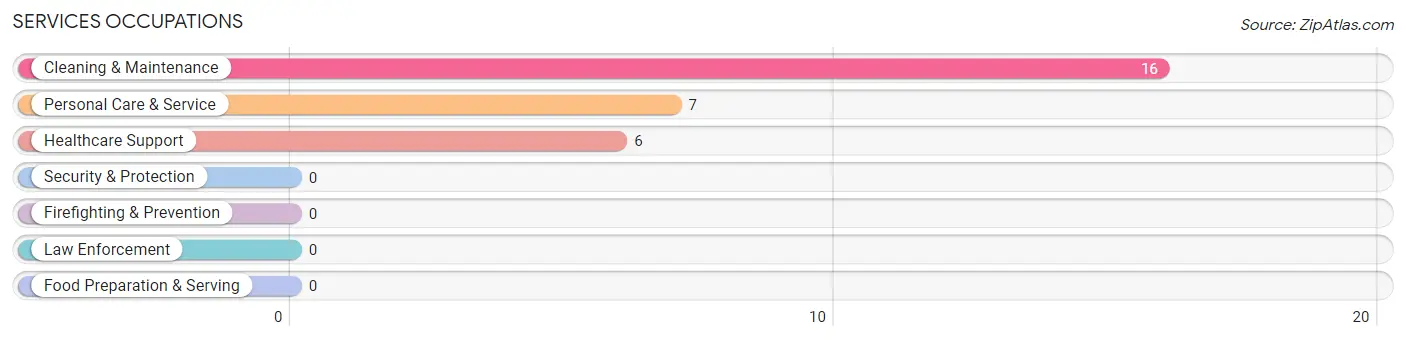
Services Occupations
The most common Services occupations in Foots Creek are Cleaning & Maintenance (16 | 4.6%), Personal Care & Service (7 | 2.0%), and Healthcare Support (6 | 1.7%).
Services Occupations by Sex
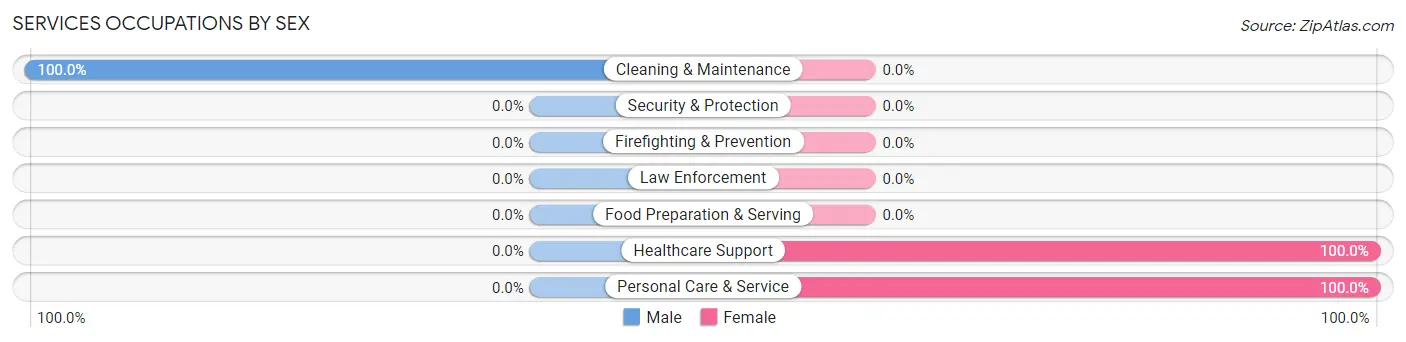
| Occupation | Male | Female |
| Healthcare Support | 0 (0.0%) | 6 (100.0%) |
| Security & Protection | 0 (0.0%) | 0 (0.0%) |
| Firefighting & Prevention | 0 (0.0%) | 0 (0.0%) |
| Law Enforcement | 0 (0.0%) | 0 (0.0%) |
| Food Preparation & Serving | 0 (0.0%) | 0 (0.0%) |
| Cleaning & Maintenance | 16 (100.0%) | 0 (0.0%) |
| Personal Care & Service | 0 (0.0%) | 7 (100.0%) |
| Total (Category) | 16 (55.2%) | 13 (44.8%) |
| Total (Overall) | 166 (47.8%) | 181 (52.2%) |
Sales and Office Occupations
The most common Sales and Office occupations in Foots Creek are Sales & Related (38 | 11.0%), and Office & Administration (24 | 6.9%).
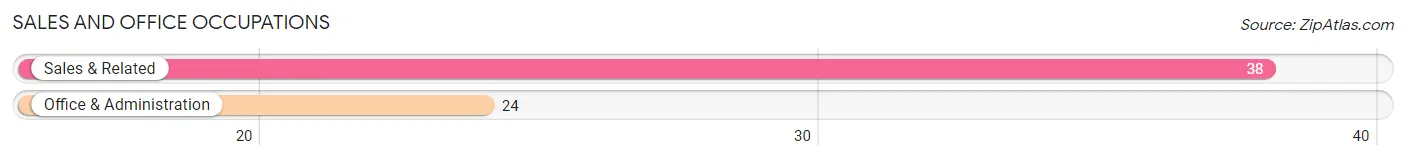
Sales and Office Occupations by Sex
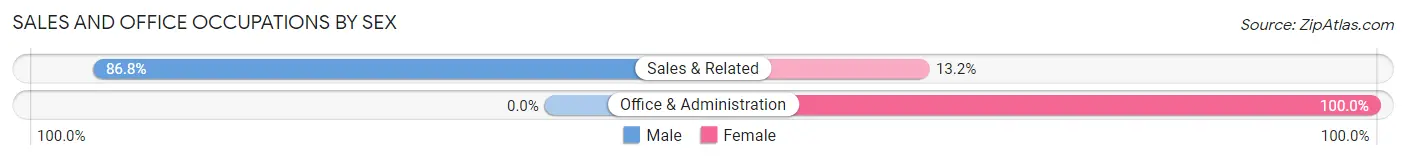
| Occupation | Male | Female |
| Sales & Related | 33 (86.8%) | 5 (13.2%) |
| Office & Administration | 0 (0.0%) | 24 (100.0%) |
| Total (Category) | 33 (53.2%) | 29 (46.8%) |
| Total (Overall) | 166 (47.8%) | 181 (52.2%) |
Natural Resources, Construction and Maintenance Occupations
The most common Natural Resources, Construction and Maintenance occupations in Foots Creek are , and Construction & Extraction (58 | 16.7%).
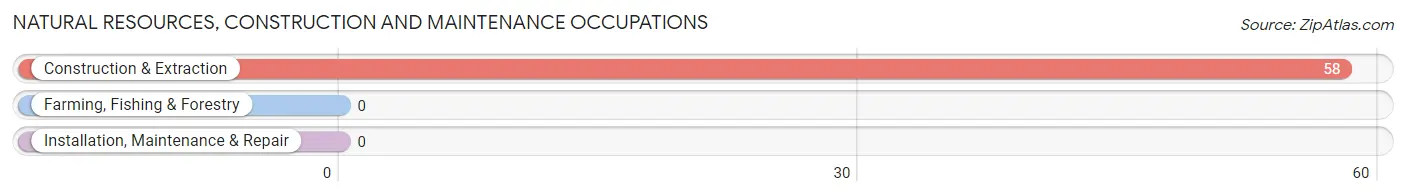
Natural Resources, Construction and Maintenance Occupations by Sex
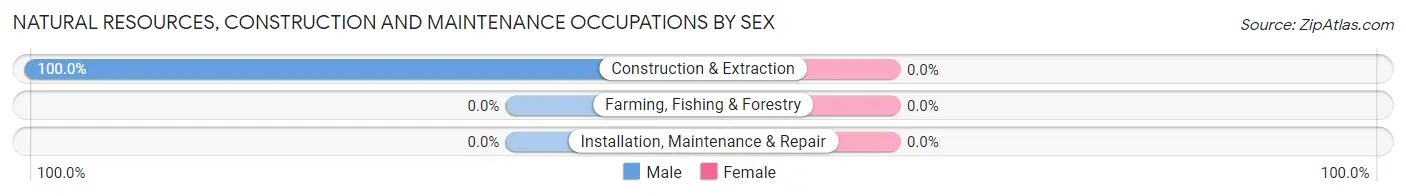
| Occupation | Male | Female |
| Farming, Fishing & Forestry | 0 (0.0%) | 0 (0.0%) |
| Construction & Extraction | 58 (100.0%) | 0 (0.0%) |
| Installation, Maintenance & Repair | 0 (0.0%) | 0 (0.0%) |
| Total (Category) | 58 (100.0%) | 0 (0.0%) |
| Total (Overall) | 166 (47.8%) | 181 (52.2%) |
Production, Transportation and Moving Occupations
The most common Production, Transportation and Moving occupations in Foots Creek are , and Production (12 | 3.5%).
Production, Transportation and Moving Occupations by Sex
| Occupation | Male | Female |
| Production | 12 (100.0%) | 0 (0.0%) |
| Transportation | 0 (0.0%) | 0 (0.0%) |
| Material Moving | 0 (0.0%) | 0 (0.0%) |
| Total (Category) | 12 (100.0%) | 0 (0.0%) |
| Total (Overall) | 166 (47.8%) | 181 (52.2%) |
Employment Industries by Sex in Foots Creek
Employment Industries in Foots Creek
The major employment industries in Foots Creek include Health Care & Social Assistance (117 | 33.7%), Construction (41 | 11.8%), Manufacturing (34 | 9.8%), Retail Trade (33 | 9.5%), and Educational Services (23 | 6.6%).
Employment Industries by Sex in Foots Creek
The Foots Creek industries that see more men than women are Construction (100.0%), Manufacturing (100.0%), and Retail Trade (100.0%), whereas the industries that tend to have a higher number of women are Finance & Insurance (100.0%), Professional & Scientific (100.0%), and Educational Services (100.0%).
| Industry | Male | Female |
| Agriculture, Fishing & Hunting | 0 (0.0%) | 0 (0.0%) |
| Mining, Quarrying, & Extraction | 0 (0.0%) | 0 (0.0%) |
| Construction | 41 (100.0%) | 0 (0.0%) |
| Manufacturing | 34 (100.0%) | 0 (0.0%) |
| Wholesale Trade | 0 (0.0%) | 0 (0.0%) |
| Retail Trade | 33 (100.0%) | 0 (0.0%) |
| Transportation & Warehousing | 0 (0.0%) | 0 (0.0%) |
| Utilities | 0 (0.0%) | 0 (0.0%) |
| Information | 0 (0.0%) | 0 (0.0%) |
| Finance & Insurance | 0 (0.0%) | 5 (100.0%) |
| Real Estate, Rental & Leasing | 16 (100.0%) | 0 (0.0%) |
| Professional & Scientific | 0 (0.0%) | 11 (100.0%) |
| Enterprise Management | 0 (0.0%) | 0 (0.0%) |
| Administrative & Support | 0 (0.0%) | 0 (0.0%) |
| Educational Services | 0 (0.0%) | 23 (100.0%) |
| Health Care & Social Assistance | 9 (7.7%) | 108 (92.3%) |
| Arts, Entertainment & Recreation | 0 (0.0%) | 7 (100.0%) |
| Accommodation & Food Services | 21 (100.0%) | 0 (0.0%) |
| Public Administration | 0 (0.0%) | 0 (0.0%) |
| Total | 166 (47.8%) | 181 (52.2%) |
Education in Foots Creek
School Enrollment in Foots Creek
The most common levels of schooling among the 106 students in Foots Creek are middle school (65 | 61.3%), college / undergraduate (21 | 19.8%), and elementary school (20 | 18.9%).
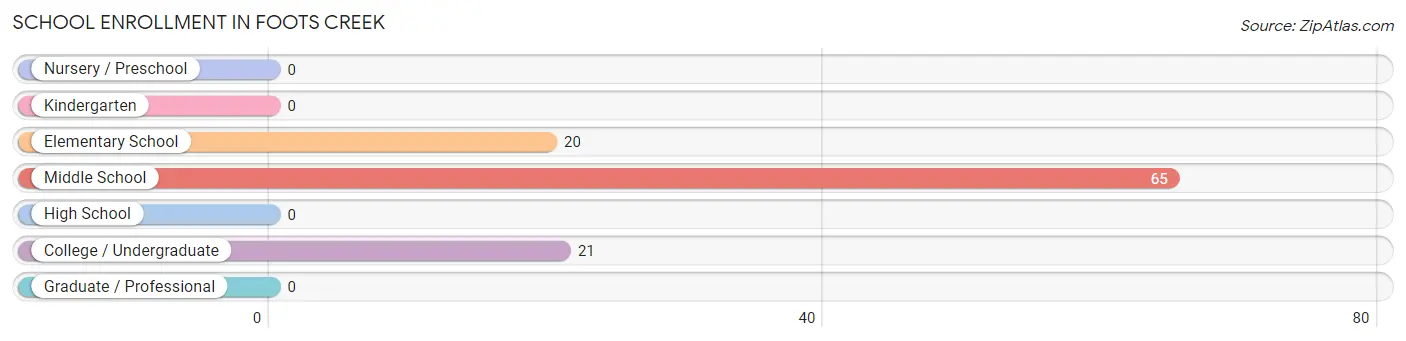
| School Level | # Students | % Students |
| Nursery / Preschool | 0 | 0.0% |
| Kindergarten | 0 | 0.0% |
| Elementary School | 20 | 18.9% |
| Middle School | 65 | 61.3% |
| High School | 0 | 0.0% |
| College / Undergraduate | 21 | 19.8% |
| Graduate / Professional | 0 | 0.0% |
| Total | 106 | 100.0% |
School Enrollment by Age by Funding Source in Foots Creek
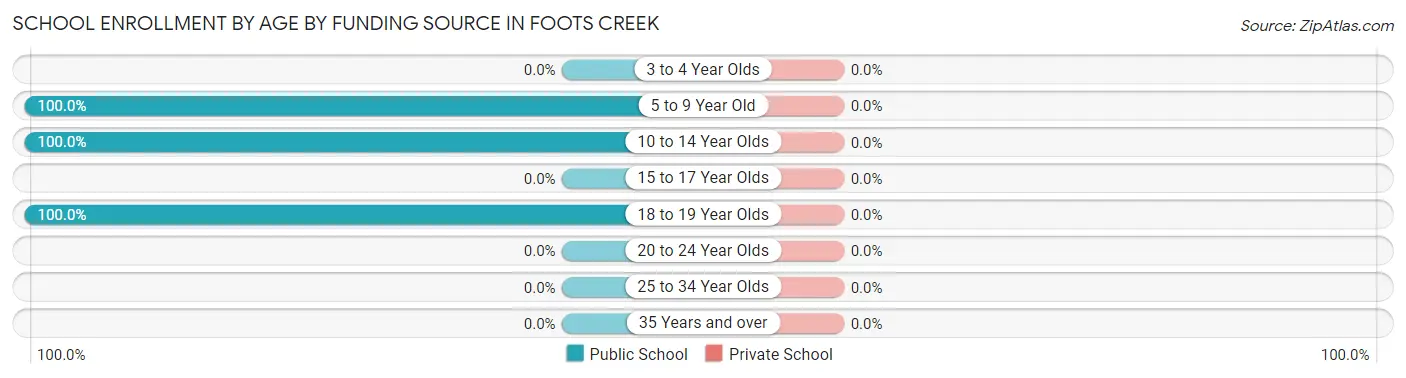
| Age Bracket | Public School | Private School |
| 3 to 4 Year Olds | 0 (0.0%) | 0 (0.0%) |
| 5 to 9 Year Old | 20 (100.0%) | 0 (0.0%) |
| 10 to 14 Year Olds | 65 (100.0%) | 0 (0.0%) |
| 15 to 17 Year Olds | 0 (0.0%) | 0 (0.0%) |
| 18 to 19 Year Olds | 21 (100.0%) | 0 (0.0%) |
| 20 to 24 Year Olds | 0 (0.0%) | 0 (0.0%) |
| 25 to 34 Year Olds | 0 (0.0%) | 0 (0.0%) |
| 35 Years and over | 0 (0.0%) | 0 (0.0%) |
| Total | 106 (100.0%) | 0 (0.0%) |
Educational Attainment by Field of Study in Foots Creek
Psychology (39 | 26.4%), bio, nature & agricultural (34 | 23.0%), science & technology (26 | 17.6%), education (18 | 12.2%), and liberal arts & history (10 | 6.8%) are the most common fields of study among 148 individuals in Foots Creek who have obtained a bachelor's degree or higher.
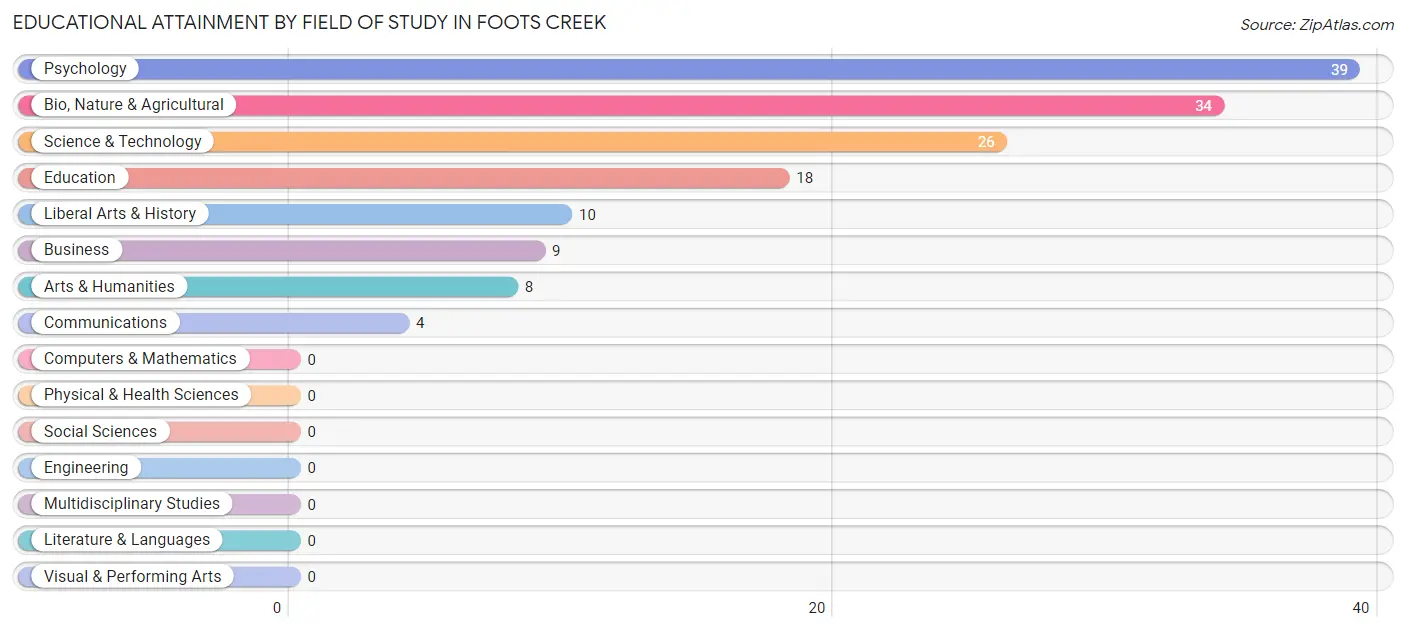
| Field of Study | # Graduates | % Graduates |
| Computers & Mathematics | 0 | 0.0% |
| Bio, Nature & Agricultural | 34 | 23.0% |
| Physical & Health Sciences | 0 | 0.0% |
| Psychology | 39 | 26.4% |
| Social Sciences | 0 | 0.0% |
| Engineering | 0 | 0.0% |
| Multidisciplinary Studies | 0 | 0.0% |
| Science & Technology | 26 | 17.6% |
| Business | 9 | 6.1% |
| Education | 18 | 12.2% |
| Literature & Languages | 0 | 0.0% |
| Liberal Arts & History | 10 | 6.8% |
| Visual & Performing Arts | 0 | 0.0% |
| Communications | 4 | 2.7% |
| Arts & Humanities | 8 | 5.4% |
| Total | 148 | 100.0% |
Transportation & Commute in Foots Creek
Vehicle Availability by Sex in Foots Creek
The most prevalent vehicle ownership categories in Foots Creek are males with 2 vehicles (96, accounting for 57.8%) and females with 2 vehicles (74, making up 53.0%).
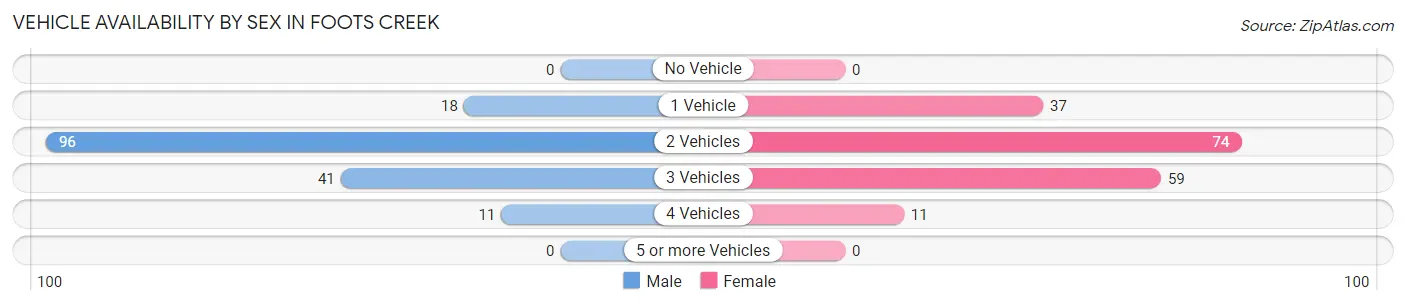
| Vehicles Available | Male | Female |
| No Vehicle | 0 (0.0%) | 0 (0.0%) |
| 1 Vehicle | 18 (10.8%) | 37 (20.4%) |
| 2 Vehicles | 96 (57.8%) | 74 (40.9%) |
| 3 Vehicles | 41 (24.7%) | 59 (32.6%) |
| 4 Vehicles | 11 (6.6%) | 11 (6.1%) |
| 5 or more Vehicles | 0 (0.0%) | 0 (0.0%) |
| Total | 166 (100.0%) | 181 (100.0%) |
Commute Time in Foots Creek
The most frequently occuring commute durations in Foots Creek are 30 to 34 minutes (86 commuters, 25.6%), 10 to 14 minutes (76 commuters, 22.6%), and 15 to 19 minutes (43 commuters, 12.8%).
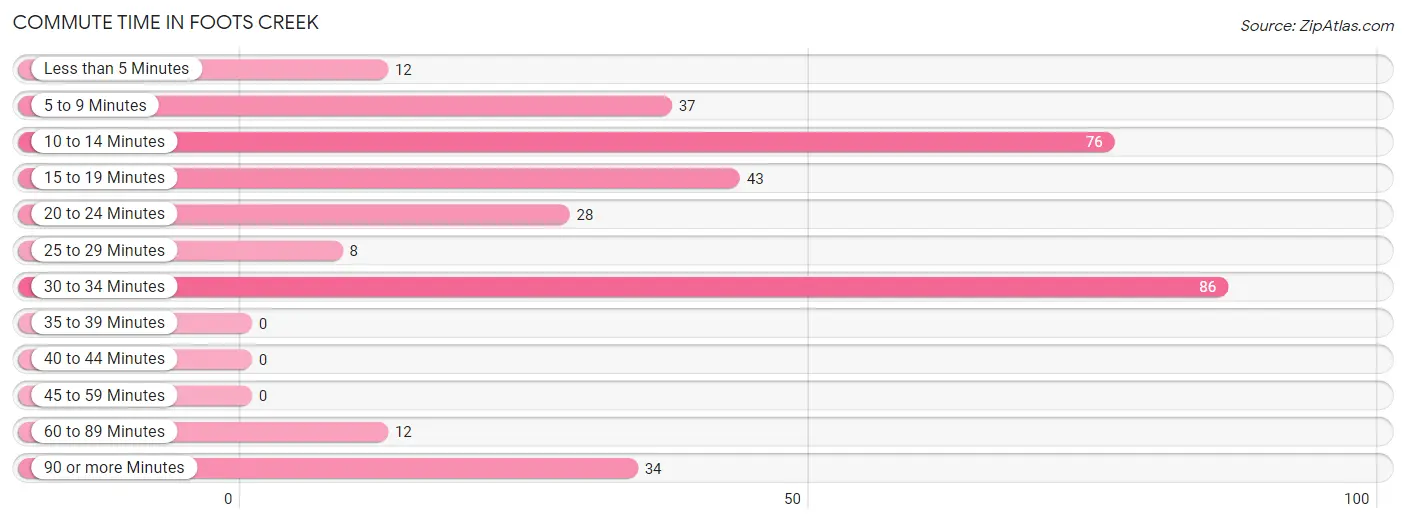
| Commute Time | # Commuters | % Commuters |
| Less than 5 Minutes | 12 | 3.6% |
| 5 to 9 Minutes | 37 | 11.0% |
| 10 to 14 Minutes | 76 | 22.6% |
| 15 to 19 Minutes | 43 | 12.8% |
| 20 to 24 Minutes | 28 | 8.3% |
| 25 to 29 Minutes | 8 | 2.4% |
| 30 to 34 Minutes | 86 | 25.6% |
| 35 to 39 Minutes | 0 | 0.0% |
| 40 to 44 Minutes | 0 | 0.0% |
| 45 to 59 Minutes | 0 | 0.0% |
| 60 to 89 Minutes | 12 | 3.6% |
| 90 or more Minutes | 34 | 10.1% |
Commute Time by Sex in Foots Creek
The most common commute times in Foots Creek are 10 to 14 minutes (76 commuters, 45.8%) for males and 30 to 34 minutes (67 commuters, 39.4%) for females.
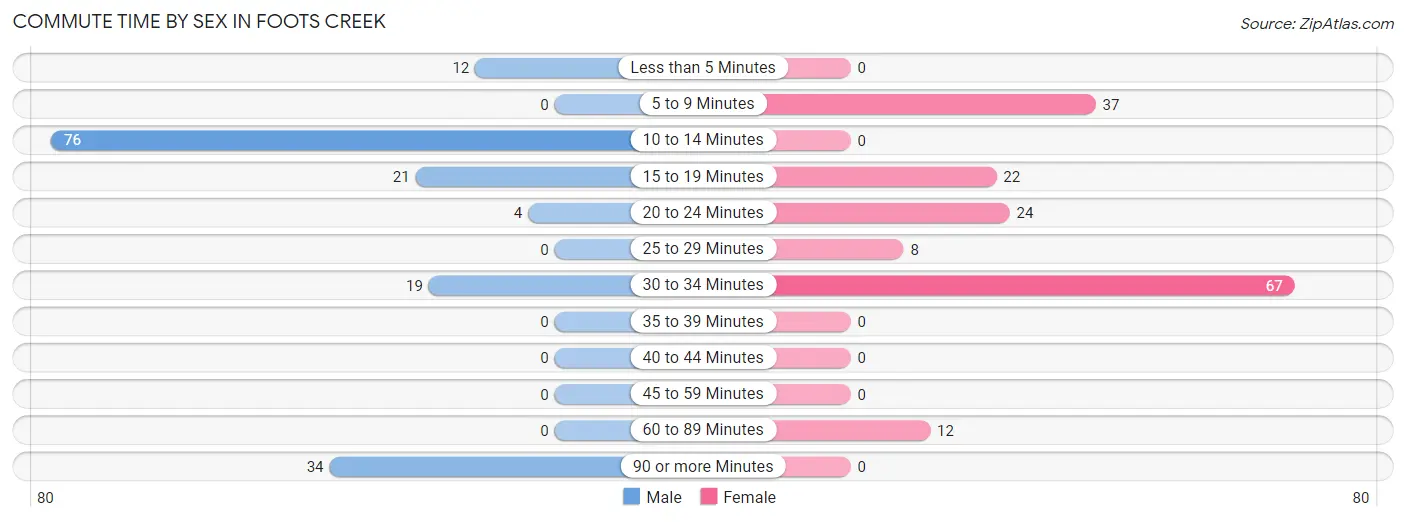
| Commute Time | Male | Female |
| Less than 5 Minutes | 12 (7.2%) | 0 (0.0%) |
| 5 to 9 Minutes | 0 (0.0%) | 37 (21.8%) |
| 10 to 14 Minutes | 76 (45.8%) | 0 (0.0%) |
| 15 to 19 Minutes | 21 (12.7%) | 22 (12.9%) |
| 20 to 24 Minutes | 4 (2.4%) | 24 (14.1%) |
| 25 to 29 Minutes | 0 (0.0%) | 8 (4.7%) |
| 30 to 34 Minutes | 19 (11.5%) | 67 (39.4%) |
| 35 to 39 Minutes | 0 (0.0%) | 0 (0.0%) |
| 40 to 44 Minutes | 0 (0.0%) | 0 (0.0%) |
| 45 to 59 Minutes | 0 (0.0%) | 0 (0.0%) |
| 60 to 89 Minutes | 0 (0.0%) | 12 (7.1%) |
| 90 or more Minutes | 34 (20.5%) | 0 (0.0%) |
Time of Departure to Work by Sex in Foots Creek
The most frequent times of departure to work in Foots Creek are 5:30 AM to 5:59 AM (47, 28.3%) for males and 7:00 AM to 7:29 AM (60, 35.3%) for females.
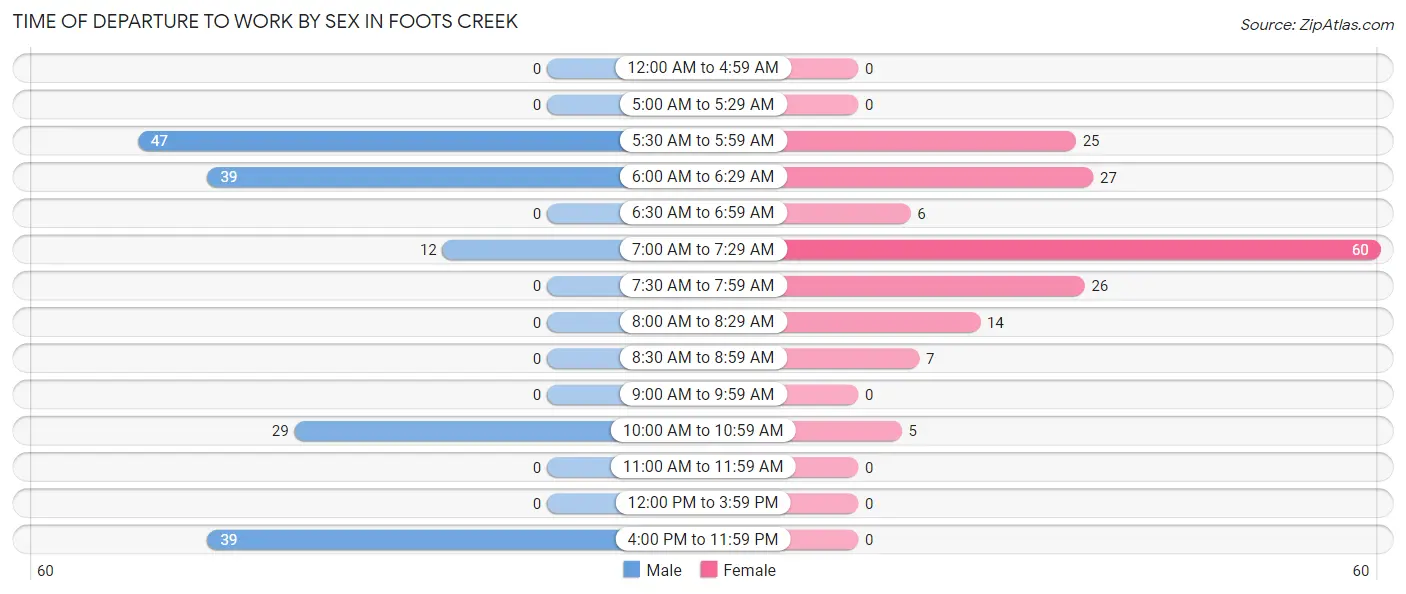
| Time of Departure | Male | Female |
| 12:00 AM to 4:59 AM | 0 (0.0%) | 0 (0.0%) |
| 5:00 AM to 5:29 AM | 0 (0.0%) | 0 (0.0%) |
| 5:30 AM to 5:59 AM | 47 (28.3%) | 25 (14.7%) |
| 6:00 AM to 6:29 AM | 39 (23.5%) | 27 (15.9%) |
| 6:30 AM to 6:59 AM | 0 (0.0%) | 6 (3.5%) |
| 7:00 AM to 7:29 AM | 12 (7.2%) | 60 (35.3%) |
| 7:30 AM to 7:59 AM | 0 (0.0%) | 26 (15.3%) |
| 8:00 AM to 8:29 AM | 0 (0.0%) | 14 (8.2%) |
| 8:30 AM to 8:59 AM | 0 (0.0%) | 7 (4.1%) |
| 9:00 AM to 9:59 AM | 0 (0.0%) | 0 (0.0%) |
| 10:00 AM to 10:59 AM | 29 (17.5%) | 5 (2.9%) |
| 11:00 AM to 11:59 AM | 0 (0.0%) | 0 (0.0%) |
| 12:00 PM to 3:59 PM | 0 (0.0%) | 0 (0.0%) |
| 4:00 PM to 11:59 PM | 39 (23.5%) | 0 (0.0%) |
| Total | 166 (100.0%) | 170 (100.0%) |
Housing Occupancy in Foots Creek
Occupancy by Ownership in Foots Creek
Of the total 426 dwellings in Foots Creek, owner-occupied units account for 342 (80.3%), while renter-occupied units make up 84 (19.7%).
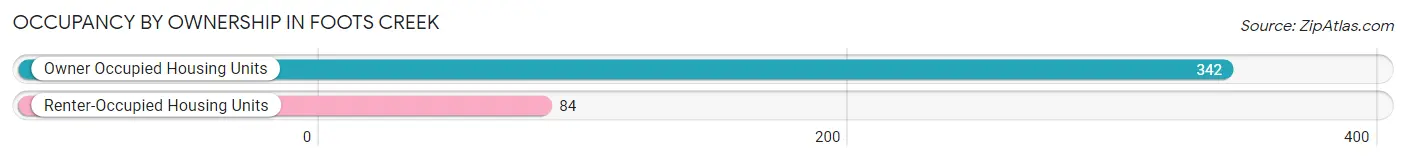
| Occupancy | # Housing Units | % Housing Units |
| Owner Occupied Housing Units | 342 | 80.3% |
| Renter-Occupied Housing Units | 84 | 19.7% |
| Total Occupied Housing Units | 426 | 100.0% |
Occupancy by Household Size in Foots Creek
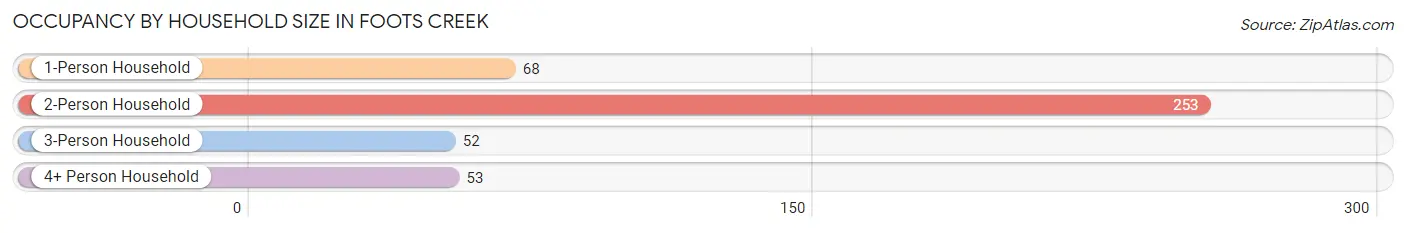
| Household Size | # Housing Units | % Housing Units |
| 1-Person Household | 68 | 16.0% |
| 2-Person Household | 253 | 59.4% |
| 3-Person Household | 52 | 12.2% |
| 4+ Person Household | 53 | 12.4% |
| Total Housing Units | 426 | 100.0% |
Occupancy by Ownership by Household Size in Foots Creek
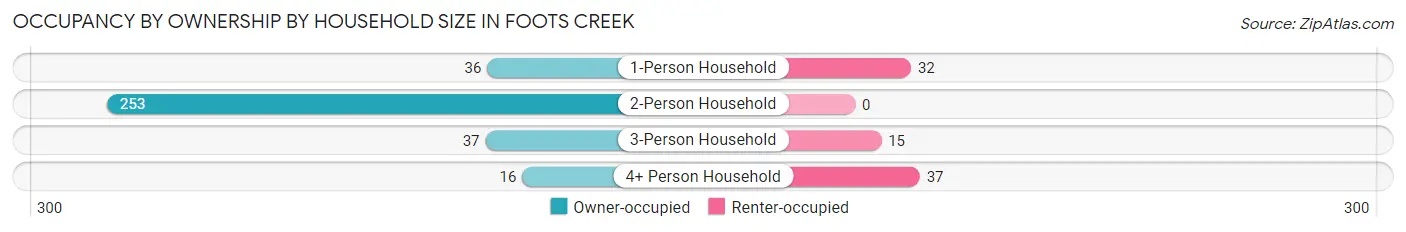
| Household Size | Owner-occupied | Renter-occupied |
| 1-Person Household | 36 (52.9%) | 32 (47.1%) |
| 2-Person Household | 253 (100.0%) | 0 (0.0%) |
| 3-Person Household | 37 (71.2%) | 15 (28.8%) |
| 4+ Person Household | 16 (30.2%) | 37 (69.8%) |
| Total Housing Units | 342 (80.3%) | 84 (19.7%) |
Occupancy by Educational Attainment in Foots Creek
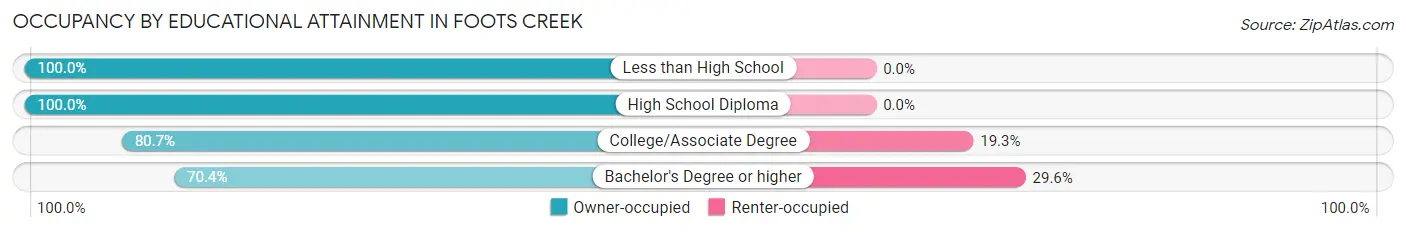
| Household Size | Owner-occupied | Renter-occupied |
| Less than High School | 16 (100.0%) | 0 (0.0%) |
| High School Diploma | 32 (100.0%) | 0 (0.0%) |
| College/Associate Degree | 218 (80.7%) | 52 (19.3%) |
| Bachelor's Degree or higher | 76 (70.4%) | 32 (29.6%) |
Occupancy by Age of Householder in Foots Creek
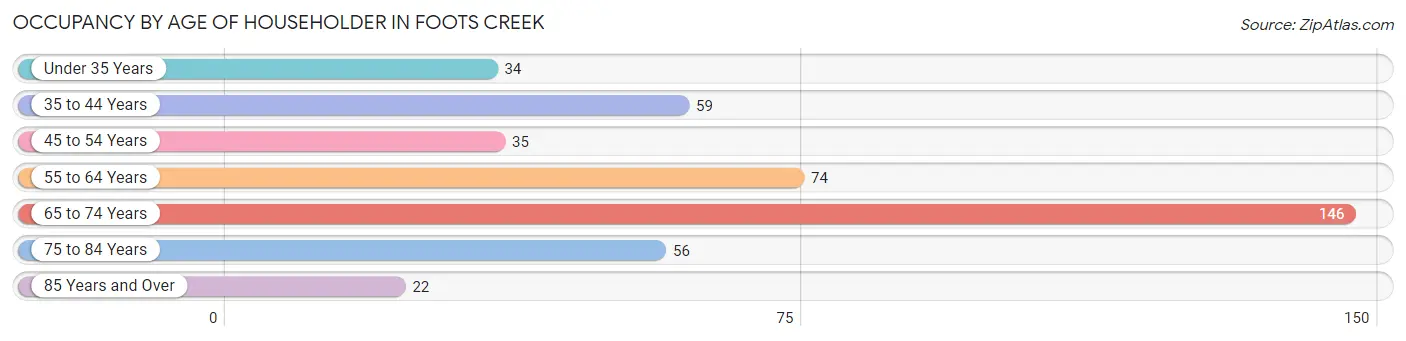
| Age Bracket | # Households | % Households |
| Under 35 Years | 34 | 8.0% |
| 35 to 44 Years | 59 | 13.9% |
| 45 to 54 Years | 35 | 8.2% |
| 55 to 64 Years | 74 | 17.4% |
| 65 to 74 Years | 146 | 34.3% |
| 75 to 84 Years | 56 | 13.2% |
| 85 Years and Over | 22 | 5.2% |
| Total | 426 | 100.0% |
Housing Finances in Foots Creek
Median Income by Occupancy in Foots Creek
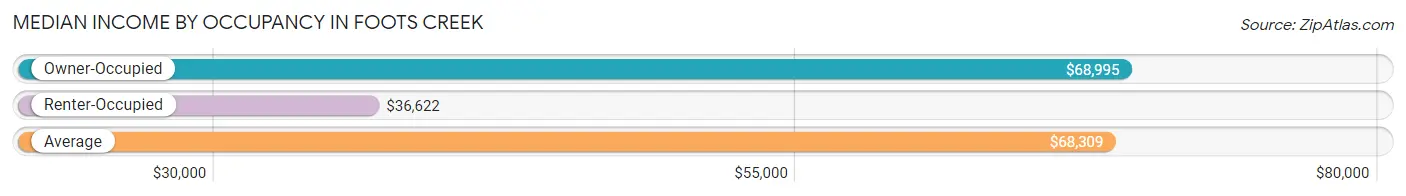
| Occupancy Type | # Households | Median Income |
| Owner-Occupied | 342 (80.3%) | $68,995 |
| Renter-Occupied | 84 (19.7%) | $36,622 |
| Average | 426 (100.0%) | $68,309 |
Occupancy by Householder Income Bracket in Foots Creek
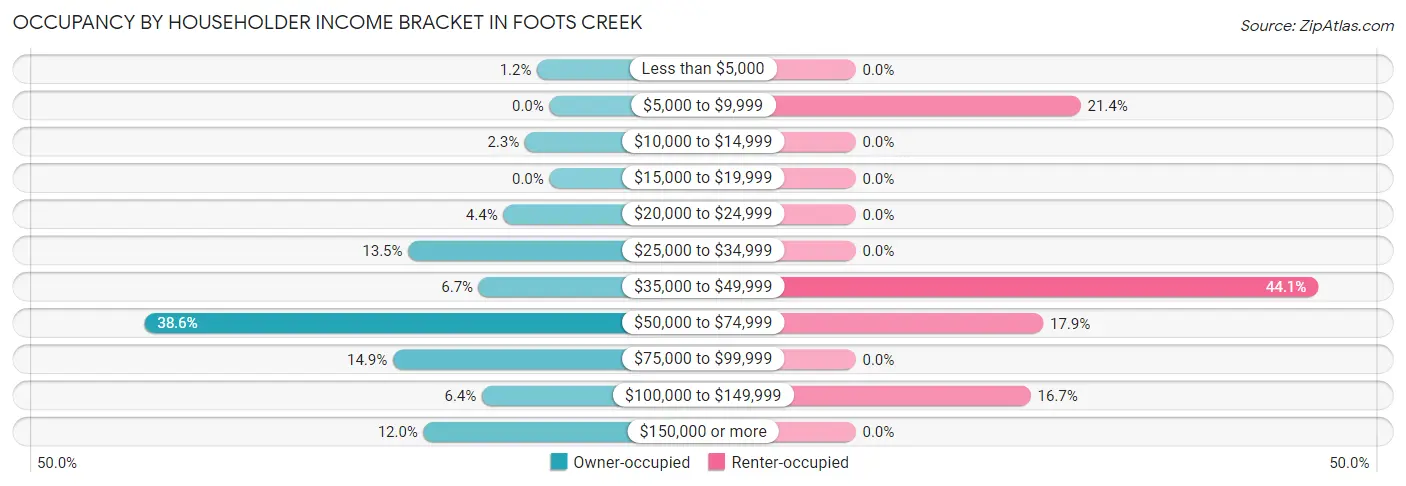
| Income Bracket | Owner-occupied | Renter-occupied |
| Less than $5,000 | 4 (1.2%) | 0 (0.0%) |
| $5,000 to $9,999 | 0 (0.0%) | 18 (21.4%) |
| $10,000 to $14,999 | 8 (2.3%) | 0 (0.0%) |
| $15,000 to $19,999 | 0 (0.0%) | 0 (0.0%) |
| $20,000 to $24,999 | 15 (4.4%) | 0 (0.0%) |
| $25,000 to $34,999 | 46 (13.5%) | 0 (0.0%) |
| $35,000 to $49,999 | 23 (6.7%) | 37 (44.1%) |
| $50,000 to $74,999 | 132 (38.6%) | 15 (17.9%) |
| $75,000 to $99,999 | 51 (14.9%) | 0 (0.0%) |
| $100,000 to $149,999 | 22 (6.4%) | 14 (16.7%) |
| $150,000 or more | 41 (12.0%) | 0 (0.0%) |
| Total | 342 (100.0%) | 84 (100.0%) |
Monthly Housing Cost Tiers in Foots Creek
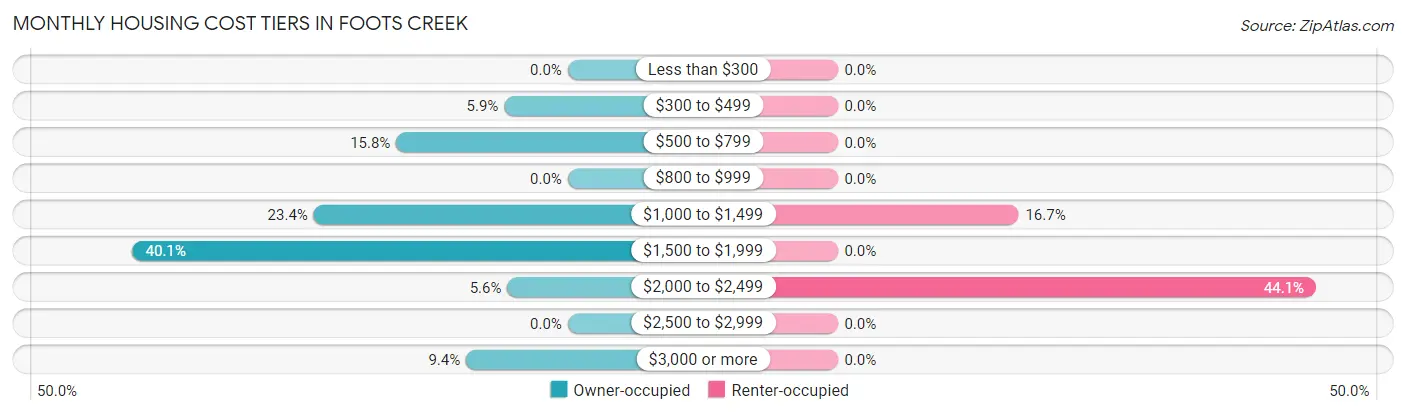
| Monthly Cost | Owner-occupied | Renter-occupied |
| Less than $300 | 0 (0.0%) | 0 (0.0%) |
| $300 to $499 | 20 (5.9%) | 0 (0.0%) |
| $500 to $799 | 54 (15.8%) | 0 (0.0%) |
| $800 to $999 | 0 (0.0%) | 0 (0.0%) |
| $1,000 to $1,499 | 80 (23.4%) | 14 (16.7%) |
| $1,500 to $1,999 | 137 (40.1%) | 0 (0.0%) |
| $2,000 to $2,499 | 19 (5.6%) | 37 (44.1%) |
| $2,500 to $2,999 | 0 (0.0%) | 0 (0.0%) |
| $3,000 or more | 32 (9.4%) | 0 (0.0%) |
| Total | 342 (100.0%) | 84 (100.0%) |
Physical Housing Characteristics in Foots Creek
Housing Structures in Foots Creek
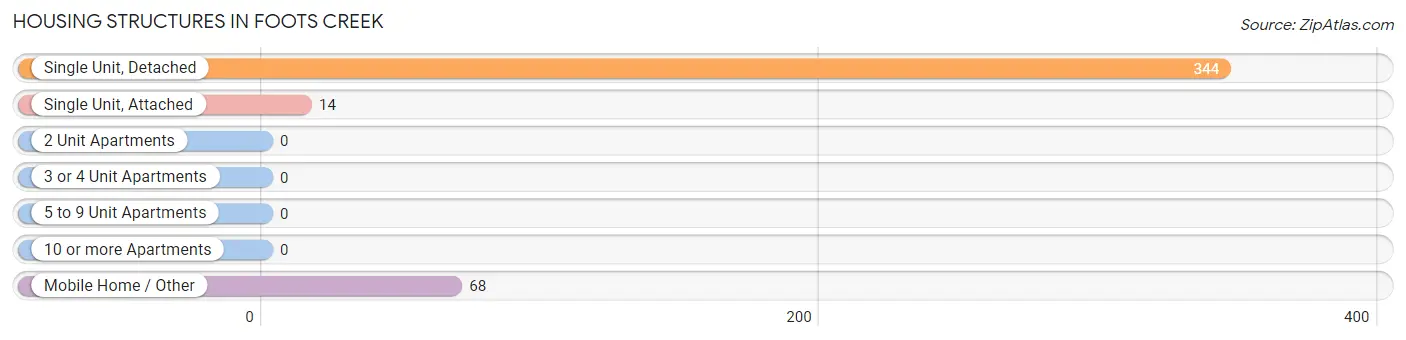
| Structure Type | # Housing Units | % Housing Units |
| Single Unit, Detached | 344 | 80.7% |
| Single Unit, Attached | 14 | 3.3% |
| 2 Unit Apartments | 0 | 0.0% |
| 3 or 4 Unit Apartments | 0 | 0.0% |
| 5 to 9 Unit Apartments | 0 | 0.0% |
| 10 or more Apartments | 0 | 0.0% |
| Mobile Home / Other | 68 | 16.0% |
| Total | 426 | 100.0% |
Housing Structures by Occupancy in Foots Creek
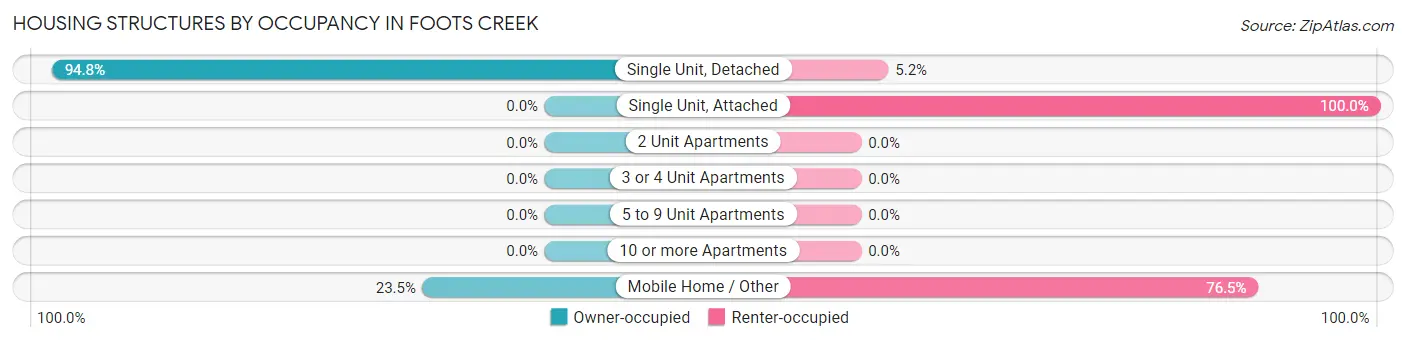
| Structure Type | Owner-occupied | Renter-occupied |
| Single Unit, Detached | 326 (94.8%) | 18 (5.2%) |
| Single Unit, Attached | 0 (0.0%) | 14 (100.0%) |
| 2 Unit Apartments | 0 (0.0%) | 0 (0.0%) |
| 3 or 4 Unit Apartments | 0 (0.0%) | 0 (0.0%) |
| 5 to 9 Unit Apartments | 0 (0.0%) | 0 (0.0%) |
| 10 or more Apartments | 0 (0.0%) | 0 (0.0%) |
| Mobile Home / Other | 16 (23.5%) | 52 (76.5%) |
| Total | 342 (80.3%) | 84 (19.7%) |
Housing Structures by Number of Rooms in Foots Creek
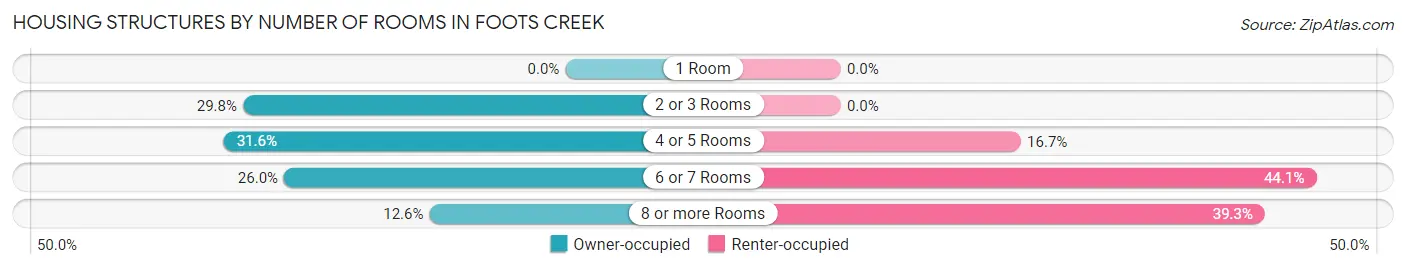
| Number of Rooms | Owner-occupied | Renter-occupied |
| 1 Room | 0 (0.0%) | 0 (0.0%) |
| 2 or 3 Rooms | 102 (29.8%) | 0 (0.0%) |
| 4 or 5 Rooms | 108 (31.6%) | 14 (16.7%) |
| 6 or 7 Rooms | 89 (26.0%) | 37 (44.1%) |
| 8 or more Rooms | 43 (12.6%) | 33 (39.3%) |
| Total | 342 (100.0%) | 84 (100.0%) |
Housing Structure by Heating Type in Foots Creek
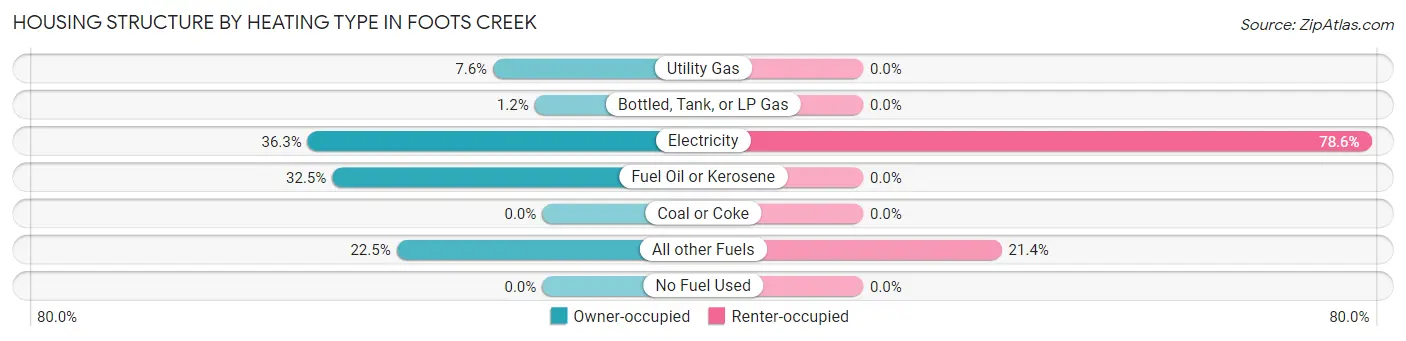
| Heating Type | Owner-occupied | Renter-occupied |
| Utility Gas | 26 (7.6%) | 0 (0.0%) |
| Bottled, Tank, or LP Gas | 4 (1.2%) | 0 (0.0%) |
| Electricity | 124 (36.3%) | 66 (78.6%) |
| Fuel Oil or Kerosene | 111 (32.5%) | 0 (0.0%) |
| Coal or Coke | 0 (0.0%) | 0 (0.0%) |
| All other Fuels | 77 (22.5%) | 18 (21.4%) |
| No Fuel Used | 0 (0.0%) | 0 (0.0%) |
| Total | 342 (100.0%) | 84 (100.0%) |
Household Vehicle Usage in Foots Creek
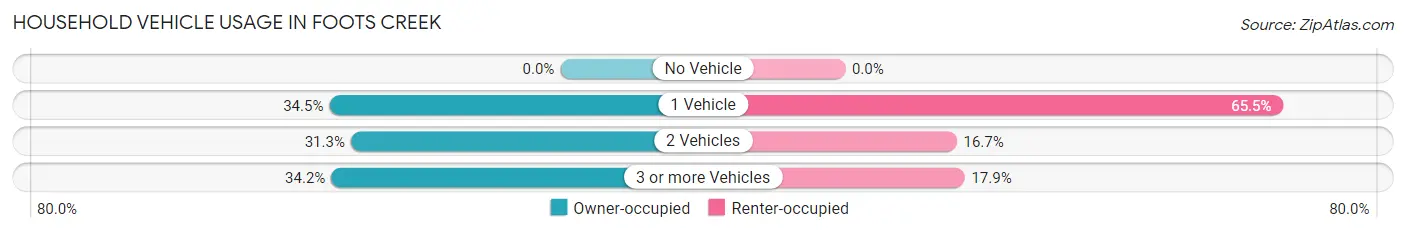
| Vehicles per Household | Owner-occupied | Renter-occupied |
| No Vehicle | 0 (0.0%) | 0 (0.0%) |
| 1 Vehicle | 118 (34.5%) | 55 (65.5%) |
| 2 Vehicles | 107 (31.3%) | 14 (16.7%) |
| 3 or more Vehicles | 117 (34.2%) | 15 (17.9%) |
| Total | 342 (100.0%) | 84 (100.0%) |
Real Estate & Mortgages in Foots Creek
Real Estate and Mortgage Overview in Foots Creek
| Characteristic | Without Mortgage | With Mortgage |
| Housing Units | 85 | 257 |
| Median Property Value | $761,400 | $427,100 |
| Median Household Income | - | - |
| Monthly Housing Costs | $605 | $32 |
| Real Estate Taxes | $4,045 | $0 |
Property Value by Mortgage Status in Foots Creek
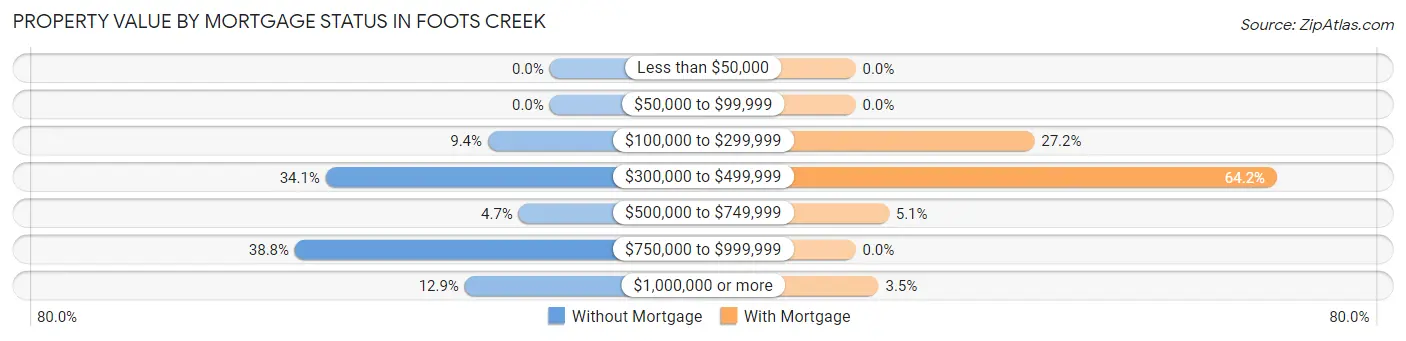
| Property Value | Without Mortgage | With Mortgage |
| Less than $50,000 | 0 (0.0%) | 0 (0.0%) |
| $50,000 to $99,999 | 0 (0.0%) | 0 (0.0%) |
| $100,000 to $299,999 | 8 (9.4%) | 70 (27.2%) |
| $300,000 to $499,999 | 29 (34.1%) | 165 (64.2%) |
| $500,000 to $749,999 | 4 (4.7%) | 13 (5.1%) |
| $750,000 to $999,999 | 33 (38.8%) | 0 (0.0%) |
| $1,000,000 or more | 11 (12.9%) | 9 (3.5%) |
| Total | 85 (100.0%) | 257 (100.0%) |
Household Income by Mortgage Status in Foots Creek
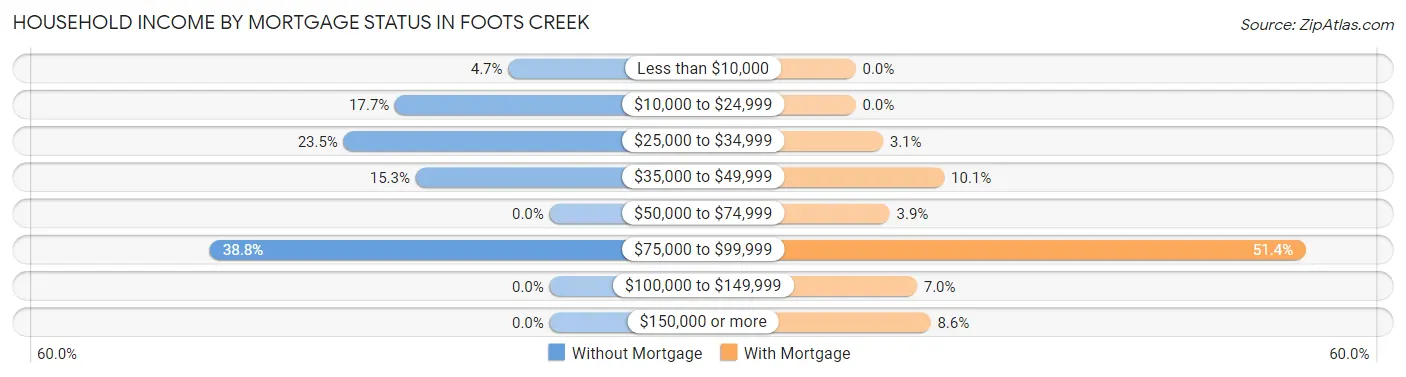
| Household Income | Without Mortgage | With Mortgage |
| Less than $10,000 | 4 (4.7%) | 0 (0.0%) |
| $10,000 to $24,999 | 15 (17.6%) | 0 (0.0%) |
| $25,000 to $34,999 | 20 (23.5%) | 8 (3.1%) |
| $35,000 to $49,999 | 13 (15.3%) | 26 (10.1%) |
| $50,000 to $74,999 | 0 (0.0%) | 10 (3.9%) |
| $75,000 to $99,999 | 33 (38.8%) | 132 (51.4%) |
| $100,000 to $149,999 | 0 (0.0%) | 18 (7.0%) |
| $150,000 or more | 0 (0.0%) | 22 (8.6%) |
| Total | 85 (100.0%) | 257 (100.0%) |
Property Value to Household Income Ratio in Foots Creek
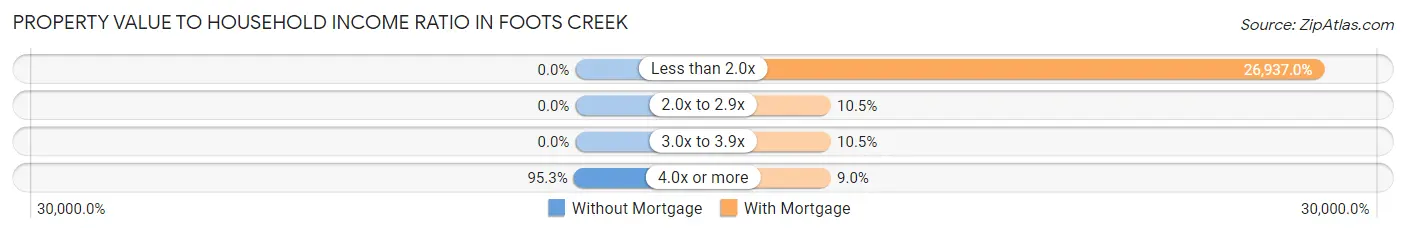
| Value-to-Income Ratio | Without Mortgage | With Mortgage |
| Less than 2.0x | 0 (0.0%) | 69,228 (26,937.0%) |
| 2.0x to 2.9x | 0 (0.0%) | 27 (10.5%) |
| 3.0x to 3.9x | 0 (0.0%) | 27 (10.5%) |
| 4.0x or more | 81 (95.3%) | 23 (8.9%) |
| Total | 85 (100.0%) | 257 (100.0%) |
Real Estate Taxes by Mortgage Status in Foots Creek
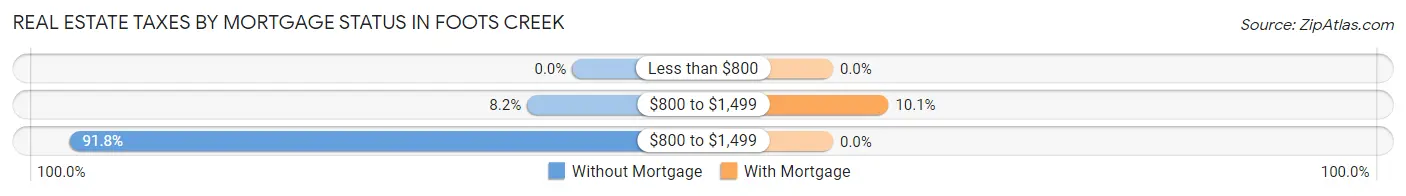
| Property Taxes | Without Mortgage | With Mortgage |
| Less than $800 | 0 (0.0%) | 0 (0.0%) |
| $800 to $1,499 | 7 (8.2%) | 26 (10.1%) |
| $800 to $1,499 | 78 (91.8%) | 0 (0.0%) |
| Total | 85 (100.0%) | 257 (100.0%) |
Health & Disability in Foots Creek
Health Insurance Coverage by Age in Foots Creek
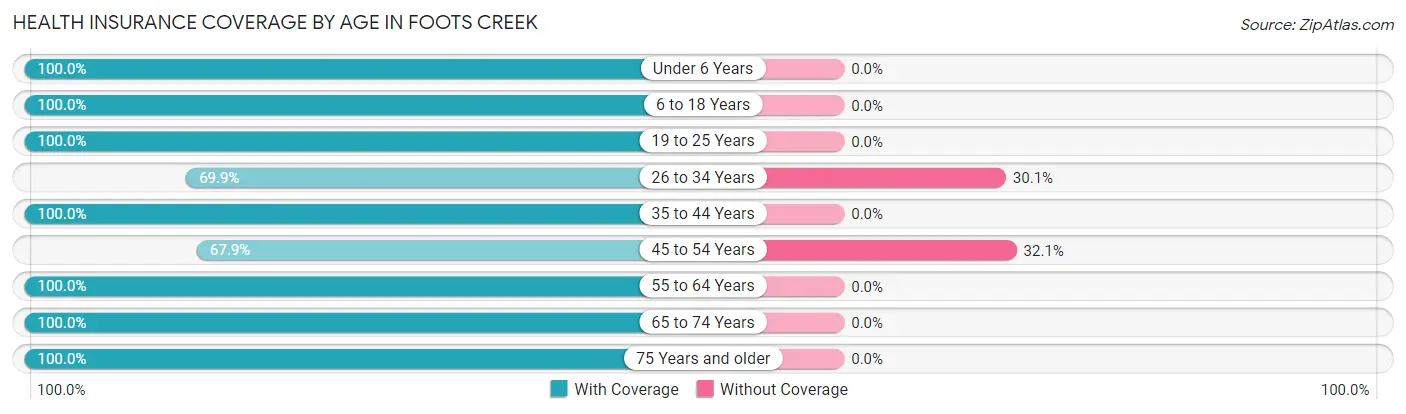
| Age Bracket | With Coverage | Without Coverage |
| Under 6 Years | 24 (100.0%) | 0 (0.0%) |
| 6 to 18 Years | 119 (100.0%) | 0 (0.0%) |
| 19 to 25 Years | 33 (100.0%) | 0 (0.0%) |
| 26 to 34 Years | 51 (69.9%) | 22 (30.1%) |
| 35 to 44 Years | 110 (100.0%) | 0 (0.0%) |
| 45 to 54 Years | 38 (67.9%) | 18 (32.1%) |
| 55 to 64 Years | 176 (100.0%) | 0 (0.0%) |
| 65 to 74 Years | 314 (100.0%) | 0 (0.0%) |
| 75 Years and older | 78 (100.0%) | 0 (0.0%) |
| Total | 943 (95.9%) | 40 (4.1%) |
Health Insurance Coverage by Citizenship Status in Foots Creek
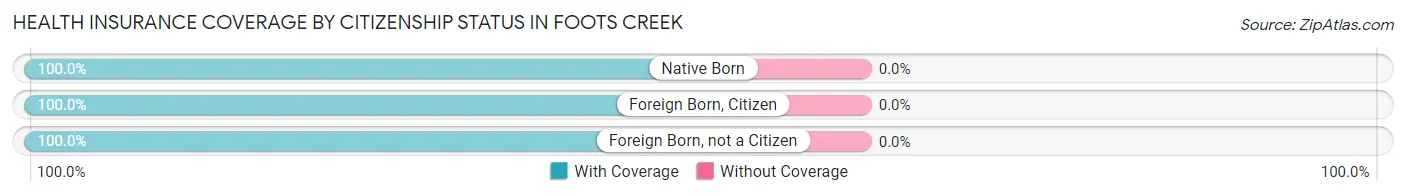
| Citizenship Status | With Coverage | Without Coverage |
| Native Born | 24 (100.0%) | 0 (0.0%) |
| Foreign Born, Citizen | 119 (100.0%) | 0 (0.0%) |
| Foreign Born, not a Citizen | 33 (100.0%) | 0 (0.0%) |
Health Insurance Coverage by Household Income in Foots Creek
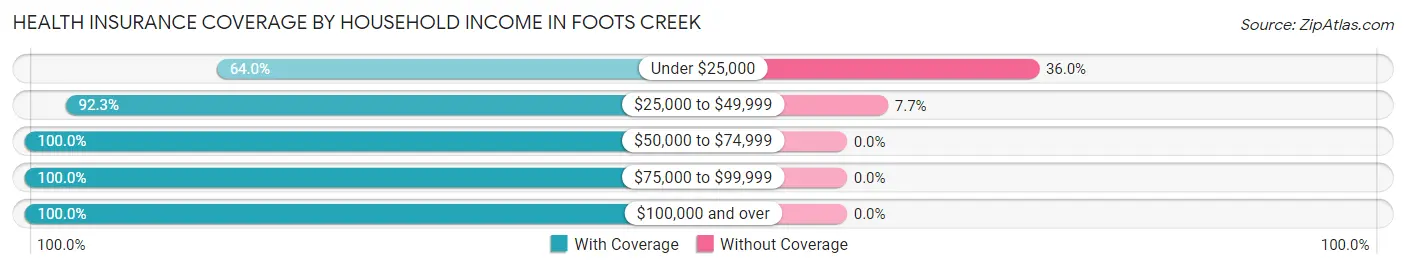
| Household Income | With Coverage | Without Coverage |
| Under $25,000 | 32 (64.0%) | 18 (36.0%) |
| $25,000 to $49,999 | 264 (92.3%) | 22 (7.7%) |
| $50,000 to $74,999 | 307 (100.0%) | 0 (0.0%) |
| $75,000 to $99,999 | 175 (100.0%) | 0 (0.0%) |
| $100,000 and over | 165 (100.0%) | 0 (0.0%) |
Public vs Private Health Insurance Coverage by Age in Foots Creek
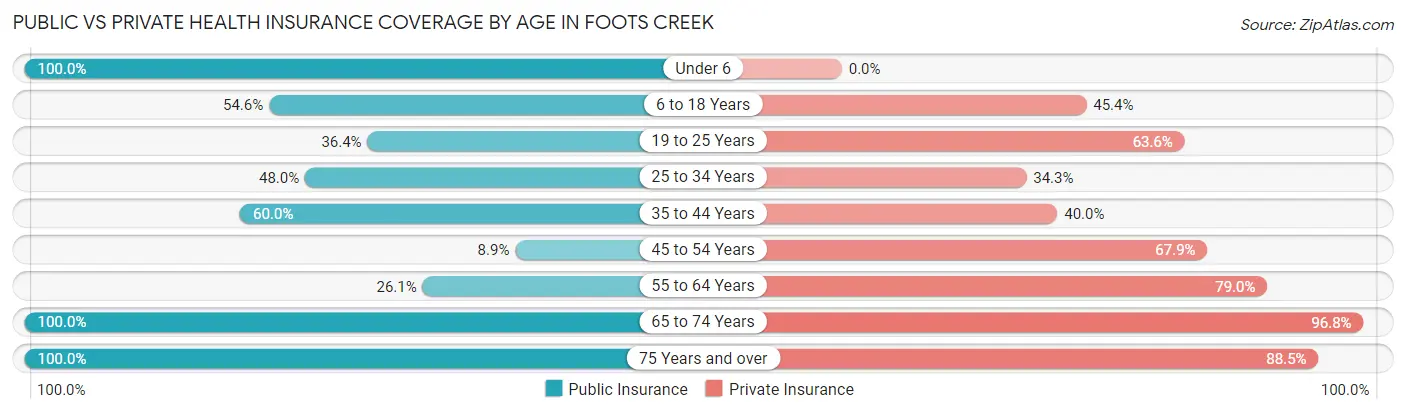
| Age Bracket | Public Insurance | Private Insurance |
| Under 6 | 24 (100.0%) | 0 (0.0%) |
| 6 to 18 Years | 65 (54.6%) | 54 (45.4%) |
| 19 to 25 Years | 12 (36.4%) | 21 (63.6%) |
| 25 to 34 Years | 35 (47.9%) | 25 (34.3%) |
| 35 to 44 Years | 66 (60.0%) | 44 (40.0%) |
| 45 to 54 Years | 5 (8.9%) | 38 (67.9%) |
| 55 to 64 Years | 46 (26.1%) | 139 (79.0%) |
| 65 to 74 Years | 314 (100.0%) | 304 (96.8%) |
| 75 Years and over | 78 (100.0%) | 69 (88.5%) |
| Total | 645 (65.6%) | 694 (70.6%) |
Disability Status by Sex by Age in Foots Creek
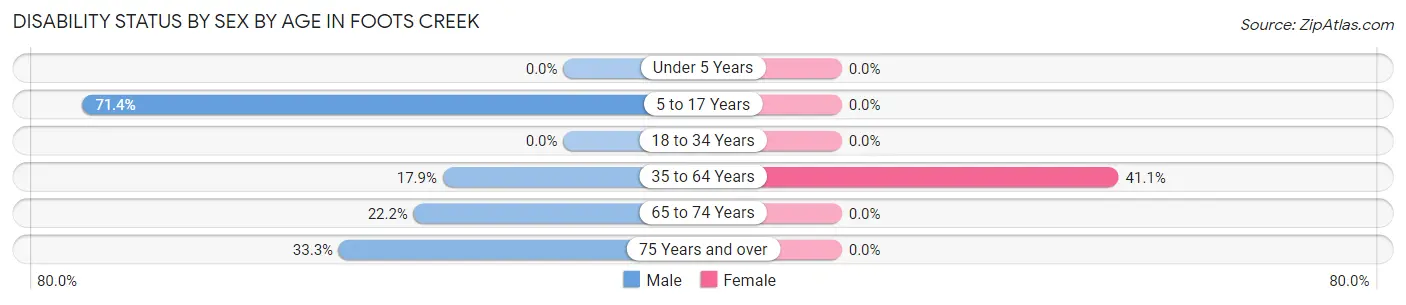
| Age Bracket | Male | Female |
| Under 5 Years | 0 (0.0%) | 0 (0.0%) |
| 5 to 17 Years | 50 (71.4%) | 0 (0.0%) |
| 18 to 34 Years | 0 (0.0%) | 0 (0.0%) |
| 35 to 64 Years | 29 (17.9%) | 74 (41.1%) |
| 65 to 74 Years | 28 (22.2%) | 0 (0.0%) |
| 75 Years and over | 21 (33.3%) | 0 (0.0%) |
Disability Class by Sex by Age in Foots Creek
Disability Class: Hearing Difficulty
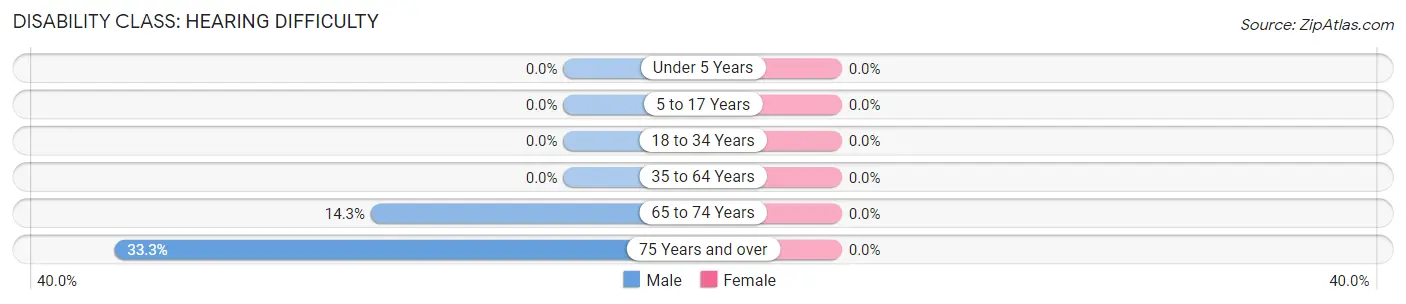
| Age Bracket | Male | Female |
| Under 5 Years | 0 (0.0%) | 0 (0.0%) |
| 5 to 17 Years | 0 (0.0%) | 0 (0.0%) |
| 18 to 34 Years | 0 (0.0%) | 0 (0.0%) |
| 35 to 64 Years | 0 (0.0%) | 0 (0.0%) |
| 65 to 74 Years | 18 (14.3%) | 0 (0.0%) |
| 75 Years and over | 21 (33.3%) | 0 (0.0%) |
Disability Class: Vision Difficulty
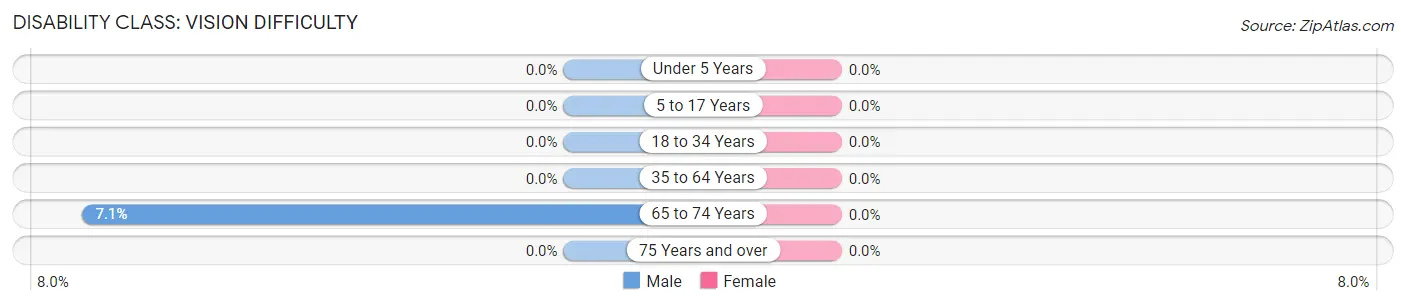
| Age Bracket | Male | Female |
| Under 5 Years | 0 (0.0%) | 0 (0.0%) |
| 5 to 17 Years | 0 (0.0%) | 0 (0.0%) |
| 18 to 34 Years | 0 (0.0%) | 0 (0.0%) |
| 35 to 64 Years | 0 (0.0%) | 0 (0.0%) |
| 65 to 74 Years | 9 (7.1%) | 0 (0.0%) |
| 75 Years and over | 0 (0.0%) | 0 (0.0%) |
Disability Class: Cognitive Difficulty
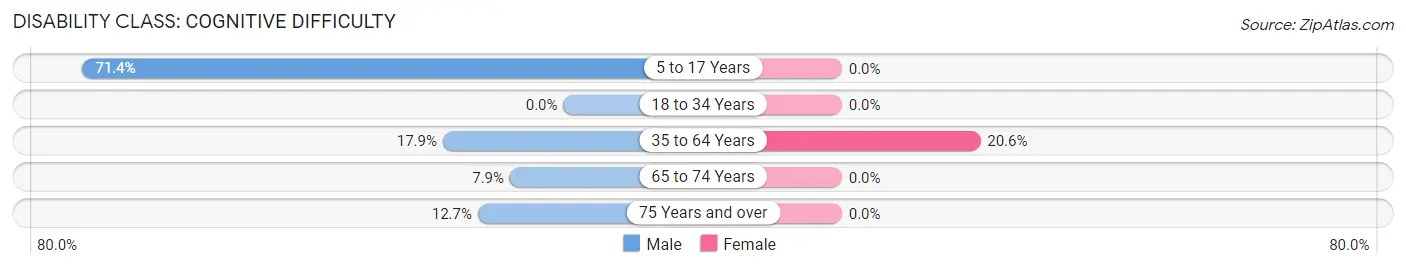
| Age Bracket | Male | Female |
| 5 to 17 Years | 50 (71.4%) | 0 (0.0%) |
| 18 to 34 Years | 0 (0.0%) | 0 (0.0%) |
| 35 to 64 Years | 29 (17.9%) | 37 (20.6%) |
| 65 to 74 Years | 10 (7.9%) | 0 (0.0%) |
| 75 Years and over | 8 (12.7%) | 0 (0.0%) |
Disability Class: Ambulatory Difficulty
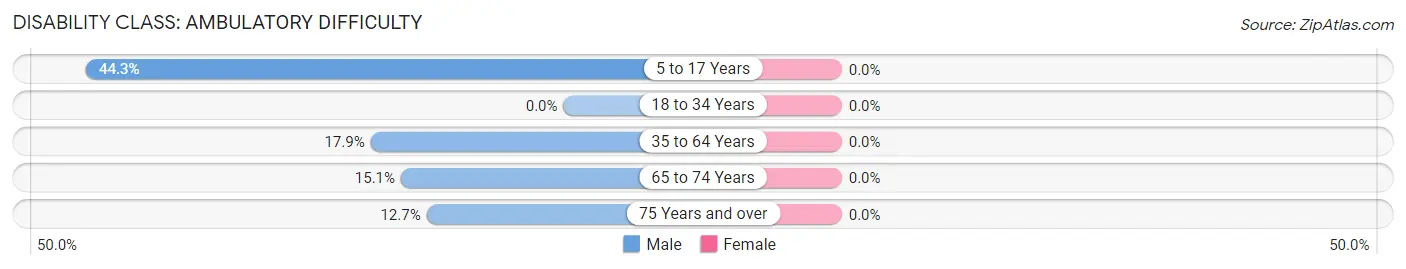
| Age Bracket | Male | Female |
| 5 to 17 Years | 31 (44.3%) | 0 (0.0%) |
| 18 to 34 Years | 0 (0.0%) | 0 (0.0%) |
| 35 to 64 Years | 29 (17.9%) | 0 (0.0%) |
| 65 to 74 Years | 19 (15.1%) | 0 (0.0%) |
| 75 Years and over | 8 (12.7%) | 0 (0.0%) |
Disability Class: Self-Care Difficulty
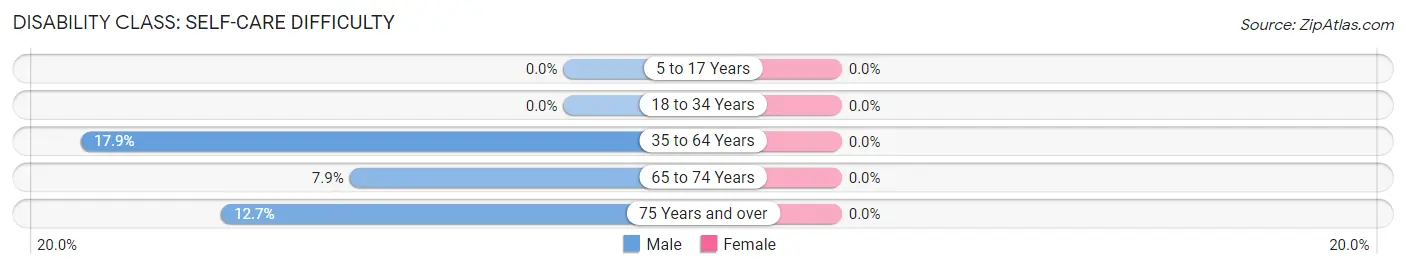
| Age Bracket | Male | Female |
| 5 to 17 Years | 0 (0.0%) | 0 (0.0%) |
| 18 to 34 Years | 0 (0.0%) | 0 (0.0%) |
| 35 to 64 Years | 29 (17.9%) | 0 (0.0%) |
| 65 to 74 Years | 10 (7.9%) | 0 (0.0%) |
| 75 Years and over | 8 (12.7%) | 0 (0.0%) |
Technology Access in Foots Creek
Computing Device Access in Foots Creek
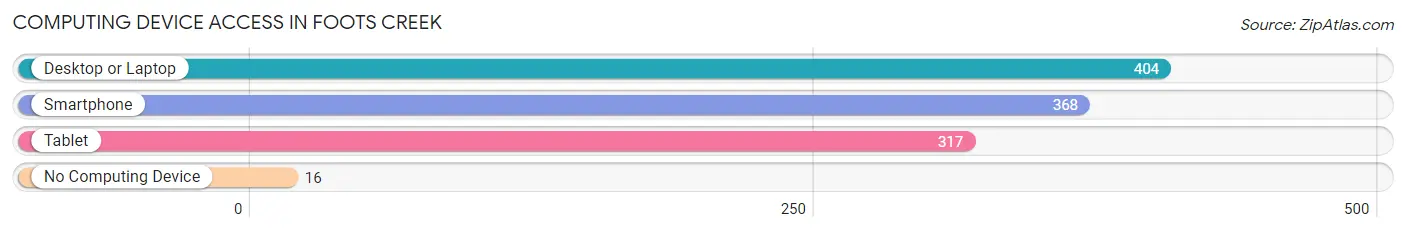
| Device Type | # Households | % Households |
| Desktop or Laptop | 404 | 94.8% |
| Smartphone | 368 | 86.4% |
| Tablet | 317 | 74.4% |
| No Computing Device | 16 | 3.8% |
| Total | 426 | 100.0% |
Internet Access in Foots Creek
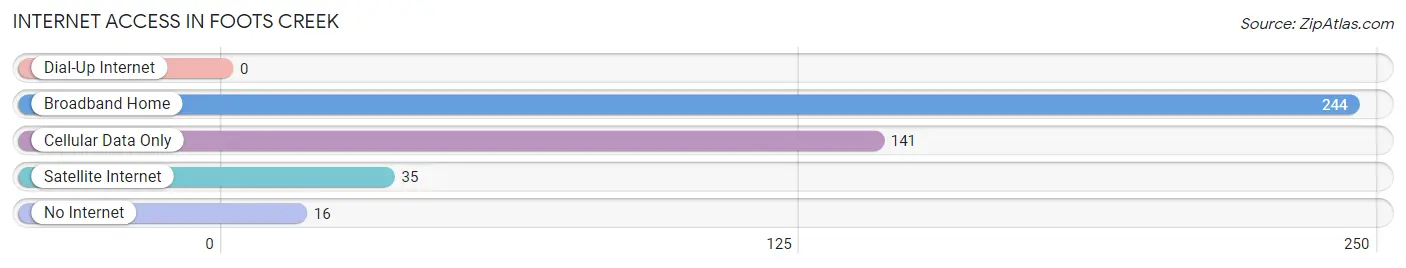
| Internet Type | # Households | % Households |
| Dial-Up Internet | 0 | 0.0% |
| Broadband Home | 244 | 57.3% |
| Cellular Data Only | 141 | 33.1% |
| Satellite Internet | 35 | 8.2% |
| No Internet | 16 | 3.8% |
| Total | 426 | 100.0% |
Foots Creek Summary
Foots Creek is a small unincorporated community located in Jackson County, Oregon, United States. It is situated in the foothills of the Cascade Mountains, approximately 10 miles east of Medford. The community is named after Foots Creek, which flows through the area.
History
The area around Foots Creek was first settled in the late 1800s by homesteaders. The first post office was established in 1891 and the community was officially named Foots Creek in 1895. The area was primarily used for logging and farming, and the local economy was largely based on these industries.
In the early 1900s, the area around Foots Creek began to develop as a tourist destination. The nearby Rogue River was a popular spot for fishing and rafting, and the area was also known for its scenic beauty. The community was home to several resorts, including the Foots Creek Inn, which was built in the 1920s.
Geography
Foots Creek is located in the foothills of the Cascade Mountains, approximately 10 miles east of Medford. The community is situated at an elevation of 1,890 feet and is surrounded by forests and rolling hills. The climate is mild and the area receives an average of 35 inches of precipitation per year.
The main waterway in the area is Foots Creek, which flows through the community and eventually empties into the Rogue River. The creek is a popular spot for fishing and rafting, and is also home to a variety of wildlife, including deer, elk, and bears.
Economy
The economy of Foots Creek is largely based on tourism and recreation. The area is a popular destination for fishing, rafting, and camping, and there are several resorts and lodges in the area. The community is also home to several small businesses, including a general store, a gas station, and a restaurant.
Demographics
As of the 2010 census, the population of Foots Creek was 545. The racial makeup of the community was 95.2% White, 0.7% Native American, 0.4% Asian, 0.2% African American, and 3.5% from other races. The median household income was $37,500 and the median age was 44.
Conclusion
Foots Creek is a small unincorporated community located in Jackson County, Oregon. The area was first settled in the late 1800s and the local economy is largely based on tourism and recreation. The population of Foots Creek is 545 and the median household income is $37,500. The area is known for its scenic beauty and is a popular destination for fishing, rafting, and camping.
Common Questions
What is the Total Population of Foots Creek?
Total Population of Foots Creek is 983.
What is the Total Male Population of Foots Creek?
Total Male Population of Foots Creek is 481.
What is the Total Female Population of Foots Creek?
Total Female Population of Foots Creek is 502.
What is the Ratio of Males per 100 Females in Foots Creek?
There are 95.82 Males per 100 Females in Foots Creek.
What is the Ratio of Females per 100 Males in Foots Creek?
There are 104.37 Females per 100 Males in Foots Creek.
What is the Median Population Age in Foots Creek?
Median Population Age in Foots Creek is 57.8 Years.
What is the Average Family Size in Foots Creek
Average Family Size in Foots Creek is 2.5 People.
What is the Average Household Size in Foots Creek
Average Household Size in Foots Creek is 2.3 People.
What is Per Capita Income in Foots Creek?
Per Capita income in Foots Creek is $33,530.
What is the Median Family Income in Foots Creek?
Median Family Income in Foots Creek is $68,799.
What is the Median Household income in Foots Creek?
Median Household Income in Foots Creek is $68,309.
What is Inequality or Gini Index in Foots Creek?
Inequality or Gini Index in Foots Creek is 0.36.
How Large is the Labor Force in Foots Creek?
There are 347 People in the Labor Forcein in Foots Creek.
What is the Percentage of People in the Labor Force in Foots Creek?
41.3% of People are in the Labor Force in Foots Creek.