Dayville, OR
Dayville Map
Dayville Overview
257
TOTAL POPULATION
136
MALE POPULATION
121
FEMALE POPULATION
112.40
MALES / 100 FEMALES
88.97
FEMALES / 100 MALES
34.3
MEDIAN AGE
3.2
AVG FAMILY SIZE
2.3
AVG HOUSEHOLD SIZE
$30,782
PER CAPITA INCOME
$94,063
AVG FAMILY INCOME
$53,750
AVG HOUSEHOLD INCOME
15.3%
WAGE / INCOME GAP [ % ]
84.7¢/ $1
WAGE / INCOME GAP [ $ ]
0.36
INEQUALITY / GINI INDEX
111
LABOR FORCE [ PEOPLE ]
59.0%
PERCENT IN LABOR FORCE
6.3%
UNEMPLOYMENT RATE
Dayville Zip Codes
Dayville Area Codes
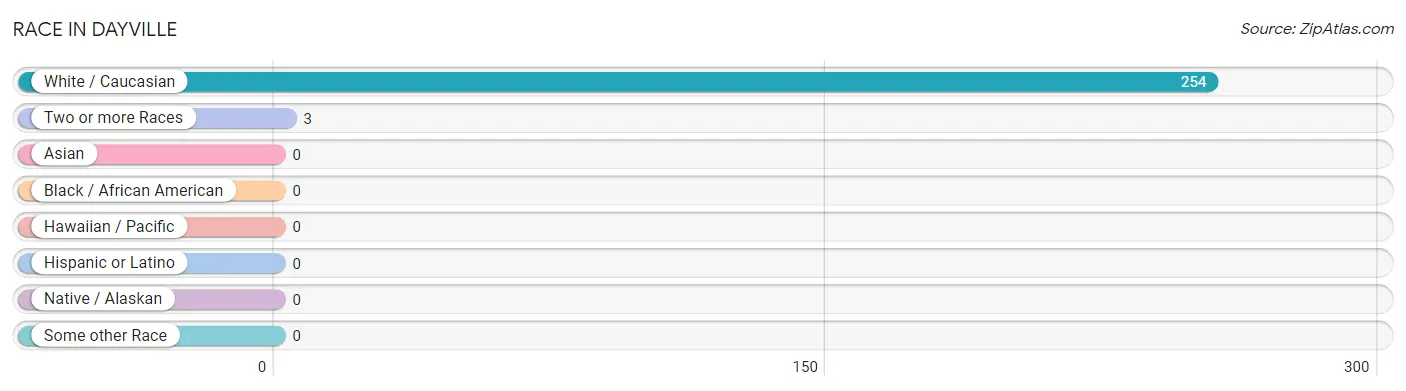
Race in Dayville
The most populous races in Dayville are White / Caucasian (254 | 98.8%), and Two or more Races (3 | 1.2%).
| Race | # Population | % Population |
| Asian | 0 | 0.0% |
| Black / African American | 0 | 0.0% |
| Hawaiian / Pacific | 0 | 0.0% |
| Hispanic or Latino | 0 | 0.0% |
| Native / Alaskan | 0 | 0.0% |
| White / Caucasian | 254 | 98.8% |
| Two or more Races | 3 | 1.2% |
| Some other Race | 0 | 0.0% |
| Total | 257 | 100.0% |
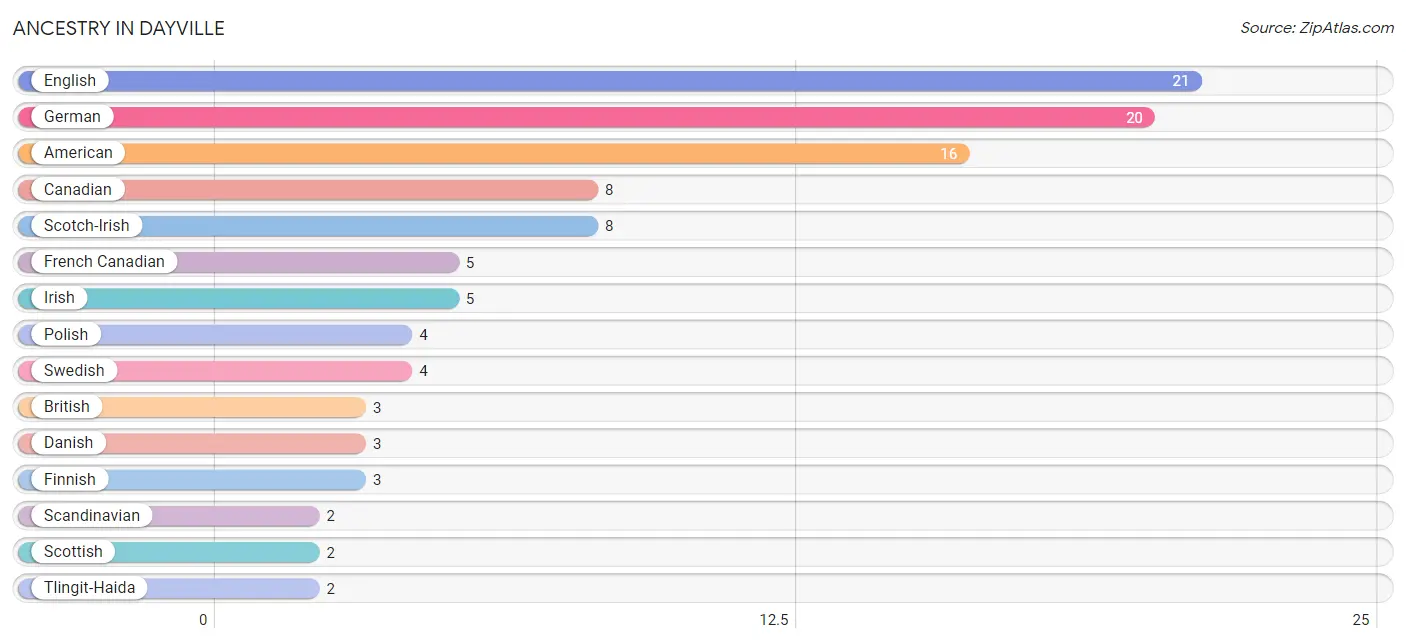
Ancestry in Dayville
The most populous ancestries reported in Dayville are English (21 | 8.2%), German (20 | 7.8%), American (16 | 6.2%), Canadian (8 | 3.1%), and Scotch-Irish (8 | 3.1%), together accounting for 28.4% of all Dayville residents.
| Ancestry | # Population | % Population |
| American | 16 | 6.2% |
| British | 3 | 1.2% |
| Canadian | 8 | 3.1% |
| Choctaw | 1 | 0.4% |
| Danish | 3 | 1.2% |
| Dutch | 1 | 0.4% |
| English | 21 | 8.2% |
| European | 1 | 0.4% |
| Finnish | 3 | 1.2% |
| French Canadian | 5 | 1.9% |
| German | 20 | 7.8% |
| Irish | 5 | 1.9% |
| Polish | 4 | 1.6% |
| Russian | 1 | 0.4% |
| Scandinavian | 2 | 0.8% |
| Scotch-Irish | 8 | 3.1% |
| Scottish | 2 | 0.8% |
| Swedish | 4 | 1.6% |
| Tlingit-Haida | 2 | 0.8% |
| Welsh | 1 | 0.4% | View All 20 Rows |
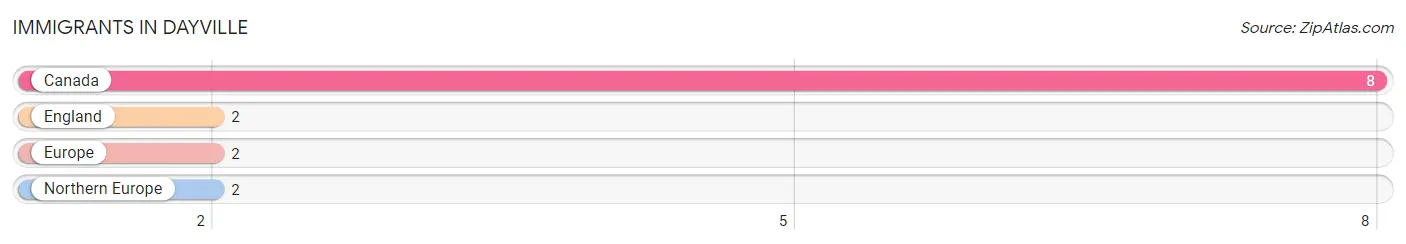
Immigrants in Dayville
The most numerous immigrant groups reported in Dayville came from Canada (8 | 3.1%), England (2 | 0.8%), Europe (2 | 0.8%), and Northern Europe (2 | 0.8%), together accounting for 5.4% of all Dayville residents.
| Immigration Origin | # Population | % Population |
| Canada | 8 | 3.1% |
| England | 2 | 0.8% |
| Europe | 2 | 0.8% |
| Northern Europe | 2 | 0.8% | View All 4 Rows |
Sex and Age in Dayville
Sex and Age in Dayville
The most populous age groups in Dayville are 40 to 44 Years (25 | 18.4%) for men and 30 to 34 Years (22 | 18.2%) for women.
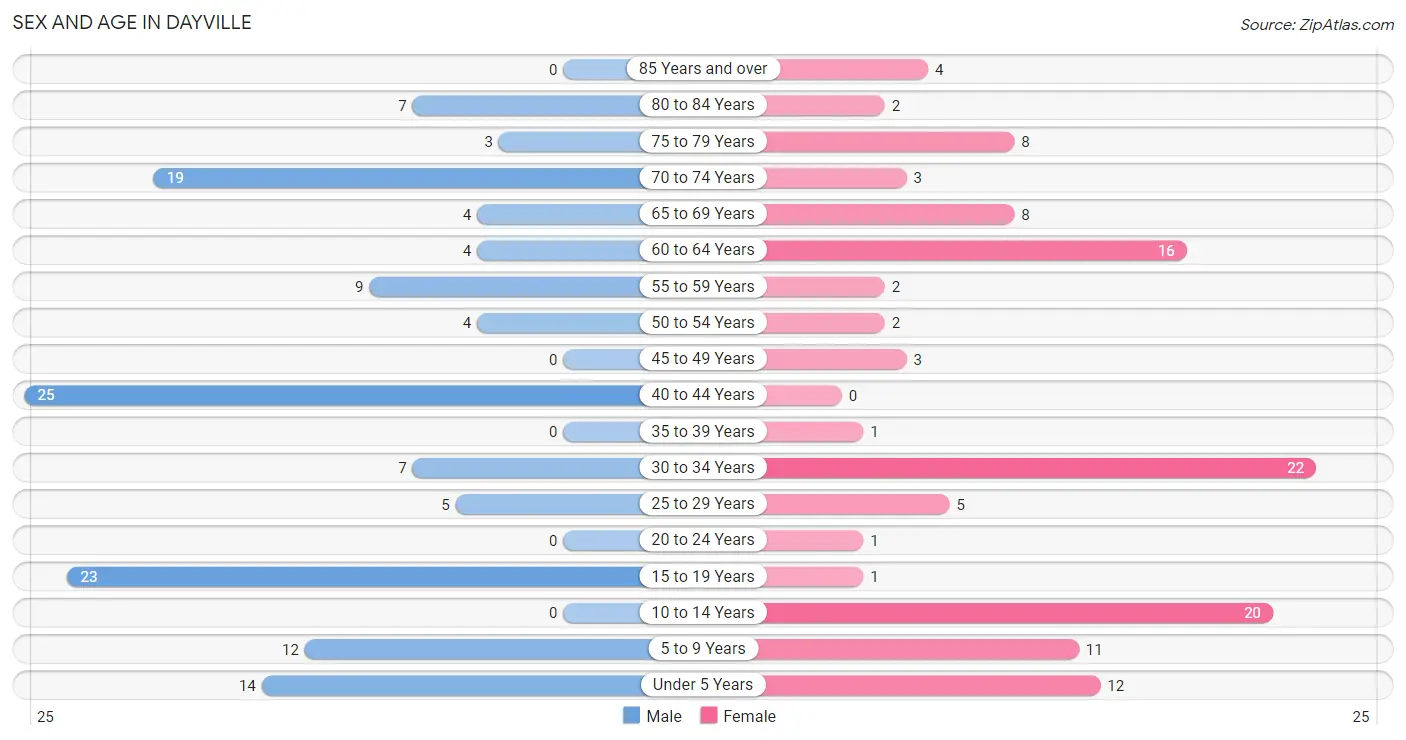
| Age Bracket | Male | Female |
| Under 5 Years | 14 (10.3%) | 12 (9.9%) |
| 5 to 9 Years | 12 (8.8%) | 11 (9.1%) |
| 10 to 14 Years | 0 (0.0%) | 20 (16.5%) |
| 15 to 19 Years | 23 (16.9%) | 1 (0.8%) |
| 20 to 24 Years | 0 (0.0%) | 1 (0.8%) |
| 25 to 29 Years | 5 (3.7%) | 5 (4.1%) |
| 30 to 34 Years | 7 (5.1%) | 22 (18.2%) |
| 35 to 39 Years | 0 (0.0%) | 1 (0.8%) |
| 40 to 44 Years | 25 (18.4%) | 0 (0.0%) |
| 45 to 49 Years | 0 (0.0%) | 3 (2.5%) |
| 50 to 54 Years | 4 (2.9%) | 2 (1.7%) |
| 55 to 59 Years | 9 (6.6%) | 2 (1.7%) |
| 60 to 64 Years | 4 (2.9%) | 16 (13.2%) |
| 65 to 69 Years | 4 (2.9%) | 8 (6.6%) |
| 70 to 74 Years | 19 (14.0%) | 3 (2.5%) |
| 75 to 79 Years | 3 (2.2%) | 8 (6.6%) |
| 80 to 84 Years | 7 (5.1%) | 2 (1.7%) |
| 85 Years and over | 0 (0.0%) | 4 (3.3%) |
| Total | 136 (100.0%) | 121 (100.0%) |
Families and Households in Dayville
Median Family Size in Dayville
The median family size in Dayville is 3.18 persons per family, with single male/father families (1 | 1.5%) accounting for the largest median family size of 4 persons per family. On the other hand, married-couple families (60 | 89.5%) represent the smallest median family size with 3.12 persons per family.
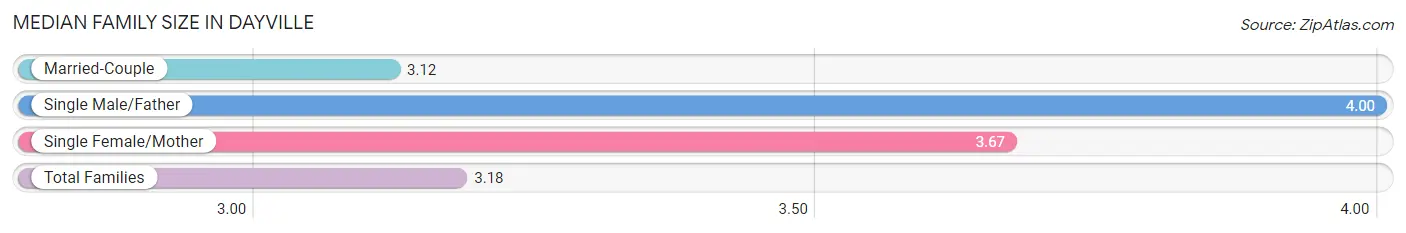
| Family Type | # Families | Family Size |
| Married-Couple | 60 (89.5%) | 3.12 |
| Single Male/Father | 1 (1.5%) | 4.00 |
| Single Female/Mother | 6 (9.0%) | 3.67 |
| Total Families | 67 (100.0%) | 3.18 |
Median Household Size in Dayville
The median household size in Dayville is 2.34 persons per household, with single male/father households (1 | 0.9%) accounting for the largest median household size of 4 persons per household. non-family households (43 | 39.1%) represent the smallest median household size with 1.02 persons per household.
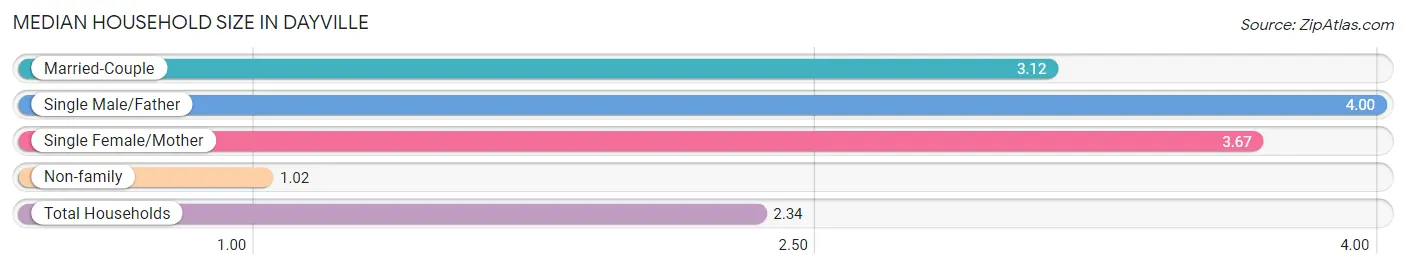
| Household Type | # Households | Household Size |
| Married-Couple | 60 (54.5%) | 3.12 |
| Single Male/Father | 1 (0.9%) | 4.00 |
| Single Female/Mother | 6 (5.4%) | 3.67 |
| Non-family | 43 (39.1%) | 1.02 |
| Total Households | 110 (100.0%) | 2.34 |
Household Size by Marriage Status in Dayville
Out of a total of 110 households in Dayville, 67 (60.9%) are family households, while 43 (39.1%) are nonfamily households. The most numerous type of family households are 4-person households, comprising 28, and the most common type of nonfamily households are 1-person households, comprising 42.
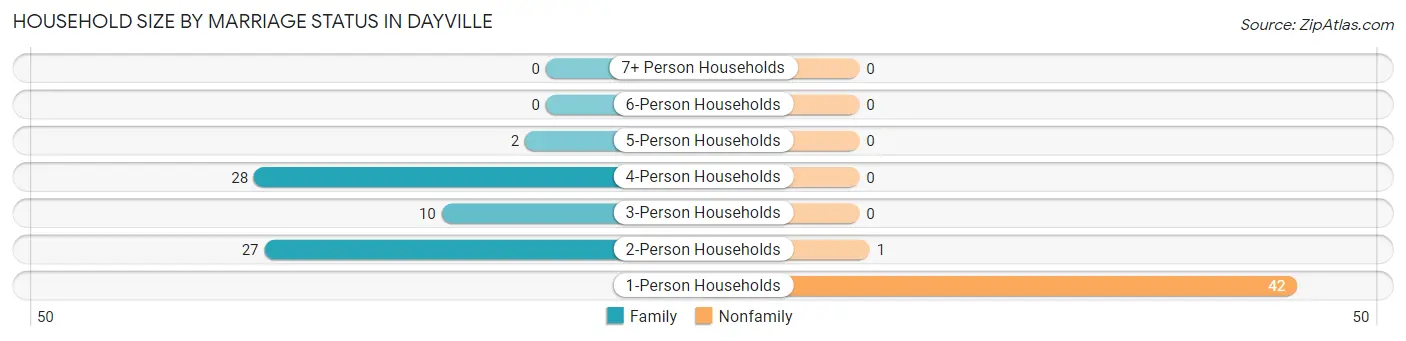
| Household Size | Family Households | Nonfamily Households |
| 1-Person Households | - | 42 (38.2%) |
| 2-Person Households | 27 (24.5%) | 1 (0.9%) |
| 3-Person Households | 10 (9.1%) | 0 (0.0%) |
| 4-Person Households | 28 (25.5%) | 0 (0.0%) |
| 5-Person Households | 2 (1.8%) | 0 (0.0%) |
| 6-Person Households | 0 (0.0%) | 0 (0.0%) |
| 7+ Person Households | 0 (0.0%) | 0 (0.0%) |
| Total | 67 (60.9%) | 43 (39.1%) |
Female Fertility in Dayville
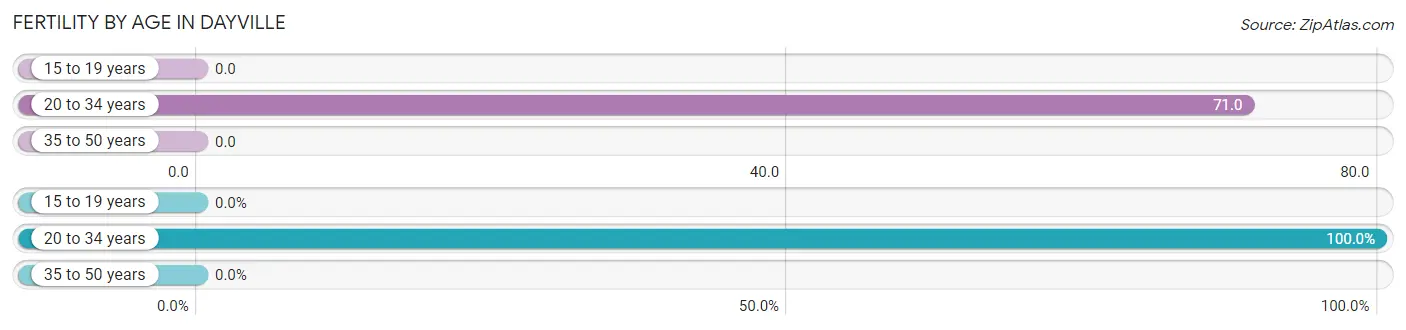
Fertility by Age in Dayville
Average fertility rate in Dayville is 57.0 births per 1,000 women. Women in the age bracket of 20 to 34 years have the highest fertility rate with 71.0 births per 1,000 women. Women in the age bracket of 20 to 34 years acount for 100.0% of all women with births.
| Age Bracket | Women with Births | Births / 1,000 Women |
| 15 to 19 years | 0 (0.0%) | 0.0 |
| 20 to 34 years | 2 (100.0%) | 71.0 |
| 35 to 50 years | 0 (0.0%) | 0.0 |
| Total | 2 (100.0%) | 57.0 |
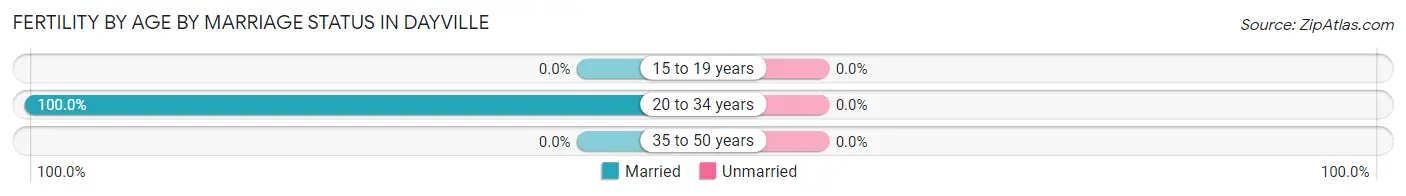
Fertility by Age by Marriage Status in Dayville
| Age Bracket | Married | Unmarried |
| 15 to 19 years | 0 (0.0%) | 0 (0.0%) |
| 20 to 34 years | 2 (100.0%) | 0 (0.0%) |
| 35 to 50 years | 0 (0.0%) | 0 (0.0%) |
| Total | 2 (100.0%) | 0 (0.0%) |
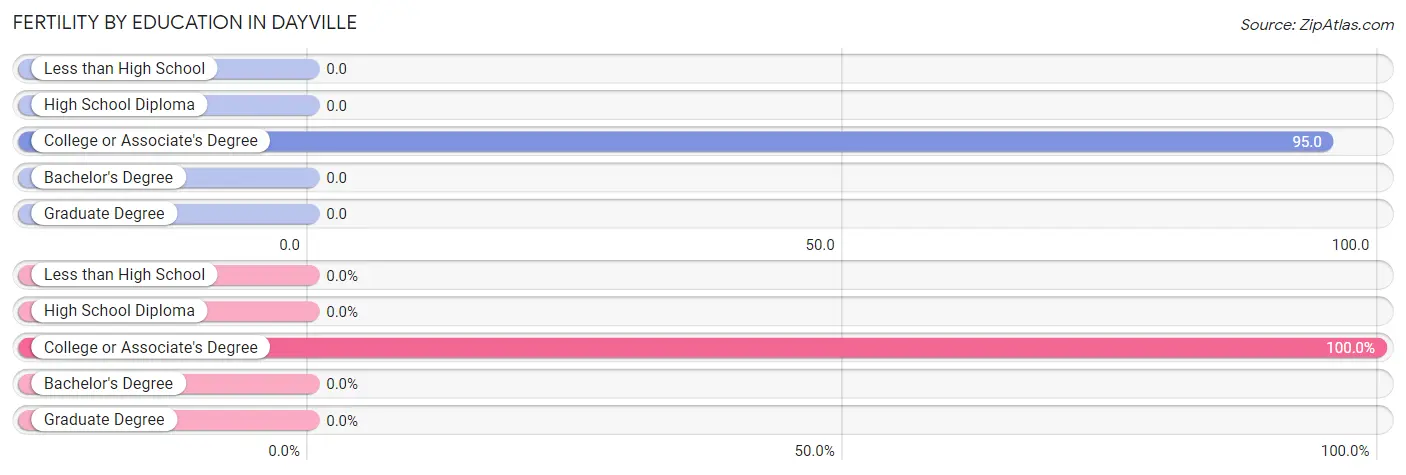
Fertility by Education in Dayville
| Educational Attainment | Women with Births | Births / 1,000 Women |
| Less than High School | 0 (0.0%) | 0.0 |
| High School Diploma | 0 (0.0%) | 0.0 |
| College or Associate's Degree | 2 (100.0%) | 95.0 |
| Bachelor's Degree | 0 (0.0%) | 0.0 |
| Graduate Degree | 0 (0.0%) | 0.0 |
| Total | 2 (100.0%) | 57.0 |
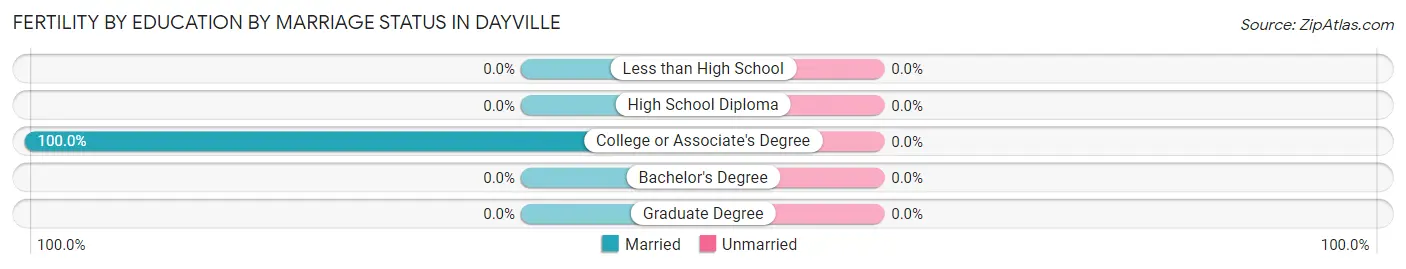
Fertility by Education by Marriage Status in Dayville
| Educational Attainment | Married | Unmarried |
| Less than High School | 0 (0.0%) | 0 (0.0%) |
| High School Diploma | 0 (0.0%) | 0 (0.0%) |
| College or Associate's Degree | 2 (100.0%) | 0 (0.0%) |
| Bachelor's Degree | 0 (0.0%) | 0 (0.0%) |
| Graduate Degree | 0 (0.0%) | 0 (0.0%) |
| Total | 2 (100.0%) | 0 (0.0%) |
Income in Dayville
Income Overview in Dayville
Per Capita Income in Dayville is $30,782, while median incomes of families and households are $94,063 and $53,750 respectively.
| Characteristic | Number | Measure |
| Per Capita Income | 257 | $30,782 |
| Median Family Income | 67 | $94,063 |
| Mean Family Income | 67 | $97,693 |
| Median Household Income | 110 | $53,750 |
| Mean Household Income | 110 | $74,672 |
| Income Deficit | 67 | $0 |
| Wage / Income Gap (%) | 257 | 15.26% |
| Wage / Income Gap ($) | 257 | 84.74¢ per $1 |
| Gini / Inequality Index | 257 | 0.36 |
Earnings by Sex in Dayville
Average Earnings in Dayville are $39,583, $34,250 for men and $40,417 for women, a difference of 15.3%.
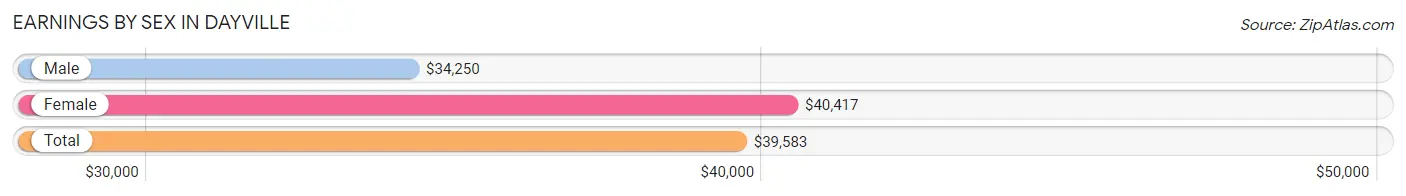
| Sex | Number | Average Earnings |
| Male | 93 (63.3%) | $34,250 |
| Female | 54 (36.7%) | $40,417 |
| Total | 147 (100.0%) | $39,583 |
Earnings by Sex by Income Bracket in Dayville
The most common earnings brackets in Dayville are $2,500 to $4,999 for men (25 | 26.9%) and $65,000 to $74,999 for women (17 | 31.5%).
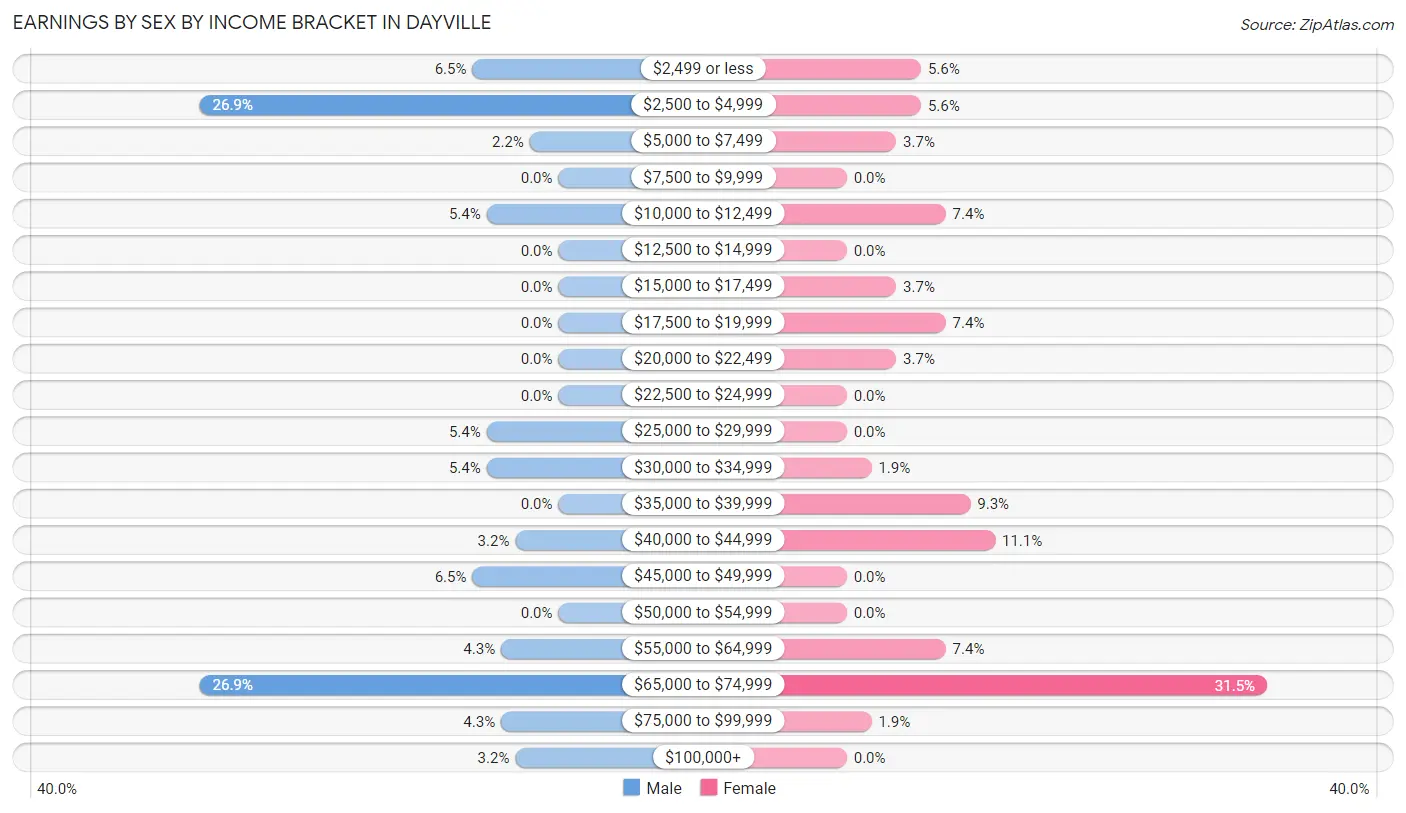
| Income | Male | Female |
| $2,499 or less | 6 (6.5%) | 3 (5.6%) |
| $2,500 to $4,999 | 25 (26.9%) | 3 (5.6%) |
| $5,000 to $7,499 | 2 (2.1%) | 2 (3.7%) |
| $7,500 to $9,999 | 0 (0.0%) | 0 (0.0%) |
| $10,000 to $12,499 | 5 (5.4%) | 4 (7.4%) |
| $12,500 to $14,999 | 0 (0.0%) | 0 (0.0%) |
| $15,000 to $17,499 | 0 (0.0%) | 2 (3.7%) |
| $17,500 to $19,999 | 0 (0.0%) | 4 (7.4%) |
| $20,000 to $22,499 | 0 (0.0%) | 2 (3.7%) |
| $22,500 to $24,999 | 0 (0.0%) | 0 (0.0%) |
| $25,000 to $29,999 | 5 (5.4%) | 0 (0.0%) |
| $30,000 to $34,999 | 5 (5.4%) | 1 (1.8%) |
| $35,000 to $39,999 | 0 (0.0%) | 5 (9.3%) |
| $40,000 to $44,999 | 3 (3.2%) | 6 (11.1%) |
| $45,000 to $49,999 | 6 (6.5%) | 0 (0.0%) |
| $50,000 to $54,999 | 0 (0.0%) | 0 (0.0%) |
| $55,000 to $64,999 | 4 (4.3%) | 4 (7.4%) |
| $65,000 to $74,999 | 25 (26.9%) | 17 (31.5%) |
| $75,000 to $99,999 | 4 (4.3%) | 1 (1.8%) |
| $100,000+ | 3 (3.2%) | 0 (0.0%) |
| Total | 93 (100.0%) | 54 (100.0%) |
Earnings by Sex by Educational Attainment in Dayville
Average earnings in Dayville are $58,333 for men and $40,833 for women, a difference of 30.0%. Men with an educational attainment of less than high school enjoy the highest average annual earnings of $70,850, while those with high school diploma education earn the least with $41,250. Women with an educational attainment of college or associate's degree earn the most with the average annual earnings of $65,625, while those with bachelor's degree education have the smallest earnings of $38,333.
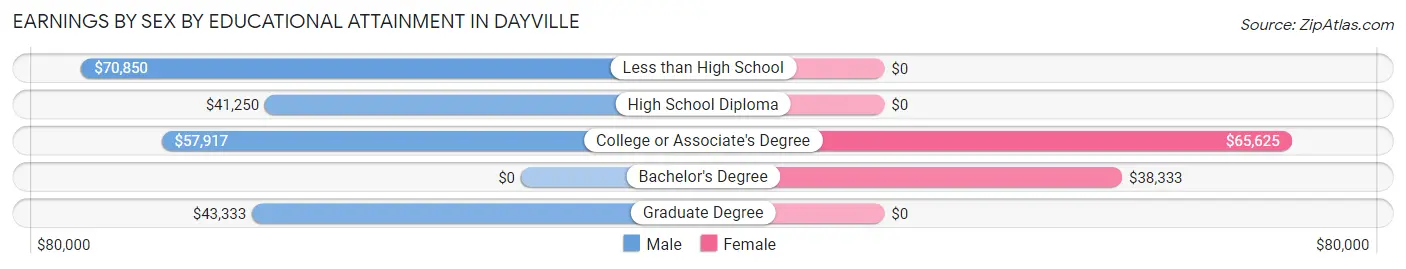
| Educational Attainment | Male Income | Female Income |
| Less than High School | $70,850 | $0 |
| High School Diploma | $41,250 | $0 |
| College or Associate's Degree | $57,917 | $65,625 |
| Bachelor's Degree | - | - |
| Graduate Degree | $43,333 | $0 |
| Total | $58,333 | $40,833 |
Family Income in Dayville
Family Income Brackets in Dayville
According to the Dayville family income data, there are 27 families falling into the $100,000 to $149,999 income range, which is the most common income bracket and makes up 40.3% of all families.
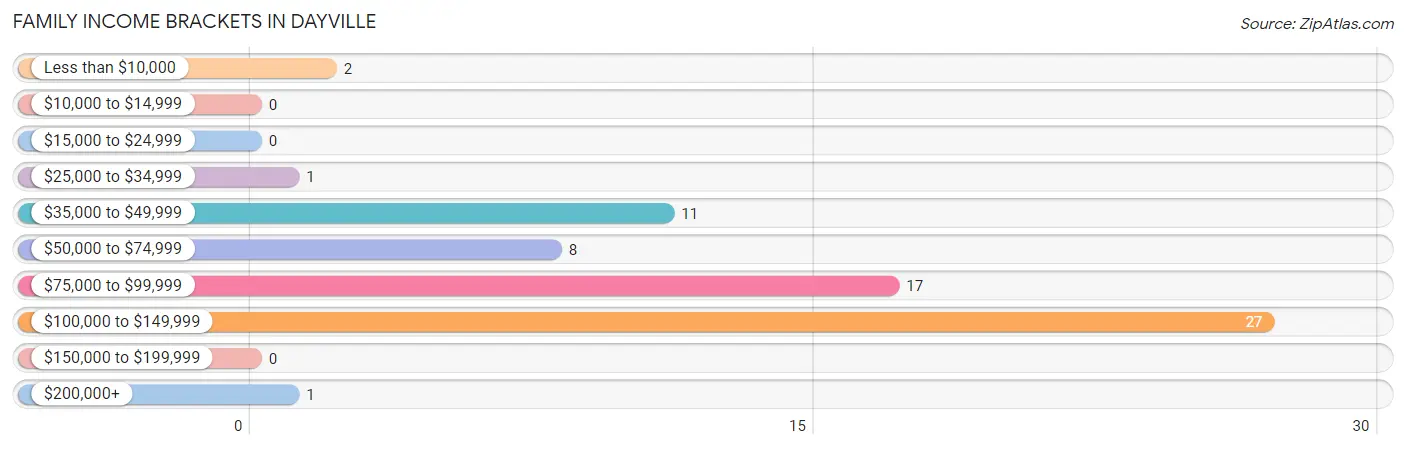
| Income Bracket | # Families | % Families |
| Less than $10,000 | 2 | 3.0% |
| $10,000 to $14,999 | 0 | 0.0% |
| $15,000 to $24,999 | 0 | 0.0% |
| $25,000 to $34,999 | 1 | 1.5% |
| $35,000 to $49,999 | 11 | 16.4% |
| $50,000 to $74,999 | 8 | 11.9% |
| $75,000 to $99,999 | 17 | 25.4% |
| $100,000 to $149,999 | 27 | 40.3% |
| $150,000 to $199,999 | 0 | 0.0% |
| $200,000+ | 1 | 1.5% |
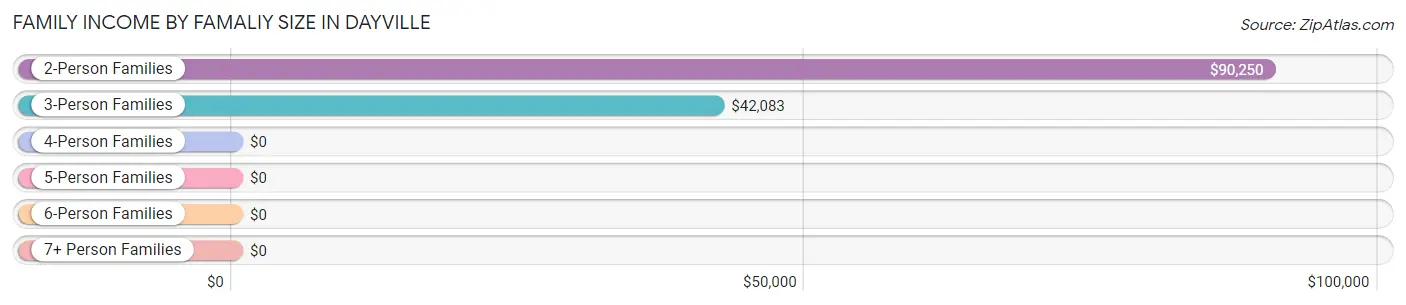
Family Income by Famaliy Size in Dayville
2-person families (27 | 40.3%) account for the highest median family income in Dayville with $90,250 per family, while 2-person families (27 | 40.3%) have the highest median income of $45,125 per family member.
| Income Bracket | # Families | Median Income |
| 2-Person Families | 27 (40.3%) | $90,250 |
| 3-Person Families | 10 (14.9%) | $42,083 |
| 4-Person Families | 28 (41.8%) | $0 |
| 5-Person Families | 2 (3.0%) | $0 |
| 6-Person Families | 0 (0.0%) | $0 |
| 7+ Person Families | 0 (0.0%) | $0 |
| Total | 67 (100.0%) | $94,063 |
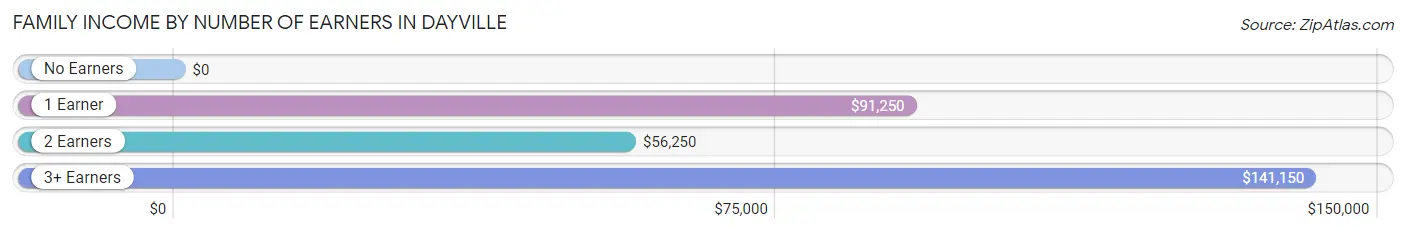
Family Income by Number of Earners in Dayville
| Number of Earners | # Families | Median Income |
| No Earners | 3 (4.5%) | $0 |
| 1 Earner | 17 (25.4%) | $91,250 |
| 2 Earners | 20 (29.8%) | $56,250 |
| 3+ Earners | 27 (40.3%) | $141,150 |
| Total | 67 (100.0%) | $94,063 |
Household Income in Dayville
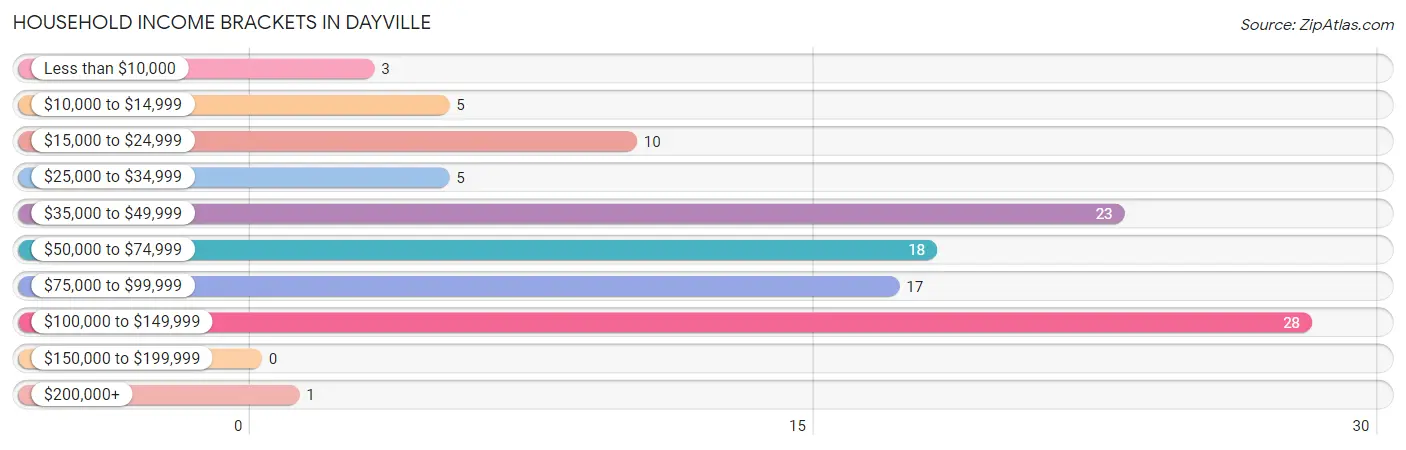
Household Income Brackets in Dayville
With 28 households falling in the category, the $100,000 to $149,999 income range is the most frequent in Dayville, accounting for 25.5% of all households.
| Income Bracket | # Households | % Households |
| Less than $10,000 | 3 | 2.7% |
| $10,000 to $14,999 | 5 | 4.5% |
| $15,000 to $24,999 | 10 | 9.1% |
| $25,000 to $34,999 | 5 | 4.5% |
| $35,000 to $49,999 | 23 | 20.9% |
| $50,000 to $74,999 | 18 | 16.4% |
| $75,000 to $99,999 | 17 | 15.5% |
| $100,000 to $149,999 | 28 | 25.5% |
| $150,000 to $199,999 | 0 | 0.0% |
| $200,000+ | 1 | 0.9% |
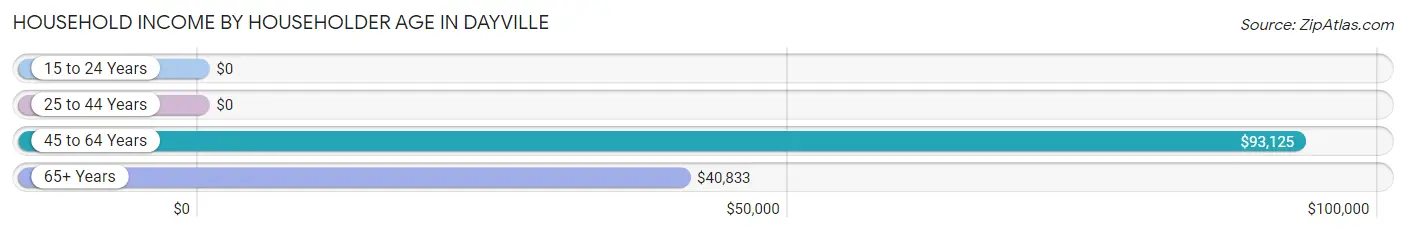
Household Income by Householder Age in Dayville
The median household income in Dayville is $53,750, with the highest median household income of $93,125 found in the 45 to 64 years age bracket for the primary householder. A total of 22 households (20.0%) fall into this category.
| Income Bracket | # Households | Median Income |
| 15 to 24 Years | 0 (0.0%) | $0 |
| 25 to 44 Years | 44 (40.0%) | $0 |
| 45 to 64 Years | 22 (20.0%) | $93,125 |
| 65+ Years | 44 (40.0%) | $40,833 |
| Total | 110 (100.0%) | $53,750 |
Poverty in Dayville
Income Below Poverty by Sex and Age in Dayville
With 9.6% poverty level for males and 6.6% for females among the residents of Dayville, under 5 year old males and 75 year old and over females are the most vulnerable to poverty, with 8 males (57.1%) and 2 females (14.3%) in their respective age groups living below the poverty level.
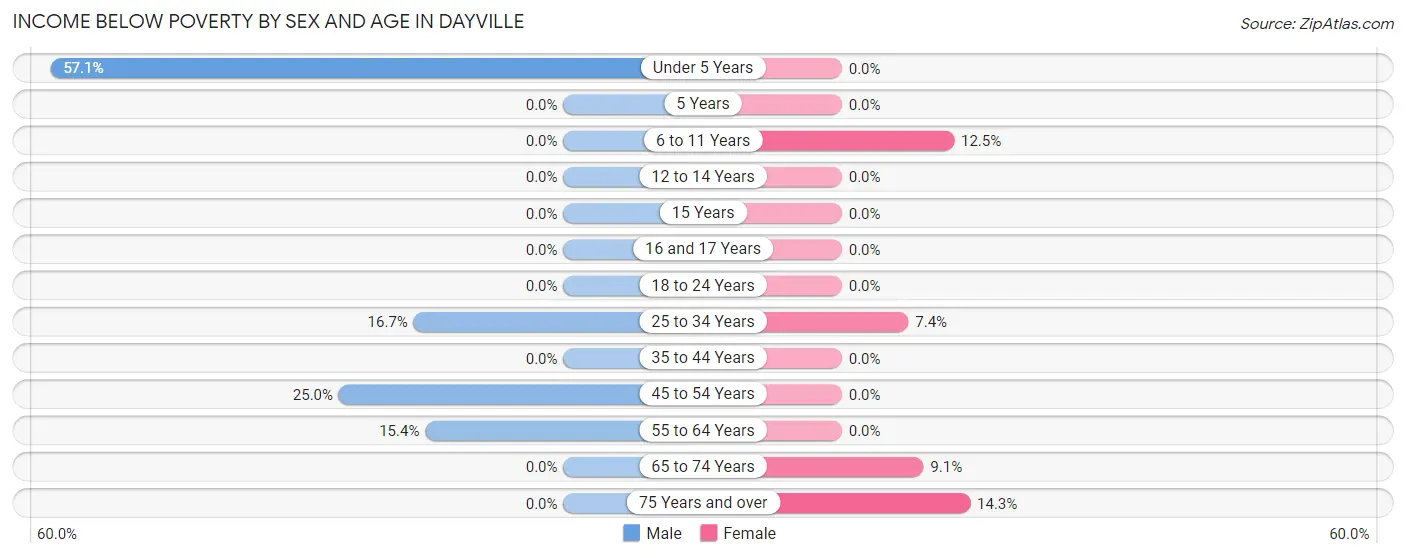
| Age Bracket | Male | Female |
| Under 5 Years | 8 (57.1%) | 0 (0.0%) |
| 5 Years | 0 (0.0%) | 0 (0.0%) |
| 6 to 11 Years | 0 (0.0%) | 3 (12.5%) |
| 12 to 14 Years | 0 (0.0%) | 0 (0.0%) |
| 15 Years | 0 (0.0%) | 0 (0.0%) |
| 16 and 17 Years | 0 (0.0%) | 0 (0.0%) |
| 18 to 24 Years | 0 (0.0%) | 0 (0.0%) |
| 25 to 34 Years | 2 (16.7%) | 2 (7.4%) |
| 35 to 44 Years | 0 (0.0%) | 0 (0.0%) |
| 45 to 54 Years | 1 (25.0%) | 0 (0.0%) |
| 55 to 64 Years | 2 (15.4%) | 0 (0.0%) |
| 65 to 74 Years | 0 (0.0%) | 1 (9.1%) |
| 75 Years and over | 0 (0.0%) | 2 (14.3%) |
| Total | 13 (9.6%) | 8 (6.6%) |
Income Above Poverty by Sex and Age in Dayville
According to the poverty statistics in Dayville, males aged 5 years and females aged under 5 years are the age groups that are most secure financially, with 100.0% of males and 100.0% of females in these age groups living above the poverty line.
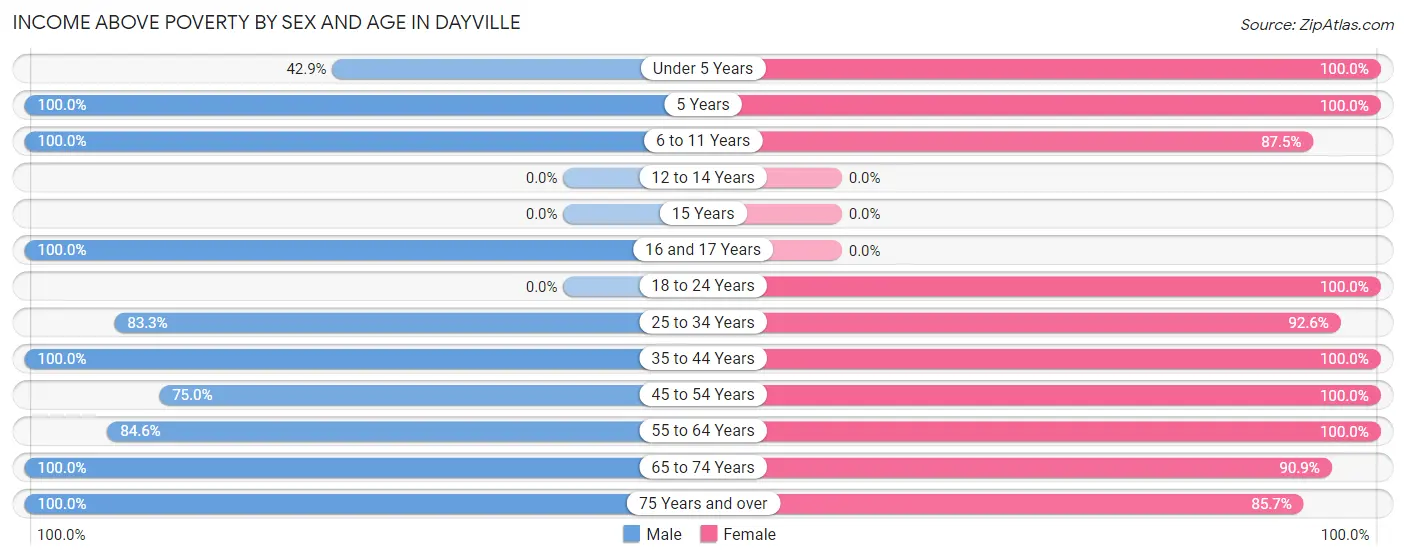
| Age Bracket | Male | Female |
| Under 5 Years | 6 (42.9%) | 12 (100.0%) |
| 5 Years | 3 (100.0%) | 7 (100.0%) |
| 6 to 11 Years | 9 (100.0%) | 21 (87.5%) |
| 12 to 14 Years | 0 (0.0%) | 0 (0.0%) |
| 15 Years | 0 (0.0%) | 0 (0.0%) |
| 16 and 17 Years | 23 (100.0%) | 0 (0.0%) |
| 18 to 24 Years | 0 (0.0%) | 2 (100.0%) |
| 25 to 34 Years | 10 (83.3%) | 25 (92.6%) |
| 35 to 44 Years | 25 (100.0%) | 1 (100.0%) |
| 45 to 54 Years | 3 (75.0%) | 5 (100.0%) |
| 55 to 64 Years | 11 (84.6%) | 18 (100.0%) |
| 65 to 74 Years | 23 (100.0%) | 10 (90.9%) |
| 75 Years and over | 10 (100.0%) | 12 (85.7%) |
| Total | 123 (90.4%) | 113 (93.4%) |
Income Below Poverty Among Married-Couple Families in Dayville
The poverty statistics for married-couple families in Dayville show that 3.3% or 2 of the total 60 families live below the poverty line. Families with 3 or 4 children have the highest poverty rate of 100.0%, comprising of 2 families. On the other hand, families with no children have the lowest poverty rate of 0.0%, which includes 0 families.
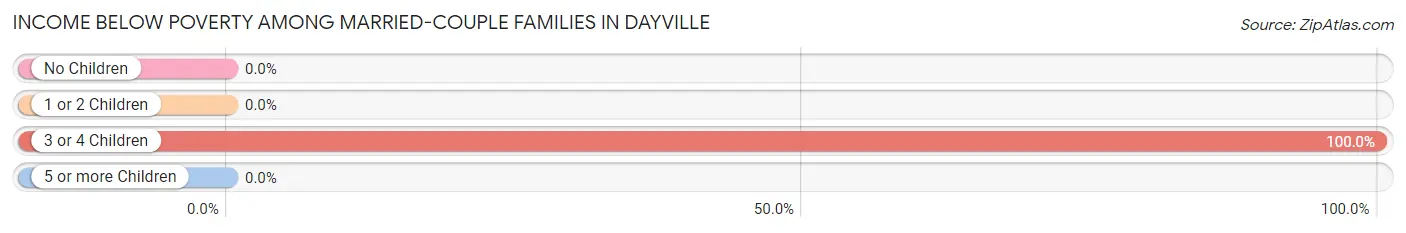
| Children | Above Poverty | Below Poverty |
| No Children | 29 (100.0%) | 0 (0.0%) |
| 1 or 2 Children | 29 (100.0%) | 0 (0.0%) |
| 3 or 4 Children | 0 (0.0%) | 2 (100.0%) |
| 5 or more Children | 0 (0.0%) | 0 (0.0%) |
| Total | 58 (96.7%) | 2 (3.3%) |
Income Below Poverty Among Single-Parent Households in Dayville
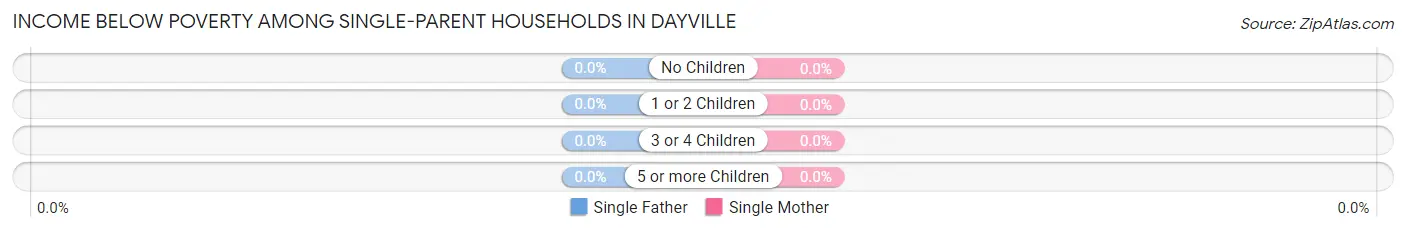
| Children | Single Father | Single Mother |
| No Children | 0 (0.0%) | 0 (0.0%) |
| 1 or 2 Children | 0 (0.0%) | 0 (0.0%) |
| 3 or 4 Children | 0 (0.0%) | 0 (0.0%) |
| 5 or more Children | 0 (0.0%) | 0 (0.0%) |
| Total | 0 (0.0%) | 0 (0.0%) |
Income Below Poverty Among Married-Couple vs Single-Parent Households in Dayville
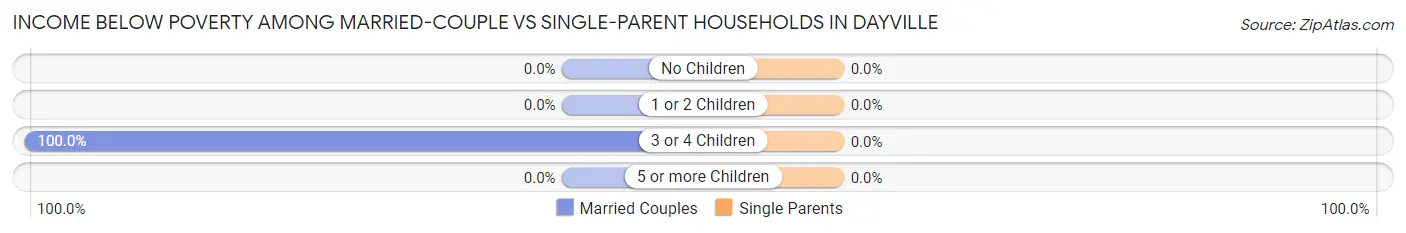
| Children | Married-Couple Families | Single-Parent Households |
| No Children | 0 (0.0%) | 0 (0.0%) |
| 1 or 2 Children | 0 (0.0%) | 0 (0.0%) |
| 3 or 4 Children | 2 (100.0%) | 0 (0.0%) |
| 5 or more Children | 0 (0.0%) | 0 (0.0%) |
| Total | 2 (3.3%) | 0 (0.0%) |
Employment Characteristics in Dayville
Employment by Class of Employer in Dayville
Among the 104 employed individuals in Dayville, private company employees (53 | 51.0%), self-employed (not incorporated) (23 | 22.1%), and local government employees (13 | 12.5%) make up the most common classes of employment.
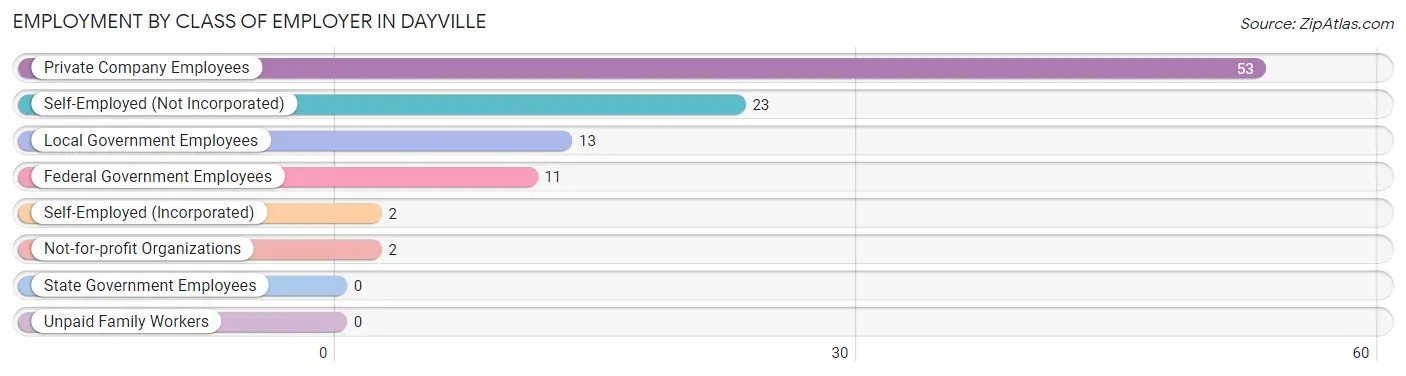
| Employer Class | # Employees | % Employees |
| Private Company Employees | 53 | 51.0% |
| Self-Employed (Incorporated) | 2 | 1.9% |
| Self-Employed (Not Incorporated) | 23 | 22.1% |
| Not-for-profit Organizations | 2 | 1.9% |
| Local Government Employees | 13 | 12.5% |
| State Government Employees | 0 | 0.0% |
| Federal Government Employees | 11 | 10.6% |
| Unpaid Family Workers | 0 | 0.0% |
| Total | 104 | 100.0% |
Employment Status by Age in Dayville
According to the labor force statistics for Dayville, out of the total population over 16 years of age (188), 59.0% or 111 individuals are in the labor force, with 6.3% or 7 of them unemployed. The age group with the highest labor force participation rate is 20 to 24 years, with 100.0% or 1 individuals in the labor force. Within the labor force, the 20 to 24 years age range has the highest percentage of unemployed individuals, with 100.0% or 1 of them being unemployed.
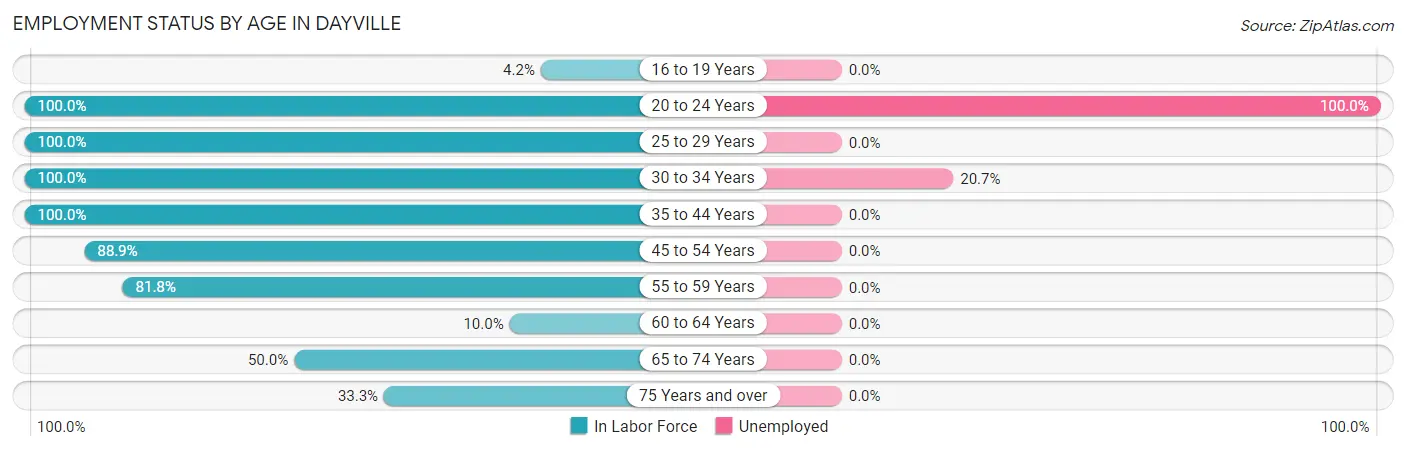
| Age Bracket | In Labor Force | Unemployed |
| 16 to 19 Years | 1 (4.2%) | 0 (0.0%) |
| 20 to 24 Years | 1 (100.0%) | 1 (100.0%) |
| 25 to 29 Years | 10 (100.0%) | 0 (0.0%) |
| 30 to 34 Years | 29 (100.0%) | 6 (20.7%) |
| 35 to 44 Years | 26 (100.0%) | 0 (0.0%) |
| 45 to 54 Years | 8 (88.9%) | 0 (0.0%) |
| 55 to 59 Years | 9 (81.8%) | 0 (0.0%) |
| 60 to 64 Years | 2 (10.0%) | 0 (0.0%) |
| 65 to 74 Years | 17 (50.0%) | 0 (0.0%) |
| 75 Years and over | 8 (33.3%) | 0 (0.0%) |
| Total | 111 (59.0%) | 7 (6.3%) |
Employment Status by Educational Attainment in Dayville
According to labor force statistics for Dayville, 80.0% of individuals (84) out of the total population between 25 and 64 years of age (105) are in the labor force, with 7.1% or 6 of them being unemployed. The group with the highest labor force participation rate are those with the educational attainment of less than high school, with 100.0% or 25 individuals in the labor force. Within the labor force, individuals with high school diploma education have the highest percentage of unemployment, with 37.5% or 6 of them being unemployed.
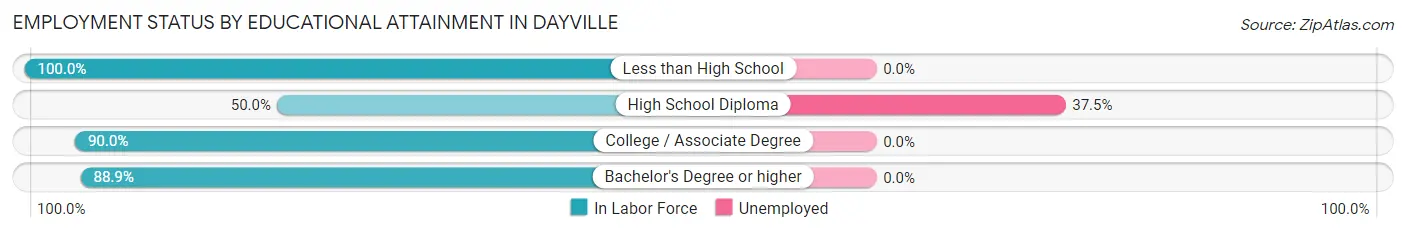
| Educational Attainment | In Labor Force | Unemployed |
| Less than High School | 25 (100.0%) | 0 (0.0%) |
| High School Diploma | 16 (50.0%) | 12 (37.5%) |
| College / Associate Degree | 27 (90.0%) | 0 (0.0%) |
| Bachelor's Degree or higher | 16 (88.9%) | 0 (0.0%) |
| Total | 84 (80.0%) | 7 (7.1%) |
Employment Occupations by Sex in Dayville
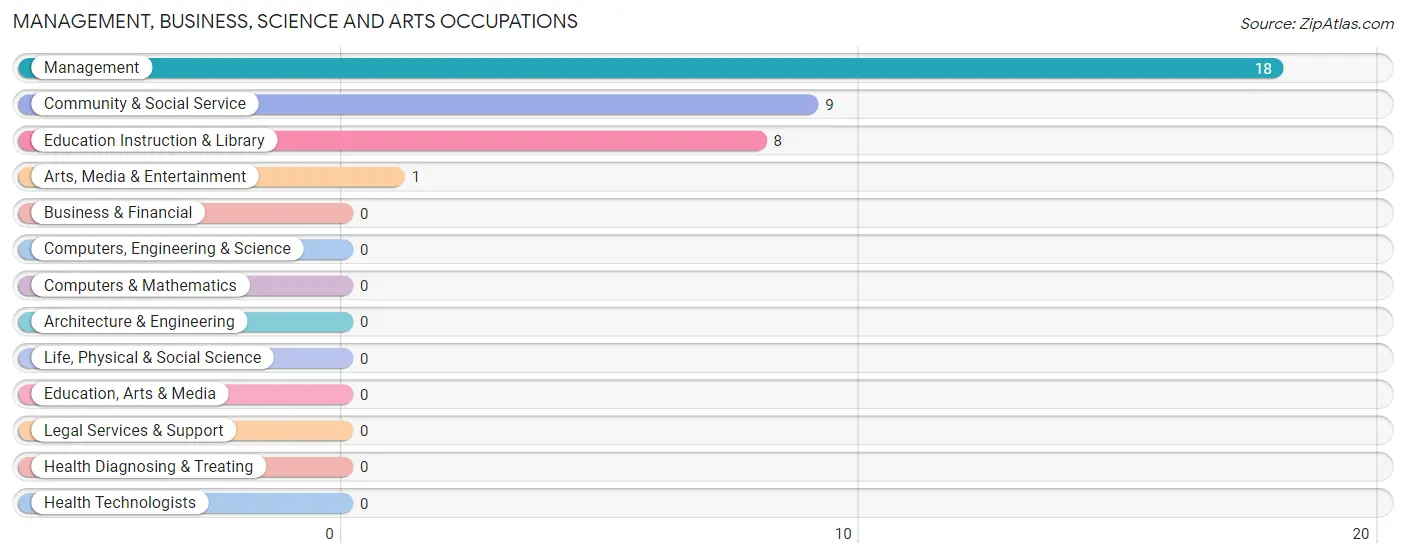
Management, Business, Science and Arts Occupations
The most common Management, Business, Science and Arts occupations in Dayville are Management (18 | 17.3%), Community & Social Service (9 | 8.6%), Education Instruction & Library (8 | 7.7%), and Arts, Media & Entertainment (1 | 1.0%).
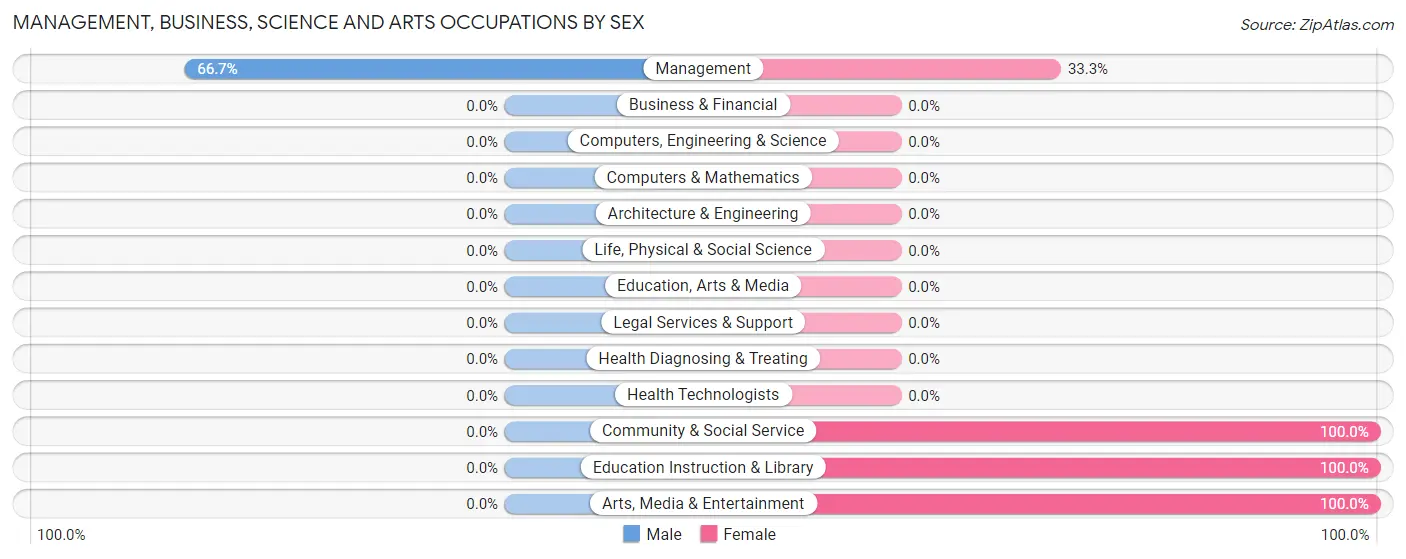
Management, Business, Science and Arts Occupations by Sex
| Occupation | Male | Female |
| Management | 12 (66.7%) | 6 (33.3%) |
| Business & Financial | 0 (0.0%) | 0 (0.0%) |
| Computers, Engineering & Science | 0 (0.0%) | 0 (0.0%) |
| Computers & Mathematics | 0 (0.0%) | 0 (0.0%) |
| Architecture & Engineering | 0 (0.0%) | 0 (0.0%) |
| Life, Physical & Social Science | 0 (0.0%) | 0 (0.0%) |
| Community & Social Service | 0 (0.0%) | 9 (100.0%) |
| Education, Arts & Media | 0 (0.0%) | 0 (0.0%) |
| Legal Services & Support | 0 (0.0%) | 0 (0.0%) |
| Education Instruction & Library | 0 (0.0%) | 8 (100.0%) |
| Arts, Media & Entertainment | 0 (0.0%) | 1 (100.0%) |
| Health Diagnosing & Treating | 0 (0.0%) | 0 (0.0%) |
| Health Technologists | 0 (0.0%) | 0 (0.0%) |
| Total (Category) | 12 (44.4%) | 15 (55.6%) |
| Total (Overall) | 61 (58.7%) | 43 (41.3%) |
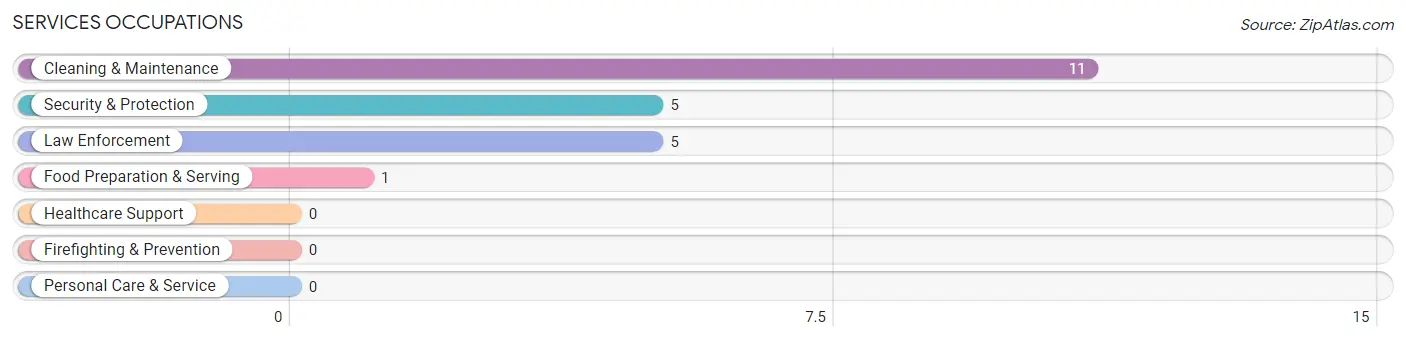
Services Occupations
The most common Services occupations in Dayville are Cleaning & Maintenance (11 | 10.6%), Security & Protection (5 | 4.8%), Law Enforcement (5 | 4.8%), and Food Preparation & Serving (1 | 1.0%).
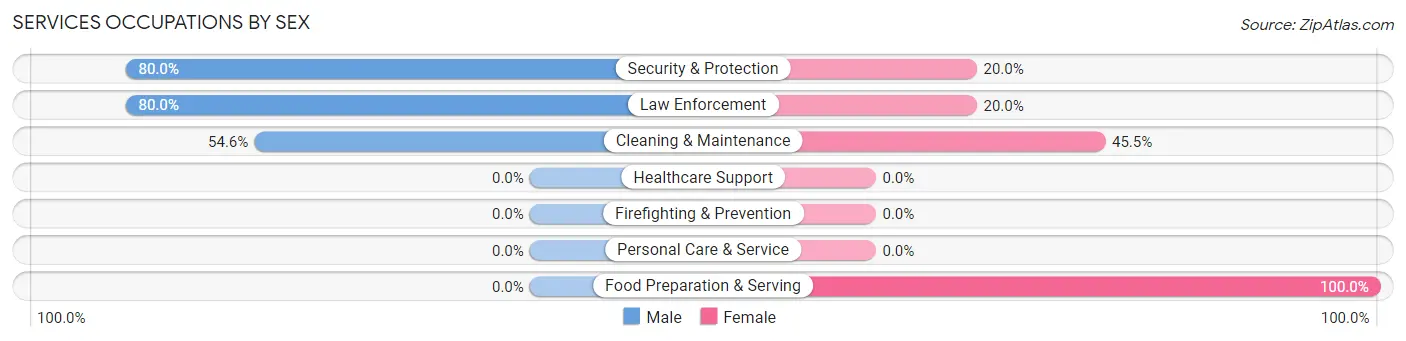
Services Occupations by Sex
Within the Services occupations in Dayville, the most male-oriented occupations are Security & Protection (80.0%), Law Enforcement (80.0%), and Cleaning & Maintenance (54.5%), while the most female-oriented occupations are Food Preparation & Serving (100.0%), Cleaning & Maintenance (45.5%), and Security & Protection (20.0%).
| Occupation | Male | Female |
| Healthcare Support | 0 (0.0%) | 0 (0.0%) |
| Security & Protection | 4 (80.0%) | 1 (20.0%) |
| Firefighting & Prevention | 0 (0.0%) | 0 (0.0%) |
| Law Enforcement | 4 (80.0%) | 1 (20.0%) |
| Food Preparation & Serving | 0 (0.0%) | 1 (100.0%) |
| Cleaning & Maintenance | 6 (54.5%) | 5 (45.5%) |
| Personal Care & Service | 0 (0.0%) | 0 (0.0%) |
| Total (Category) | 10 (58.8%) | 7 (41.2%) |
| Total (Overall) | 61 (58.7%) | 43 (41.3%) |
Sales and Office Occupations
The most common Sales and Office occupations in Dayville are , and Office & Administration (7 | 6.7%).
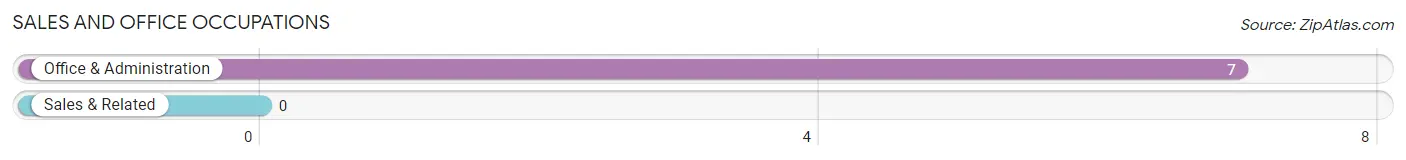
Sales and Office Occupations by Sex
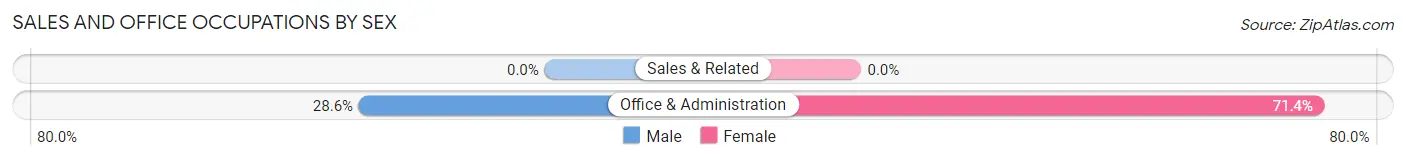
| Occupation | Male | Female |
| Sales & Related | 0 (0.0%) | 0 (0.0%) |
| Office & Administration | 2 (28.6%) | 5 (71.4%) |
| Total (Category) | 2 (28.6%) | 5 (71.4%) |
| Total (Overall) | 61 (58.7%) | 43 (41.3%) |
Natural Resources, Construction and Maintenance Occupations
The most common Natural Resources, Construction and Maintenance occupations in Dayville are Construction & Extraction (43 | 41.3%), Installation, Maintenance & Repair (3 | 2.9%), and Farming, Fishing & Forestry (1 | 1.0%).
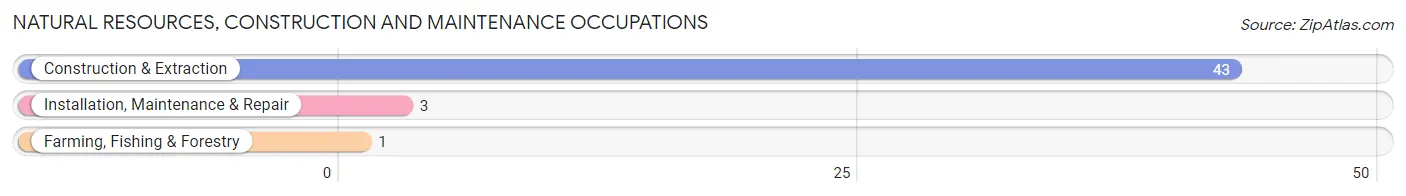
Natural Resources, Construction and Maintenance Occupations by Sex
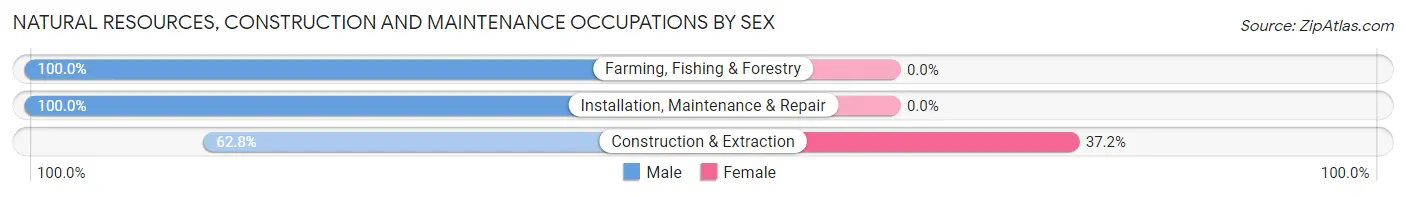
| Occupation | Male | Female |
| Farming, Fishing & Forestry | 1 (100.0%) | 0 (0.0%) |
| Construction & Extraction | 27 (62.8%) | 16 (37.2%) |
| Installation, Maintenance & Repair | 3 (100.0%) | 0 (0.0%) |
| Total (Category) | 31 (66.0%) | 16 (34.0%) |
| Total (Overall) | 61 (58.7%) | 43 (41.3%) |
Production, Transportation and Moving Occupations
The most common Production, Transportation and Moving occupations in Dayville are Transportation (5 | 4.8%), and Production (1 | 1.0%).
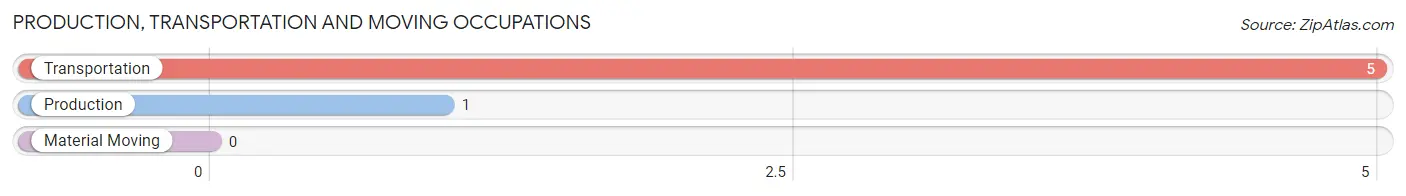
Production, Transportation and Moving Occupations by Sex
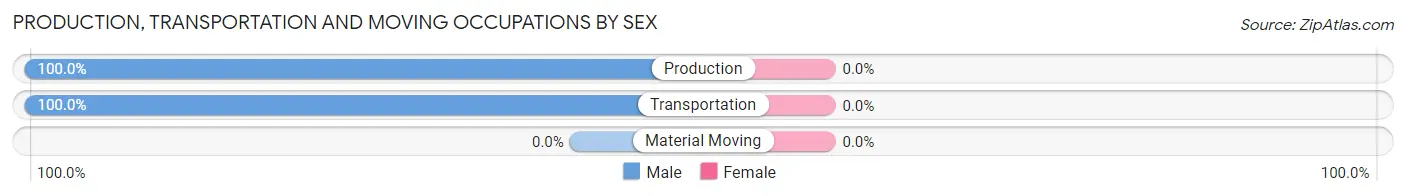
| Occupation | Male | Female |
| Production | 1 (100.0%) | 0 (0.0%) |
| Transportation | 5 (100.0%) | 0 (0.0%) |
| Material Moving | 0 (0.0%) | 0 (0.0%) |
| Total (Category) | 6 (100.0%) | 0 (0.0%) |
| Total (Overall) | 61 (58.7%) | 43 (41.3%) |
Employment Industries by Sex in Dayville
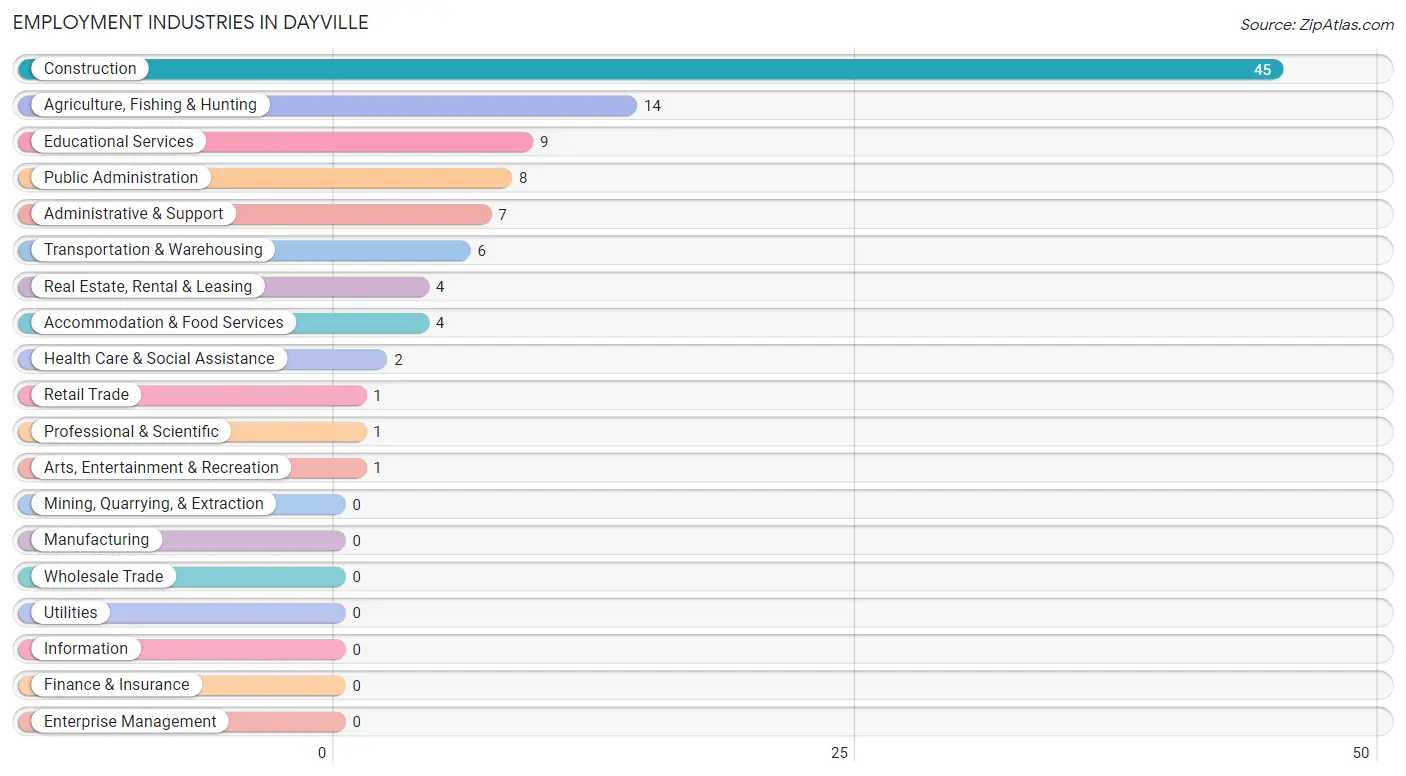
Employment Industries in Dayville
The major employment industries in Dayville include Construction (45 | 43.3%), Agriculture, Fishing & Hunting (14 | 13.5%), Educational Services (9 | 8.6%), Public Administration (8 | 7.7%), and Administrative & Support (7 | 6.7%).
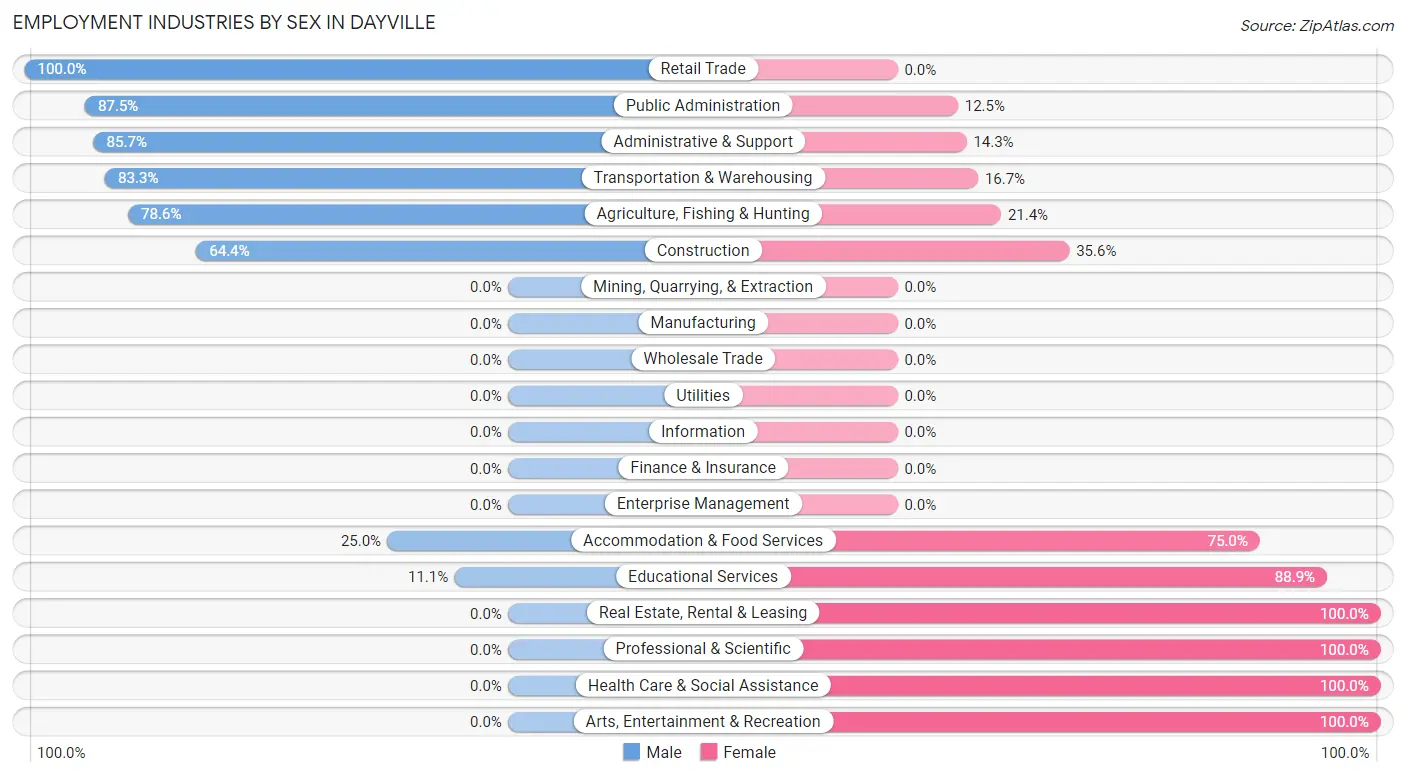
Employment Industries by Sex in Dayville
The Dayville industries that see more men than women are Retail Trade (100.0%), Public Administration (87.5%), and Administrative & Support (85.7%), whereas the industries that tend to have a higher number of women are Real Estate, Rental & Leasing (100.0%), Professional & Scientific (100.0%), and Health Care & Social Assistance (100.0%).
| Industry | Male | Female |
| Agriculture, Fishing & Hunting | 11 (78.6%) | 3 (21.4%) |
| Mining, Quarrying, & Extraction | 0 (0.0%) | 0 (0.0%) |
| Construction | 29 (64.4%) | 16 (35.6%) |
| Manufacturing | 0 (0.0%) | 0 (0.0%) |
| Wholesale Trade | 0 (0.0%) | 0 (0.0%) |
| Retail Trade | 1 (100.0%) | 0 (0.0%) |
| Transportation & Warehousing | 5 (83.3%) | 1 (16.7%) |
| Utilities | 0 (0.0%) | 0 (0.0%) |
| Information | 0 (0.0%) | 0 (0.0%) |
| Finance & Insurance | 0 (0.0%) | 0 (0.0%) |
| Real Estate, Rental & Leasing | 0 (0.0%) | 4 (100.0%) |
| Professional & Scientific | 0 (0.0%) | 1 (100.0%) |
| Enterprise Management | 0 (0.0%) | 0 (0.0%) |
| Administrative & Support | 6 (85.7%) | 1 (14.3%) |
| Educational Services | 1 (11.1%) | 8 (88.9%) |
| Health Care & Social Assistance | 0 (0.0%) | 2 (100.0%) |
| Arts, Entertainment & Recreation | 0 (0.0%) | 1 (100.0%) |
| Accommodation & Food Services | 1 (25.0%) | 3 (75.0%) |
| Public Administration | 7 (87.5%) | 1 (12.5%) |
| Total | 61 (58.7%) | 43 (41.3%) |
Education in Dayville
School Enrollment in Dayville
The most common levels of schooling among the 83 students in Dayville are high school (23 | 27.7%), middle school (20 | 24.1%), and graduate / professional (12 | 14.5%).
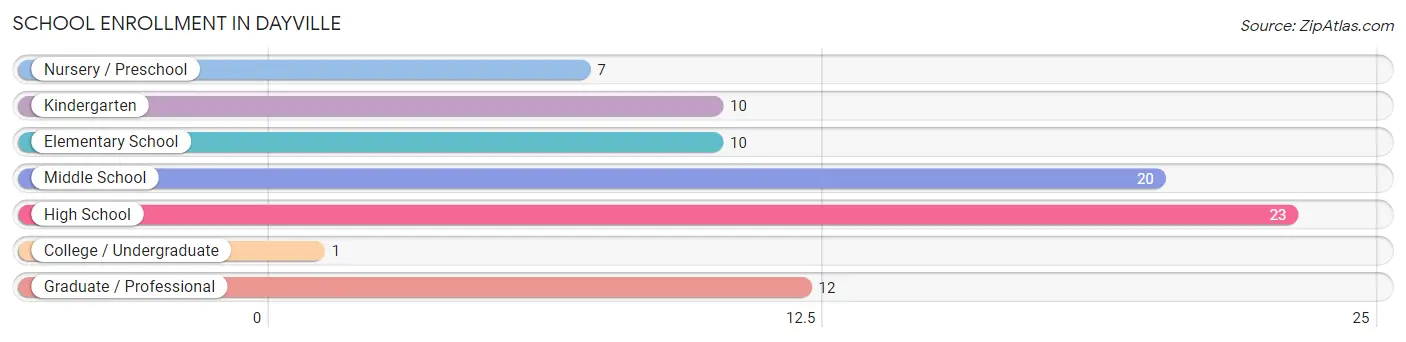
| School Level | # Students | % Students |
| Nursery / Preschool | 7 | 8.4% |
| Kindergarten | 10 | 12.0% |
| Elementary School | 10 | 12.0% |
| Middle School | 20 | 24.1% |
| High School | 23 | 27.7% |
| College / Undergraduate | 1 | 1.2% |
| Graduate / Professional | 12 | 14.5% |
| Total | 83 | 100.0% |
School Enrollment by Age by Funding Source in Dayville
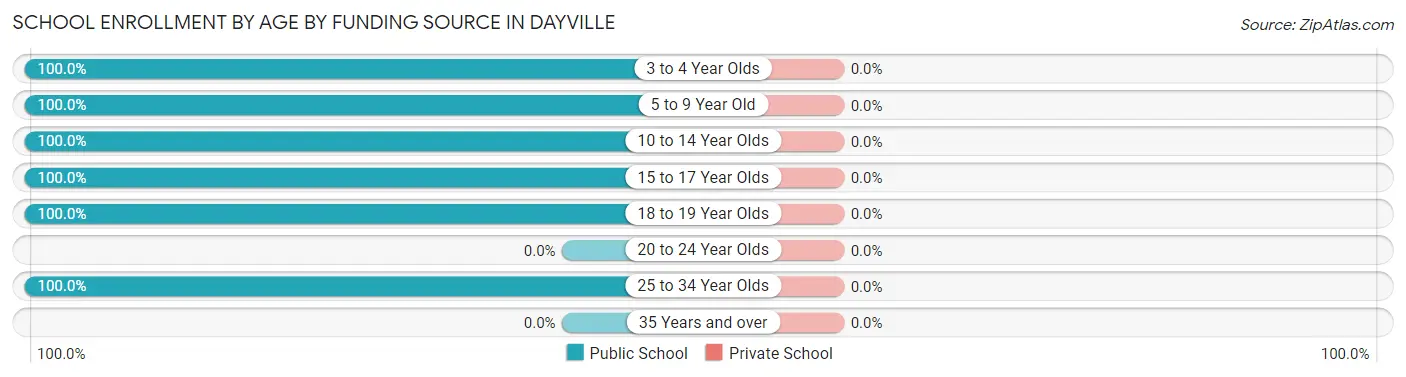
| Age Bracket | Public School | Private School |
| 3 to 4 Year Olds | 4 (100.0%) | 0 (0.0%) |
| 5 to 9 Year Old | 23 (100.0%) | 0 (0.0%) |
| 10 to 14 Year Olds | 20 (100.0%) | 0 (0.0%) |
| 15 to 17 Year Olds | 23 (100.0%) | 0 (0.0%) |
| 18 to 19 Year Olds | 1 (100.0%) | 0 (0.0%) |
| 20 to 24 Year Olds | 0 (0.0%) | 0 (0.0%) |
| 25 to 34 Year Olds | 12 (100.0%) | 0 (0.0%) |
| 35 Years and over | 0 (0.0%) | 0 (0.0%) |
| Total | 83 (100.0%) | 0 (0.0%) |
Educational Attainment by Field of Study in Dayville
Education (10 | 29.4%), bio, nature & agricultural (7 | 20.6%), social sciences (6 | 17.6%), science & technology (3 | 8.8%), and business (3 | 8.8%) are the most common fields of study among 34 individuals in Dayville who have obtained a bachelor's degree or higher.
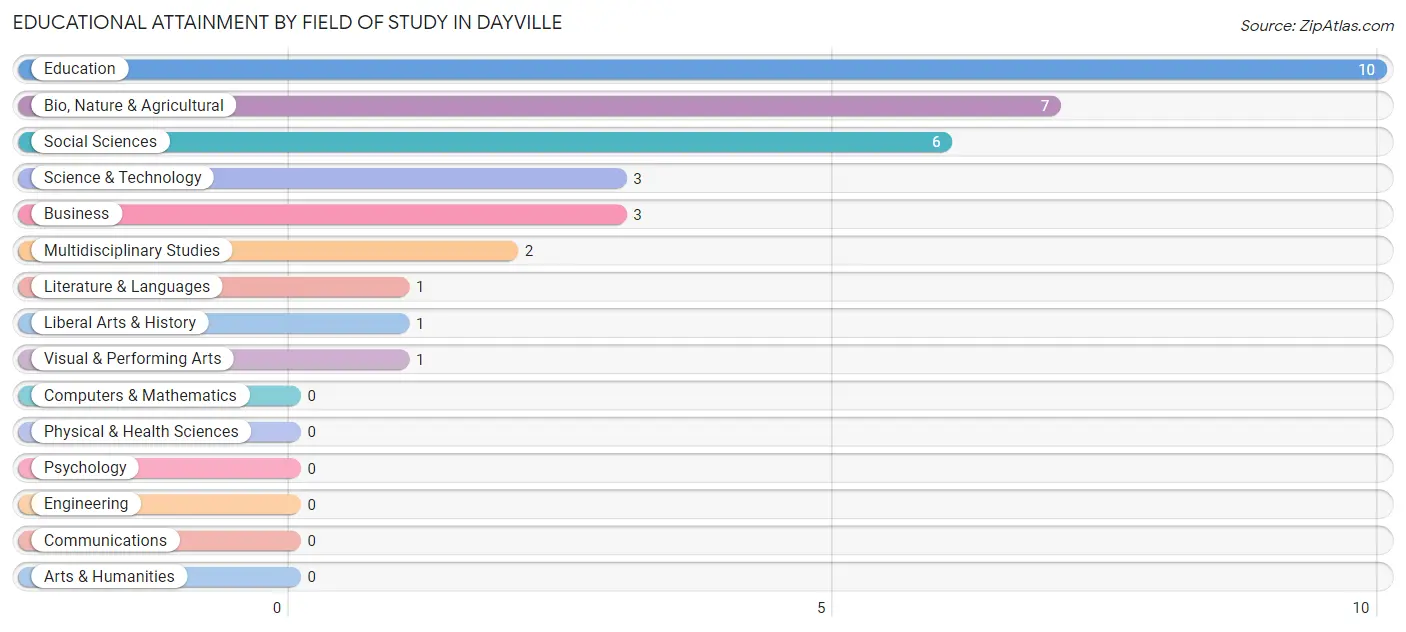
| Field of Study | # Graduates | % Graduates |
| Computers & Mathematics | 0 | 0.0% |
| Bio, Nature & Agricultural | 7 | 20.6% |
| Physical & Health Sciences | 0 | 0.0% |
| Psychology | 0 | 0.0% |
| Social Sciences | 6 | 17.6% |
| Engineering | 0 | 0.0% |
| Multidisciplinary Studies | 2 | 5.9% |
| Science & Technology | 3 | 8.8% |
| Business | 3 | 8.8% |
| Education | 10 | 29.4% |
| Literature & Languages | 1 | 2.9% |
| Liberal Arts & History | 1 | 2.9% |
| Visual & Performing Arts | 1 | 2.9% |
| Communications | 0 | 0.0% |
| Arts & Humanities | 0 | 0.0% |
| Total | 34 | 100.0% |
Transportation & Commute in Dayville
Vehicle Availability by Sex in Dayville
The most prevalent vehicle ownership categories in Dayville are males with 4 vehicles (25, accounting for 41.0%) and females with 4 vehicles (16, making up 58.1%).
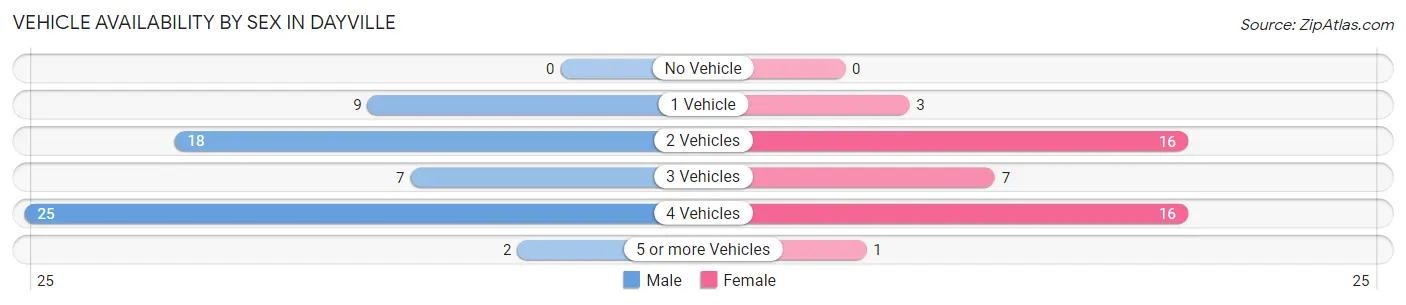
| Vehicles Available | Male | Female |
| No Vehicle | 0 (0.0%) | 0 (0.0%) |
| 1 Vehicle | 9 (14.7%) | 3 (7.0%) |
| 2 Vehicles | 18 (29.5%) | 16 (37.2%) |
| 3 Vehicles | 7 (11.5%) | 7 (16.3%) |
| 4 Vehicles | 25 (41.0%) | 16 (37.2%) |
| 5 or more Vehicles | 2 (3.3%) | 1 (2.3%) |
| Total | 61 (100.0%) | 43 (100.0%) |
Commute Time in Dayville
The most frequently occuring commute durations in Dayville are less than 5 minutes (37 commuters, 36.3%), 5 to 9 minutes (24 commuters, 23.5%), and 40 to 44 minutes (21 commuters, 20.6%).
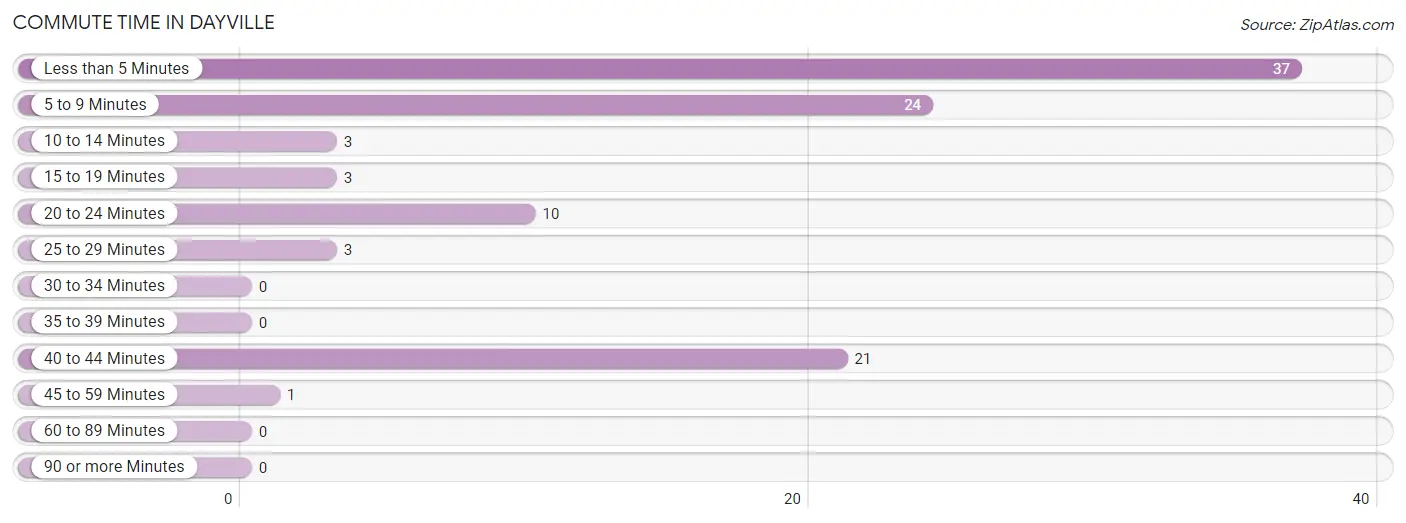
| Commute Time | # Commuters | % Commuters |
| Less than 5 Minutes | 37 | 36.3% |
| 5 to 9 Minutes | 24 | 23.5% |
| 10 to 14 Minutes | 3 | 2.9% |
| 15 to 19 Minutes | 3 | 2.9% |
| 20 to 24 Minutes | 10 | 9.8% |
| 25 to 29 Minutes | 3 | 2.9% |
| 30 to 34 Minutes | 0 | 0.0% |
| 35 to 39 Minutes | 0 | 0.0% |
| 40 to 44 Minutes | 21 | 20.6% |
| 45 to 59 Minutes | 1 | 1.0% |
| 60 to 89 Minutes | 0 | 0.0% |
| 90 or more Minutes | 0 | 0.0% |
Commute Time by Sex in Dayville
The most common commute times in Dayville are less than 5 minutes (33 commuters, 54.1%) for males and 40 to 44 minutes (18 commuters, 43.9%) for females.
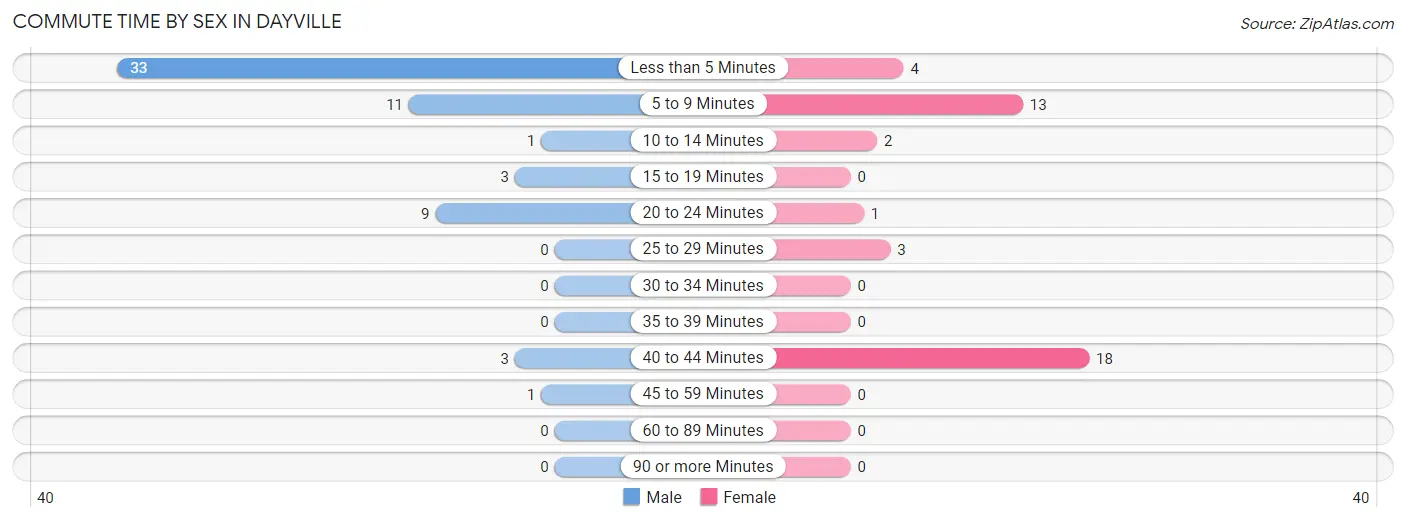
| Commute Time | Male | Female |
| Less than 5 Minutes | 33 (54.1%) | 4 (9.8%) |
| 5 to 9 Minutes | 11 (18.0%) | 13 (31.7%) |
| 10 to 14 Minutes | 1 (1.6%) | 2 (4.9%) |
| 15 to 19 Minutes | 3 (4.9%) | 0 (0.0%) |
| 20 to 24 Minutes | 9 (14.7%) | 1 (2.4%) |
| 25 to 29 Minutes | 0 (0.0%) | 3 (7.3%) |
| 30 to 34 Minutes | 0 (0.0%) | 0 (0.0%) |
| 35 to 39 Minutes | 0 (0.0%) | 0 (0.0%) |
| 40 to 44 Minutes | 3 (4.9%) | 18 (43.9%) |
| 45 to 59 Minutes | 1 (1.6%) | 0 (0.0%) |
| 60 to 89 Minutes | 0 (0.0%) | 0 (0.0%) |
| 90 or more Minutes | 0 (0.0%) | 0 (0.0%) |
Time of Departure to Work by Sex in Dayville
The most frequent times of departure to work in Dayville are 5:00 AM to 5:29 AM (27, 44.3%) for males and 7:00 AM to 7:29 AM (22, 53.7%) for females.
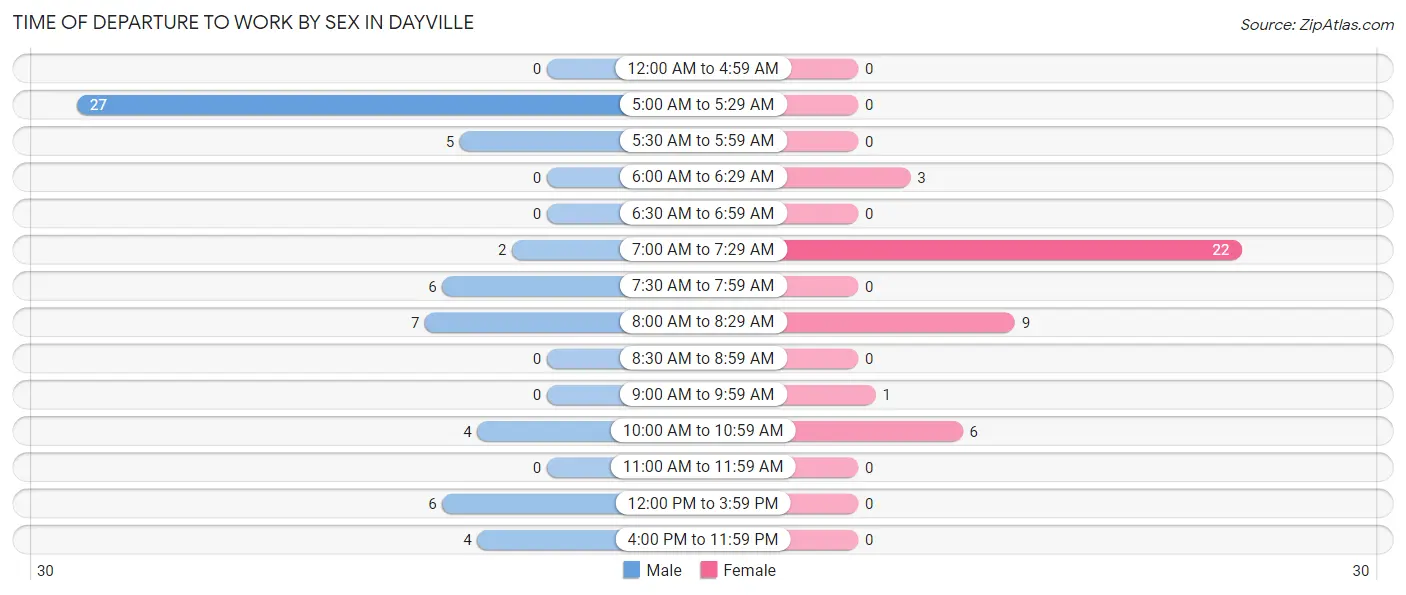
| Time of Departure | Male | Female |
| 12:00 AM to 4:59 AM | 0 (0.0%) | 0 (0.0%) |
| 5:00 AM to 5:29 AM | 27 (44.3%) | 0 (0.0%) |
| 5:30 AM to 5:59 AM | 5 (8.2%) | 0 (0.0%) |
| 6:00 AM to 6:29 AM | 0 (0.0%) | 3 (7.3%) |
| 6:30 AM to 6:59 AM | 0 (0.0%) | 0 (0.0%) |
| 7:00 AM to 7:29 AM | 2 (3.3%) | 22 (53.7%) |
| 7:30 AM to 7:59 AM | 6 (9.8%) | 0 (0.0%) |
| 8:00 AM to 8:29 AM | 7 (11.5%) | 9 (22.0%) |
| 8:30 AM to 8:59 AM | 0 (0.0%) | 0 (0.0%) |
| 9:00 AM to 9:59 AM | 0 (0.0%) | 1 (2.4%) |
| 10:00 AM to 10:59 AM | 4 (6.6%) | 6 (14.6%) |
| 11:00 AM to 11:59 AM | 0 (0.0%) | 0 (0.0%) |
| 12:00 PM to 3:59 PM | 6 (9.8%) | 0 (0.0%) |
| 4:00 PM to 11:59 PM | 4 (6.6%) | 0 (0.0%) |
| Total | 61 (100.0%) | 41 (100.0%) |
Housing Occupancy in Dayville
Occupancy by Ownership in Dayville
Of the total 110 dwellings in Dayville, owner-occupied units account for 92 (83.6%), while renter-occupied units make up 18 (16.4%).
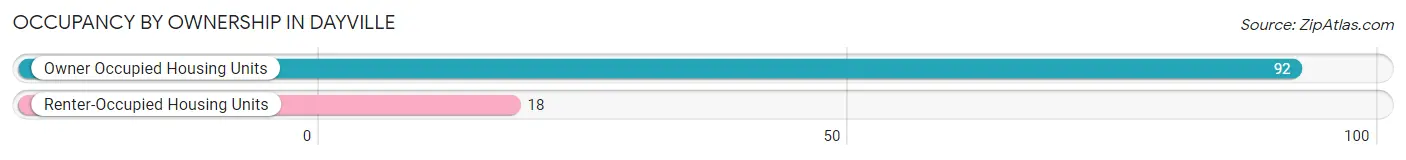
| Occupancy | # Housing Units | % Housing Units |
| Owner Occupied Housing Units | 92 | 83.6% |
| Renter-Occupied Housing Units | 18 | 16.4% |
| Total Occupied Housing Units | 110 | 100.0% |
Occupancy by Household Size in Dayville
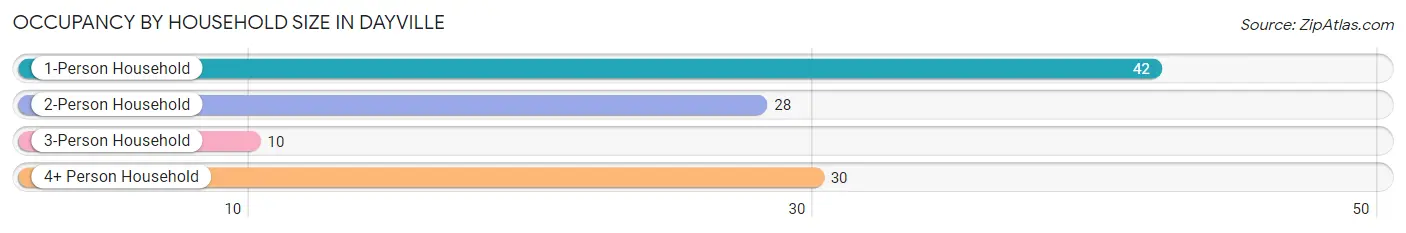
| Household Size | # Housing Units | % Housing Units |
| 1-Person Household | 42 | 38.2% |
| 2-Person Household | 28 | 25.5% |
| 3-Person Household | 10 | 9.1% |
| 4+ Person Household | 30 | 27.3% |
| Total Housing Units | 110 | 100.0% |
Occupancy by Ownership by Household Size in Dayville
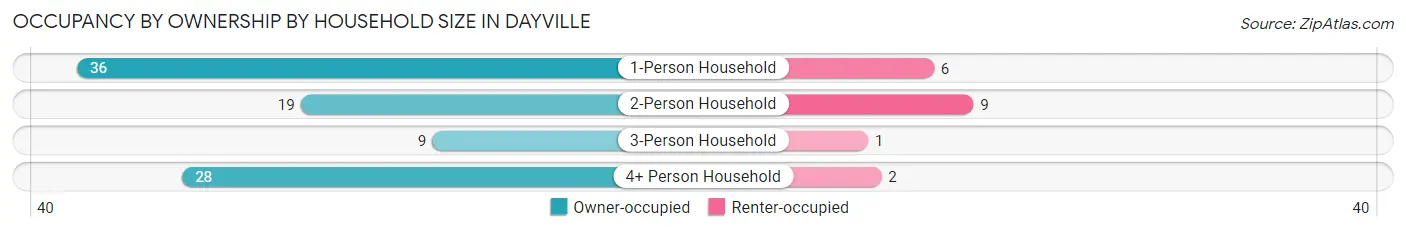
| Household Size | Owner-occupied | Renter-occupied |
| 1-Person Household | 36 (85.7%) | 6 (14.3%) |
| 2-Person Household | 19 (67.9%) | 9 (32.1%) |
| 3-Person Household | 9 (90.0%) | 1 (10.0%) |
| 4+ Person Household | 28 (93.3%) | 2 (6.7%) |
| Total Housing Units | 92 (83.6%) | 18 (16.4%) |
Occupancy by Educational Attainment in Dayville
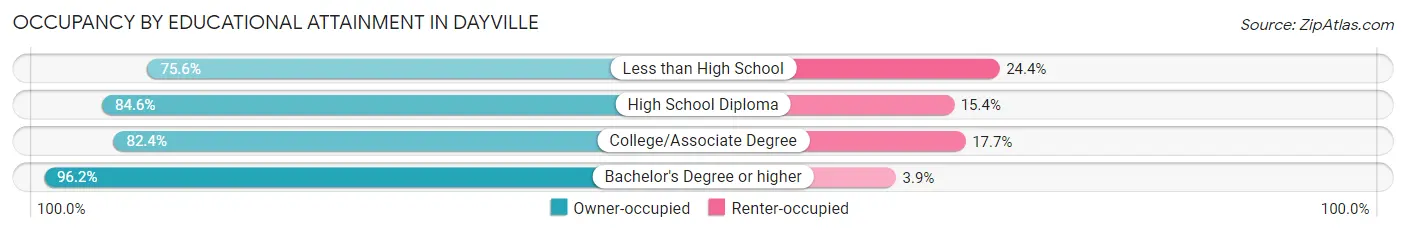
| Household Size | Owner-occupied | Renter-occupied |
| Less than High School | 31 (75.6%) | 10 (24.4%) |
| High School Diploma | 22 (84.6%) | 4 (15.4%) |
| College/Associate Degree | 14 (82.4%) | 3 (17.6%) |
| Bachelor's Degree or higher | 25 (96.2%) | 1 (3.8%) |
Occupancy by Age of Householder in Dayville
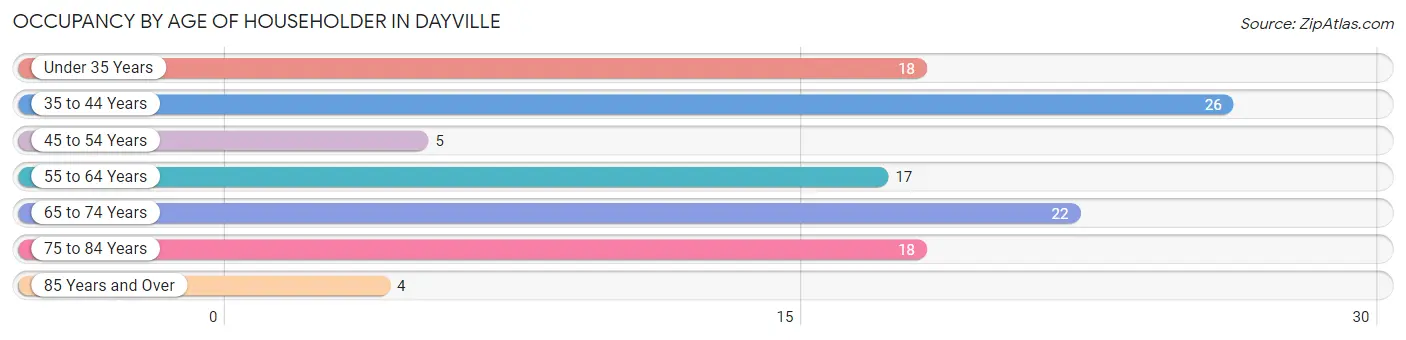
| Age Bracket | # Households | % Households |
| Under 35 Years | 18 | 16.4% |
| 35 to 44 Years | 26 | 23.6% |
| 45 to 54 Years | 5 | 4.5% |
| 55 to 64 Years | 17 | 15.4% |
| 65 to 74 Years | 22 | 20.0% |
| 75 to 84 Years | 18 | 16.4% |
| 85 Years and Over | 4 | 3.6% |
| Total | 110 | 100.0% |
Housing Finances in Dayville
Median Income by Occupancy in Dayville
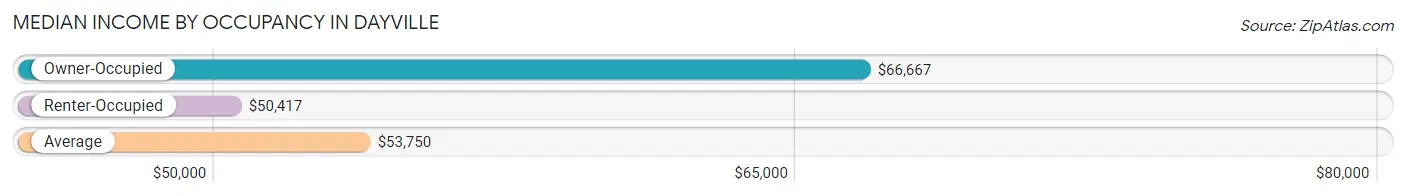
| Occupancy Type | # Households | Median Income |
| Owner-Occupied | 92 (83.6%) | $66,667 |
| Renter-Occupied | 18 (16.4%) | $50,417 |
| Average | 110 (100.0%) | $53,750 |
Occupancy by Householder Income Bracket in Dayville
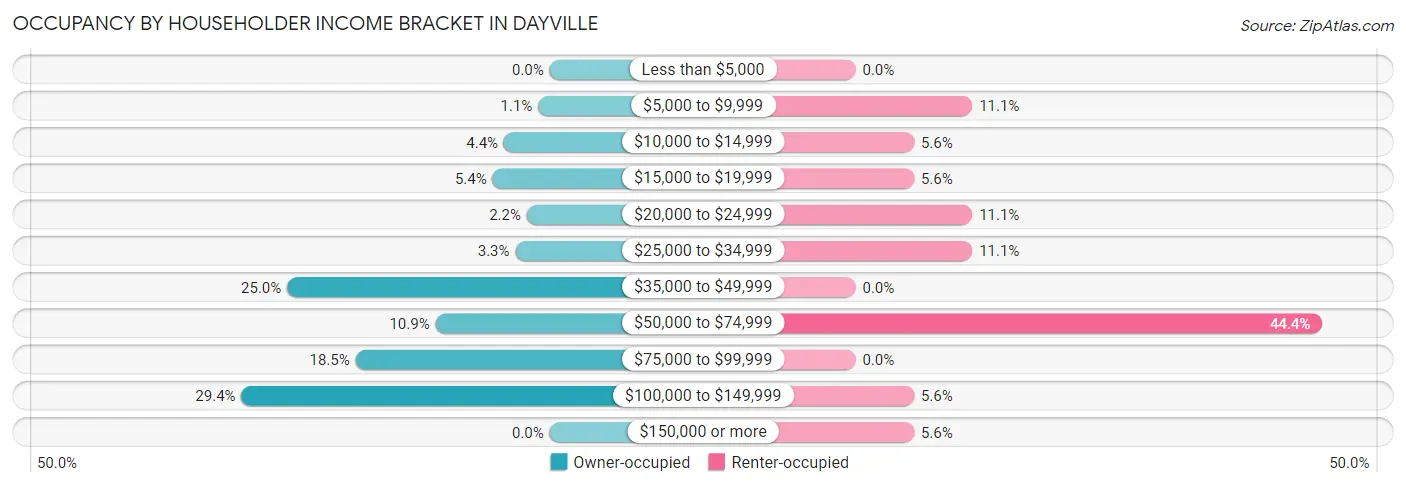
| Income Bracket | Owner-occupied | Renter-occupied |
| Less than $5,000 | 0 (0.0%) | 0 (0.0%) |
| $5,000 to $9,999 | 1 (1.1%) | 2 (11.1%) |
| $10,000 to $14,999 | 4 (4.3%) | 1 (5.6%) |
| $15,000 to $19,999 | 5 (5.4%) | 1 (5.6%) |
| $20,000 to $24,999 | 2 (2.2%) | 2 (11.1%) |
| $25,000 to $34,999 | 3 (3.3%) | 2 (11.1%) |
| $35,000 to $49,999 | 23 (25.0%) | 0 (0.0%) |
| $50,000 to $74,999 | 10 (10.9%) | 8 (44.4%) |
| $75,000 to $99,999 | 17 (18.5%) | 0 (0.0%) |
| $100,000 to $149,999 | 27 (29.3%) | 1 (5.6%) |
| $150,000 or more | 0 (0.0%) | 1 (5.6%) |
| Total | 92 (100.0%) | 18 (100.0%) |
Monthly Housing Cost Tiers in Dayville
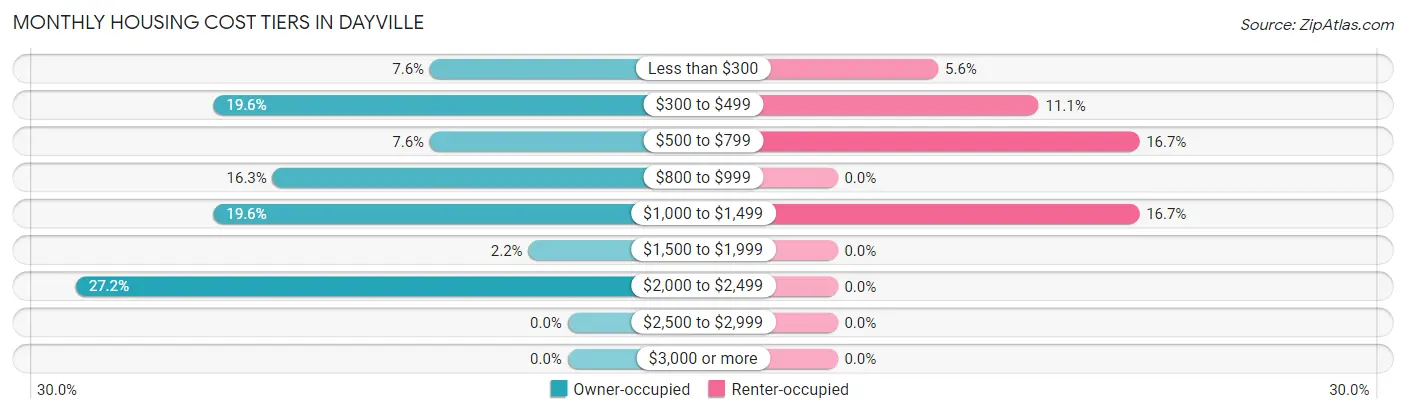
| Monthly Cost | Owner-occupied | Renter-occupied |
| Less than $300 | 7 (7.6%) | 1 (5.6%) |
| $300 to $499 | 18 (19.6%) | 2 (11.1%) |
| $500 to $799 | 7 (7.6%) | 3 (16.7%) |
| $800 to $999 | 15 (16.3%) | 0 (0.0%) |
| $1,000 to $1,499 | 18 (19.6%) | 3 (16.7%) |
| $1,500 to $1,999 | 2 (2.2%) | 0 (0.0%) |
| $2,000 to $2,499 | 25 (27.2%) | 0 (0.0%) |
| $2,500 to $2,999 | 0 (0.0%) | 0 (0.0%) |
| $3,000 or more | 0 (0.0%) | 0 (0.0%) |
| Total | 92 (100.0%) | 18 (100.0%) |
Physical Housing Characteristics in Dayville
Housing Structures in Dayville
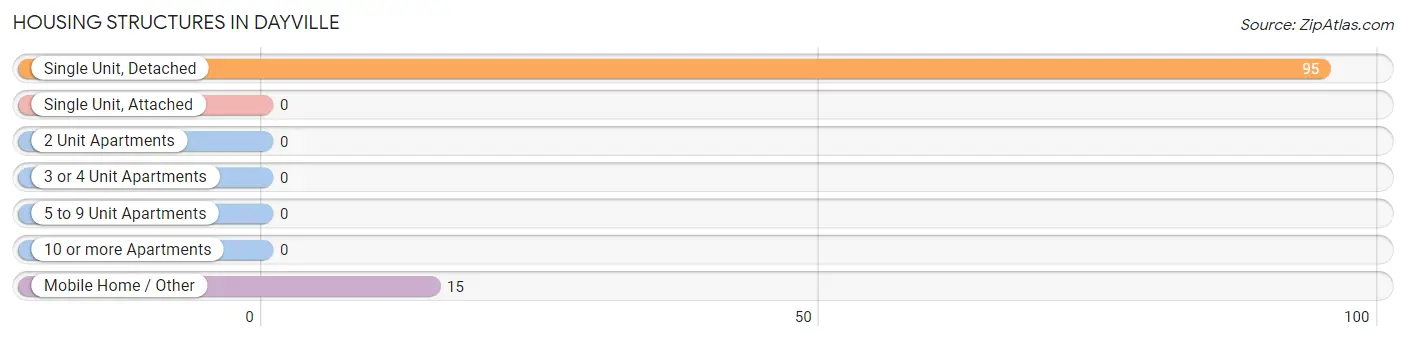
| Structure Type | # Housing Units | % Housing Units |
| Single Unit, Detached | 95 | 86.4% |
| Single Unit, Attached | 0 | 0.0% |
| 2 Unit Apartments | 0 | 0.0% |
| 3 or 4 Unit Apartments | 0 | 0.0% |
| 5 to 9 Unit Apartments | 0 | 0.0% |
| 10 or more Apartments | 0 | 0.0% |
| Mobile Home / Other | 15 | 13.6% |
| Total | 110 | 100.0% |
Housing Structures by Occupancy in Dayville
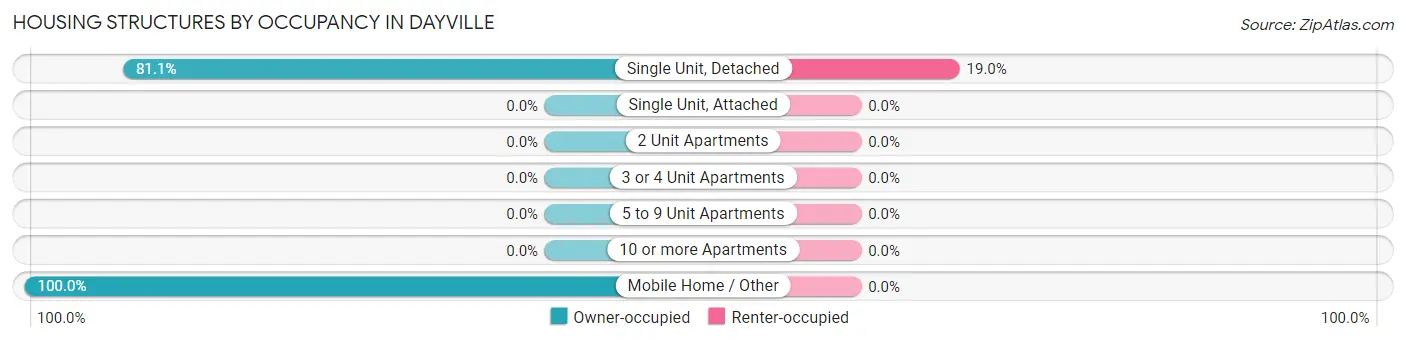
| Structure Type | Owner-occupied | Renter-occupied |
| Single Unit, Detached | 77 (81.0%) | 18 (19.0%) |
| Single Unit, Attached | 0 (0.0%) | 0 (0.0%) |
| 2 Unit Apartments | 0 (0.0%) | 0 (0.0%) |
| 3 or 4 Unit Apartments | 0 (0.0%) | 0 (0.0%) |
| 5 to 9 Unit Apartments | 0 (0.0%) | 0 (0.0%) |
| 10 or more Apartments | 0 (0.0%) | 0 (0.0%) |
| Mobile Home / Other | 15 (100.0%) | 0 (0.0%) |
| Total | 92 (83.6%) | 18 (16.4%) |
Housing Structures by Number of Rooms in Dayville
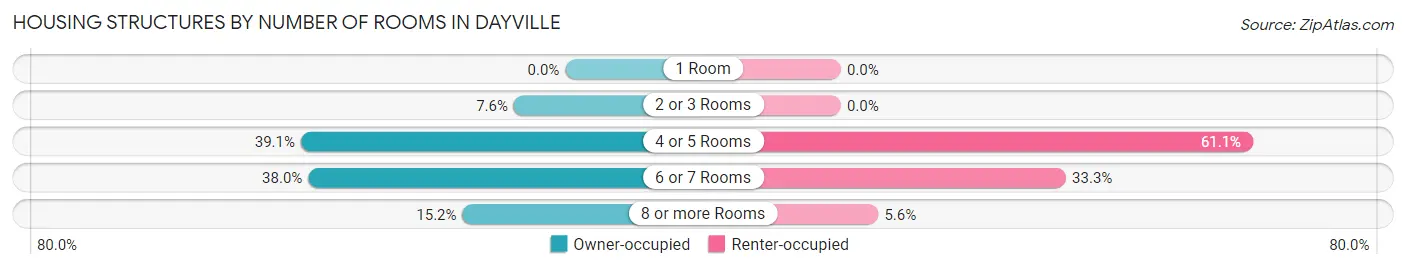
| Number of Rooms | Owner-occupied | Renter-occupied |
| 1 Room | 0 (0.0%) | 0 (0.0%) |
| 2 or 3 Rooms | 7 (7.6%) | 0 (0.0%) |
| 4 or 5 Rooms | 36 (39.1%) | 11 (61.1%) |
| 6 or 7 Rooms | 35 (38.0%) | 6 (33.3%) |
| 8 or more Rooms | 14 (15.2%) | 1 (5.6%) |
| Total | 92 (100.0%) | 18 (100.0%) |
Housing Structure by Heating Type in Dayville
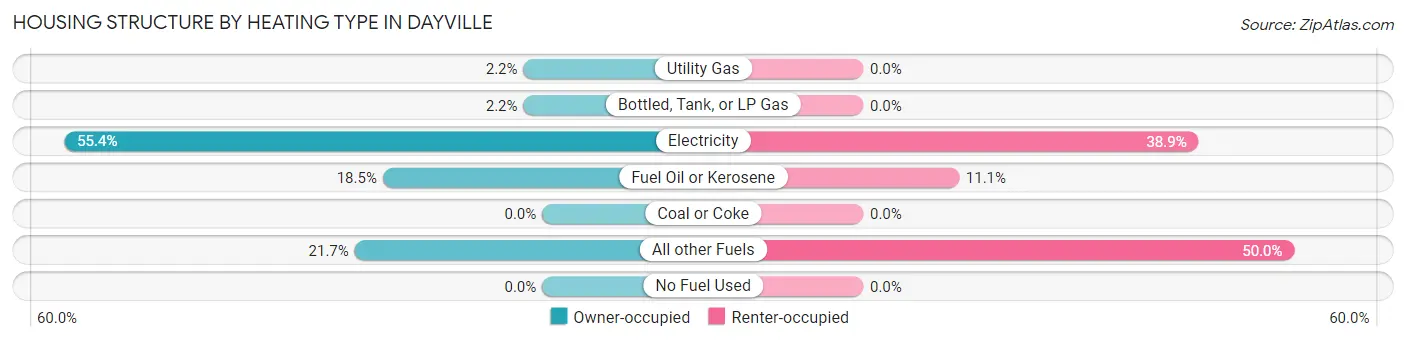
| Heating Type | Owner-occupied | Renter-occupied |
| Utility Gas | 2 (2.2%) | 0 (0.0%) |
| Bottled, Tank, or LP Gas | 2 (2.2%) | 0 (0.0%) |
| Electricity | 51 (55.4%) | 7 (38.9%) |
| Fuel Oil or Kerosene | 17 (18.5%) | 2 (11.1%) |
| Coal or Coke | 0 (0.0%) | 0 (0.0%) |
| All other Fuels | 20 (21.7%) | 9 (50.0%) |
| No Fuel Used | 0 (0.0%) | 0 (0.0%) |
| Total | 92 (100.0%) | 18 (100.0%) |
Household Vehicle Usage in Dayville
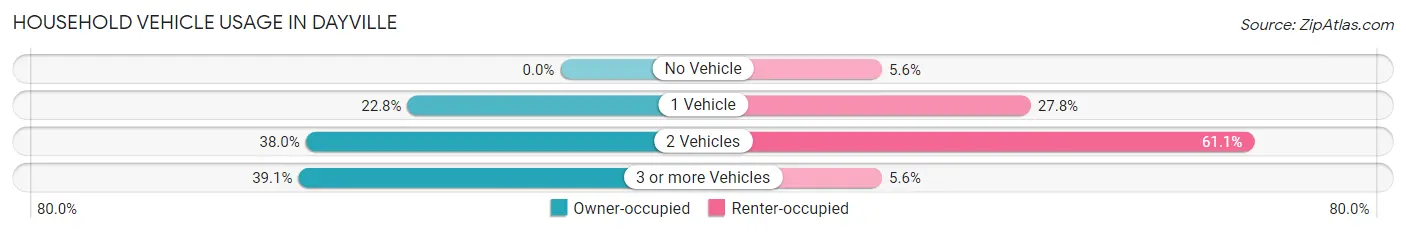
| Vehicles per Household | Owner-occupied | Renter-occupied |
| No Vehicle | 0 (0.0%) | 1 (5.6%) |
| 1 Vehicle | 21 (22.8%) | 5 (27.8%) |
| 2 Vehicles | 35 (38.0%) | 11 (61.1%) |
| 3 or more Vehicles | 36 (39.1%) | 1 (5.6%) |
| Total | 92 (100.0%) | 18 (100.0%) |
Real Estate & Mortgages in Dayville
Real Estate and Mortgage Overview in Dayville
| Characteristic | Without Mortgage | With Mortgage |
| Housing Units | 30 | 62 |
| Median Property Value | $214,300 | $212,500 |
| Median Household Income | $66,667 | $0 |
| Monthly Housing Costs | $417 | $0 |
| Real Estate Taxes | $1,175 | $0 |
Property Value by Mortgage Status in Dayville
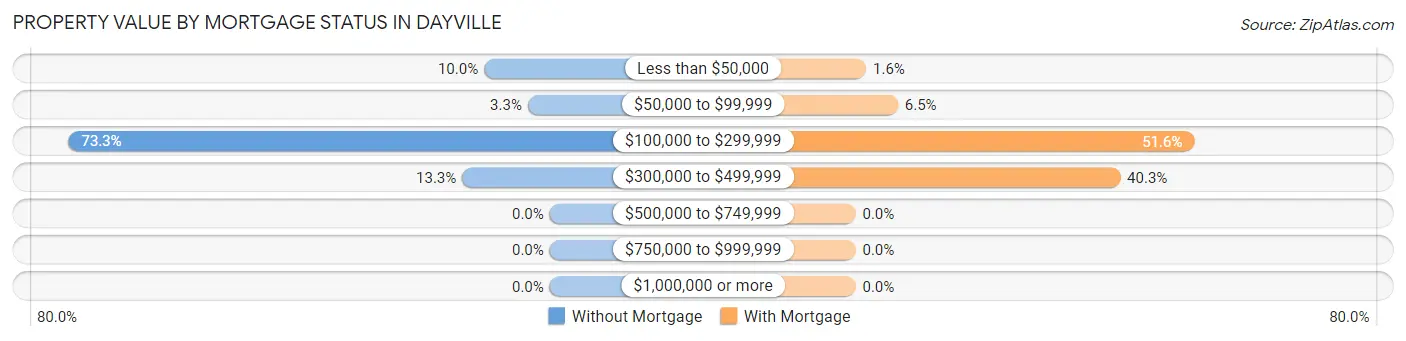
| Property Value | Without Mortgage | With Mortgage |
| Less than $50,000 | 3 (10.0%) | 1 (1.6%) |
| $50,000 to $99,999 | 1 (3.3%) | 4 (6.5%) |
| $100,000 to $299,999 | 22 (73.3%) | 32 (51.6%) |
| $300,000 to $499,999 | 4 (13.3%) | 25 (40.3%) |
| $500,000 to $749,999 | 0 (0.0%) | 0 (0.0%) |
| $750,000 to $999,999 | 0 (0.0%) | 0 (0.0%) |
| $1,000,000 or more | 0 (0.0%) | 0 (0.0%) |
| Total | 30 (100.0%) | 62 (100.0%) |
Household Income by Mortgage Status in Dayville
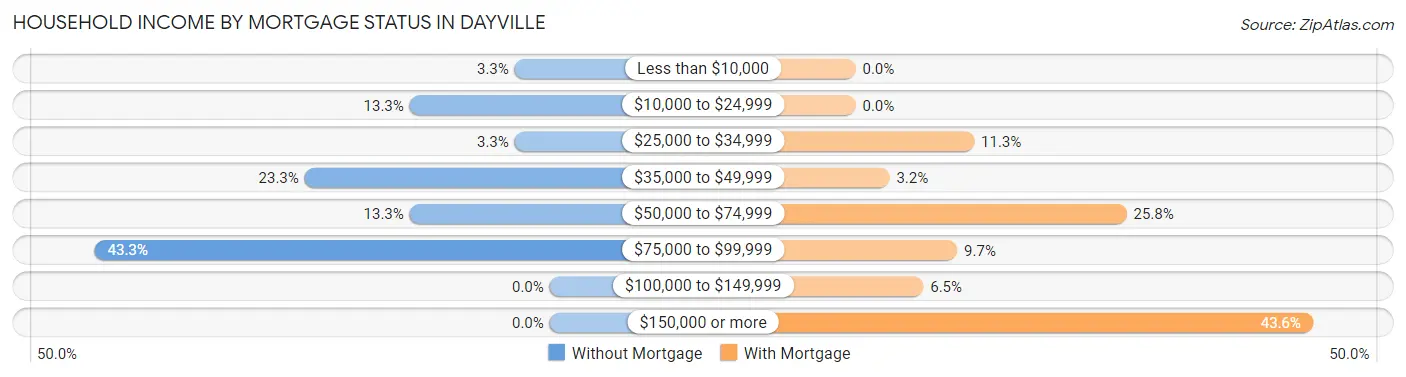
| Household Income | Without Mortgage | With Mortgage |
| Less than $10,000 | 1 (3.3%) | 0 (0.0%) |
| $10,000 to $24,999 | 4 (13.3%) | 0 (0.0%) |
| $25,000 to $34,999 | 1 (3.3%) | 7 (11.3%) |
| $35,000 to $49,999 | 7 (23.3%) | 2 (3.2%) |
| $50,000 to $74,999 | 4 (13.3%) | 16 (25.8%) |
| $75,000 to $99,999 | 13 (43.3%) | 6 (9.7%) |
| $100,000 to $149,999 | 0 (0.0%) | 4 (6.5%) |
| $150,000 or more | 0 (0.0%) | 27 (43.5%) |
| Total | 30 (100.0%) | 62 (100.0%) |
Property Value to Household Income Ratio in Dayville
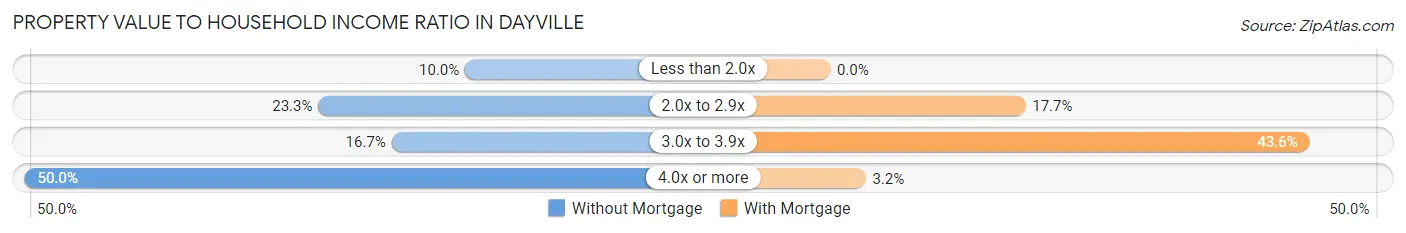
| Value-to-Income Ratio | Without Mortgage | With Mortgage |
| Less than 2.0x | 3 (10.0%) | 0 (0.0%) |
| 2.0x to 2.9x | 7 (23.3%) | 11 (17.7%) |
| 3.0x to 3.9x | 5 (16.7%) | 27 (43.5%) |
| 4.0x or more | 15 (50.0%) | 2 (3.2%) |
| Total | 30 (100.0%) | 62 (100.0%) |
Real Estate Taxes by Mortgage Status in Dayville
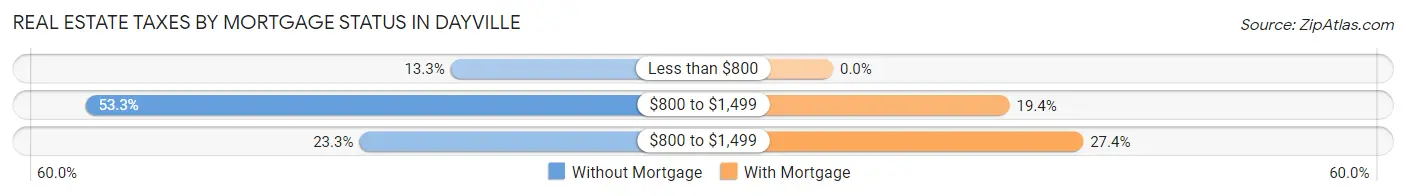
| Property Taxes | Without Mortgage | With Mortgage |
| Less than $800 | 4 (13.3%) | 0 (0.0%) |
| $800 to $1,499 | 16 (53.3%) | 12 (19.4%) |
| $800 to $1,499 | 7 (23.3%) | 17 (27.4%) |
| Total | 30 (100.0%) | 62 (100.0%) |
Health & Disability in Dayville
Health Insurance Coverage by Age in Dayville
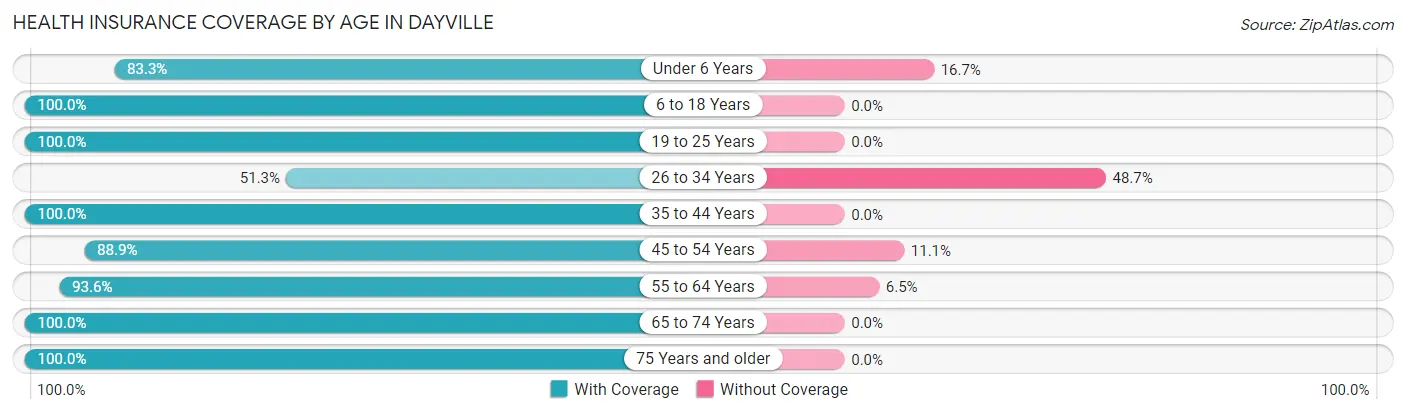
| Age Bracket | With Coverage | Without Coverage |
| Under 6 Years | 30 (83.3%) | 6 (16.7%) |
| 6 to 18 Years | 57 (100.0%) | 0 (0.0%) |
| 19 to 25 Years | 1 (100.0%) | 0 (0.0%) |
| 26 to 34 Years | 20 (51.3%) | 19 (48.7%) |
| 35 to 44 Years | 26 (100.0%) | 0 (0.0%) |
| 45 to 54 Years | 8 (88.9%) | 1 (11.1%) |
| 55 to 64 Years | 29 (93.5%) | 2 (6.5%) |
| 65 to 74 Years | 34 (100.0%) | 0 (0.0%) |
| 75 Years and older | 24 (100.0%) | 0 (0.0%) |
| Total | 229 (89.1%) | 28 (10.9%) |
Health Insurance Coverage by Citizenship Status in Dayville
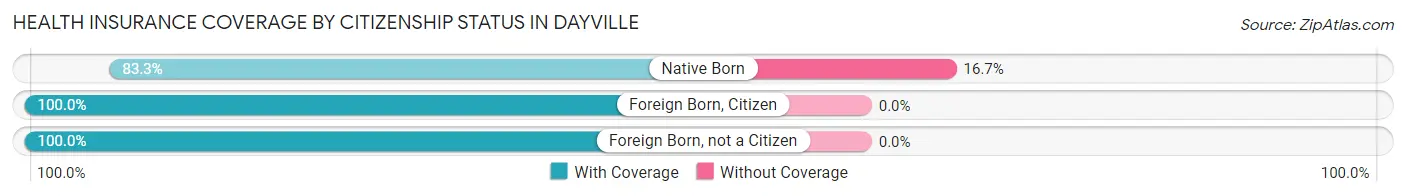
| Citizenship Status | With Coverage | Without Coverage |
| Native Born | 30 (83.3%) | 6 (16.7%) |
| Foreign Born, Citizen | 57 (100.0%) | 0 (0.0%) |
| Foreign Born, not a Citizen | 1 (100.0%) | 0 (0.0%) |
Health Insurance Coverage by Household Income in Dayville
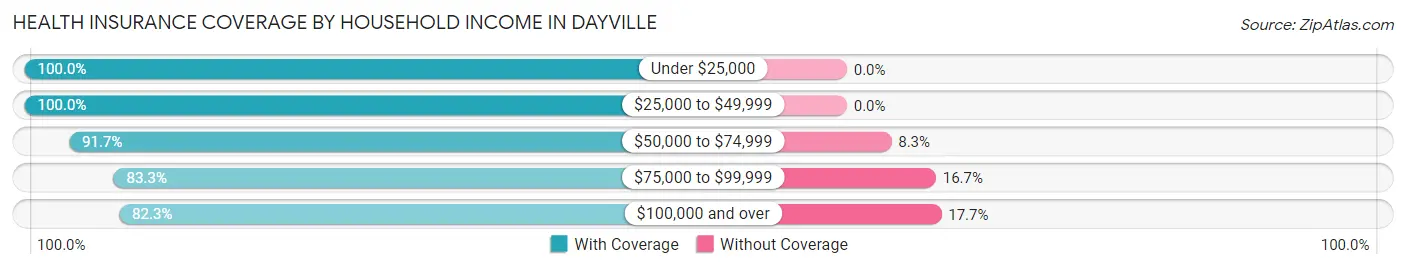
| Household Income | With Coverage | Without Coverage |
| Under $25,000 | 31 (100.0%) | 0 (0.0%) |
| $25,000 to $49,999 | 52 (100.0%) | 0 (0.0%) |
| $50,000 to $74,999 | 22 (91.7%) | 2 (8.3%) |
| $75,000 to $99,999 | 45 (83.3%) | 9 (16.7%) |
| $100,000 and over | 79 (82.3%) | 17 (17.7%) |
Public vs Private Health Insurance Coverage by Age in Dayville
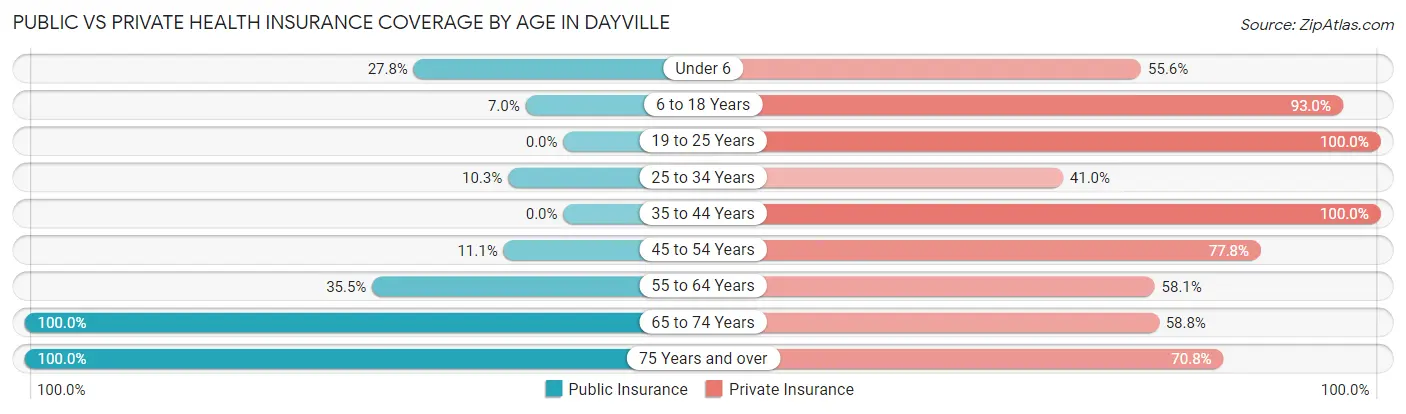
| Age Bracket | Public Insurance | Private Insurance |
| Under 6 | 10 (27.8%) | 20 (55.6%) |
| 6 to 18 Years | 4 (7.0%) | 53 (93.0%) |
| 19 to 25 Years | 0 (0.0%) | 1 (100.0%) |
| 25 to 34 Years | 4 (10.3%) | 16 (41.0%) |
| 35 to 44 Years | 0 (0.0%) | 26 (100.0%) |
| 45 to 54 Years | 1 (11.1%) | 7 (77.8%) |
| 55 to 64 Years | 11 (35.5%) | 18 (58.1%) |
| 65 to 74 Years | 34 (100.0%) | 20 (58.8%) |
| 75 Years and over | 24 (100.0%) | 17 (70.8%) |
| Total | 88 (34.2%) | 178 (69.3%) |
Disability Status by Sex by Age in Dayville
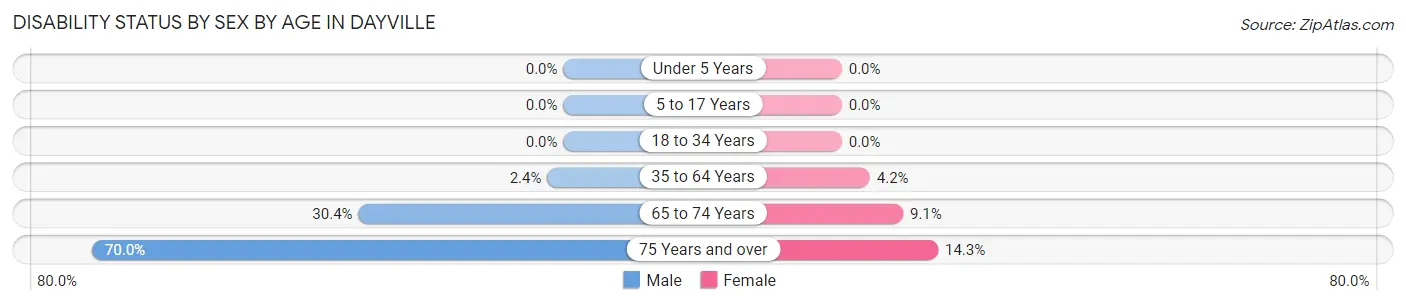
| Age Bracket | Male | Female |
| Under 5 Years | 0 (0.0%) | 0 (0.0%) |
| 5 to 17 Years | 0 (0.0%) | 0 (0.0%) |
| 18 to 34 Years | 0 (0.0%) | 0 (0.0%) |
| 35 to 64 Years | 1 (2.4%) | 1 (4.2%) |
| 65 to 74 Years | 7 (30.4%) | 1 (9.1%) |
| 75 Years and over | 7 (70.0%) | 2 (14.3%) |
Disability Class by Sex by Age in Dayville
Disability Class: Hearing Difficulty
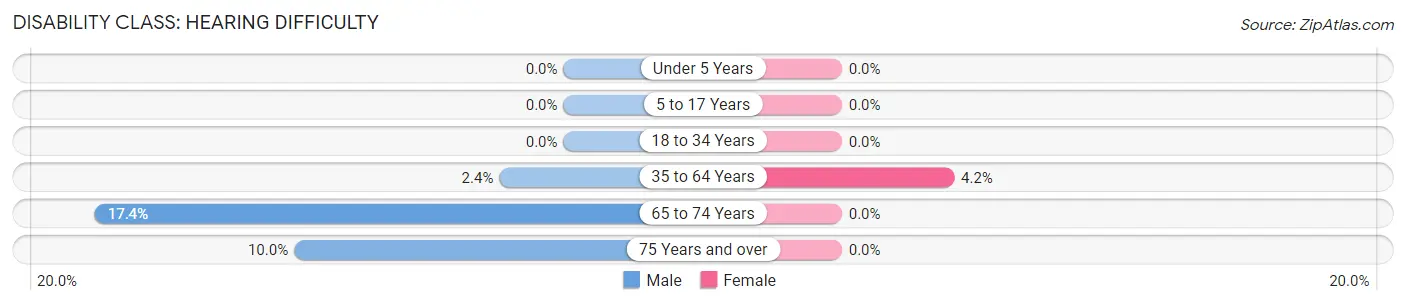
| Age Bracket | Male | Female |
| Under 5 Years | 0 (0.0%) | 0 (0.0%) |
| 5 to 17 Years | 0 (0.0%) | 0 (0.0%) |
| 18 to 34 Years | 0 (0.0%) | 0 (0.0%) |
| 35 to 64 Years | 1 (2.4%) | 1 (4.2%) |
| 65 to 74 Years | 4 (17.4%) | 0 (0.0%) |
| 75 Years and over | 1 (10.0%) | 0 (0.0%) |
Disability Class: Vision Difficulty
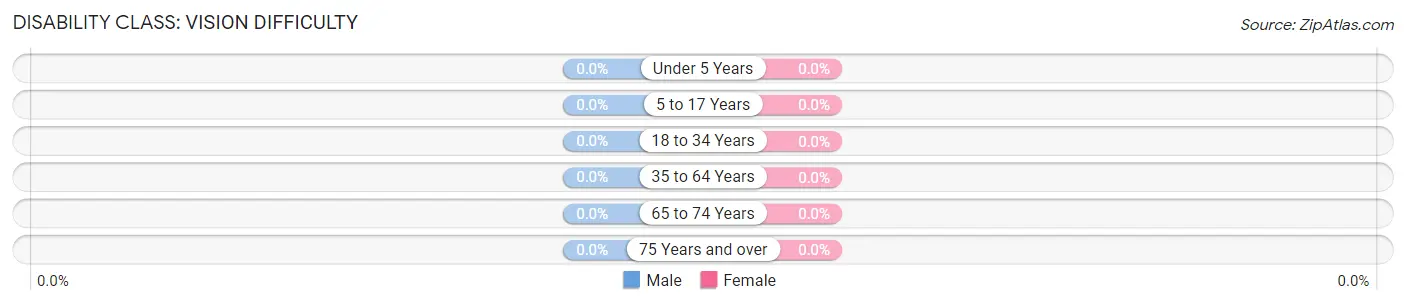
| Age Bracket | Male | Female |
| Under 5 Years | 0 (0.0%) | 0 (0.0%) |
| 5 to 17 Years | 0 (0.0%) | 0 (0.0%) |
| 18 to 34 Years | 0 (0.0%) | 0 (0.0%) |
| 35 to 64 Years | 0 (0.0%) | 0 (0.0%) |
| 65 to 74 Years | 0 (0.0%) | 0 (0.0%) |
| 75 Years and over | 0 (0.0%) | 0 (0.0%) |
Disability Class: Cognitive Difficulty
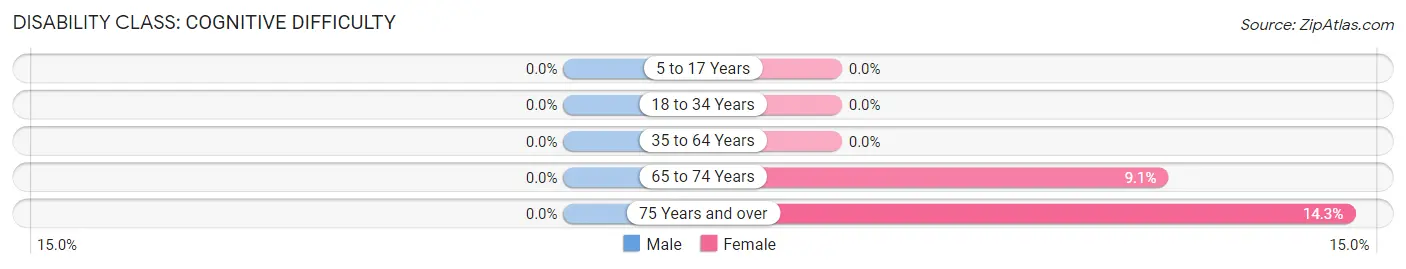
| Age Bracket | Male | Female |
| 5 to 17 Years | 0 (0.0%) | 0 (0.0%) |
| 18 to 34 Years | 0 (0.0%) | 0 (0.0%) |
| 35 to 64 Years | 0 (0.0%) | 0 (0.0%) |
| 65 to 74 Years | 0 (0.0%) | 1 (9.1%) |
| 75 Years and over | 0 (0.0%) | 2 (14.3%) |
Disability Class: Ambulatory Difficulty
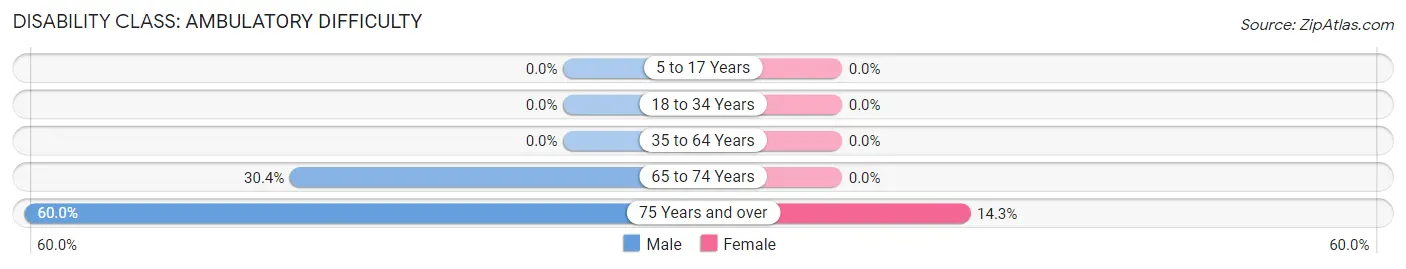
| Age Bracket | Male | Female |
| 5 to 17 Years | 0 (0.0%) | 0 (0.0%) |
| 18 to 34 Years | 0 (0.0%) | 0 (0.0%) |
| 35 to 64 Years | 0 (0.0%) | 0 (0.0%) |
| 65 to 74 Years | 7 (30.4%) | 0 (0.0%) |
| 75 Years and over | 6 (60.0%) | 2 (14.3%) |
Disability Class: Self-Care Difficulty
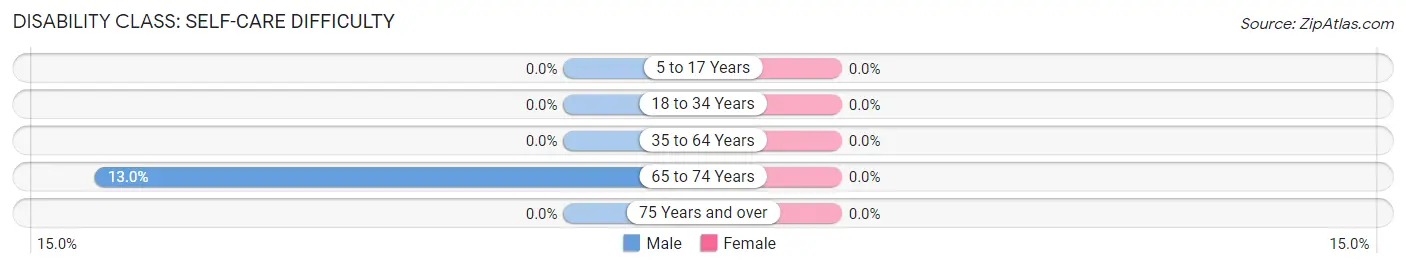
| Age Bracket | Male | Female |
| 5 to 17 Years | 0 (0.0%) | 0 (0.0%) |
| 18 to 34 Years | 0 (0.0%) | 0 (0.0%) |
| 35 to 64 Years | 0 (0.0%) | 0 (0.0%) |
| 65 to 74 Years | 3 (13.0%) | 0 (0.0%) |
| 75 Years and over | 0 (0.0%) | 0 (0.0%) |
Technology Access in Dayville
Computing Device Access in Dayville
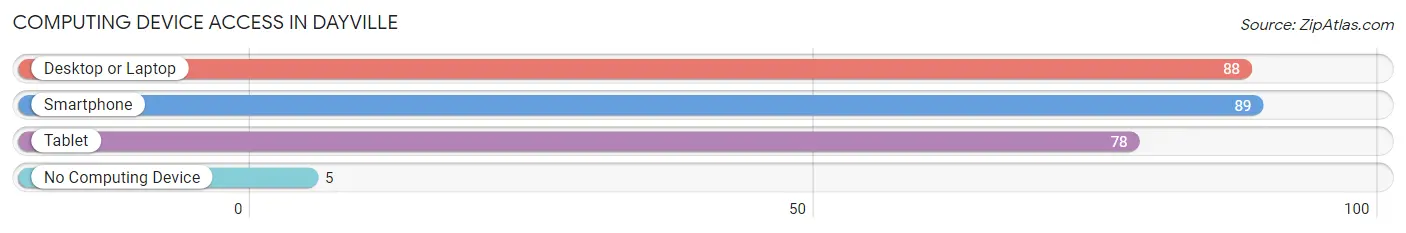
| Device Type | # Households | % Households |
| Desktop or Laptop | 88 | 80.0% |
| Smartphone | 89 | 80.9% |
| Tablet | 78 | 70.9% |
| No Computing Device | 5 | 4.5% |
| Total | 110 | 100.0% |
Internet Access in Dayville
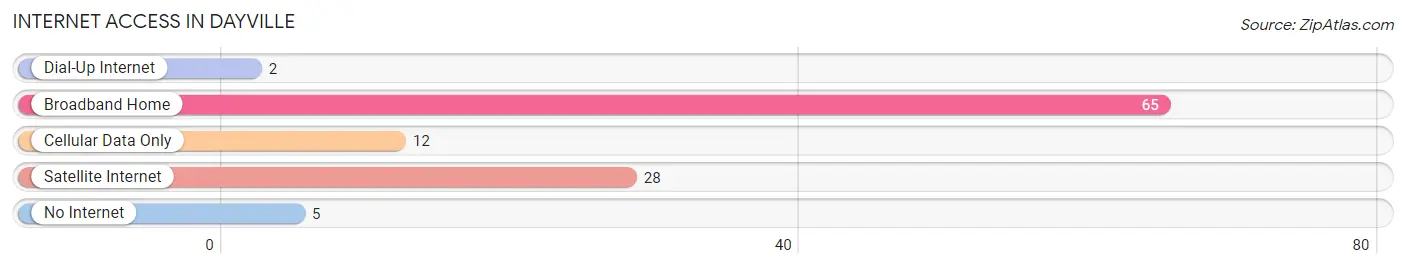
| Internet Type | # Households | % Households |
| Dial-Up Internet | 2 | 1.8% |
| Broadband Home | 65 | 59.1% |
| Cellular Data Only | 12 | 10.9% |
| Satellite Internet | 28 | 25.5% |
| No Internet | 5 | 4.5% |
| Total | 110 | 100.0% |
Dayville Summary
Dayville is a small unincorporated community located in Grant County, Oregon, United States. It is situated in the foothills of the Blue Mountains, approximately 20 miles east of John Day. The population of Dayville was estimated to be around 200 in 2020.
History
Dayville was founded in 1882 by a group of settlers from the nearby town of Canyon City. The settlers were looking for a place to settle and start a new life. The town was named after the first settler, William Day, who had come to the area in search of gold. The town quickly grew and by the early 1900s, it had become a bustling community with a post office, a school, a hotel, a general store, and several other businesses.
In the early 1900s, Dayville was a major stop on the Oregon Trail. The town was also a popular destination for travelers and tourists, who would come to enjoy the scenic beauty of the area.
Geography
Dayville is located in the foothills of the Blue Mountains, approximately 20 miles east of John Day. The town is situated at an elevation of 3,000 feet and is surrounded by rolling hills and grasslands. The area is known for its dry climate and is home to a variety of wildlife, including deer, elk, and antelope.
The town is located near the John Day River, which is a popular destination for fishing and rafting. The nearby Malheur National Forest is also a popular destination for camping, hiking, and other outdoor activities.
Economy
Dayville’s economy is largely based on agriculture and ranching. The town is home to several farms and ranches, which produce a variety of crops and livestock. The town is also home to several small businesses, including a general store, a gas station, and a restaurant.
Demographics
As of the 2010 census, the population of Dayville was estimated to be around 200. The town is predominantly white, with a small Hispanic population. The median household income in Dayville is around $30,000, and the median home value is around $100,000.
Conclusion
Dayville is a small unincorporated community located in Grant County, Oregon. It was founded in 1882 by a group of settlers from the nearby town of Canyon City and is situated in the foothills of the Blue Mountains. The town is known for its dry climate and is home to a variety of wildlife. The economy of Dayville is largely based on agriculture and ranching, and the town is home to several small businesses. The population of Dayville was estimated to be around 200 in 2020.
Common Questions
What is the Total Population of Dayville?
Total Population of Dayville is 257.
What is the Total Male Population of Dayville?
Total Male Population of Dayville is 136.
What is the Total Female Population of Dayville?
Total Female Population of Dayville is 121.
What is the Ratio of Males per 100 Females in Dayville?
There are 112.40 Males per 100 Females in Dayville.
What is the Ratio of Females per 100 Males in Dayville?
There are 88.97 Females per 100 Males in Dayville.
What is the Median Population Age in Dayville?
Median Population Age in Dayville is 34.3 Years.
What is the Average Family Size in Dayville
Average Family Size in Dayville is 3.2 People.
What is the Average Household Size in Dayville
Average Household Size in Dayville is 2.3 People.
What is Per Capita Income in Dayville?
Per Capita income in Dayville is $30,782.
What is the Median Family Income in Dayville?
Median Family Income in Dayville is $94,063.
What is the Median Household income in Dayville?
Median Household Income in Dayville is $53,750.
What is Income or Wage Gap in Dayville?
Income or Wage Gap in Dayville is 15.3%.
Women in Dayville earn 84.7 cents for every dollar earned by a man.
What is Inequality or Gini Index in Dayville?
Inequality or Gini Index in Dayville is 0.36.
How Large is the Labor Force in Dayville?
There are 111 People in the Labor Forcein in Dayville.
What is the Percentage of People in the Labor Force in Dayville?
59.0% of People are in the Labor Force in Dayville.
What is the Unemployment Rate in Dayville?
Unemployment Rate in Dayville is 6.3%.