Yamhill County, OR
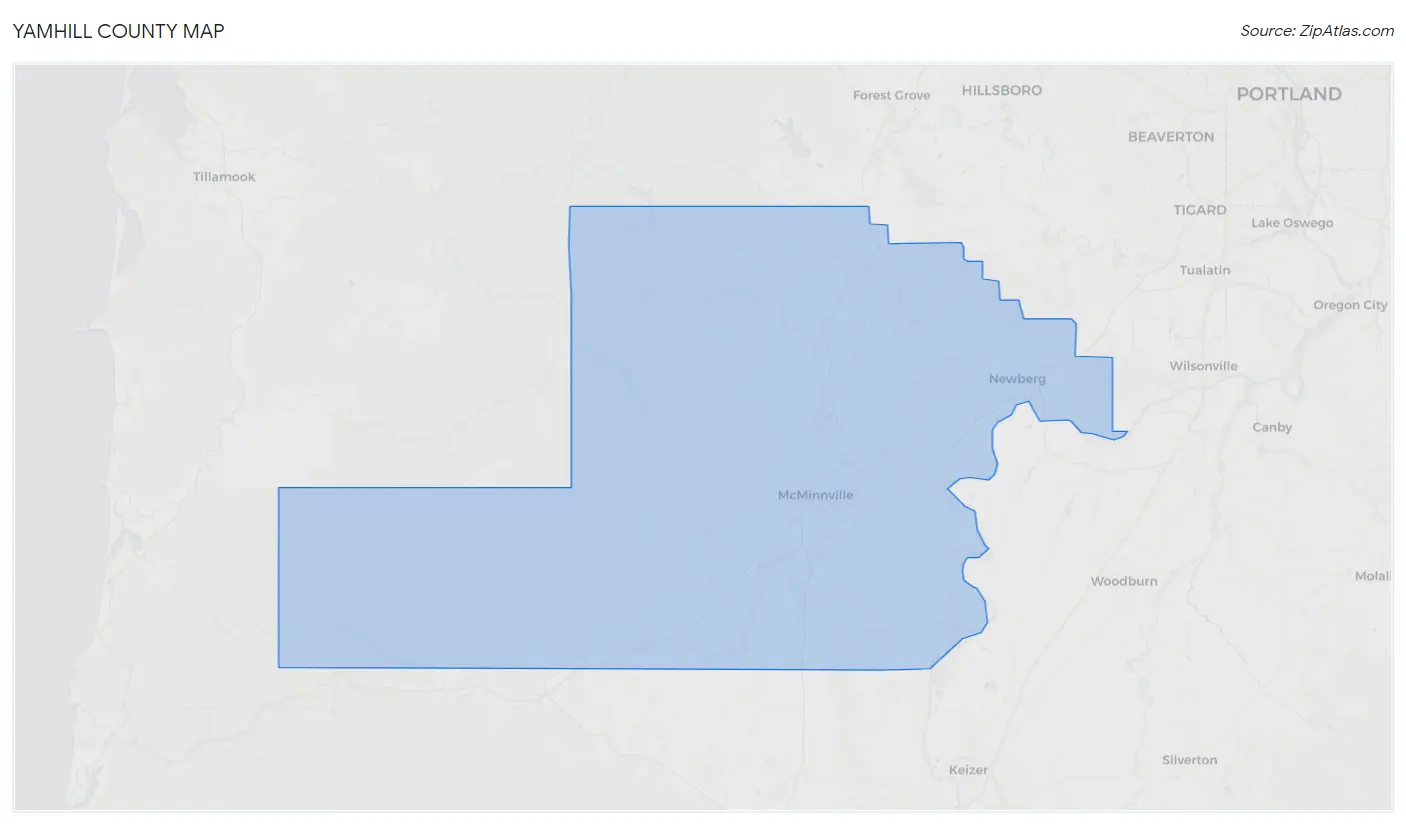
Yamhill County Map
Yamhill County Overview
107,674
TOTAL POPULATION
54,489
MALE POPULATION
53,185
FEMALE POPULATION
102.45
MALES / 100 FEMALES
97.61
FEMALES / 100 MALES
39.4
MEDIAN AGE
3.1
AVG FAMILY SIZE
2.6
AVG HOUSEHOLD SIZE
$38,002
PER CAPITA INCOME
$95,708
AVG FAMILY INCOME
$80,125
AVG HOUSEHOLD INCOME
28.5%
WAGE / INCOME GAP [ % ]
71.5¢/ $1
WAGE / INCOME GAP [ $ ]
$10,460
FAMILY INCOME DEFICIT
0.45
INEQUALITY / GINI INDEX
52,231
LABOR FORCE [ PEOPLE ]
59.7%
PERCENT IN LABOR FORCE
4.1%
UNEMPLOYMENT RATE
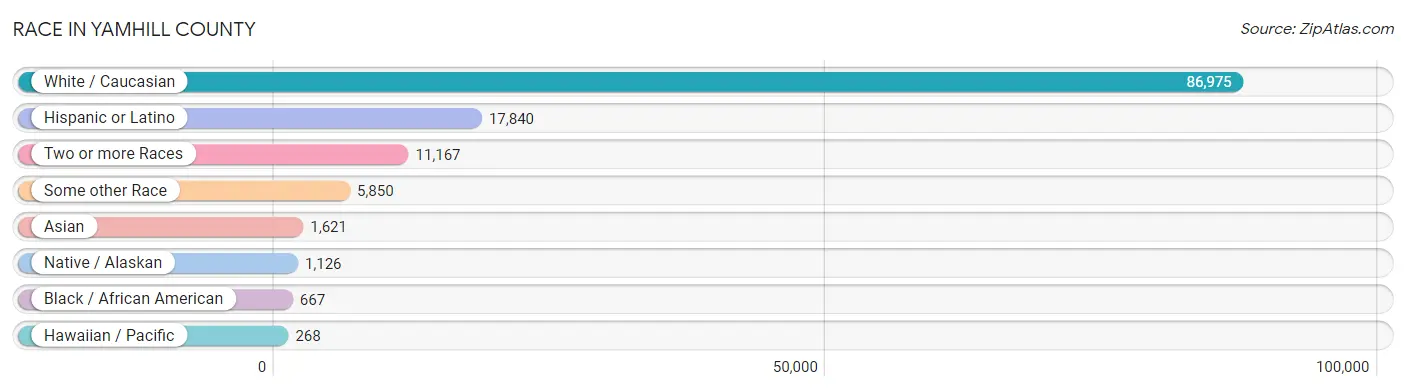
Race in Yamhill County
The most populous races in Yamhill County are White / Caucasian (86,975 | 80.8%), Hispanic or Latino (17,840 | 16.6%), and Two or more Races (11,167 | 10.4%).
| Race | # Population | % Population |
| Asian | 1,621 | 1.5% |
| Black / African American | 667 | 0.6% |
| Hawaiian / Pacific | 268 | 0.3% |
| Hispanic or Latino | 17,840 | 16.6% |
| Native / Alaskan | 1,126 | 1.1% |
| White / Caucasian | 86,975 | 80.8% |
| Two or more Races | 11,167 | 10.4% |
| Some other Race | 5,850 | 5.4% |
| Total | 107,674 | 100.0% |
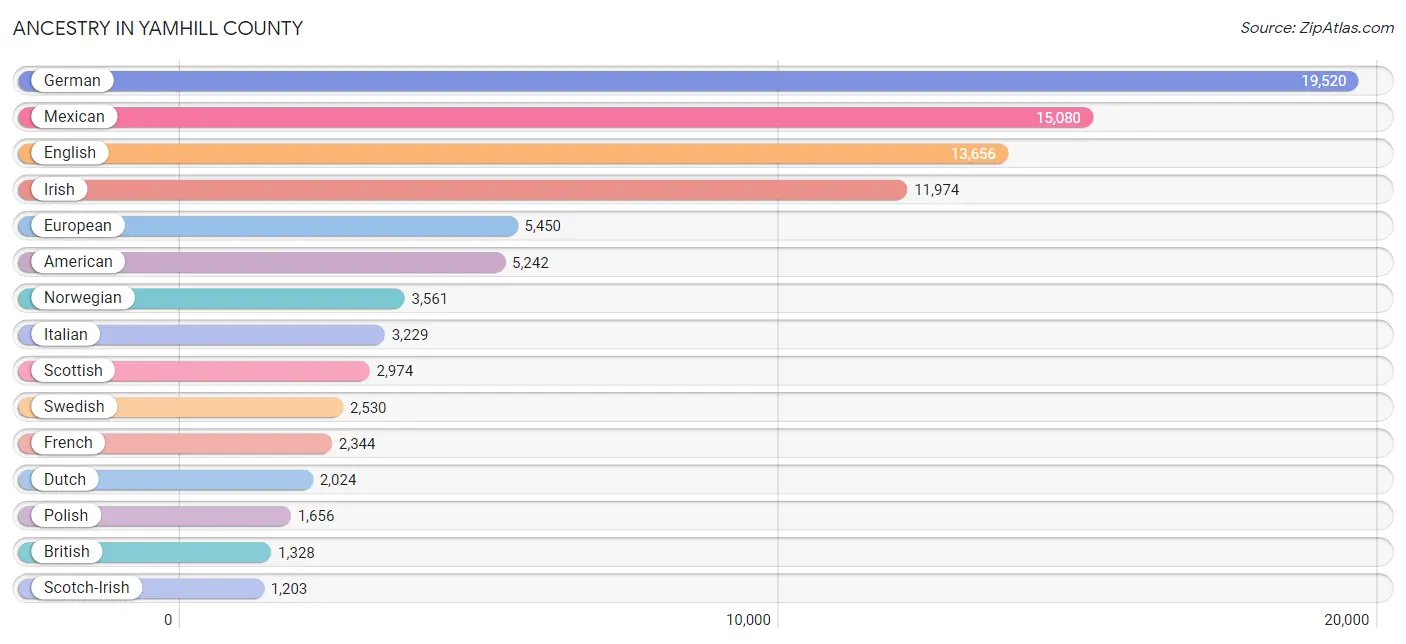
Ancestry in Yamhill County
The most populous ancestries reported in Yamhill County are German (19,520 | 18.1%), Mexican (15,080 | 14.0%), English (13,656 | 12.7%), Irish (11,974 | 11.1%), and European (5,450 | 5.1%), together accounting for 61.0% of all Yamhill County residents.
| Ancestry | # Population | % Population |
| African | 4 | 0.0% |
| Alaskan Athabascan | 15 | 0.0% |
| American | 5,242 | 4.9% |
| Apache | 3 | 0.0% |
| Arab | 180 | 0.2% |
| Argentinean | 4 | 0.0% |
| Armenian | 28 | 0.0% |
| Assyrian / Chaldean / Syriac | 27 | 0.0% |
| Australian | 70 | 0.1% |
| Austrian | 718 | 0.7% |
| Bangladeshi | 2 | 0.0% |
| Basque | 27 | 0.0% |
| Belgian | 97 | 0.1% |
| Bhutanese | 750 | 0.7% |
| Blackfeet | 169 | 0.2% |
| Brazilian | 64 | 0.1% |
| British | 1,328 | 1.2% |
| Burmese | 161 | 0.2% |
| Cajun | 47 | 0.0% |
| Canadian | 250 | 0.2% |
| Celtic | 14 | 0.0% |
| Central American | 477 | 0.4% |
| Central American Indian | 58 | 0.1% |
| Cherokee | 694 | 0.6% |
| Chickasaw | 52 | 0.1% |
| Chinese | 18 | 0.0% |
| Chippewa | 61 | 0.1% |
| Choctaw | 390 | 0.4% |
| Comanche | 1 | 0.0% |
| Costa Rican | 92 | 0.1% |
| Cree | 3 | 0.0% |
| Creek | 16 | 0.0% |
| Croatian | 59 | 0.1% |
| Cuban | 46 | 0.0% |
| Czech | 320 | 0.3% |
| Czechoslovakian | 101 | 0.1% |
| Danish | 775 | 0.7% |
| Delaware | 13 | 0.0% |
| Dominican | 4 | 0.0% |
| Dutch | 2,024 | 1.9% |
| Eastern European | 527 | 0.5% |
| Ecuadorian | 35 | 0.0% |
| Egyptian | 17 | 0.0% |
| English | 13,656 | 12.7% |
| Estonian | 100 | 0.1% |
| Ethiopian | 143 | 0.1% |
| European | 5,450 | 5.1% |
| Filipino | 25 | 0.0% |
| Finnish | 434 | 0.4% |
| French | 2,344 | 2.2% |
| French American Indian | 18 | 0.0% |
| French Canadian | 652 | 0.6% |
| German | 19,520 | 18.1% |
| German Russian | 60 | 0.1% |
| Greek | 120 | 0.1% |
| Guamanian / Chamorro | 75 | 0.1% |
| Guatemalan | 91 | 0.1% |
| Haitian | 13 | 0.0% |
| Hopi | 25 | 0.0% |
| Hungarian | 389 | 0.4% |
| Icelander | 67 | 0.1% |
| Indian (Asian) | 876 | 0.8% |
| Indonesian | 17 | 0.0% |
| Inupiat | 10 | 0.0% |
| Iranian | 73 | 0.1% |
| Irish | 11,974 | 11.1% |
| Iroquois | 15 | 0.0% |
| Israeli | 9 | 0.0% |
| Italian | 3,229 | 3.0% |
| Kenyan | 107 | 0.1% |
| Korean | 1,030 | 1.0% |
| Laotian | 38 | 0.0% |
| Latvian | 9 | 0.0% |
| Lebanese | 46 | 0.0% |
| Lithuanian | 63 | 0.1% |
| Luxembourger | 25 | 0.0% |
| Macedonian | 7 | 0.0% |
| Malaysian | 26 | 0.0% |
| Mexican | 15,080 | 14.0% |
| Mexican American Indian | 649 | 0.6% |
| Native Hawaiian | 293 | 0.3% |
| Navajo | 23 | 0.0% |
| Nicaraguan | 179 | 0.2% |
| Northern European | 392 | 0.4% |
| Norwegian | 3,561 | 3.3% |
| Ottawa | 8 | 0.0% |
| Paiute | 10 | 0.0% |
| Pakistani | 16 | 0.0% |
| Palestinian | 13 | 0.0% |
| Panamanian | 41 | 0.0% |
| Pennsylvania German | 25 | 0.0% |
| Peruvian | 64 | 0.1% |
| Pima | 1 | 0.0% |
| Polish | 1,656 | 1.5% |
| Portuguese | 449 | 0.4% |
| Pueblo | 14 | 0.0% |
| Puerto Rican | 584 | 0.5% |
| Puget Sound Salish | 37 | 0.0% |
| Romanian | 72 | 0.1% |
| Russian | 557 | 0.5% |
| Salvadoran | 74 | 0.1% |
| Samoan | 24 | 0.0% |
| Scandinavian | 909 | 0.8% |
| Scotch-Irish | 1,203 | 1.1% |
| Scottish | 2,974 | 2.8% |
| Seminole | 155 | 0.1% |
| Shoshone | 20 | 0.0% |
| Sioux | 176 | 0.2% |
| Slavic | 66 | 0.1% |
| Slovak | 71 | 0.1% |
| Slovene | 19 | 0.0% |
| South African | 14 | 0.0% |
| South American | 123 | 0.1% |
| Spaniard | 274 | 0.3% |
| Spanish | 218 | 0.2% |
| Spanish American | 21 | 0.0% |
| Sri Lankan | 268 | 0.3% |
| Subsaharan African | 464 | 0.4% |
| Swedish | 2,530 | 2.4% |
| Swiss | 645 | 0.6% |
| Thai | 79 | 0.1% |
| Tlingit-Haida | 64 | 0.1% |
| Turkish | 44 | 0.0% |
| Ukrainian | 60 | 0.1% |
| Uruguayan | 20 | 0.0% |
| Welsh | 902 | 0.8% |
| Yugoslavian | 41 | 0.0% |
| Yup'ik | 65 | 0.1% | View All 128 Rows |
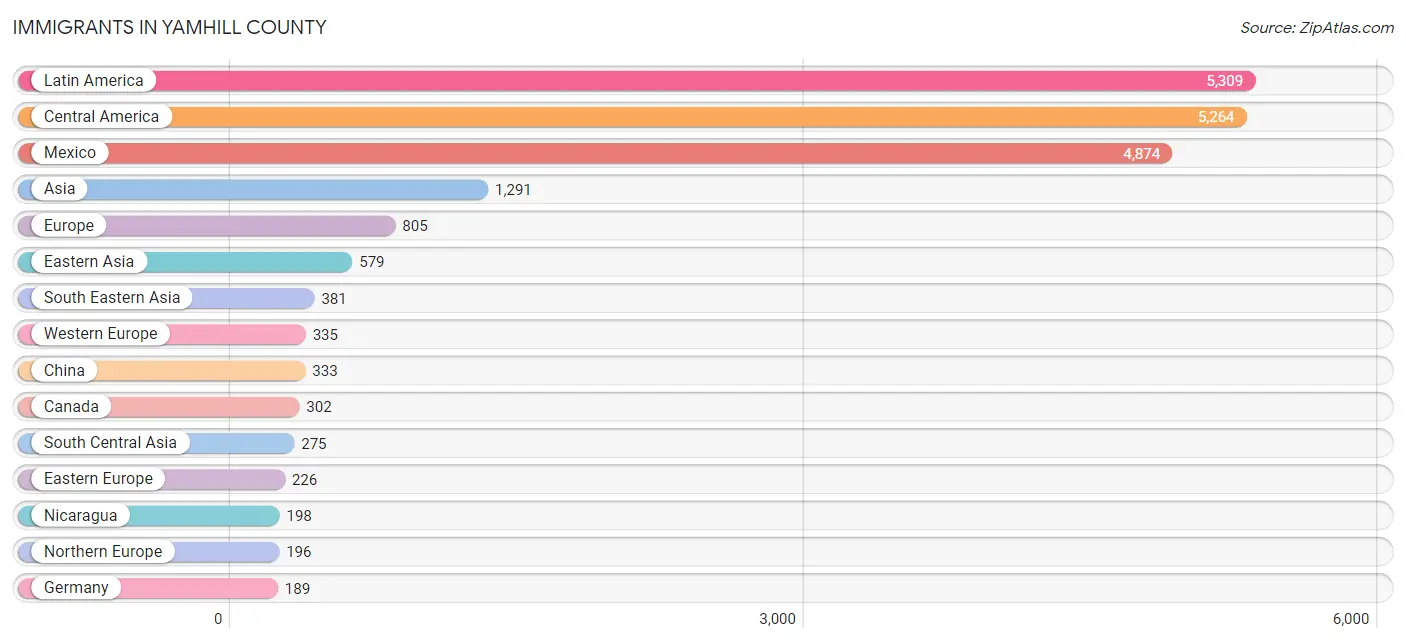
Immigrants in Yamhill County
The most numerous immigrant groups reported in Yamhill County came from Latin America (5,309 | 4.9%), Central America (5,264 | 4.9%), Mexico (4,874 | 4.5%), Asia (1,291 | 1.2%), and Europe (805 | 0.7%), together accounting for 16.3% of all Yamhill County residents.
| Immigration Origin | # Population | % Population |
| Africa | 120 | 0.1% |
| Asia | 1,291 | 1.2% |
| Australia | 117 | 0.1% |
| Austria | 63 | 0.1% |
| Canada | 302 | 0.3% |
| Caribbean | 28 | 0.0% |
| Central America | 5,264 | 4.9% |
| China | 333 | 0.3% |
| Cuba | 24 | 0.0% |
| Czechoslovakia | 6 | 0.0% |
| Denmark | 14 | 0.0% |
| Dominican Republic | 4 | 0.0% |
| Eastern Africa | 92 | 0.1% |
| Eastern Asia | 579 | 0.5% |
| Eastern Europe | 226 | 0.2% |
| Ecuador | 14 | 0.0% |
| El Salvador | 85 | 0.1% |
| England | 58 | 0.1% |
| Ethiopia | 78 | 0.1% |
| Europe | 805 | 0.7% |
| Fiji | 3 | 0.0% |
| France | 10 | 0.0% |
| Germany | 189 | 0.2% |
| Ghana | 4 | 0.0% |
| Guatemala | 65 | 0.1% |
| Honduras | 20 | 0.0% |
| Hong Kong | 47 | 0.0% |
| India | 79 | 0.1% |
| Indonesia | 16 | 0.0% |
| Iran | 33 | 0.0% |
| Ireland | 32 | 0.0% |
| Israel | 13 | 0.0% |
| Italy | 48 | 0.0% |
| Japan | 172 | 0.2% |
| Jordan | 12 | 0.0% |
| Korea | 74 | 0.1% |
| Laos | 4 | 0.0% |
| Latin America | 5,309 | 4.9% |
| Lebanon | 10 | 0.0% |
| Lithuania | 10 | 0.0% |
| Mexico | 4,874 | 4.5% |
| Netherlands | 66 | 0.1% |
| Nicaragua | 198 | 0.2% |
| Northern Europe | 196 | 0.2% |
| Oceania | 131 | 0.1% |
| Pakistan | 10 | 0.0% |
| Panama | 22 | 0.0% |
| Peru | 3 | 0.0% |
| Philippines | 170 | 0.2% |
| Poland | 3 | 0.0% |
| Romania | 118 | 0.1% |
| Russia | 62 | 0.1% |
| Saudi Arabia | 21 | 0.0% |
| Scotland | 45 | 0.0% |
| Sierra Leone | 19 | 0.0% |
| Singapore | 9 | 0.0% |
| South Africa | 5 | 0.0% |
| South America | 17 | 0.0% |
| South Central Asia | 275 | 0.3% |
| South Eastern Asia | 381 | 0.4% |
| Southern Europe | 48 | 0.0% |
| Switzerland | 7 | 0.0% |
| Taiwan | 75 | 0.1% |
| Thailand | 2 | 0.0% |
| Uzbekistan | 153 | 0.1% |
| Vietnam | 145 | 0.1% |
| Western Africa | 23 | 0.0% |
| Western Asia | 56 | 0.1% |
| Western Europe | 335 | 0.3% |
| Zimbabwe | 14 | 0.0% | View All 70 Rows |
Sex and Age in Yamhill County
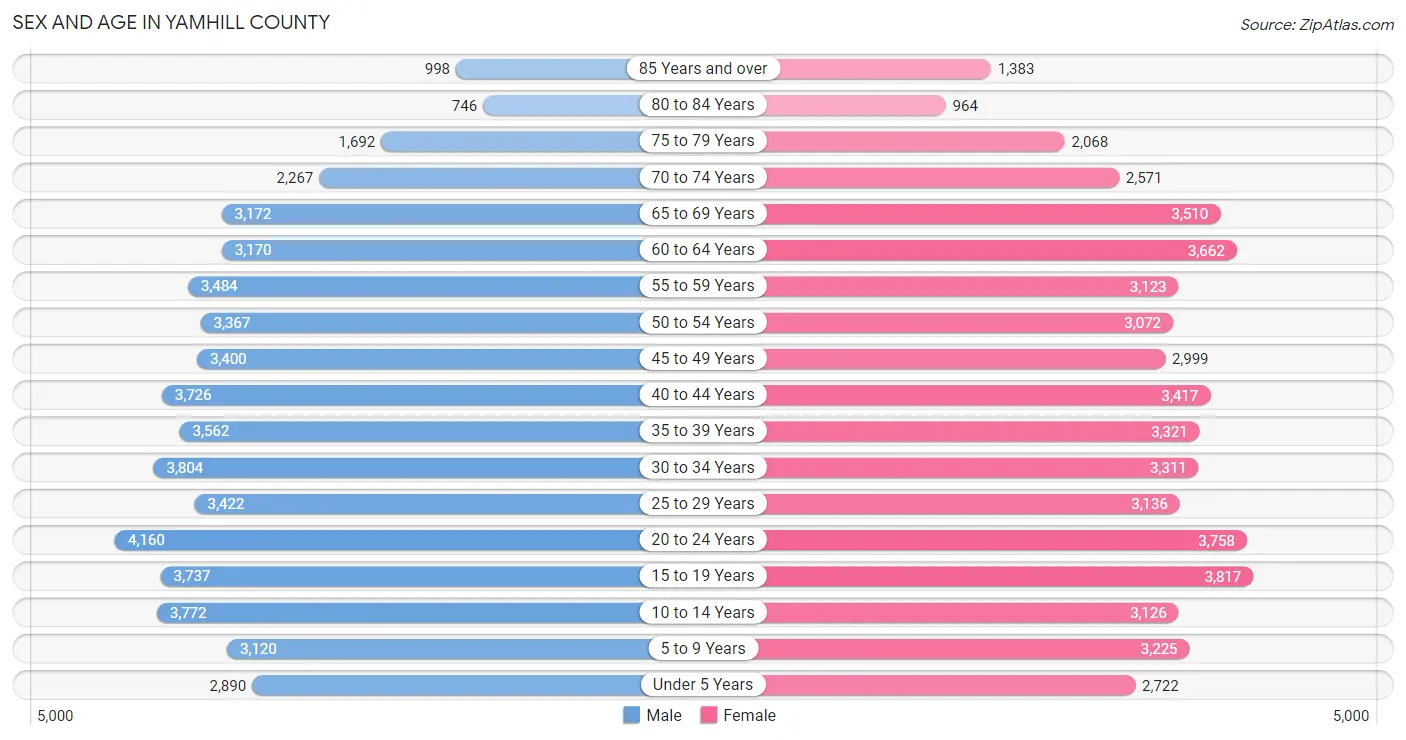
Sex and Age in Yamhill County
The most populous age groups in Yamhill County are 20 to 24 Years (4,160 | 7.6%) for men and 15 to 19 Years (3,817 | 7.2%) for women.
| Age Bracket | Male | Female |
| Under 5 Years | 2,890 (5.3%) | 2,722 (5.1%) |
| 5 to 9 Years | 3,120 (5.7%) | 3,225 (6.1%) |
| 10 to 14 Years | 3,772 (6.9%) | 3,126 (5.9%) |
| 15 to 19 Years | 3,737 (6.9%) | 3,817 (7.2%) |
| 20 to 24 Years | 4,160 (7.6%) | 3,758 (7.1%) |
| 25 to 29 Years | 3,422 (6.3%) | 3,136 (5.9%) |
| 30 to 34 Years | 3,804 (7.0%) | 3,311 (6.2%) |
| 35 to 39 Years | 3,562 (6.5%) | 3,321 (6.2%) |
| 40 to 44 Years | 3,726 (6.8%) | 3,417 (6.4%) |
| 45 to 49 Years | 3,400 (6.2%) | 2,999 (5.6%) |
| 50 to 54 Years | 3,367 (6.2%) | 3,072 (5.8%) |
| 55 to 59 Years | 3,484 (6.4%) | 3,123 (5.9%) |
| 60 to 64 Years | 3,170 (5.8%) | 3,662 (6.9%) |
| 65 to 69 Years | 3,172 (5.8%) | 3,510 (6.6%) |
| 70 to 74 Years | 2,267 (4.2%) | 2,571 (4.8%) |
| 75 to 79 Years | 1,692 (3.1%) | 2,068 (3.9%) |
| 80 to 84 Years | 746 (1.4%) | 964 (1.8%) |
| 85 Years and over | 998 (1.8%) | 1,383 (2.6%) |
| Total | 54,489 (100.0%) | 53,185 (100.0%) |
Families and Households in Yamhill County
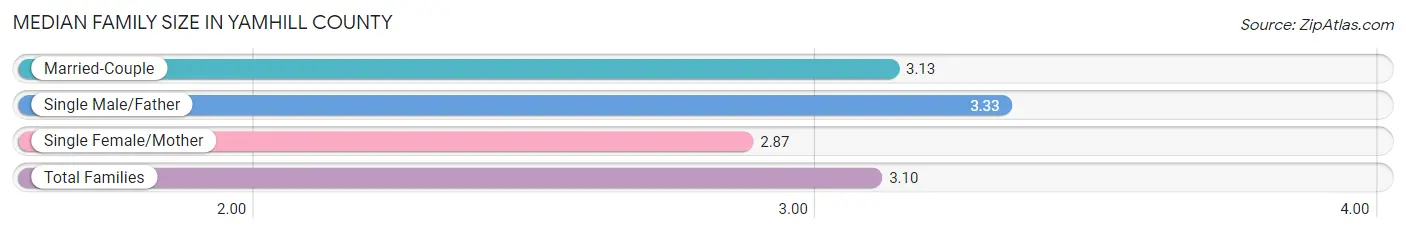
Median Family Size in Yamhill County
The median family size in Yamhill County is 3.10 persons per family, with single male/father families (1,517 | 5.6%) accounting for the largest median family size of 3.33 persons per family. On the other hand, single female/mother families (4,881 | 18.1%) represent the smallest median family size with 2.87 persons per family.
| Family Type | # Families | Family Size |
| Married-Couple | 20,513 (76.2%) | 3.13 |
| Single Male/Father | 1,517 (5.6%) | 3.33 |
| Single Female/Mother | 4,881 (18.1%) | 2.87 |
| Total Families | 26,911 (100.0%) | 3.10 |
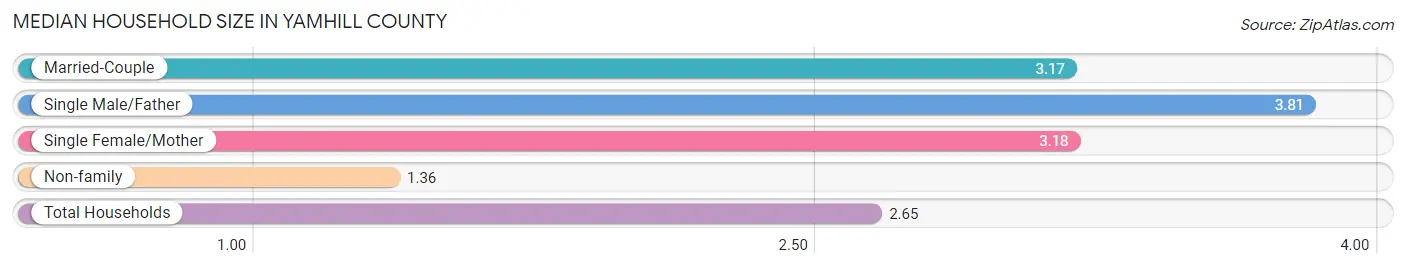
Median Household Size in Yamhill County
The median household size in Yamhill County is 2.65 persons per household, with single male/father households (1,517 | 4.0%) accounting for the largest median household size of 3.81 persons per household. non-family households (11,460 | 29.9%) represent the smallest median household size with 1.36 persons per household.
| Household Type | # Households | Household Size |
| Married-Couple | 20,513 (53.5%) | 3.17 |
| Single Male/Father | 1,517 (4.0%) | 3.81 |
| Single Female/Mother | 4,881 (12.7%) | 3.18 |
| Non-family | 11,460 (29.9%) | 1.36 |
| Total Households | 38,371 (100.0%) | 2.65 |
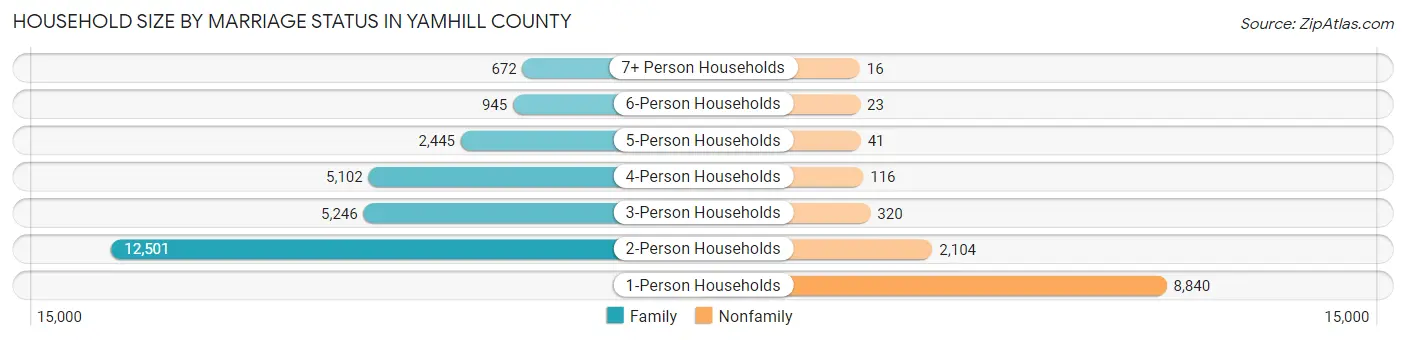
Household Size by Marriage Status in Yamhill County
Out of a total of 38,371 households in Yamhill County, 26,911 (70.1%) are family households, while 11,460 (29.9%) are nonfamily households. The most numerous type of family households are 2-person households, comprising 12,501, and the most common type of nonfamily households are 1-person households, comprising 8,840.
| Household Size | Family Households | Nonfamily Households |
| 1-Person Households | - | 8,840 (23.0%) |
| 2-Person Households | 12,501 (32.6%) | 2,104 (5.5%) |
| 3-Person Households | 5,246 (13.7%) | 320 (0.8%) |
| 4-Person Households | 5,102 (13.3%) | 116 (0.3%) |
| 5-Person Households | 2,445 (6.4%) | 41 (0.1%) |
| 6-Person Households | 945 (2.5%) | 23 (0.1%) |
| 7+ Person Households | 672 (1.8%) | 16 (0.0%) |
| Total | 26,911 (70.1%) | 11,460 (29.9%) |
Female Fertility in Yamhill County
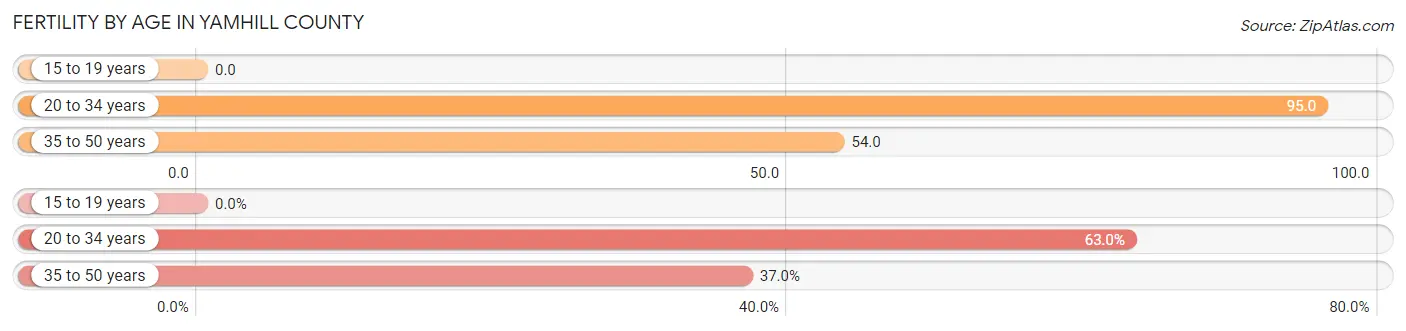
Fertility by Age in Yamhill County
Average fertility rate in Yamhill County is 62.0 births per 1,000 women. Women in the age bracket of 20 to 34 years have the highest fertility rate with 95.0 births per 1,000 women. Women in the age bracket of 20 to 34 years acount for 63.0% of all women with births.
| Age Bracket | Women with Births | Births / 1,000 Women |
| 15 to 19 years | 0 (0.0%) | 0.0 |
| 20 to 34 years | 965 (63.0%) | 95.0 |
| 35 to 50 years | 566 (37.0%) | 54.0 |
| Total | 1,531 (100.0%) | 62.0 |
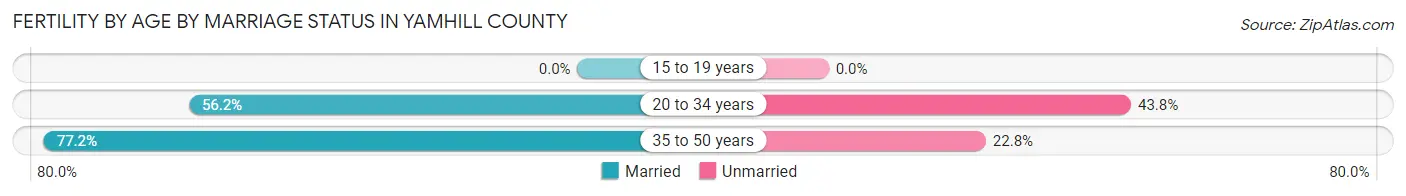
Fertility by Age by Marriage Status in Yamhill County
63.9% of women with births (1,531) in Yamhill County are married. The highest percentage of unmarried women with births falls into 20 to 34 years age bracket with 43.8% of them unmarried at the time of birth, while the lowest percentage of unmarried women with births belong to 35 to 50 years age bracket with 22.8% of them unmarried.
| Age Bracket | Married | Unmarried |
| 15 to 19 years | 0 (0.0%) | 0 (0.0%) |
| 20 to 34 years | 542 (56.2%) | 423 (43.8%) |
| 35 to 50 years | 437 (77.2%) | 129 (22.8%) |
| Total | 978 (63.9%) | 553 (36.1%) |
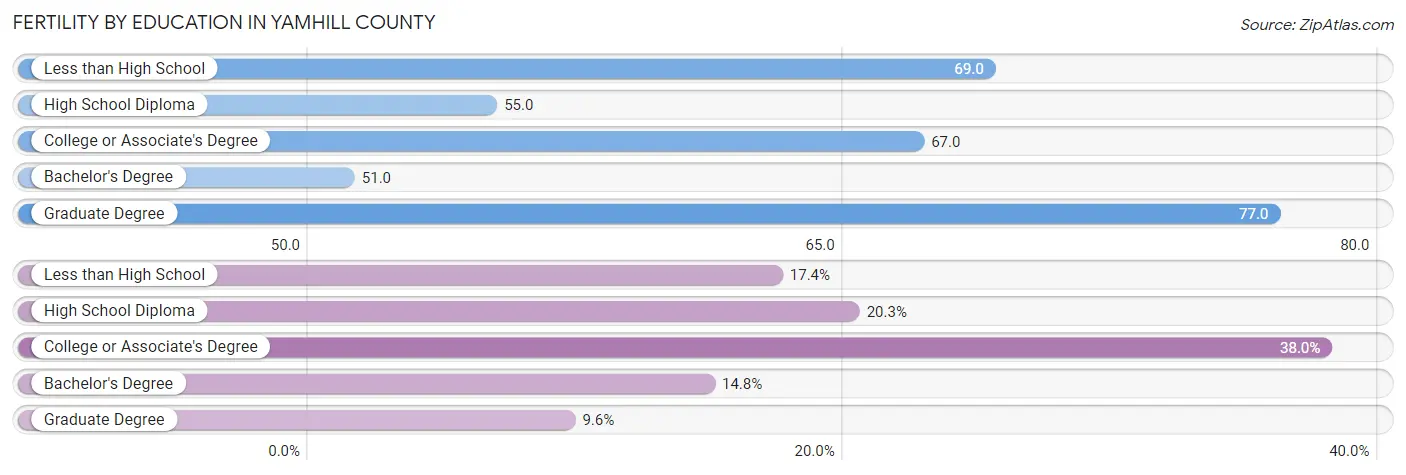
Fertility by Education in Yamhill County
Average fertility rate in Yamhill County is 62.0 births per 1,000 women. Women with the education attainment of graduate degree have the highest fertility rate of 77.0 births per 1,000 women, while women with the education attainment of bachelor's degree have the lowest fertility at 51.0 births per 1,000 women. Women with the education attainment of college or associate's degree represent 38.0% of all women with births.
| Educational Attainment | Women with Births | Births / 1,000 Women |
| Less than High School | 266 (17.4%) | 69.0 |
| High School Diploma | 310 (20.3%) | 55.0 |
| College or Associate's Degree | 581 (38.0%) | 67.0 |
| Bachelor's Degree | 227 (14.8%) | 51.0 |
| Graduate Degree | 147 (9.6%) | 77.0 |
| Total | 1,531 (100.0%) | 62.0 |
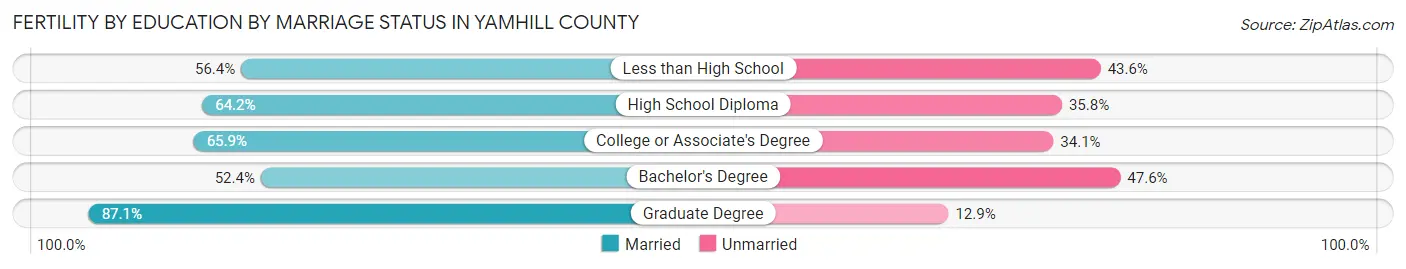
Fertility by Education by Marriage Status in Yamhill County
36.1% of women with births in Yamhill County are unmarried. Women with the educational attainment of graduate degree are most likely to be married with 87.1% of them married at childbirth, while women with the educational attainment of bachelor's degree are least likely to be married with 47.6% of them unmarried at childbirth.
| Educational Attainment | Married | Unmarried |
| Less than High School | 150 (56.4%) | 116 (43.6%) |
| High School Diploma | 199 (64.2%) | 111 (35.8%) |
| College or Associate's Degree | 383 (65.9%) | 198 (34.1%) |
| Bachelor's Degree | 119 (52.4%) | 108 (47.6%) |
| Graduate Degree | 128 (87.1%) | 19 (12.9%) |
| Total | 978 (63.9%) | 553 (36.1%) |
Income in Yamhill County
Income Overview in Yamhill County
Per Capita Income in Yamhill County is $38,002, while median incomes of families and households are $95,708 and $80,125 respectively.
| Characteristic | Number | Measure |
| Per Capita Income | 107,674 | $38,002 |
| Median Family Income | 26,911 | $95,708 |
| Mean Family Income | 26,911 | $118,961 |
| Median Household Income | 38,371 | $80,125 |
| Mean Household Income | 38,371 | $102,856 |
| Income Deficit | 26,911 | $10,460 |
| Wage / Income Gap (%) | 107,674 | 28.49% |
| Wage / Income Gap ($) | 107,674 | 71.51¢ per $1 |
| Gini / Inequality Index | 107,674 | 0.45 |
Earnings by Sex in Yamhill County
Average Earnings in Yamhill County are $39,142, $46,226 for men and $33,057 for women, a difference of 28.5%.
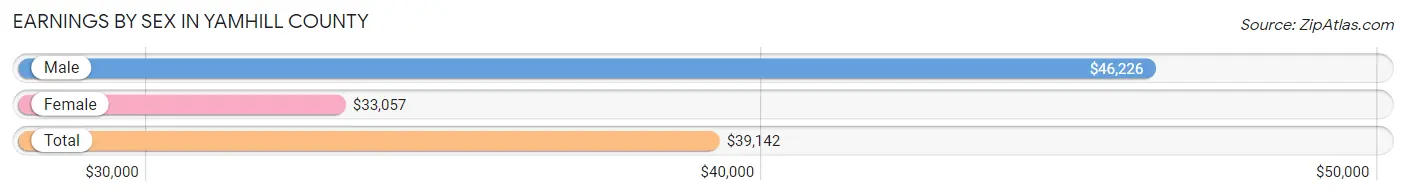
| Sex | Number | Average Earnings |
| Male | 30,623 (54.4%) | $46,226 |
| Female | 25,706 (45.6%) | $33,057 |
| Total | 56,329 (100.0%) | $39,142 |
Earnings by Sex by Income Bracket in Yamhill County
The most common earnings brackets in Yamhill County are $100,000+ for men (5,076 | 16.6%) and $2,499 or less for women (2,003 | 7.8%).
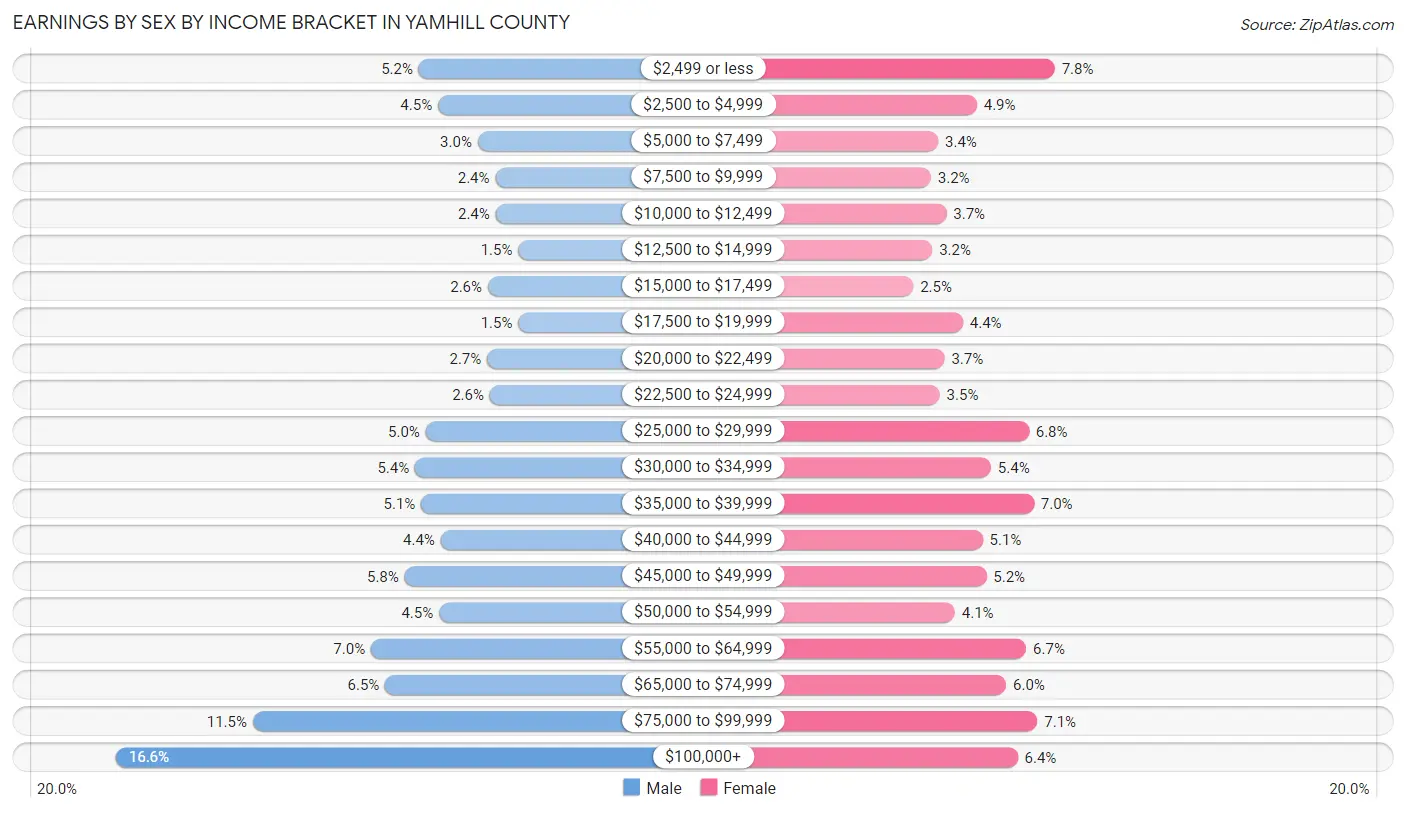
| Income | Male | Female |
| $2,499 or less | 1,601 (5.2%) | 2,003 (7.8%) |
| $2,500 to $4,999 | 1,382 (4.5%) | 1,253 (4.9%) |
| $5,000 to $7,499 | 925 (3.0%) | 880 (3.4%) |
| $7,500 to $9,999 | 723 (2.4%) | 810 (3.2%) |
| $10,000 to $12,499 | 721 (2.4%) | 960 (3.7%) |
| $12,500 to $14,999 | 460 (1.5%) | 823 (3.2%) |
| $15,000 to $17,499 | 807 (2.6%) | 641 (2.5%) |
| $17,500 to $19,999 | 459 (1.5%) | 1,118 (4.3%) |
| $20,000 to $22,499 | 817 (2.7%) | 942 (3.7%) |
| $22,500 to $24,999 | 786 (2.6%) | 895 (3.5%) |
| $25,000 to $29,999 | 1,522 (5.0%) | 1,753 (6.8%) |
| $30,000 to $34,999 | 1,643 (5.4%) | 1,389 (5.4%) |
| $35,000 to $39,999 | 1,573 (5.1%) | 1,802 (7.0%) |
| $40,000 to $44,999 | 1,351 (4.4%) | 1,309 (5.1%) |
| $45,000 to $49,999 | 1,765 (5.8%) | 1,345 (5.2%) |
| $50,000 to $54,999 | 1,370 (4.5%) | 1,040 (4.1%) |
| $55,000 to $64,999 | 2,149 (7.0%) | 1,727 (6.7%) |
| $65,000 to $74,999 | 1,988 (6.5%) | 1,535 (6.0%) |
| $75,000 to $99,999 | 3,505 (11.5%) | 1,835 (7.1%) |
| $100,000+ | 5,076 (16.6%) | 1,646 (6.4%) |
| Total | 30,623 (100.0%) | 25,706 (100.0%) |
Earnings by Sex by Educational Attainment in Yamhill County
Average earnings in Yamhill County are $54,504 for men and $38,938 for women, a difference of 28.6%. Men with an educational attainment of graduate degree enjoy the highest average annual earnings of $89,152, while those with less than high school education earn the least with $35,842. Women with an educational attainment of graduate degree earn the most with the average annual earnings of $60,295, while those with less than high school education have the smallest earnings of $25,970.
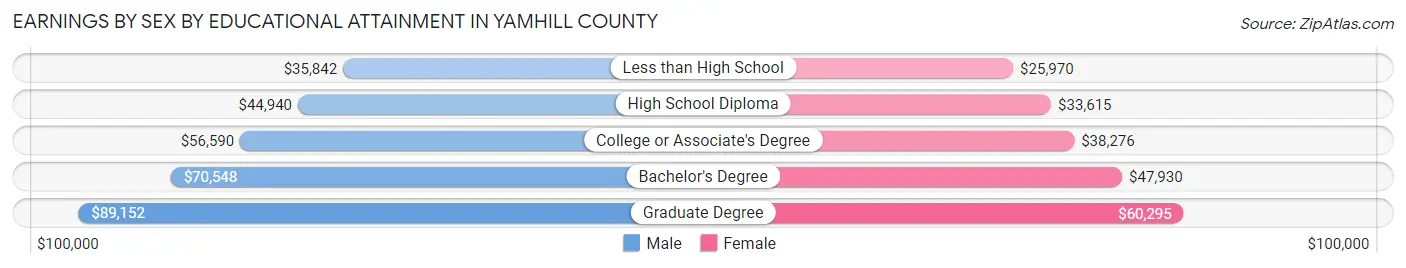
| Educational Attainment | Male Income | Female Income |
| Less than High School | $35,842 | $25,970 |
| High School Diploma | $44,940 | $33,615 |
| College or Associate's Degree | $56,590 | $38,276 |
| Bachelor's Degree | $70,548 | $47,930 |
| Graduate Degree | $89,152 | $60,295 |
| Total | $54,504 | $38,938 |
Family Income in Yamhill County
Family Income Brackets in Yamhill County
According to the Yamhill County family income data, there are 6,620 families falling into the $100,000 to $149,999 income range, which is the most common income bracket and makes up 24.6% of all families. Conversely, the $10,000 to $14,999 income bracket is the least frequent group with only 377 families (1.4%) belonging to this category.
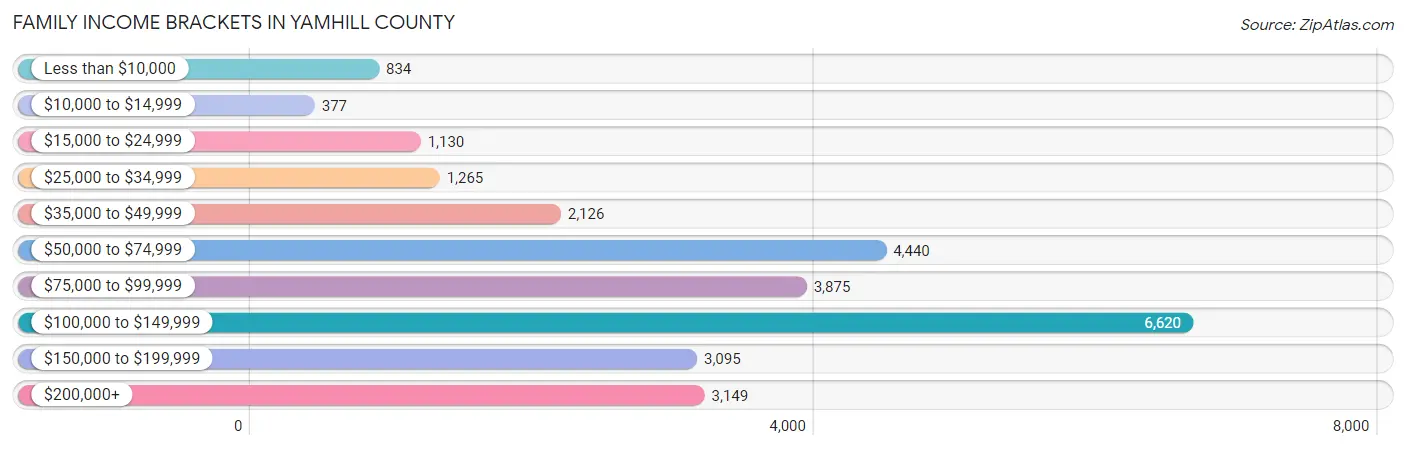
| Income Bracket | # Families | % Families |
| Less than $10,000 | 834 | 3.1% |
| $10,000 to $14,999 | 377 | 1.4% |
| $15,000 to $24,999 | 1,130 | 4.2% |
| $25,000 to $34,999 | 1,265 | 4.7% |
| $35,000 to $49,999 | 2,126 | 7.9% |
| $50,000 to $74,999 | 4,440 | 16.5% |
| $75,000 to $99,999 | 3,875 | 14.4% |
| $100,000 to $149,999 | 6,620 | 24.6% |
| $150,000 to $199,999 | 3,095 | 11.5% |
| $200,000+ | 3,149 | 11.7% |
Family Income by Famaliy Size in Yamhill County
7+ person families (519 | 1.9%) account for the highest median family income in Yamhill County with $131,481 per family, while 2-person families (13,320 | 49.5%) have the highest median income of $42,450 per family member.
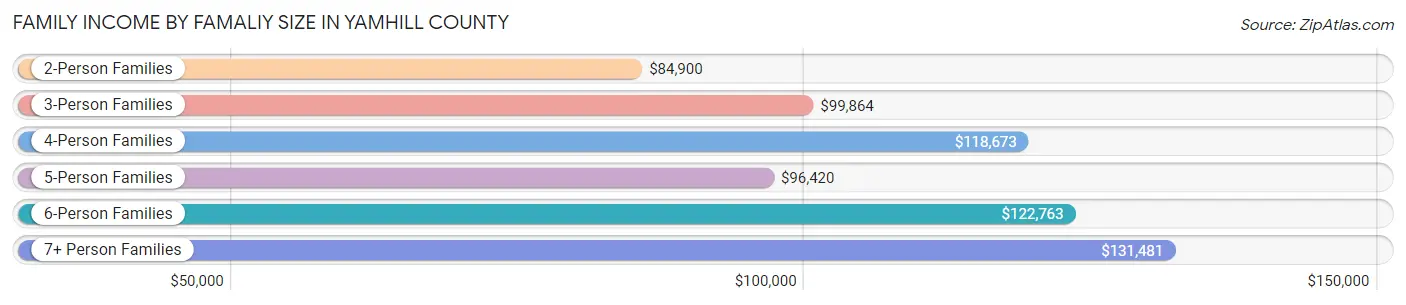
| Income Bracket | # Families | Median Income |
| 2-Person Families | 13,320 (49.5%) | $84,900 |
| 3-Person Families | 5,282 (19.6%) | $99,864 |
| 4-Person Families | 4,871 (18.1%) | $118,673 |
| 5-Person Families | 2,083 (7.7%) | $96,420 |
| 6-Person Families | 836 (3.1%) | $122,763 |
| 7+ Person Families | 519 (1.9%) | $131,481 |
| Total | 26,911 (100.0%) | $95,708 |
Family Income by Number of Earners in Yamhill County
The median family income in Yamhill County is $95,708, with families comprising 3+ earners (3,465) having the highest median family income of $134,073, while families with no earners (4,560) have the lowest median family income of $59,068, accounting for 12.9% and 16.9% of families, respectively.
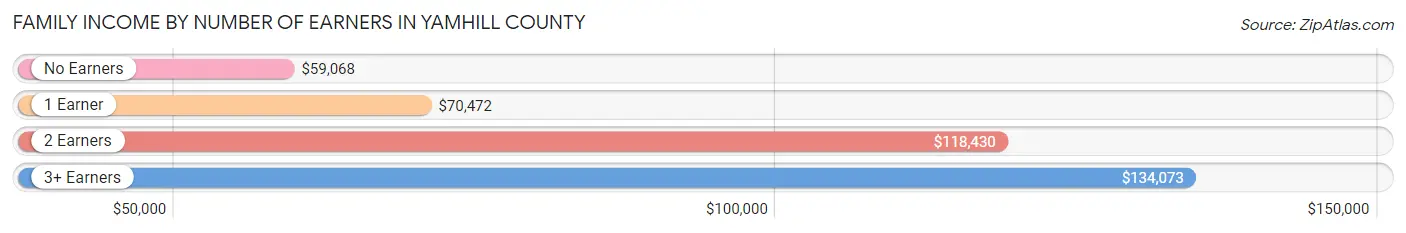
| Number of Earners | # Families | Median Income |
| No Earners | 4,560 (16.9%) | $59,068 |
| 1 Earner | 8,040 (29.9%) | $70,472 |
| 2 Earners | 10,846 (40.3%) | $118,430 |
| 3+ Earners | 3,465 (12.9%) | $134,073 |
| Total | 26,911 (100.0%) | $95,708 |
Household Income in Yamhill County
Household Income Brackets in Yamhill County
With 7,866 households falling in the category, the $100,000 to $149,999 income range is the most frequent in Yamhill County, accounting for 20.5% of all households. In contrast, only 1,343 households (3.5%) fall into the $10,000 to $14,999 income bracket, making it the least populous group.
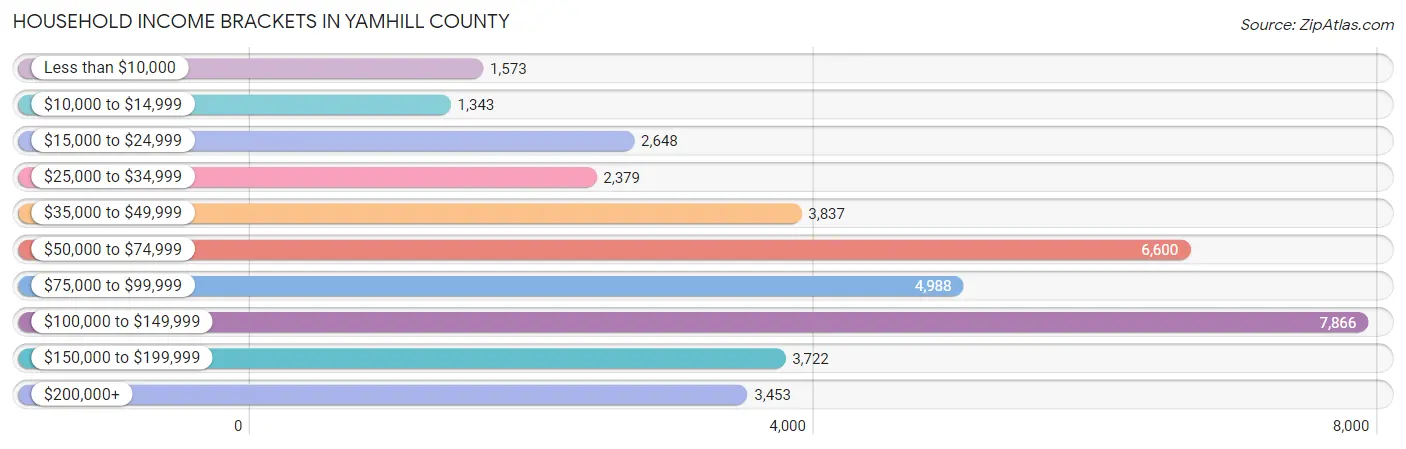
| Income Bracket | # Households | % Households |
| Less than $10,000 | 1,573 | 4.1% |
| $10,000 to $14,999 | 1,343 | 3.5% |
| $15,000 to $24,999 | 2,648 | 6.9% |
| $25,000 to $34,999 | 2,379 | 6.2% |
| $35,000 to $49,999 | 3,837 | 10.0% |
| $50,000 to $74,999 | 6,600 | 17.2% |
| $75,000 to $99,999 | 4,988 | 13.0% |
| $100,000 to $149,999 | 7,866 | 20.5% |
| $150,000 to $199,999 | 3,722 | 9.7% |
| $200,000+ | 3,453 | 9.0% |
Household Income by Householder Age in Yamhill County
The median household income in Yamhill County is $80,125, with the highest median household income of $103,973 found in the 45 to 64 years age bracket for the primary householder. A total of 13,209 households (34.4%) fall into this category. Meanwhile, the 15 to 24 years age bracket for the primary householder has the lowest median household income of $55,546, with 1,163 households (3.0%) in this group.
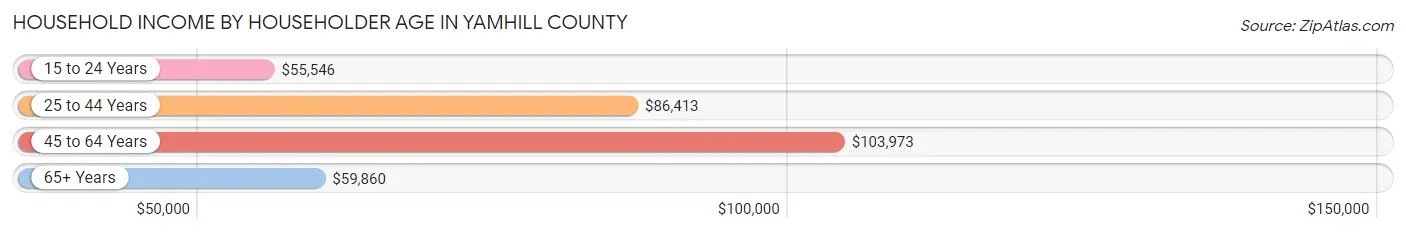
| Income Bracket | # Households | Median Income |
| 15 to 24 Years | 1,163 (3.0%) | $55,546 |
| 25 to 44 Years | 12,322 (32.1%) | $86,413 |
| 45 to 64 Years | 13,209 (34.4%) | $103,973 |
| 65+ Years | 11,677 (30.4%) | $59,860 |
| Total | 38,371 (100.0%) | $80,125 |
Poverty in Yamhill County
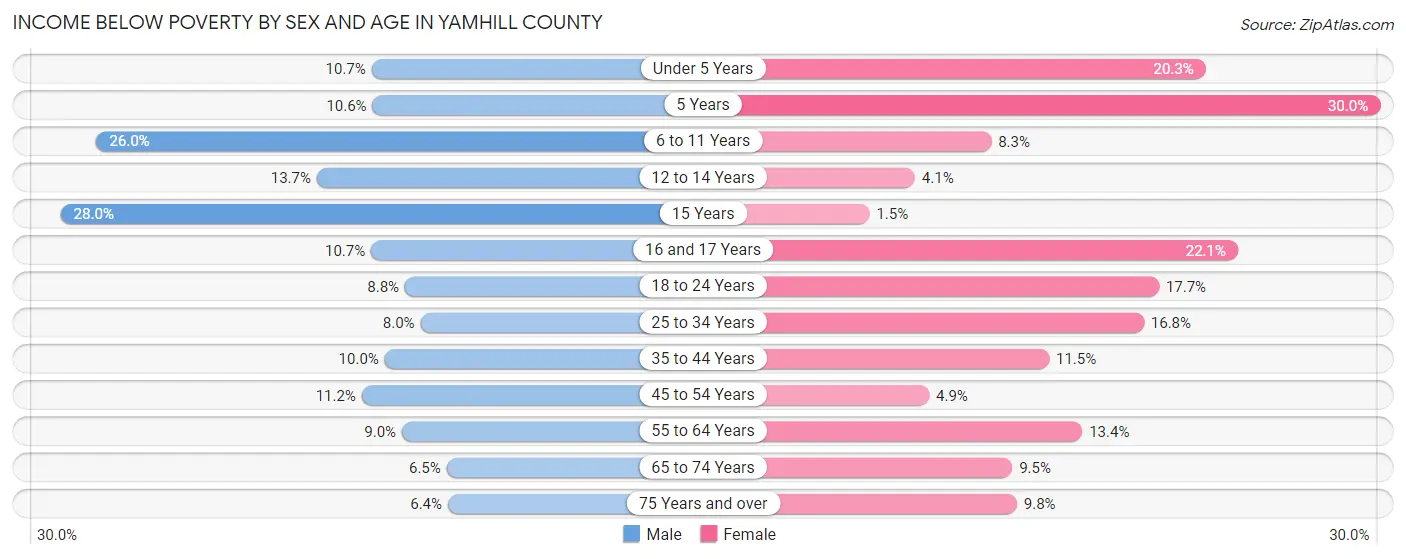
Income Below Poverty by Sex and Age in Yamhill County
With 10.7% poverty level for males and 12.0% for females among the residents of Yamhill County, 15 year old males and 5 year old females are the most vulnerable to poverty, with 171 males (28.0%) and 175 females (30.0%) in their respective age groups living below the poverty level.
| Age Bracket | Male | Female |
| Under 5 Years | 303 (10.7%) | 550 (20.3%) |
| 5 Years | 79 (10.6%) | 175 (30.0%) |
| 6 to 11 Years | 1,005 (26.0%) | 319 (8.3%) |
| 12 to 14 Years | 299 (13.7%) | 75 (4.1%) |
| 15 Years | 171 (28.0%) | 11 (1.5%) |
| 16 and 17 Years | 176 (10.7%) | 290 (22.1%) |
| 18 to 24 Years | 420 (8.8%) | 659 (17.7%) |
| 25 to 34 Years | 534 (8.0%) | 1,082 (16.8%) |
| 35 to 44 Years | 665 (10.0%) | 777 (11.5%) |
| 45 to 54 Years | 711 (11.2%) | 295 (4.9%) |
| 55 to 64 Years | 580 (9.0%) | 906 (13.4%) |
| 65 to 74 Years | 345 (6.5%) | 574 (9.5%) |
| 75 Years and over | 215 (6.4%) | 409 (9.8%) |
| Total | 5,503 (10.7%) | 6,122 (12.0%) |
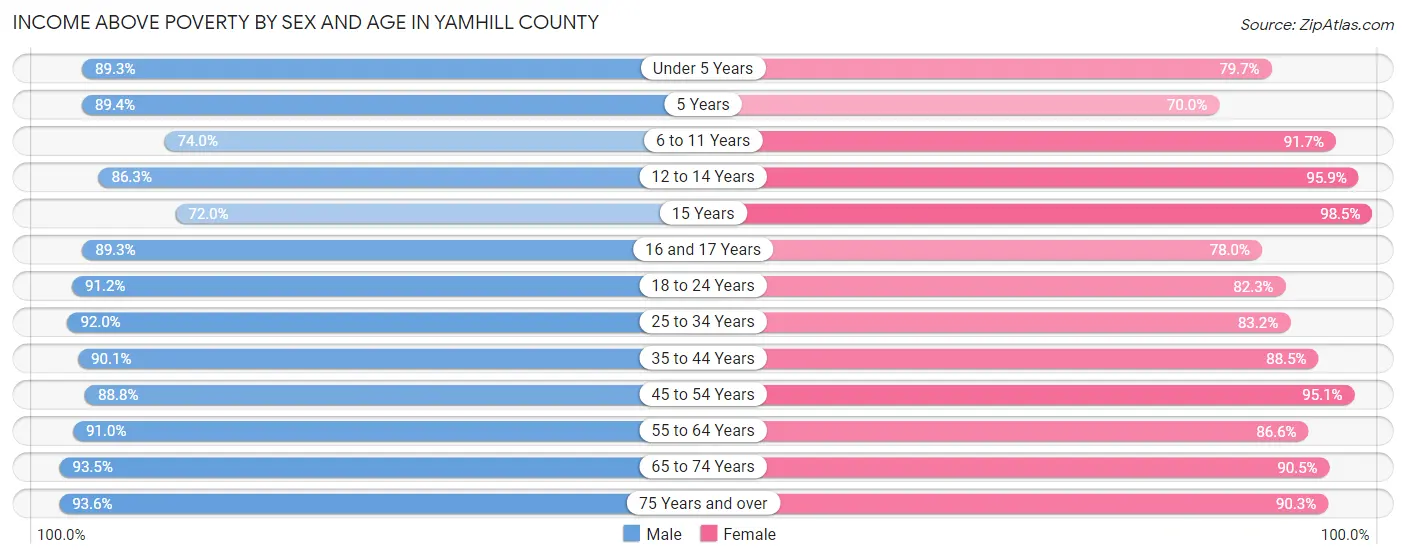
Income Above Poverty by Sex and Age in Yamhill County
According to the poverty statistics in Yamhill County, males aged 75 years and over and females aged 15 years are the age groups that are most secure financially, with 93.6% of males and 98.5% of females in these age groups living above the poverty line.
| Age Bracket | Male | Female |
| Under 5 Years | 2,535 (89.3%) | 2,165 (79.7%) |
| 5 Years | 664 (89.4%) | 409 (70.0%) |
| 6 to 11 Years | 2,861 (74.0%) | 3,517 (91.7%) |
| 12 to 14 Years | 1,879 (86.3%) | 1,767 (95.9%) |
| 15 Years | 440 (72.0%) | 704 (98.5%) |
| 16 and 17 Years | 1,468 (89.3%) | 1,025 (77.9%) |
| 18 to 24 Years | 4,343 (91.2%) | 3,072 (82.3%) |
| 25 to 34 Years | 6,177 (92.0%) | 5,351 (83.2%) |
| 35 to 44 Years | 6,017 (90.0%) | 5,959 (88.5%) |
| 45 to 54 Years | 5,618 (88.8%) | 5,774 (95.1%) |
| 55 to 64 Years | 5,873 (91.0%) | 5,859 (86.6%) |
| 65 to 74 Years | 4,962 (93.5%) | 5,476 (90.5%) |
| 75 Years and over | 3,127 (93.6%) | 3,785 (90.2%) |
| Total | 45,964 (89.3%) | 44,863 (88.0%) |
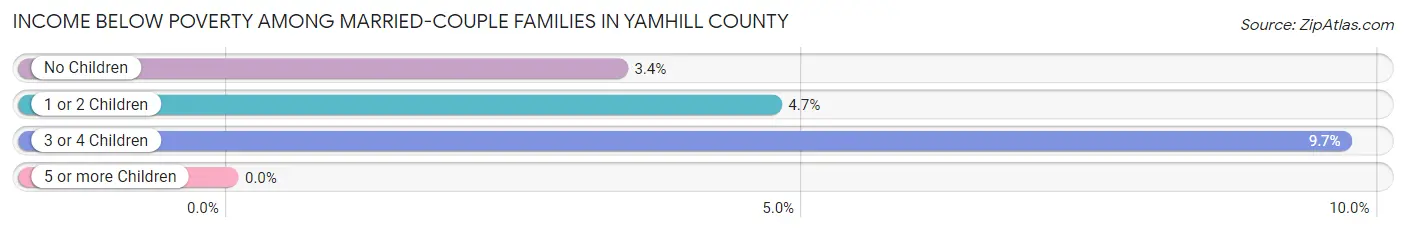
Income Below Poverty Among Married-Couple Families in Yamhill County
The poverty statistics for married-couple families in Yamhill County show that 4.3% or 888 of the total 20,513 families live below the poverty line. Families with 3 or 4 children have the highest poverty rate of 9.7%, comprising of 169 families. On the other hand, families with 5 or more children have the lowest poverty rate of 0.0%, which includes 0 families.
| Children | Above Poverty | Below Poverty |
| No Children | 11,908 (96.6%) | 418 (3.4%) |
| 1 or 2 Children | 6,068 (95.3%) | 301 (4.7%) |
| 3 or 4 Children | 1,573 (90.3%) | 169 (9.7%) |
| 5 or more Children | 76 (100.0%) | 0 (0.0%) |
| Total | 19,625 (95.7%) | 888 (4.3%) |
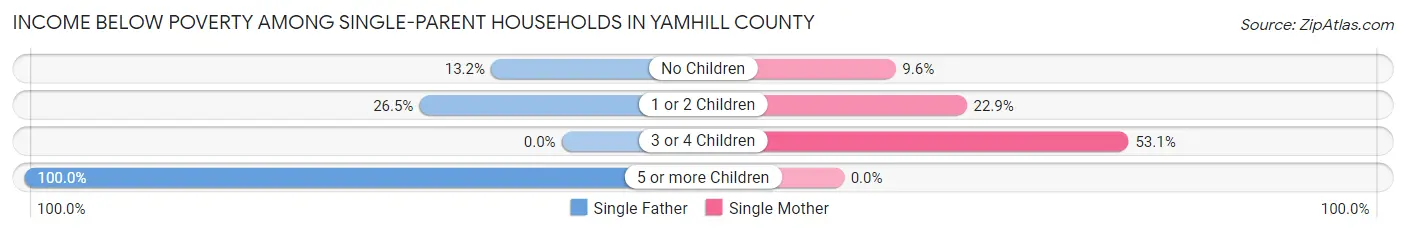
Income Below Poverty Among Single-Parent Households in Yamhill County
According to the poverty data in Yamhill County, 19.9% or 302 single-father households and 20.7% or 1,013 single-mother households are living below the poverty line. Among single-father households, those with 5 or more children have the highest poverty rate, with 27 households (100.0%) experiencing poverty. Likewise, among single-mother households, those with 3 or 4 children have the highest poverty rate, with 322 households (53.0%) falling below the poverty line.
| Children | Single Father | Single Mother |
| No Children | 76 (13.2%) | 209 (9.6%) |
| 1 or 2 Children | 199 (26.5%) | 482 (22.9%) |
| 3 or 4 Children | 0 (0.0%) | 322 (53.0%) |
| 5 or more Children | 27 (100.0%) | 0 (0.0%) |
| Total | 302 (19.9%) | 1,013 (20.7%) |
Income Below Poverty Among Married-Couple vs Single-Parent Households in Yamhill County
The poverty data for Yamhill County shows that 888 of the married-couple family households (4.3%) and 1,315 of the single-parent households (20.5%) are living below the poverty level. Within the married-couple family households, those with 3 or 4 children have the highest poverty rate, with 169 households (9.7%) falling below the poverty line. Among the single-parent households, those with 5 or more children have the highest poverty rate, with 27 household (100.0%) living below poverty.
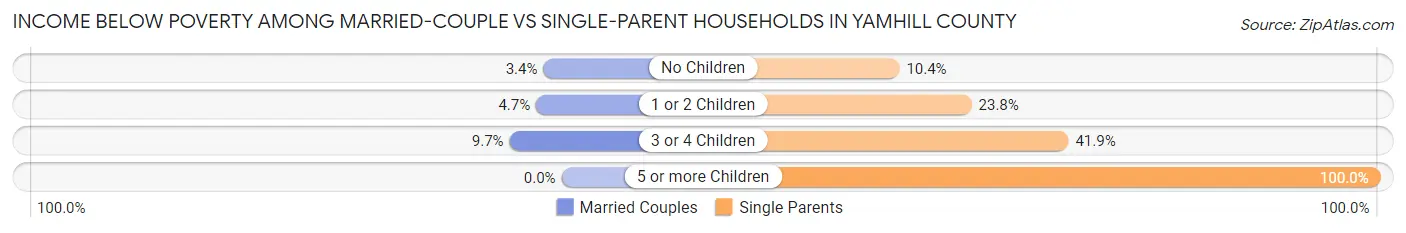
| Children | Married-Couple Families | Single-Parent Households |
| No Children | 418 (3.4%) | 285 (10.4%) |
| 1 or 2 Children | 301 (4.7%) | 681 (23.8%) |
| 3 or 4 Children | 169 (9.7%) | 322 (41.9%) |
| 5 or more Children | 0 (0.0%) | 27 (100.0%) |
| Total | 888 (4.3%) | 1,315 (20.5%) |
Employment Characteristics in Yamhill County
Employment by Class of Employer in Yamhill County
Among the 48,875 employed individuals in Yamhill County, private company employees (32,620 | 66.7%), not-for-profit organizations (4,765 | 9.8%), and self-employed (not incorporated) (3,500 | 7.2%) make up the most common classes of employment.
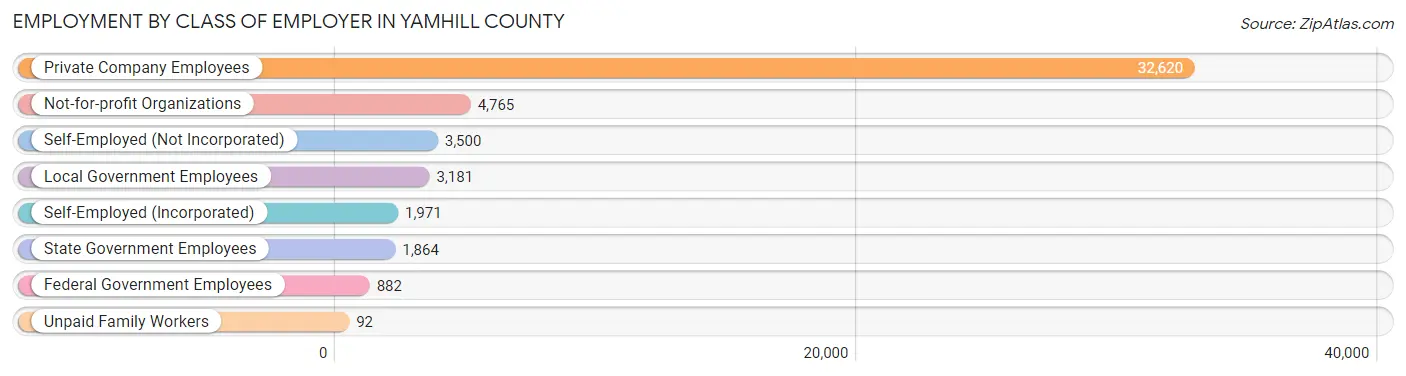
| Employer Class | # Employees | % Employees |
| Private Company Employees | 32,620 | 66.7% |
| Self-Employed (Incorporated) | 1,971 | 4.0% |
| Self-Employed (Not Incorporated) | 3,500 | 7.2% |
| Not-for-profit Organizations | 4,765 | 9.8% |
| Local Government Employees | 3,181 | 6.5% |
| State Government Employees | 1,864 | 3.8% |
| Federal Government Employees | 882 | 1.8% |
| Unpaid Family Workers | 92 | 0.2% |
| Total | 48,875 | 100.0% |
Employment Status by Age in Yamhill County
According to the labor force statistics for Yamhill County, out of the total population over 16 years of age (87,489), 59.7% or 52,231 individuals are in the labor force, with 4.1% or 2,141 of them unemployed. The age group with the highest labor force participation rate is 30 to 34 years, with 83.4% or 5,934 individuals in the labor force. Within the labor force, the 16 to 19 years age range has the highest percentage of unemployed individuals, with 11.3% or 303 of them being unemployed.
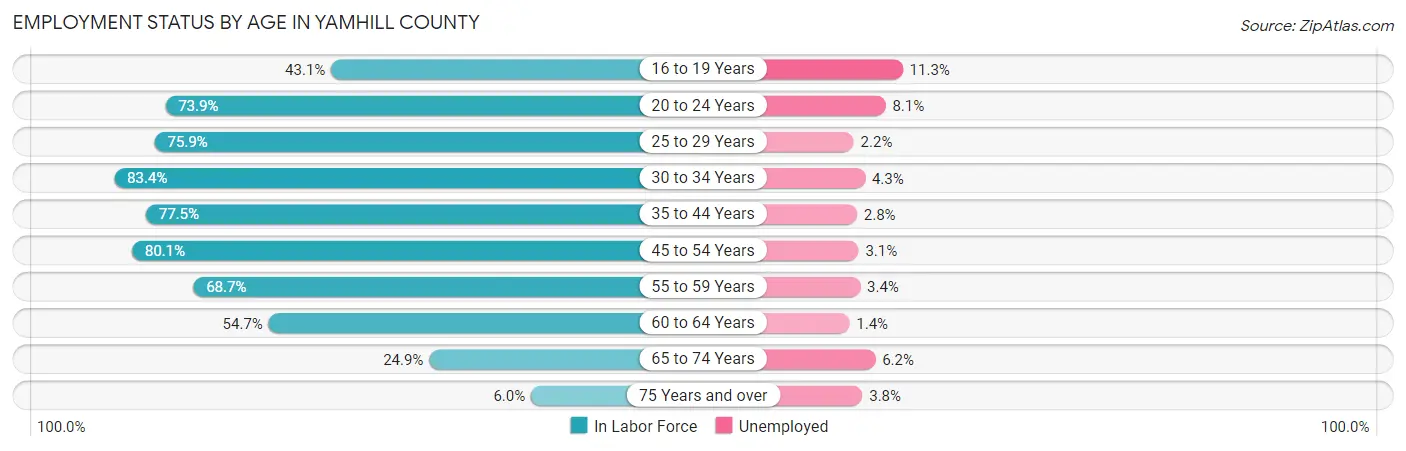
| Age Bracket | In Labor Force | Unemployed |
| 16 to 19 Years | 2,683 (43.1%) | 303 (11.3%) |
| 20 to 24 Years | 5,851 (73.9%) | 474 (8.1%) |
| 25 to 29 Years | 4,978 (75.9%) | 110 (2.2%) |
| 30 to 34 Years | 5,934 (83.4%) | 255 (4.3%) |
| 35 to 44 Years | 10,870 (77.5%) | 304 (2.8%) |
| 45 to 54 Years | 10,283 (80.1%) | 319 (3.1%) |
| 55 to 59 Years | 4,539 (68.7%) | 154 (3.4%) |
| 60 to 64 Years | 3,737 (54.7%) | 52 (1.4%) |
| 65 to 74 Years | 2,868 (24.9%) | 178 (6.2%) |
| 75 Years and over | 471 (6.0%) | 18 (3.8%) |
| Total | 52,231 (59.7%) | 2,141 (4.1%) |
Employment Status by Educational Attainment in Yamhill County
According to labor force statistics for Yamhill County, 74.7% of individuals (40,320) out of the total population between 25 and 64 years of age (53,976) are in the labor force, with 2.9% or 1,169 of them being unemployed. The group with the highest labor force participation rate are those with the educational attainment of bachelor's degree or higher, with 87.5% or 13,355 individuals in the labor force. Within the labor force, individuals with less than high school education have the highest percentage of unemployment, with 4.7% or 177 of them being unemployed.
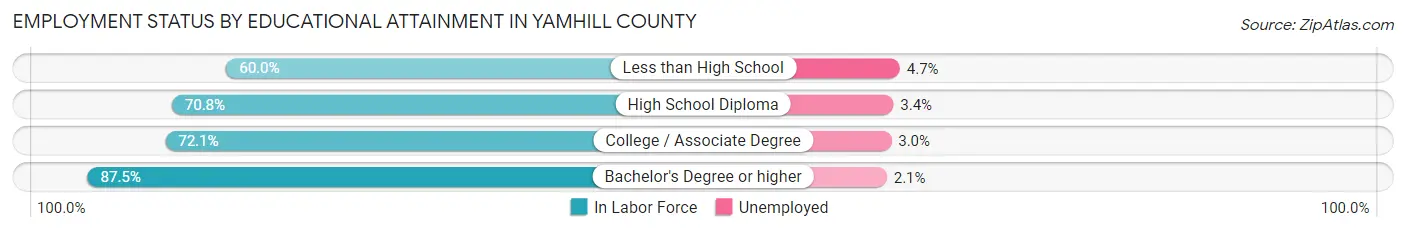
| Educational Attainment | In Labor Force | Unemployed |
| Less than High School | 3,761 (60.0%) | 295 (4.7%) |
| High School Diploma | 9,525 (70.8%) | 457 (3.4%) |
| College / Associate Degree | 13,693 (72.1%) | 570 (3.0%) |
| Bachelor's Degree or higher | 13,355 (87.5%) | 321 (2.1%) |
| Total | 40,320 (74.7%) | 1,565 (2.9%) |
Employment Occupations by Sex in Yamhill County
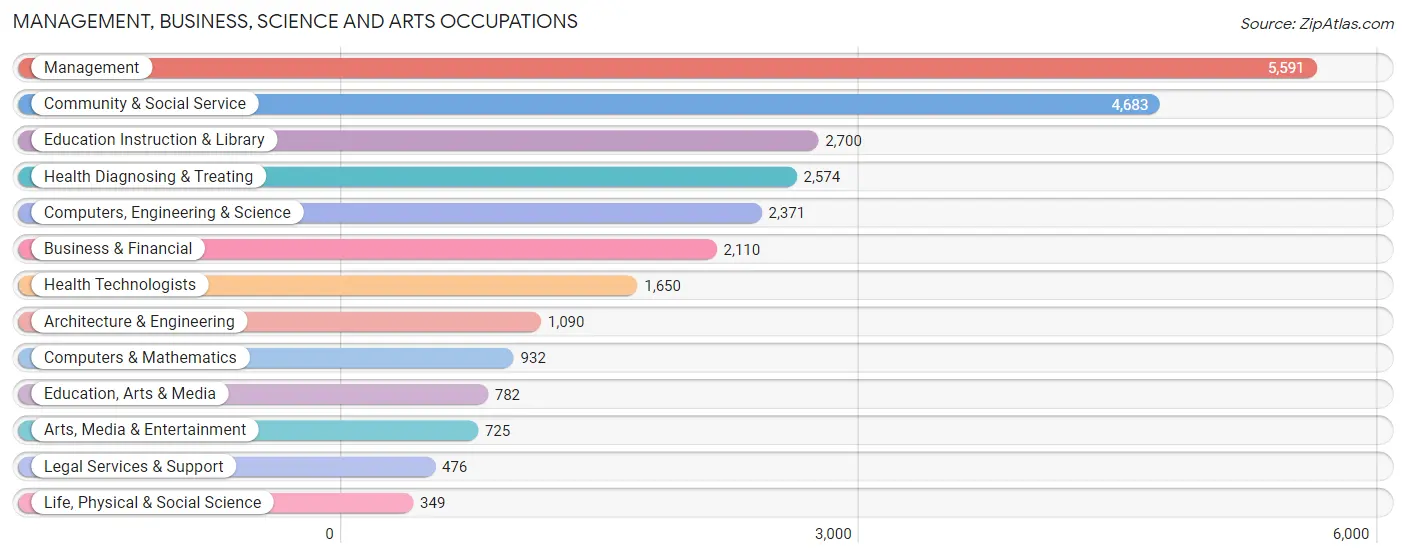
Management, Business, Science and Arts Occupations
The most common Management, Business, Science and Arts occupations in Yamhill County are Management (5,591 | 11.2%), Community & Social Service (4,683 | 9.4%), Education Instruction & Library (2,700 | 5.4%), Health Diagnosing & Treating (2,574 | 5.1%), and Computers, Engineering & Science (2,371 | 4.7%).
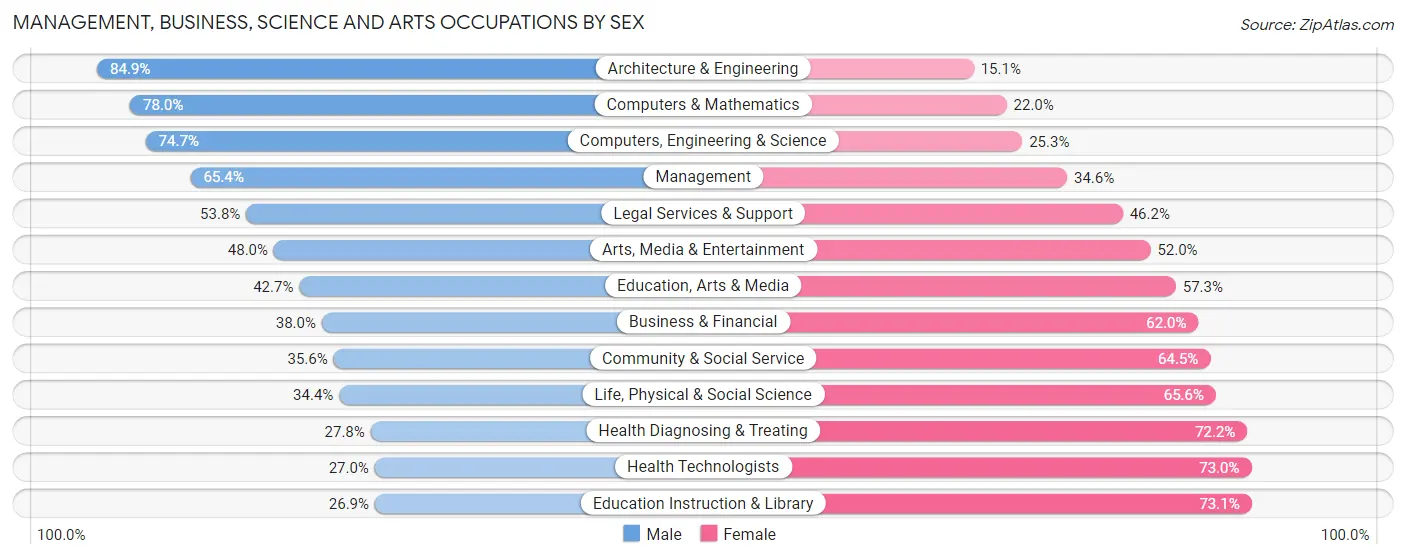
Management, Business, Science and Arts Occupations by Sex
Within the Management, Business, Science and Arts occupations in Yamhill County, the most male-oriented occupations are Architecture & Engineering (84.9%), Computers & Mathematics (78.0%), and Computers, Engineering & Science (74.7%), while the most female-oriented occupations are Education Instruction & Library (73.1%), Health Technologists (73.0%), and Health Diagnosing & Treating (72.2%).
| Occupation | Male | Female |
| Management | 3,656 (65.4%) | 1,935 (34.6%) |
| Business & Financial | 802 (38.0%) | 1,308 (62.0%) |
| Computers, Engineering & Science | 1,772 (74.7%) | 599 (25.3%) |
| Computers & Mathematics | 727 (78.0%) | 205 (22.0%) |
| Architecture & Engineering | 925 (84.9%) | 165 (15.1%) |
| Life, Physical & Social Science | 120 (34.4%) | 229 (65.6%) |
| Community & Social Service | 1,665 (35.5%) | 3,018 (64.4%) |
| Education, Arts & Media | 334 (42.7%) | 448 (57.3%) |
| Legal Services & Support | 256 (53.8%) | 220 (46.2%) |
| Education Instruction & Library | 727 (26.9%) | 1,973 (73.1%) |
| Arts, Media & Entertainment | 348 (48.0%) | 377 (52.0%) |
| Health Diagnosing & Treating | 716 (27.8%) | 1,858 (72.2%) |
| Health Technologists | 445 (27.0%) | 1,205 (73.0%) |
| Total (Category) | 8,611 (49.7%) | 8,718 (50.3%) |
| Total (Overall) | 27,411 (54.8%) | 22,570 (45.2%) |
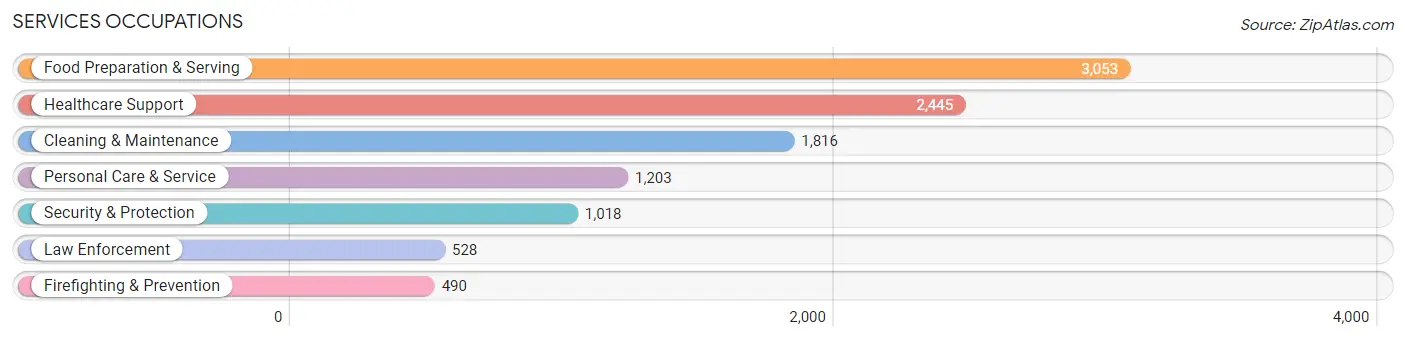
Services Occupations
The most common Services occupations in Yamhill County are Food Preparation & Serving (3,053 | 6.1%), Healthcare Support (2,445 | 4.9%), Cleaning & Maintenance (1,816 | 3.6%), Personal Care & Service (1,203 | 2.4%), and Security & Protection (1,018 | 2.0%).
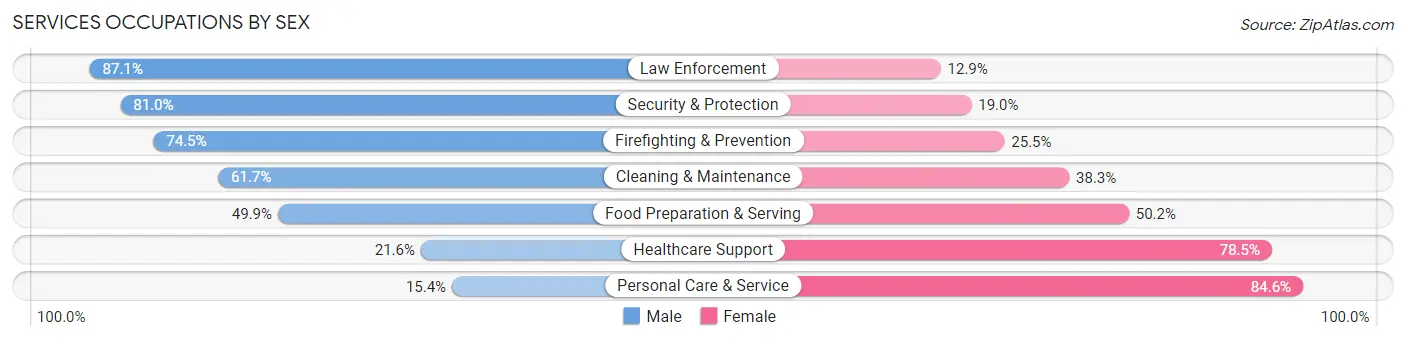
Services Occupations by Sex
Within the Services occupations in Yamhill County, the most male-oriented occupations are Law Enforcement (87.1%), Security & Protection (81.0%), and Firefighting & Prevention (74.5%), while the most female-oriented occupations are Personal Care & Service (84.6%), Healthcare Support (78.4%), and Food Preparation & Serving (50.1%).
| Occupation | Male | Female |
| Healthcare Support | 527 (21.5%) | 1,918 (78.4%) |
| Security & Protection | 825 (81.0%) | 193 (19.0%) |
| Firefighting & Prevention | 365 (74.5%) | 125 (25.5%) |
| Law Enforcement | 460 (87.1%) | 68 (12.9%) |
| Food Preparation & Serving | 1,522 (49.8%) | 1,531 (50.1%) |
| Cleaning & Maintenance | 1,120 (61.7%) | 696 (38.3%) |
| Personal Care & Service | 185 (15.4%) | 1,018 (84.6%) |
| Total (Category) | 4,179 (43.8%) | 5,356 (56.2%) |
| Total (Overall) | 27,411 (54.8%) | 22,570 (45.2%) |
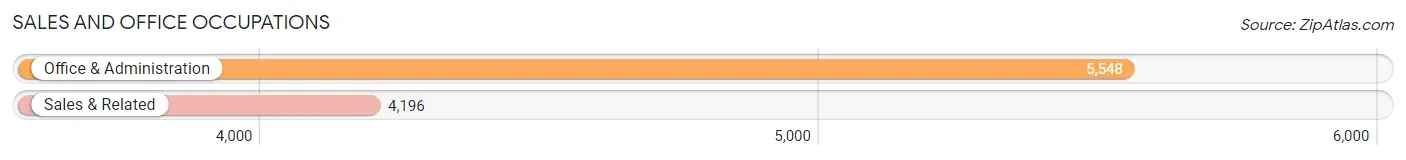
Sales and Office Occupations
The most common Sales and Office occupations in Yamhill County are Office & Administration (5,548 | 11.1%), and Sales & Related (4,196 | 8.4%).
Sales and Office Occupations by Sex
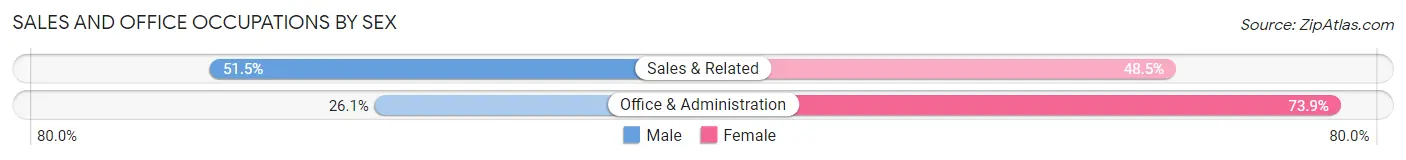
| Occupation | Male | Female |
| Sales & Related | 2,160 (51.5%) | 2,036 (48.5%) |
| Office & Administration | 1,450 (26.1%) | 4,098 (73.9%) |
| Total (Category) | 3,610 (37.0%) | 6,134 (62.9%) |
| Total (Overall) | 27,411 (54.8%) | 22,570 (45.2%) |
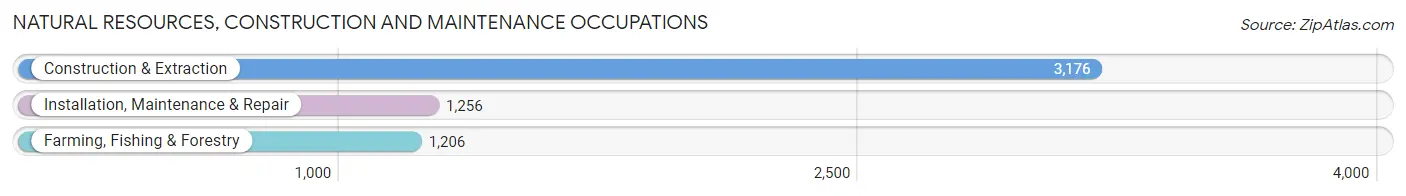
Natural Resources, Construction and Maintenance Occupations
The most common Natural Resources, Construction and Maintenance occupations in Yamhill County are Construction & Extraction (3,176 | 6.4%), Installation, Maintenance & Repair (1,256 | 2.5%), and Farming, Fishing & Forestry (1,206 | 2.4%).
Natural Resources, Construction and Maintenance Occupations by Sex
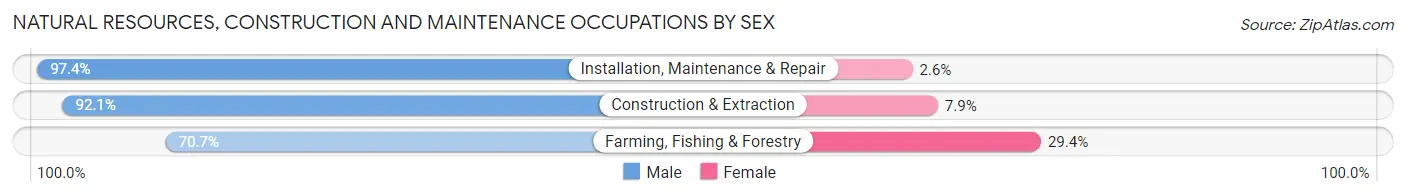
| Occupation | Male | Female |
| Farming, Fishing & Forestry | 852 (70.7%) | 354 (29.3%) |
| Construction & Extraction | 2,925 (92.1%) | 251 (7.9%) |
| Installation, Maintenance & Repair | 1,223 (97.4%) | 33 (2.6%) |
| Total (Category) | 5,000 (88.7%) | 638 (11.3%) |
| Total (Overall) | 27,411 (54.8%) | 22,570 (45.2%) |
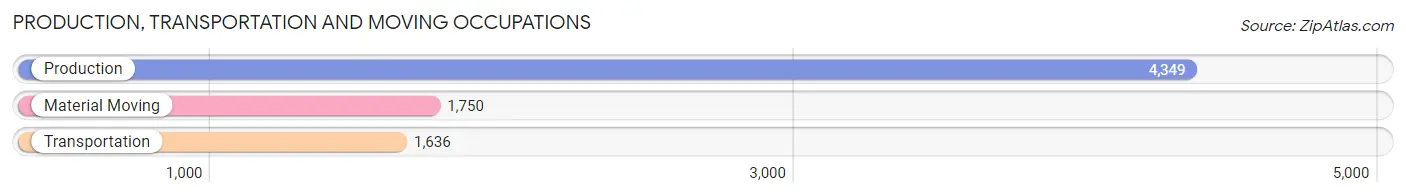
Production, Transportation and Moving Occupations
The most common Production, Transportation and Moving occupations in Yamhill County are Production (4,349 | 8.7%), Material Moving (1,750 | 3.5%), and Transportation (1,636 | 3.3%).
Production, Transportation and Moving Occupations by Sex
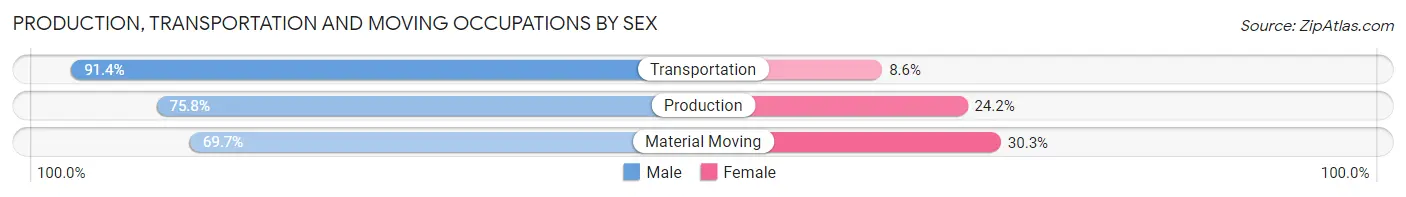
| Occupation | Male | Female |
| Production | 3,296 (75.8%) | 1,053 (24.2%) |
| Transportation | 1,496 (91.4%) | 140 (8.6%) |
| Material Moving | 1,219 (69.7%) | 531 (30.3%) |
| Total (Category) | 6,011 (77.7%) | 1,724 (22.3%) |
| Total (Overall) | 27,411 (54.8%) | 22,570 (45.2%) |
Employment Industries by Sex in Yamhill County
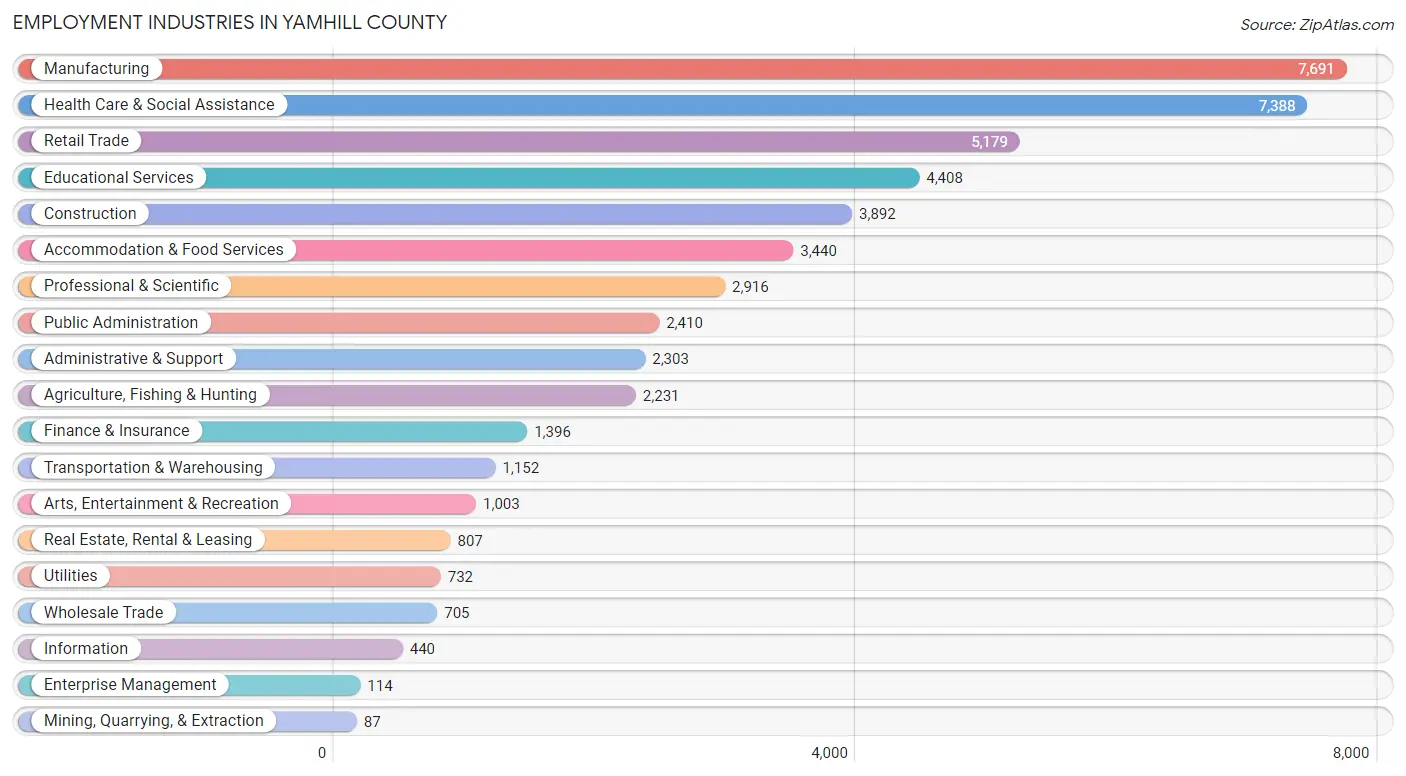
Employment Industries in Yamhill County
The major employment industries in Yamhill County include Manufacturing (7,691 | 15.4%), Health Care & Social Assistance (7,388 | 14.8%), Retail Trade (5,179 | 10.4%), Educational Services (4,408 | 8.8%), and Construction (3,892 | 7.8%).
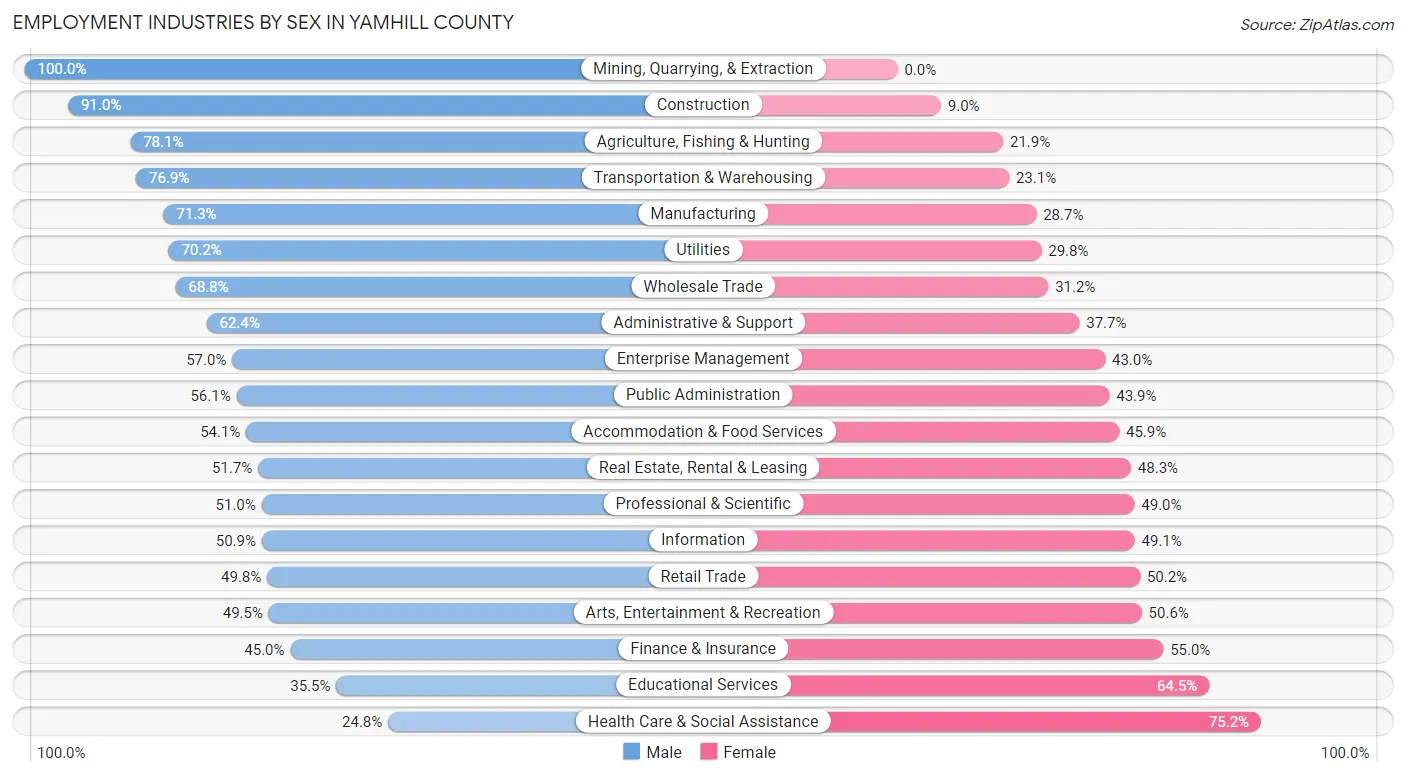
Employment Industries by Sex in Yamhill County
The Yamhill County industries that see more men than women are Mining, Quarrying, & Extraction (100.0%), Construction (91.0%), and Agriculture, Fishing & Hunting (78.1%), whereas the industries that tend to have a higher number of women are Health Care & Social Assistance (75.2%), Educational Services (64.5%), and Finance & Insurance (55.0%).
| Industry | Male | Female |
| Agriculture, Fishing & Hunting | 1,743 (78.1%) | 488 (21.9%) |
| Mining, Quarrying, & Extraction | 87 (100.0%) | 0 (0.0%) |
| Construction | 3,542 (91.0%) | 350 (9.0%) |
| Manufacturing | 5,481 (71.3%) | 2,210 (28.7%) |
| Wholesale Trade | 485 (68.8%) | 220 (31.2%) |
| Retail Trade | 2,579 (49.8%) | 2,600 (50.2%) |
| Transportation & Warehousing | 886 (76.9%) | 266 (23.1%) |
| Utilities | 514 (70.2%) | 218 (29.8%) |
| Information | 224 (50.9%) | 216 (49.1%) |
| Finance & Insurance | 628 (45.0%) | 768 (55.0%) |
| Real Estate, Rental & Leasing | 417 (51.7%) | 390 (48.3%) |
| Professional & Scientific | 1,486 (51.0%) | 1,430 (49.0%) |
| Enterprise Management | 65 (57.0%) | 49 (43.0%) |
| Administrative & Support | 1,436 (62.4%) | 867 (37.7%) |
| Educational Services | 1,564 (35.5%) | 2,844 (64.5%) |
| Health Care & Social Assistance | 1,829 (24.8%) | 5,559 (75.2%) |
| Arts, Entertainment & Recreation | 496 (49.4%) | 507 (50.5%) |
| Accommodation & Food Services | 1,862 (54.1%) | 1,578 (45.9%) |
| Public Administration | 1,353 (56.1%) | 1,057 (43.9%) |
| Total | 27,411 (54.8%) | 22,570 (45.2%) |
Education in Yamhill County
School Enrollment in Yamhill County
The most common levels of schooling among the 25,140 students in Yamhill County are college / undergraduate (6,170 | 24.5%), middle school (5,382 | 21.4%), and elementary school (5,196 | 20.7%).
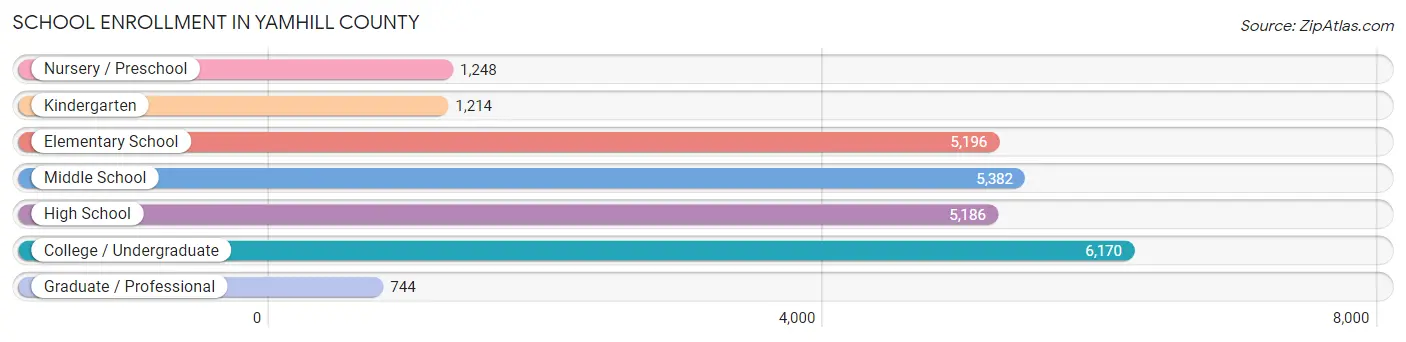
| School Level | # Students | % Students |
| Nursery / Preschool | 1,248 | 5.0% |
| Kindergarten | 1,214 | 4.8% |
| Elementary School | 5,196 | 20.7% |
| Middle School | 5,382 | 21.4% |
| High School | 5,186 | 20.6% |
| College / Undergraduate | 6,170 | 24.5% |
| Graduate / Professional | 744 | 3.0% |
| Total | 25,140 | 100.0% |
School Enrollment by Age by Funding Source in Yamhill County
Out of a total of 25,140 students who are enrolled in schools in Yamhill County, 5,656 (22.5%) attend a private institution, while the remaining 19,484 (77.5%) are enrolled in public schools. The age group of 20 to 24 year olds has the highest likelihood of being enrolled in private schools, with 1,708 (56.4% in the age bracket) enrolled. Conversely, the age group of 15 to 17 year olds has the lowest likelihood of being enrolled in a private school, with 3,747 (93.8% in the age bracket) attending a public institution.
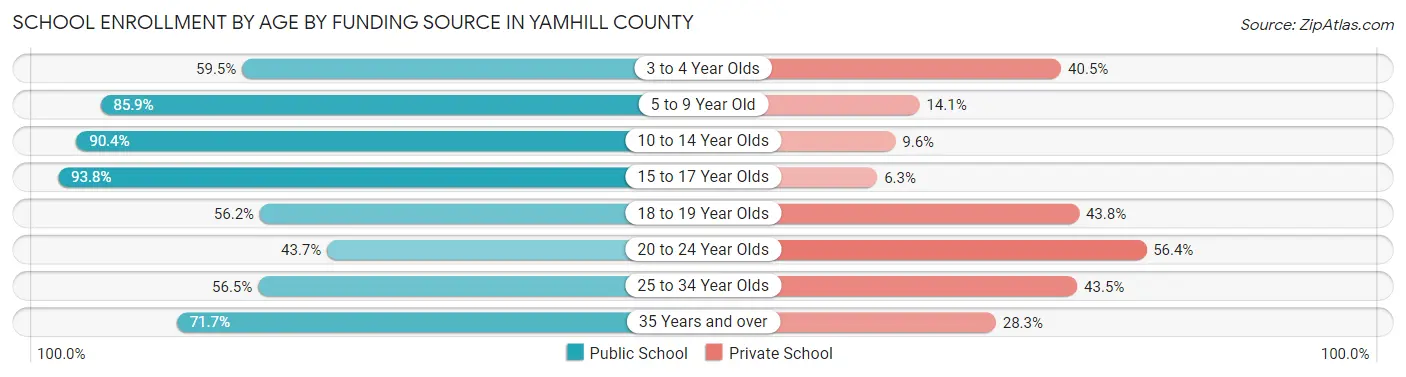
| Age Bracket | Public School | Private School |
| 3 to 4 Year Olds | 583 (59.5%) | 397 (40.5%) |
| 5 to 9 Year Old | 5,010 (85.9%) | 824 (14.1%) |
| 10 to 14 Year Olds | 6,053 (90.4%) | 645 (9.6%) |
| 15 to 17 Year Olds | 3,747 (93.8%) | 250 (6.2%) |
| 18 to 19 Year Olds | 1,357 (56.2%) | 1,059 (43.8%) |
| 20 to 24 Year Olds | 1,323 (43.6%) | 1,708 (56.4%) |
| 25 to 34 Year Olds | 608 (56.5%) | 468 (43.5%) |
| 35 Years and over | 794 (71.7%) | 314 (28.3%) |
| Total | 19,484 (77.5%) | 5,656 (22.5%) |
Educational Attainment by Field of Study in Yamhill County
Business (3,677 | 15.5%), education (3,108 | 13.1%), bio, nature & agricultural (2,361 | 10.0%), science & technology (1,982 | 8.4%), and social sciences (1,979 | 8.4%) are the most common fields of study among 23,688 individuals in Yamhill County who have obtained a bachelor's degree or higher.
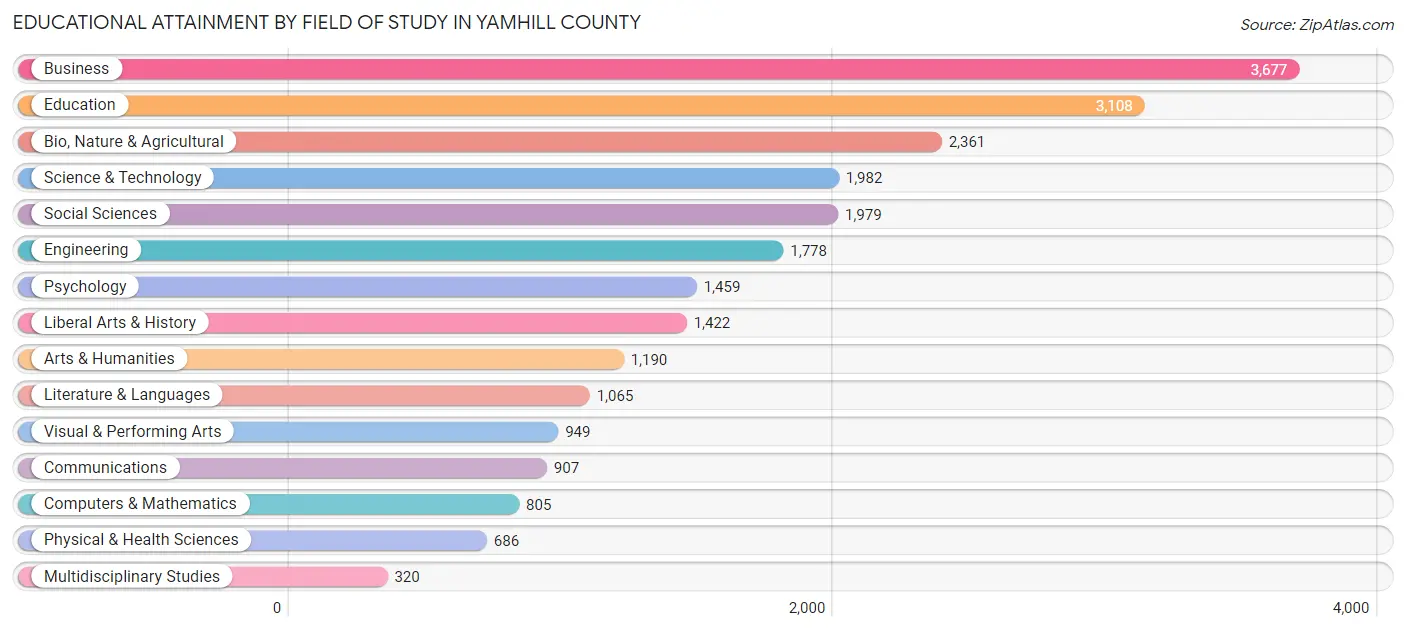
| Field of Study | # Graduates | % Graduates |
| Computers & Mathematics | 805 | 3.4% |
| Bio, Nature & Agricultural | 2,361 | 10.0% |
| Physical & Health Sciences | 686 | 2.9% |
| Psychology | 1,459 | 6.2% |
| Social Sciences | 1,979 | 8.4% |
| Engineering | 1,778 | 7.5% |
| Multidisciplinary Studies | 320 | 1.3% |
| Science & Technology | 1,982 | 8.4% |
| Business | 3,677 | 15.5% |
| Education | 3,108 | 13.1% |
| Literature & Languages | 1,065 | 4.5% |
| Liberal Arts & History | 1,422 | 6.0% |
| Visual & Performing Arts | 949 | 4.0% |
| Communications | 907 | 3.8% |
| Arts & Humanities | 1,190 | 5.0% |
| Total | 23,688 | 100.0% |
Transportation & Commute in Yamhill County
Vehicle Availability by Sex in Yamhill County
The most prevalent vehicle ownership categories in Yamhill County are males with 2 vehicles (10,803, accounting for 40.5%) and females with 2 vehicles (8,524, making up 52.3%).
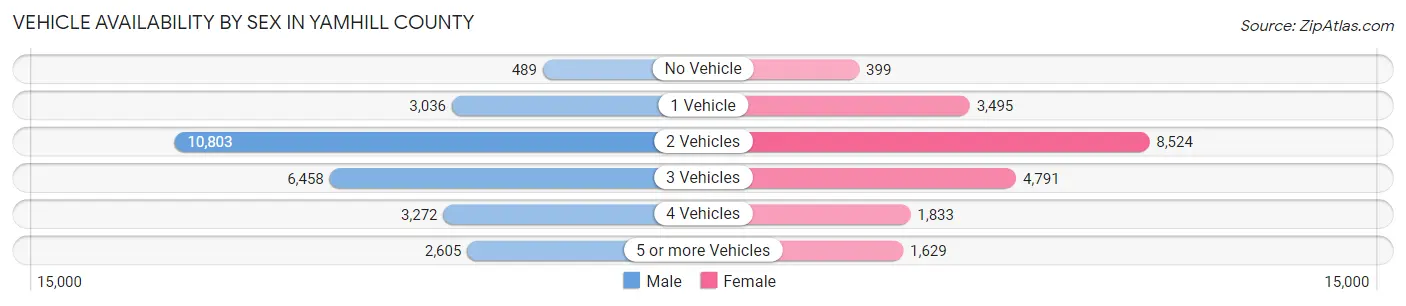
| Vehicles Available | Male | Female |
| No Vehicle | 489 (1.8%) | 399 (1.9%) |
| 1 Vehicle | 3,036 (11.4%) | 3,495 (16.9%) |
| 2 Vehicles | 10,803 (40.5%) | 8,524 (41.2%) |
| 3 Vehicles | 6,458 (24.2%) | 4,791 (23.2%) |
| 4 Vehicles | 3,272 (12.3%) | 1,833 (8.9%) |
| 5 or more Vehicles | 2,605 (9.8%) | 1,629 (7.9%) |
| Total | 26,663 (100.0%) | 20,671 (100.0%) |
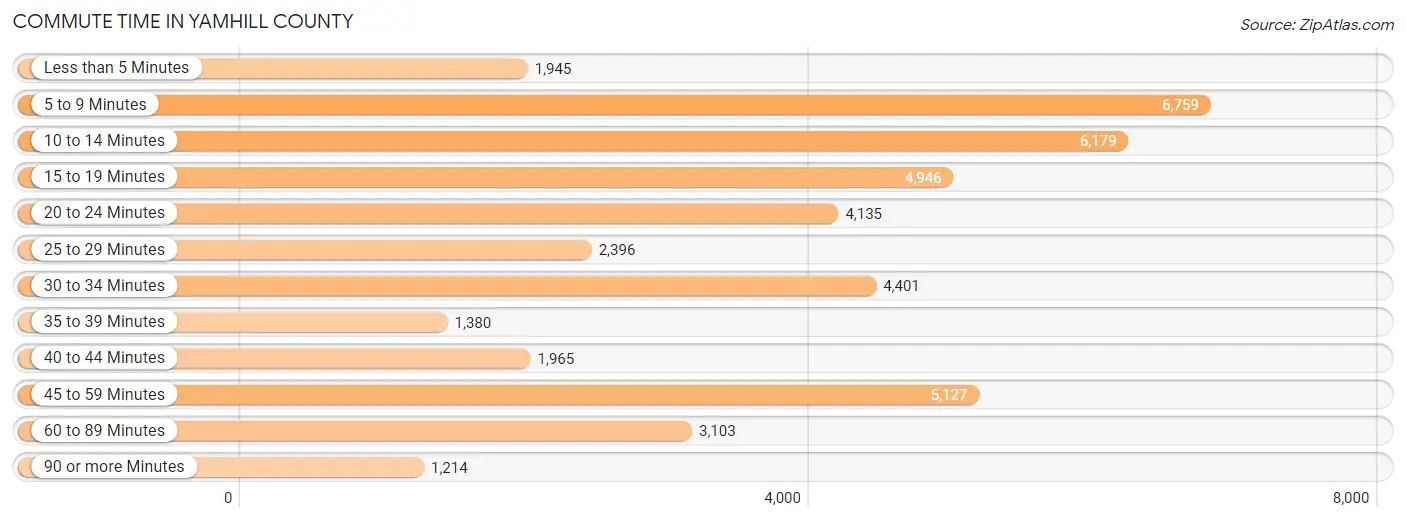
Commute Time in Yamhill County
The most frequently occuring commute durations in Yamhill County are 5 to 9 minutes (6,759 commuters, 15.5%), 10 to 14 minutes (6,179 commuters, 14.2%), and 45 to 59 minutes (5,127 commuters, 11.8%).
| Commute Time | # Commuters | % Commuters |
| Less than 5 Minutes | 1,945 | 4.5% |
| 5 to 9 Minutes | 6,759 | 15.5% |
| 10 to 14 Minutes | 6,179 | 14.2% |
| 15 to 19 Minutes | 4,946 | 11.4% |
| 20 to 24 Minutes | 4,135 | 9.5% |
| 25 to 29 Minutes | 2,396 | 5.5% |
| 30 to 34 Minutes | 4,401 | 10.1% |
| 35 to 39 Minutes | 1,380 | 3.2% |
| 40 to 44 Minutes | 1,965 | 4.5% |
| 45 to 59 Minutes | 5,127 | 11.8% |
| 60 to 89 Minutes | 3,103 | 7.1% |
| 90 or more Minutes | 1,214 | 2.8% |
Commute Time by Sex in Yamhill County
The most common commute times in Yamhill County are 45 to 59 minutes (3,300 commuters, 13.4%) for males and 5 to 9 minutes (3,955 commuters, 20.8%) for females.
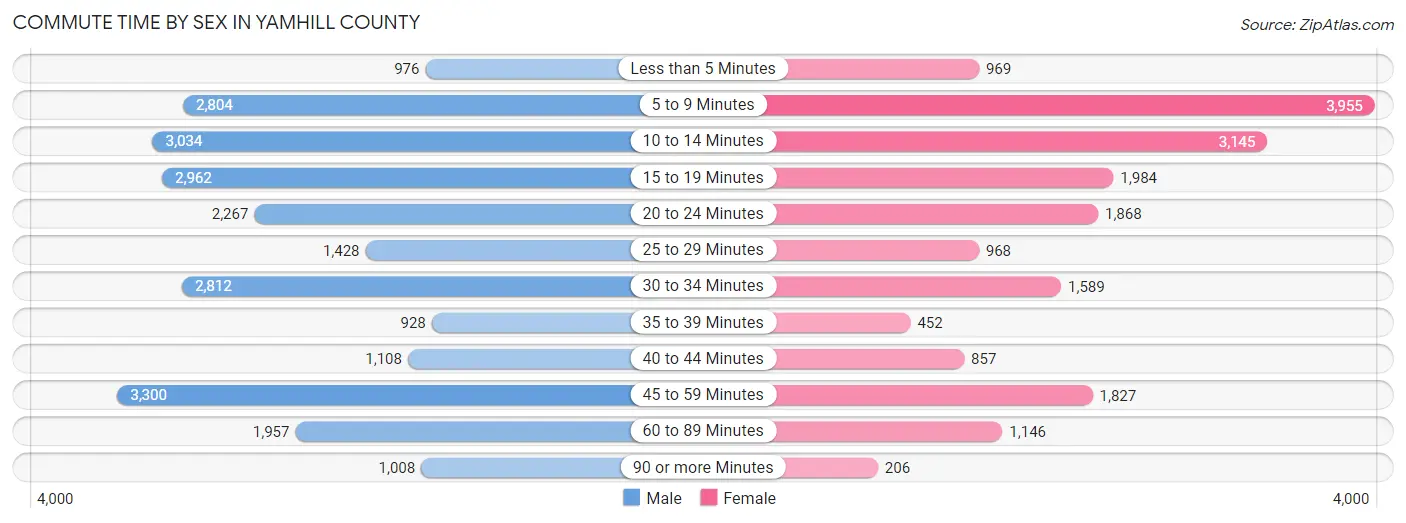
| Commute Time | Male | Female |
| Less than 5 Minutes | 976 (4.0%) | 969 (5.1%) |
| 5 to 9 Minutes | 2,804 (11.4%) | 3,955 (20.8%) |
| 10 to 14 Minutes | 3,034 (12.3%) | 3,145 (16.6%) |
| 15 to 19 Minutes | 2,962 (12.0%) | 1,984 (10.5%) |
| 20 to 24 Minutes | 2,267 (9.2%) | 1,868 (9.9%) |
| 25 to 29 Minutes | 1,428 (5.8%) | 968 (5.1%) |
| 30 to 34 Minutes | 2,812 (11.4%) | 1,589 (8.4%) |
| 35 to 39 Minutes | 928 (3.8%) | 452 (2.4%) |
| 40 to 44 Minutes | 1,108 (4.5%) | 857 (4.5%) |
| 45 to 59 Minutes | 3,300 (13.4%) | 1,827 (9.6%) |
| 60 to 89 Minutes | 1,957 (8.0%) | 1,146 (6.0%) |
| 90 or more Minutes | 1,008 (4.1%) | 206 (1.1%) |
Time of Departure to Work by Sex in Yamhill County
The most frequent times of departure to work in Yamhill County are 12:00 AM to 4:59 AM (2,972, 12.1%) for males and 7:30 AM to 7:59 AM (2,831, 14.9%) for females.
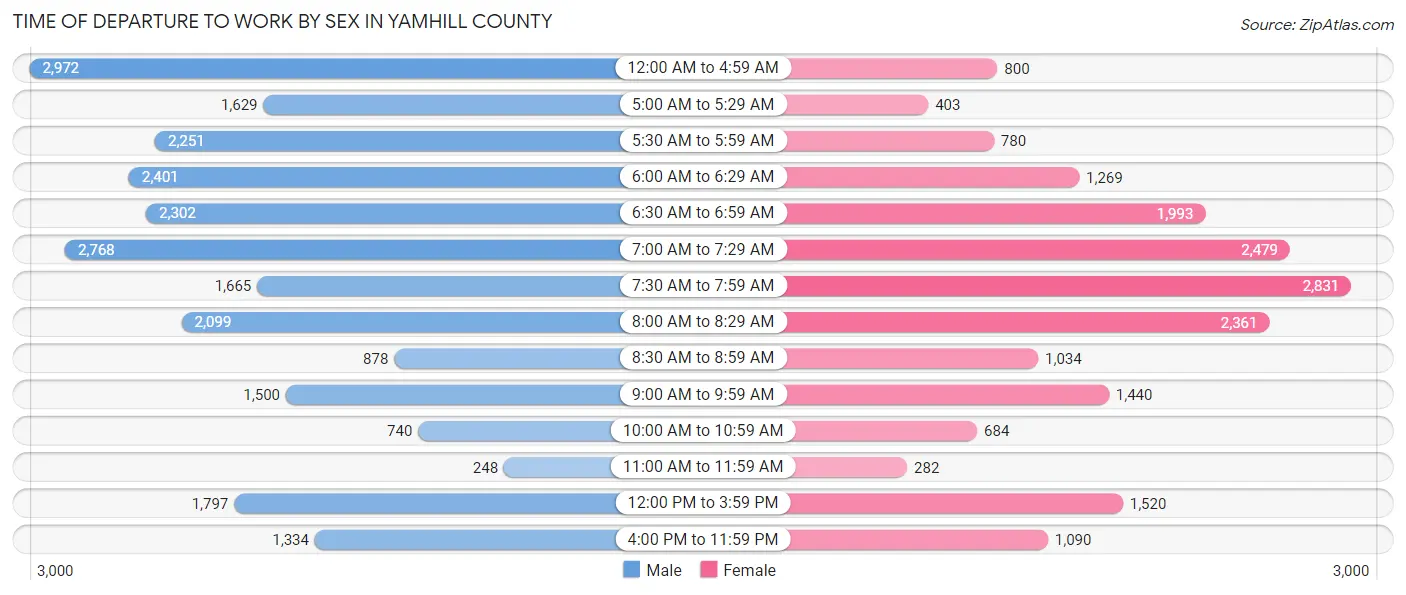
| Time of Departure | Male | Female |
| 12:00 AM to 4:59 AM | 2,972 (12.1%) | 800 (4.2%) |
| 5:00 AM to 5:29 AM | 1,629 (6.6%) | 403 (2.1%) |
| 5:30 AM to 5:59 AM | 2,251 (9.2%) | 780 (4.1%) |
| 6:00 AM to 6:29 AM | 2,401 (9.8%) | 1,269 (6.7%) |
| 6:30 AM to 6:59 AM | 2,302 (9.4%) | 1,993 (10.5%) |
| 7:00 AM to 7:29 AM | 2,768 (11.3%) | 2,479 (13.1%) |
| 7:30 AM to 7:59 AM | 1,665 (6.8%) | 2,831 (14.9%) |
| 8:00 AM to 8:29 AM | 2,099 (8.5%) | 2,361 (12.4%) |
| 8:30 AM to 8:59 AM | 878 (3.6%) | 1,034 (5.4%) |
| 9:00 AM to 9:59 AM | 1,500 (6.1%) | 1,440 (7.6%) |
| 10:00 AM to 10:59 AM | 740 (3.0%) | 684 (3.6%) |
| 11:00 AM to 11:59 AM | 248 (1.0%) | 282 (1.5%) |
| 12:00 PM to 3:59 PM | 1,797 (7.3%) | 1,520 (8.0%) |
| 4:00 PM to 11:59 PM | 1,334 (5.4%) | 1,090 (5.8%) |
| Total | 24,584 (100.0%) | 18,966 (100.0%) |
Housing Occupancy in Yamhill County
Occupancy by Ownership in Yamhill County
Of the total 38,371 dwellings in Yamhill County, owner-occupied units account for 26,617 (69.4%), while renter-occupied units make up 11,754 (30.6%).
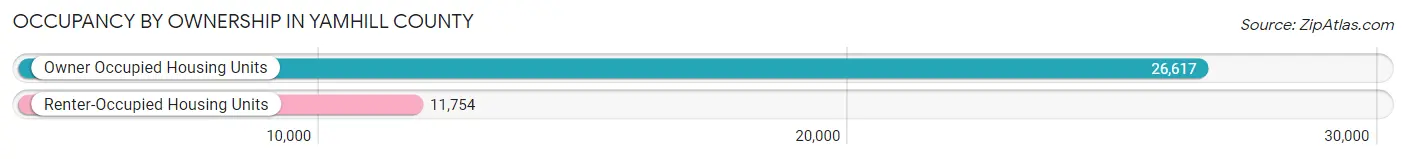
| Occupancy | # Housing Units | % Housing Units |
| Owner Occupied Housing Units | 26,617 | 69.4% |
| Renter-Occupied Housing Units | 11,754 | 30.6% |
| Total Occupied Housing Units | 38,371 | 100.0% |
Occupancy by Household Size in Yamhill County
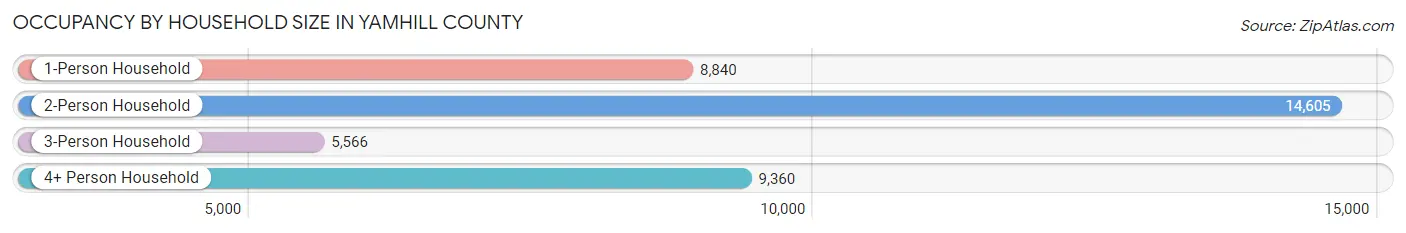
| Household Size | # Housing Units | % Housing Units |
| 1-Person Household | 8,840 | 23.0% |
| 2-Person Household | 14,605 | 38.1% |
| 3-Person Household | 5,566 | 14.5% |
| 4+ Person Household | 9,360 | 24.4% |
| Total Housing Units | 38,371 | 100.0% |
Occupancy by Ownership by Household Size in Yamhill County
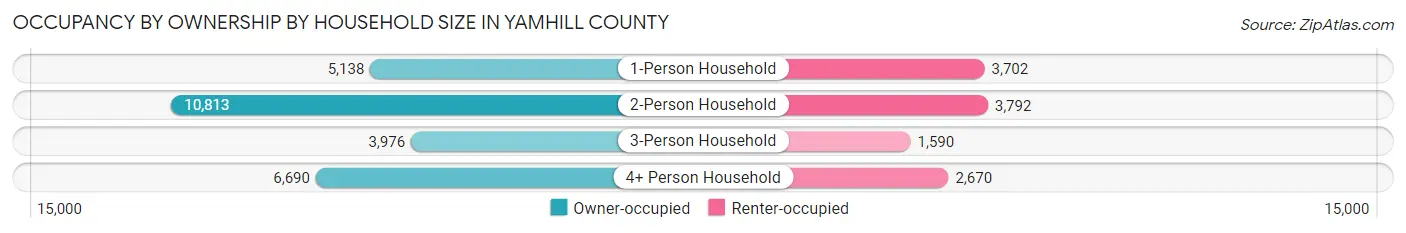
| Household Size | Owner-occupied | Renter-occupied |
| 1-Person Household | 5,138 (58.1%) | 3,702 (41.9%) |
| 2-Person Household | 10,813 (74.0%) | 3,792 (26.0%) |
| 3-Person Household | 3,976 (71.4%) | 1,590 (28.6%) |
| 4+ Person Household | 6,690 (71.5%) | 2,670 (28.5%) |
| Total Housing Units | 26,617 (69.4%) | 11,754 (30.6%) |
Occupancy by Educational Attainment in Yamhill County
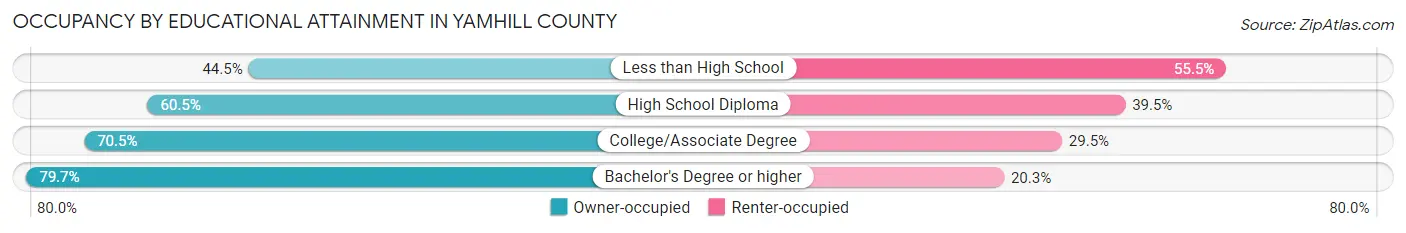
| Household Size | Owner-occupied | Renter-occupied |
| Less than High School | 1,293 (44.5%) | 1,613 (55.5%) |
| High School Diploma | 5,075 (60.5%) | 3,314 (39.5%) |
| College/Associate Degree | 10,280 (70.5%) | 4,293 (29.5%) |
| Bachelor's Degree or higher | 9,969 (79.7%) | 2,534 (20.3%) |
Occupancy by Age of Householder in Yamhill County
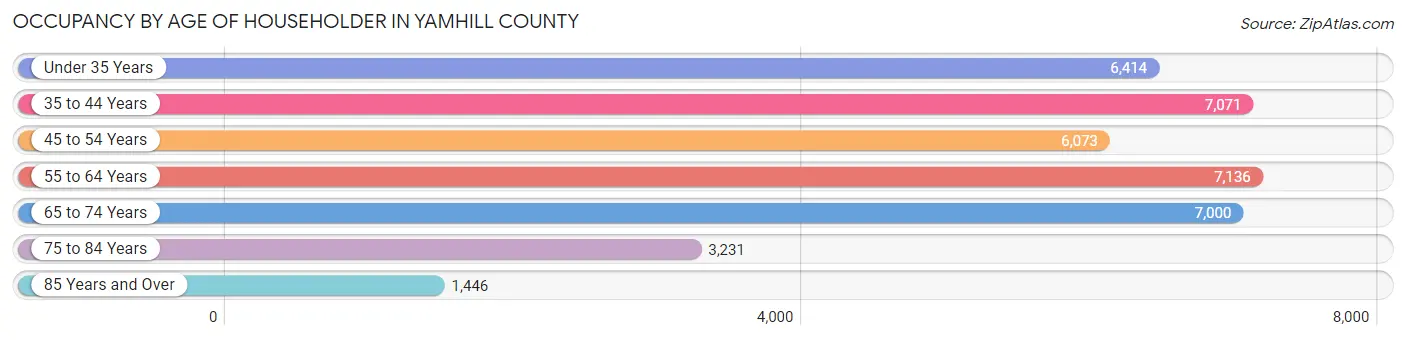
| Age Bracket | # Households | % Households |
| Under 35 Years | 6,414 | 16.7% |
| 35 to 44 Years | 7,071 | 18.4% |
| 45 to 54 Years | 6,073 | 15.8% |
| 55 to 64 Years | 7,136 | 18.6% |
| 65 to 74 Years | 7,000 | 18.2% |
| 75 to 84 Years | 3,231 | 8.4% |
| 85 Years and Over | 1,446 | 3.8% |
| Total | 38,371 | 100.0% |
Housing Finances in Yamhill County
Median Income by Occupancy in Yamhill County
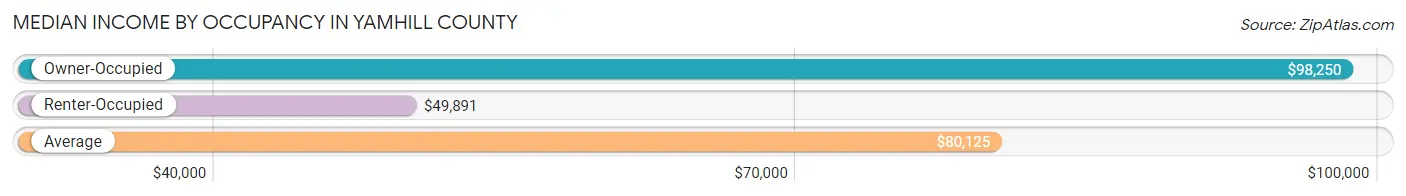
| Occupancy Type | # Households | Median Income |
| Owner-Occupied | 26,617 (69.4%) | $98,250 |
| Renter-Occupied | 11,754 (30.6%) | $49,891 |
| Average | 38,371 (100.0%) | $80,125 |
Occupancy by Householder Income Bracket in Yamhill County
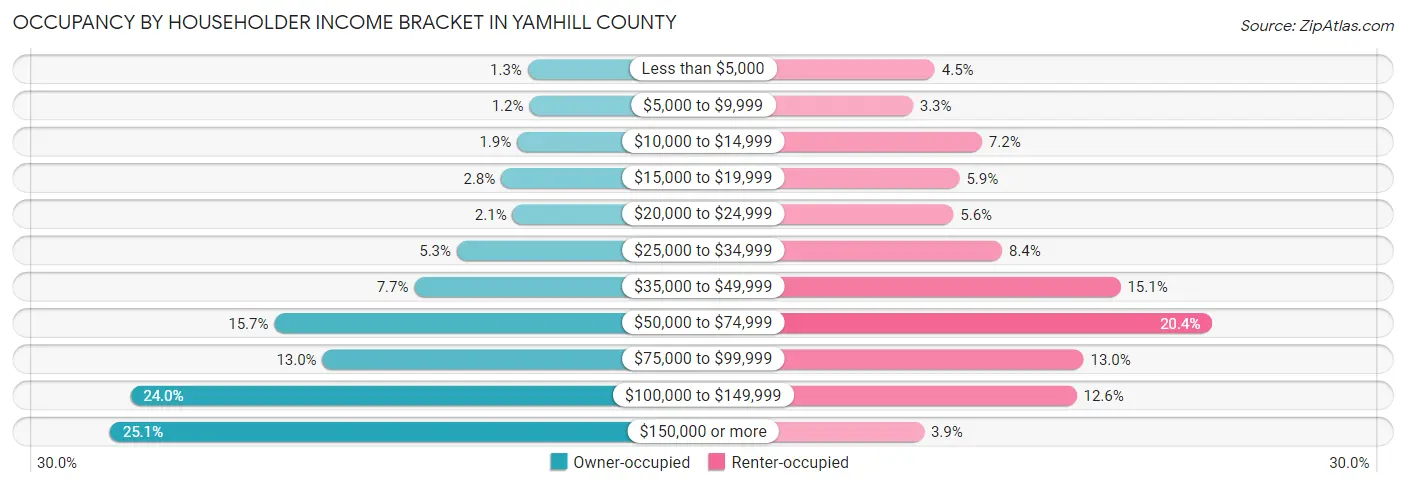
| Income Bracket | Owner-occupied | Renter-occupied |
| Less than $5,000 | 334 (1.3%) | 533 (4.5%) |
| $5,000 to $9,999 | 308 (1.2%) | 384 (3.3%) |
| $10,000 to $14,999 | 496 (1.9%) | 849 (7.2%) |
| $15,000 to $19,999 | 738 (2.8%) | 698 (5.9%) |
| $20,000 to $24,999 | 563 (2.1%) | 657 (5.6%) |
| $25,000 to $34,999 | 1,411 (5.3%) | 984 (8.4%) |
| $35,000 to $49,999 | 2,058 (7.7%) | 1,779 (15.1%) |
| $50,000 to $74,999 | 4,188 (15.7%) | 2,396 (20.4%) |
| $75,000 to $99,999 | 3,454 (13.0%) | 1,531 (13.0%) |
| $100,000 to $149,999 | 6,377 (24.0%) | 1,484 (12.6%) |
| $150,000 or more | 6,690 (25.1%) | 459 (3.9%) |
| Total | 26,617 (100.0%) | 11,754 (100.0%) |
Monthly Housing Cost Tiers in Yamhill County
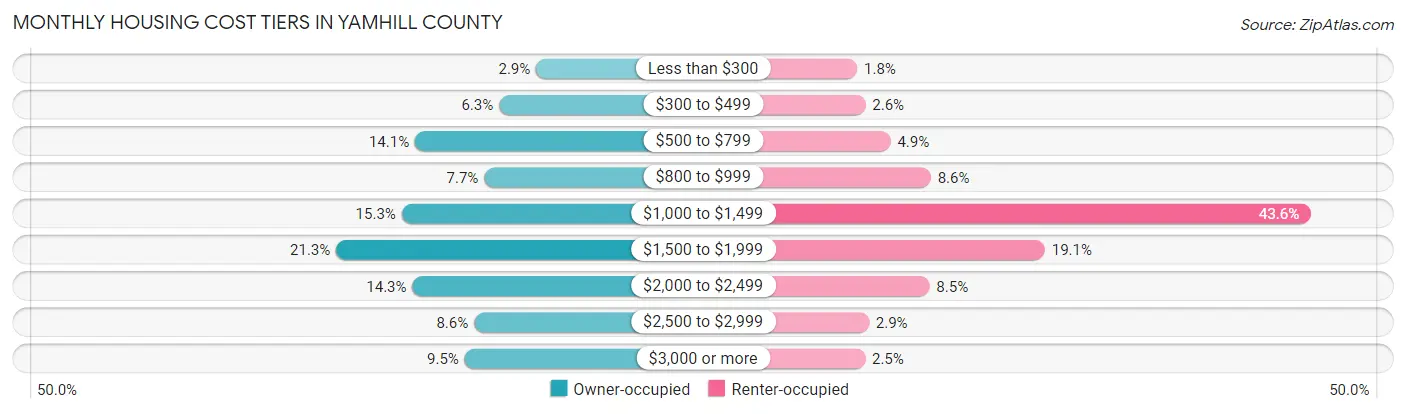
| Monthly Cost | Owner-occupied | Renter-occupied |
| Less than $300 | 774 (2.9%) | 213 (1.8%) |
| $300 to $499 | 1,681 (6.3%) | 302 (2.6%) |
| $500 to $799 | 3,743 (14.1%) | 574 (4.9%) |
| $800 to $999 | 2,047 (7.7%) | 1,010 (8.6%) |
| $1,000 to $1,499 | 4,070 (15.3%) | 5,125 (43.6%) |
| $1,500 to $1,999 | 5,674 (21.3%) | 2,244 (19.1%) |
| $2,000 to $2,499 | 3,806 (14.3%) | 996 (8.5%) |
| $2,500 to $2,999 | 2,295 (8.6%) | 340 (2.9%) |
| $3,000 or more | 2,527 (9.5%) | 299 (2.5%) |
| Total | 26,617 (100.0%) | 11,754 (100.0%) |
Physical Housing Characteristics in Yamhill County
Housing Structures in Yamhill County
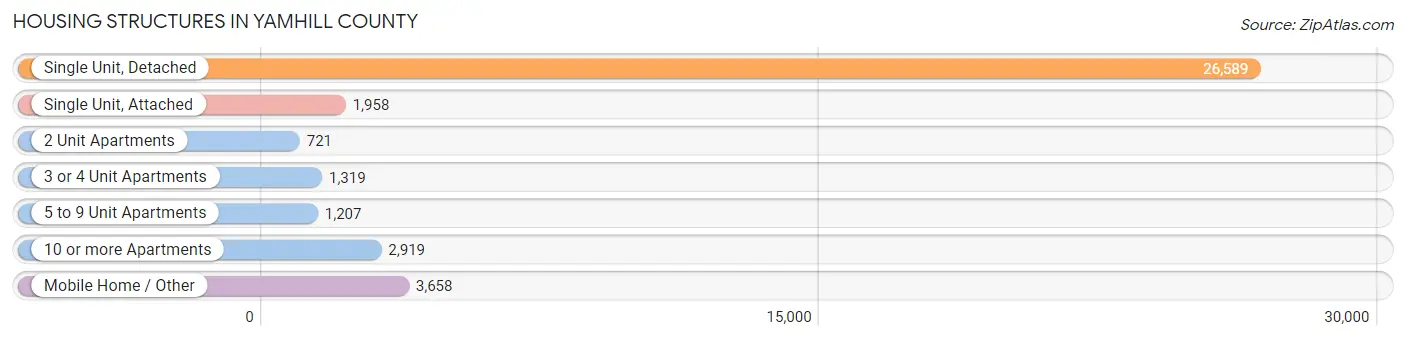
| Structure Type | # Housing Units | % Housing Units |
| Single Unit, Detached | 26,589 | 69.3% |
| Single Unit, Attached | 1,958 | 5.1% |
| 2 Unit Apartments | 721 | 1.9% |
| 3 or 4 Unit Apartments | 1,319 | 3.4% |
| 5 to 9 Unit Apartments | 1,207 | 3.2% |
| 10 or more Apartments | 2,919 | 7.6% |
| Mobile Home / Other | 3,658 | 9.5% |
| Total | 38,371 | 100.0% |
Housing Structures by Occupancy in Yamhill County
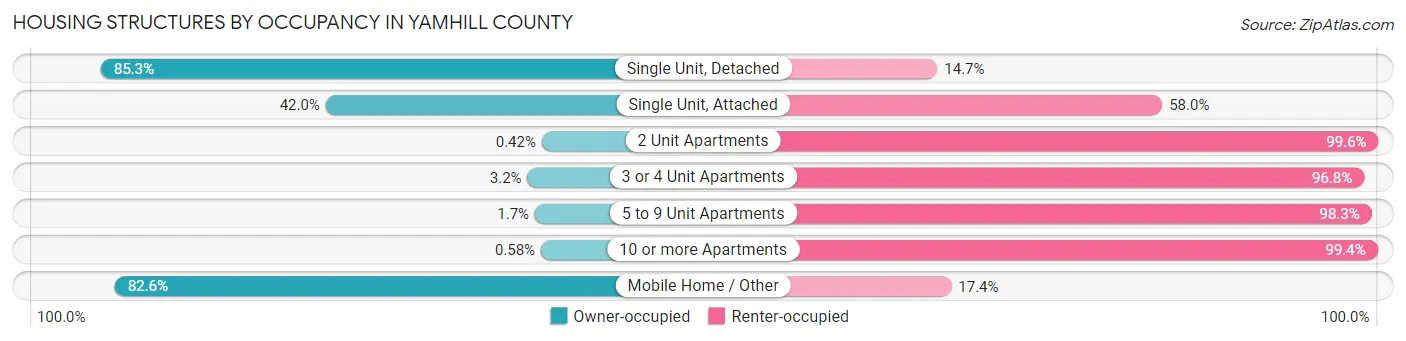
| Structure Type | Owner-occupied | Renter-occupied |
| Single Unit, Detached | 22,688 (85.3%) | 3,901 (14.7%) |
| Single Unit, Attached | 823 (42.0%) | 1,135 (58.0%) |
| 2 Unit Apartments | 3 (0.4%) | 718 (99.6%) |
| 3 or 4 Unit Apartments | 42 (3.2%) | 1,277 (96.8%) |
| 5 to 9 Unit Apartments | 21 (1.7%) | 1,186 (98.3%) |
| 10 or more Apartments | 17 (0.6%) | 2,902 (99.4%) |
| Mobile Home / Other | 3,023 (82.6%) | 635 (17.4%) |
| Total | 26,617 (69.4%) | 11,754 (30.6%) |
Housing Structures by Number of Rooms in Yamhill County
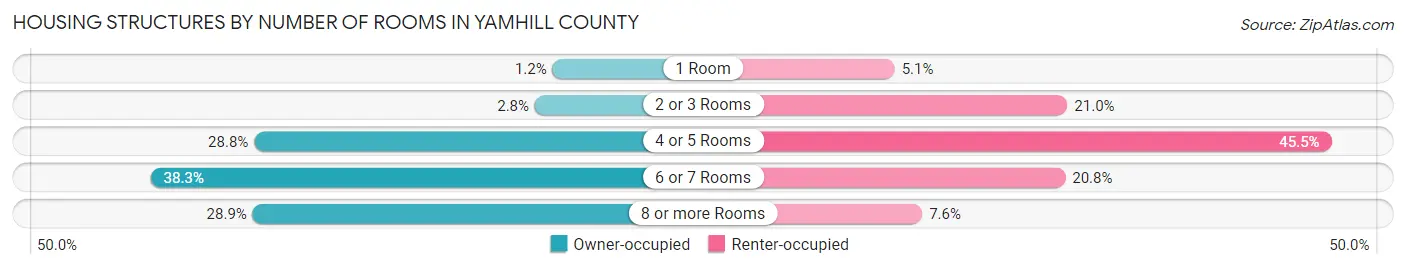
| Number of Rooms | Owner-occupied | Renter-occupied |
| 1 Room | 312 (1.2%) | 596 (5.1%) |
| 2 or 3 Rooms | 747 (2.8%) | 2,473 (21.0%) |
| 4 or 5 Rooms | 7,658 (28.8%) | 5,342 (45.5%) |
| 6 or 7 Rooms | 10,206 (38.3%) | 2,449 (20.8%) |
| 8 or more Rooms | 7,694 (28.9%) | 894 (7.6%) |
| Total | 26,617 (100.0%) | 11,754 (100.0%) |
Housing Structure by Heating Type in Yamhill County
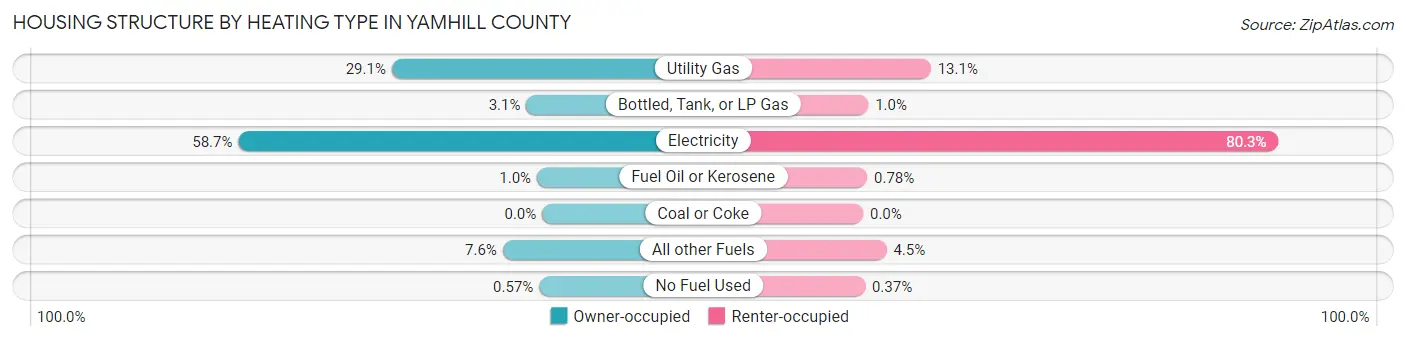
| Heating Type | Owner-occupied | Renter-occupied |
| Utility Gas | 7,734 (29.1%) | 1,538 (13.1%) |
| Bottled, Tank, or LP Gas | 813 (3.0%) | 117 (1.0%) |
| Electricity | 15,626 (58.7%) | 9,432 (80.2%) |
| Fuel Oil or Kerosene | 266 (1.0%) | 92 (0.8%) |
| Coal or Coke | 0 (0.0%) | 0 (0.0%) |
| All other Fuels | 2,025 (7.6%) | 532 (4.5%) |
| No Fuel Used | 153 (0.6%) | 43 (0.4%) |
| Total | 26,617 (100.0%) | 11,754 (100.0%) |
Household Vehicle Usage in Yamhill County
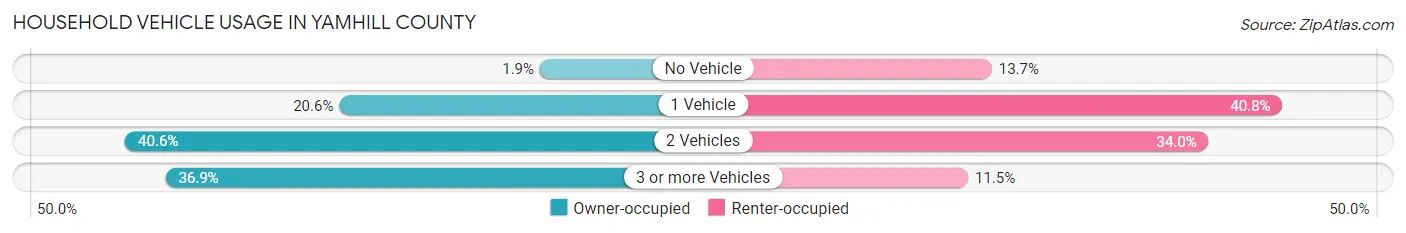
| Vehicles per Household | Owner-occupied | Renter-occupied |
| No Vehicle | 506 (1.9%) | 1,612 (13.7%) |
| 1 Vehicle | 5,492 (20.6%) | 4,800 (40.8%) |
| 2 Vehicles | 10,810 (40.6%) | 3,991 (34.0%) |
| 3 or more Vehicles | 9,809 (36.8%) | 1,351 (11.5%) |
| Total | 26,617 (100.0%) | 11,754 (100.0%) |
Real Estate & Mortgages in Yamhill County
Real Estate and Mortgage Overview in Yamhill County
| Characteristic | Without Mortgage | With Mortgage |
| Housing Units | 8,125 | 18,492 |
| Median Property Value | $358,900 | $425,800 |
| Median Household Income | $64,236 | $5,276 |
| Monthly Housing Costs | $631 | $2,504 |
| Real Estate Taxes | $2,958 | $202 |
Property Value by Mortgage Status in Yamhill County
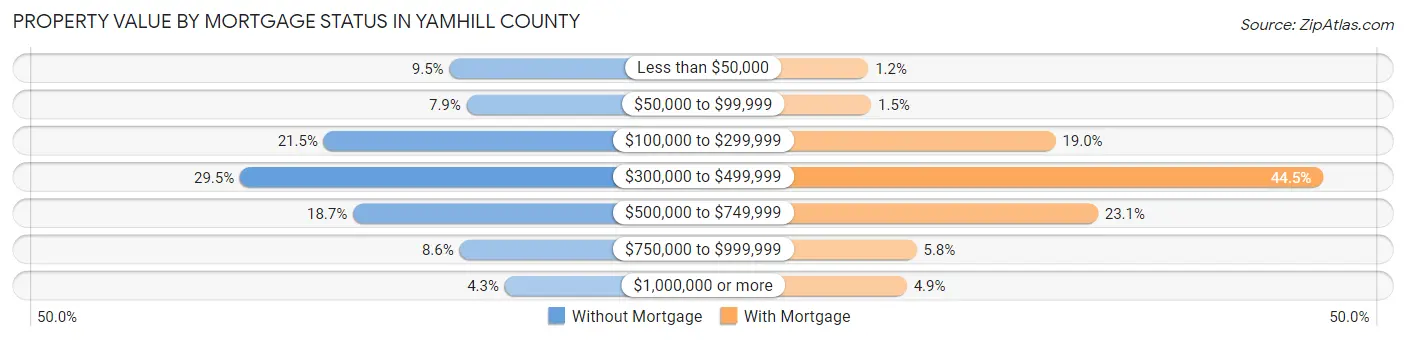
| Property Value | Without Mortgage | With Mortgage |
| Less than $50,000 | 775 (9.5%) | 223 (1.2%) |
| $50,000 to $99,999 | 642 (7.9%) | 273 (1.5%) |
| $100,000 to $299,999 | 1,748 (21.5%) | 3,520 (19.0%) |
| $300,000 to $499,999 | 2,395 (29.5%) | 8,235 (44.5%) |
| $500,000 to $749,999 | 1,521 (18.7%) | 4,266 (23.1%) |
| $750,000 to $999,999 | 697 (8.6%) | 1,075 (5.8%) |
| $1,000,000 or more | 347 (4.3%) | 900 (4.9%) |
| Total | 8,125 (100.0%) | 18,492 (100.0%) |
Household Income by Mortgage Status in Yamhill County
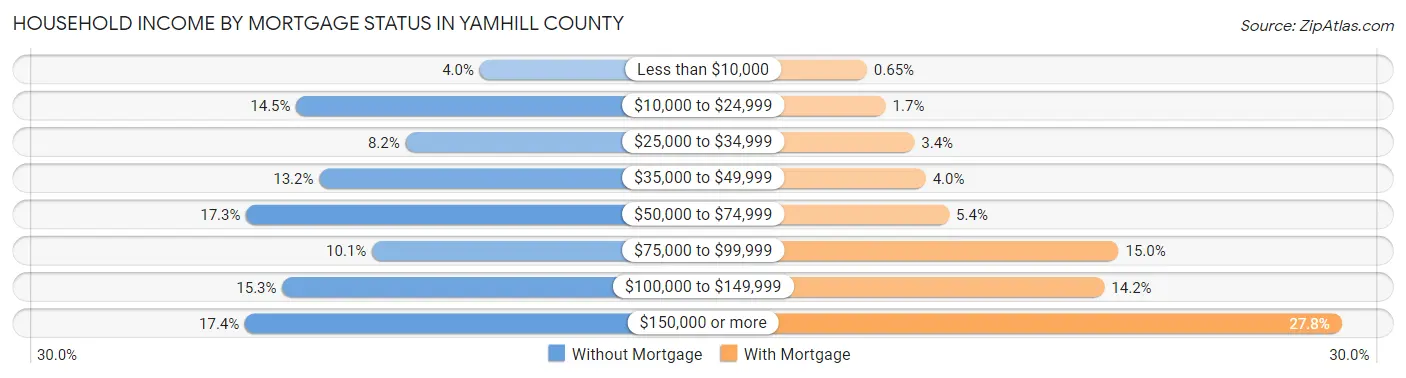
| Household Income | Without Mortgage | With Mortgage |
| Less than $10,000 | 324 (4.0%) | 120 (0.6%) |
| $10,000 to $24,999 | 1,176 (14.5%) | 318 (1.7%) |
| $25,000 to $34,999 | 669 (8.2%) | 621 (3.4%) |
| $35,000 to $49,999 | 1,069 (13.2%) | 742 (4.0%) |
| $50,000 to $74,999 | 1,408 (17.3%) | 989 (5.3%) |
| $75,000 to $99,999 | 824 (10.1%) | 2,780 (15.0%) |
| $100,000 to $149,999 | 1,241 (15.3%) | 2,630 (14.2%) |
| $150,000 or more | 1,414 (17.4%) | 5,136 (27.8%) |
| Total | 8,125 (100.0%) | 18,492 (100.0%) |
Property Value to Household Income Ratio in Yamhill County
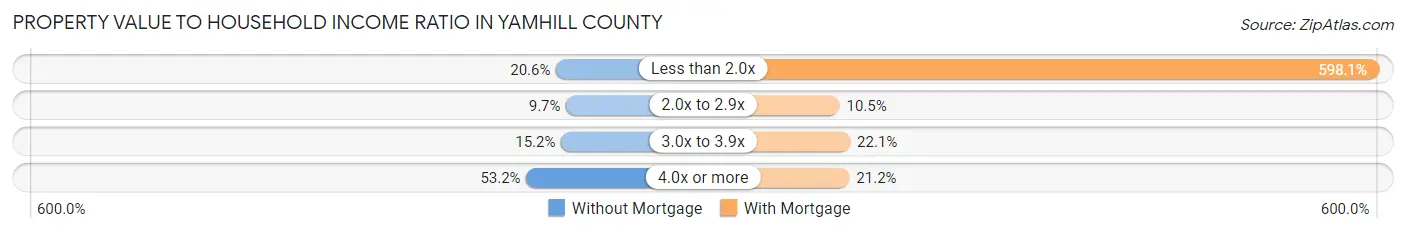
| Value-to-Income Ratio | Without Mortgage | With Mortgage |
| Less than 2.0x | 1,677 (20.6%) | 110,608 (598.1%) |
| 2.0x to 2.9x | 785 (9.7%) | 1,932 (10.4%) |
| 3.0x to 3.9x | 1,233 (15.2%) | 4,081 (22.1%) |
| 4.0x or more | 4,319 (53.2%) | 3,925 (21.2%) |
| Total | 8,125 (100.0%) | 18,492 (100.0%) |
Real Estate Taxes by Mortgage Status in Yamhill County
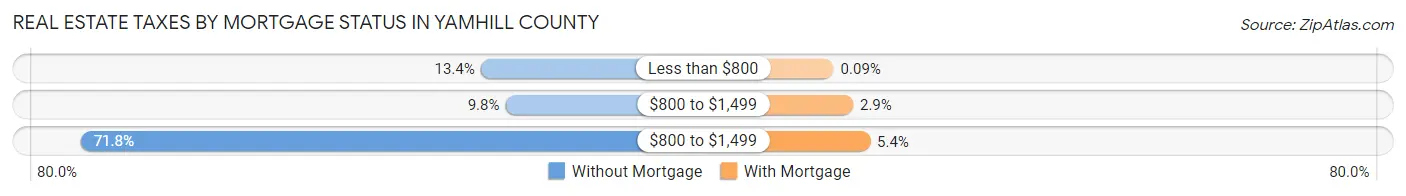
| Property Taxes | Without Mortgage | With Mortgage |
| Less than $800 | 1,087 (13.4%) | 16 (0.1%) |
| $800 to $1,499 | 793 (9.8%) | 540 (2.9%) |
| $800 to $1,499 | 5,833 (71.8%) | 1,001 (5.4%) |
| Total | 8,125 (100.0%) | 18,492 (100.0%) |
Health & Disability in Yamhill County
Health Insurance Coverage by Age in Yamhill County
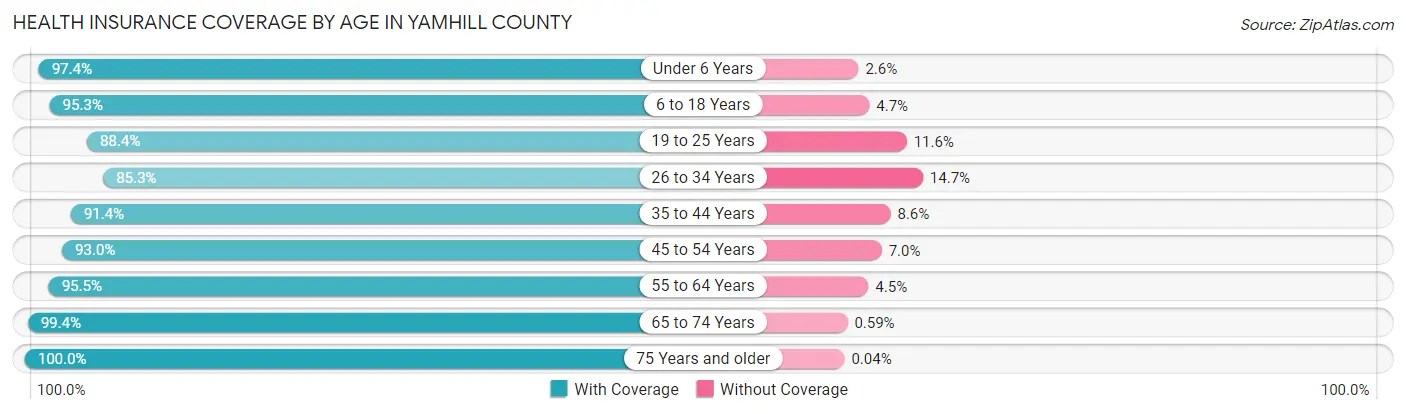
| Age Bracket | With Coverage | Without Coverage |
| Under 6 Years | 6,781 (97.4%) | 184 (2.6%) |
| 6 to 18 Years | 17,061 (95.3%) | 836 (4.7%) |
| 19 to 25 Years | 9,281 (88.4%) | 1,223 (11.6%) |
| 26 to 34 Years | 10,242 (85.3%) | 1,760 (14.7%) |
| 35 to 44 Years | 12,251 (91.4%) | 1,155 (8.6%) |
| 45 to 54 Years | 11,491 (93.0%) | 862 (7.0%) |
| 55 to 64 Years | 12,623 (95.5%) | 595 (4.5%) |
| 65 to 74 Years | 11,290 (99.4%) | 67 (0.6%) |
| 75 Years and older | 7,533 (100.0%) | 3 (0.0%) |
| Total | 98,553 (93.6%) | 6,685 (6.4%) |
Health Insurance Coverage by Citizenship Status in Yamhill County
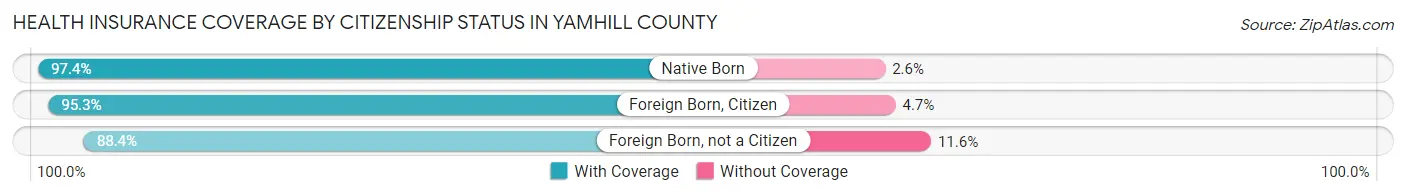
| Citizenship Status | With Coverage | Without Coverage |
| Native Born | 6,781 (97.4%) | 184 (2.6%) |
| Foreign Born, Citizen | 17,061 (95.3%) | 836 (4.7%) |
| Foreign Born, not a Citizen | 9,281 (88.4%) | 1,223 (11.6%) |
Health Insurance Coverage by Household Income in Yamhill County
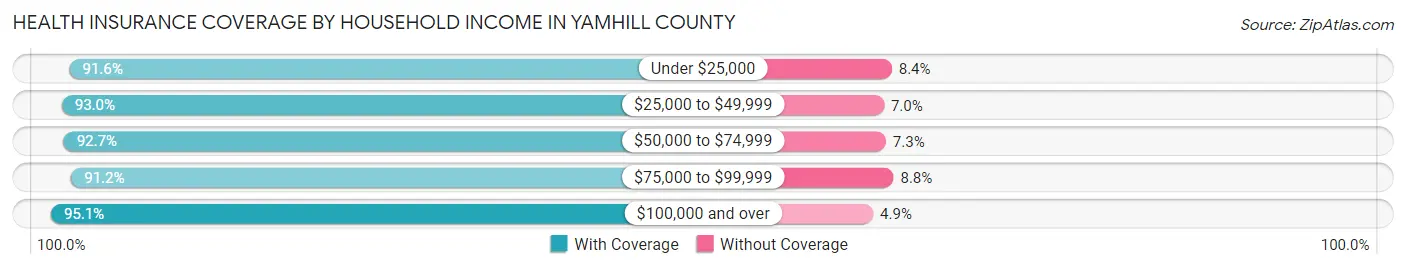
| Household Income | With Coverage | Without Coverage |
| Under $25,000 | 9,085 (91.6%) | 836 (8.4%) |
| $25,000 to $49,999 | 12,407 (93.0%) | 929 (7.0%) |
| $50,000 to $74,999 | 14,674 (92.7%) | 1,160 (7.3%) |
| $75,000 to $99,999 | 13,443 (91.2%) | 1,291 (8.8%) |
| $100,000 and over | 45,559 (95.1%) | 2,369 (4.9%) |
Public vs Private Health Insurance Coverage by Age in Yamhill County
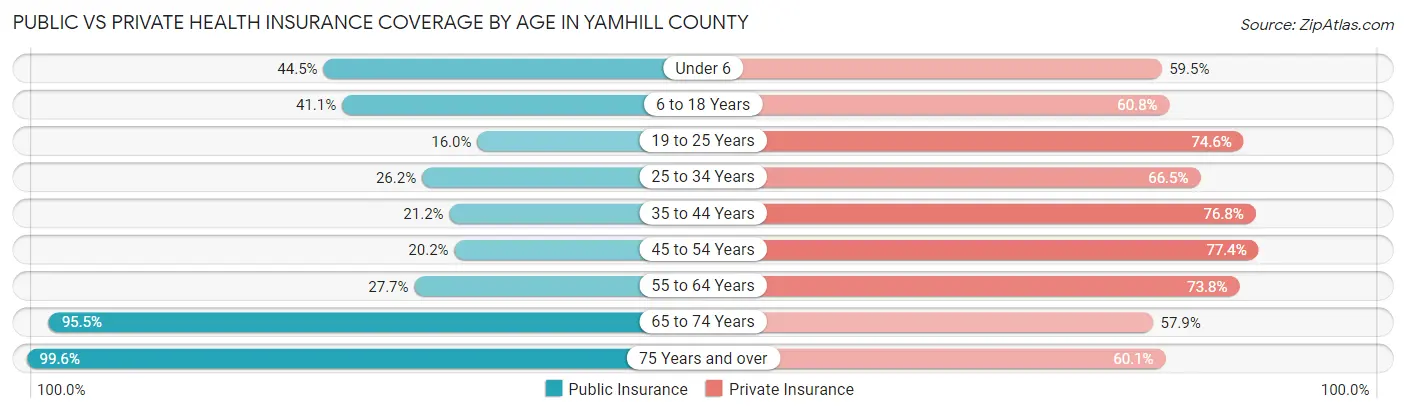
| Age Bracket | Public Insurance | Private Insurance |
| Under 6 | 3,102 (44.5%) | 4,143 (59.5%) |
| 6 to 18 Years | 7,352 (41.1%) | 10,881 (60.8%) |
| 19 to 25 Years | 1,677 (16.0%) | 7,834 (74.6%) |
| 25 to 34 Years | 3,149 (26.2%) | 7,986 (66.5%) |
| 35 to 44 Years | 2,836 (21.1%) | 10,297 (76.8%) |
| 45 to 54 Years | 2,498 (20.2%) | 9,555 (77.3%) |
| 55 to 64 Years | 3,656 (27.7%) | 9,752 (73.8%) |
| 65 to 74 Years | 10,848 (95.5%) | 6,571 (57.9%) |
| 75 Years and over | 7,507 (99.6%) | 4,527 (60.1%) |
| Total | 42,625 (40.5%) | 71,546 (68.0%) |
Disability Status by Sex by Age in Yamhill County
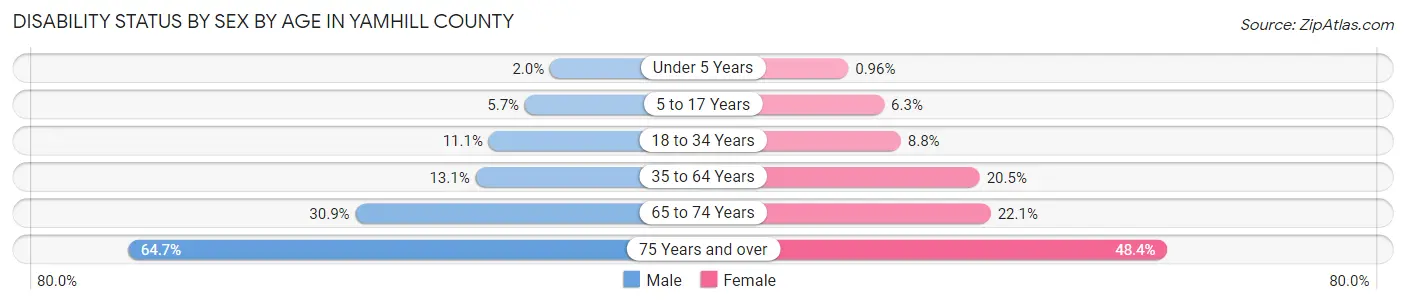
| Age Bracket | Male | Female |
| Under 5 Years | 57 (2.0%) | 26 (1.0%) |
| 5 to 17 Years | 521 (5.7%) | 528 (6.3%) |
| 18 to 34 Years | 1,357 (11.1%) | 1,049 (8.8%) |
| 35 to 64 Years | 2,533 (13.1%) | 4,007 (20.5%) |
| 65 to 74 Years | 1,639 (30.9%) | 1,338 (22.1%) |
| 75 Years and over | 2,161 (64.7%) | 2,028 (48.3%) |
Disability Class by Sex by Age in Yamhill County
Disability Class: Hearing Difficulty
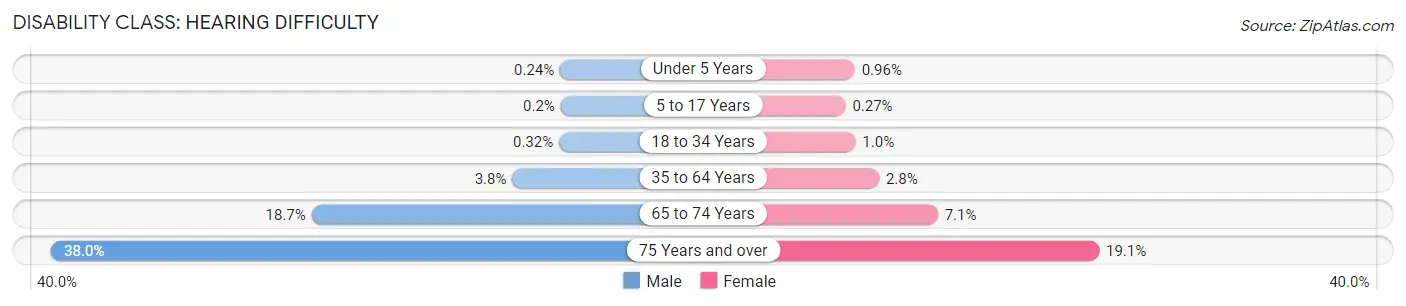
| Age Bracket | Male | Female |
| Under 5 Years | 7 (0.2%) | 26 (1.0%) |
| 5 to 17 Years | 18 (0.2%) | 23 (0.3%) |
| 18 to 34 Years | 39 (0.3%) | 121 (1.0%) |
| 35 to 64 Years | 735 (3.8%) | 541 (2.8%) |
| 65 to 74 Years | 992 (18.7%) | 431 (7.1%) |
| 75 Years and over | 1,271 (38.0%) | 801 (19.1%) |
Disability Class: Vision Difficulty
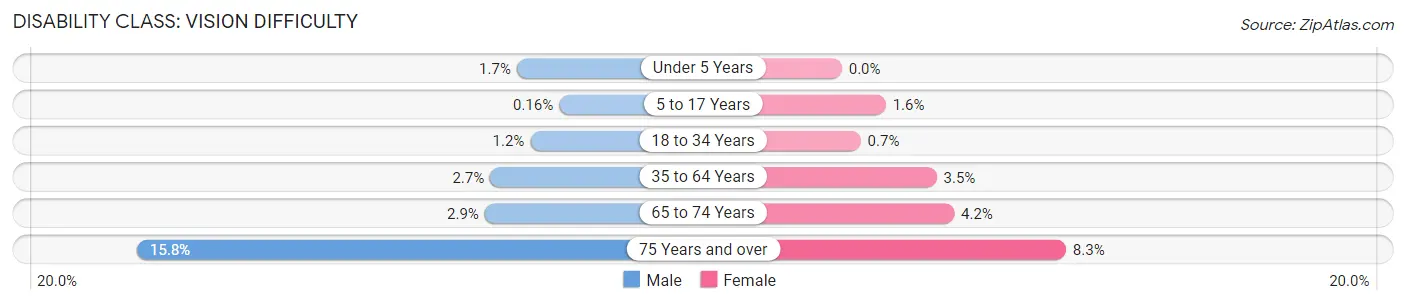
| Age Bracket | Male | Female |
| Under 5 Years | 50 (1.7%) | 0 (0.0%) |
| 5 to 17 Years | 15 (0.2%) | 137 (1.6%) |
| 18 to 34 Years | 151 (1.2%) | 84 (0.7%) |
| 35 to 64 Years | 528 (2.7%) | 688 (3.5%) |
| 65 to 74 Years | 155 (2.9%) | 252 (4.2%) |
| 75 Years and over | 529 (15.8%) | 349 (8.3%) |
Disability Class: Cognitive Difficulty
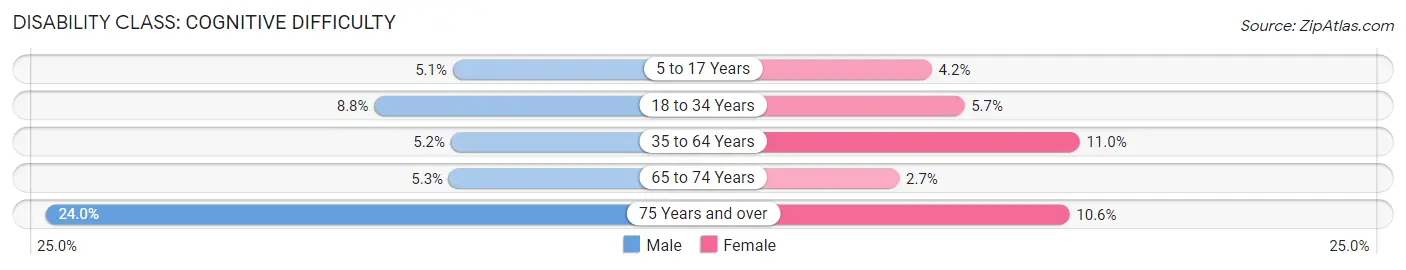
| Age Bracket | Male | Female |
| 5 to 17 Years | 469 (5.1%) | 350 (4.2%) |
| 18 to 34 Years | 1,074 (8.8%) | 680 (5.7%) |
| 35 to 64 Years | 1,013 (5.2%) | 2,158 (11.0%) |
| 65 to 74 Years | 282 (5.3%) | 161 (2.7%) |
| 75 Years and over | 803 (24.0%) | 443 (10.6%) |
Disability Class: Ambulatory Difficulty
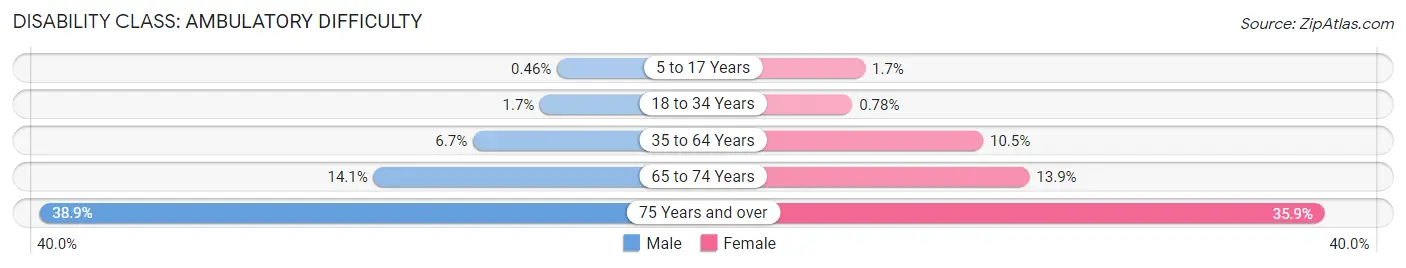
| Age Bracket | Male | Female |
| 5 to 17 Years | 42 (0.5%) | 145 (1.7%) |
| 18 to 34 Years | 211 (1.7%) | 93 (0.8%) |
| 35 to 64 Years | 1,302 (6.7%) | 2,052 (10.5%) |
| 65 to 74 Years | 748 (14.1%) | 843 (13.9%) |
| 75 Years and over | 1,300 (38.9%) | 1,504 (35.9%) |
Disability Class: Self-Care Difficulty
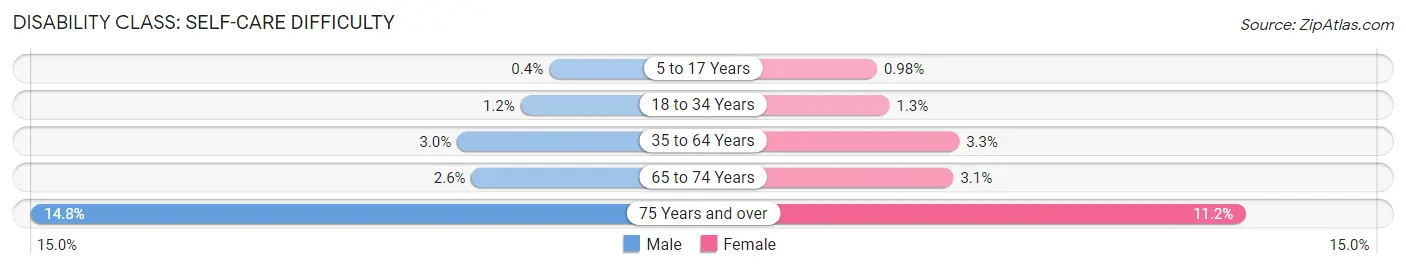
| Age Bracket | Male | Female |
| 5 to 17 Years | 37 (0.4%) | 82 (1.0%) |
| 18 to 34 Years | 146 (1.2%) | 159 (1.3%) |
| 35 to 64 Years | 575 (3.0%) | 640 (3.3%) |
| 65 to 74 Years | 136 (2.6%) | 188 (3.1%) |
| 75 Years and over | 495 (14.8%) | 471 (11.2%) |
Technology Access in Yamhill County
Computing Device Access in Yamhill County
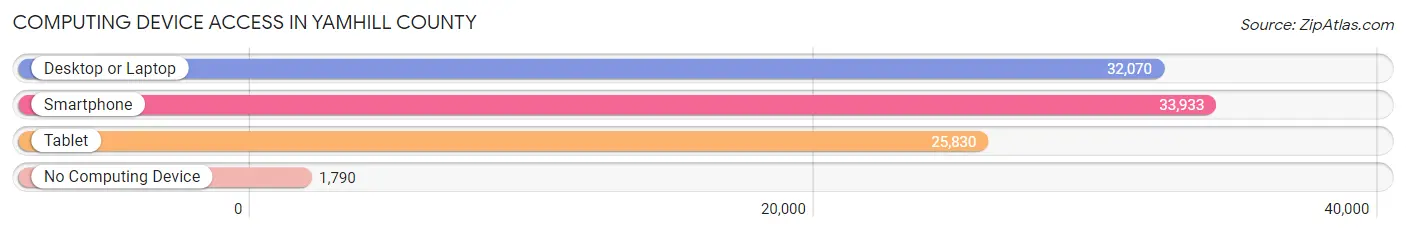
| Device Type | # Households | % Households |
| Desktop or Laptop | 32,070 | 83.6% |
| Smartphone | 33,933 | 88.4% |
| Tablet | 25,830 | 67.3% |
| No Computing Device | 1,790 | 4.7% |
| Total | 38,371 | 100.0% |
Internet Access in Yamhill County
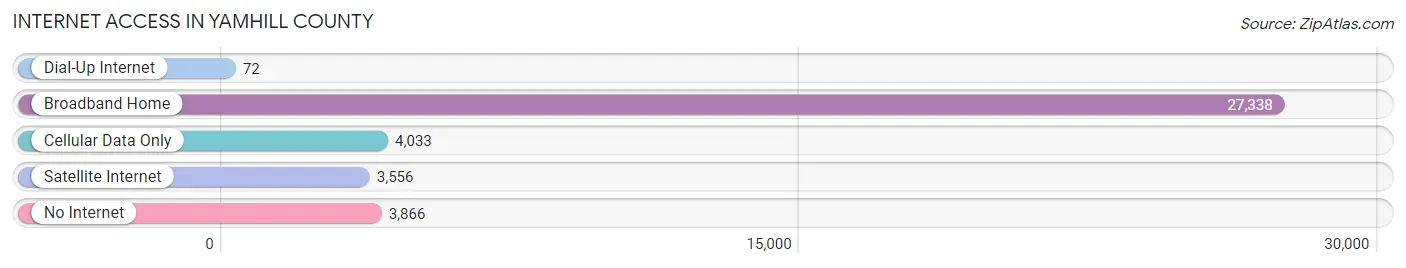
| Internet Type | # Households | % Households |
| Dial-Up Internet | 72 | 0.2% |
| Broadband Home | 27,338 | 71.3% |
| Cellular Data Only | 4,033 | 10.5% |
| Satellite Internet | 3,556 | 9.3% |
| No Internet | 3,866 | 10.1% |
| Total | 38,371 | 100.0% |
Yamhill County Summary
Yamhill County is located in the northwestern part of the U.S. state of Oregon. It is part of the Willamette Valley region and is bordered by Washington County to the north, Polk County to the east, Marion County to the south, and Tillamook County to the west. The county seat is McMinnville, and its largest city is Newberg. The county has a total area of 718 square miles, of which 717 square miles is land and 1 square mile is water.
History
The area that is now Yamhill County was originally inhabited by the Kalapuya Native American tribe. The first European settlers arrived in the area in the early 19th century, and the county was officially established in 1843. The county was named after the Yamhill River, which was named after the Kalapuya word for “deep river.”
In the late 19th century, the county became a major producer of hops, and the city of McMinnville became known as the “Hop Capital of the World.” The county also became a major producer of wine, and the city of Newberg became known as the “Wine Capital of Oregon.”
Geography
Yamhill County is located in the northwestern part of the state of Oregon. It is part of the Willamette Valley region and is bordered by Washington County to the north, Polk County to the east, Marion County to the south, and Tillamook County to the west. The county has a total area of 718 square miles, of which 717 square miles is land and 1 square mile is water.
The county is home to several rivers, including the Yamhill, Tualatin, and Willamette Rivers. The county is also home to several lakes, including Hagg Lake, Henry Hagg Lake, and Oswego Lake. The county is also home to several parks, including the Yamhill-Carlton State Park, the Willamette Valley National Wildlife Refuge, and the Yamhill-Carlton Wilderness Area.
Economy
Yamhill County has a diverse economy, with a mix of agriculture, manufacturing, and services. The county is home to several wineries and vineyards, and is a major producer of wine. The county is also home to several hop farms, and is a major producer of hops. Other major industries in the county include timber, food processing, and electronics manufacturing.
Demographics
As of the 2010 census, Yamhill County had a population of 99,193. The racial makeup of the county was 87.2% White, 1.2% African American, 1.3% Native American, 1.7% Asian, 0.2% Pacific Islander, 6.2% from other races, and 2.4% from two or more races. Hispanic or Latino of any race were 12.3% of the population.
The median income for a household in the county was $50,845, and the median income for a family was $60,845. The per capita income for the county was $25,845. About 11.2% of families and 15.2% of the population were below the poverty line, including 20.2% of those under age 18 and 8.2% of those age 65 or over.
Common Questions
What is the Total Population of Yamhill County?
Total Population of Yamhill County is 107,674.
What is the Total Male Population of Yamhill County?
Total Male Population of Yamhill County is 54,489.
What is the Total Female Population of Yamhill County?
Total Female Population of Yamhill County is 53,185.
What is the Ratio of Males per 100 Females in Yamhill County?
There are 102.45 Males per 100 Females in Yamhill County.
What is the Ratio of Females per 100 Males in Yamhill County?
There are 97.61 Females per 100 Males in Yamhill County.
What is the Median Population Age in Yamhill County?
Median Population Age in Yamhill County is 39.4 Years.
What is the Average Family Size in Yamhill County
Average Family Size in Yamhill County is 3.1 People.
What is the Average Household Size in Yamhill County
Average Household Size in Yamhill County is 2.6 People.
What is Per Capita Income in Yamhill County?
Per Capita income in Yamhill County is $38,002.
What is the Median Family Income in Yamhill County?
Median Family Income in Yamhill County is $95,708.
What is the Median Household income in Yamhill County?
Median Household Income in Yamhill County is $80,125.
What is Income or Wage Gap in Yamhill County?
Income or Wage Gap in Yamhill County is 28.5%.
Women in Yamhill County earn 71.5 cents for every dollar earned by a man.
What is Family Income Deficit in Yamhill County?
Family Income Deficit in Yamhill County is $10,460.
Families that are below poverty line in Yamhill County earn $10,460 less on average than the poverty threshold level.
What is Inequality or Gini Index in Yamhill County?
Inequality or Gini Index in Yamhill County is 0.45.
How Large is the Labor Force in Yamhill County?
There are 52,231 People in the Labor Forcein in Yamhill County.
What is the Percentage of People in the Labor Force in Yamhill County?
59.7% of People are in the Labor Force in Yamhill County.
What is the Unemployment Rate in Yamhill County?
Unemployment Rate in Yamhill County is 4.1%.