Wheeler County, OR
Wheeler County Map
Wheeler County Overview
1,407
TOTAL POPULATION
694
MALE POPULATION
713
FEMALE POPULATION
97.34
MALES / 100 FEMALES
102.74
FEMALES / 100 MALES
56.1
MEDIAN AGE
2.8
AVG FAMILY SIZE
2.2
AVG HOUSEHOLD SIZE
$27,847
PER CAPITA INCOME
$63,125
AVG FAMILY INCOME
$50,774
AVG HOUSEHOLD INCOME
7.1%
WAGE / INCOME GAP [ % ]
92.9¢/ $1
WAGE / INCOME GAP [ $ ]
$3,771
FAMILY INCOME DEFICIT
0.40
INEQUALITY / GINI INDEX
521
LABOR FORCE [ PEOPLE ]
43.4%
PERCENT IN LABOR FORCE
5.4%
UNEMPLOYMENT RATE
Wheeler County Area Codes
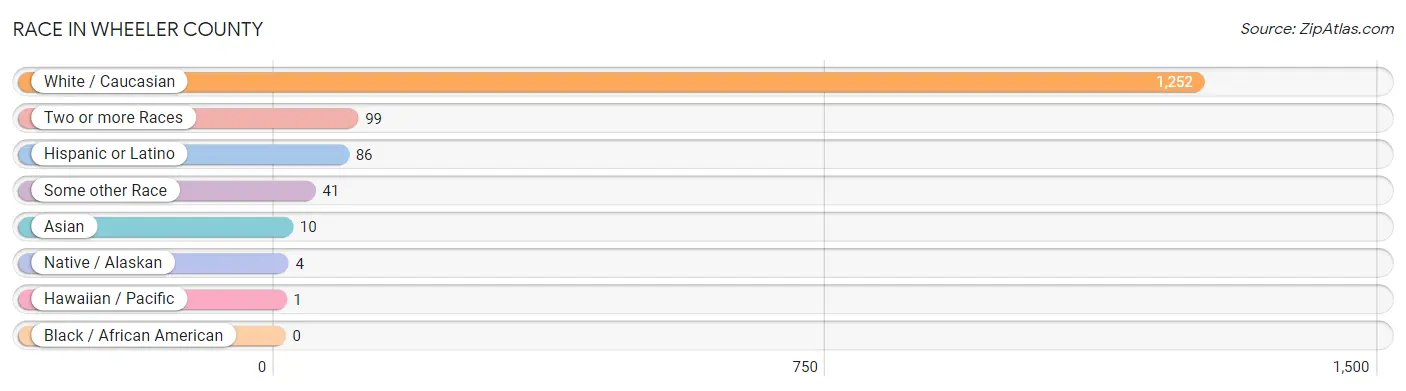
Race in Wheeler County
The most populous races in Wheeler County are White / Caucasian (1,252 | 89.0%), Two or more Races (99 | 7.0%), and Hispanic or Latino (86 | 6.1%).
| Race | # Population | % Population |
| Asian | 10 | 0.7% |
| Black / African American | 0 | 0.0% |
| Hawaiian / Pacific | 1 | 0.1% |
| Hispanic or Latino | 86 | 6.1% |
| Native / Alaskan | 4 | 0.3% |
| White / Caucasian | 1,252 | 89.0% |
| Two or more Races | 99 | 7.0% |
| Some other Race | 41 | 2.9% |
| Total | 1,407 | 100.0% |
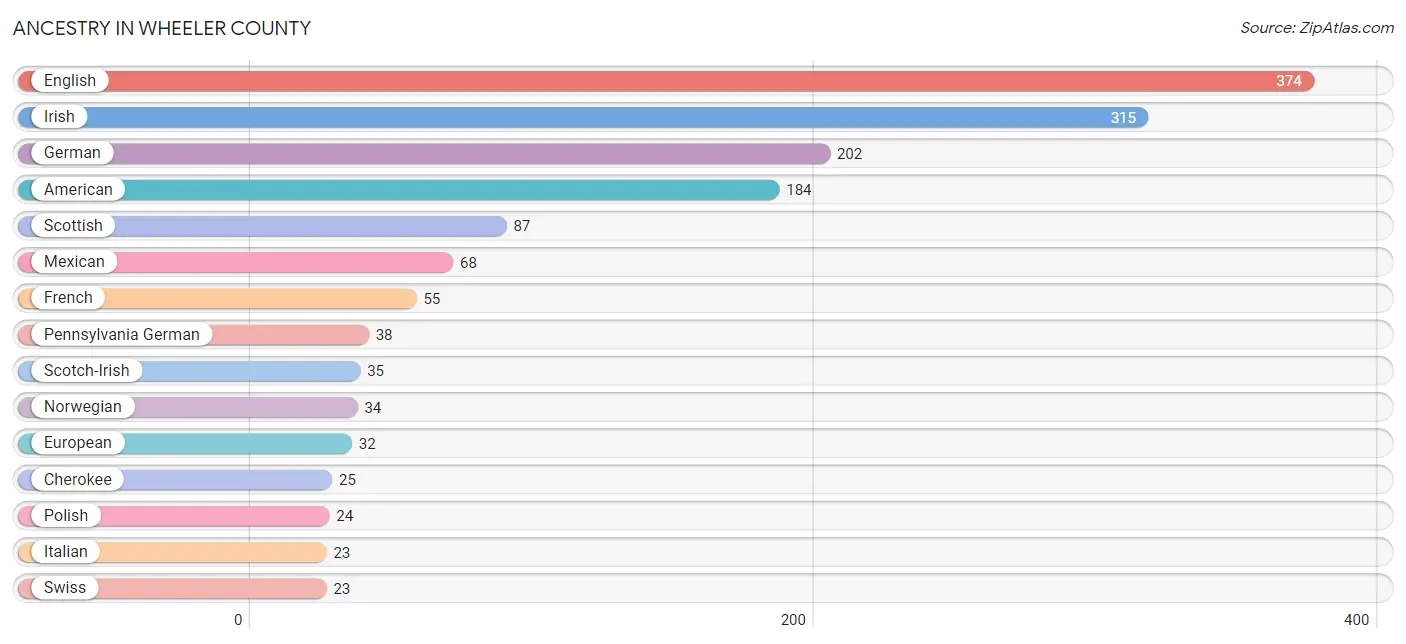
Ancestry in Wheeler County
The most populous ancestries reported in Wheeler County are English (374 | 26.6%), Irish (315 | 22.4%), German (202 | 14.4%), American (184 | 13.1%), and Scottish (87 | 6.2%), together accounting for 82.6% of all Wheeler County residents.
| Ancestry | # Population | % Population |
| American | 184 | 13.1% |
| Armenian | 1 | 0.1% |
| Bhutanese | 3 | 0.2% |
| Brazilian | 1 | 0.1% |
| Burmese | 2 | 0.1% |
| Canadian | 8 | 0.6% |
| Cherokee | 25 | 1.8% |
| Cree | 2 | 0.1% |
| Czechoslovakian | 1 | 0.1% |
| Danish | 9 | 0.6% |
| Dutch | 16 | 1.1% |
| Eastern European | 3 | 0.2% |
| English | 374 | 26.6% |
| European | 32 | 2.3% |
| Filipino | 1 | 0.1% |
| French | 55 | 3.9% |
| French American Indian | 7 | 0.5% |
| French Canadian | 3 | 0.2% |
| German | 202 | 14.4% |
| Greek | 9 | 0.6% |
| Guamanian / Chamorro | 1 | 0.1% |
| Indian (Asian) | 1 | 0.1% |
| Irish | 315 | 22.4% |
| Iroquois | 8 | 0.6% |
| Israeli | 1 | 0.1% |
| Italian | 23 | 1.6% |
| Lithuanian | 2 | 0.1% |
| Mexican | 68 | 4.8% |
| Mexican American Indian | 3 | 0.2% |
| Northern European | 2 | 0.1% |
| Norwegian | 34 | 2.4% |
| Pakistani | 2 | 0.1% |
| Pennsylvania German | 38 | 2.7% |
| Polish | 24 | 1.7% |
| Portuguese | 4 | 0.3% |
| Russian | 1 | 0.1% |
| Scandinavian | 3 | 0.2% |
| Scotch-Irish | 35 | 2.5% |
| Scottish | 87 | 6.2% |
| Shoshone | 15 | 1.1% |
| Sri Lankan | 1 | 0.1% |
| Swedish | 22 | 1.6% |
| Swiss | 23 | 1.6% |
| Ukrainian | 1 | 0.1% |
| Welsh | 18 | 1.3% | View All 45 Rows |
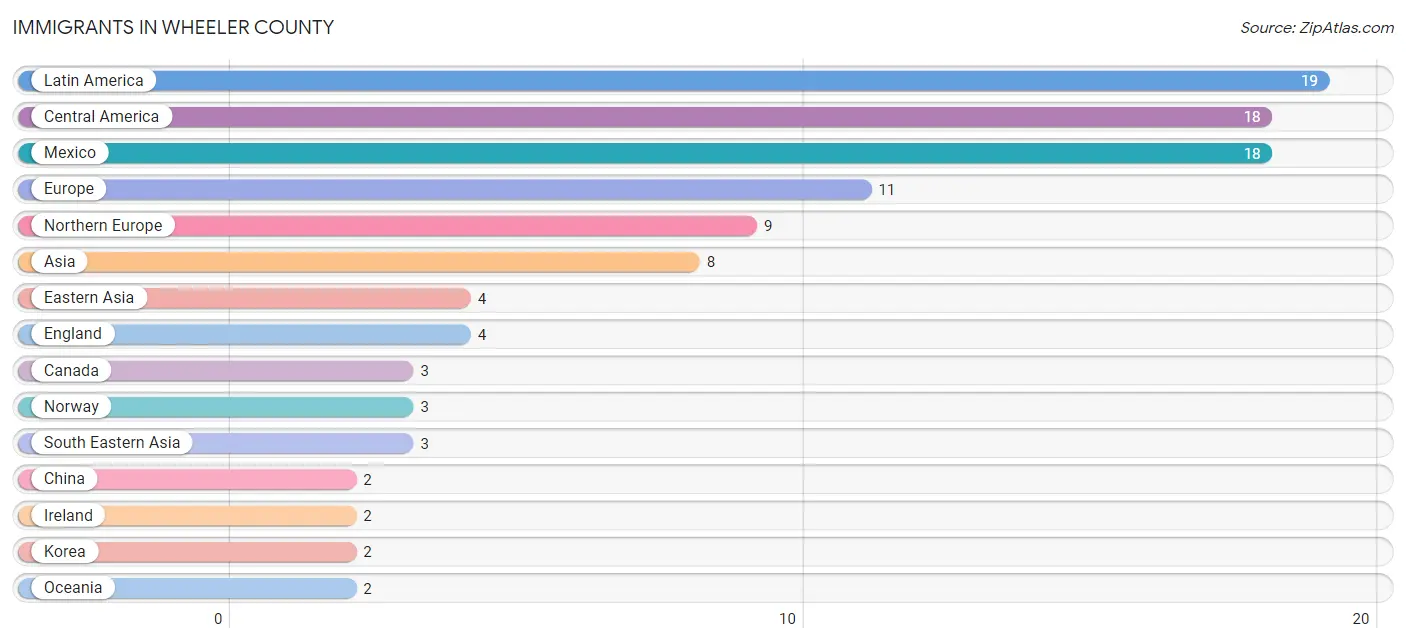
Immigrants in Wheeler County
The most numerous immigrant groups reported in Wheeler County came from Latin America (19 | 1.3%), Central America (18 | 1.3%), Mexico (18 | 1.3%), Europe (11 | 0.8%), and Northern Europe (9 | 0.6%), together accounting for 5.3% of all Wheeler County residents.
| Immigration Origin | # Population | % Population |
| Asia | 8 | 0.6% |
| Brazil | 1 | 0.1% |
| Canada | 3 | 0.2% |
| Central America | 18 | 1.3% |
| China | 2 | 0.1% |
| Eastern Asia | 4 | 0.3% |
| Eastern Europe | 1 | 0.1% |
| England | 4 | 0.3% |
| Europe | 11 | 0.8% |
| Germany | 1 | 0.1% |
| Ireland | 2 | 0.1% |
| Israel | 1 | 0.1% |
| Korea | 2 | 0.1% |
| Latin America | 19 | 1.3% |
| Mexico | 18 | 1.3% |
| Northern Europe | 9 | 0.6% |
| Norway | 3 | 0.2% |
| Oceania | 2 | 0.1% |
| Russia | 1 | 0.1% |
| South America | 1 | 0.1% |
| South Eastern Asia | 3 | 0.2% |
| Taiwan | 1 | 0.1% |
| Thailand | 2 | 0.1% |
| Vietnam | 1 | 0.1% |
| Western Asia | 1 | 0.1% |
| Western Europe | 1 | 0.1% | View All 26 Rows |
Sex and Age in Wheeler County
Sex and Age in Wheeler County
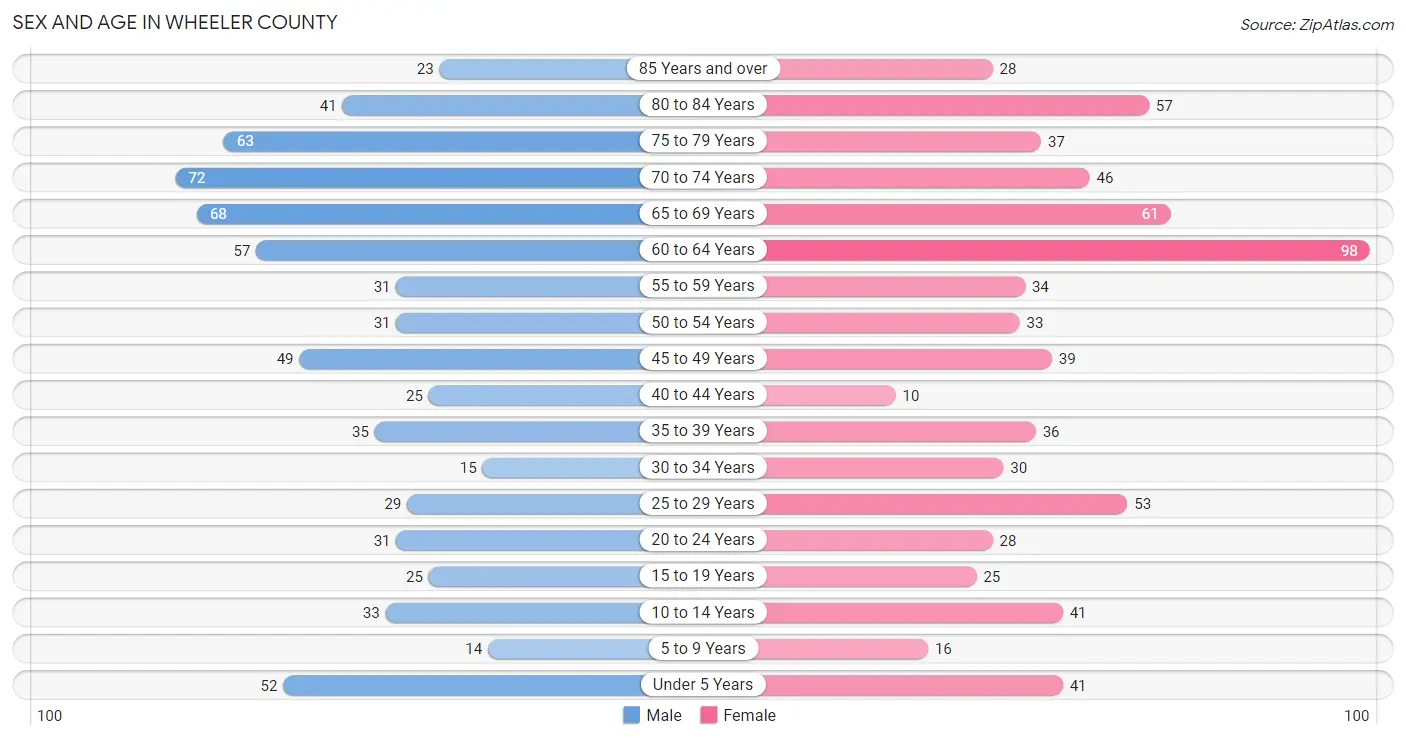
The most populous age groups in Wheeler County are 70 to 74 Years (72 | 10.4%) for men and 60 to 64 Years (98 | 13.7%) for women.
| Age Bracket | Male | Female |
| Under 5 Years | 52 (7.5%) | 41 (5.8%) |
| 5 to 9 Years | 14 (2.0%) | 16 (2.2%) |
| 10 to 14 Years | 33 (4.8%) | 41 (5.8%) |
| 15 to 19 Years | 25 (3.6%) | 25 (3.5%) |
| 20 to 24 Years | 31 (4.5%) | 28 (3.9%) |
| 25 to 29 Years | 29 (4.2%) | 53 (7.4%) |
| 30 to 34 Years | 15 (2.2%) | 30 (4.2%) |
| 35 to 39 Years | 35 (5.0%) | 36 (5.1%) |
| 40 to 44 Years | 25 (3.6%) | 10 (1.4%) |
| 45 to 49 Years | 49 (7.1%) | 39 (5.5%) |
| 50 to 54 Years | 31 (4.5%) | 33 (4.6%) |
| 55 to 59 Years | 31 (4.5%) | 34 (4.8%) |
| 60 to 64 Years | 57 (8.2%) | 98 (13.7%) |
| 65 to 69 Years | 68 (9.8%) | 61 (8.6%) |
| 70 to 74 Years | 72 (10.4%) | 46 (6.5%) |
| 75 to 79 Years | 63 (9.1%) | 37 (5.2%) |
| 80 to 84 Years | 41 (5.9%) | 57 (8.0%) |
| 85 Years and over | 23 (3.3%) | 28 (3.9%) |
| Total | 694 (100.0%) | 713 (100.0%) |
Families and Households in Wheeler County
Median Family Size in Wheeler County
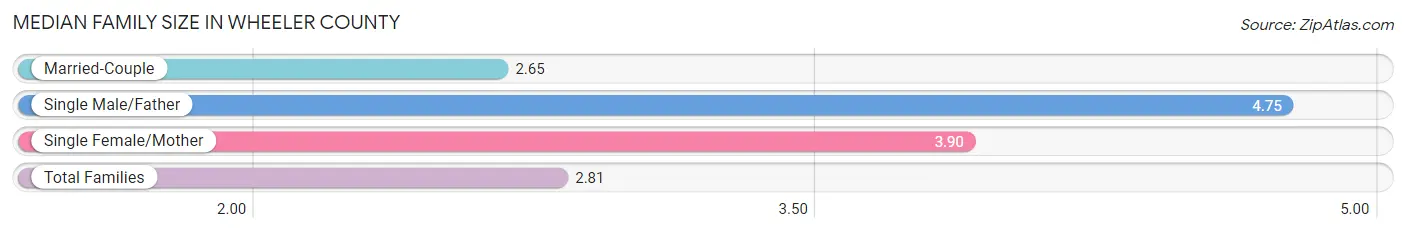
The median family size in Wheeler County is 2.81 persons per family, with single male/father families (4 | 1.0%) accounting for the largest median family size of 4.75 persons per family. On the other hand, married-couple families (337 | 88.0%) represent the smallest median family size with 2.65 persons per family.
| Family Type | # Families | Family Size |
| Married-Couple | 337 (88.0%) | 2.65 |
| Single Male/Father | 4 (1.0%) | 4.75 |
| Single Female/Mother | 42 (11.0%) | 3.90 |
| Total Families | 383 (100.0%) | 2.81 |
Median Household Size in Wheeler County
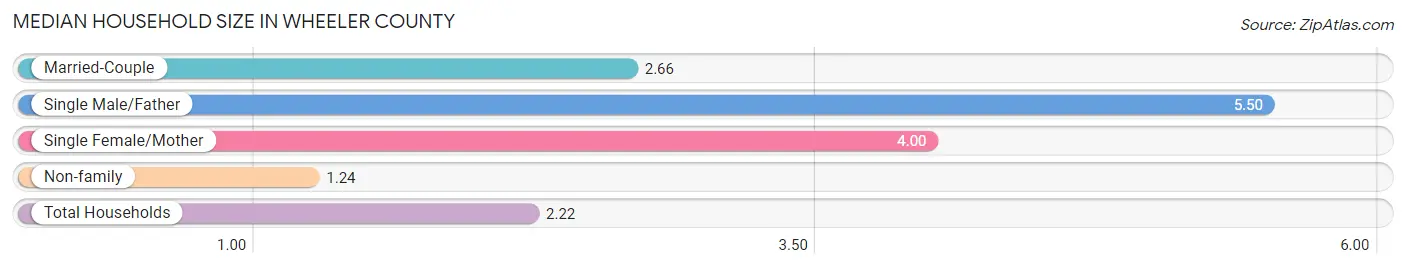
The median household size in Wheeler County is 2.22 persons per household, with single male/father households (4 | 0.6%) accounting for the largest median household size of 5.5 persons per household. non-family households (241 | 38.6%) represent the smallest median household size with 1.24 persons per household.
| Household Type | # Households | Household Size |
| Married-Couple | 337 (54.0%) | 2.66 |
| Single Male/Father | 4 (0.6%) | 5.50 |
| Single Female/Mother | 42 (6.7%) | 4.00 |
| Non-family | 241 (38.6%) | 1.24 |
| Total Households | 624 (100.0%) | 2.22 |
Household Size by Marriage Status in Wheeler County
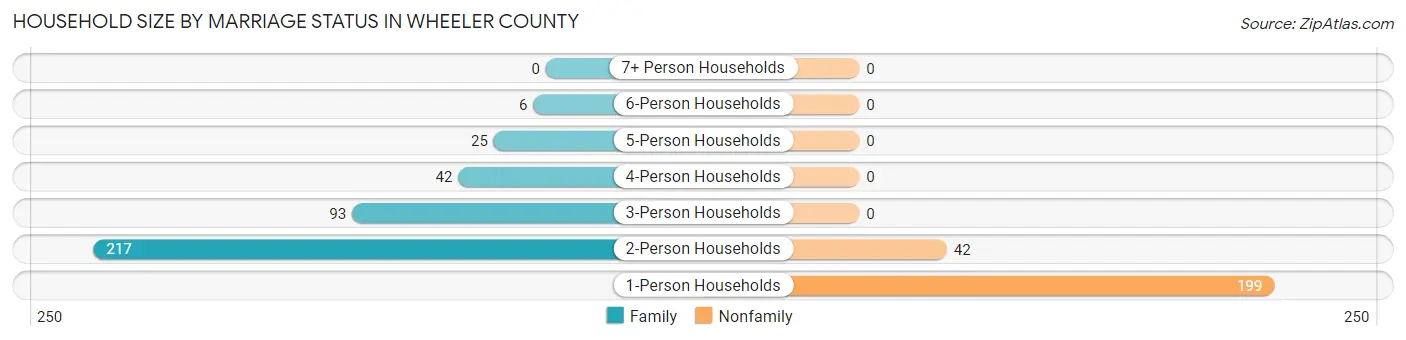
Out of a total of 624 households in Wheeler County, 383 (61.4%) are family households, while 241 (38.6%) are nonfamily households. The most numerous type of family households are 2-person households, comprising 217, and the most common type of nonfamily households are 1-person households, comprising 199.
| Household Size | Family Households | Nonfamily Households |
| 1-Person Households | - | 199 (31.9%) |
| 2-Person Households | 217 (34.8%) | 42 (6.7%) |
| 3-Person Households | 93 (14.9%) | 0 (0.0%) |
| 4-Person Households | 42 (6.7%) | 0 (0.0%) |
| 5-Person Households | 25 (4.0%) | 0 (0.0%) |
| 6-Person Households | 6 (1.0%) | 0 (0.0%) |
| 7+ Person Households | 0 (0.0%) | 0 (0.0%) |
| Total | 383 (61.4%) | 241 (38.6%) |
Female Fertility in Wheeler County
Fertility by Age in Wheeler County
Average fertility rate in Wheeler County is 96.0 births per 1,000 women. Women in the age bracket of 20 to 34 years have the highest fertility rate with 198.0 births per 1,000 women. Women in the age bracket of 20 to 34 years acount for 100.0% of all women with births.
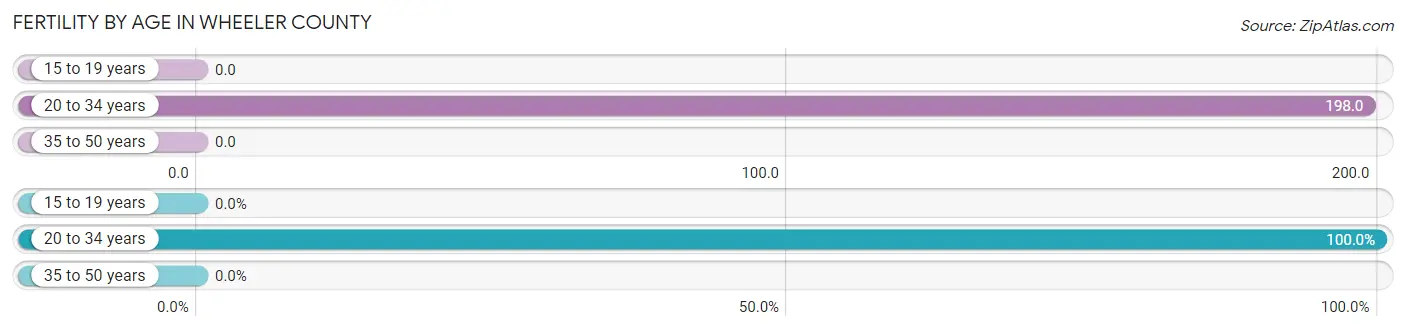
| Age Bracket | Women with Births | Births / 1,000 Women |
| 15 to 19 years | 0 (0.0%) | 0.0 |
| 20 to 34 years | 22 (100.0%) | 198.0 |
| 35 to 50 years | 0 (0.0%) | 0.0 |
| Total | 22 (100.0%) | 96.0 |
Fertility by Age by Marriage Status in Wheeler County
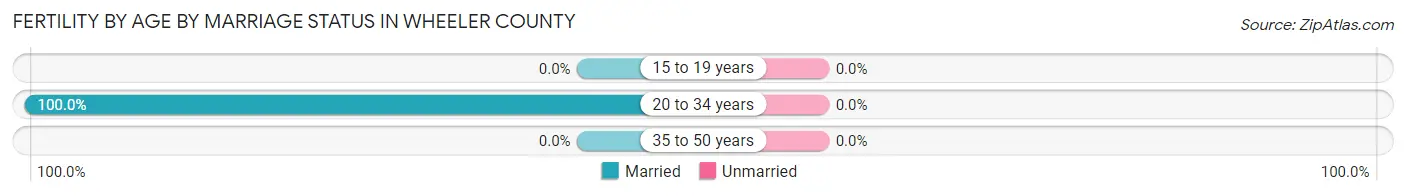
| Age Bracket | Married | Unmarried |
| 15 to 19 years | 0 (0.0%) | 0 (0.0%) |
| 20 to 34 years | 22 (100.0%) | 0 (0.0%) |
| 35 to 50 years | 0 (0.0%) | 0 (0.0%) |
| Total | 22 (100.0%) | 0 (0.0%) |
Fertility by Education in Wheeler County
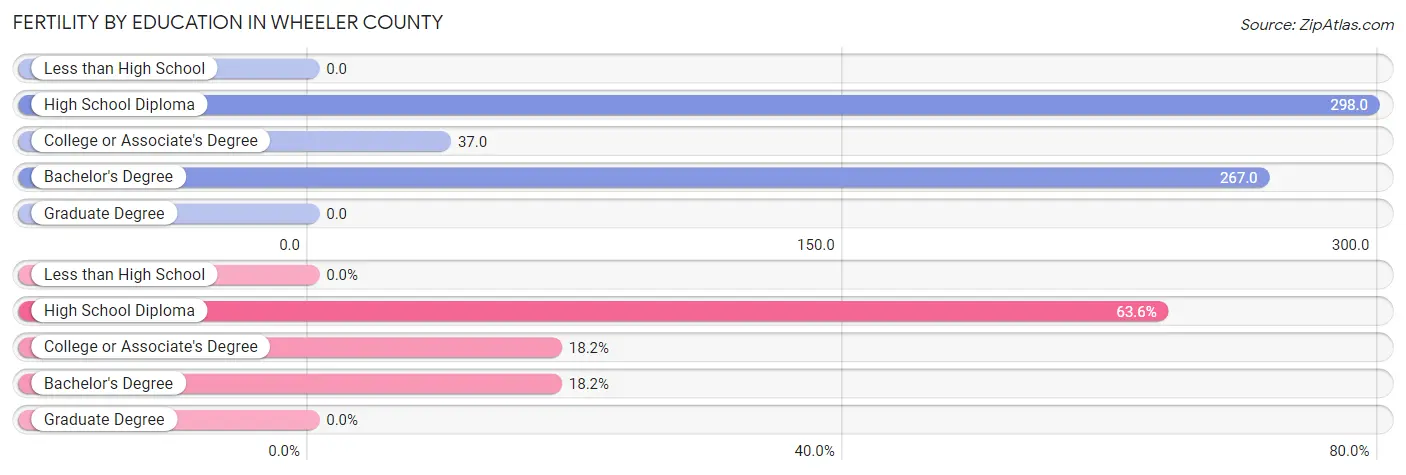
| Educational Attainment | Women with Births | Births / 1,000 Women |
| Less than High School | 0 (0.0%) | 0.0 |
| High School Diploma | 14 (63.6%) | 298.0 |
| College or Associate's Degree | 4 (18.2%) | 37.0 |
| Bachelor's Degree | 4 (18.2%) | 267.0 |
| Graduate Degree | 0 (0.0%) | 0.0 |
| Total | 22 (100.0%) | 96.0 |
Fertility by Education by Marriage Status in Wheeler County
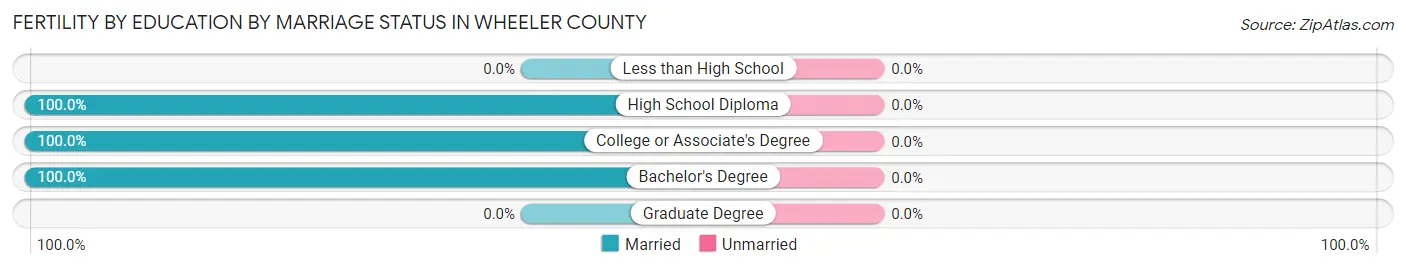
| Educational Attainment | Married | Unmarried |
| Less than High School | 0 (0.0%) | 0 (0.0%) |
| High School Diploma | 14 (100.0%) | 0 (0.0%) |
| College or Associate's Degree | 4 (100.0%) | 0 (0.0%) |
| Bachelor's Degree | 4 (100.0%) | 0 (0.0%) |
| Graduate Degree | 0 (0.0%) | 0 (0.0%) |
| Total | 22 (100.0%) | 0 (0.0%) |
Income in Wheeler County
Income Overview in Wheeler County
Per Capita Income in Wheeler County is $27,847, while median incomes of families and households are $63,125 and $50,774 respectively.
| Characteristic | Number | Measure |
| Per Capita Income | 1,407 | $27,847 |
| Median Family Income | 383 | $63,125 |
| Mean Family Income | 383 | $77,873 |
| Median Household Income | 624 | $50,774 |
| Mean Household Income | 624 | $62,698 |
| Income Deficit | 383 | $3,771 |
| Wage / Income Gap (%) | 1,407 | 7.11% |
| Wage / Income Gap ($) | 1,407 | 92.89¢ per $1 |
| Gini / Inequality Index | 1,407 | 0.40 |
Earnings by Sex in Wheeler County
Average Earnings in Wheeler County are $30,463, $28,750 for men and $30,950 for women, a difference of 7.1%.
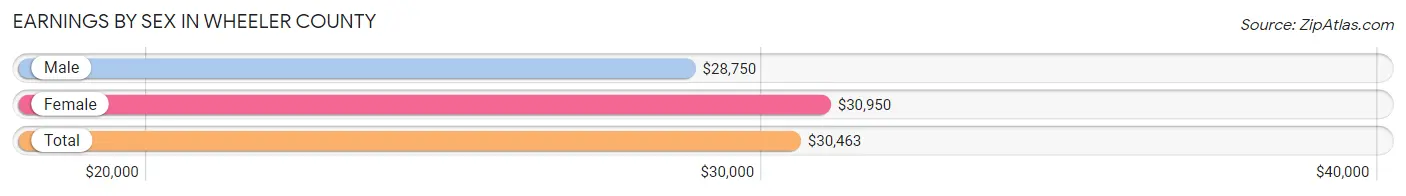
| Sex | Number | Average Earnings |
| Male | 311 (51.0%) | $28,750 |
| Female | 299 (49.0%) | $30,950 |
| Total | 610 (100.0%) | $30,463 |
Earnings by Sex by Income Bracket in Wheeler County
The most common earnings brackets in Wheeler County are $10,000 to $12,499 for men (39 | 12.5%) and $30,000 to $34,999 for women (35 | 11.7%).
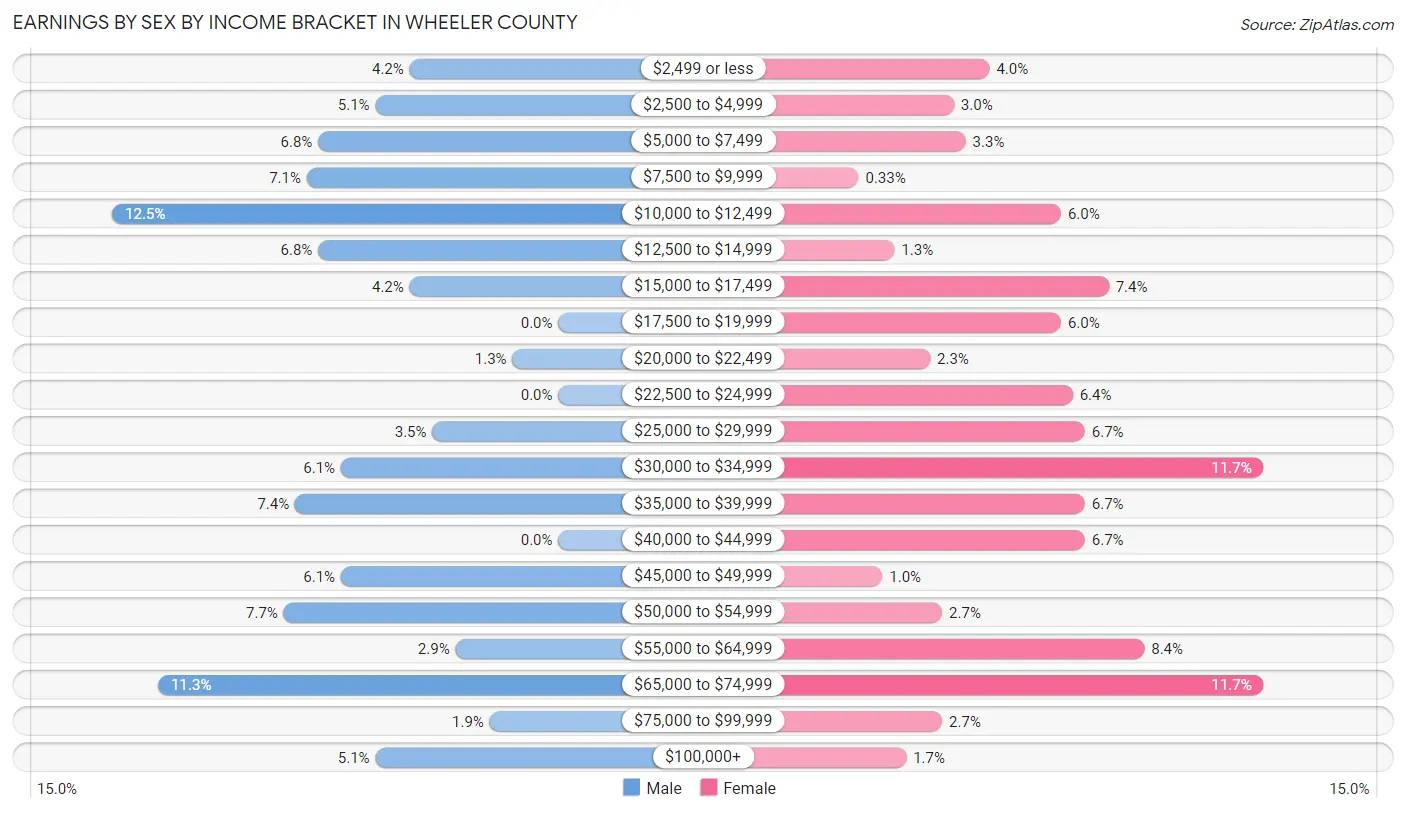
| Income | Male | Female |
| $2,499 or less | 13 (4.2%) | 12 (4.0%) |
| $2,500 to $4,999 | 16 (5.1%) | 9 (3.0%) |
| $5,000 to $7,499 | 21 (6.8%) | 10 (3.3%) |
| $7,500 to $9,999 | 22 (7.1%) | 1 (0.3%) |
| $10,000 to $12,499 | 39 (12.5%) | 18 (6.0%) |
| $12,500 to $14,999 | 21 (6.8%) | 4 (1.3%) |
| $15,000 to $17,499 | 13 (4.2%) | 22 (7.4%) |
| $17,500 to $19,999 | 0 (0.0%) | 18 (6.0%) |
| $20,000 to $22,499 | 4 (1.3%) | 7 (2.3%) |
| $22,500 to $24,999 | 0 (0.0%) | 19 (6.4%) |
| $25,000 to $29,999 | 11 (3.5%) | 20 (6.7%) |
| $30,000 to $34,999 | 19 (6.1%) | 35 (11.7%) |
| $35,000 to $39,999 | 23 (7.4%) | 20 (6.7%) |
| $40,000 to $44,999 | 0 (0.0%) | 20 (6.7%) |
| $45,000 to $49,999 | 19 (6.1%) | 3 (1.0%) |
| $50,000 to $54,999 | 24 (7.7%) | 8 (2.7%) |
| $55,000 to $64,999 | 9 (2.9%) | 25 (8.4%) |
| $65,000 to $74,999 | 35 (11.3%) | 35 (11.7%) |
| $75,000 to $99,999 | 6 (1.9%) | 8 (2.7%) |
| $100,000+ | 16 (5.1%) | 5 (1.7%) |
| Total | 311 (100.0%) | 299 (100.0%) |
Earnings by Sex by Educational Attainment in Wheeler County
Average earnings in Wheeler County are $33,897 for men and $32,500 for women, a difference of 4.1%. Men with an educational attainment of college or associate's degree enjoy the highest average annual earnings of $34,861, while those with bachelor's degree education earn the least with $33,281. Women with an educational attainment of graduate degree earn the most with the average annual earnings of $68,429, while those with high school diploma education have the smallest earnings of $19,904.
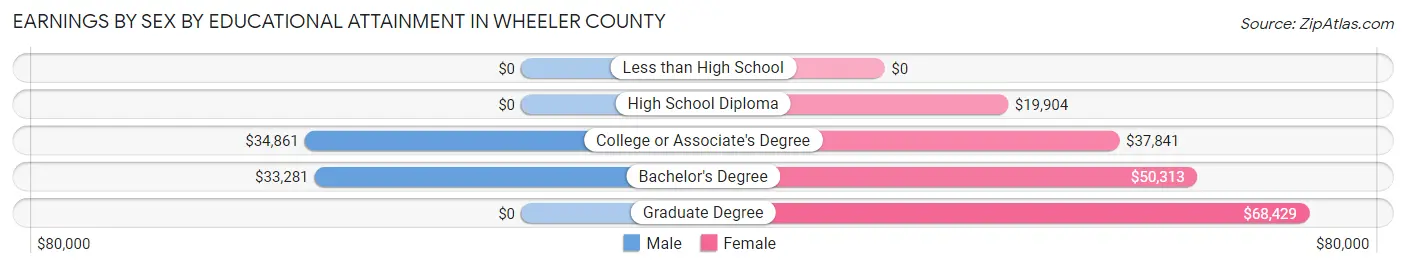
| Educational Attainment | Male Income | Female Income |
| Less than High School | - | - |
| High School Diploma | - | - |
| College or Associate's Degree | $34,861 | $37,841 |
| Bachelor's Degree | $33,281 | $50,313 |
| Graduate Degree | - | - |
| Total | $33,897 | $32,500 |
Family Income in Wheeler County
Family Income Brackets in Wheeler County
According to the Wheeler County family income data, there are 103 families falling into the $50,000 to $74,999 income range, which is the most common income bracket and makes up 26.9% of all families. Conversely, the $10,000 to $14,999 income bracket is the least frequent group with only 1 families (0.3%) belonging to this category.
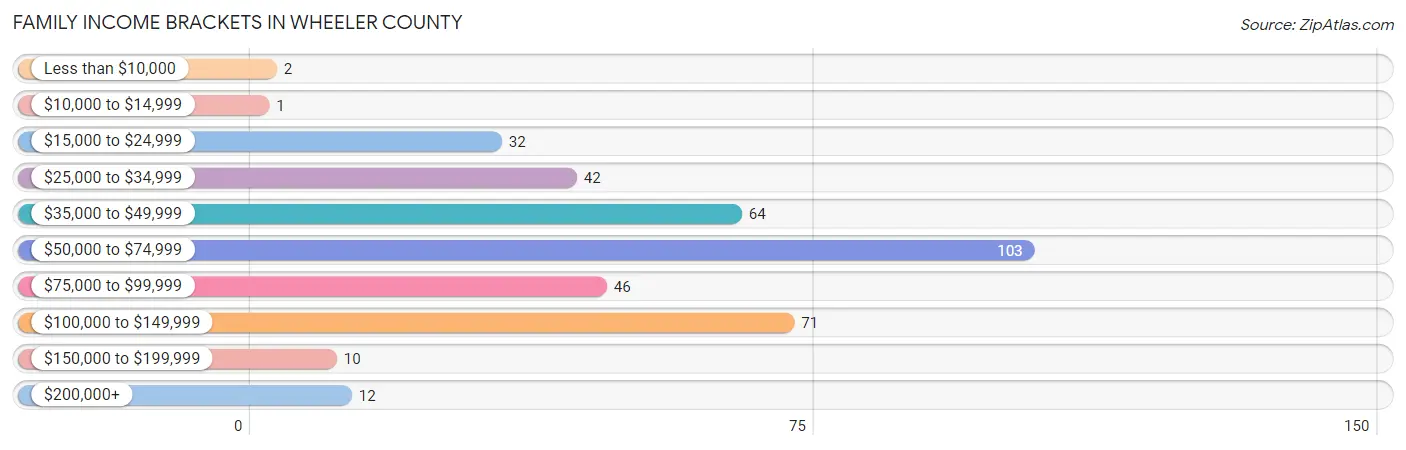
| Income Bracket | # Families | % Families |
| Less than $10,000 | 2 | 0.5% |
| $10,000 to $14,999 | 1 | 0.3% |
| $15,000 to $24,999 | 32 | 8.4% |
| $25,000 to $34,999 | 42 | 11.0% |
| $35,000 to $49,999 | 64 | 16.7% |
| $50,000 to $74,999 | 103 | 26.9% |
| $75,000 to $99,999 | 46 | 12.0% |
| $100,000 to $149,999 | 71 | 18.5% |
| $150,000 to $199,999 | 10 | 2.6% |
| $200,000+ | 12 | 3.1% |
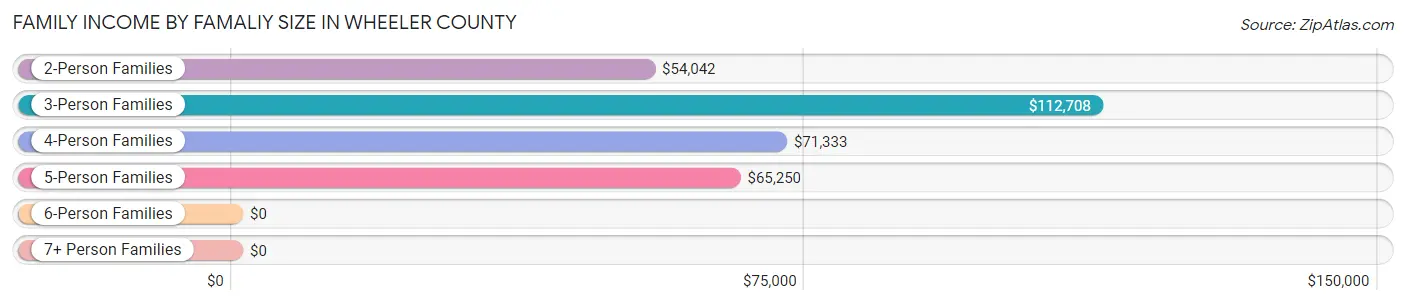
Family Income by Famaliy Size in Wheeler County
3-person families (91 | 23.8%) account for the highest median family income in Wheeler County with $112,708 per family, while 3-person families (91 | 23.8%) have the highest median income of $37,569 per family member.
| Income Bracket | # Families | Median Income |
| 2-Person Families | 219 (57.2%) | $54,042 |
| 3-Person Families | 91 (23.8%) | $112,708 |
| 4-Person Families | 44 (11.5%) | $71,333 |
| 5-Person Families | 29 (7.6%) | $65,250 |
| 6-Person Families | 0 (0.0%) | $0 |
| 7+ Person Families | 0 (0.0%) | $0 |
| Total | 383 (100.0%) | $63,125 |
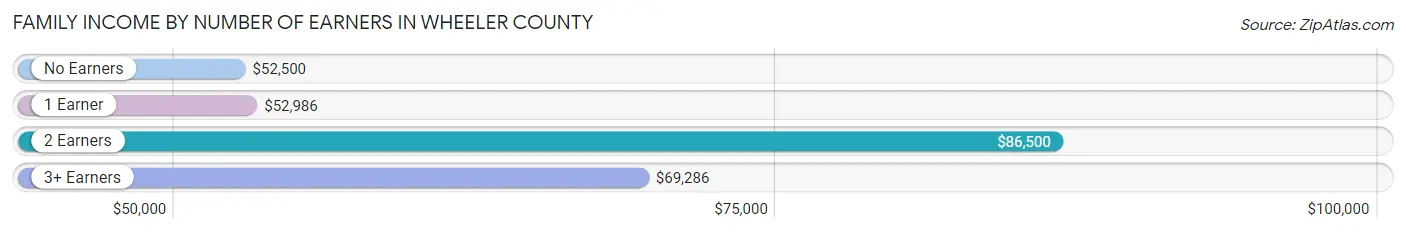
Family Income by Number of Earners in Wheeler County
The median family income in Wheeler County is $63,125, with families comprising 2 earners (138) having the highest median family income of $86,500, while families with no earners (104) have the lowest median family income of $52,500, accounting for 36.0% and 27.2% of families, respectively.
| Number of Earners | # Families | Median Income |
| No Earners | 104 (27.2%) | $52,500 |
| 1 Earner | 121 (31.6%) | $52,986 |
| 2 Earners | 138 (36.0%) | $86,500 |
| 3+ Earners | 20 (5.2%) | $69,286 |
| Total | 383 (100.0%) | $63,125 |
Household Income in Wheeler County
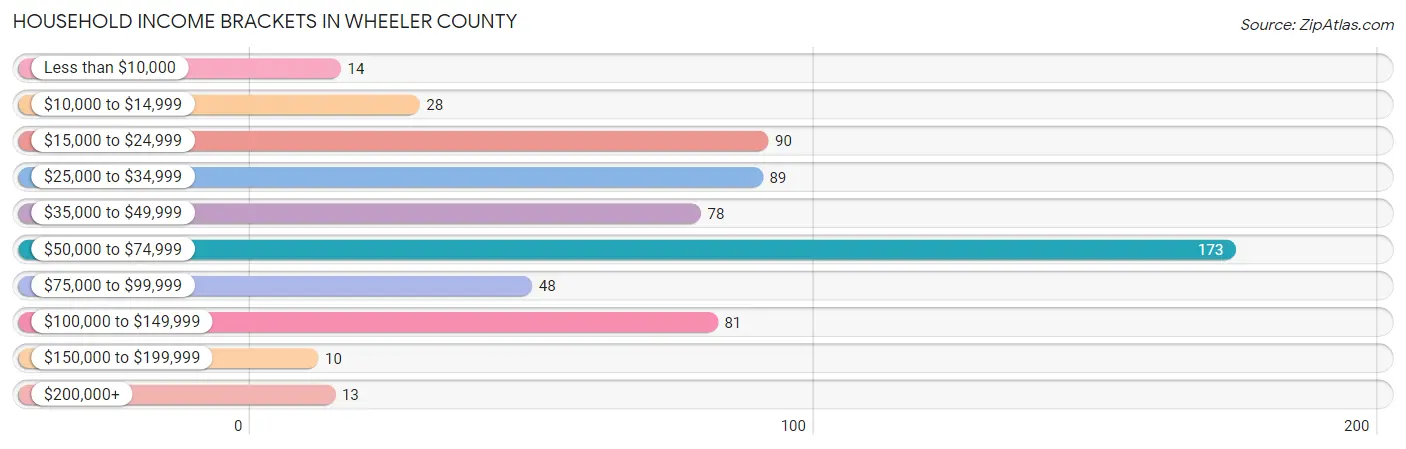
Household Income Brackets in Wheeler County
With 173 households falling in the category, the $50,000 to $74,999 income range is the most frequent in Wheeler County, accounting for 27.7% of all households. In contrast, only 10 households (1.6%) fall into the $150,000 to $199,999 income bracket, making it the least populous group.
| Income Bracket | # Households | % Households |
| Less than $10,000 | 14 | 2.2% |
| $10,000 to $14,999 | 28 | 4.5% |
| $15,000 to $24,999 | 90 | 14.4% |
| $25,000 to $34,999 | 89 | 14.3% |
| $35,000 to $49,999 | 78 | 12.5% |
| $50,000 to $74,999 | 173 | 27.7% |
| $75,000 to $99,999 | 48 | 7.7% |
| $100,000 to $149,999 | 81 | 13.0% |
| $150,000 to $199,999 | 10 | 1.6% |
| $200,000+ | 13 | 2.1% |
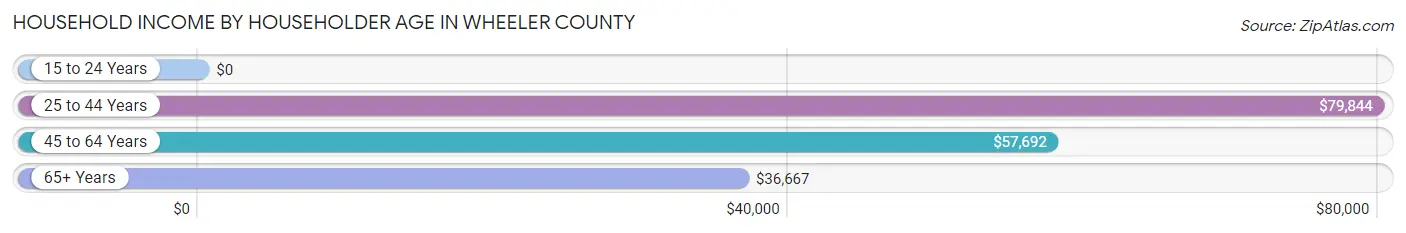
Household Income by Householder Age in Wheeler County
The median household income in Wheeler County is $50,774, with the highest median household income of $79,844 found in the 25 to 44 years age bracket for the primary householder. A total of 109 households (17.5%) fall into this category. Meanwhile, the 15 to 24 years age bracket for the primary householder has the lowest median household income of $0, with 13 households (2.1%) in this group.
| Income Bracket | # Households | Median Income |
| 15 to 24 Years | 13 (2.1%) | $0 |
| 25 to 44 Years | 109 (17.5%) | $79,844 |
| 45 to 64 Years | 204 (32.7%) | $57,692 |
| 65+ Years | 298 (47.8%) | $36,667 |
| Total | 624 (100.0%) | $50,774 |
Poverty in Wheeler County
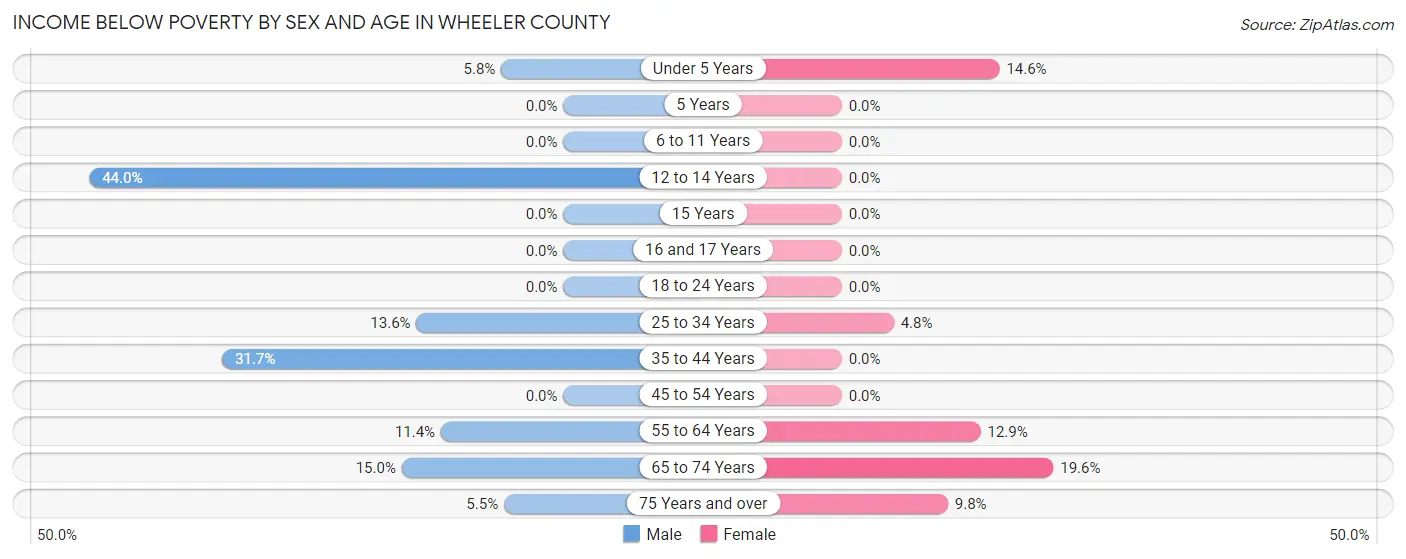
Income Below Poverty by Sex and Age in Wheeler County
With 11.2% poverty level for males and 8.5% for females among the residents of Wheeler County, 12 to 14 year old males and 65 to 74 year old females are the most vulnerable to poverty, with 11 males (44.0%) and 21 females (19.6%) in their respective age groups living below the poverty level.
| Age Bracket | Male | Female |
| Under 5 Years | 3 (5.8%) | 6 (14.6%) |
| 5 Years | 0 (0.0%) | 0 (0.0%) |
| 6 to 11 Years | 0 (0.0%) | 0 (0.0%) |
| 12 to 14 Years | 11 (44.0%) | 0 (0.0%) |
| 15 Years | 0 (0.0%) | 0 (0.0%) |
| 16 and 17 Years | 0 (0.0%) | 0 (0.0%) |
| 18 to 24 Years | 0 (0.0%) | 0 (0.0%) |
| 25 to 34 Years | 6 (13.6%) | 4 (4.8%) |
| 35 to 44 Years | 19 (31.7%) | 0 (0.0%) |
| 45 to 54 Years | 0 (0.0%) | 0 (0.0%) |
| 55 to 64 Years | 10 (11.4%) | 17 (12.9%) |
| 65 to 74 Years | 21 (15.0%) | 21 (19.6%) |
| 75 Years and over | 7 (5.5%) | 12 (9.8%) |
| Total | 77 (11.2%) | 60 (8.5%) |
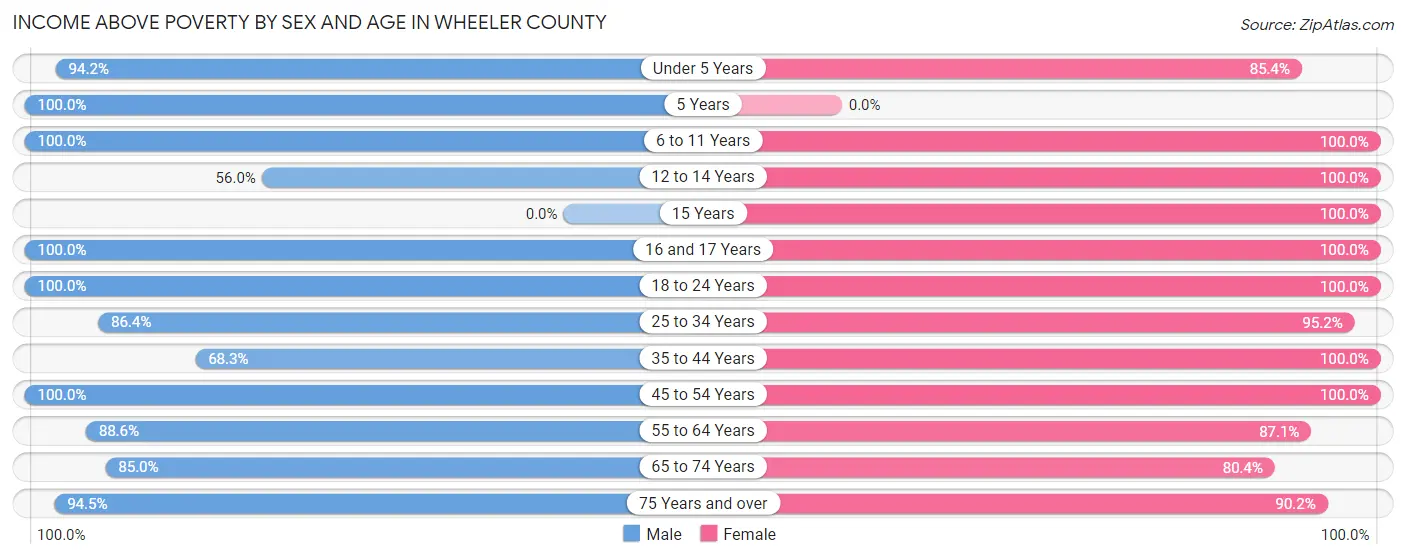
Income Above Poverty by Sex and Age in Wheeler County
According to the poverty statistics in Wheeler County, males aged 5 years and females aged 6 to 11 years are the age groups that are most secure financially, with 100.0% of males and 100.0% of females in these age groups living above the poverty line.
| Age Bracket | Male | Female |
| Under 5 Years | 49 (94.2%) | 35 (85.4%) |
| 5 Years | 4 (100.0%) | 0 (0.0%) |
| 6 to 11 Years | 18 (100.0%) | 34 (100.0%) |
| 12 to 14 Years | 14 (56.0%) | 23 (100.0%) |
| 15 Years | 0 (0.0%) | 9 (100.0%) |
| 16 and 17 Years | 14 (100.0%) | 7 (100.0%) |
| 18 to 24 Years | 34 (100.0%) | 27 (100.0%) |
| 25 to 34 Years | 38 (86.4%) | 79 (95.2%) |
| 35 to 44 Years | 41 (68.3%) | 46 (100.0%) |
| 45 to 54 Years | 80 (100.0%) | 72 (100.0%) |
| 55 to 64 Years | 78 (88.6%) | 115 (87.1%) |
| 65 to 74 Years | 119 (85.0%) | 86 (80.4%) |
| 75 Years and over | 120 (94.5%) | 110 (90.2%) |
| Total | 609 (88.8%) | 643 (91.5%) |
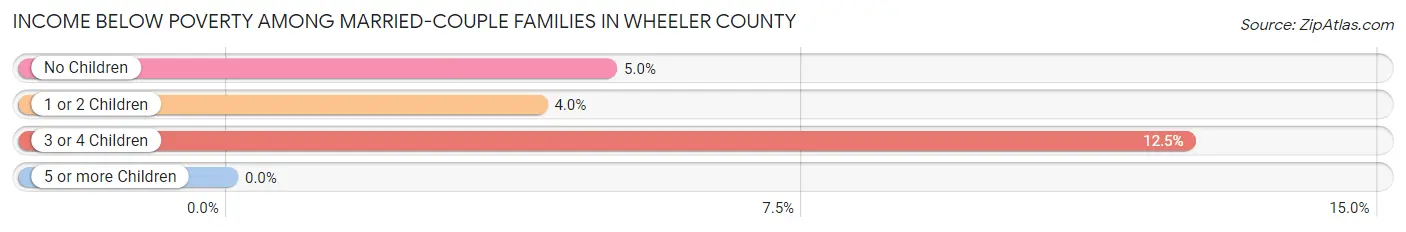
Income Below Poverty Among Married-Couple Families in Wheeler County
The poverty statistics for married-couple families in Wheeler County show that 5.0% or 17 of the total 337 families live below the poverty line. Families with 3 or 4 children have the highest poverty rate of 12.5%, comprising of 2 families. On the other hand, families with 1 or 2 children have the lowest poverty rate of 4.0%, which includes 4 families.
| Children | Above Poverty | Below Poverty |
| No Children | 211 (95.1%) | 11 (5.0%) |
| 1 or 2 Children | 95 (96.0%) | 4 (4.0%) |
| 3 or 4 Children | 14 (87.5%) | 2 (12.5%) |
| 5 or more Children | 0 (0.0%) | 0 (0.0%) |
| Total | 320 (95.0%) | 17 (5.0%) |
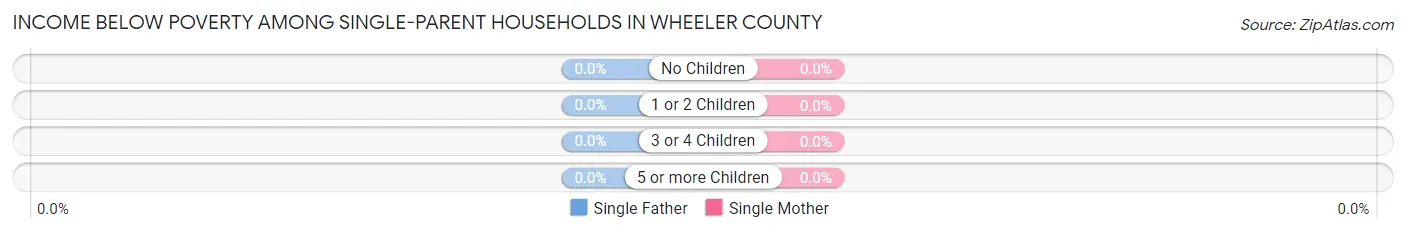
Income Below Poverty Among Single-Parent Households in Wheeler County
| Children | Single Father | Single Mother |
| No Children | 0 (0.0%) | 0 (0.0%) |
| 1 or 2 Children | 0 (0.0%) | 0 (0.0%) |
| 3 or 4 Children | 0 (0.0%) | 0 (0.0%) |
| 5 or more Children | 0 (0.0%) | 0 (0.0%) |
| Total | 0 (0.0%) | 0 (0.0%) |
Income Below Poverty Among Married-Couple vs Single-Parent Households in Wheeler County
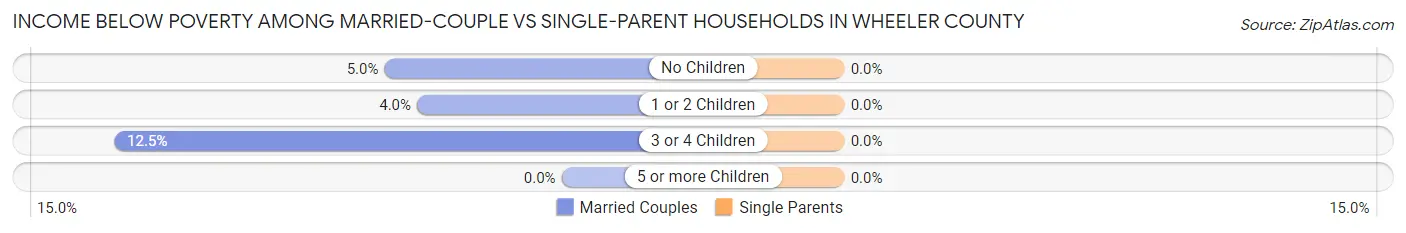
| Children | Married-Couple Families | Single-Parent Households |
| No Children | 11 (5.0%) | 0 (0.0%) |
| 1 or 2 Children | 4 (4.0%) | 0 (0.0%) |
| 3 or 4 Children | 2 (12.5%) | 0 (0.0%) |
| 5 or more Children | 0 (0.0%) | 0 (0.0%) |
| Total | 17 (5.0%) | 0 (0.0%) |
Employment Characteristics in Wheeler County
Employment by Class of Employer in Wheeler County
Among the 484 employed individuals in Wheeler County, private company employees (174 | 35.9%), state government employees (82 | 16.9%), and local government employees (72 | 14.9%) make up the most common classes of employment.
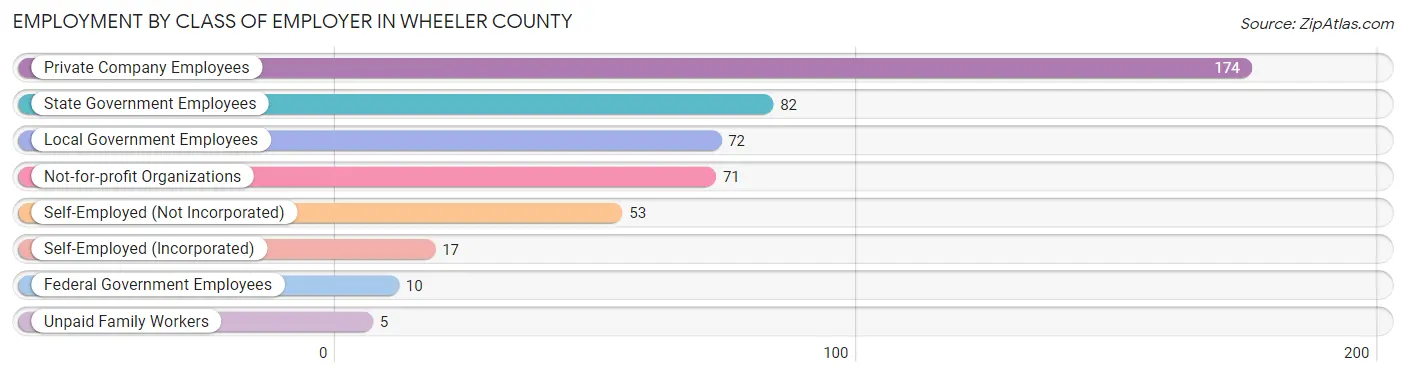
| Employer Class | # Employees | % Employees |
| Private Company Employees | 174 | 35.9% |
| Self-Employed (Incorporated) | 17 | 3.5% |
| Self-Employed (Not Incorporated) | 53 | 11.0% |
| Not-for-profit Organizations | 71 | 14.7% |
| Local Government Employees | 72 | 14.9% |
| State Government Employees | 82 | 16.9% |
| Federal Government Employees | 10 | 2.1% |
| Unpaid Family Workers | 5 | 1.0% |
| Total | 484 | 100.0% |
Employment Status by Age in Wheeler County
According to the labor force statistics for Wheeler County, out of the total population over 16 years of age (1,201), 43.4% or 521 individuals are in the labor force, with 5.4% or 28 of them unemployed. The age group with the highest labor force participation rate is 25 to 29 years, with 95.1% or 78 individuals in the labor force. Within the labor force, the 30 to 34 years age range has the highest percentage of unemployed individuals, with 18.2% or 6 of them being unemployed.
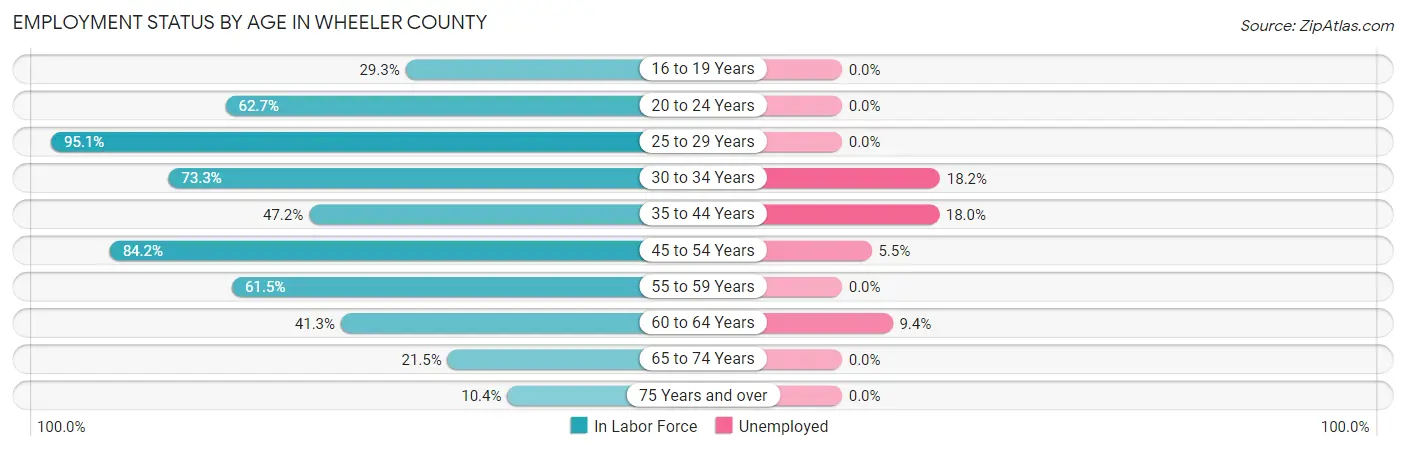
| Age Bracket | In Labor Force | Unemployed |
| 16 to 19 Years | 12 (29.3%) | 0 (0.0%) |
| 20 to 24 Years | 37 (62.7%) | 0 (0.0%) |
| 25 to 29 Years | 78 (95.1%) | 0 (0.0%) |
| 30 to 34 Years | 33 (73.3%) | 6 (18.2%) |
| 35 to 44 Years | 50 (47.2%) | 9 (18.0%) |
| 45 to 54 Years | 128 (84.2%) | 7 (5.5%) |
| 55 to 59 Years | 40 (61.5%) | 0 (0.0%) |
| 60 to 64 Years | 64 (41.3%) | 6 (9.4%) |
| 65 to 74 Years | 53 (21.5%) | 0 (0.0%) |
| 75 Years and over | 26 (10.4%) | 0 (0.0%) |
| Total | 521 (43.4%) | 28 (5.4%) |
Employment Status by Educational Attainment in Wheeler County
According to labor force statistics for Wheeler County, 65.0% of individuals (393) out of the total population between 25 and 64 years of age (605) are in the labor force, with 7.1% or 28 of them being unemployed. The group with the highest labor force participation rate are those with the educational attainment of bachelor's degree or higher, with 77.0% or 97 individuals in the labor force. Within the labor force, individuals with college / associate degree education have the highest percentage of unemployment, with 10.1% or 19 of them being unemployed.
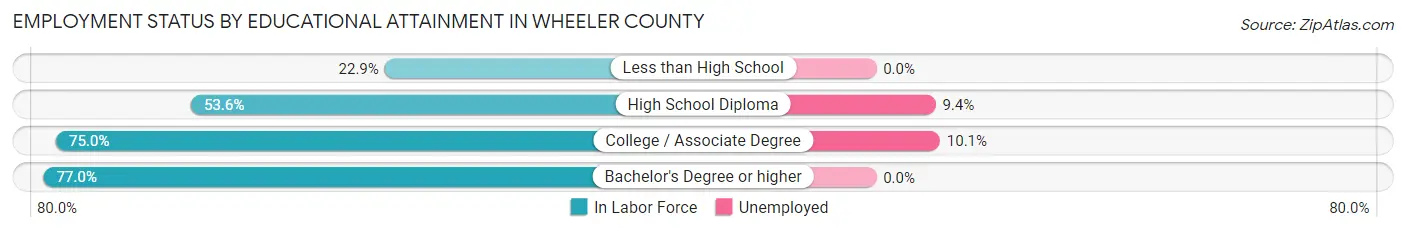
| Educational Attainment | In Labor Force | Unemployed |
| Less than High School | 11 (22.9%) | 0 (0.0%) |
| High School Diploma | 96 (53.6%) | 17 (9.4%) |
| College / Associate Degree | 189 (75.0%) | 25 (10.1%) |
| Bachelor's Degree or higher | 97 (77.0%) | 0 (0.0%) |
| Total | 393 (65.0%) | 43 (7.1%) |
Employment Occupations by Sex in Wheeler County
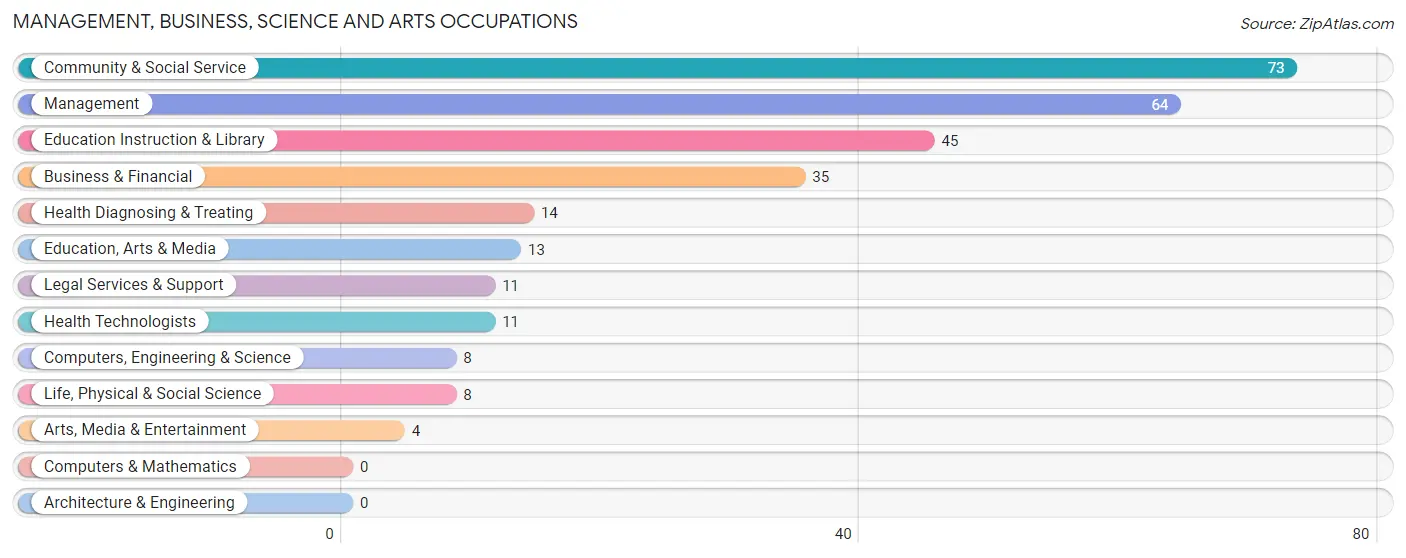
Management, Business, Science and Arts Occupations
The most common Management, Business, Science and Arts occupations in Wheeler County are Community & Social Service (73 | 14.8%), Management (64 | 13.0%), Education Instruction & Library (45 | 9.1%), Business & Financial (35 | 7.1%), and Health Diagnosing & Treating (14 | 2.8%).
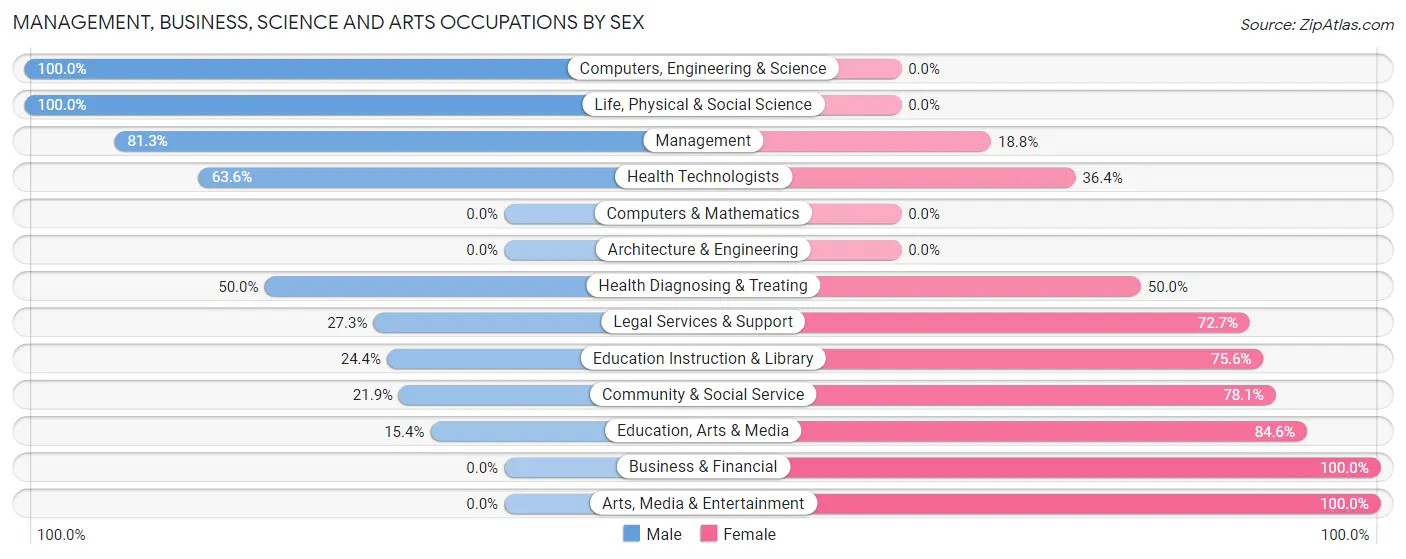
Management, Business, Science and Arts Occupations by Sex
Within the Management, Business, Science and Arts occupations in Wheeler County, the most male-oriented occupations are Computers, Engineering & Science (100.0%), Life, Physical & Social Science (100.0%), and Management (81.2%), while the most female-oriented occupations are Business & Financial (100.0%), Arts, Media & Entertainment (100.0%), and Education, Arts & Media (84.6%).
| Occupation | Male | Female |
| Management | 52 (81.2%) | 12 (18.8%) |
| Business & Financial | 0 (0.0%) | 35 (100.0%) |
| Computers, Engineering & Science | 8 (100.0%) | 0 (0.0%) |
| Computers & Mathematics | 0 (0.0%) | 0 (0.0%) |
| Architecture & Engineering | 0 (0.0%) | 0 (0.0%) |
| Life, Physical & Social Science | 8 (100.0%) | 0 (0.0%) |
| Community & Social Service | 16 (21.9%) | 57 (78.1%) |
| Education, Arts & Media | 2 (15.4%) | 11 (84.6%) |
| Legal Services & Support | 3 (27.3%) | 8 (72.7%) |
| Education Instruction & Library | 11 (24.4%) | 34 (75.6%) |
| Arts, Media & Entertainment | 0 (0.0%) | 4 (100.0%) |
| Health Diagnosing & Treating | 7 (50.0%) | 7 (50.0%) |
| Health Technologists | 7 (63.6%) | 4 (36.4%) |
| Total (Category) | 83 (42.8%) | 111 (57.2%) |
| Total (Overall) | 247 (50.1%) | 246 (49.9%) |
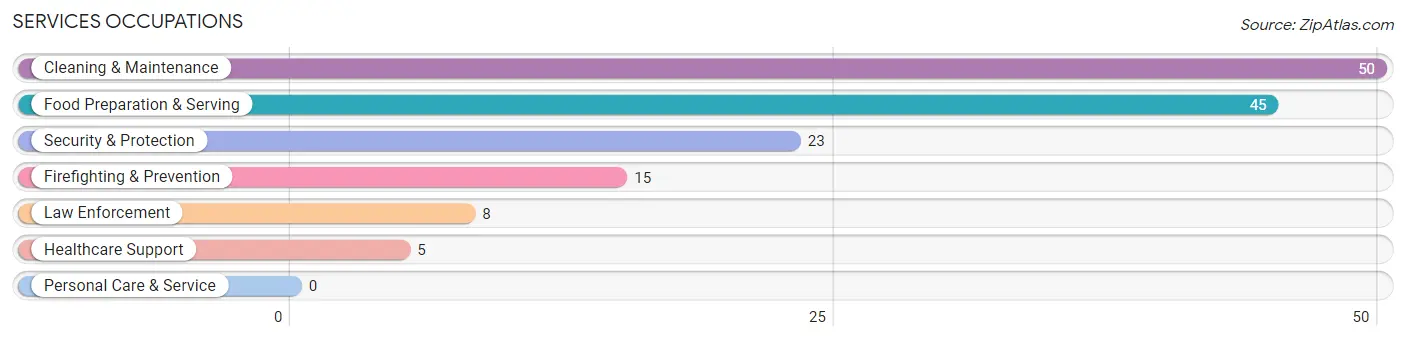
Services Occupations
The most common Services occupations in Wheeler County are Cleaning & Maintenance (50 | 10.1%), Food Preparation & Serving (45 | 9.1%), Security & Protection (23 | 4.7%), Firefighting & Prevention (15 | 3.0%), and Law Enforcement (8 | 1.6%).
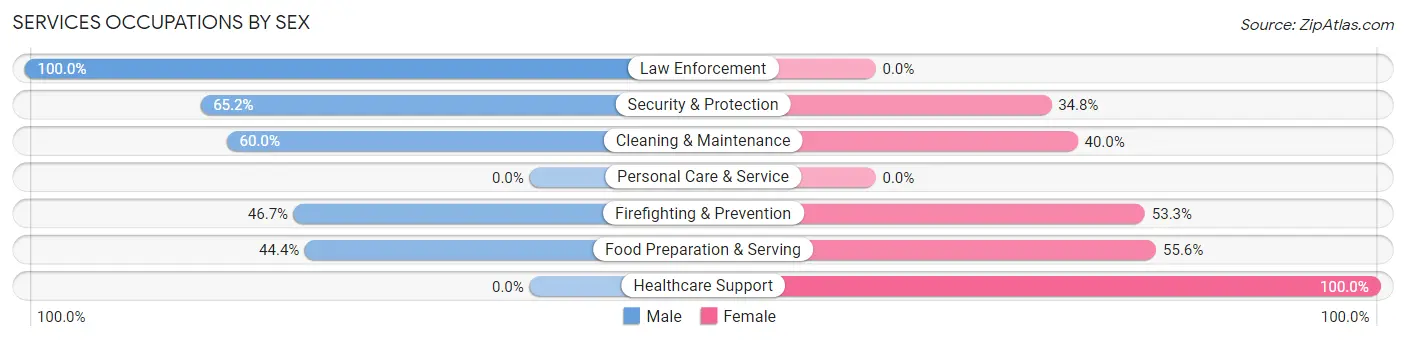
Services Occupations by Sex
Within the Services occupations in Wheeler County, the most male-oriented occupations are Law Enforcement (100.0%), Security & Protection (65.2%), and Cleaning & Maintenance (60.0%), while the most female-oriented occupations are Healthcare Support (100.0%), Food Preparation & Serving (55.6%), and Firefighting & Prevention (53.3%).
| Occupation | Male | Female |
| Healthcare Support | 0 (0.0%) | 5 (100.0%) |
| Security & Protection | 15 (65.2%) | 8 (34.8%) |
| Firefighting & Prevention | 7 (46.7%) | 8 (53.3%) |
| Law Enforcement | 8 (100.0%) | 0 (0.0%) |
| Food Preparation & Serving | 20 (44.4%) | 25 (55.6%) |
| Cleaning & Maintenance | 30 (60.0%) | 20 (40.0%) |
| Personal Care & Service | 0 (0.0%) | 0 (0.0%) |
| Total (Category) | 65 (52.8%) | 58 (47.1%) |
| Total (Overall) | 247 (50.1%) | 246 (49.9%) |
Sales and Office Occupations
The most common Sales and Office occupations in Wheeler County are Office & Administration (75 | 15.2%), and Sales & Related (20 | 4.1%).
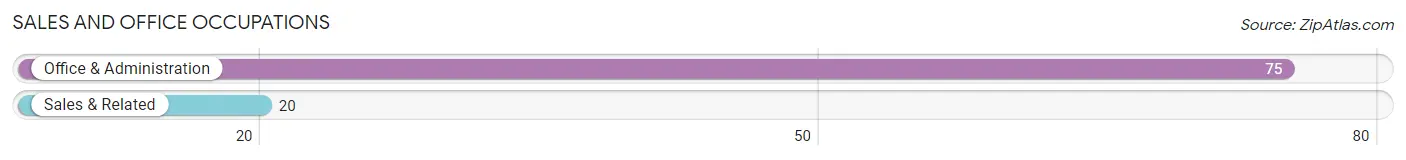
Sales and Office Occupations by Sex
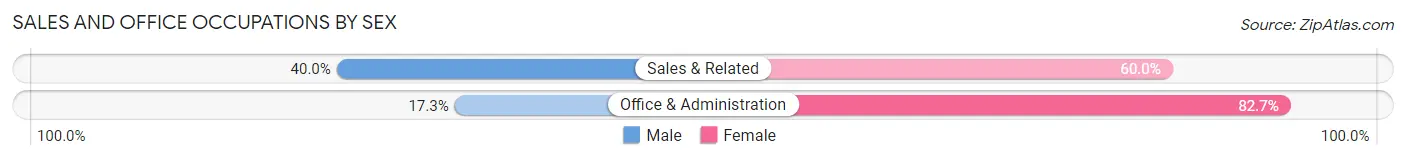
| Occupation | Male | Female |
| Sales & Related | 8 (40.0%) | 12 (60.0%) |
| Office & Administration | 13 (17.3%) | 62 (82.7%) |
| Total (Category) | 21 (22.1%) | 74 (77.9%) |
| Total (Overall) | 247 (50.1%) | 246 (49.9%) |
Natural Resources, Construction and Maintenance Occupations
The most common Natural Resources, Construction and Maintenance occupations in Wheeler County are Farming, Fishing & Forestry (26 | 5.3%), Construction & Extraction (24 | 4.9%), and Installation, Maintenance & Repair (18 | 3.6%).
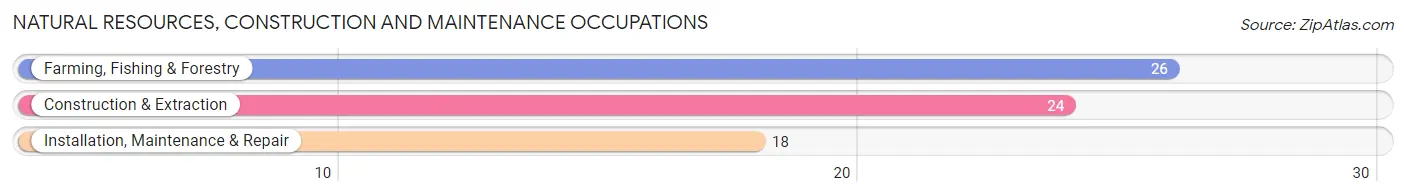
Natural Resources, Construction and Maintenance Occupations by Sex
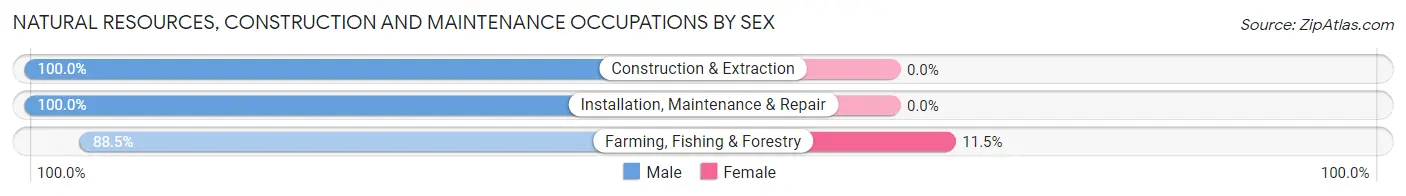
| Occupation | Male | Female |
| Farming, Fishing & Forestry | 23 (88.5%) | 3 (11.5%) |
| Construction & Extraction | 24 (100.0%) | 0 (0.0%) |
| Installation, Maintenance & Repair | 18 (100.0%) | 0 (0.0%) |
| Total (Category) | 65 (95.6%) | 3 (4.4%) |
| Total (Overall) | 247 (50.1%) | 246 (49.9%) |
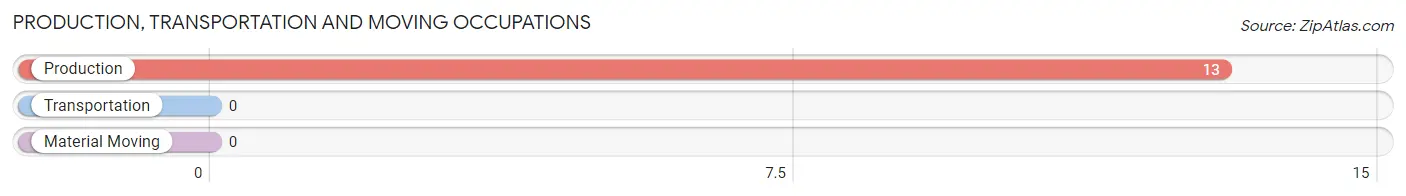
Production, Transportation and Moving Occupations
The most common Production, Transportation and Moving occupations in Wheeler County are , and Production (13 | 2.6%).
Production, Transportation and Moving Occupations by Sex
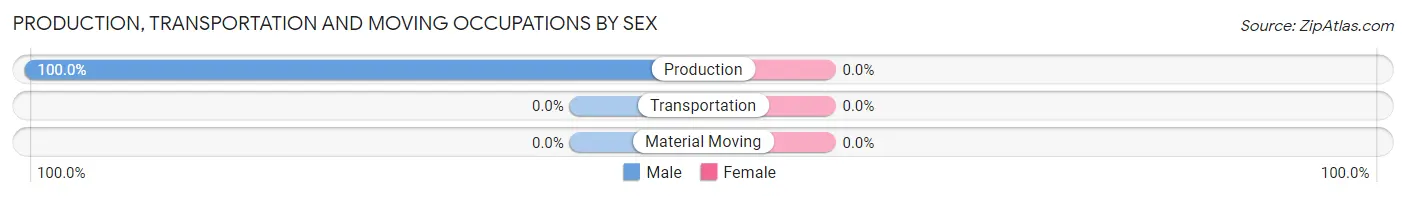
| Occupation | Male | Female |
| Production | 13 (100.0%) | 0 (0.0%) |
| Transportation | 0 (0.0%) | 0 (0.0%) |
| Material Moving | 0 (0.0%) | 0 (0.0%) |
| Total (Category) | 13 (100.0%) | 0 (0.0%) |
| Total (Overall) | 247 (50.1%) | 246 (49.9%) |
Employment Industries by Sex in Wheeler County
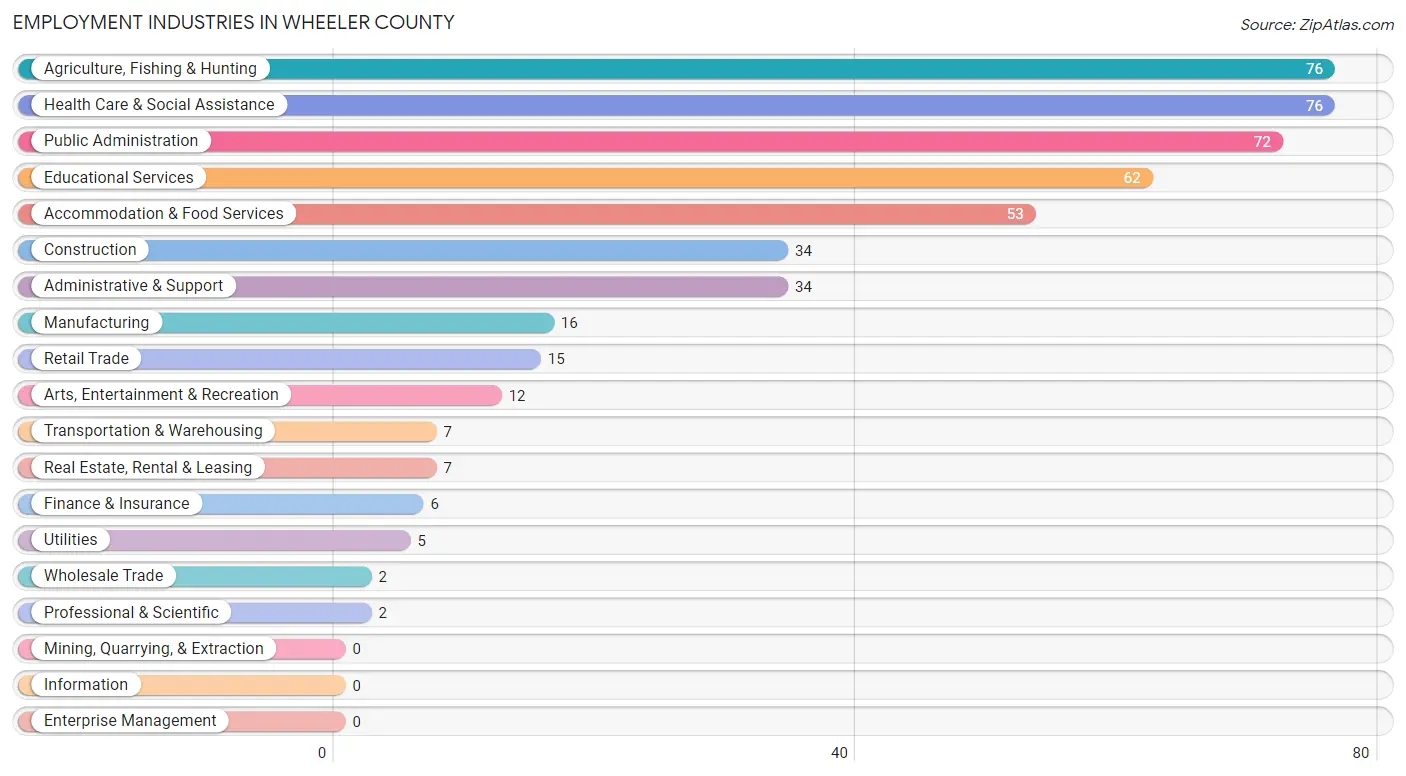
Employment Industries in Wheeler County
The major employment industries in Wheeler County include Agriculture, Fishing & Hunting (76 | 15.4%), Health Care & Social Assistance (76 | 15.4%), Public Administration (72 | 14.6%), Educational Services (62 | 12.6%), and Accommodation & Food Services (53 | 10.7%).
Employment Industries by Sex in Wheeler County
The Wheeler County industries that see more men than women are Wholesale Trade (100.0%), Utilities (100.0%), and Construction (94.1%), whereas the industries that tend to have a higher number of women are Transportation & Warehousing (100.0%), Finance & Insurance (100.0%), and Real Estate, Rental & Leasing (100.0%).
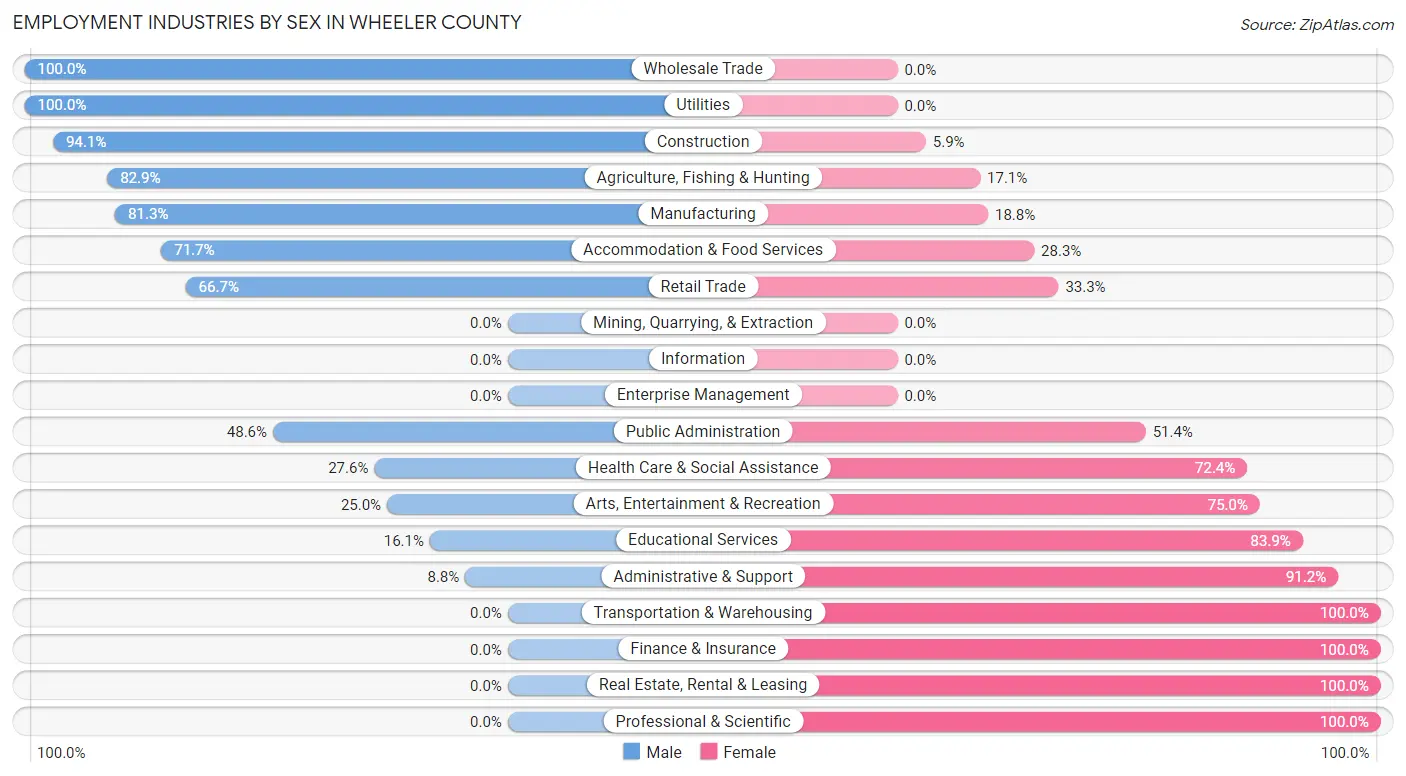
| Industry | Male | Female |
| Agriculture, Fishing & Hunting | 63 (82.9%) | 13 (17.1%) |
| Mining, Quarrying, & Extraction | 0 (0.0%) | 0 (0.0%) |
| Construction | 32 (94.1%) | 2 (5.9%) |
| Manufacturing | 13 (81.2%) | 3 (18.8%) |
| Wholesale Trade | 2 (100.0%) | 0 (0.0%) |
| Retail Trade | 10 (66.7%) | 5 (33.3%) |
| Transportation & Warehousing | 0 (0.0%) | 7 (100.0%) |
| Utilities | 5 (100.0%) | 0 (0.0%) |
| Information | 0 (0.0%) | 0 (0.0%) |
| Finance & Insurance | 0 (0.0%) | 6 (100.0%) |
| Real Estate, Rental & Leasing | 0 (0.0%) | 7 (100.0%) |
| Professional & Scientific | 0 (0.0%) | 2 (100.0%) |
| Enterprise Management | 0 (0.0%) | 0 (0.0%) |
| Administrative & Support | 3 (8.8%) | 31 (91.2%) |
| Educational Services | 10 (16.1%) | 52 (83.9%) |
| Health Care & Social Assistance | 21 (27.6%) | 55 (72.4%) |
| Arts, Entertainment & Recreation | 3 (25.0%) | 9 (75.0%) |
| Accommodation & Food Services | 38 (71.7%) | 15 (28.3%) |
| Public Administration | 35 (48.6%) | 37 (51.4%) |
| Total | 247 (50.1%) | 246 (49.9%) |
Education in Wheeler County
School Enrollment in Wheeler County
The most common levels of schooling among the 179 students in Wheeler County are middle school (54 | 30.2%), high school (42 | 23.5%), and elementary school (35 | 19.6%).
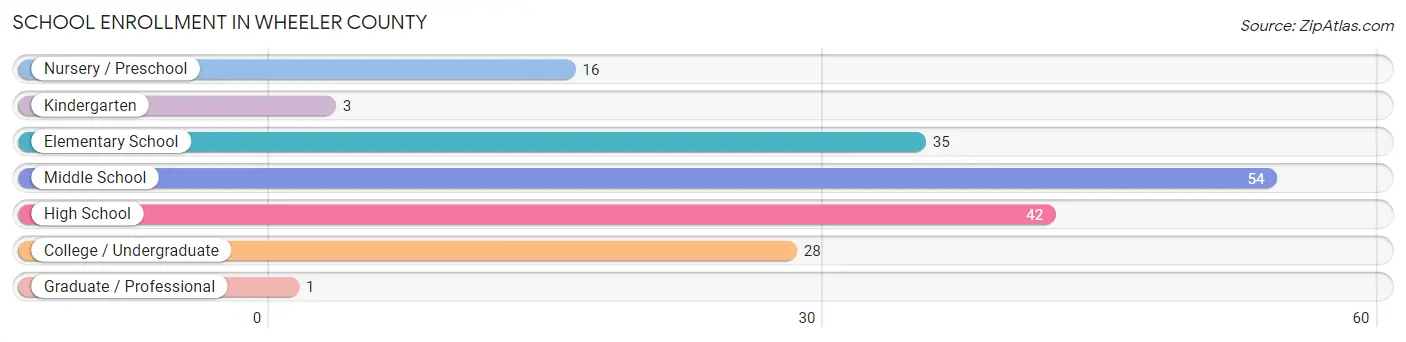
| School Level | # Students | % Students |
| Nursery / Preschool | 16 | 8.9% |
| Kindergarten | 3 | 1.7% |
| Elementary School | 35 | 19.6% |
| Middle School | 54 | 30.2% |
| High School | 42 | 23.5% |
| College / Undergraduate | 28 | 15.6% |
| Graduate / Professional | 1 | 0.6% |
| Total | 179 | 100.0% |
School Enrollment by Age by Funding Source in Wheeler County
Out of a total of 179 students who are enrolled in schools in Wheeler County, 14 (7.8%) attend a private institution, while the remaining 165 (92.2%) are enrolled in public schools. The age group of 35 years and over has the highest likelihood of being enrolled in private schools, with 1 (100.0% in the age bracket) enrolled. Conversely, the age group of 3 to 4 year olds has the lowest likelihood of being enrolled in a private school, with 12 (100.0% in the age bracket) attending a public institution.
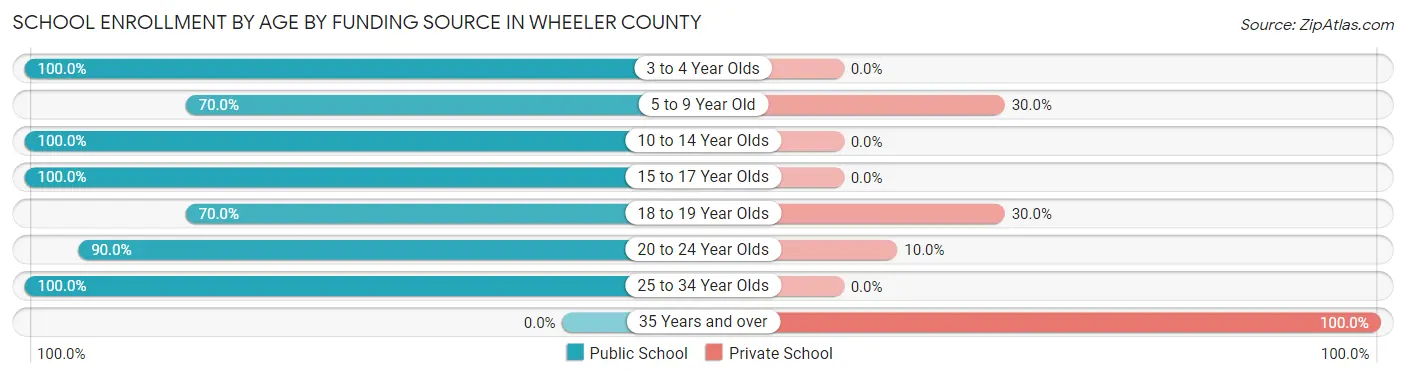
| Age Bracket | Public School | Private School |
| 3 to 4 Year Olds | 12 (100.0%) | 0 (0.0%) |
| 5 to 9 Year Old | 21 (70.0%) | 9 (30.0%) |
| 10 to 14 Year Olds | 74 (100.0%) | 0 (0.0%) |
| 15 to 17 Year Olds | 40 (100.0%) | 0 (0.0%) |
| 18 to 19 Year Olds | 7 (70.0%) | 3 (30.0%) |
| 20 to 24 Year Olds | 9 (90.0%) | 1 (10.0%) |
| 25 to 34 Year Olds | 2 (100.0%) | 0 (0.0%) |
| 35 Years and over | 0 (0.0%) | 1 (100.0%) |
| Total | 165 (92.2%) | 14 (7.8%) |
Educational Attainment by Field of Study in Wheeler County
Business (72 | 31.2%), education (49 | 21.2%), physical & health sciences (22 | 9.5%), engineering (16 | 6.9%), and literature & languages (14 | 6.1%) are the most common fields of study among 231 individuals in Wheeler County who have obtained a bachelor's degree or higher.
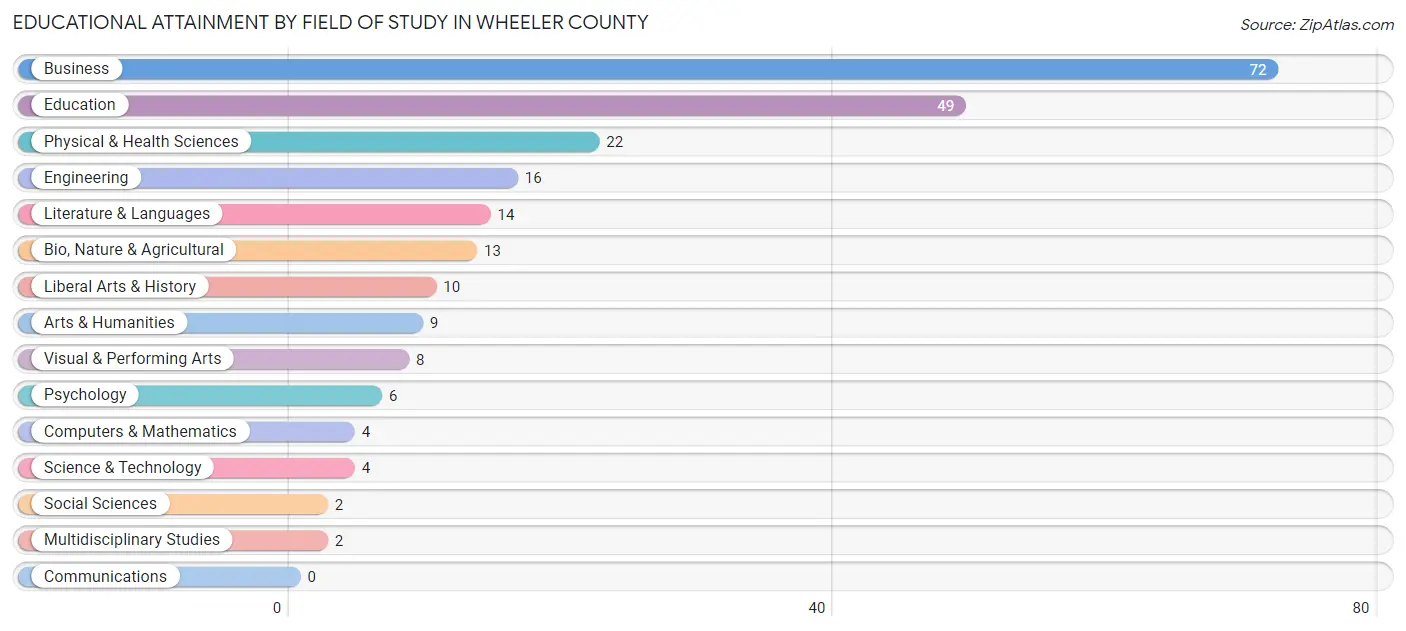
| Field of Study | # Graduates | % Graduates |
| Computers & Mathematics | 4 | 1.7% |
| Bio, Nature & Agricultural | 13 | 5.6% |
| Physical & Health Sciences | 22 | 9.5% |
| Psychology | 6 | 2.6% |
| Social Sciences | 2 | 0.9% |
| Engineering | 16 | 6.9% |
| Multidisciplinary Studies | 2 | 0.9% |
| Science & Technology | 4 | 1.7% |
| Business | 72 | 31.2% |
| Education | 49 | 21.2% |
| Literature & Languages | 14 | 6.1% |
| Liberal Arts & History | 10 | 4.3% |
| Visual & Performing Arts | 8 | 3.5% |
| Communications | 0 | 0.0% |
| Arts & Humanities | 9 | 3.9% |
| Total | 231 | 100.0% |
Transportation & Commute in Wheeler County
Vehicle Availability by Sex in Wheeler County
The most prevalent vehicle ownership categories in Wheeler County are males with 2 vehicles (84, accounting for 34.7%) and females with 2 vehicles (122, making up 35.0%).
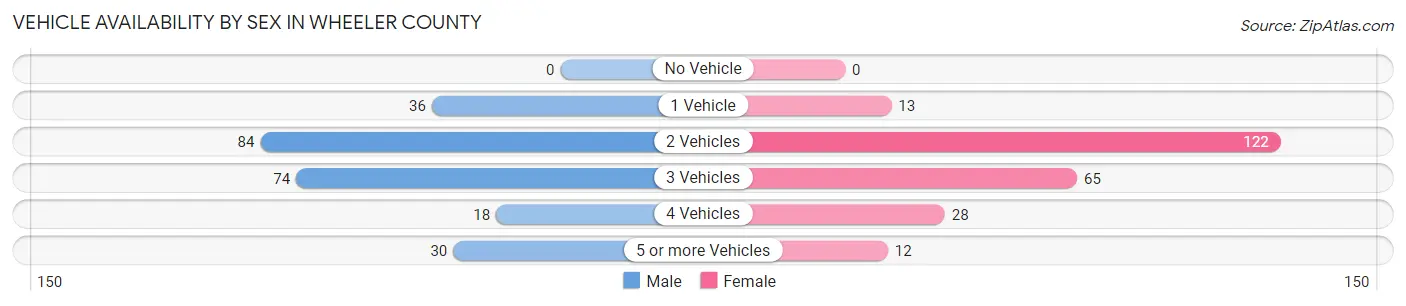
| Vehicles Available | Male | Female |
| No Vehicle | 0 (0.0%) | 0 (0.0%) |
| 1 Vehicle | 36 (14.9%) | 13 (5.4%) |
| 2 Vehicles | 84 (34.7%) | 122 (50.8%) |
| 3 Vehicles | 74 (30.6%) | 65 (27.1%) |
| 4 Vehicles | 18 (7.4%) | 28 (11.7%) |
| 5 or more Vehicles | 30 (12.4%) | 12 (5.0%) |
| Total | 242 (100.0%) | 240 (100.0%) |
Commute Time in Wheeler County
The most frequently occuring commute durations in Wheeler County are 5 to 9 minutes (120 commuters, 29.1%), less than 5 minutes (69 commuters, 16.8%), and 30 to 34 minutes (61 commuters, 14.8%).
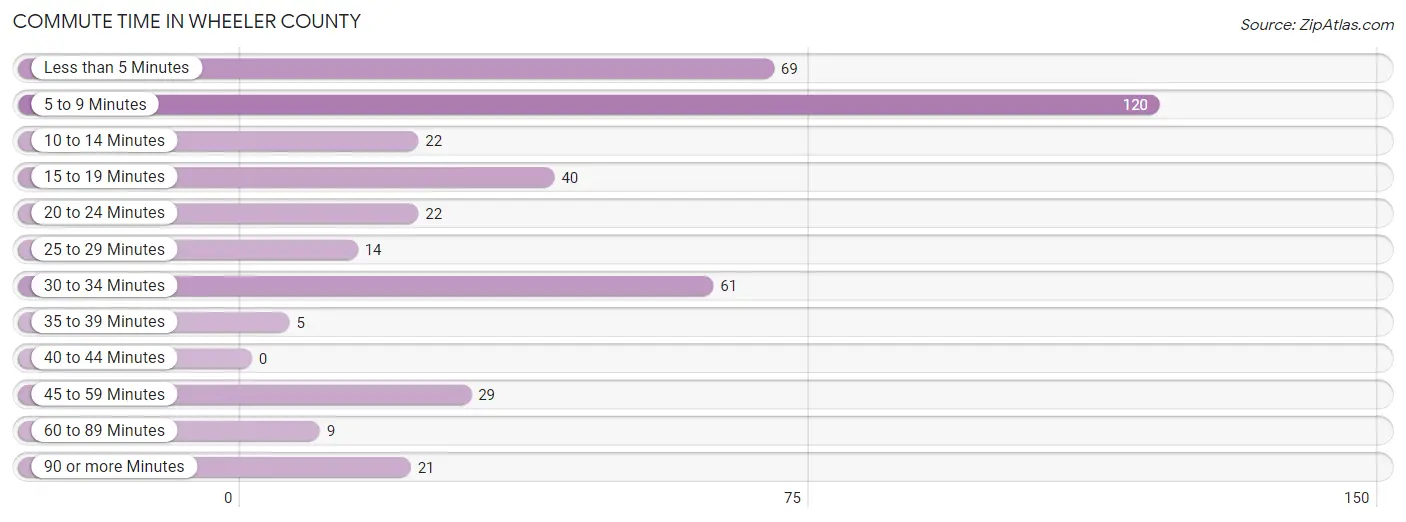
| Commute Time | # Commuters | % Commuters |
| Less than 5 Minutes | 69 | 16.8% |
| 5 to 9 Minutes | 120 | 29.1% |
| 10 to 14 Minutes | 22 | 5.3% |
| 15 to 19 Minutes | 40 | 9.7% |
| 20 to 24 Minutes | 22 | 5.3% |
| 25 to 29 Minutes | 14 | 3.4% |
| 30 to 34 Minutes | 61 | 14.8% |
| 35 to 39 Minutes | 5 | 1.2% |
| 40 to 44 Minutes | 0 | 0.0% |
| 45 to 59 Minutes | 29 | 7.0% |
| 60 to 89 Minutes | 9 | 2.2% |
| 90 or more Minutes | 21 | 5.1% |
Commute Time by Sex in Wheeler County
The most common commute times in Wheeler County are less than 5 minutes (35 commuters, 18.2%) for males and 5 to 9 minutes (89 commuters, 40.5%) for females.
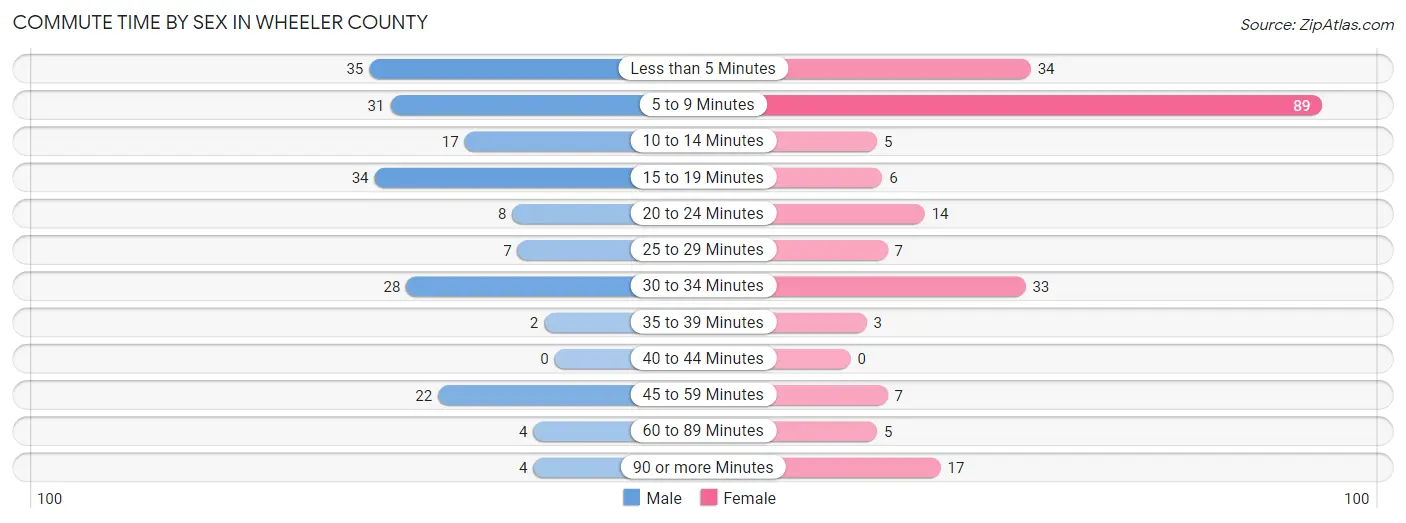
| Commute Time | Male | Female |
| Less than 5 Minutes | 35 (18.2%) | 34 (15.4%) |
| 5 to 9 Minutes | 31 (16.2%) | 89 (40.5%) |
| 10 to 14 Minutes | 17 (8.8%) | 5 (2.3%) |
| 15 to 19 Minutes | 34 (17.7%) | 6 (2.7%) |
| 20 to 24 Minutes | 8 (4.2%) | 14 (6.4%) |
| 25 to 29 Minutes | 7 (3.6%) | 7 (3.2%) |
| 30 to 34 Minutes | 28 (14.6%) | 33 (15.0%) |
| 35 to 39 Minutes | 2 (1.0%) | 3 (1.4%) |
| 40 to 44 Minutes | 0 (0.0%) | 0 (0.0%) |
| 45 to 59 Minutes | 22 (11.5%) | 7 (3.2%) |
| 60 to 89 Minutes | 4 (2.1%) | 5 (2.3%) |
| 90 or more Minutes | 4 (2.1%) | 17 (7.7%) |
Time of Departure to Work by Sex in Wheeler County
The most frequent times of departure to work in Wheeler County are 7:00 AM to 7:29 AM (38, 19.8%) for males and 7:30 AM to 7:59 AM (65, 29.5%) for females.
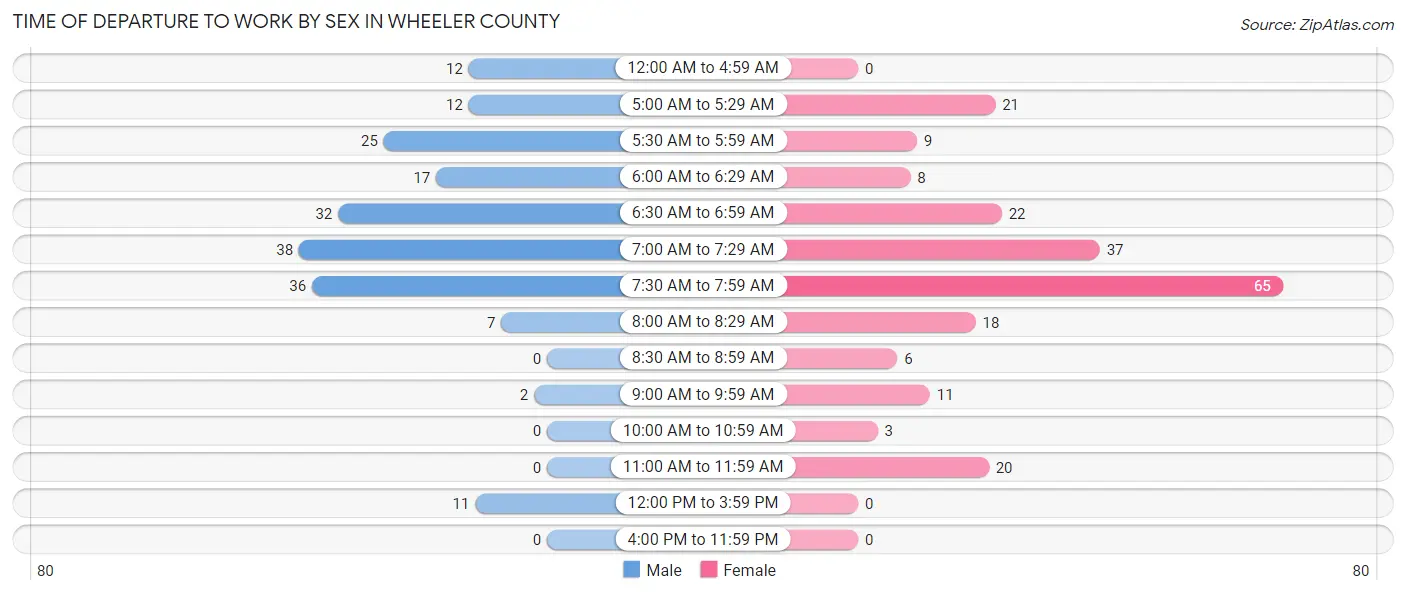
| Time of Departure | Male | Female |
| 12:00 AM to 4:59 AM | 12 (6.2%) | 0 (0.0%) |
| 5:00 AM to 5:29 AM | 12 (6.2%) | 21 (9.6%) |
| 5:30 AM to 5:59 AM | 25 (13.0%) | 9 (4.1%) |
| 6:00 AM to 6:29 AM | 17 (8.8%) | 8 (3.6%) |
| 6:30 AM to 6:59 AM | 32 (16.7%) | 22 (10.0%) |
| 7:00 AM to 7:29 AM | 38 (19.8%) | 37 (16.8%) |
| 7:30 AM to 7:59 AM | 36 (18.8%) | 65 (29.5%) |
| 8:00 AM to 8:29 AM | 7 (3.6%) | 18 (8.2%) |
| 8:30 AM to 8:59 AM | 0 (0.0%) | 6 (2.7%) |
| 9:00 AM to 9:59 AM | 2 (1.0%) | 11 (5.0%) |
| 10:00 AM to 10:59 AM | 0 (0.0%) | 3 (1.4%) |
| 11:00 AM to 11:59 AM | 0 (0.0%) | 20 (9.1%) |
| 12:00 PM to 3:59 PM | 11 (5.7%) | 0 (0.0%) |
| 4:00 PM to 11:59 PM | 0 (0.0%) | 0 (0.0%) |
| Total | 192 (100.0%) | 220 (100.0%) |
Housing Occupancy in Wheeler County
Occupancy by Ownership in Wheeler County
Of the total 624 dwellings in Wheeler County, owner-occupied units account for 431 (69.1%), while renter-occupied units make up 193 (30.9%).
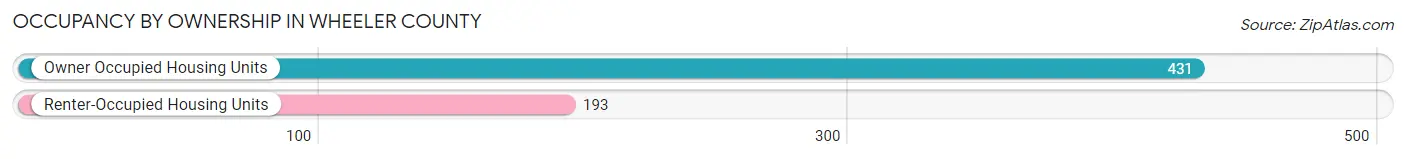
| Occupancy | # Housing Units | % Housing Units |
| Owner Occupied Housing Units | 431 | 69.1% |
| Renter-Occupied Housing Units | 193 | 30.9% |
| Total Occupied Housing Units | 624 | 100.0% |
Occupancy by Household Size in Wheeler County
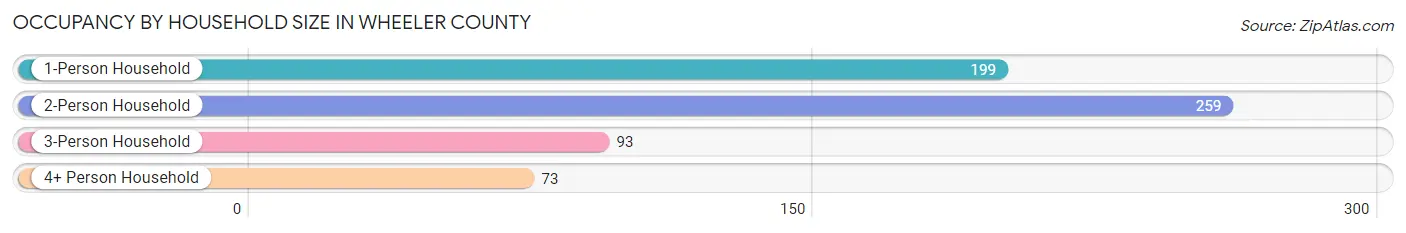
| Household Size | # Housing Units | % Housing Units |
| 1-Person Household | 199 | 31.9% |
| 2-Person Household | 259 | 41.5% |
| 3-Person Household | 93 | 14.9% |
| 4+ Person Household | 73 | 11.7% |
| Total Housing Units | 624 | 100.0% |
Occupancy by Ownership by Household Size in Wheeler County
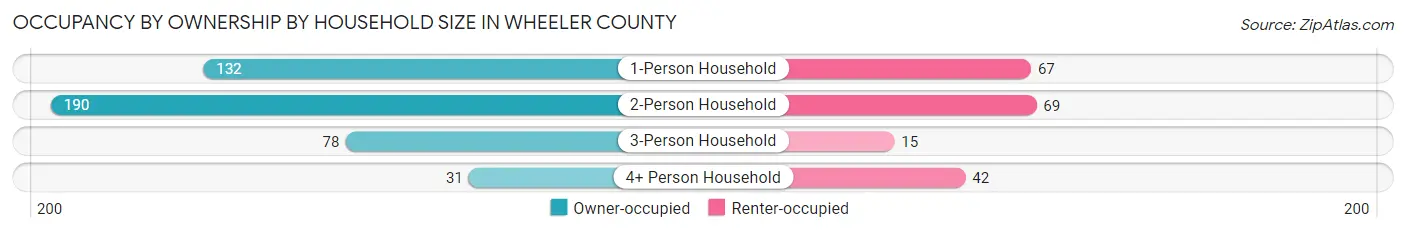
| Household Size | Owner-occupied | Renter-occupied |
| 1-Person Household | 132 (66.3%) | 67 (33.7%) |
| 2-Person Household | 190 (73.4%) | 69 (26.6%) |
| 3-Person Household | 78 (83.9%) | 15 (16.1%) |
| 4+ Person Household | 31 (42.5%) | 42 (57.5%) |
| Total Housing Units | 431 (69.1%) | 193 (30.9%) |
Occupancy by Educational Attainment in Wheeler County
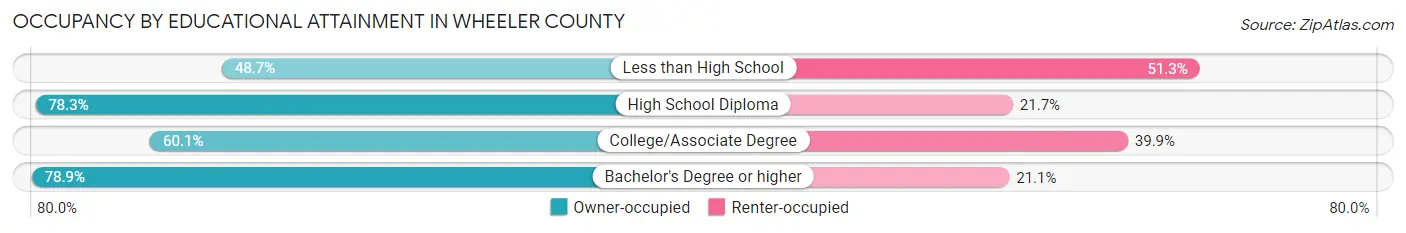
| Household Size | Owner-occupied | Renter-occupied |
| Less than High School | 19 (48.7%) | 20 (51.3%) |
| High School Diploma | 130 (78.3%) | 36 (21.7%) |
| College/Associate Degree | 155 (60.1%) | 103 (39.9%) |
| Bachelor's Degree or higher | 127 (78.9%) | 34 (21.1%) |
Occupancy by Age of Householder in Wheeler County
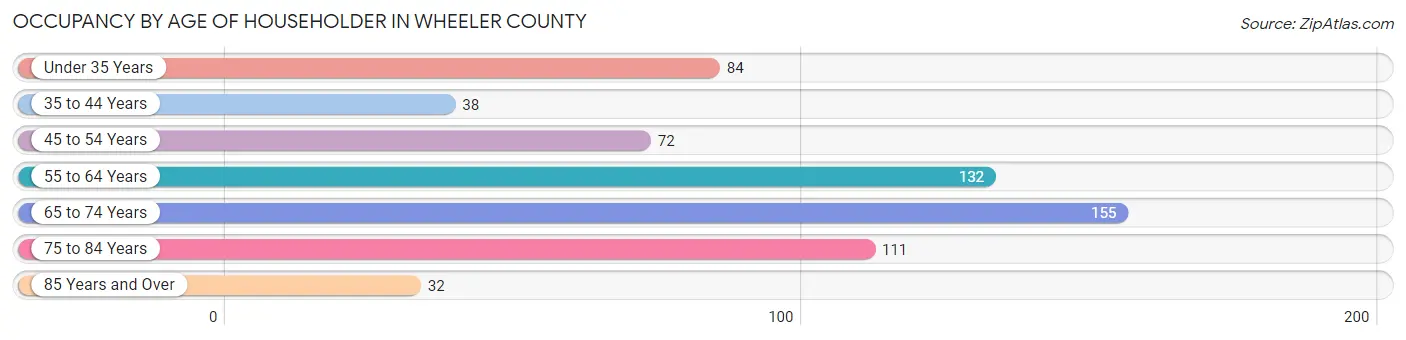
| Age Bracket | # Households | % Households |
| Under 35 Years | 84 | 13.5% |
| 35 to 44 Years | 38 | 6.1% |
| 45 to 54 Years | 72 | 11.5% |
| 55 to 64 Years | 132 | 21.1% |
| 65 to 74 Years | 155 | 24.8% |
| 75 to 84 Years | 111 | 17.8% |
| 85 Years and Over | 32 | 5.1% |
| Total | 624 | 100.0% |
Housing Finances in Wheeler County
Median Income by Occupancy in Wheeler County
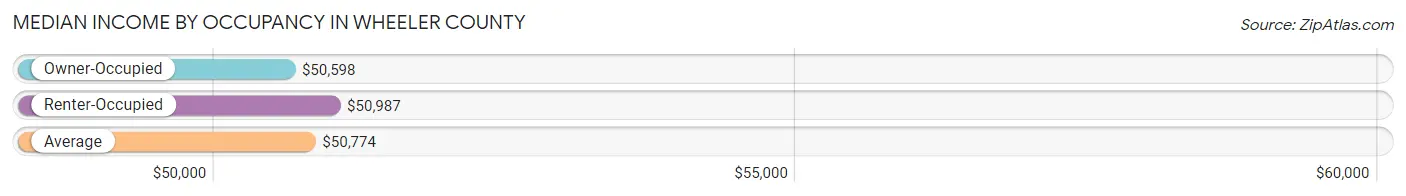
| Occupancy Type | # Households | Median Income |
| Owner-Occupied | 431 (69.1%) | $50,598 |
| Renter-Occupied | 193 (30.9%) | $50,987 |
| Average | 624 (100.0%) | $50,774 |
Occupancy by Householder Income Bracket in Wheeler County
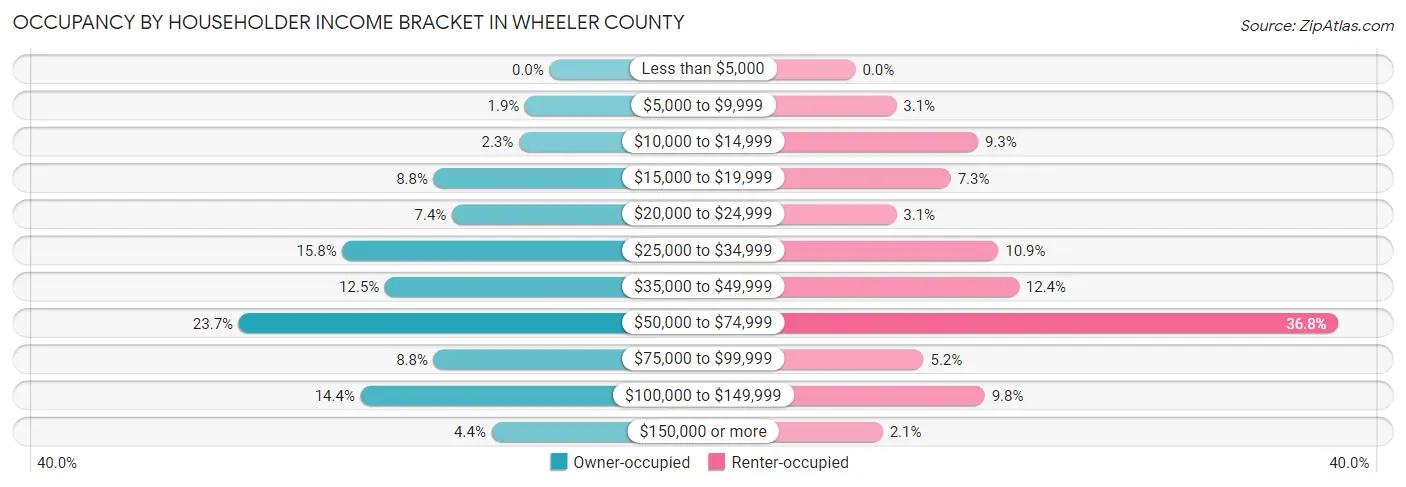
| Income Bracket | Owner-occupied | Renter-occupied |
| Less than $5,000 | 0 (0.0%) | 0 (0.0%) |
| $5,000 to $9,999 | 8 (1.9%) | 6 (3.1%) |
| $10,000 to $14,999 | 10 (2.3%) | 18 (9.3%) |
| $15,000 to $19,999 | 38 (8.8%) | 14 (7.2%) |
| $20,000 to $24,999 | 32 (7.4%) | 6 (3.1%) |
| $25,000 to $34,999 | 68 (15.8%) | 21 (10.9%) |
| $35,000 to $49,999 | 54 (12.5%) | 24 (12.4%) |
| $50,000 to $74,999 | 102 (23.7%) | 71 (36.8%) |
| $75,000 to $99,999 | 38 (8.8%) | 10 (5.2%) |
| $100,000 to $149,999 | 62 (14.4%) | 19 (9.8%) |
| $150,000 or more | 19 (4.4%) | 4 (2.1%) |
| Total | 431 (100.0%) | 193 (100.0%) |
Monthly Housing Cost Tiers in Wheeler County
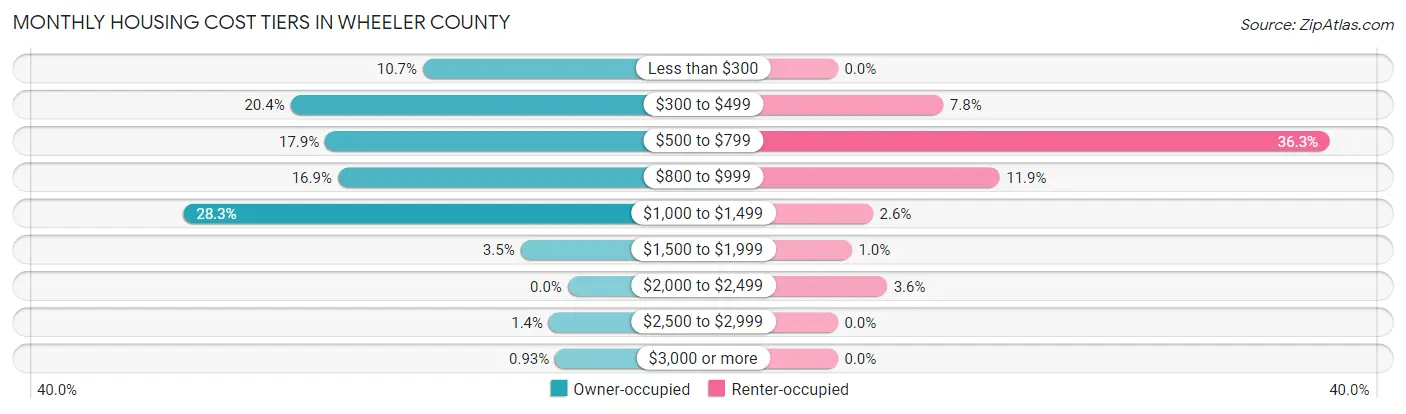
| Monthly Cost | Owner-occupied | Renter-occupied |
| Less than $300 | 46 (10.7%) | 0 (0.0%) |
| $300 to $499 | 88 (20.4%) | 15 (7.8%) |
| $500 to $799 | 77 (17.9%) | 70 (36.3%) |
| $800 to $999 | 73 (16.9%) | 23 (11.9%) |
| $1,000 to $1,499 | 122 (28.3%) | 5 (2.6%) |
| $1,500 to $1,999 | 15 (3.5%) | 2 (1.0%) |
| $2,000 to $2,499 | 0 (0.0%) | 7 (3.6%) |
| $2,500 to $2,999 | 6 (1.4%) | 0 (0.0%) |
| $3,000 or more | 4 (0.9%) | 0 (0.0%) |
| Total | 431 (100.0%) | 193 (100.0%) |
Physical Housing Characteristics in Wheeler County
Housing Structures in Wheeler County
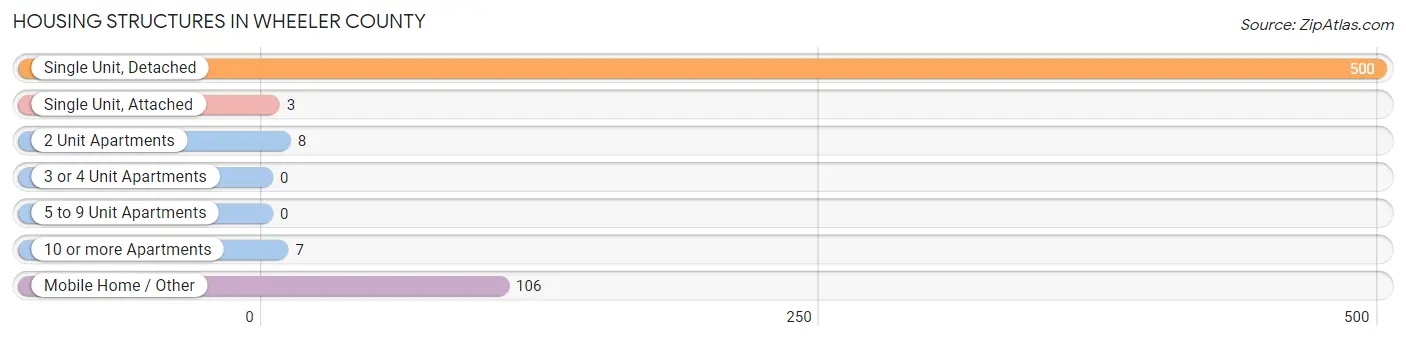
| Structure Type | # Housing Units | % Housing Units |
| Single Unit, Detached | 500 | 80.1% |
| Single Unit, Attached | 3 | 0.5% |
| 2 Unit Apartments | 8 | 1.3% |
| 3 or 4 Unit Apartments | 0 | 0.0% |
| 5 to 9 Unit Apartments | 0 | 0.0% |
| 10 or more Apartments | 7 | 1.1% |
| Mobile Home / Other | 106 | 17.0% |
| Total | 624 | 100.0% |
Housing Structures by Occupancy in Wheeler County
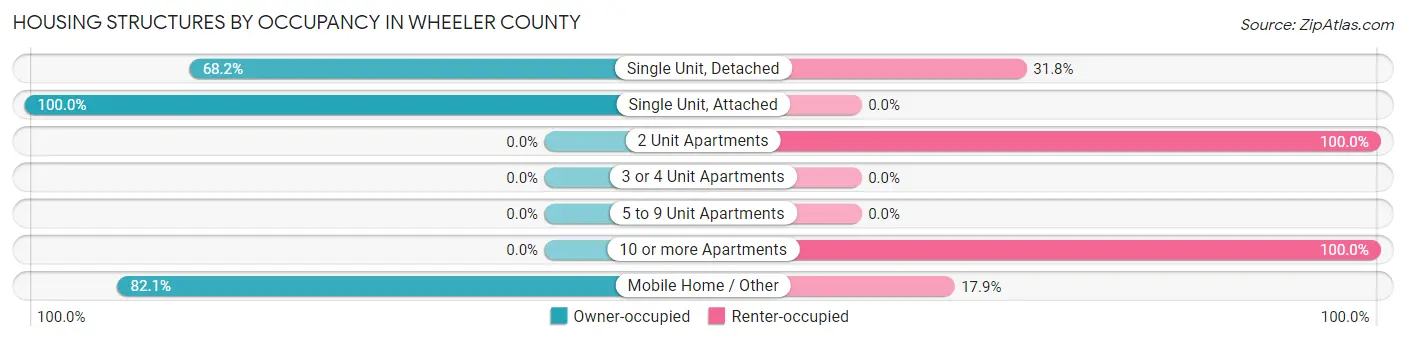
| Structure Type | Owner-occupied | Renter-occupied |
| Single Unit, Detached | 341 (68.2%) | 159 (31.8%) |
| Single Unit, Attached | 3 (100.0%) | 0 (0.0%) |
| 2 Unit Apartments | 0 (0.0%) | 8 (100.0%) |
| 3 or 4 Unit Apartments | 0 (0.0%) | 0 (0.0%) |
| 5 to 9 Unit Apartments | 0 (0.0%) | 0 (0.0%) |
| 10 or more Apartments | 0 (0.0%) | 7 (100.0%) |
| Mobile Home / Other | 87 (82.1%) | 19 (17.9%) |
| Total | 431 (69.1%) | 193 (30.9%) |
Housing Structures by Number of Rooms in Wheeler County
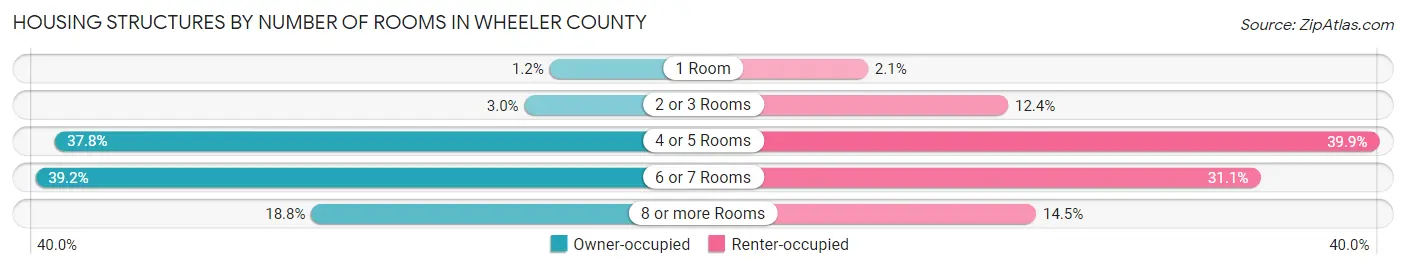
| Number of Rooms | Owner-occupied | Renter-occupied |
| 1 Room | 5 (1.2%) | 4 (2.1%) |
| 2 or 3 Rooms | 13 (3.0%) | 24 (12.4%) |
| 4 or 5 Rooms | 163 (37.8%) | 77 (39.9%) |
| 6 or 7 Rooms | 169 (39.2%) | 60 (31.1%) |
| 8 or more Rooms | 81 (18.8%) | 28 (14.5%) |
| Total | 431 (100.0%) | 193 (100.0%) |
Housing Structure by Heating Type in Wheeler County
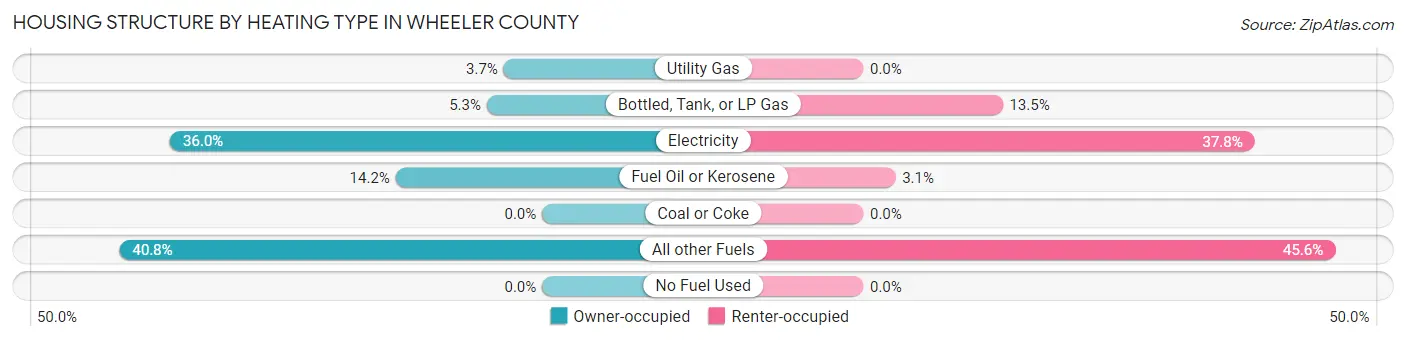
| Heating Type | Owner-occupied | Renter-occupied |
| Utility Gas | 16 (3.7%) | 0 (0.0%) |
| Bottled, Tank, or LP Gas | 23 (5.3%) | 26 (13.5%) |
| Electricity | 155 (36.0%) | 73 (37.8%) |
| Fuel Oil or Kerosene | 61 (14.1%) | 6 (3.1%) |
| Coal or Coke | 0 (0.0%) | 0 (0.0%) |
| All other Fuels | 176 (40.8%) | 88 (45.6%) |
| No Fuel Used | 0 (0.0%) | 0 (0.0%) |
| Total | 431 (100.0%) | 193 (100.0%) |
Household Vehicle Usage in Wheeler County
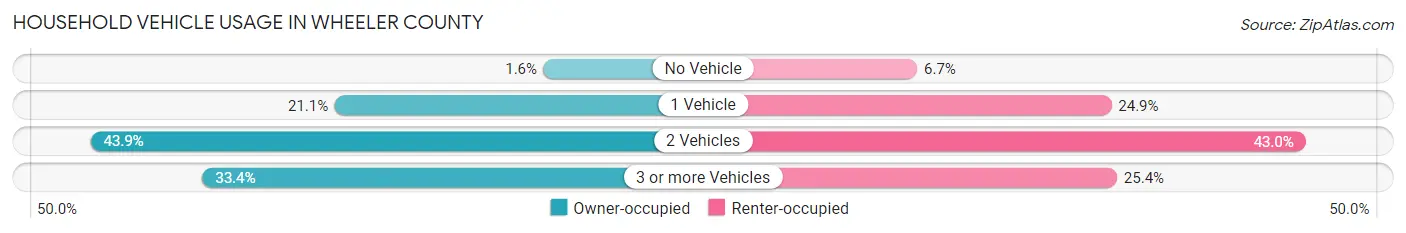
| Vehicles per Household | Owner-occupied | Renter-occupied |
| No Vehicle | 7 (1.6%) | 13 (6.7%) |
| 1 Vehicle | 91 (21.1%) | 48 (24.9%) |
| 2 Vehicles | 189 (43.9%) | 83 (43.0%) |
| 3 or more Vehicles | 144 (33.4%) | 49 (25.4%) |
| Total | 431 (100.0%) | 193 (100.0%) |
Real Estate & Mortgages in Wheeler County
Real Estate and Mortgage Overview in Wheeler County
| Characteristic | Without Mortgage | With Mortgage |
| Housing Units | 228 | 203 |
| Median Property Value | $182,100 | $234,400 |
| Median Household Income | $35,833 | $10 |
| Monthly Housing Costs | $397 | $4 |
| Real Estate Taxes | $1,302 | $6 |
Property Value by Mortgage Status in Wheeler County
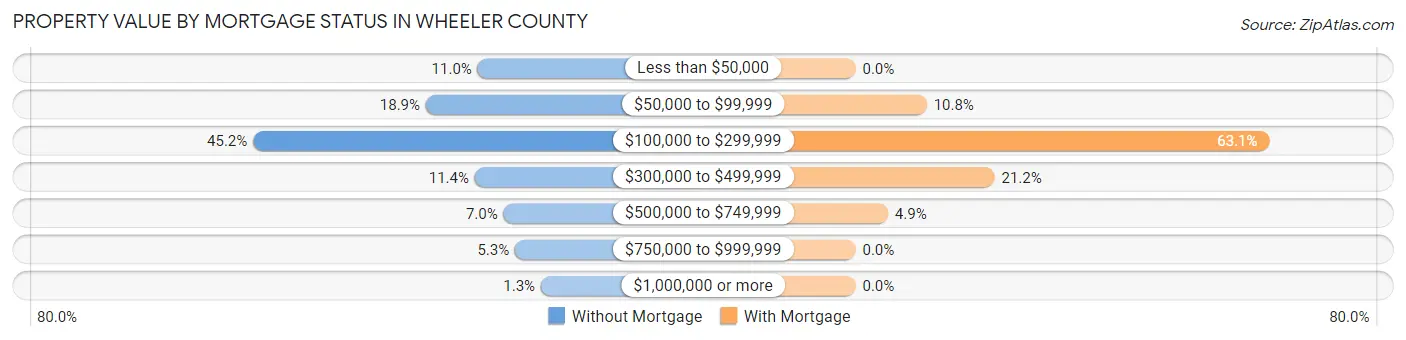
| Property Value | Without Mortgage | With Mortgage |
| Less than $50,000 | 25 (11.0%) | 0 (0.0%) |
| $50,000 to $99,999 | 43 (18.9%) | 22 (10.8%) |
| $100,000 to $299,999 | 103 (45.2%) | 128 (63.0%) |
| $300,000 to $499,999 | 26 (11.4%) | 43 (21.2%) |
| $500,000 to $749,999 | 16 (7.0%) | 10 (4.9%) |
| $750,000 to $999,999 | 12 (5.3%) | 0 (0.0%) |
| $1,000,000 or more | 3 (1.3%) | 0 (0.0%) |
| Total | 228 (100.0%) | 203 (100.0%) |
Household Income by Mortgage Status in Wheeler County
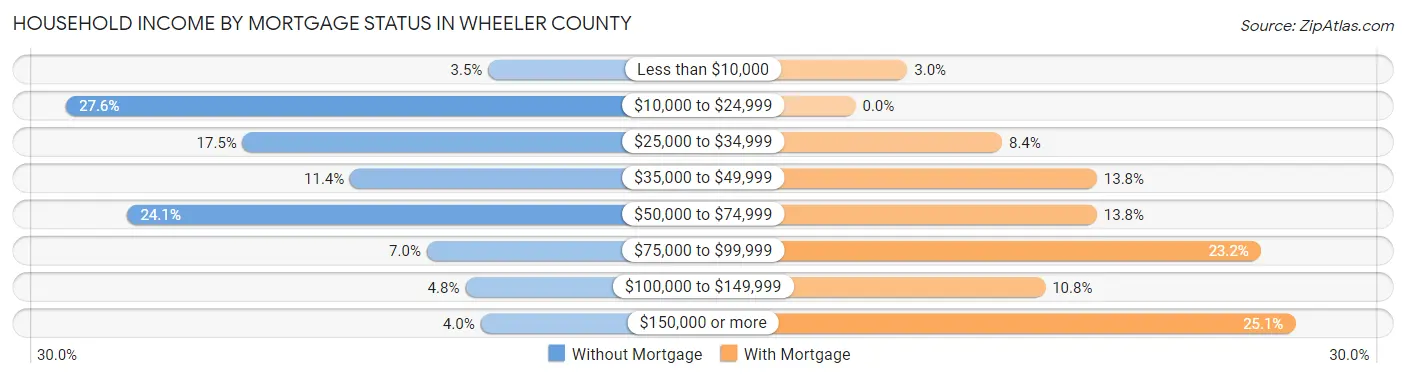
| Household Income | Without Mortgage | With Mortgage |
| Less than $10,000 | 8 (3.5%) | 6 (3.0%) |
| $10,000 to $24,999 | 63 (27.6%) | 0 (0.0%) |
| $25,000 to $34,999 | 40 (17.5%) | 17 (8.4%) |
| $35,000 to $49,999 | 26 (11.4%) | 28 (13.8%) |
| $50,000 to $74,999 | 55 (24.1%) | 28 (13.8%) |
| $75,000 to $99,999 | 16 (7.0%) | 47 (23.2%) |
| $100,000 to $149,999 | 11 (4.8%) | 22 (10.8%) |
| $150,000 or more | 9 (4.0%) | 51 (25.1%) |
| Total | 228 (100.0%) | 203 (100.0%) |
Property Value to Household Income Ratio in Wheeler County
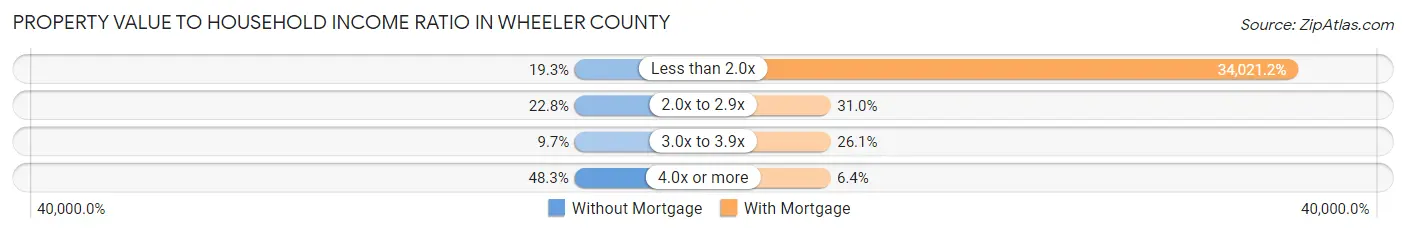
| Value-to-Income Ratio | Without Mortgage | With Mortgage |
| Less than 2.0x | 44 (19.3%) | 69,063 (34,021.2%) |
| 2.0x to 2.9x | 52 (22.8%) | 63 (31.0%) |
| 3.0x to 3.9x | 22 (9.7%) | 53 (26.1%) |
| 4.0x or more | 110 (48.2%) | 13 (6.4%) |
| Total | 228 (100.0%) | 203 (100.0%) |
Real Estate Taxes by Mortgage Status in Wheeler County
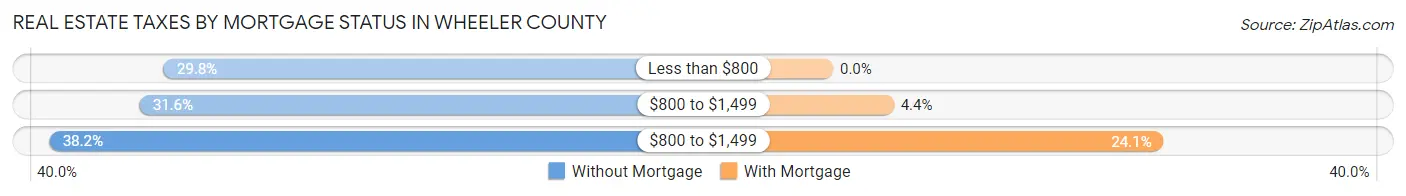
| Property Taxes | Without Mortgage | With Mortgage |
| Less than $800 | 68 (29.8%) | 0 (0.0%) |
| $800 to $1,499 | 72 (31.6%) | 9 (4.4%) |
| $800 to $1,499 | 87 (38.2%) | 49 (24.1%) |
| Total | 228 (100.0%) | 203 (100.0%) |
Health & Disability in Wheeler County
Health Insurance Coverage by Age in Wheeler County
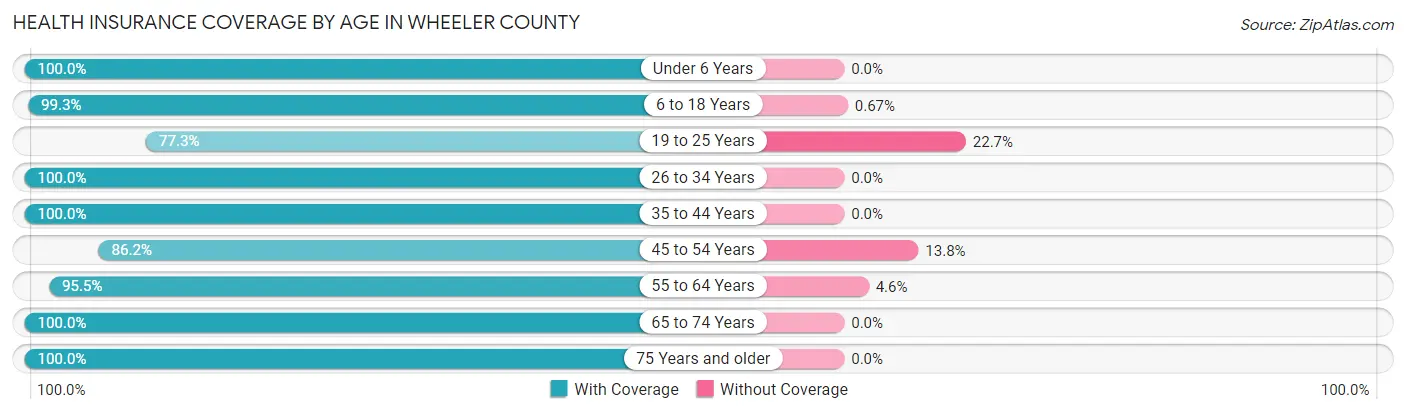
| Age Bracket | With Coverage | Without Coverage |
| Under 6 Years | 97 (100.0%) | 0 (0.0%) |
| 6 to 18 Years | 148 (99.3%) | 1 (0.7%) |
| 19 to 25 Years | 58 (77.3%) | 17 (22.7%) |
| 26 to 34 Years | 112 (100.0%) | 0 (0.0%) |
| 35 to 44 Years | 106 (100.0%) | 0 (0.0%) |
| 45 to 54 Years | 131 (86.2%) | 21 (13.8%) |
| 55 to 64 Years | 210 (95.5%) | 10 (4.5%) |
| 65 to 74 Years | 247 (100.0%) | 0 (0.0%) |
| 75 Years and older | 249 (100.0%) | 0 (0.0%) |
| Total | 1,358 (96.5%) | 49 (3.5%) |
Health Insurance Coverage by Citizenship Status in Wheeler County
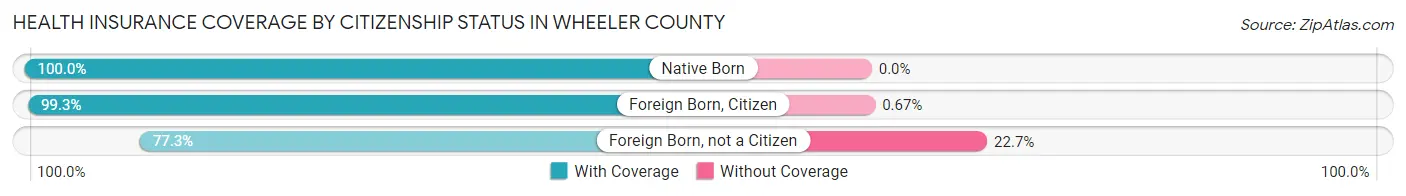
| Citizenship Status | With Coverage | Without Coverage |
| Native Born | 97 (100.0%) | 0 (0.0%) |
| Foreign Born, Citizen | 148 (99.3%) | 1 (0.7%) |
| Foreign Born, not a Citizen | 58 (77.3%) | 17 (22.7%) |
Health Insurance Coverage by Household Income in Wheeler County
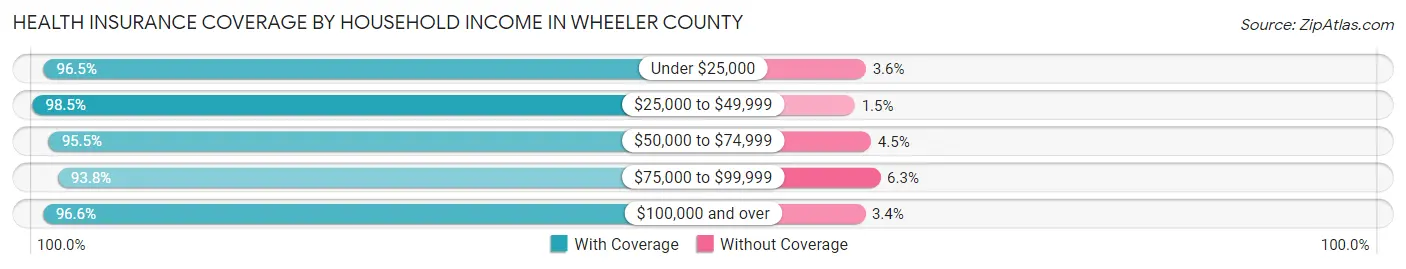
| Household Income | With Coverage | Without Coverage |
| Under $25,000 | 190 (96.5%) | 7 (3.5%) |
| $25,000 to $49,999 | 397 (98.5%) | 6 (1.5%) |
| $50,000 to $74,999 | 359 (95.5%) | 17 (4.5%) |
| $75,000 to $99,999 | 165 (93.8%) | 11 (6.2%) |
| $100,000 and over | 227 (96.6%) | 8 (3.4%) |
Public vs Private Health Insurance Coverage by Age in Wheeler County
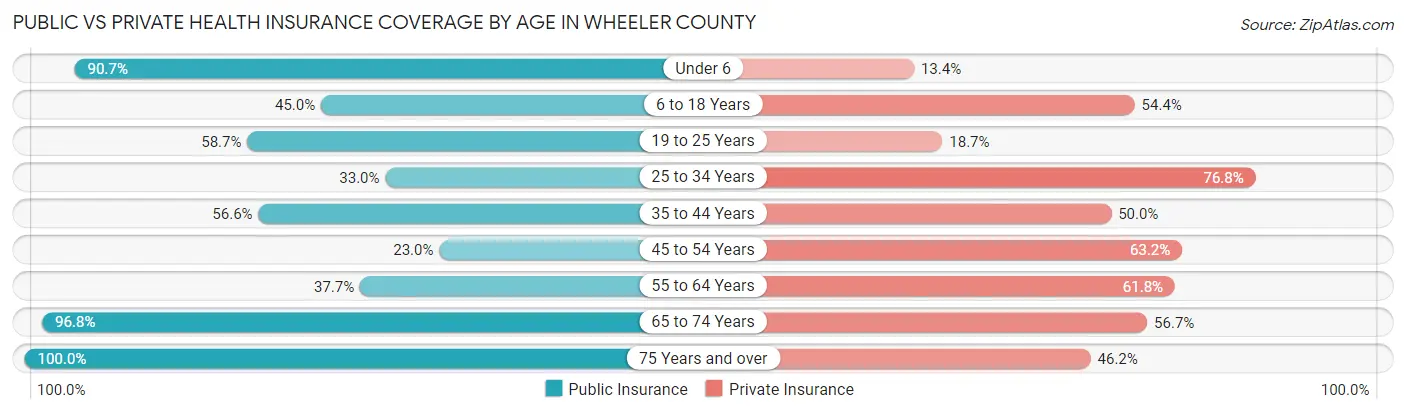
| Age Bracket | Public Insurance | Private Insurance |
| Under 6 | 88 (90.7%) | 13 (13.4%) |
| 6 to 18 Years | 67 (45.0%) | 81 (54.4%) |
| 19 to 25 Years | 44 (58.7%) | 14 (18.7%) |
| 25 to 34 Years | 37 (33.0%) | 86 (76.8%) |
| 35 to 44 Years | 60 (56.6%) | 53 (50.0%) |
| 45 to 54 Years | 35 (23.0%) | 96 (63.2%) |
| 55 to 64 Years | 83 (37.7%) | 136 (61.8%) |
| 65 to 74 Years | 239 (96.8%) | 140 (56.7%) |
| 75 Years and over | 249 (100.0%) | 115 (46.2%) |
| Total | 902 (64.1%) | 734 (52.2%) |
Disability Status by Sex by Age in Wheeler County
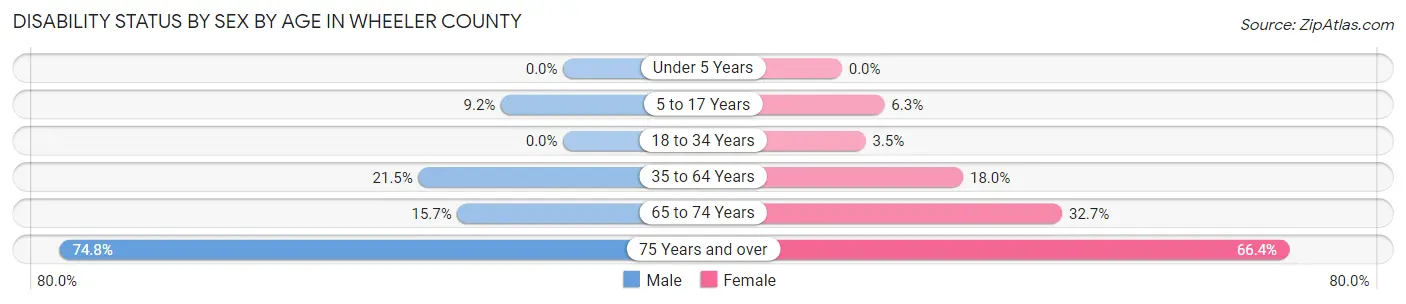
| Age Bracket | Male | Female |
| Under 5 Years | 0 (0.0%) | 0 (0.0%) |
| 5 to 17 Years | 6 (9.2%) | 5 (6.3%) |
| 18 to 34 Years | 0 (0.0%) | 4 (3.5%) |
| 35 to 64 Years | 49 (21.5%) | 45 (18.0%) |
| 65 to 74 Years | 22 (15.7%) | 35 (32.7%) |
| 75 Years and over | 95 (74.8%) | 81 (66.4%) |
Disability Class by Sex by Age in Wheeler County
Disability Class: Hearing Difficulty
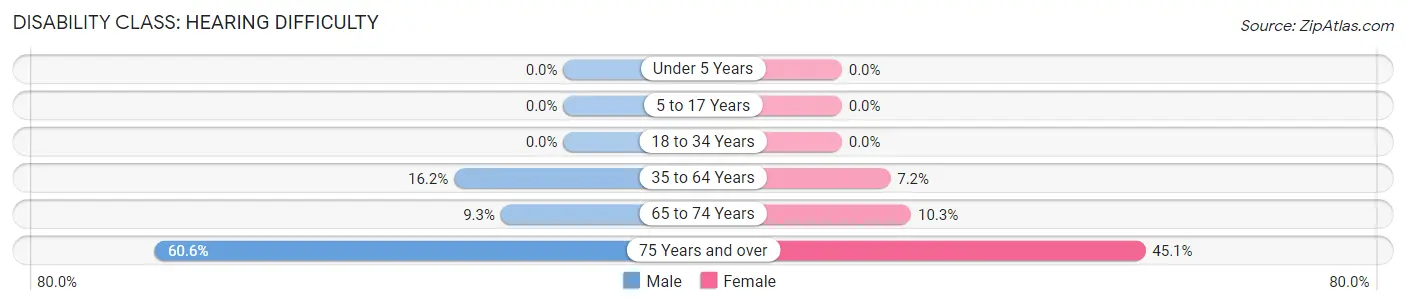
| Age Bracket | Male | Female |
| Under 5 Years | 0 (0.0%) | 0 (0.0%) |
| 5 to 17 Years | 0 (0.0%) | 0 (0.0%) |
| 18 to 34 Years | 0 (0.0%) | 0 (0.0%) |
| 35 to 64 Years | 37 (16.2%) | 18 (7.2%) |
| 65 to 74 Years | 13 (9.3%) | 11 (10.3%) |
| 75 Years and over | 77 (60.6%) | 55 (45.1%) |
Disability Class: Vision Difficulty
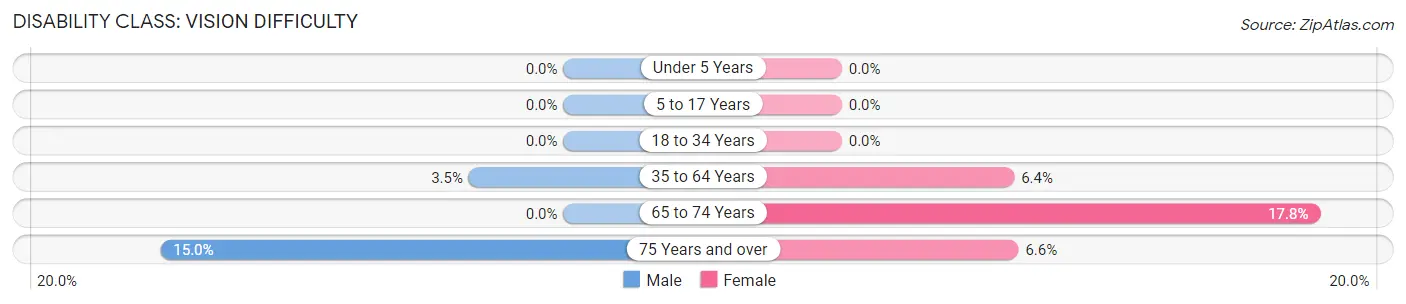
| Age Bracket | Male | Female |
| Under 5 Years | 0 (0.0%) | 0 (0.0%) |
| 5 to 17 Years | 0 (0.0%) | 0 (0.0%) |
| 18 to 34 Years | 0 (0.0%) | 0 (0.0%) |
| 35 to 64 Years | 8 (3.5%) | 16 (6.4%) |
| 65 to 74 Years | 0 (0.0%) | 19 (17.8%) |
| 75 Years and over | 19 (15.0%) | 8 (6.6%) |
Disability Class: Cognitive Difficulty
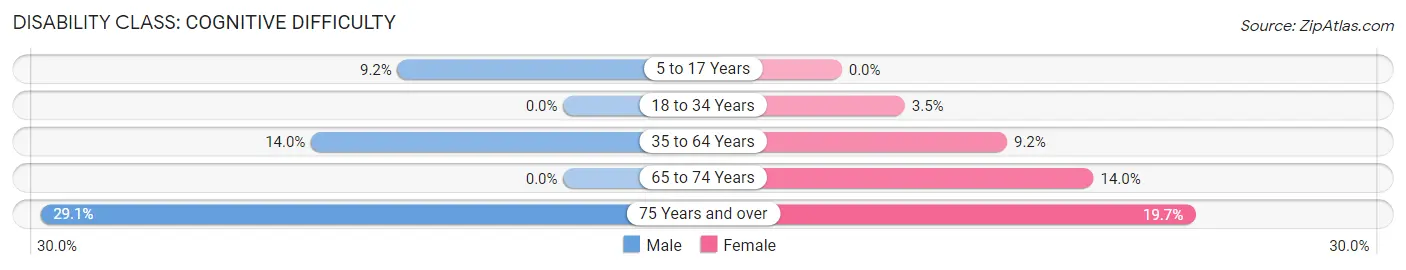
| Age Bracket | Male | Female |
| 5 to 17 Years | 6 (9.2%) | 0 (0.0%) |
| 18 to 34 Years | 0 (0.0%) | 4 (3.5%) |
| 35 to 64 Years | 32 (14.0%) | 23 (9.2%) |
| 65 to 74 Years | 0 (0.0%) | 15 (14.0%) |
| 75 Years and over | 37 (29.1%) | 24 (19.7%) |
Disability Class: Ambulatory Difficulty
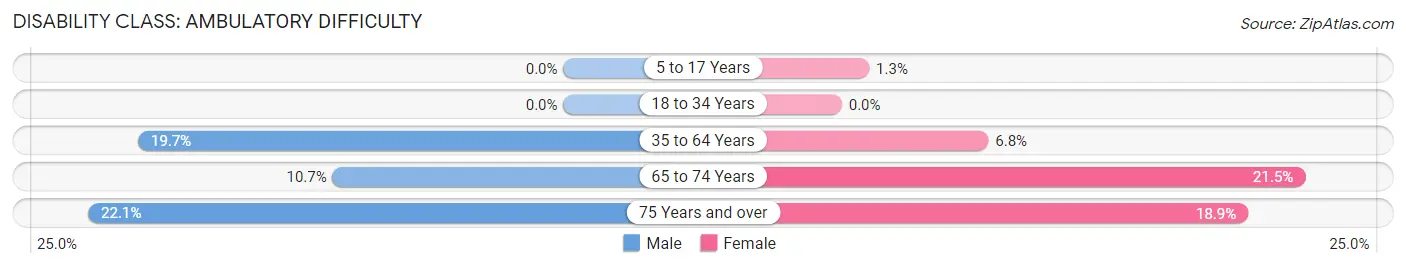
| Age Bracket | Male | Female |
| 5 to 17 Years | 0 (0.0%) | 1 (1.3%) |
| 18 to 34 Years | 0 (0.0%) | 0 (0.0%) |
| 35 to 64 Years | 45 (19.7%) | 17 (6.8%) |
| 65 to 74 Years | 15 (10.7%) | 23 (21.5%) |
| 75 Years and over | 28 (22.1%) | 23 (18.9%) |
Disability Class: Self-Care Difficulty
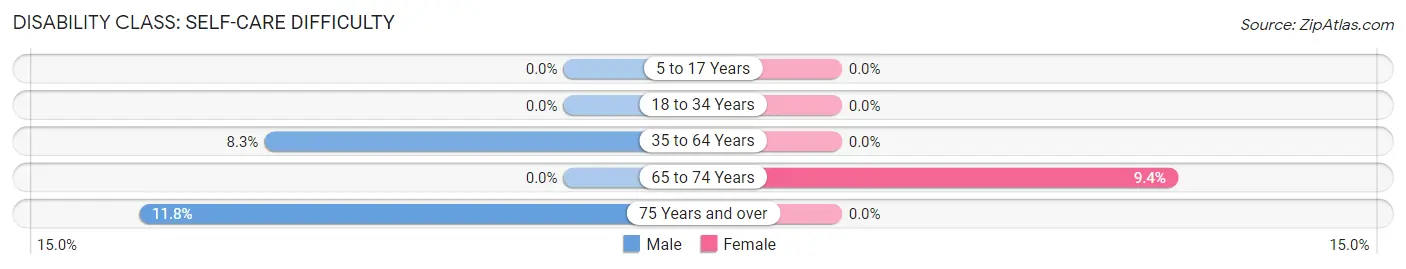
| Age Bracket | Male | Female |
| 5 to 17 Years | 0 (0.0%) | 0 (0.0%) |
| 18 to 34 Years | 0 (0.0%) | 0 (0.0%) |
| 35 to 64 Years | 19 (8.3%) | 0 (0.0%) |
| 65 to 74 Years | 0 (0.0%) | 10 (9.3%) |
| 75 Years and over | 15 (11.8%) | 0 (0.0%) |
Technology Access in Wheeler County
Computing Device Access in Wheeler County

| Device Type | # Households | % Households |
| Desktop or Laptop | 489 | 78.4% |
| Smartphone | 453 | 72.6% |
| Tablet | 411 | 65.9% |
| No Computing Device | 52 | 8.3% |
| Total | 624 | 100.0% |
Internet Access in Wheeler County
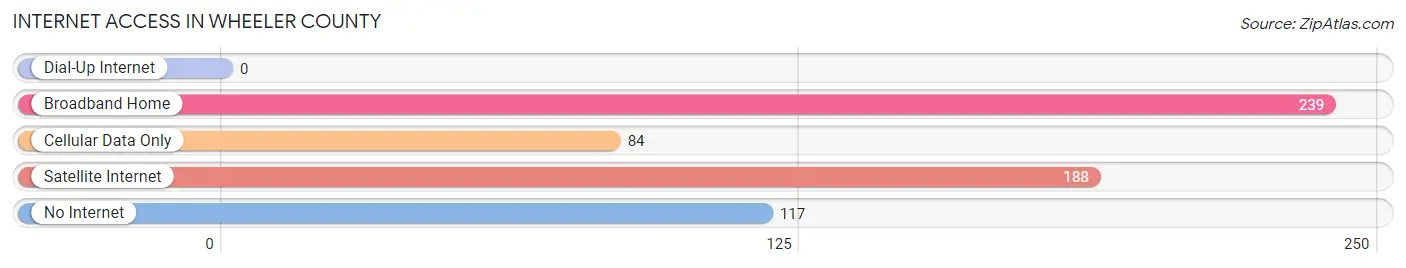
| Internet Type | # Households | % Households |
| Dial-Up Internet | 0 | 0.0% |
| Broadband Home | 239 | 38.3% |
| Cellular Data Only | 84 | 13.5% |
| Satellite Internet | 188 | 30.1% |
| No Internet | 117 | 18.8% |
| Total | 624 | 100.0% |
Wheeler County Summary
Wheeler County is located in the eastern part of the U.S. state of Oregon. It is bordered by Grant County to the north, Crook County to the east, Jefferson County to the south, and Gilliam County to the west. The county seat is Fossil, and the largest city is Mitchell. The county has a total area of 1,741 square miles, of which 1,737 square miles is land and 4.2 square miles is water.
History
Wheeler County was created in 1899 from the eastern portion of Crook County. It was named after Henry H. Wheeler, a prominent Oregon politician. The county was originally populated by Native American tribes, including the Umatilla, Wasco, and Warm Springs.
The first settlers in the area were ranchers and farmers, who arrived in the late 1800s. The county was largely agricultural until the early 1900s, when the discovery of gold and other minerals in the area led to a mining boom. The boom lasted until the 1930s, when the Great Depression caused the mines to close.
Geography
Wheeler County is located in the Blue Mountains region of Oregon. The county is mostly mountainous, with elevations ranging from 2,000 to 8,000 feet. The highest point in the county is the summit of Lookout Mountain, at 8,068 feet. The county is home to several rivers, including the John Day, Deschutes, and Crooked Rivers.
The climate of Wheeler County is semi-arid, with hot summers and cold winters. The average annual precipitation is around 12 inches.
Economy
The economy of Wheeler County is largely based on agriculture and tourism. The county is home to several large cattle ranches, as well as several smaller farms. The county is also home to several tourist attractions, including the John Day Fossil Beds National Monument and the Painted Hills.
Demographics
As of the 2010 census, the population of Wheeler County was 1,441, with a population density of 0.8 people per square mile. The racial makeup of the county was 94.3% White, 0.2% African American, 0.7% Native American, 0.2% Asian, 0.1% Pacific Islander, 0.2% from other races, and 4.3% from two or more races. Hispanic or Latino of any race were 1.3% of the population.
The median income for a household in the county was $31,250, and the median income for a family was $35,000. The per capita income for the county was $15,945. About 16.2% of families and 19.2% of the population were below the poverty line, including 25.2% of those under age 18 and 10.2% of those age 65 or over.
Common Questions
What is the Total Population of Wheeler County?
Total Population of Wheeler County is 1,407.
What is the Total Male Population of Wheeler County?
Total Male Population of Wheeler County is 694.
What is the Total Female Population of Wheeler County?
Total Female Population of Wheeler County is 713.
What is the Ratio of Males per 100 Females in Wheeler County?
There are 97.34 Males per 100 Females in Wheeler County.
What is the Ratio of Females per 100 Males in Wheeler County?
There are 102.74 Females per 100 Males in Wheeler County.
What is the Median Population Age in Wheeler County?
Median Population Age in Wheeler County is 56.1 Years.
What is the Average Family Size in Wheeler County
Average Family Size in Wheeler County is 2.8 People.
What is the Average Household Size in Wheeler County
Average Household Size in Wheeler County is 2.2 People.
What is Per Capita Income in Wheeler County?
Per Capita income in Wheeler County is $27,847.
What is the Median Family Income in Wheeler County?
Median Family Income in Wheeler County is $63,125.
What is the Median Household income in Wheeler County?
Median Household Income in Wheeler County is $50,774.
What is Income or Wage Gap in Wheeler County?
Income or Wage Gap in Wheeler County is 7.1%.
Women in Wheeler County earn 92.9 cents for every dollar earned by a man.
What is Family Income Deficit in Wheeler County?
Family Income Deficit in Wheeler County is $3,771.
Families that are below poverty line in Wheeler County earn $3,771 less on average than the poverty threshold level.
What is Inequality or Gini Index in Wheeler County?
Inequality or Gini Index in Wheeler County is 0.40.
How Large is the Labor Force in Wheeler County?
There are 521 People in the Labor Forcein in Wheeler County.
What is the Percentage of People in the Labor Force in Wheeler County?
43.4% of People are in the Labor Force in Wheeler County.
What is the Unemployment Rate in Wheeler County?
Unemployment Rate in Wheeler County is 5.4%.