Washington County, OR
Washington County Overview
599,541
TOTAL POPULATION
299,671
MALE POPULATION
299,870
FEMALE POPULATION
99.93
MALES / 100 FEMALES
100.07
FEMALES / 100 MALES
37.5
MEDIAN AGE
3.1
AVG FAMILY SIZE
2.6
AVG HOUSEHOLD SIZE
$49,553
PER CAPITA INCOME
$119,312
AVG FAMILY INCOME
$100,121
AVG HOUSEHOLD INCOME
31.3%
WAGE / INCOME GAP [ % ]
68.7¢/ $1
WAGE / INCOME GAP [ $ ]
$11,090
FAMILY INCOME DEFICIT
0.43
INEQUALITY / GINI INDEX
332,498
LABOR FORCE [ PEOPLE ]
68.9%
PERCENT IN LABOR FORCE
4.6%
UNEMPLOYMENT RATE
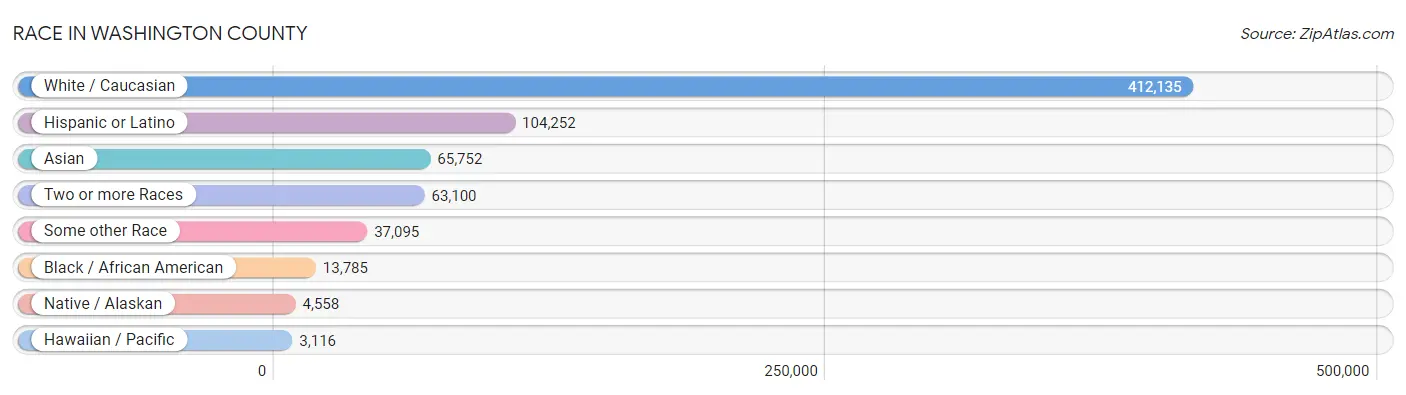
Race in Washington County
The most populous races in Washington County are White / Caucasian (412,135 | 68.7%), Hispanic or Latino (104,252 | 17.4%), and Asian (65,752 | 11.0%).
| Race | # Population | % Population |
| Asian | 65,752 | 11.0% |
| Black / African American | 13,785 | 2.3% |
| Hawaiian / Pacific | 3,116 | 0.5% |
| Hispanic or Latino | 104,252 | 17.4% |
| Native / Alaskan | 4,558 | 0.8% |
| White / Caucasian | 412,135 | 68.7% |
| Two or more Races | 63,100 | 10.5% |
| Some other Race | 37,095 | 6.2% |
| Total | 599,541 | 100.0% |
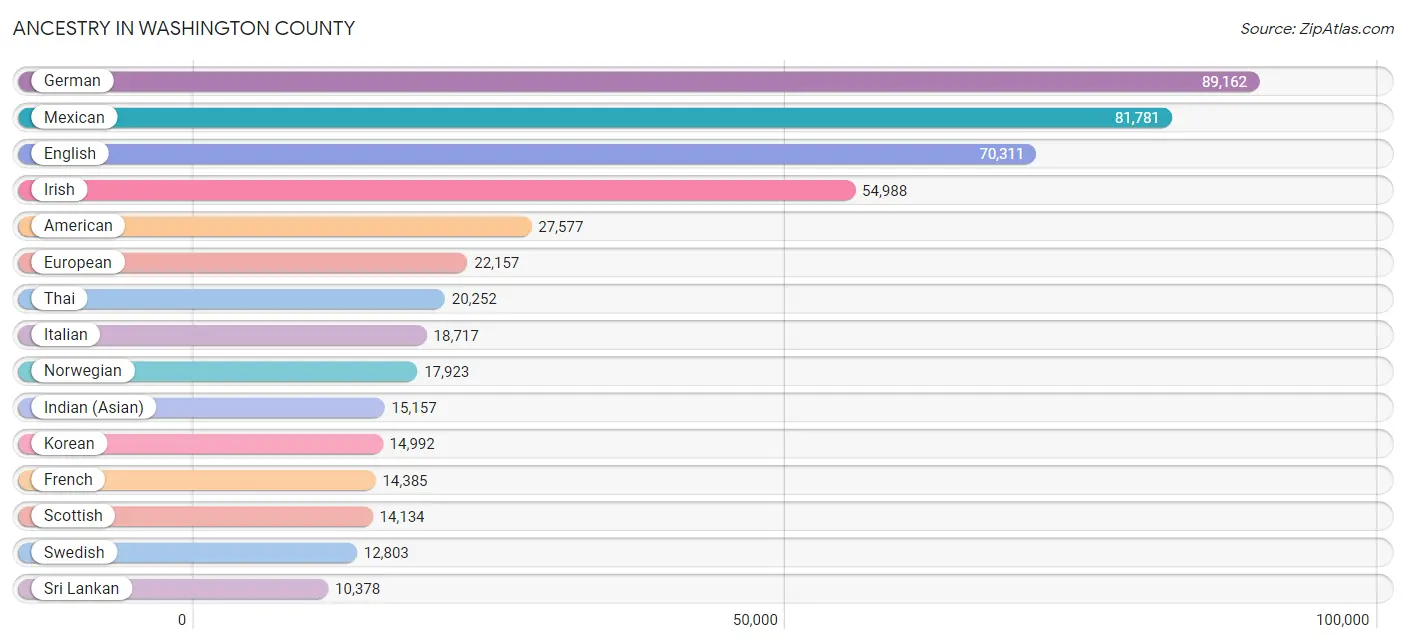
Ancestry in Washington County
The most populous ancestries reported in Washington County are German (89,162 | 14.9%), Mexican (81,781 | 13.6%), English (70,311 | 11.7%), Irish (54,988 | 9.2%), and American (27,577 | 4.6%), together accounting for 54.0% of all Washington County residents.
| Ancestry | # Population | % Population |
| Afghan | 660 | 0.1% |
| African | 2,088 | 0.4% |
| Alaska Native | 14 | 0.0% |
| Albanian | 65 | 0.0% |
| Aleut | 66 | 0.0% |
| Alsatian | 36 | 0.0% |
| American | 27,577 | 4.6% |
| Apache | 136 | 0.0% |
| Arab | 6,087 | 1.0% |
| Argentinean | 184 | 0.0% |
| Armenian | 605 | 0.1% |
| Assyrian / Chaldean / Syriac | 125 | 0.0% |
| Australian | 355 | 0.1% |
| Austrian | 1,306 | 0.2% |
| Bahamian | 3 | 0.0% |
| Bangladeshi | 462 | 0.1% |
| Basque | 332 | 0.1% |
| Belgian | 894 | 0.2% |
| Belizean | 16 | 0.0% |
| Bhutanese | 9,469 | 1.6% |
| Blackfeet | 514 | 0.1% |
| Bolivian | 240 | 0.0% |
| Brazilian | 489 | 0.1% |
| British | 6,037 | 1.0% |
| Bulgarian | 275 | 0.1% |
| Burmese | 9,356 | 1.6% |
| Cajun | 41 | 0.0% |
| Cambodian | 107 | 0.0% |
| Canadian | 2,285 | 0.4% |
| Cape Verdean | 17 | 0.0% |
| Celtic | 185 | 0.0% |
| Central American | 7,635 | 1.3% |
| Central American Indian | 748 | 0.1% |
| Cherokee | 1,717 | 0.3% |
| Cheyenne | 56 | 0.0% |
| Chickasaw | 38 | 0.0% |
| Chilean | 246 | 0.0% |
| Chinese | 113 | 0.0% |
| Chippewa | 270 | 0.1% |
| Choctaw | 391 | 0.1% |
| Colombian | 739 | 0.1% |
| Colville | 34 | 0.0% |
| Comanche | 31 | 0.0% |
| Costa Rican | 583 | 0.1% |
| Cree | 19 | 0.0% |
| Creek | 72 | 0.0% |
| Croatian | 909 | 0.2% |
| Crow | 8 | 0.0% |
| Cuban | 1,445 | 0.2% |
| Cypriot | 13 | 0.0% |
| Czech | 2,345 | 0.4% |
| Czechoslovakian | 775 | 0.1% |
| Danish | 4,899 | 0.8% |
| Dominican | 599 | 0.1% |
| Dutch | 9,195 | 1.5% |
| Dutch West Indian | 9 | 0.0% |
| Eastern European | 1,750 | 0.3% |
| Ecuadorian | 694 | 0.1% |
| Egyptian | 361 | 0.1% |
| English | 70,311 | 11.7% |
| Estonian | 93 | 0.0% |
| Ethiopian | 614 | 0.1% |
| European | 22,157 | 3.7% |
| Fijian | 205 | 0.0% |
| Filipino | 1,232 | 0.2% |
| Finnish | 3,117 | 0.5% |
| French | 14,385 | 2.4% |
| French American Indian | 339 | 0.1% |
| French Canadian | 2,428 | 0.4% |
| German | 89,162 | 14.9% |
| German Russian | 4 | 0.0% |
| Ghanaian | 455 | 0.1% |
| Greek | 2,335 | 0.4% |
| Guamanian / Chamorro | 1,163 | 0.2% |
| Guatemalan | 4,402 | 0.7% |
| Guyanese | 22 | 0.0% |
| Haitian | 380 | 0.1% |
| Hmong | 10 | 0.0% |
| Honduran | 407 | 0.1% |
| Hopi | 1 | 0.0% |
| Houma | 17 | 0.0% |
| Hungarian | 2,242 | 0.4% |
| Icelander | 125 | 0.0% |
| Indian (Asian) | 15,157 | 2.5% |
| Indonesian | 63 | 0.0% |
| Inupiat | 47 | 0.0% |
| Iranian | 2,728 | 0.5% |
| Iraqi | 1,229 | 0.2% |
| Irish | 54,988 | 9.2% |
| Iroquois | 27 | 0.0% |
| Israeli | 677 | 0.1% |
| Italian | 18,717 | 3.1% |
| Jamaican | 668 | 0.1% |
| Japanese | 1,850 | 0.3% |
| Jordanian | 128 | 0.0% |
| Kenyan | 277 | 0.1% |
| Kiowa | 6 | 0.0% |
| Korean | 14,992 | 2.5% |
| Laotian | 420 | 0.1% |
| Latvian | 129 | 0.0% |
| Lebanese | 1,561 | 0.3% |
| Liberian | 37 | 0.0% |
| Lithuanian | 647 | 0.1% |
| Lumbee | 29 | 0.0% |
| Luxembourger | 103 | 0.0% |
| Macedonian | 177 | 0.0% |
| Malaysian | 808 | 0.1% |
| Maltese | 54 | 0.0% |
| Mexican | 81,781 | 13.6% |
| Mexican American Indian | 2,075 | 0.4% |
| Mongolian | 115 | 0.0% |
| Moroccan | 351 | 0.1% |
| Native Hawaiian | 4,659 | 0.8% |
| Navajo | 394 | 0.1% |
| Nepalese | 101 | 0.0% |
| New Zealander | 279 | 0.1% |
| Nicaraguan | 208 | 0.0% |
| Nigerian | 618 | 0.1% |
| Northern European | 3,335 | 0.6% |
| Norwegian | 17,923 | 3.0% |
| Okinawan | 71 | 0.0% |
| Osage | 15 | 0.0% |
| Ottawa | 4 | 0.0% |
| Paiute | 136 | 0.0% |
| Pakistani | 1,180 | 0.2% |
| Palestinian | 275 | 0.1% |
| Panamanian | 464 | 0.1% |
| Paraguayan | 27 | 0.0% |
| Pennsylvania German | 75 | 0.0% |
| Peruvian | 909 | 0.2% |
| Polish | 9,632 | 1.6% |
| Portuguese | 2,011 | 0.3% |
| Potawatomi | 54 | 0.0% |
| Pueblo | 91 | 0.0% |
| Puerto Rican | 2,442 | 0.4% |
| Puget Sound Salish | 39 | 0.0% |
| Romanian | 1,993 | 0.3% |
| Russian | 4,440 | 0.7% |
| Salvadoran | 1,522 | 0.3% |
| Samoan | 754 | 0.1% |
| Scandinavian | 5,088 | 0.9% |
| Scotch-Irish | 5,692 | 0.9% |
| Scottish | 14,134 | 2.4% |
| Seminole | 7 | 0.0% |
| Senegalese | 123 | 0.0% |
| Serbian | 726 | 0.1% |
| Shoshone | 67 | 0.0% |
| Sioux | 438 | 0.1% |
| Slavic | 255 | 0.0% |
| Slovak | 480 | 0.1% |
| Slovene | 375 | 0.1% |
| Somali | 1,131 | 0.2% |
| South African | 184 | 0.0% |
| South American | 4,449 | 0.7% |
| South American Indian | 191 | 0.0% |
| Soviet Union | 84 | 0.0% |
| Spaniard | 2,084 | 0.4% |
| Spanish | 1,804 | 0.3% |
| Spanish American | 70 | 0.0% |
| Spanish American Indian | 40 | 0.0% |
| Sri Lankan | 10,378 | 1.7% |
| Subsaharan African | 5,837 | 1.0% |
| Sudanese | 58 | 0.0% |
| Swedish | 12,803 | 2.1% |
| Swiss | 3,758 | 0.6% |
| Syrian | 105 | 0.0% |
| Taiwanese | 7 | 0.0% |
| Thai | 20,252 | 3.4% |
| Tlingit-Haida | 181 | 0.0% |
| Tongan | 15 | 0.0% |
| Trinidadian and Tobagonian | 51 | 0.0% |
| Tsimshian | 23 | 0.0% |
| Turkish | 905 | 0.2% |
| Ugandan | 35 | 0.0% |
| Ukrainian | 2,436 | 0.4% |
| Uruguayan | 403 | 0.1% |
| Ute | 7 | 0.0% |
| Venezuelan | 1,007 | 0.2% |
| Vietnamese | 560 | 0.1% |
| Welsh | 4,717 | 0.8% |
| West Indian | 220 | 0.0% |
| Yakama | 98 | 0.0% |
| Yaqui | 221 | 0.0% |
| Yugoslavian | 367 | 0.1% |
| Yup'ik | 47 | 0.0% | View All 185 Rows |
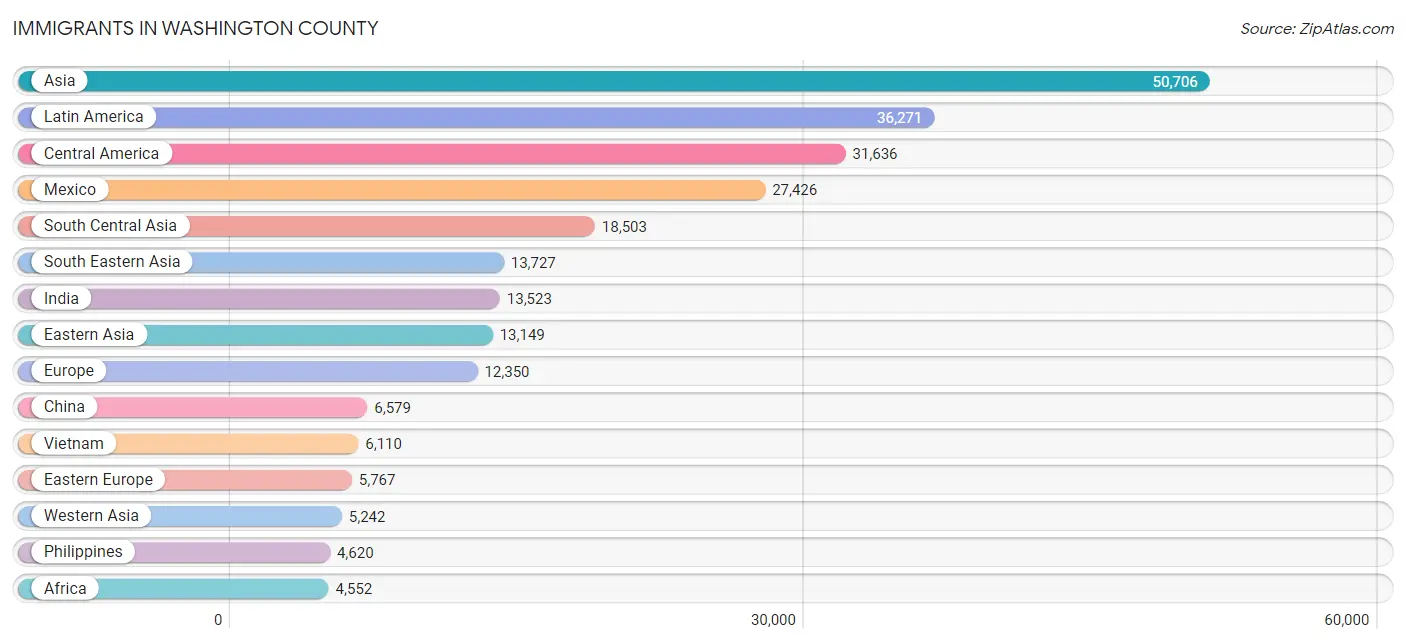
Immigrants in Washington County
The most numerous immigrant groups reported in Washington County came from Asia (50,706 | 8.5%), Latin America (36,271 | 6.0%), Central America (31,636 | 5.3%), Mexico (27,426 | 4.6%), and South Central Asia (18,503 | 3.1%), together accounting for 27.5% of all Washington County residents.
| Immigration Origin | # Population | % Population |
| Afghanistan | 591 | 0.1% |
| Africa | 4,552 | 0.8% |
| Argentina | 214 | 0.0% |
| Armenia | 139 | 0.0% |
| Asia | 50,706 | 8.5% |
| Australia | 363 | 0.1% |
| Austria | 35 | 0.0% |
| Bahamas | 3 | 0.0% |
| Bangladesh | 476 | 0.1% |
| Belarus | 135 | 0.0% |
| Belgium | 111 | 0.0% |
| Belize | 4 | 0.0% |
| Bolivia | 48 | 0.0% |
| Bosnia and Herzegovina | 253 | 0.0% |
| Brazil | 683 | 0.1% |
| Bulgaria | 235 | 0.0% |
| Cambodia | 1,090 | 0.2% |
| Cameroon | 114 | 0.0% |
| Canada | 3,004 | 0.5% |
| Caribbean | 1,142 | 0.2% |
| Central America | 31,636 | 5.3% |
| Chile | 200 | 0.0% |
| China | 6,579 | 1.1% |
| Colombia | 322 | 0.1% |
| Congo | 52 | 0.0% |
| Costa Rica | 291 | 0.1% |
| Croatia | 60 | 0.0% |
| Cuba | 293 | 0.1% |
| Czechoslovakia | 334 | 0.1% |
| Denmark | 167 | 0.0% |
| Dominican Republic | 188 | 0.0% |
| Eastern Africa | 2,252 | 0.4% |
| Eastern Asia | 13,149 | 2.2% |
| Eastern Europe | 5,767 | 1.0% |
| Ecuador | 346 | 0.1% |
| Egypt | 261 | 0.0% |
| El Salvador | 739 | 0.1% |
| England | 1,201 | 0.2% |
| Eritrea | 9 | 0.0% |
| Ethiopia | 462 | 0.1% |
| Europe | 12,350 | 2.1% |
| Fiji | 462 | 0.1% |
| France | 613 | 0.1% |
| Germany | 1,371 | 0.2% |
| Ghana | 446 | 0.1% |
| Greece | 81 | 0.0% |
| Guatemala | 2,779 | 0.5% |
| Haiti | 102 | 0.0% |
| Honduras | 132 | 0.0% |
| Hong Kong | 664 | 0.1% |
| Hungary | 198 | 0.0% |
| India | 13,523 | 2.3% |
| Indonesia | 401 | 0.1% |
| Iran | 1,854 | 0.3% |
| Iraq | 1,667 | 0.3% |
| Ireland | 618 | 0.1% |
| Israel | 1,197 | 0.2% |
| Italy | 155 | 0.0% |
| Jamaica | 453 | 0.1% |
| Japan | 2,056 | 0.3% |
| Jordan | 428 | 0.1% |
| Kazakhstan | 337 | 0.1% |
| Kenya | 537 | 0.1% |
| Korea | 4,514 | 0.7% |
| Kuwait | 93 | 0.0% |
| Laos | 460 | 0.1% |
| Latin America | 36,271 | 6.0% |
| Latvia | 21 | 0.0% |
| Lebanon | 343 | 0.1% |
| Liberia | 19 | 0.0% |
| Lithuania | 232 | 0.0% |
| Malaysia | 267 | 0.0% |
| Mexico | 27,426 | 4.6% |
| Micronesia | 203 | 0.0% |
| Middle Africa | 272 | 0.1% |
| Moldova | 193 | 0.0% |
| Morocco | 210 | 0.0% |
| Nepal | 604 | 0.1% |
| Netherlands | 223 | 0.0% |
| Nicaragua | 155 | 0.0% |
| Nigeria | 445 | 0.1% |
| North Macedonia | 82 | 0.0% |
| Northern Africa | 608 | 0.1% |
| Northern Europe | 3,566 | 0.6% |
| Norway | 277 | 0.1% |
| Oceania | 1,254 | 0.2% |
| Pakistan | 426 | 0.1% |
| Panama | 110 | 0.0% |
| Peru | 672 | 0.1% |
| Philippines | 4,620 | 0.8% |
| Poland | 496 | 0.1% |
| Portugal | 14 | 0.0% |
| Romania | 1,065 | 0.2% |
| Russia | 1,122 | 0.2% |
| Saudi Arabia | 195 | 0.0% |
| Scotland | 74 | 0.0% |
| Senegal | 62 | 0.0% |
| Serbia | 207 | 0.0% |
| Singapore | 118 | 0.0% |
| Somalia | 1,130 | 0.2% |
| South Africa | 233 | 0.0% |
| South America | 3,493 | 0.6% |
| South Central Asia | 18,503 | 3.1% |
| South Eastern Asia | 13,727 | 2.3% |
| Southern Europe | 484 | 0.1% |
| Spain | 234 | 0.0% |
| Sri Lanka | 578 | 0.1% |
| Sudan | 76 | 0.0% |
| Sweden | 148 | 0.0% |
| Switzerland | 74 | 0.0% |
| Syria | 144 | 0.0% |
| Taiwan | 1,295 | 0.2% |
| Thailand | 632 | 0.1% |
| Trinidad and Tobago | 103 | 0.0% |
| Turkey | 470 | 0.1% |
| Uganda | 12 | 0.0% |
| Ukraine | 919 | 0.2% |
| Uruguay | 175 | 0.0% |
| Uzbekistan | 100 | 0.0% |
| Venezuela | 806 | 0.1% |
| Vietnam | 6,110 | 1.0% |
| Western Africa | 1,187 | 0.2% |
| Western Asia | 5,242 | 0.9% |
| Western Europe | 2,427 | 0.4% |
| Yemen | 68 | 0.0% |
| Zaire | 106 | 0.0% |
| Zimbabwe | 17 | 0.0% | View All 127 Rows |
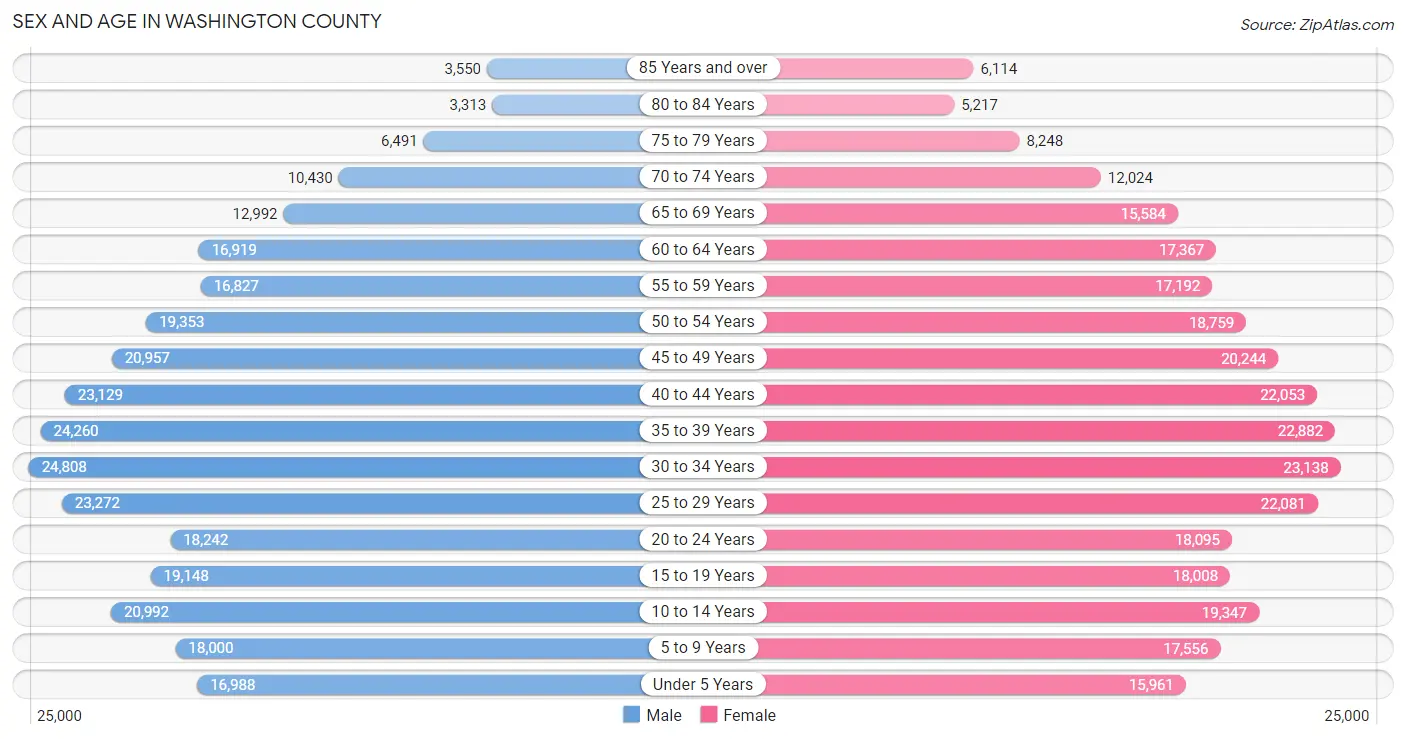
Sex and Age in Washington County
Sex and Age in Washington County
The most populous age groups in Washington County are 30 to 34 Years (24,808 | 8.3%) for men and 30 to 34 Years (23,138 | 7.7%) for women.
| Age Bracket | Male | Female |
| Under 5 Years | 16,988 (5.7%) | 15,961 (5.3%) |
| 5 to 9 Years | 18,000 (6.0%) | 17,556 (5.9%) |
| 10 to 14 Years | 20,992 (7.0%) | 19,347 (6.5%) |
| 15 to 19 Years | 19,148 (6.4%) | 18,008 (6.0%) |
| 20 to 24 Years | 18,242 (6.1%) | 18,095 (6.0%) |
| 25 to 29 Years | 23,272 (7.8%) | 22,081 (7.4%) |
| 30 to 34 Years | 24,808 (8.3%) | 23,138 (7.7%) |
| 35 to 39 Years | 24,260 (8.1%) | 22,882 (7.6%) |
| 40 to 44 Years | 23,129 (7.7%) | 22,053 (7.3%) |
| 45 to 49 Years | 20,957 (7.0%) | 20,244 (6.8%) |
| 50 to 54 Years | 19,353 (6.5%) | 18,759 (6.3%) |
| 55 to 59 Years | 16,827 (5.6%) | 17,192 (5.7%) |
| 60 to 64 Years | 16,919 (5.7%) | 17,367 (5.8%) |
| 65 to 69 Years | 12,992 (4.3%) | 15,584 (5.2%) |
| 70 to 74 Years | 10,430 (3.5%) | 12,024 (4.0%) |
| 75 to 79 Years | 6,491 (2.2%) | 8,248 (2.8%) |
| 80 to 84 Years | 3,313 (1.1%) | 5,217 (1.7%) |
| 85 Years and over | 3,550 (1.2%) | 6,114 (2.0%) |
| Total | 299,671 (100.0%) | 299,870 (100.0%) |
Families and Households in Washington County
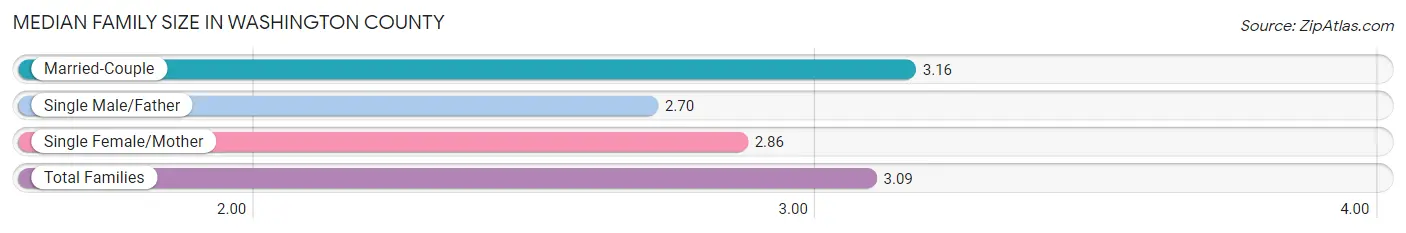
Median Family Size in Washington County
The median family size in Washington County is 3.09 persons per family, with married-couple families (119,410 | 78.6%) accounting for the largest median family size of 3.16 persons per family. On the other hand, single male/father families (10,567 | 7.0%) represent the smallest median family size with 2.70 persons per family.
| Family Type | # Families | Family Size |
| Married-Couple | 119,410 (78.6%) | 3.16 |
| Single Male/Father | 10,567 (7.0%) | 2.70 |
| Single Female/Mother | 21,883 (14.4%) | 2.86 |
| Total Families | 151,860 (100.0%) | 3.09 |
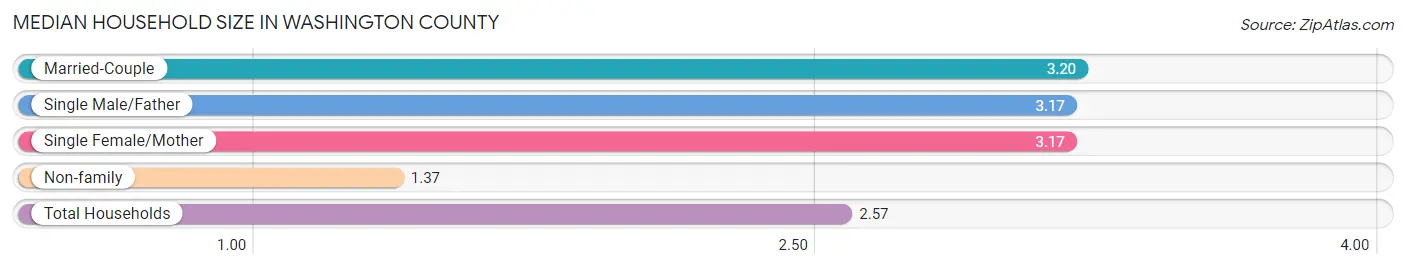
Median Household Size in Washington County
The median household size in Washington County is 2.57 persons per household, with married-couple households (119,410 | 51.9%) accounting for the largest median household size of 3.2 persons per household. non-family households (78,262 | 34.0%) represent the smallest median household size with 1.37 persons per household.
| Household Type | # Households | Household Size |
| Married-Couple | 119,410 (51.9%) | 3.20 |
| Single Male/Father | 10,567 (4.6%) | 3.17 |
| Single Female/Mother | 21,883 (9.5%) | 3.17 |
| Non-family | 78,262 (34.0%) | 1.37 |
| Total Households | 230,122 (100.0%) | 2.57 |
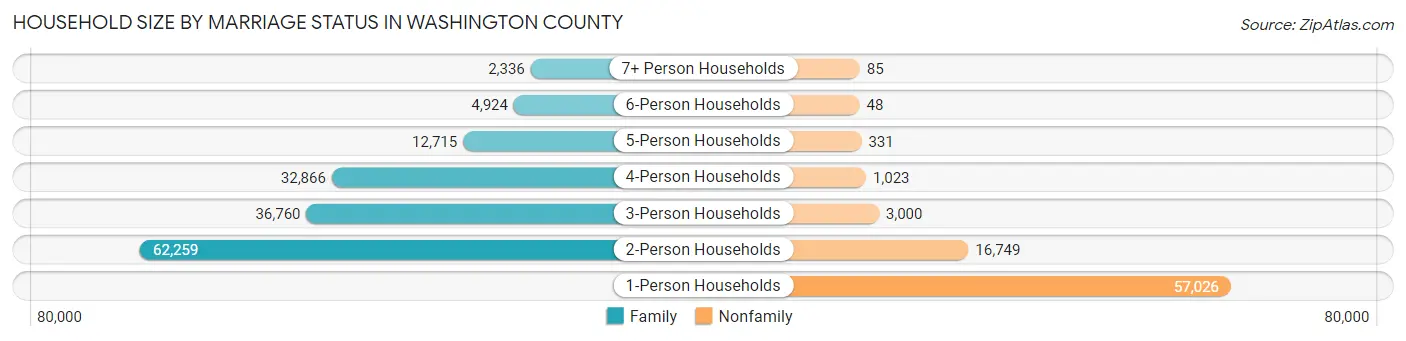
Household Size by Marriage Status in Washington County
Out of a total of 230,122 households in Washington County, 151,860 (66.0%) are family households, while 78,262 (34.0%) are nonfamily households. The most numerous type of family households are 2-person households, comprising 62,259, and the most common type of nonfamily households are 1-person households, comprising 57,026.
| Household Size | Family Households | Nonfamily Households |
| 1-Person Households | - | 57,026 (24.8%) |
| 2-Person Households | 62,259 (27.1%) | 16,749 (7.3%) |
| 3-Person Households | 36,760 (16.0%) | 3,000 (1.3%) |
| 4-Person Households | 32,866 (14.3%) | 1,023 (0.4%) |
| 5-Person Households | 12,715 (5.5%) | 331 (0.1%) |
| 6-Person Households | 4,924 (2.1%) | 48 (0.0%) |
| 7+ Person Households | 2,336 (1.0%) | 85 (0.0%) |
| Total | 151,860 (66.0%) | 78,262 (34.0%) |
Female Fertility in Washington County
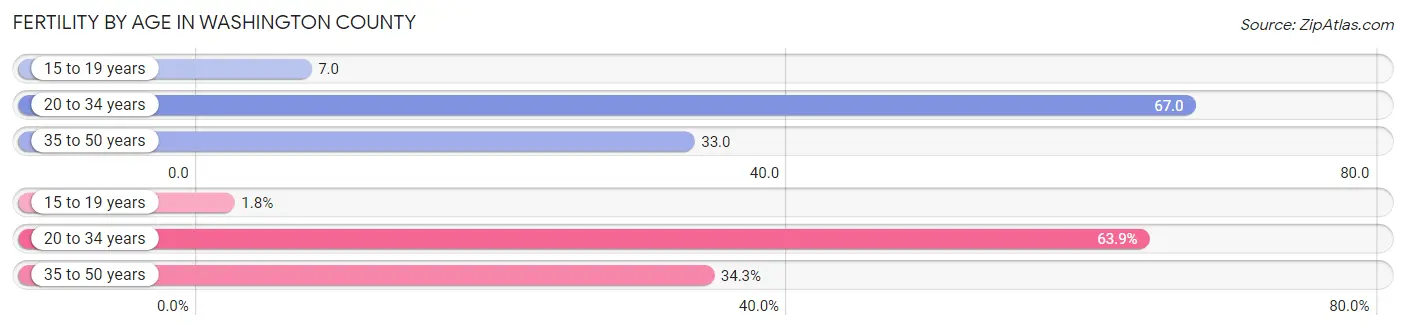
Fertility by Age in Washington County
Average fertility rate in Washington County is 44.0 births per 1,000 women. Women in the age bracket of 20 to 34 years have the highest fertility rate with 67.0 births per 1,000 women. Women in the age bracket of 20 to 34 years acount for 63.9% of all women with births.
| Age Bracket | Women with Births | Births / 1,000 Women |
| 15 to 19 years | 119 (1.8%) | 7.0 |
| 20 to 34 years | 4,249 (63.9%) | 67.0 |
| 35 to 50 years | 2,283 (34.3%) | 33.0 |
| Total | 6,651 (100.0%) | 44.0 |
Fertility by Age by Marriage Status in Washington County
80.2% of women with births (6,651) in Washington County are married. The highest percentage of unmarried women with births falls into 15 to 19 years age bracket with 100.0% of them unmarried at the time of birth, while the lowest percentage of unmarried women with births belong to 35 to 50 years age bracket with 13.8% of them unmarried.
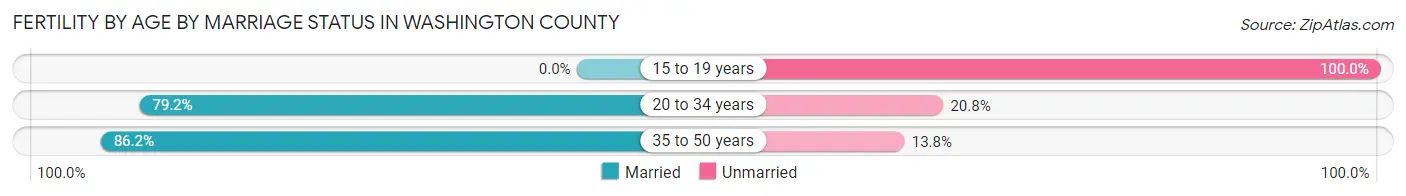
| Age Bracket | Married | Unmarried |
| 15 to 19 years | 0 (0.0%) | 119 (100.0%) |
| 20 to 34 years | 3,365 (79.2%) | 884 (20.8%) |
| 35 to 50 years | 1,968 (86.2%) | 315 (13.8%) |
| Total | 5,334 (80.2%) | 1,317 (19.8%) |
Fertility by Education in Washington County
Average fertility rate in Washington County is 44.0 births per 1,000 women. Women with the education attainment of graduate degree have the highest fertility rate of 63.0 births per 1,000 women, while women with the education attainment of college or associate's degree have the lowest fertility at 31.0 births per 1,000 women. Women with the education attainment of bachelor's degree represent 33.2% of all women with births.
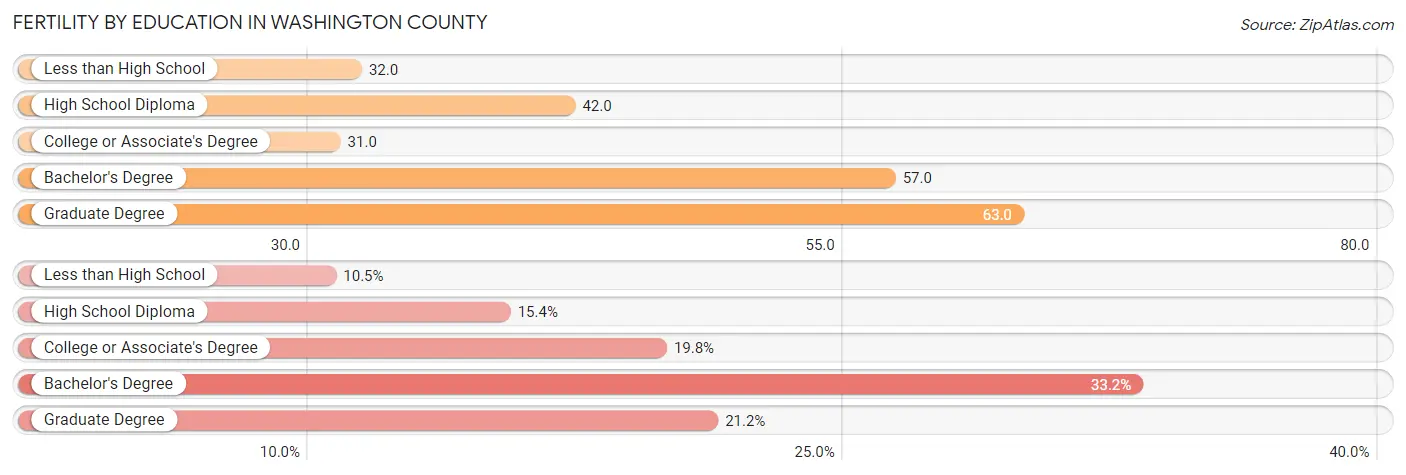
| Educational Attainment | Women with Births | Births / 1,000 Women |
| Less than High School | 697 (10.5%) | 32.0 |
| High School Diploma | 1,023 (15.4%) | 42.0 |
| College or Associate's Degree | 1,315 (19.8%) | 31.0 |
| Bachelor's Degree | 2,205 (33.2%) | 57.0 |
| Graduate Degree | 1,411 (21.2%) | 63.0 |
| Total | 6,651 (100.0%) | 44.0 |
Fertility by Education by Marriage Status in Washington County
19.8% of women with births in Washington County are unmarried. Women with the educational attainment of bachelor's degree are most likely to be married with 97.5% of them married at childbirth, while women with the educational attainment of less than high school are least likely to be married with 67.1% of them unmarried at childbirth.
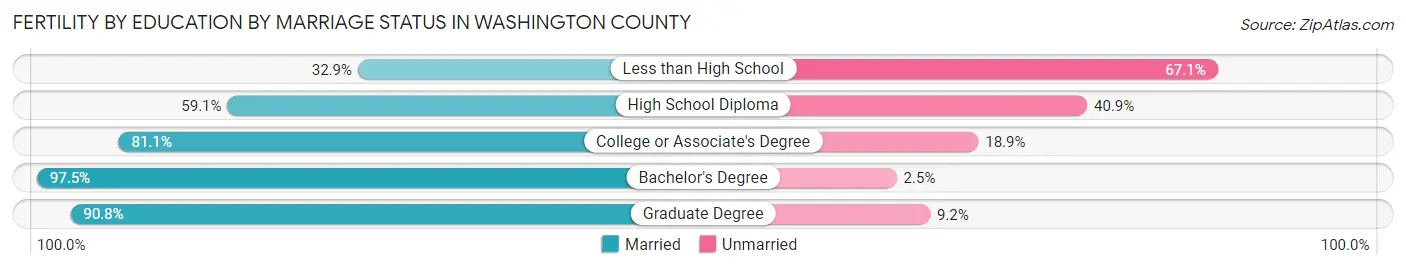
| Educational Attainment | Married | Unmarried |
| Less than High School | 229 (32.9%) | 468 (67.1%) |
| High School Diploma | 605 (59.1%) | 418 (40.9%) |
| College or Associate's Degree | 1,066 (81.1%) | 249 (18.9%) |
| Bachelor's Degree | 2,150 (97.5%) | 55 (2.5%) |
| Graduate Degree | 1,281 (90.8%) | 130 (9.2%) |
| Total | 5,334 (80.2%) | 1,317 (19.8%) |
Income in Washington County
Income Overview in Washington County
Per Capita Income in Washington County is $49,553, while median incomes of families and households are $119,312 and $100,121 respectively.
| Characteristic | Number | Measure |
| Per Capita Income | 599,541 | $49,553 |
| Median Family Income | 151,860 | $119,312 |
| Mean Family Income | 151,860 | $148,906 |
| Median Household Income | 230,122 | $100,121 |
| Mean Household Income | 230,122 | $127,688 |
| Income Deficit | 151,860 | $11,090 |
| Wage / Income Gap (%) | 599,541 | 31.26% |
| Wage / Income Gap ($) | 599,541 | 68.74¢ per $1 |
| Gini / Inequality Index | 599,541 | 0.43 |
Earnings by Sex in Washington County
Average Earnings in Washington County are $51,428, $61,089 for men and $41,991 for women, a difference of 31.3%.
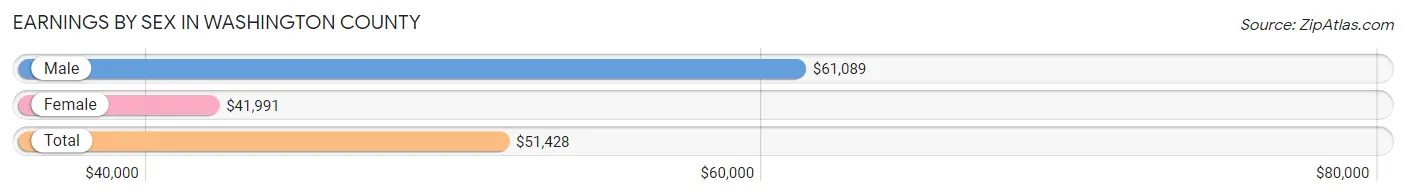
| Sex | Number | Average Earnings |
| Male | 186,348 (54.0%) | $61,089 |
| Female | 158,930 (46.0%) | $41,991 |
| Total | 345,278 (100.0%) | $51,428 |
Earnings by Sex by Income Bracket in Washington County
The most common earnings brackets in Washington County are $100,000+ for men (55,752 | 29.9%) and $100,000+ for women (23,102 | 14.5%).
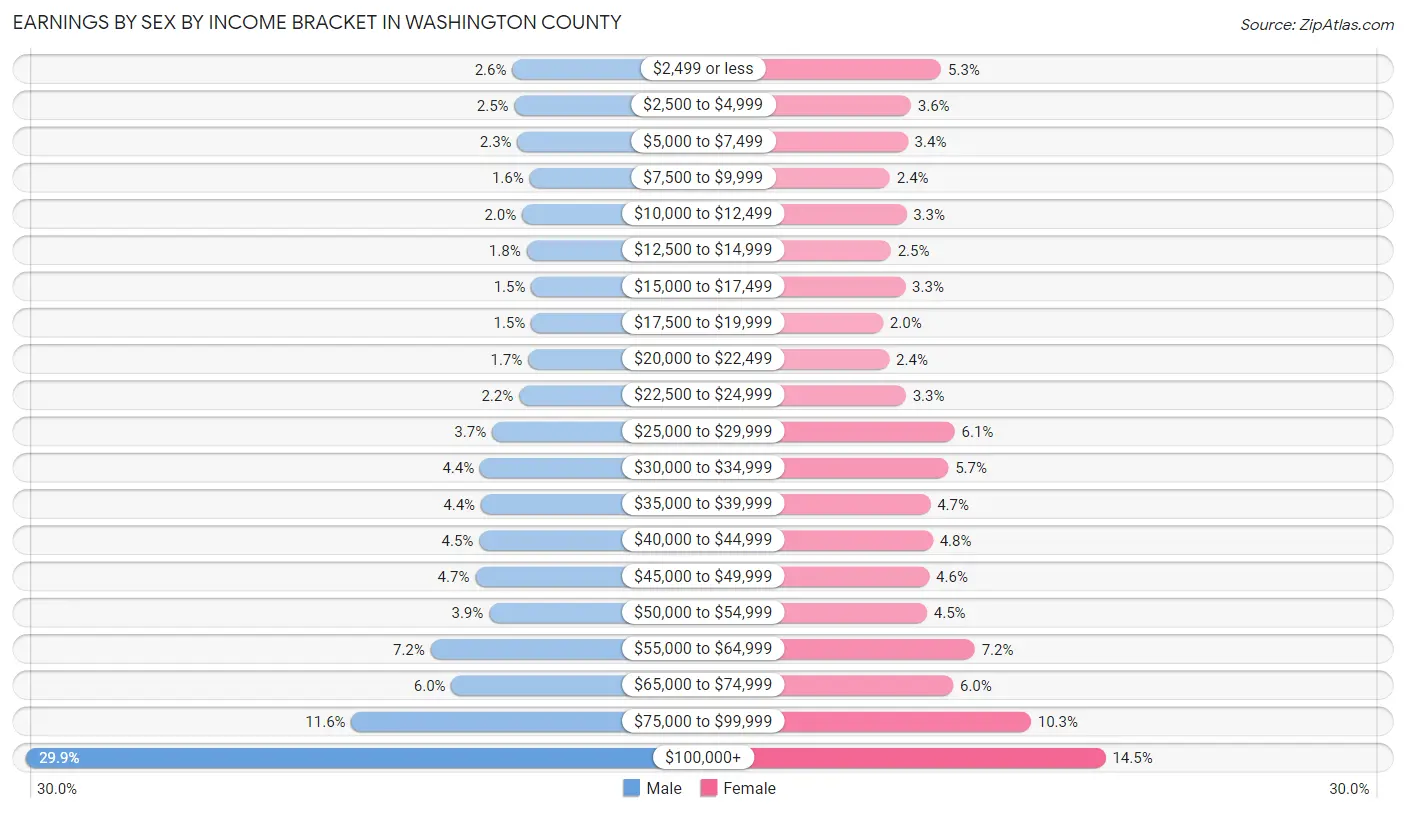
| Income | Male | Female |
| $2,499 or less | 4,824 (2.6%) | 8,421 (5.3%) |
| $2,500 to $4,999 | 4,608 (2.5%) | 5,718 (3.6%) |
| $5,000 to $7,499 | 4,293 (2.3%) | 5,438 (3.4%) |
| $7,500 to $9,999 | 3,021 (1.6%) | 3,847 (2.4%) |
| $10,000 to $12,499 | 3,803 (2.0%) | 5,312 (3.3%) |
| $12,500 to $14,999 | 3,331 (1.8%) | 3,919 (2.5%) |
| $15,000 to $17,499 | 2,828 (1.5%) | 5,208 (3.3%) |
| $17,500 to $19,999 | 2,854 (1.5%) | 3,231 (2.0%) |
| $20,000 to $22,499 | 3,163 (1.7%) | 3,790 (2.4%) |
| $22,500 to $24,999 | 4,118 (2.2%) | 5,262 (3.3%) |
| $25,000 to $29,999 | 6,943 (3.7%) | 9,637 (6.1%) |
| $30,000 to $34,999 | 8,202 (4.4%) | 9,060 (5.7%) |
| $35,000 to $39,999 | 8,111 (4.3%) | 7,452 (4.7%) |
| $40,000 to $44,999 | 8,288 (4.4%) | 7,670 (4.8%) |
| $45,000 to $49,999 | 8,699 (4.7%) | 7,356 (4.6%) |
| $50,000 to $54,999 | 7,250 (3.9%) | 7,146 (4.5%) |
| $55,000 to $64,999 | 13,384 (7.2%) | 11,431 (7.2%) |
| $65,000 to $74,999 | 11,195 (6.0%) | 9,496 (6.0%) |
| $75,000 to $99,999 | 21,681 (11.6%) | 16,434 (10.3%) |
| $100,000+ | 55,752 (29.9%) | 23,102 (14.5%) |
| Total | 186,348 (100.0%) | 158,930 (100.0%) |
Earnings by Sex by Educational Attainment in Washington County
Average earnings in Washington County are $69,706 for men and $48,063 for women, a difference of 31.0%. Men with an educational attainment of graduate degree enjoy the highest average annual earnings of $128,067, while those with less than high school education earn the least with $40,063. Women with an educational attainment of graduate degree earn the most with the average annual earnings of $83,224, while those with less than high school education have the smallest earnings of $26,189.
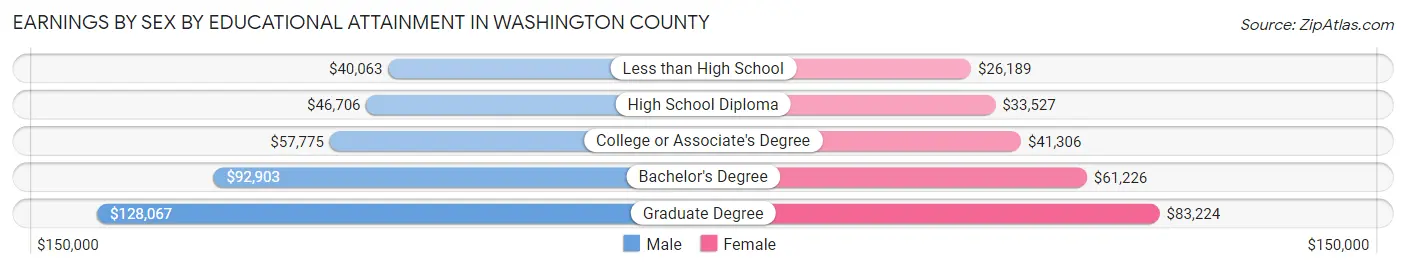
| Educational Attainment | Male Income | Female Income |
| Less than High School | $40,063 | $26,189 |
| High School Diploma | $46,706 | $33,527 |
| College or Associate's Degree | $57,775 | $41,306 |
| Bachelor's Degree | $92,903 | $61,226 |
| Graduate Degree | $128,067 | $83,224 |
| Total | $69,706 | $48,063 |
Family Income in Washington County
Family Income Brackets in Washington County
According to the Washington County family income data, there are 34,928 families falling into the $100,000 to $149,999 income range, which is the most common income bracket and makes up 23.0% of all families. Conversely, the $10,000 to $14,999 income bracket is the least frequent group with only 1,367 families (0.9%) belonging to this category.
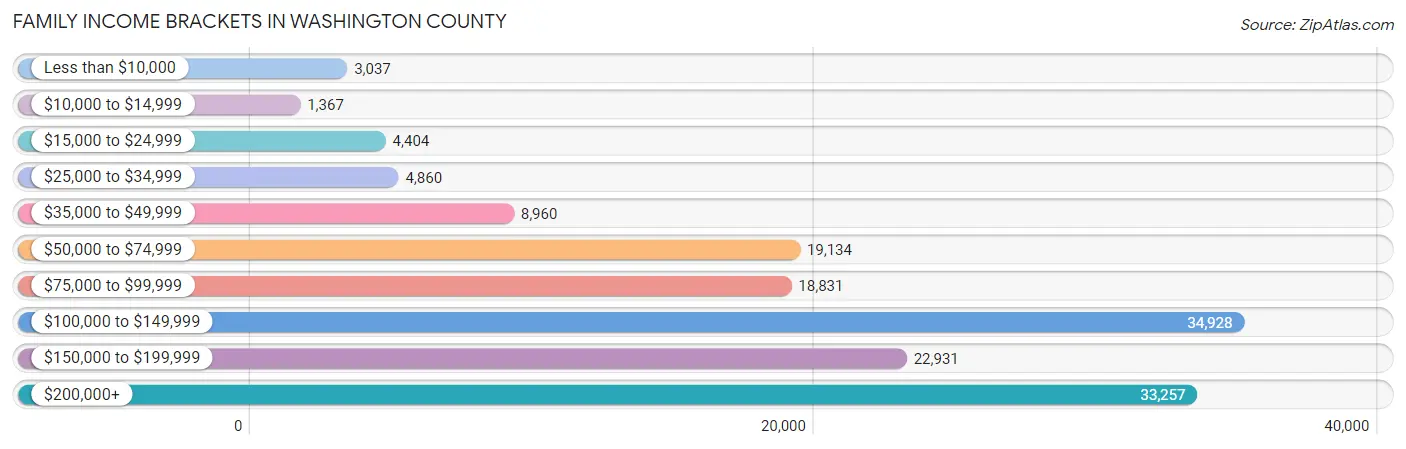
| Income Bracket | # Families | % Families |
| Less than $10,000 | 3,037 | 2.0% |
| $10,000 to $14,999 | 1,367 | 0.9% |
| $15,000 to $24,999 | 4,404 | 2.9% |
| $25,000 to $34,999 | 4,860 | 3.2% |
| $35,000 to $49,999 | 8,960 | 5.9% |
| $50,000 to $74,999 | 19,134 | 12.6% |
| $75,000 to $99,999 | 18,831 | 12.4% |
| $100,000 to $149,999 | 34,928 | 23.0% |
| $150,000 to $199,999 | 22,931 | 15.1% |
| $200,000+ | 33,257 | 21.9% |
Family Income by Famaliy Size in Washington County
4-person families (31,243 | 20.6%) account for the highest median family income in Washington County with $150,419 per family, while 2-person families (68,279 | 45.0%) have the highest median income of $50,320 per family member.
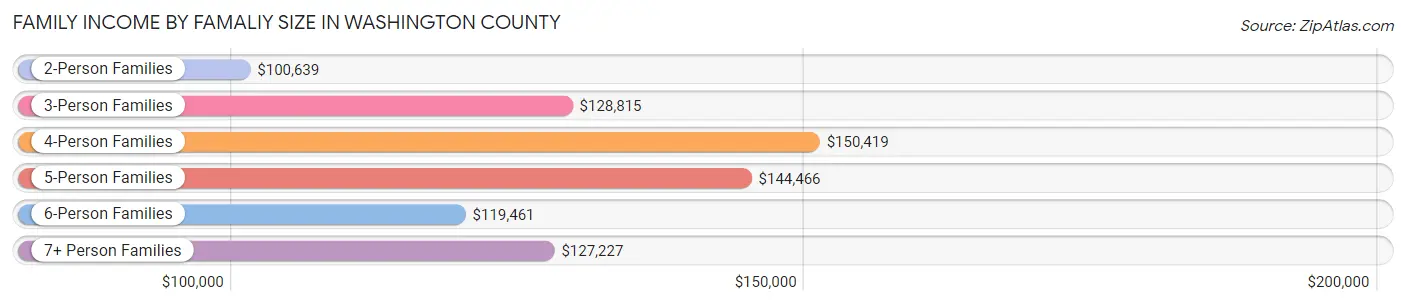
| Income Bracket | # Families | Median Income |
| 2-Person Families | 68,279 (45.0%) | $100,639 |
| 3-Person Families | 34,996 (23.0%) | $128,815 |
| 4-Person Families | 31,243 (20.6%) | $150,419 |
| 5-Person Families | 11,005 (7.2%) | $144,466 |
| 6-Person Families | 4,485 (2.9%) | $119,461 |
| 7+ Person Families | 1,852 (1.2%) | $127,227 |
| Total | 151,860 (100.0%) | $119,312 |
Family Income by Number of Earners in Washington County
The median family income in Washington County is $119,312, with families comprising 3+ earners (18,754) having the highest median family income of $159,736, while families with no earners (16,812) have the lowest median family income of $64,380, accounting for 12.3% and 11.1% of families, respectively.
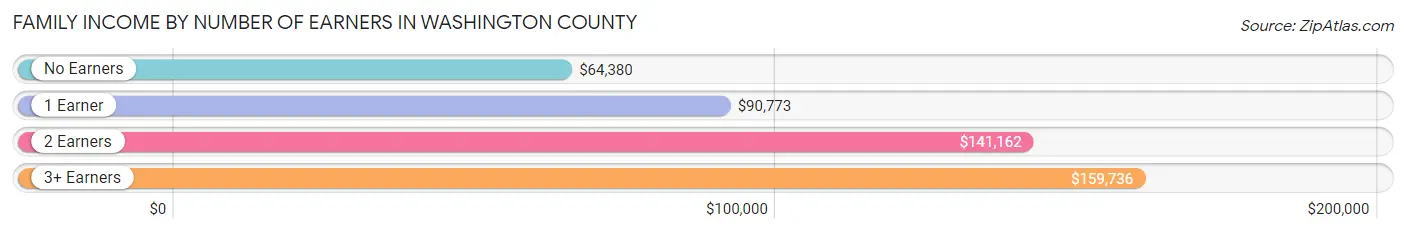
| Number of Earners | # Families | Median Income |
| No Earners | 16,812 (11.1%) | $64,380 |
| 1 Earner | 44,091 (29.0%) | $90,773 |
| 2 Earners | 72,203 (47.5%) | $141,162 |
| 3+ Earners | 18,754 (12.3%) | $159,736 |
| Total | 151,860 (100.0%) | $119,312 |
Household Income in Washington County
Household Income Brackets in Washington County
With 47,175 households falling in the category, the $100,000 to $149,999 income range is the most frequent in Washington County, accounting for 20.5% of all households. In contrast, only 4,372 households (1.9%) fall into the $10,000 to $14,999 income bracket, making it the least populous group.
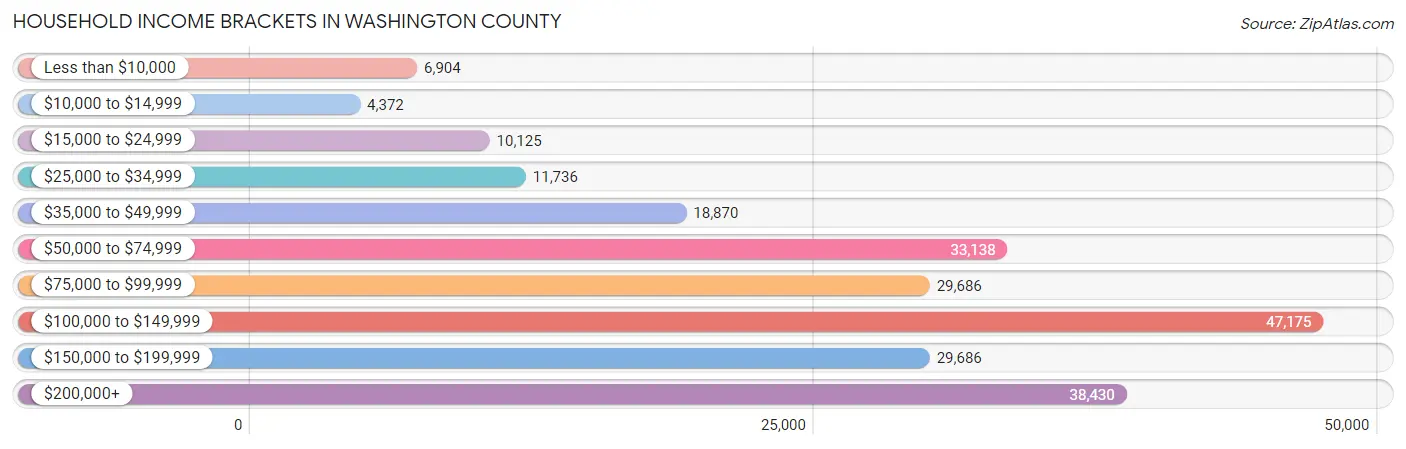
| Income Bracket | # Households | % Households |
| Less than $10,000 | 6,904 | 3.0% |
| $10,000 to $14,999 | 4,372 | 1.9% |
| $15,000 to $24,999 | 10,125 | 4.4% |
| $25,000 to $34,999 | 11,736 | 5.1% |
| $35,000 to $49,999 | 18,870 | 8.2% |
| $50,000 to $74,999 | 33,138 | 14.4% |
| $75,000 to $99,999 | 29,686 | 12.9% |
| $100,000 to $149,999 | 47,175 | 20.5% |
| $150,000 to $199,999 | 29,686 | 12.9% |
| $200,000+ | 38,430 | 16.7% |
Household Income by Householder Age in Washington County
The median household income in Washington County is $100,121, with the highest median household income of $119,939 found in the 45 to 64 years age bracket for the primary householder. A total of 82,941 households (36.0%) fall into this category. Meanwhile, the 15 to 24 years age bracket for the primary householder has the lowest median household income of $54,502, with 8,102 households (3.5%) in this group.
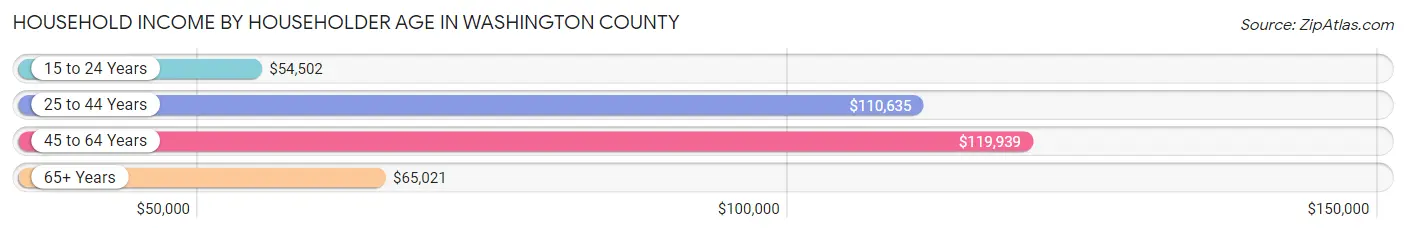
| Income Bracket | # Households | Median Income |
| 15 to 24 Years | 8,102 (3.5%) | $54,502 |
| 25 to 44 Years | 87,874 (38.2%) | $110,635 |
| 45 to 64 Years | 82,941 (36.0%) | $119,939 |
| 65+ Years | 51,205 (22.3%) | $65,021 |
| Total | 230,122 (100.0%) | $100,121 |
Poverty in Washington County
Income Below Poverty by Sex and Age in Washington County
With 7.2% poverty level for males and 9.1% for females among the residents of Washington County, 5 year old males and 18 to 24 year old females are the most vulnerable to poverty, with 391 males (12.8%) and 4,499 females (18.9%) in their respective age groups living below the poverty level.
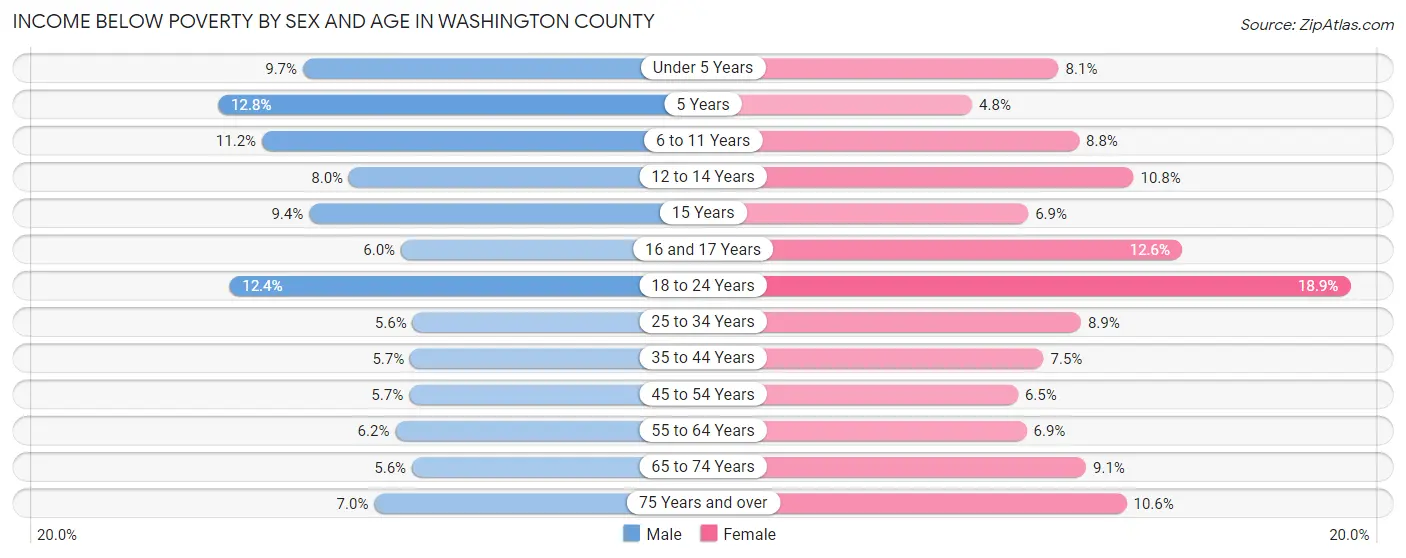
| Age Bracket | Male | Female |
| Under 5 Years | 1,634 (9.7%) | 1,258 (8.1%) |
| 5 Years | 391 (12.8%) | 195 (4.8%) |
| 6 to 11 Years | 2,588 (11.2%) | 1,873 (8.8%) |
| 12 to 14 Years | 977 (8.0%) | 1,212 (10.8%) |
| 15 Years | 366 (9.4%) | 293 (6.9%) |
| 16 and 17 Years | 494 (6.0%) | 926 (12.6%) |
| 18 to 24 Years | 3,078 (12.4%) | 4,499 (18.9%) |
| 25 to 34 Years | 2,678 (5.6%) | 3,978 (8.9%) |
| 35 to 44 Years | 2,687 (5.7%) | 3,344 (7.5%) |
| 45 to 54 Years | 2,300 (5.7%) | 2,539 (6.5%) |
| 55 to 64 Years | 2,097 (6.2%) | 2,359 (6.9%) |
| 65 to 74 Years | 1,313 (5.6%) | 2,492 (9.1%) |
| 75 Years and over | 915 (7.0%) | 2,009 (10.6%) |
| Total | 21,518 (7.2%) | 26,977 (9.1%) |
Income Above Poverty by Sex and Age in Washington County
According to the poverty statistics in Washington County, males aged 25 to 34 years and females aged 5 years are the age groups that are most secure financially, with 94.4% of males and 95.2% of females in these age groups living above the poverty line.
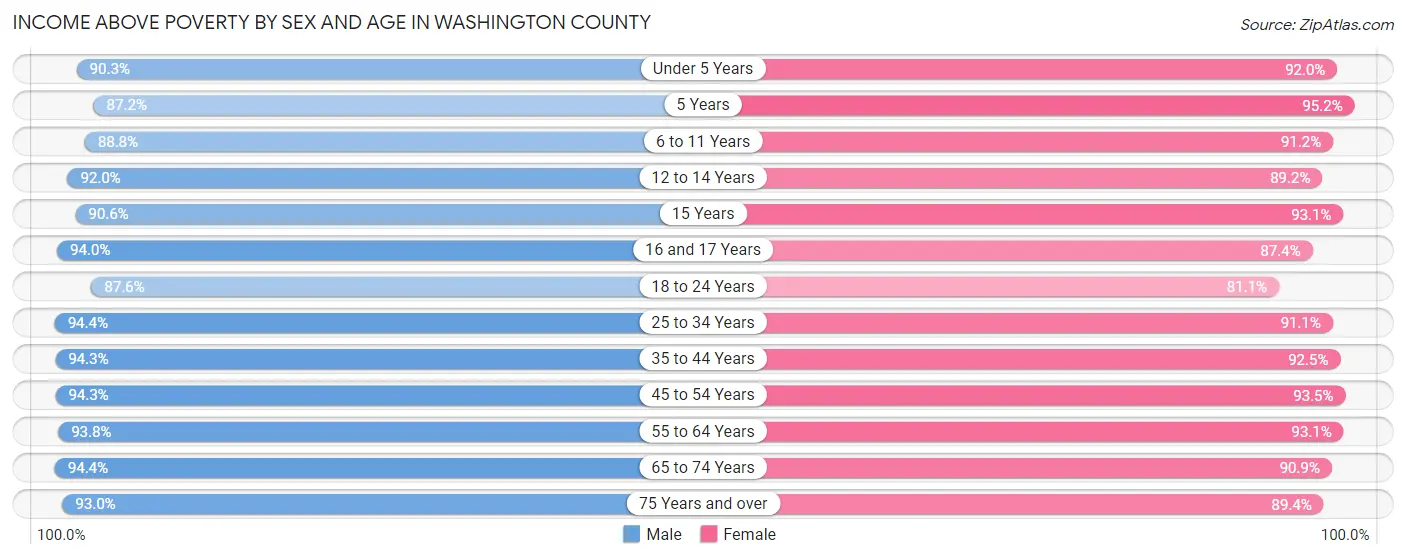
| Age Bracket | Male | Female |
| Under 5 Years | 15,261 (90.3%) | 14,371 (91.9%) |
| 5 Years | 2,659 (87.2%) | 3,832 (95.2%) |
| 6 to 11 Years | 20,547 (88.8%) | 19,382 (91.2%) |
| 12 to 14 Years | 11,295 (92.0%) | 9,975 (89.2%) |
| 15 Years | 3,510 (90.6%) | 3,941 (93.1%) |
| 16 and 17 Years | 7,697 (94.0%) | 6,412 (87.4%) |
| 18 to 24 Years | 21,742 (87.6%) | 19,349 (81.1%) |
| 25 to 34 Years | 45,110 (94.4%) | 40,809 (91.1%) |
| 35 to 44 Years | 44,528 (94.3%) | 41,287 (92.5%) |
| 45 to 54 Years | 37,854 (94.3%) | 36,303 (93.5%) |
| 55 to 64 Years | 31,508 (93.8%) | 32,029 (93.1%) |
| 65 to 74 Years | 22,044 (94.4%) | 24,969 (90.9%) |
| 75 Years and over | 12,122 (93.0%) | 16,996 (89.4%) |
| Total | 275,877 (92.8%) | 269,655 (90.9%) |
Income Below Poverty Among Married-Couple Families in Washington County
The poverty statistics for married-couple families in Washington County show that 2.9% or 3,463 of the total 119,410 families live below the poverty line. Families with 5 or more children have the highest poverty rate of 29.1%, comprising of 200 families. On the other hand, families with no children have the lowest poverty rate of 2.6%, which includes 1,688 families.
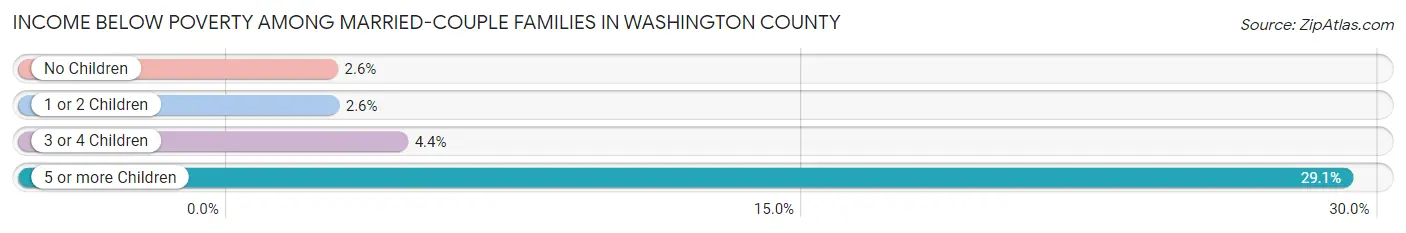
| Children | Above Poverty | Below Poverty |
| No Children | 63,272 (97.4%) | 1,688 (2.6%) |
| 1 or 2 Children | 43,716 (97.4%) | 1,182 (2.6%) |
| 3 or 4 Children | 8,472 (95.6%) | 393 (4.4%) |
| 5 or more Children | 487 (70.9%) | 200 (29.1%) |
| Total | 115,947 (97.1%) | 3,463 (2.9%) |
Income Below Poverty Among Single-Parent Households in Washington County
According to the poverty data in Washington County, 8.2% or 863 single-father households and 16.5% or 3,601 single-mother households are living below the poverty line. Among single-father households, those with 5 or more children have the highest poverty rate, with 11 households (36.7%) experiencing poverty. Likewise, among single-mother households, those with 5 or more children have the highest poverty rate, with 57 households (90.5%) falling below the poverty line.
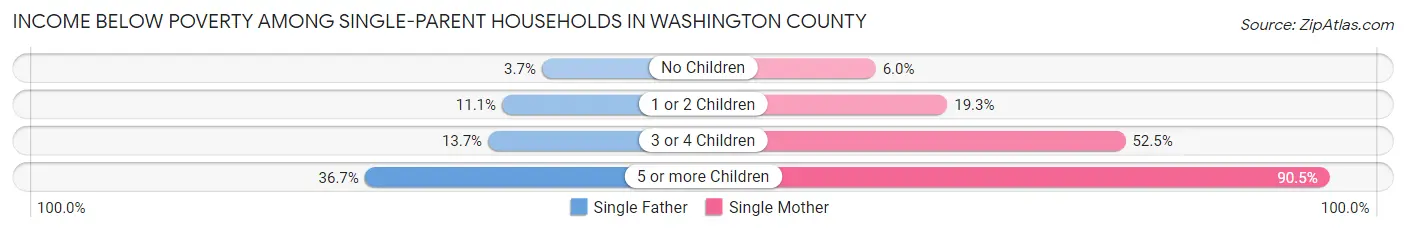
| Children | Single Father | Single Mother |
| No Children | 165 (3.7%) | 547 (6.0%) |
| 1 or 2 Children | 610 (11.1%) | 2,122 (19.3%) |
| 3 or 4 Children | 77 (13.7%) | 875 (52.5%) |
| 5 or more Children | 11 (36.7%) | 57 (90.5%) |
| Total | 863 (8.2%) | 3,601 (16.5%) |
Income Below Poverty Among Married-Couple vs Single-Parent Households in Washington County
The poverty data for Washington County shows that 3,463 of the married-couple family households (2.9%) and 4,464 of the single-parent households (13.8%) are living below the poverty level. Within the married-couple family households, those with 5 or more children have the highest poverty rate, with 200 households (29.1%) falling below the poverty line. Among the single-parent households, those with 5 or more children have the highest poverty rate, with 68 household (73.1%) living below poverty.
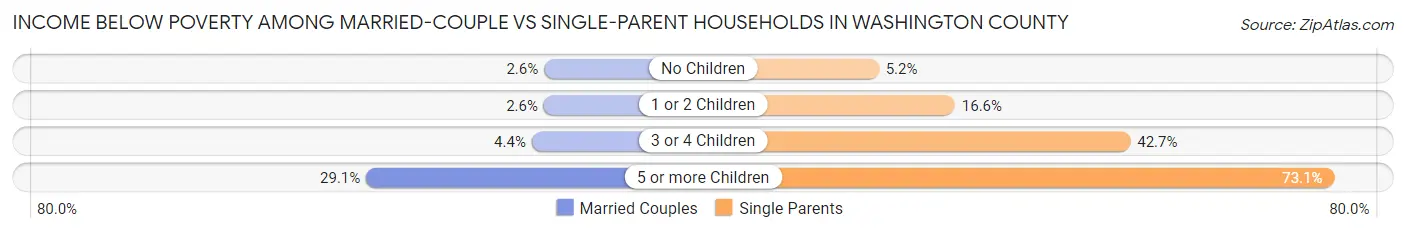
| Children | Married-Couple Families | Single-Parent Households |
| No Children | 1,688 (2.6%) | 712 (5.2%) |
| 1 or 2 Children | 1,182 (2.6%) | 2,732 (16.6%) |
| 3 or 4 Children | 393 (4.4%) | 952 (42.7%) |
| 5 or more Children | 200 (29.1%) | 68 (73.1%) |
| Total | 3,463 (2.9%) | 4,464 (13.8%) |
Employment Characteristics in Washington County
Employment by Class of Employer in Washington County
Among the 312,020 employed individuals in Washington County, private company employees (225,495 | 72.3%), not-for-profit organizations (26,190 | 8.4%), and local government employees (17,771 | 5.7%) make up the most common classes of employment.
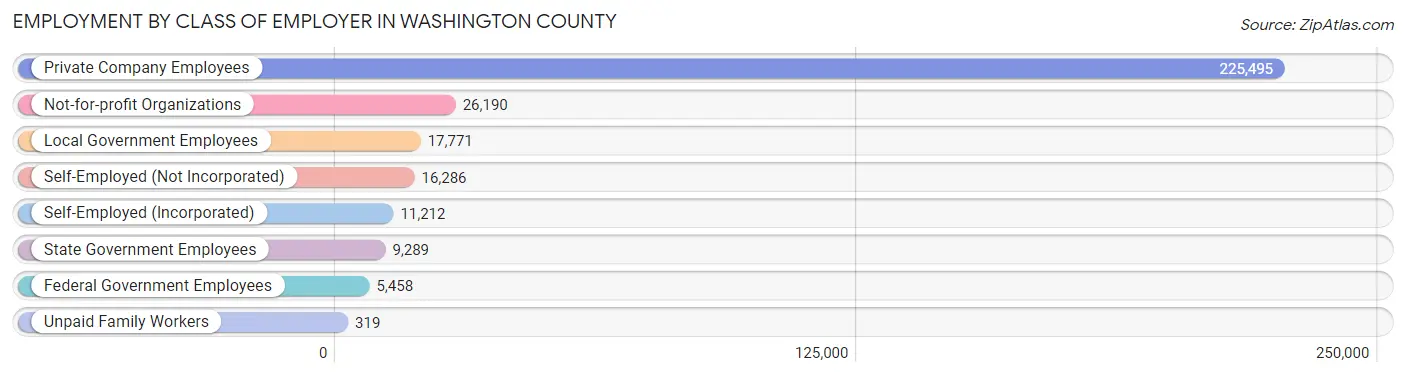
| Employer Class | # Employees | % Employees |
| Private Company Employees | 225,495 | 72.3% |
| Self-Employed (Incorporated) | 11,212 | 3.6% |
| Self-Employed (Not Incorporated) | 16,286 | 5.2% |
| Not-for-profit Organizations | 26,190 | 8.4% |
| Local Government Employees | 17,771 | 5.7% |
| State Government Employees | 9,289 | 3.0% |
| Federal Government Employees | 5,458 | 1.8% |
| Unpaid Family Workers | 319 | 0.1% |
| Total | 312,020 | 100.0% |
Employment Status by Age in Washington County
According to the labor force statistics for Washington County, out of the total population over 16 years of age (482,581), 68.9% or 332,498 individuals are in the labor force, with 4.6% or 15,295 of them unemployed. The age group with the highest labor force participation rate is 25 to 29 years, with 86.4% or 39,185 individuals in the labor force. Within the labor force, the 16 to 19 years age range has the highest percentage of unemployed individuals, with 12.7% or 1,494 of them being unemployed.
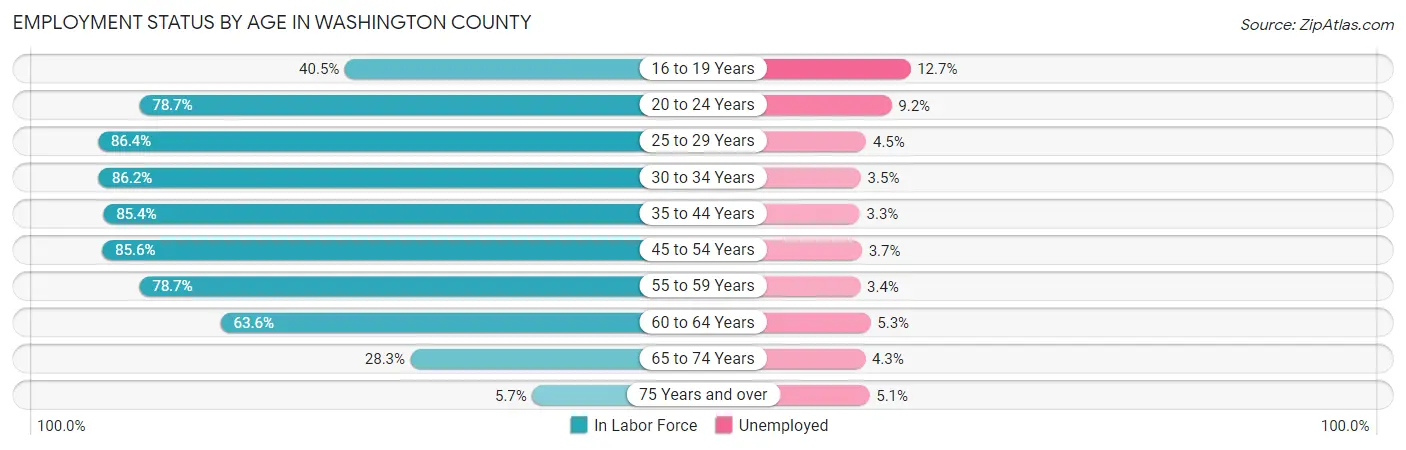
| Age Bracket | In Labor Force | Unemployed |
| 16 to 19 Years | 11,761 (40.5%) | 1,494 (12.7%) |
| 20 to 24 Years | 28,597 (78.7%) | 2,631 (9.2%) |
| 25 to 29 Years | 39,185 (86.4%) | 1,763 (4.5%) |
| 30 to 34 Years | 41,329 (86.2%) | 1,447 (3.5%) |
| 35 to 44 Years | 78,845 (85.4%) | 2,602 (3.3%) |
| 45 to 54 Years | 67,892 (85.6%) | 2,512 (3.7%) |
| 55 to 59 Years | 26,773 (78.7%) | 910 (3.4%) |
| 60 to 64 Years | 21,806 (63.6%) | 1,156 (5.3%) |
| 65 to 74 Years | 14,441 (28.3%) | 621 (4.3%) |
| 75 Years and over | 1,877 (5.7%) | 96 (5.1%) |
| Total | 332,498 (68.9%) | 15,295 (4.6%) |
Employment Status by Educational Attainment in Washington County
According to labor force statistics for Washington County, 82.8% of individuals (275,924) out of the total population between 25 and 64 years of age (333,241) are in the labor force, with 3.8% or 10,485 of them being unemployed. The group with the highest labor force participation rate are those with the educational attainment of bachelor's degree or higher, with 87.3% or 136,274 individuals in the labor force. Within the labor force, individuals with less than high school education have the highest percentage of unemployment, with 5.5% or 948 of them being unemployed.
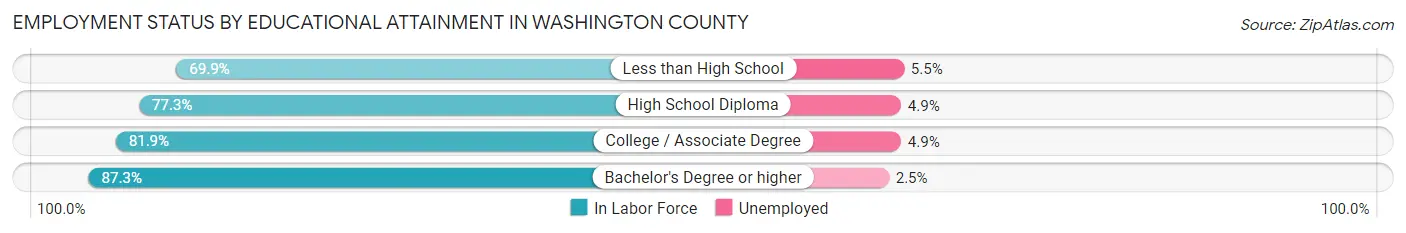
| Educational Attainment | In Labor Force | Unemployed |
| Less than High School | 17,228 (69.9%) | 1,356 (5.5%) |
| High School Diploma | 42,394 (77.3%) | 2,687 (4.9%) |
| College / Associate Degree | 79,977 (81.9%) | 4,785 (4.9%) |
| Bachelor's Degree or higher | 136,274 (87.3%) | 3,902 (2.5%) |
| Total | 275,924 (82.8%) | 12,663 (3.8%) |
Employment Occupations by Sex in Washington County
Management, Business, Science and Arts Occupations
The most common Management, Business, Science and Arts occupations in Washington County are Computers, Engineering & Science (43,956 | 13.9%), Management (38,683 | 12.2%), Community & Social Service (31,895 | 10.1%), Business & Financial (23,029 | 7.3%), and Architecture & Engineering (21,091 | 6.7%).
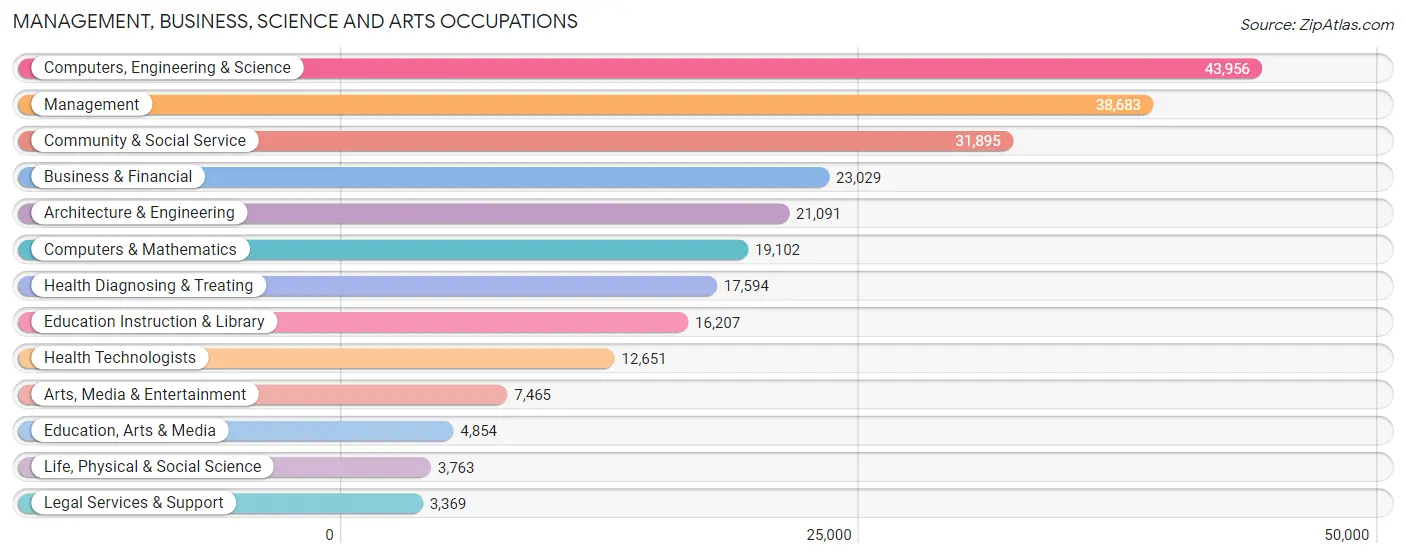
Management, Business, Science and Arts Occupations by Sex
Within the Management, Business, Science and Arts occupations in Washington County, the most male-oriented occupations are Architecture & Engineering (82.6%), Computers & Mathematics (76.8%), and Computers, Engineering & Science (76.6%), while the most female-oriented occupations are Health Technologists (75.9%), Health Diagnosing & Treating (74.4%), and Education Instruction & Library (74.3%).
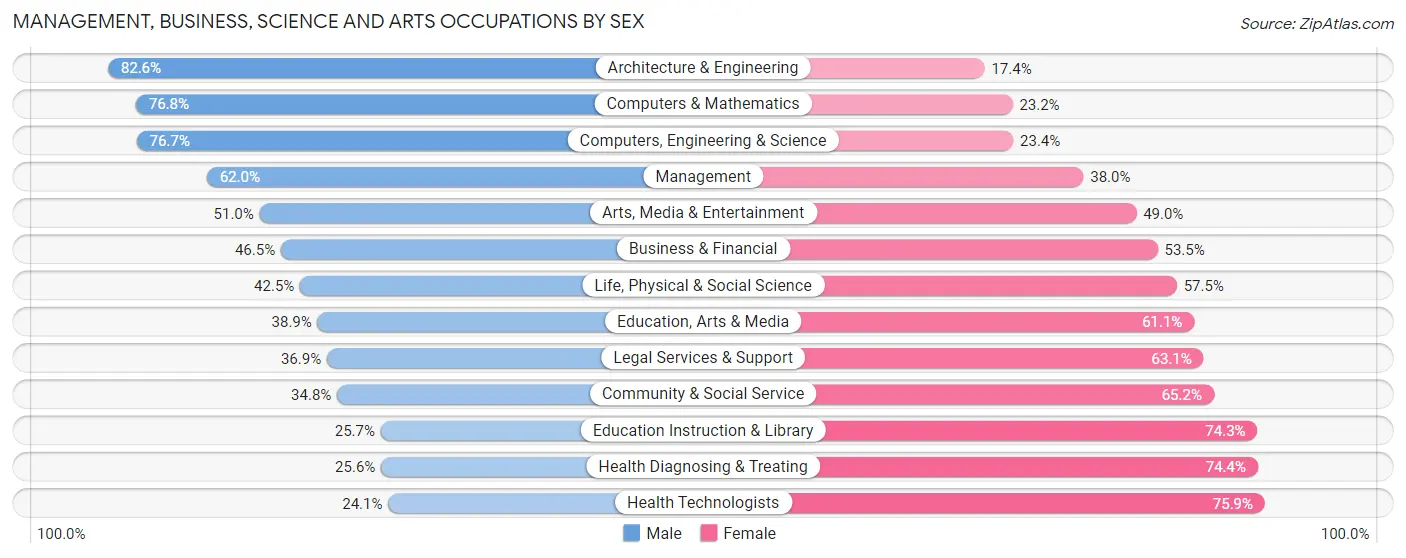
| Occupation | Male | Female |
| Management | 23,985 (62.0%) | 14,698 (38.0%) |
| Business & Financial | 10,712 (46.5%) | 12,317 (53.5%) |
| Computers, Engineering & Science | 33,694 (76.6%) | 10,262 (23.4%) |
| Computers & Mathematics | 14,669 (76.8%) | 4,433 (23.2%) |
| Architecture & Engineering | 17,425 (82.6%) | 3,666 (17.4%) |
| Life, Physical & Social Science | 1,600 (42.5%) | 2,163 (57.5%) |
| Community & Social Service | 11,099 (34.8%) | 20,796 (65.2%) |
| Education, Arts & Media | 1,887 (38.9%) | 2,967 (61.1%) |
| Legal Services & Support | 1,244 (36.9%) | 2,125 (63.1%) |
| Education Instruction & Library | 4,163 (25.7%) | 12,044 (74.3%) |
| Arts, Media & Entertainment | 3,805 (51.0%) | 3,660 (49.0%) |
| Health Diagnosing & Treating | 4,507 (25.6%) | 13,087 (74.4%) |
| Health Technologists | 3,054 (24.1%) | 9,597 (75.9%) |
| Total (Category) | 83,997 (54.1%) | 71,160 (45.9%) |
| Total (Overall) | 172,414 (54.5%) | 144,043 (45.5%) |
Services Occupations
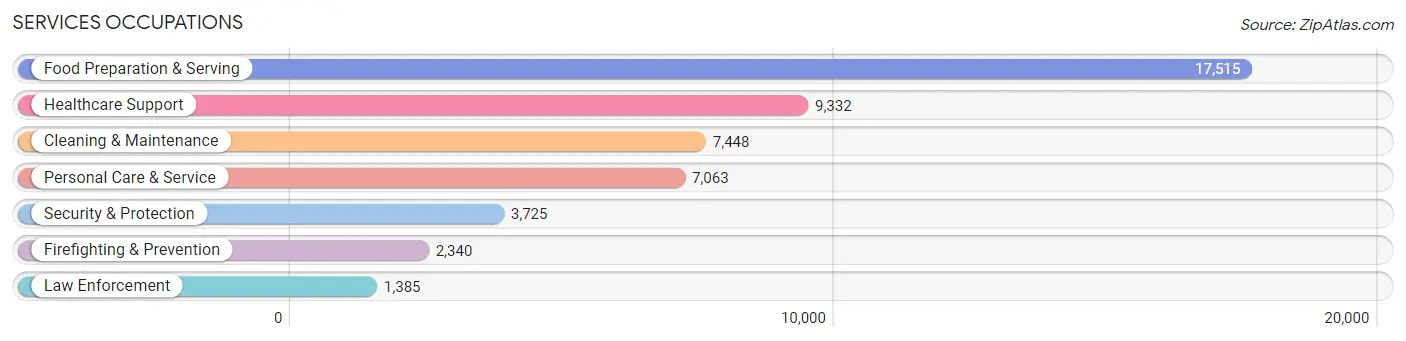
The most common Services occupations in Washington County are Food Preparation & Serving (17,515 | 5.5%), Healthcare Support (9,332 | 2.9%), Cleaning & Maintenance (7,448 | 2.4%), Personal Care & Service (7,063 | 2.2%), and Security & Protection (3,725 | 1.2%).
Services Occupations by Sex
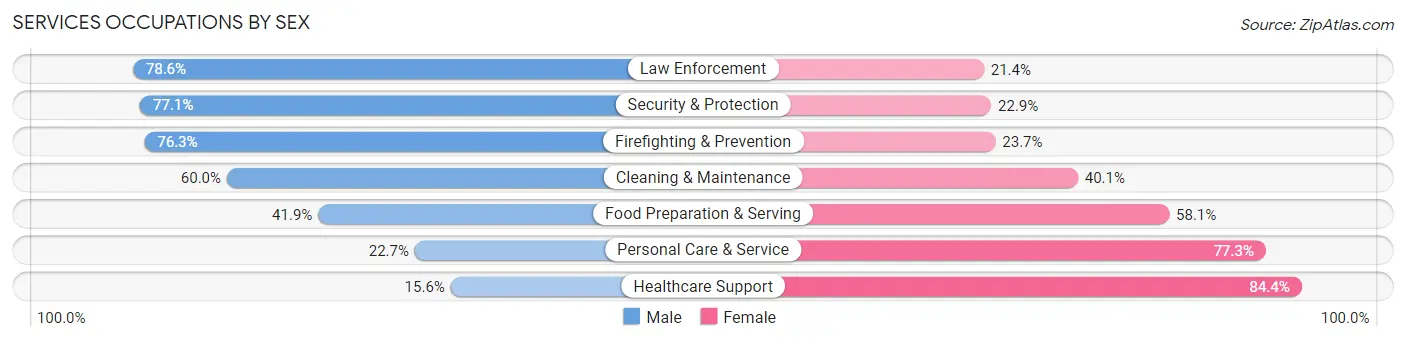
Within the Services occupations in Washington County, the most male-oriented occupations are Law Enforcement (78.6%), Security & Protection (77.1%), and Firefighting & Prevention (76.3%), while the most female-oriented occupations are Healthcare Support (84.4%), Personal Care & Service (77.3%), and Food Preparation & Serving (58.1%).
| Occupation | Male | Female |
| Healthcare Support | 1,459 (15.6%) | 7,873 (84.4%) |
| Security & Protection | 2,873 (77.1%) | 852 (22.9%) |
| Firefighting & Prevention | 1,785 (76.3%) | 555 (23.7%) |
| Law Enforcement | 1,088 (78.6%) | 297 (21.4%) |
| Food Preparation & Serving | 7,333 (41.9%) | 10,182 (58.1%) |
| Cleaning & Maintenance | 4,465 (60.0%) | 2,983 (40.1%) |
| Personal Care & Service | 1,606 (22.7%) | 5,457 (77.3%) |
| Total (Category) | 17,736 (39.3%) | 27,347 (60.7%) |
| Total (Overall) | 172,414 (54.5%) | 144,043 (45.5%) |
Sales and Office Occupations
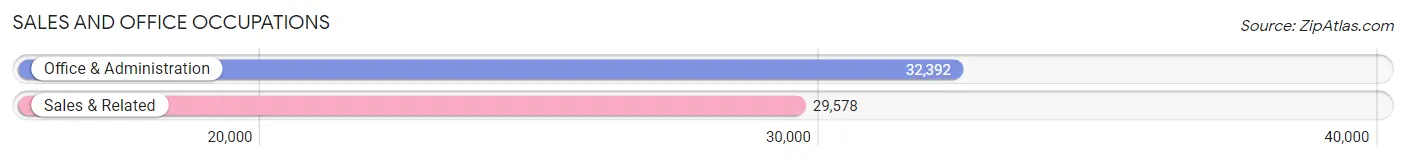
The most common Sales and Office occupations in Washington County are Office & Administration (32,392 | 10.2%), and Sales & Related (29,578 | 9.3%).
Sales and Office Occupations by Sex
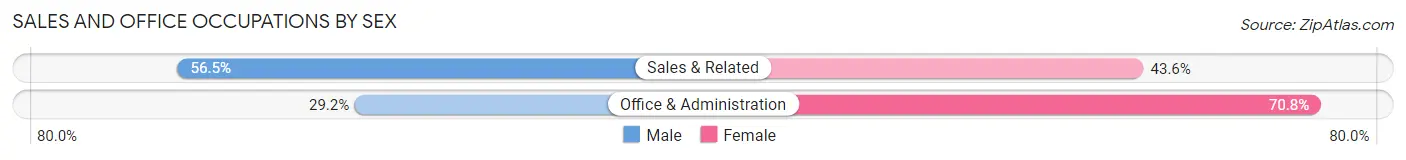
| Occupation | Male | Female |
| Sales & Related | 16,698 (56.5%) | 12,880 (43.5%) |
| Office & Administration | 9,447 (29.2%) | 22,945 (70.8%) |
| Total (Category) | 26,145 (42.2%) | 35,825 (57.8%) |
| Total (Overall) | 172,414 (54.5%) | 144,043 (45.5%) |
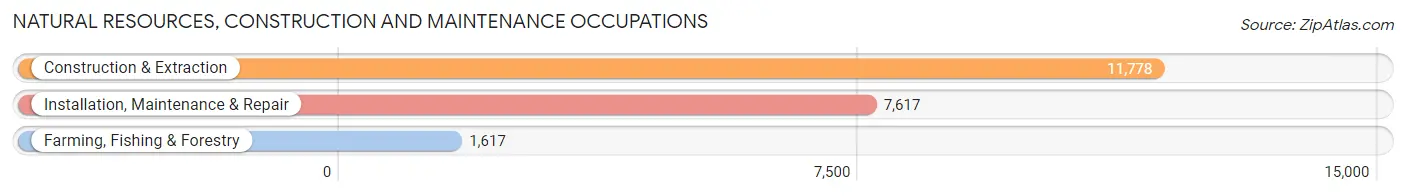
Natural Resources, Construction and Maintenance Occupations
The most common Natural Resources, Construction and Maintenance occupations in Washington County are Construction & Extraction (11,778 | 3.7%), Installation, Maintenance & Repair (7,617 | 2.4%), and Farming, Fishing & Forestry (1,617 | 0.5%).
Natural Resources, Construction and Maintenance Occupations by Sex
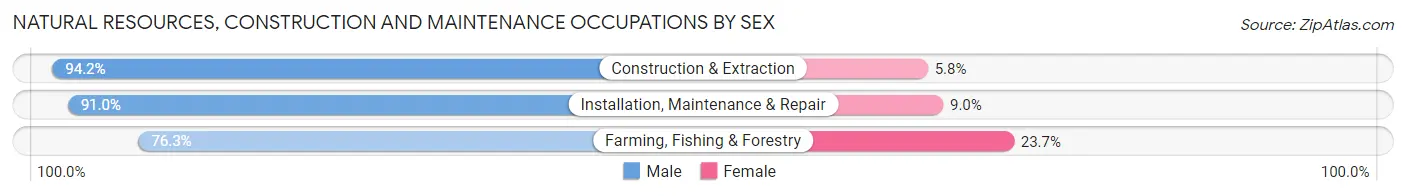
| Occupation | Male | Female |
| Farming, Fishing & Forestry | 1,234 (76.3%) | 383 (23.7%) |
| Construction & Extraction | 11,097 (94.2%) | 681 (5.8%) |
| Installation, Maintenance & Repair | 6,934 (91.0%) | 683 (9.0%) |
| Total (Category) | 19,265 (91.7%) | 1,747 (8.3%) |
| Total (Overall) | 172,414 (54.5%) | 144,043 (45.5%) |
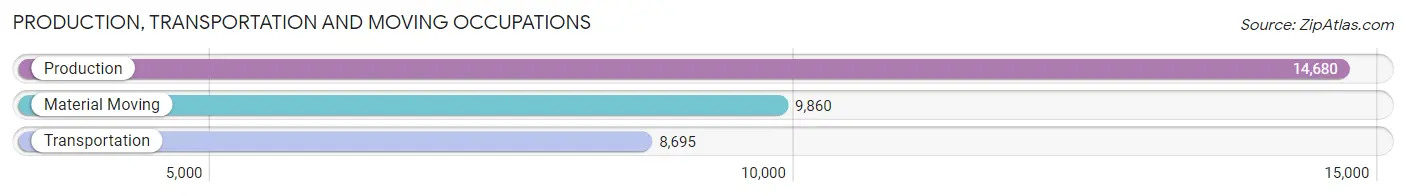
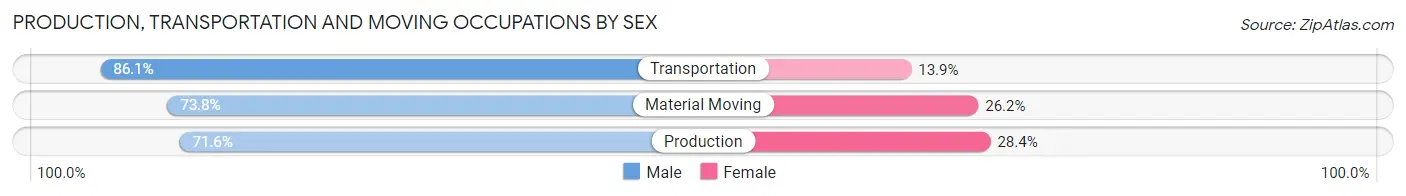
Production, Transportation and Moving Occupations
The most common Production, Transportation and Moving occupations in Washington County are Production (14,680 | 4.6%), Material Moving (9,860 | 3.1%), and Transportation (8,695 | 2.8%).
Production, Transportation and Moving Occupations by Sex
| Occupation | Male | Female |
| Production | 10,507 (71.6%) | 4,173 (28.4%) |
| Transportation | 7,486 (86.1%) | 1,209 (13.9%) |
| Material Moving | 7,278 (73.8%) | 2,582 (26.2%) |
| Total (Category) | 25,271 (76.0%) | 7,964 (24.0%) |
| Total (Overall) | 172,414 (54.5%) | 144,043 (45.5%) |
Employment Industries by Sex in Washington County
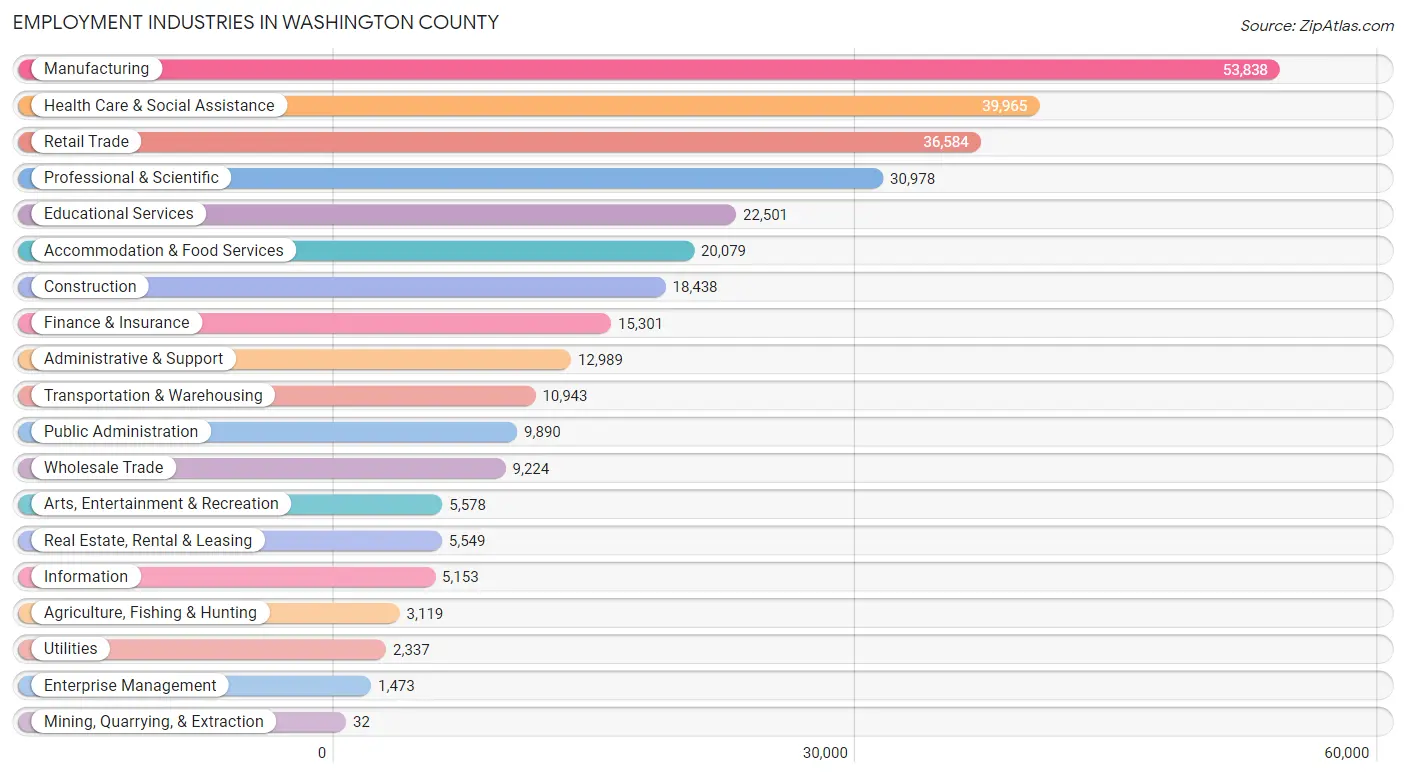
Employment Industries in Washington County
The major employment industries in Washington County include Manufacturing (53,838 | 17.0%), Health Care & Social Assistance (39,965 | 12.6%), Retail Trade (36,584 | 11.6%), Professional & Scientific (30,978 | 9.8%), and Educational Services (22,501 | 7.1%).
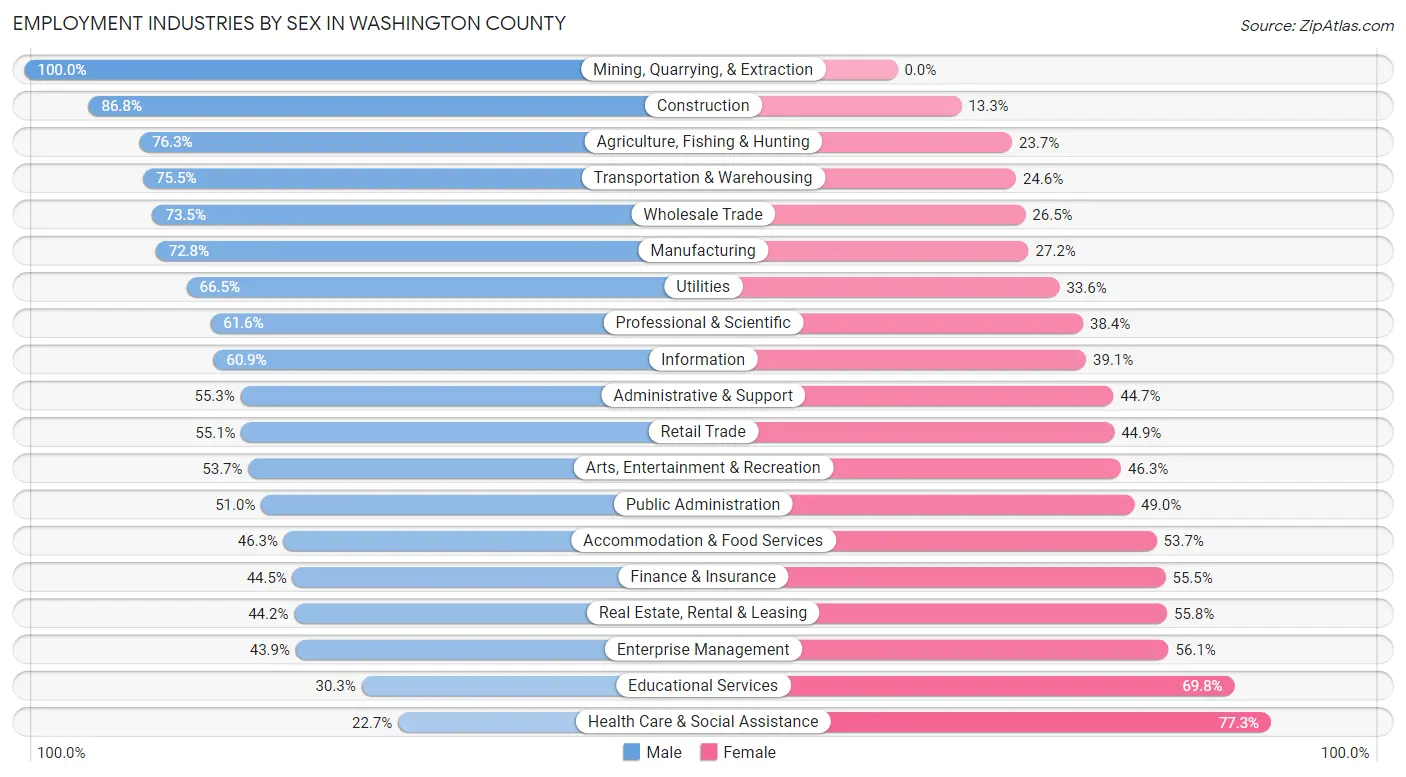
Employment Industries by Sex in Washington County
The Washington County industries that see more men than women are Mining, Quarrying, & Extraction (100.0%), Construction (86.8%), and Agriculture, Fishing & Hunting (76.3%), whereas the industries that tend to have a higher number of women are Health Care & Social Assistance (77.3%), Educational Services (69.8%), and Enterprise Management (56.1%).
| Industry | Male | Female |
| Agriculture, Fishing & Hunting | 2,379 (76.3%) | 740 (23.7%) |
| Mining, Quarrying, & Extraction | 32 (100.0%) | 0 (0.0%) |
| Construction | 15,995 (86.8%) | 2,443 (13.3%) |
| Manufacturing | 39,217 (72.8%) | 14,621 (27.2%) |
| Wholesale Trade | 6,781 (73.5%) | 2,443 (26.5%) |
| Retail Trade | 20,167 (55.1%) | 16,417 (44.9%) |
| Transportation & Warehousing | 8,256 (75.4%) | 2,687 (24.5%) |
| Utilities | 1,553 (66.4%) | 784 (33.6%) |
| Information | 3,140 (60.9%) | 2,013 (39.1%) |
| Finance & Insurance | 6,810 (44.5%) | 8,491 (55.5%) |
| Real Estate, Rental & Leasing | 2,452 (44.2%) | 3,097 (55.8%) |
| Professional & Scientific | 19,071 (61.6%) | 11,907 (38.4%) |
| Enterprise Management | 646 (43.9%) | 827 (56.1%) |
| Administrative & Support | 7,184 (55.3%) | 5,805 (44.7%) |
| Educational Services | 6,807 (30.2%) | 15,694 (69.8%) |
| Health Care & Social Assistance | 9,069 (22.7%) | 30,896 (77.3%) |
| Arts, Entertainment & Recreation | 2,995 (53.7%) | 2,583 (46.3%) |
| Accommodation & Food Services | 9,305 (46.3%) | 10,774 (53.7%) |
| Public Administration | 5,046 (51.0%) | 4,844 (49.0%) |
| Total | 172,414 (54.5%) | 144,043 (45.5%) |
Education in Washington County
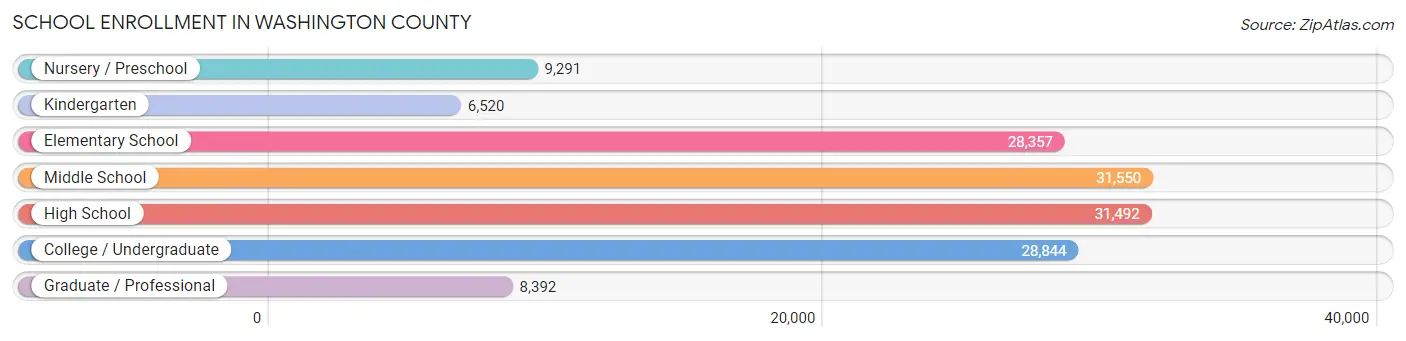
School Enrollment in Washington County
The most common levels of schooling among the 144,446 students in Washington County are middle school (31,550 | 21.8%), high school (31,492 | 21.8%), and college / undergraduate (28,844 | 20.0%).
| School Level | # Students | % Students |
| Nursery / Preschool | 9,291 | 6.4% |
| Kindergarten | 6,520 | 4.5% |
| Elementary School | 28,357 | 19.6% |
| Middle School | 31,550 | 21.8% |
| High School | 31,492 | 21.8% |
| College / Undergraduate | 28,844 | 20.0% |
| Graduate / Professional | 8,392 | 5.8% |
| Total | 144,446 | 100.0% |
School Enrollment by Age by Funding Source in Washington County
Out of a total of 144,446 students who are enrolled in schools in Washington County, 28,167 (19.5%) attend a private institution, while the remaining 116,279 (80.5%) are enrolled in public schools. The age group of 3 to 4 year olds has the highest likelihood of being enrolled in private schools, with 4,294 (64.5% in the age bracket) enrolled. Conversely, the age group of 15 to 17 year olds has the lowest likelihood of being enrolled in a private school, with 20,450 (88.8% in the age bracket) attending a public institution.
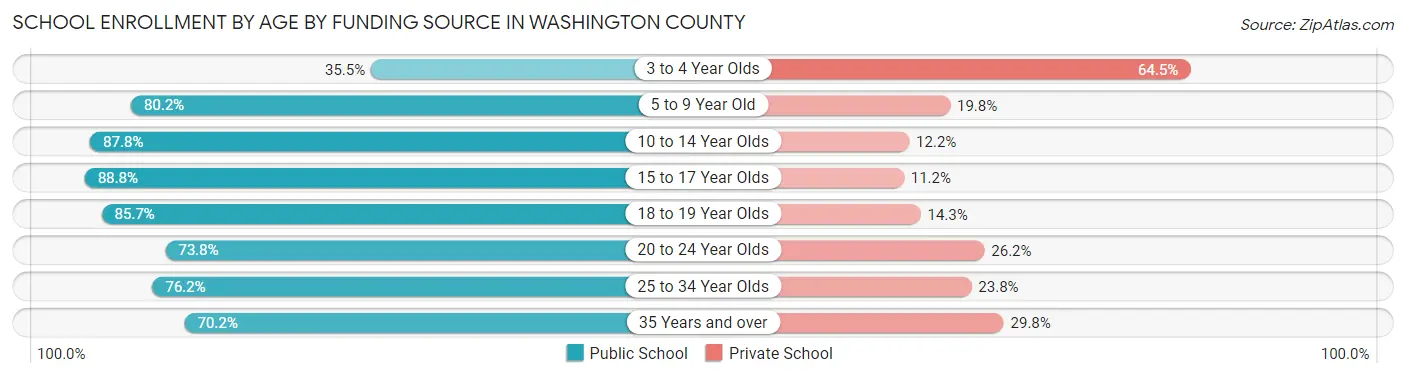
| Age Bracket | Public School | Private School |
| 3 to 4 Year Olds | 2,360 (35.5%) | 4,294 (64.5%) |
| 5 to 9 Year Old | 26,666 (80.2%) | 6,586 (19.8%) |
| 10 to 14 Year Olds | 34,591 (87.8%) | 4,807 (12.2%) |
| 15 to 17 Year Olds | 20,450 (88.8%) | 2,578 (11.2%) |
| 18 to 19 Year Olds | 8,149 (85.7%) | 1,362 (14.3%) |
| 20 to 24 Year Olds | 9,514 (73.8%) | 3,380 (26.2%) |
| 25 to 34 Year Olds | 8,667 (76.2%) | 2,706 (23.8%) |
| 35 Years and over | 5,853 (70.2%) | 2,483 (29.8%) |
| Total | 116,279 (80.5%) | 28,167 (19.5%) |
Educational Attainment by Field of Study in Washington County
Business (37,167 | 17.8%), engineering (29,053 | 13.9%), science & technology (16,863 | 8.1%), social sciences (15,713 | 7.5%), and education (15,516 | 7.4%) are the most common fields of study among 208,609 individuals in Washington County who have obtained a bachelor's degree or higher.
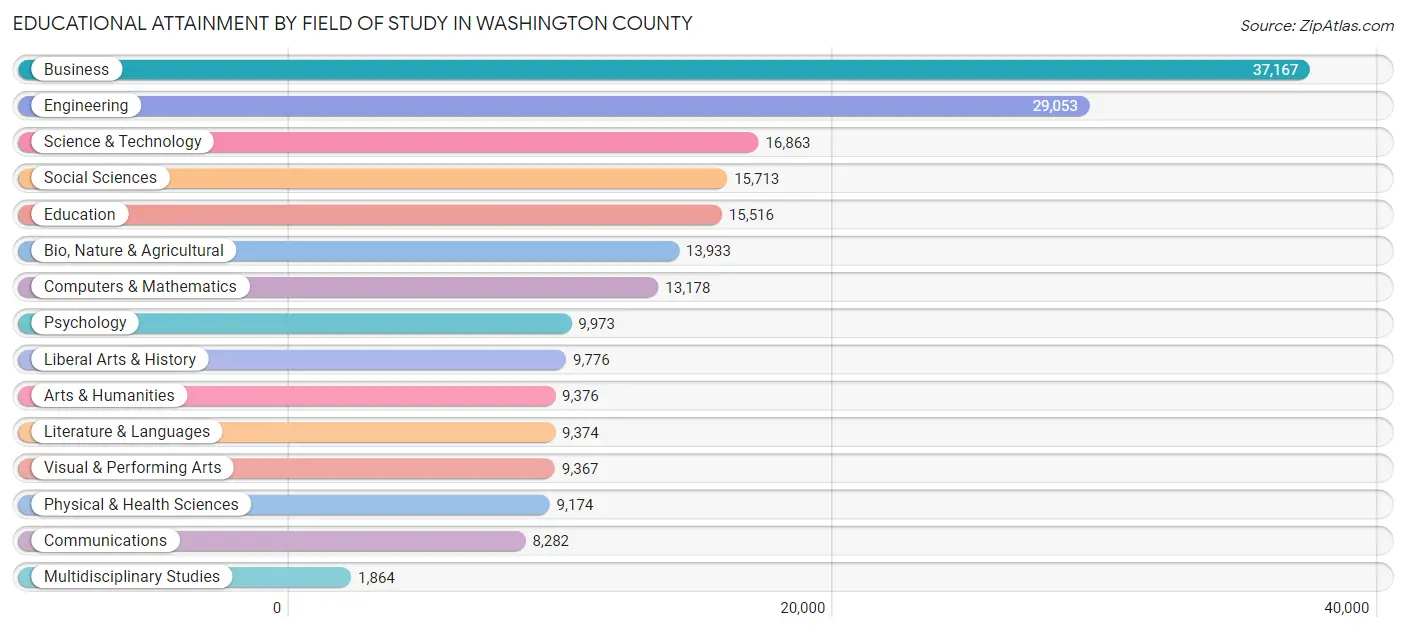
| Field of Study | # Graduates | % Graduates |
| Computers & Mathematics | 13,178 | 6.3% |
| Bio, Nature & Agricultural | 13,933 | 6.7% |
| Physical & Health Sciences | 9,174 | 4.4% |
| Psychology | 9,973 | 4.8% |
| Social Sciences | 15,713 | 7.5% |
| Engineering | 29,053 | 13.9% |
| Multidisciplinary Studies | 1,864 | 0.9% |
| Science & Technology | 16,863 | 8.1% |
| Business | 37,167 | 17.8% |
| Education | 15,516 | 7.4% |
| Literature & Languages | 9,374 | 4.5% |
| Liberal Arts & History | 9,776 | 4.7% |
| Visual & Performing Arts | 9,367 | 4.5% |
| Communications | 8,282 | 4.0% |
| Arts & Humanities | 9,376 | 4.5% |
| Total | 208,609 | 100.0% |
Transportation & Commute in Washington County
Vehicle Availability by Sex in Washington County
The most prevalent vehicle ownership categories in Washington County are males with 2 vehicles (78,646, accounting for 46.1%) and females with 2 vehicles (62,184, making up 56.0%).
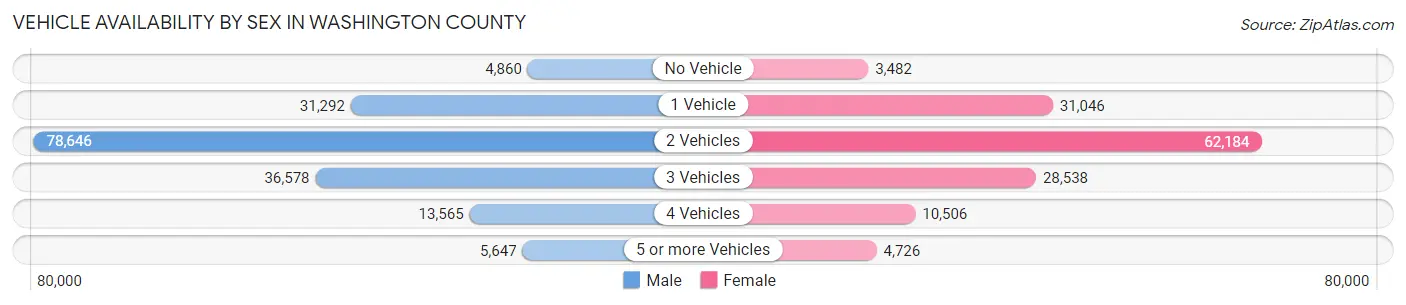
| Vehicles Available | Male | Female |
| No Vehicle | 4,860 (2.9%) | 3,482 (2.5%) |
| 1 Vehicle | 31,292 (18.3%) | 31,046 (22.1%) |
| 2 Vehicles | 78,646 (46.1%) | 62,184 (44.3%) |
| 3 Vehicles | 36,578 (21.4%) | 28,538 (20.3%) |
| 4 Vehicles | 13,565 (8.0%) | 10,506 (7.5%) |
| 5 or more Vehicles | 5,647 (3.3%) | 4,726 (3.4%) |
| Total | 170,588 (100.0%) | 140,482 (100.0%) |
Commute Time in Washington County
The most frequently occuring commute durations in Washington County are 15 to 19 minutes (42,305 commuters, 16.7%), 20 to 24 minutes (39,005 commuters, 15.4%), and 10 to 14 minutes (38,533 commuters, 15.2%).
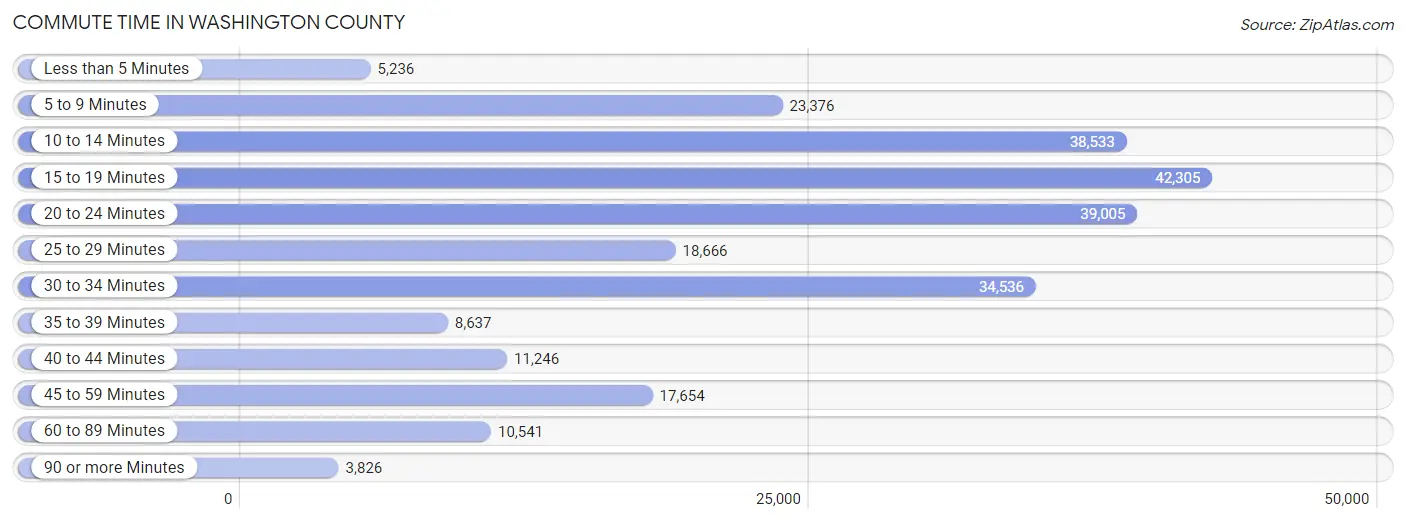
| Commute Time | # Commuters | % Commuters |
| Less than 5 Minutes | 5,236 | 2.1% |
| 5 to 9 Minutes | 23,376 | 9.2% |
| 10 to 14 Minutes | 38,533 | 15.2% |
| 15 to 19 Minutes | 42,305 | 16.7% |
| 20 to 24 Minutes | 39,005 | 15.4% |
| 25 to 29 Minutes | 18,666 | 7.4% |
| 30 to 34 Minutes | 34,536 | 13.6% |
| 35 to 39 Minutes | 8,637 | 3.4% |
| 40 to 44 Minutes | 11,246 | 4.4% |
| 45 to 59 Minutes | 17,654 | 7.0% |
| 60 to 89 Minutes | 10,541 | 4.2% |
| 90 or more Minutes | 3,826 | 1.5% |
Commute Time by Sex in Washington County
The most common commute times in Washington County are 15 to 19 minutes (22,858 commuters, 16.3%) for males and 15 to 19 minutes (19,447 commuters, 17.1%) for females.
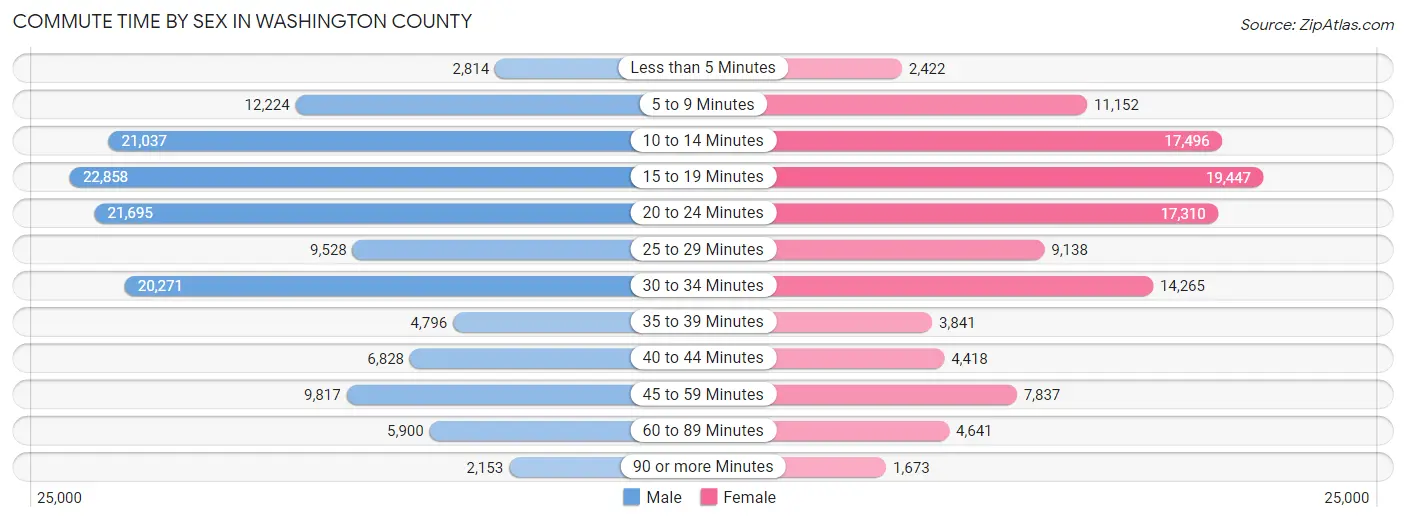
| Commute Time | Male | Female |
| Less than 5 Minutes | 2,814 (2.0%) | 2,422 (2.1%) |
| 5 to 9 Minutes | 12,224 (8.7%) | 11,152 (9.8%) |
| 10 to 14 Minutes | 21,037 (15.0%) | 17,496 (15.4%) |
| 15 to 19 Minutes | 22,858 (16.3%) | 19,447 (17.1%) |
| 20 to 24 Minutes | 21,695 (15.5%) | 17,310 (15.2%) |
| 25 to 29 Minutes | 9,528 (6.8%) | 9,138 (8.0%) |
| 30 to 34 Minutes | 20,271 (14.5%) | 14,265 (12.6%) |
| 35 to 39 Minutes | 4,796 (3.4%) | 3,841 (3.4%) |
| 40 to 44 Minutes | 6,828 (4.9%) | 4,418 (3.9%) |
| 45 to 59 Minutes | 9,817 (7.0%) | 7,837 (6.9%) |
| 60 to 89 Minutes | 5,900 (4.2%) | 4,641 (4.1%) |
| 90 or more Minutes | 2,153 (1.5%) | 1,673 (1.5%) |
Time of Departure to Work by Sex in Washington County
The most frequent times of departure to work in Washington County are 7:00 AM to 7:29 AM (20,023, 14.3%) for males and 7:30 AM to 7:59 AM (16,558, 14.6%) for females.
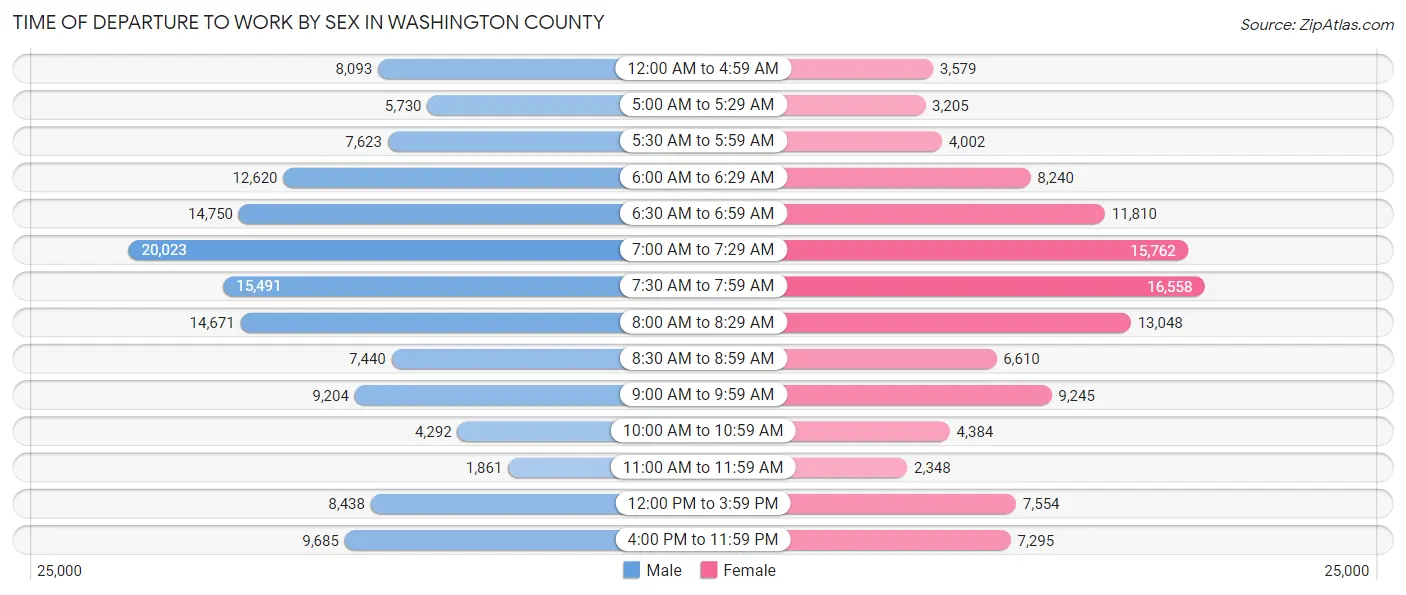
| Time of Departure | Male | Female |
| 12:00 AM to 4:59 AM | 8,093 (5.8%) | 3,579 (3.2%) |
| 5:00 AM to 5:29 AM | 5,730 (4.1%) | 3,205 (2.8%) |
| 5:30 AM to 5:59 AM | 7,623 (5.4%) | 4,002 (3.5%) |
| 6:00 AM to 6:29 AM | 12,620 (9.0%) | 8,240 (7.2%) |
| 6:30 AM to 6:59 AM | 14,750 (10.5%) | 11,810 (10.4%) |
| 7:00 AM to 7:29 AM | 20,023 (14.3%) | 15,762 (13.9%) |
| 7:30 AM to 7:59 AM | 15,491 (11.1%) | 16,558 (14.6%) |
| 8:00 AM to 8:29 AM | 14,671 (10.5%) | 13,048 (11.5%) |
| 8:30 AM to 8:59 AM | 7,440 (5.3%) | 6,610 (5.8%) |
| 9:00 AM to 9:59 AM | 9,204 (6.6%) | 9,245 (8.1%) |
| 10:00 AM to 10:59 AM | 4,292 (3.1%) | 4,384 (3.9%) |
| 11:00 AM to 11:59 AM | 1,861 (1.3%) | 2,348 (2.1%) |
| 12:00 PM to 3:59 PM | 8,438 (6.0%) | 7,554 (6.7%) |
| 4:00 PM to 11:59 PM | 9,685 (6.9%) | 7,295 (6.4%) |
| Total | 139,921 (100.0%) | 113,640 (100.0%) |
Housing Occupancy in Washington County
Occupancy by Ownership in Washington County
Of the total 230,122 dwellings in Washington County, owner-occupied units account for 140,168 (60.9%), while renter-occupied units make up 89,954 (39.1%).
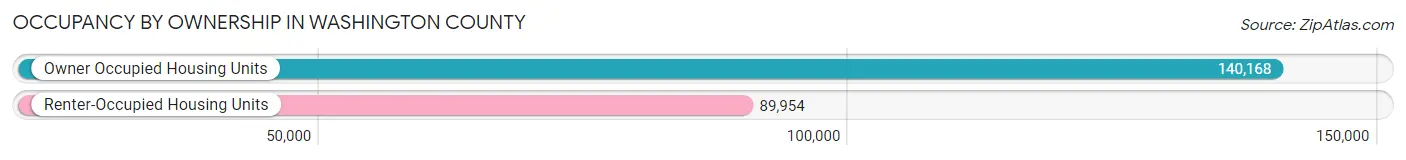
| Occupancy | # Housing Units | % Housing Units |
| Owner Occupied Housing Units | 140,168 | 60.9% |
| Renter-Occupied Housing Units | 89,954 | 39.1% |
| Total Occupied Housing Units | 230,122 | 100.0% |
Occupancy by Household Size in Washington County
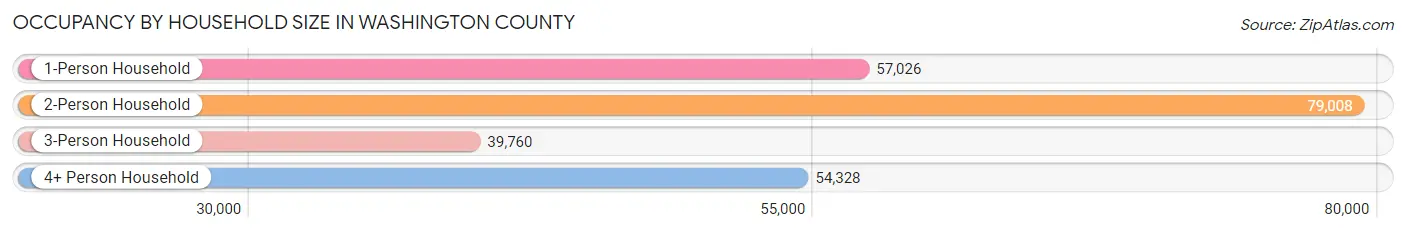
| Household Size | # Housing Units | % Housing Units |
| 1-Person Household | 57,026 | 24.8% |
| 2-Person Household | 79,008 | 34.3% |
| 3-Person Household | 39,760 | 17.3% |
| 4+ Person Household | 54,328 | 23.6% |
| Total Housing Units | 230,122 | 100.0% |
Occupancy by Ownership by Household Size in Washington County
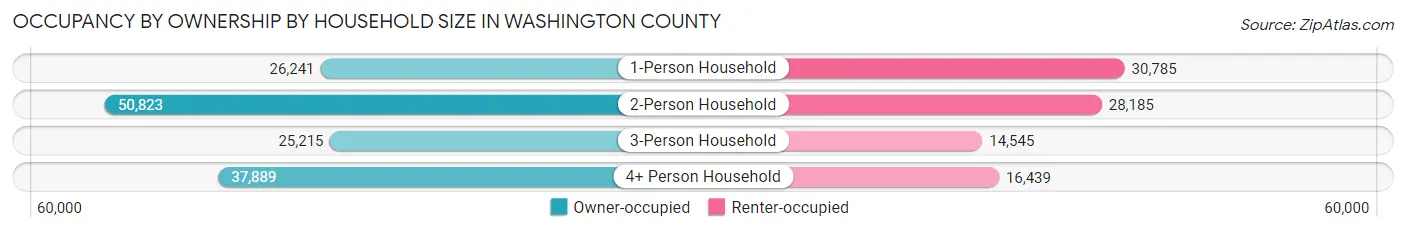
| Household Size | Owner-occupied | Renter-occupied |
| 1-Person Household | 26,241 (46.0%) | 30,785 (54.0%) |
| 2-Person Household | 50,823 (64.3%) | 28,185 (35.7%) |
| 3-Person Household | 25,215 (63.4%) | 14,545 (36.6%) |
| 4+ Person Household | 37,889 (69.7%) | 16,439 (30.3%) |
| Total Housing Units | 140,168 (60.9%) | 89,954 (39.1%) |
Occupancy by Educational Attainment in Washington County
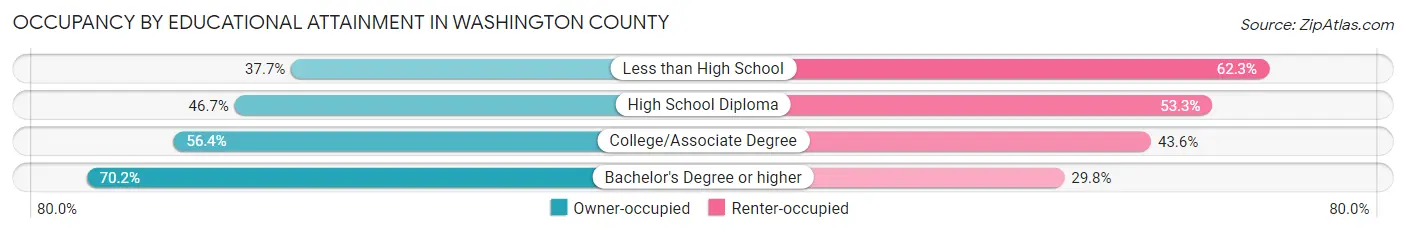
| Household Size | Owner-occupied | Renter-occupied |
| Less than High School | 4,522 (37.7%) | 7,465 (62.3%) |
| High School Diploma | 15,244 (46.7%) | 17,415 (53.3%) |
| College/Associate Degree | 39,849 (56.4%) | 30,811 (43.6%) |
| Bachelor's Degree or higher | 80,553 (70.2%) | 34,263 (29.8%) |
Occupancy by Age of Householder in Washington County
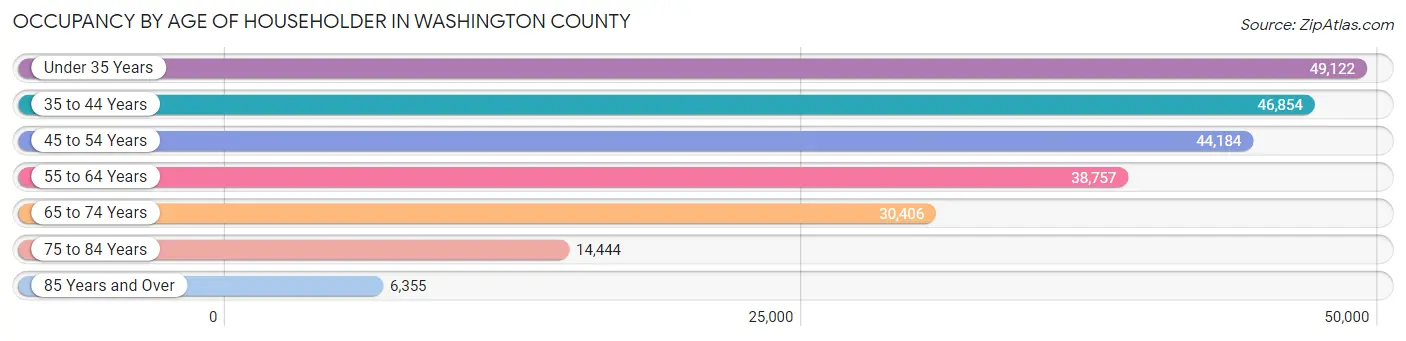
| Age Bracket | # Households | % Households |
| Under 35 Years | 49,122 | 21.3% |
| 35 to 44 Years | 46,854 | 20.4% |
| 45 to 54 Years | 44,184 | 19.2% |
| 55 to 64 Years | 38,757 | 16.8% |
| 65 to 74 Years | 30,406 | 13.2% |
| 75 to 84 Years | 14,444 | 6.3% |
| 85 Years and Over | 6,355 | 2.8% |
| Total | 230,122 | 100.0% |
Housing Finances in Washington County
Median Income by Occupancy in Washington County
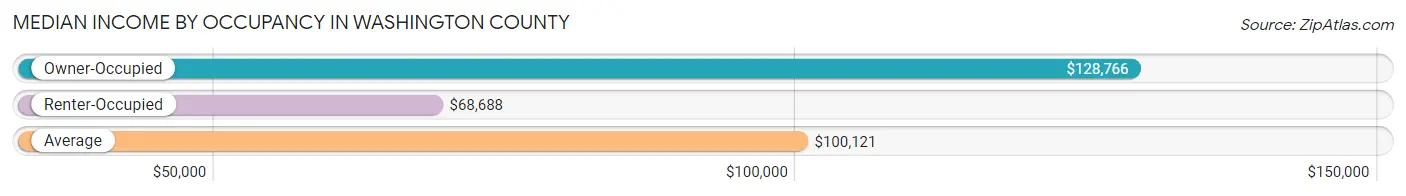
| Occupancy Type | # Households | Median Income |
| Owner-Occupied | 140,168 (60.9%) | $128,766 |
| Renter-Occupied | 89,954 (39.1%) | $68,688 |
| Average | 230,122 (100.0%) | $100,121 |
Occupancy by Householder Income Bracket in Washington County
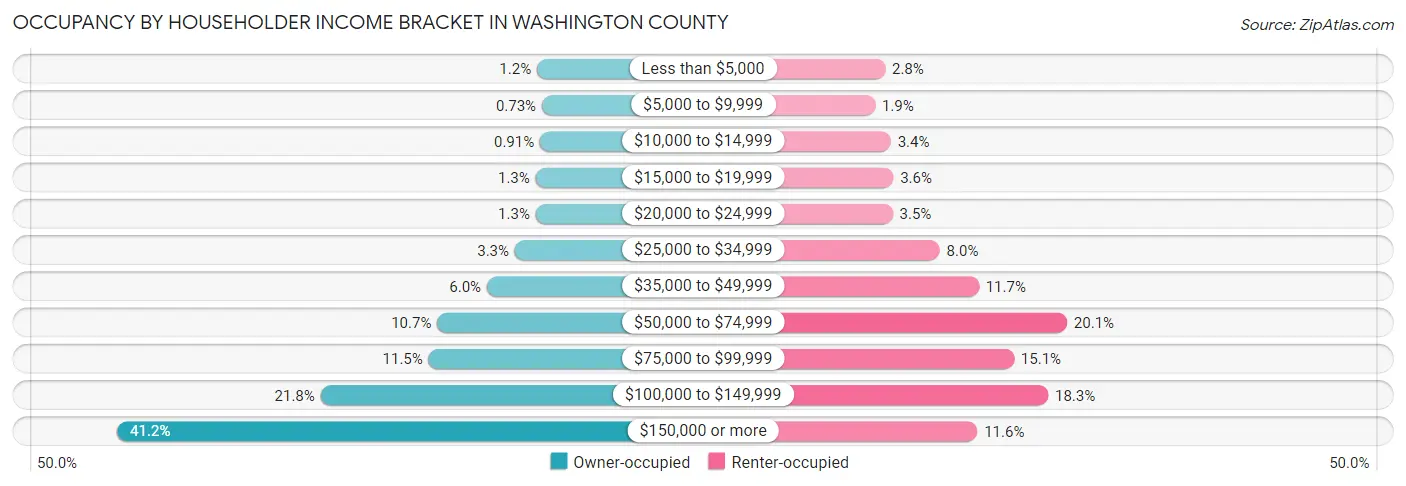
| Income Bracket | Owner-occupied | Renter-occupied |
| Less than $5,000 | 1,681 (1.2%) | 2,530 (2.8%) |
| $5,000 to $9,999 | 1,027 (0.7%) | 1,661 (1.8%) |
| $10,000 to $14,999 | 1,269 (0.9%) | 3,015 (3.4%) |
| $15,000 to $19,999 | 1,867 (1.3%) | 3,226 (3.6%) |
| $20,000 to $24,999 | 1,852 (1.3%) | 3,178 (3.5%) |
| $25,000 to $34,999 | 4,645 (3.3%) | 7,203 (8.0%) |
| $35,000 to $49,999 | 8,374 (6.0%) | 10,555 (11.7%) |
| $50,000 to $74,999 | 15,002 (10.7%) | 18,106 (20.1%) |
| $75,000 to $99,999 | 16,150 (11.5%) | 13,566 (15.1%) |
| $100,000 to $149,999 | 30,571 (21.8%) | 16,489 (18.3%) |
| $150,000 or more | 57,730 (41.2%) | 10,425 (11.6%) |
| Total | 140,168 (100.0%) | 89,954 (100.0%) |
Monthly Housing Cost Tiers in Washington County
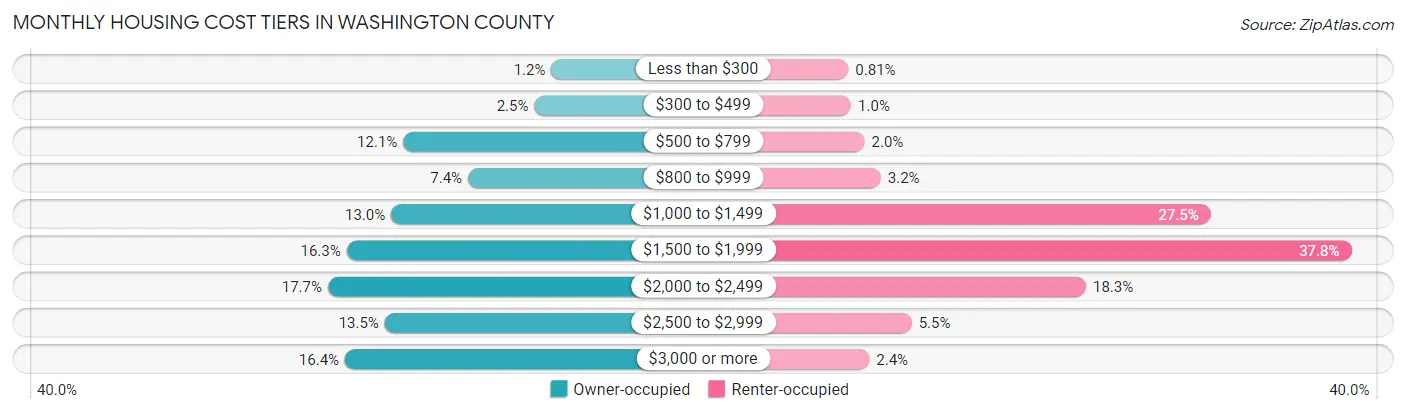
| Monthly Cost | Owner-occupied | Renter-occupied |
| Less than $300 | 1,693 (1.2%) | 730 (0.8%) |
| $300 to $499 | 3,454 (2.5%) | 905 (1.0%) |
| $500 to $799 | 16,994 (12.1%) | 1,803 (2.0%) |
| $800 to $999 | 10,296 (7.3%) | 2,882 (3.2%) |
| $1,000 to $1,499 | 18,242 (13.0%) | 24,715 (27.5%) |
| $1,500 to $1,999 | 22,833 (16.3%) | 34,043 (37.8%) |
| $2,000 to $2,499 | 24,769 (17.7%) | 16,472 (18.3%) |
| $2,500 to $2,999 | 18,890 (13.5%) | 4,920 (5.5%) |
| $3,000 or more | 22,997 (16.4%) | 2,114 (2.4%) |
| Total | 140,168 (100.0%) | 89,954 (100.0%) |
Physical Housing Characteristics in Washington County
Housing Structures in Washington County
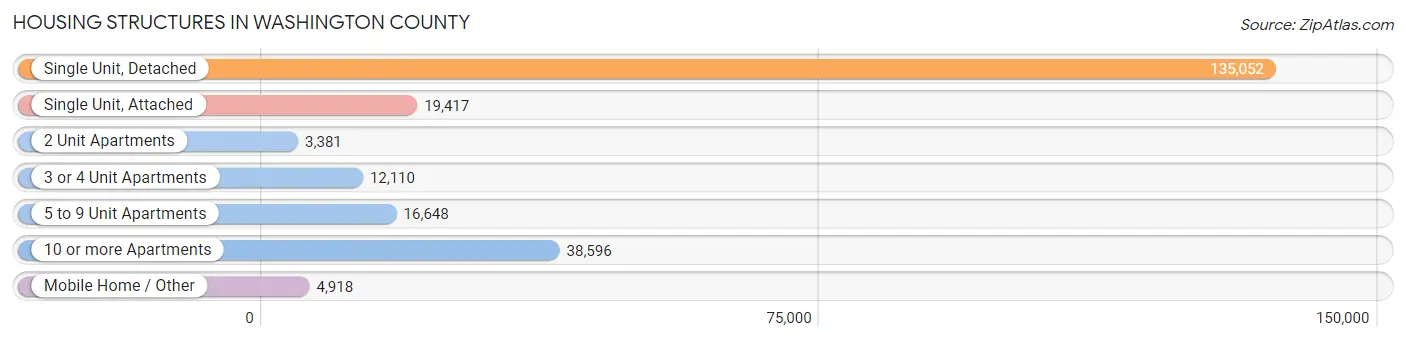
| Structure Type | # Housing Units | % Housing Units |
| Single Unit, Detached | 135,052 | 58.7% |
| Single Unit, Attached | 19,417 | 8.4% |
| 2 Unit Apartments | 3,381 | 1.5% |
| 3 or 4 Unit Apartments | 12,110 | 5.3% |
| 5 to 9 Unit Apartments | 16,648 | 7.2% |
| 10 or more Apartments | 38,596 | 16.8% |
| Mobile Home / Other | 4,918 | 2.1% |
| Total | 230,122 | 100.0% |
Housing Structures by Occupancy in Washington County
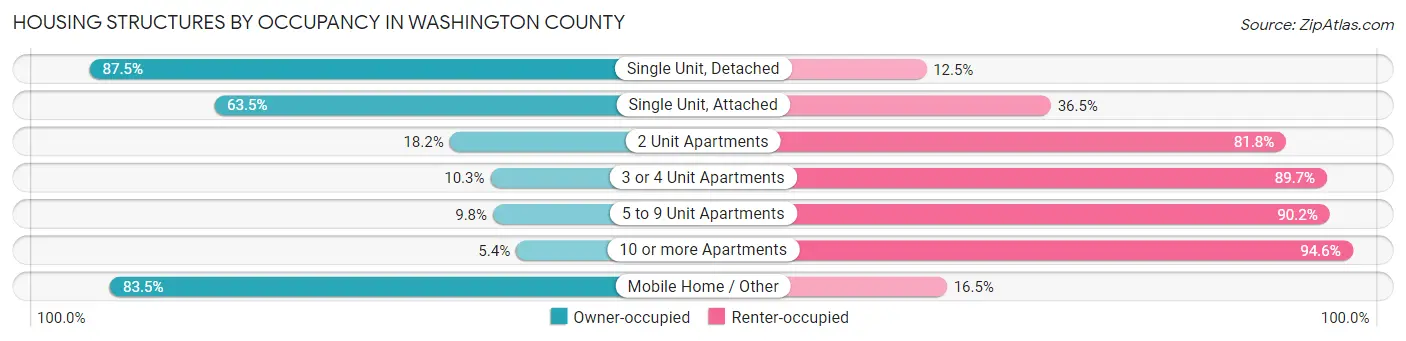
| Structure Type | Owner-occupied | Renter-occupied |
| Single Unit, Detached | 118,143 (87.5%) | 16,909 (12.5%) |
| Single Unit, Attached | 12,332 (63.5%) | 7,085 (36.5%) |
| 2 Unit Apartments | 615 (18.2%) | 2,766 (81.8%) |
| 3 or 4 Unit Apartments | 1,252 (10.3%) | 10,858 (89.7%) |
| 5 to 9 Unit Apartments | 1,638 (9.8%) | 15,010 (90.2%) |
| 10 or more Apartments | 2,080 (5.4%) | 36,516 (94.6%) |
| Mobile Home / Other | 4,108 (83.5%) | 810 (16.5%) |
| Total | 140,168 (60.9%) | 89,954 (39.1%) |
Housing Structures by Number of Rooms in Washington County
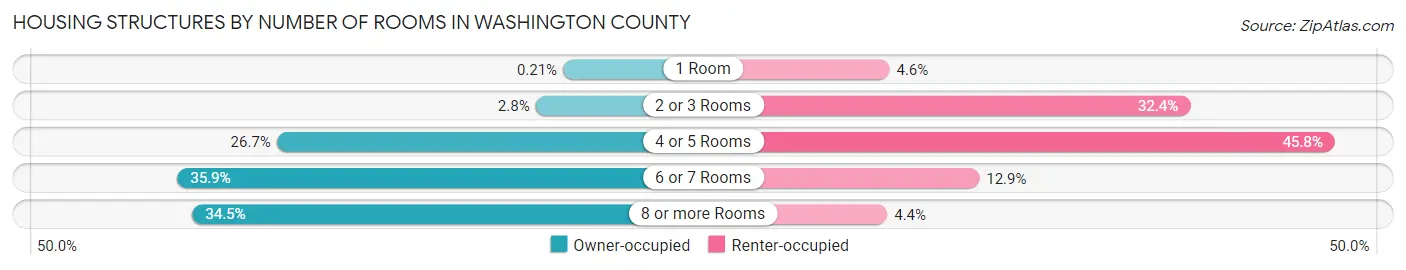
| Number of Rooms | Owner-occupied | Renter-occupied |
| 1 Room | 291 (0.2%) | 4,128 (4.6%) |
| 2 or 3 Rooms | 3,860 (2.8%) | 29,126 (32.4%) |
| 4 or 5 Rooms | 37,406 (26.7%) | 41,164 (45.8%) |
| 6 or 7 Rooms | 50,282 (35.9%) | 11,594 (12.9%) |
| 8 or more Rooms | 48,329 (34.5%) | 3,942 (4.4%) |
| Total | 140,168 (100.0%) | 89,954 (100.0%) |
Housing Structure by Heating Type in Washington County
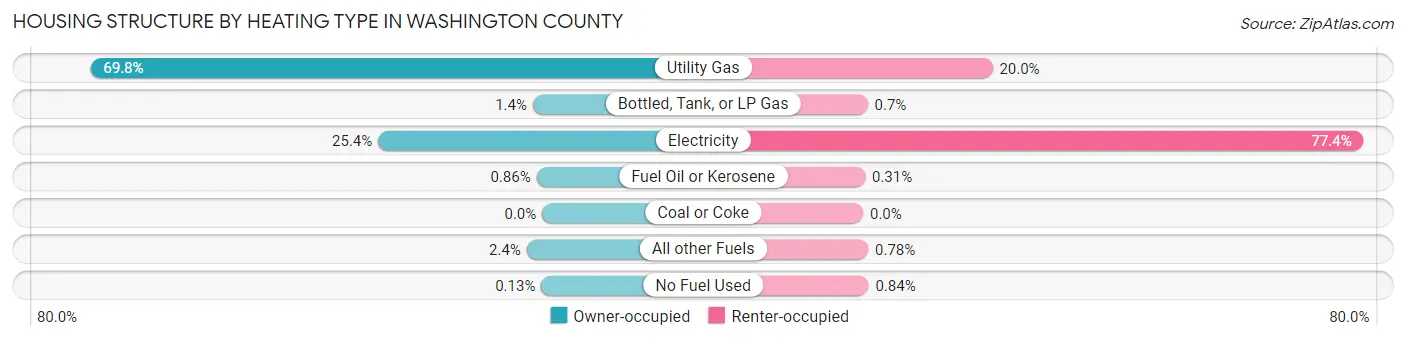
| Heating Type | Owner-occupied | Renter-occupied |
| Utility Gas | 97,883 (69.8%) | 17,988 (20.0%) |
| Bottled, Tank, or LP Gas | 2,025 (1.4%) | 634 (0.7%) |
| Electricity | 35,528 (25.4%) | 69,595 (77.4%) |
| Fuel Oil or Kerosene | 1,212 (0.9%) | 281 (0.3%) |
| Coal or Coke | 0 (0.0%) | 0 (0.0%) |
| All other Fuels | 3,342 (2.4%) | 698 (0.8%) |
| No Fuel Used | 178 (0.1%) | 758 (0.8%) |
| Total | 140,168 (100.0%) | 89,954 (100.0%) |
Household Vehicle Usage in Washington County
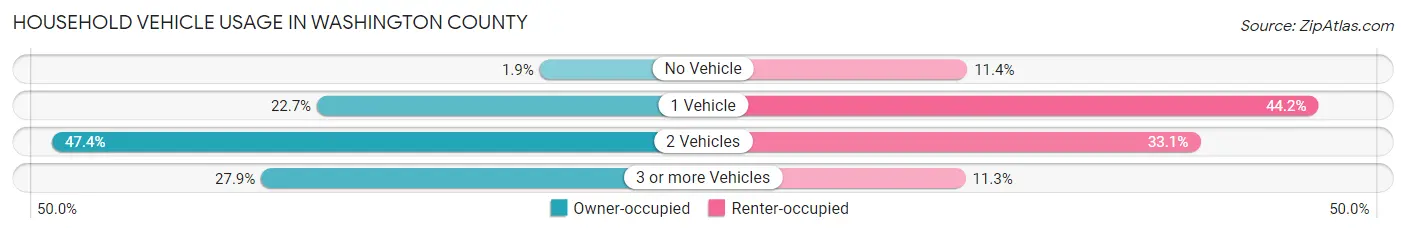
| Vehicles per Household | Owner-occupied | Renter-occupied |
| No Vehicle | 2,706 (1.9%) | 10,277 (11.4%) |
| 1 Vehicle | 31,838 (22.7%) | 39,738 (44.2%) |
| 2 Vehicles | 66,492 (47.4%) | 29,811 (33.1%) |
| 3 or more Vehicles | 39,132 (27.9%) | 10,128 (11.3%) |
| Total | 140,168 (100.0%) | 89,954 (100.0%) |
Real Estate & Mortgages in Washington County
Real Estate and Mortgage Overview in Washington County
| Characteristic | Without Mortgage | With Mortgage |
| Housing Units | 39,068 | 101,100 |
| Median Property Value | $489,700 | $512,200 |
| Median Household Income | $94,108 | $46,071 |
| Monthly Housing Costs | $778 | $22,815 |
| Real Estate Taxes | $4,659 | $1,204 |
Property Value by Mortgage Status in Washington County
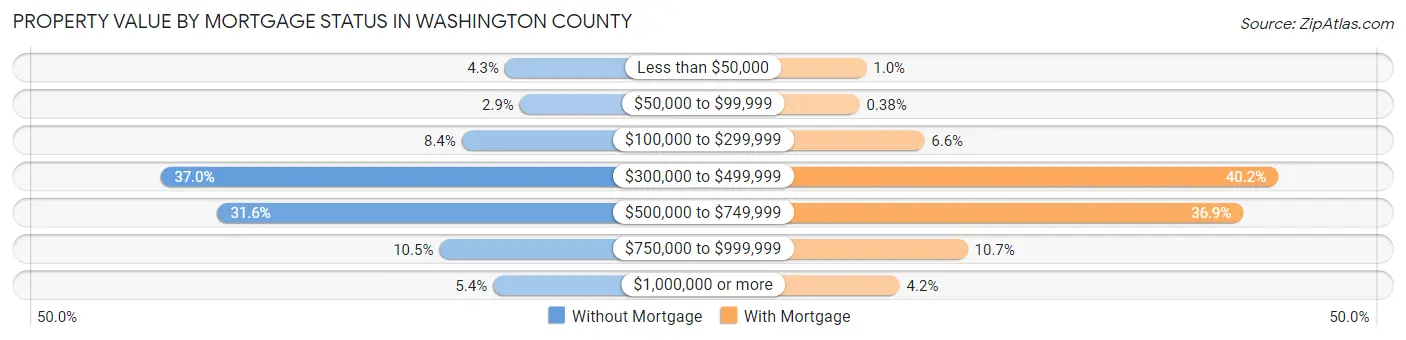
| Property Value | Without Mortgage | With Mortgage |
| Less than $50,000 | 1,663 (4.3%) | 1,038 (1.0%) |
| $50,000 to $99,999 | 1,113 (2.9%) | 385 (0.4%) |
| $100,000 to $299,999 | 3,272 (8.4%) | 6,626 (6.6%) |
| $300,000 to $499,999 | 14,449 (37.0%) | 40,674 (40.2%) |
| $500,000 to $749,999 | 12,358 (31.6%) | 37,336 (36.9%) |
| $750,000 to $999,999 | 4,108 (10.5%) | 10,791 (10.7%) |
| $1,000,000 or more | 2,105 (5.4%) | 4,250 (4.2%) |
| Total | 39,068 (100.0%) | 101,100 (100.0%) |
Household Income by Mortgage Status in Washington County
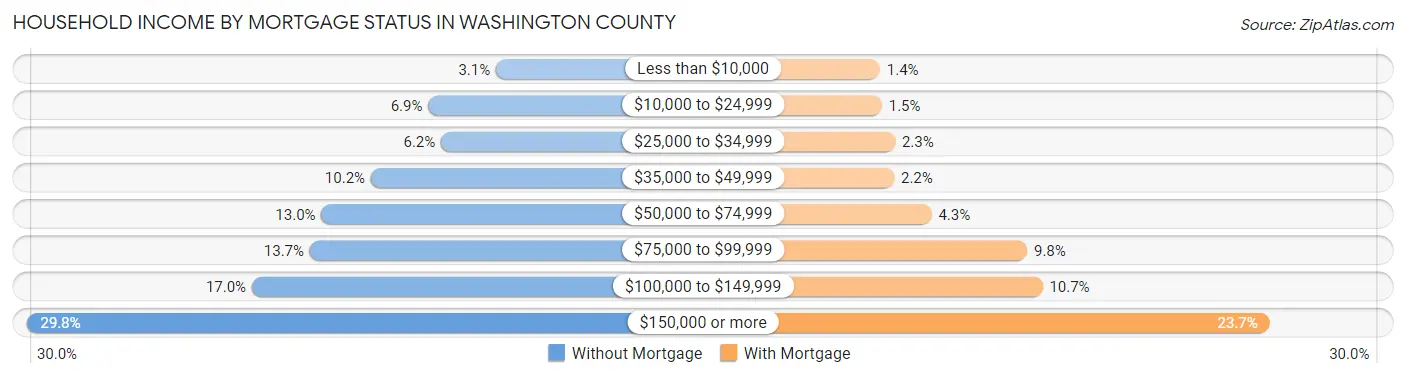
| Household Income | Without Mortgage | With Mortgage |
| Less than $10,000 | 1,196 (3.1%) | 1,406 (1.4%) |
| $10,000 to $24,999 | 2,709 (6.9%) | 1,512 (1.5%) |
| $25,000 to $34,999 | 2,423 (6.2%) | 2,279 (2.2%) |
| $35,000 to $49,999 | 3,988 (10.2%) | 2,222 (2.2%) |
| $50,000 to $74,999 | 5,095 (13.0%) | 4,386 (4.3%) |
| $75,000 to $99,999 | 5,351 (13.7%) | 9,907 (9.8%) |
| $100,000 to $149,999 | 6,647 (17.0%) | 10,799 (10.7%) |
| $150,000 or more | 11,659 (29.8%) | 23,924 (23.7%) |
| Total | 39,068 (100.0%) | 101,100 (100.0%) |
Property Value to Household Income Ratio in Washington County
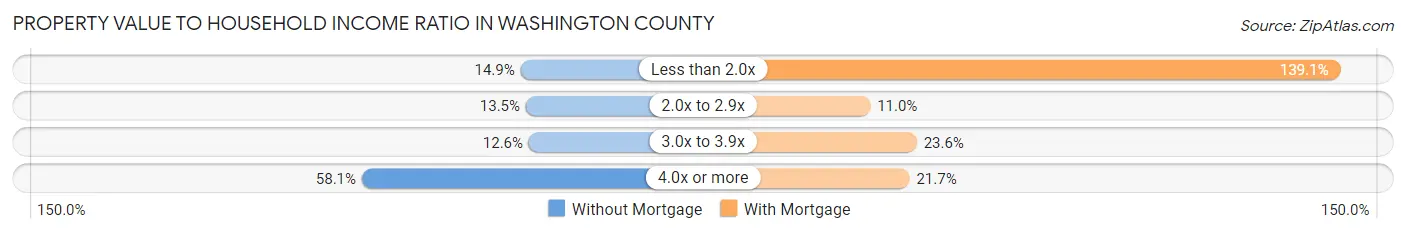
| Value-to-Income Ratio | Without Mortgage | With Mortgage |
| Less than 2.0x | 5,823 (14.9%) | 140,610 (139.1%) |
| 2.0x to 2.9x | 5,253 (13.5%) | 11,092 (11.0%) |
| 3.0x to 3.9x | 4,933 (12.6%) | 23,901 (23.6%) |
| 4.0x or more | 22,707 (58.1%) | 21,921 (21.7%) |
| Total | 39,068 (100.0%) | 101,100 (100.0%) |
Real Estate Taxes by Mortgage Status in Washington County
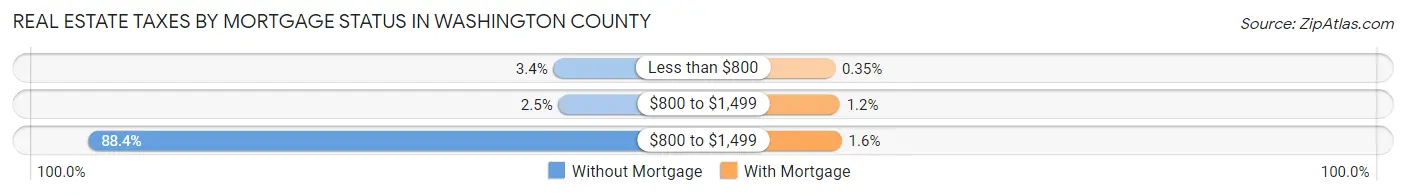
| Property Taxes | Without Mortgage | With Mortgage |
| Less than $800 | 1,328 (3.4%) | 354 (0.4%) |
| $800 to $1,499 | 971 (2.5%) | 1,236 (1.2%) |
| $800 to $1,499 | 34,530 (88.4%) | 1,585 (1.6%) |
| Total | 39,068 (100.0%) | 101,100 (100.0%) |
Health & Disability in Washington County
Health Insurance Coverage by Age in Washington County
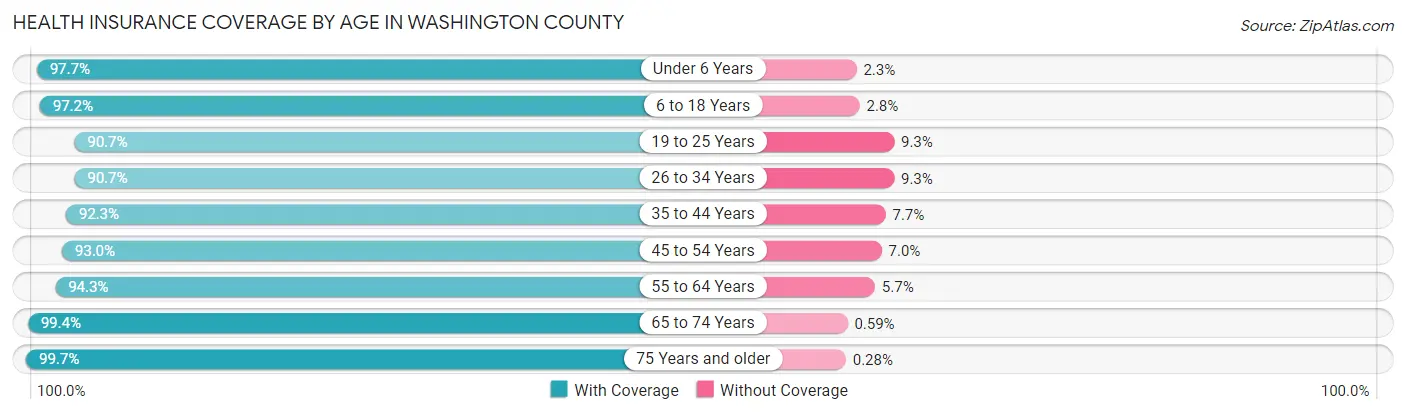
| Age Bracket | With Coverage | Without Coverage |
| Under 6 Years | 39,123 (97.7%) | 908 (2.3%) |
| 6 to 18 Years | 97,121 (97.2%) | 2,844 (2.8%) |
| 19 to 25 Years | 46,255 (90.7%) | 4,730 (9.3%) |
| 26 to 34 Years | 75,256 (90.7%) | 7,697 (9.3%) |
| 35 to 44 Years | 84,644 (92.3%) | 7,050 (7.7%) |
| 45 to 54 Years | 73,483 (93.0%) | 5,493 (7.0%) |
| 55 to 64 Years | 64,108 (94.3%) | 3,885 (5.7%) |
| 65 to 74 Years | 50,517 (99.4%) | 301 (0.6%) |
| 75 Years and older | 31,953 (99.7%) | 89 (0.3%) |
| Total | 562,460 (94.5%) | 32,997 (5.5%) |
Health Insurance Coverage by Citizenship Status in Washington County
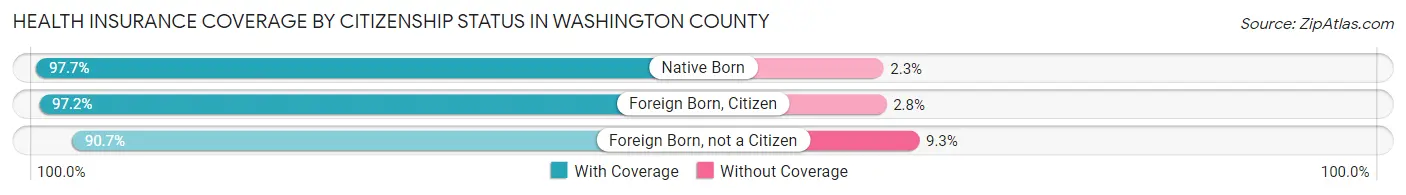
| Citizenship Status | With Coverage | Without Coverage |
| Native Born | 39,123 (97.7%) | 908 (2.3%) |
| Foreign Born, Citizen | 97,121 (97.2%) | 2,844 (2.8%) |
| Foreign Born, not a Citizen | 46,255 (90.7%) | 4,730 (9.3%) |
Health Insurance Coverage by Household Income in Washington County
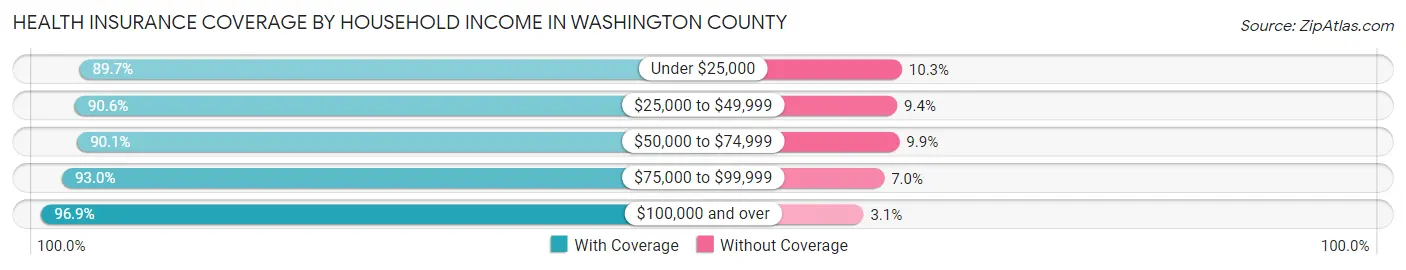
| Household Income | With Coverage | Without Coverage |
| Under $25,000 | 32,234 (89.7%) | 3,710 (10.3%) |
| $25,000 to $49,999 | 53,866 (90.6%) | 5,611 (9.4%) |
| $50,000 to $74,999 | 68,287 (90.1%) | 7,472 (9.9%) |
| $75,000 to $99,999 | 68,185 (93.0%) | 5,144 (7.0%) |
| $100,000 and over | 335,558 (96.9%) | 10,845 (3.1%) |
Public vs Private Health Insurance Coverage by Age in Washington County
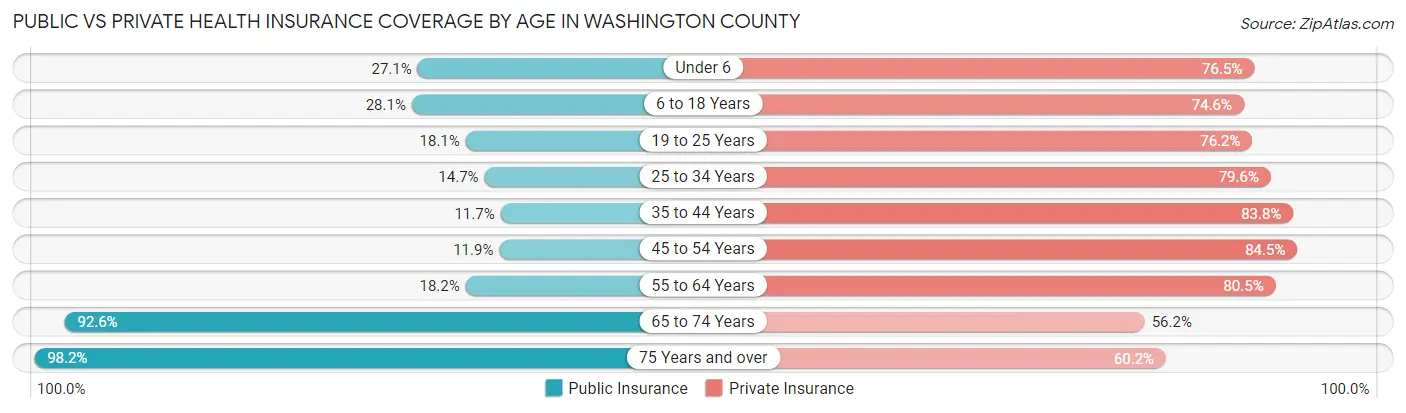
| Age Bracket | Public Insurance | Private Insurance |
| Under 6 | 10,835 (27.1%) | 30,637 (76.5%) |
| 6 to 18 Years | 28,131 (28.1%) | 74,591 (74.6%) |
| 19 to 25 Years | 9,250 (18.1%) | 38,847 (76.2%) |
| 25 to 34 Years | 12,156 (14.6%) | 66,035 (79.6%) |
| 35 to 44 Years | 10,703 (11.7%) | 76,827 (83.8%) |
| 45 to 54 Years | 9,402 (11.9%) | 66,758 (84.5%) |
| 55 to 64 Years | 12,346 (18.2%) | 54,730 (80.5%) |
| 65 to 74 Years | 47,056 (92.6%) | 28,576 (56.2%) |
| 75 Years and over | 31,469 (98.2%) | 19,278 (60.2%) |
| Total | 171,348 (28.8%) | 456,279 (76.6%) |
Disability Status by Sex by Age in Washington County
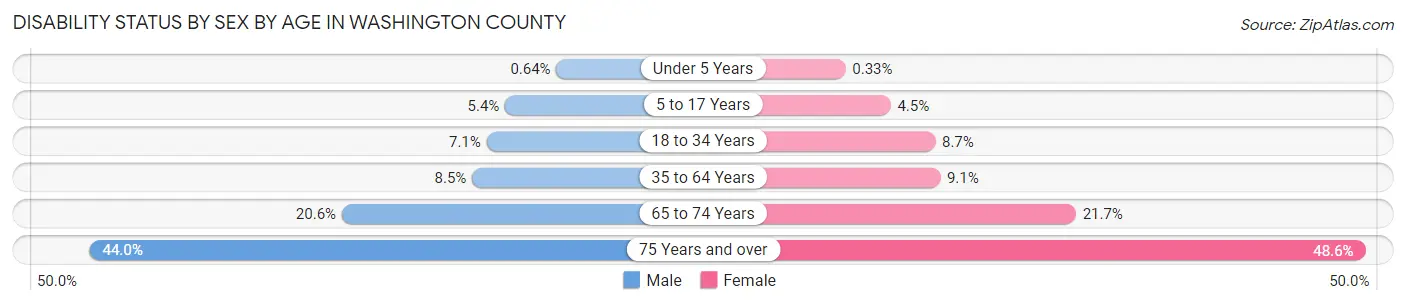
| Age Bracket | Male | Female |
| Under 5 Years | 109 (0.6%) | 53 (0.3%) |
| 5 to 17 Years | 2,756 (5.4%) | 2,189 (4.5%) |
| 18 to 34 Years | 5,150 (7.1%) | 5,983 (8.6%) |
| 35 to 64 Years | 10,218 (8.5%) | 10,732 (9.1%) |
| 65 to 74 Years | 4,801 (20.5%) | 5,962 (21.7%) |
| 75 Years and over | 5,733 (44.0%) | 9,235 (48.6%) |
Disability Class by Sex by Age in Washington County
Disability Class: Hearing Difficulty
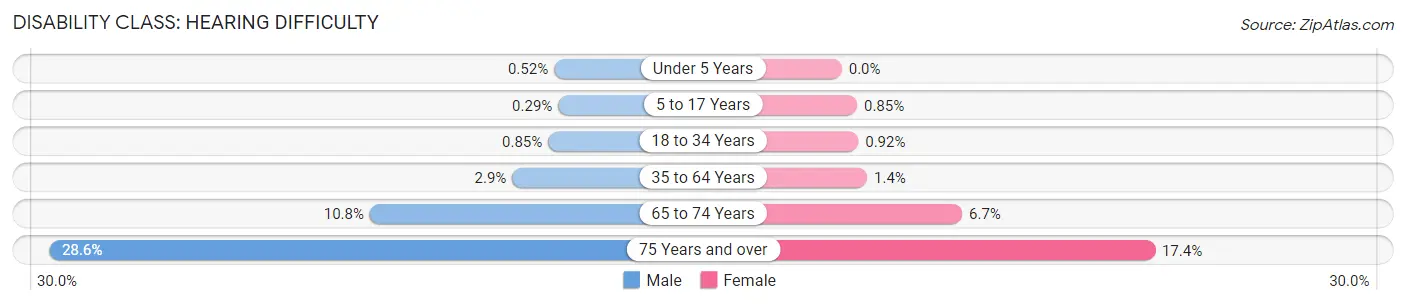
| Age Bracket | Male | Female |
| Under 5 Years | 89 (0.5%) | 0 (0.0%) |
| 5 to 17 Years | 146 (0.3%) | 411 (0.9%) |
| 18 to 34 Years | 612 (0.9%) | 639 (0.9%) |
| 35 to 64 Years | 3,448 (2.9%) | 1,657 (1.4%) |
| 65 to 74 Years | 2,518 (10.8%) | 1,839 (6.7%) |
| 75 Years and over | 3,734 (28.6%) | 3,314 (17.4%) |
Disability Class: Vision Difficulty
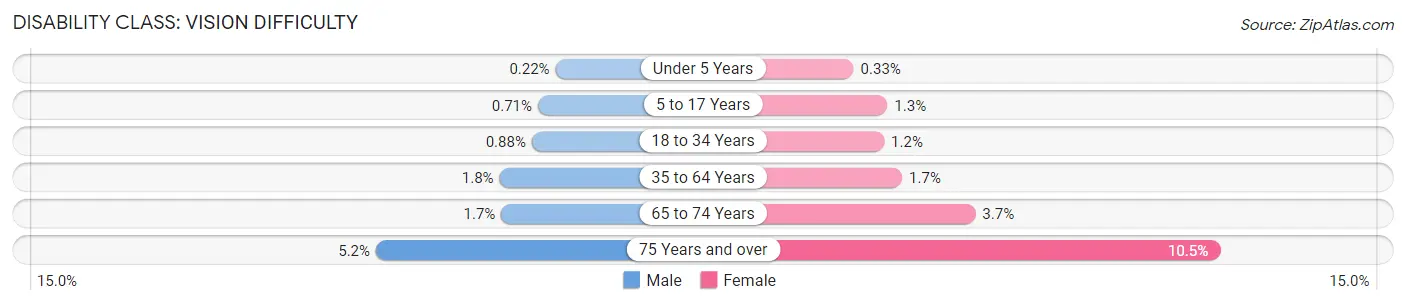
| Age Bracket | Male | Female |
| Under 5 Years | 37 (0.2%) | 53 (0.3%) |
| 5 to 17 Years | 363 (0.7%) | 616 (1.3%) |
| 18 to 34 Years | 635 (0.9%) | 817 (1.2%) |
| 35 to 64 Years | 2,149 (1.8%) | 1,981 (1.7%) |
| 65 to 74 Years | 404 (1.7%) | 1,021 (3.7%) |
| 75 Years and over | 681 (5.2%) | 2,002 (10.5%) |
Disability Class: Cognitive Difficulty
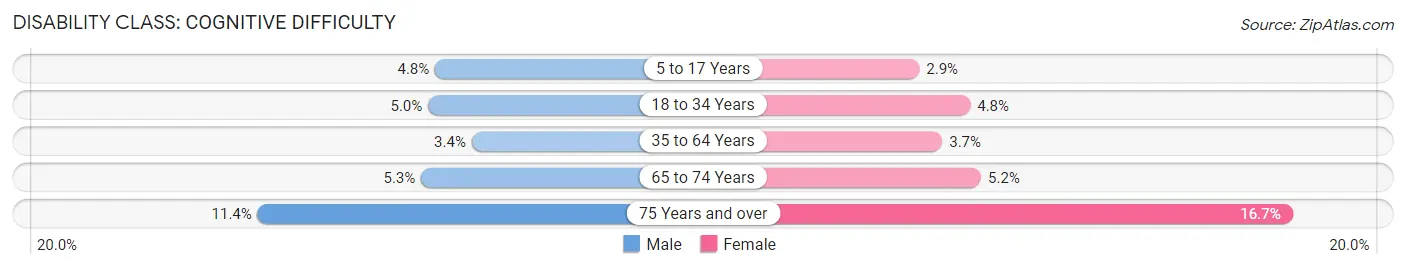
| Age Bracket | Male | Female |
| 5 to 17 Years | 2,428 (4.8%) | 1,395 (2.9%) |
| 18 to 34 Years | 3,628 (5.0%) | 3,301 (4.8%) |
| 35 to 64 Years | 4,109 (3.4%) | 4,395 (3.7%) |
| 65 to 74 Years | 1,233 (5.3%) | 1,420 (5.2%) |
| 75 Years and over | 1,480 (11.4%) | 3,180 (16.7%) |
Disability Class: Ambulatory Difficulty
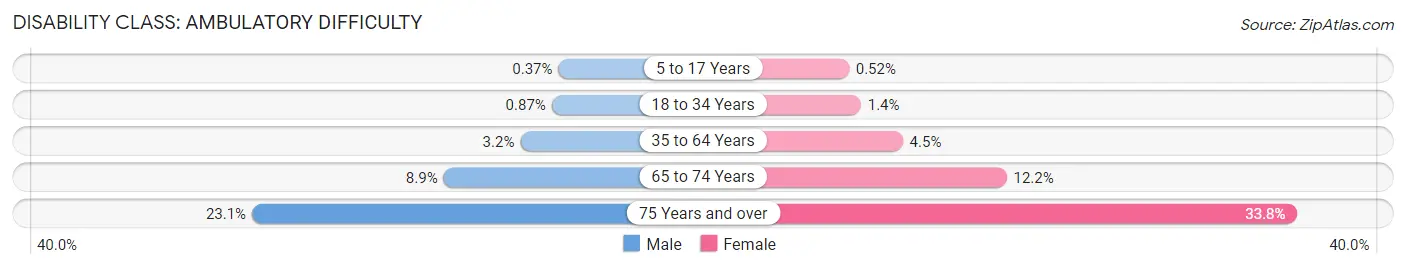
| Age Bracket | Male | Female |
| 5 to 17 Years | 188 (0.4%) | 253 (0.5%) |
| 18 to 34 Years | 628 (0.9%) | 977 (1.4%) |
| 35 to 64 Years | 3,869 (3.2%) | 5,325 (4.5%) |
| 65 to 74 Years | 2,079 (8.9%) | 3,359 (12.2%) |
| 75 Years and over | 3,014 (23.1%) | 6,428 (33.8%) |
Disability Class: Self-Care Difficulty
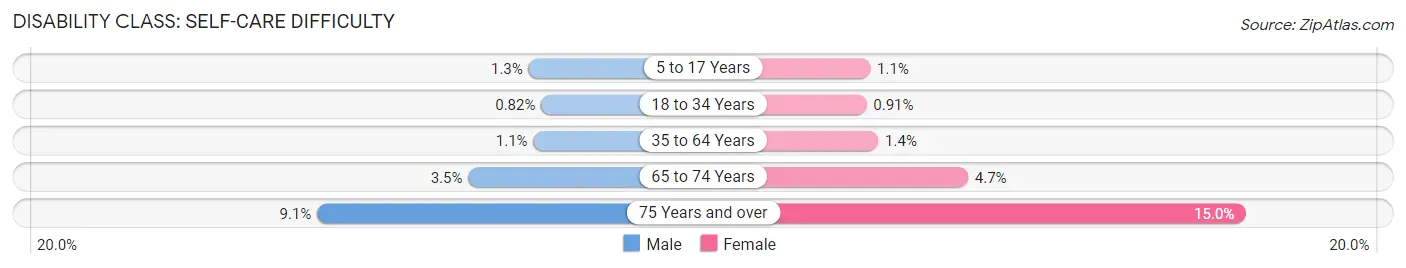
| Age Bracket | Male | Female |
| 5 to 17 Years | 656 (1.3%) | 508 (1.1%) |
| 18 to 34 Years | 591 (0.8%) | 630 (0.9%) |
| 35 to 64 Years | 1,335 (1.1%) | 1,595 (1.3%) |
| 65 to 74 Years | 825 (3.5%) | 1,285 (4.7%) |
| 75 Years and over | 1,191 (9.1%) | 2,852 (15.0%) |
Technology Access in Washington County
Computing Device Access in Washington County
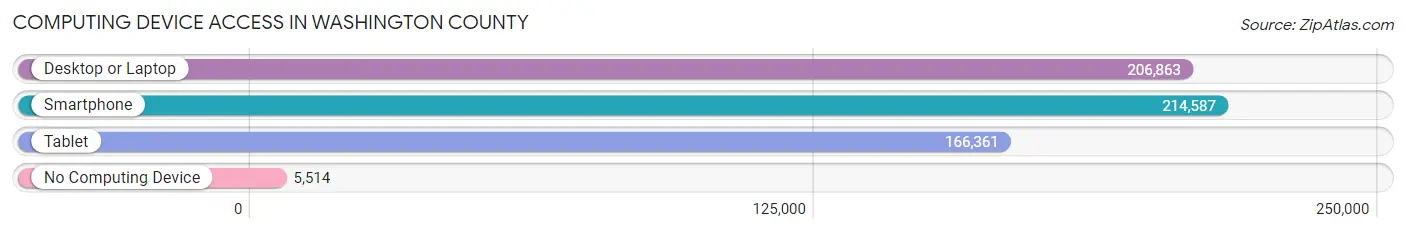
| Device Type | # Households | % Households |
| Desktop or Laptop | 206,863 | 89.9% |
| Smartphone | 214,587 | 93.2% |
| Tablet | 166,361 | 72.3% |
| No Computing Device | 5,514 | 2.4% |
| Total | 230,122 | 100.0% |
Internet Access in Washington County
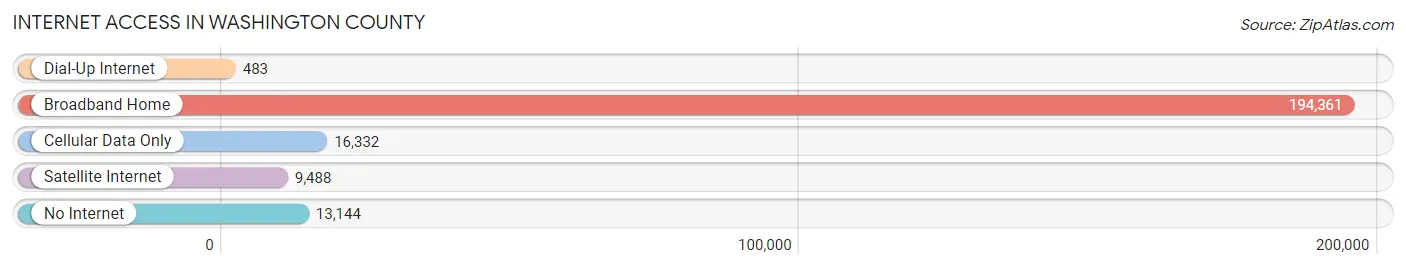
| Internet Type | # Households | % Households |
| Dial-Up Internet | 483 | 0.2% |
| Broadband Home | 194,361 | 84.5% |
| Cellular Data Only | 16,332 | 7.1% |
| Satellite Internet | 9,488 | 4.1% |
| No Internet | 13,144 | 5.7% |
| Total | 230,122 | 100.0% |
Washington County Summary
Introduction
Washington County is located in the northwest corner of Oregon, and is part of the Portland metropolitan area. It is the second most populous county in the state, with an estimated population of 575,000 in 2019. The county is home to a diverse population, with a mix of urban and rural communities. It is known for its natural beauty, with the Tualatin Valley and the Columbia River Gorge providing stunning views. The county is also home to a thriving economy, with a variety of industries and businesses.
Geography
Washington County is located in the northwest corner of Oregon, and is bordered by Multnomah County to the north, Clackamas County to the east, Yamhill County to the south, and the Columbia River to the west. The county covers an area of 718 square miles, and is divided into seven cities and four unincorporated communities. The county is home to a variety of landscapes, including the Tualatin Valley, the Columbia River Gorge, and the Coast Range. The county is also home to several rivers, including the Tualatin, Willamette, and Columbia.
History
Washington County was established in 1843, and was named after George Washington, the first President of the United States. The county was originally inhabited by the Kalapuya Native American tribe, and was later settled by pioneers in the early 1800s. The county was initially part of the Oregon Territory, and was later incorporated into the state of Oregon in 1859. The county has a long history of agriculture, with the Tualatin Valley being a major producer of wheat, hay, and other crops. The county also has a long history of industry, with the timber and paper industries being major employers in the area.
Economy
Washington County has a diverse economy, with a variety of industries and businesses. The county is home to several major employers, including Intel, Nike, and Columbia Sportswear. The county is also home to a thriving agricultural industry, with the Tualatin Valley being a major producer of wheat, hay, and other crops. The county is also home to a variety of manufacturing and technology companies, as well as a growing number of start-ups.
Demographics
Washington County has a population of 575,000, and is the second most populous county in the state. The county is home to a diverse population, with a mix of urban and rural communities. The county is majority white, with a population of 77.3%. The county is also home to a large Hispanic population, with a population of 13.2%. The county is also home to a large Asian population, with a population of 8.2%. The county is also home to a large African American population, with a population of 4.2%.
Conclusion
Washington County is located in the northwest corner of Oregon, and is part of the Portland metropolitan area. The county is home to a diverse population, with a mix of urban and rural communities. The county is known for its natural beauty, with the Tualatin Valley and the Columbia River Gorge providing stunning views. The county is also home to a thriving economy, with a variety of industries and businesses. The county is majority white, with a population of 77.3%. The county is also home to a large Hispanic population, with a population of 13.2%. The county is also home to a large Asian population, with a population of 8.2%. The county is also home to a large African American population, with a population of 4.2%.
Common Questions
What is the Total Population of Washington County?
Total Population of Washington County is 599,541.
What is the Total Male Population of Washington County?
Total Male Population of Washington County is 299,671.
What is the Total Female Population of Washington County?
Total Female Population of Washington County is 299,870.
What is the Ratio of Males per 100 Females in Washington County?
There are 99.93 Males per 100 Females in Washington County.
What is the Ratio of Females per 100 Males in Washington County?
There are 100.07 Females per 100 Males in Washington County.
What is the Median Population Age in Washington County?
Median Population Age in Washington County is 37.5 Years.
What is the Average Family Size in Washington County
Average Family Size in Washington County is 3.1 People.
What is the Average Household Size in Washington County
Average Household Size in Washington County is 2.6 People.
What is Per Capita Income in Washington County?
Per Capita income in Washington County is $49,553.
What is the Median Family Income in Washington County?
Median Family Income in Washington County is $119,312.
What is the Median Household income in Washington County?
Median Household Income in Washington County is $100,121.
What is Income or Wage Gap in Washington County?
Income or Wage Gap in Washington County is 31.3%.
Women in Washington County earn 68.7 cents for every dollar earned by a man.
What is Family Income Deficit in Washington County?
Family Income Deficit in Washington County is $11,090.
Families that are below poverty line in Washington County earn $11,090 less on average than the poverty threshold level.
What is Inequality or Gini Index in Washington County?
Inequality or Gini Index in Washington County is 0.43.
How Large is the Labor Force in Washington County?
There are 332,498 People in the Labor Forcein in Washington County.
What is the Percentage of People in the Labor Force in Washington County?
68.9% of People are in the Labor Force in Washington County.
What is the Unemployment Rate in Washington County?
Unemployment Rate in Washington County is 4.6%.