Wasco County, OR
Wasco County Map
Wasco County Overview
26,639
TOTAL POPULATION
13,645
MALE POPULATION
12,994
FEMALE POPULATION
105.01
MALES / 100 FEMALES
95.23
FEMALES / 100 MALES
40.4
MEDIAN AGE
3.0
AVG FAMILY SIZE
2.4
AVG HOUSEHOLD SIZE
$35,869
PER CAPITA INCOME
$78,408
AVG FAMILY INCOME
$61,316
AVG HOUSEHOLD INCOME
36.5%
WAGE / INCOME GAP [ % ]
63.5¢/ $1
WAGE / INCOME GAP [ $ ]
$7,461
FAMILY INCOME DEFICIT
0.48
INEQUALITY / GINI INDEX
12,817
LABOR FORCE [ PEOPLE ]
59.7%
PERCENT IN LABOR FORCE
7.1%
UNEMPLOYMENT RATE
Wasco County Area Codes
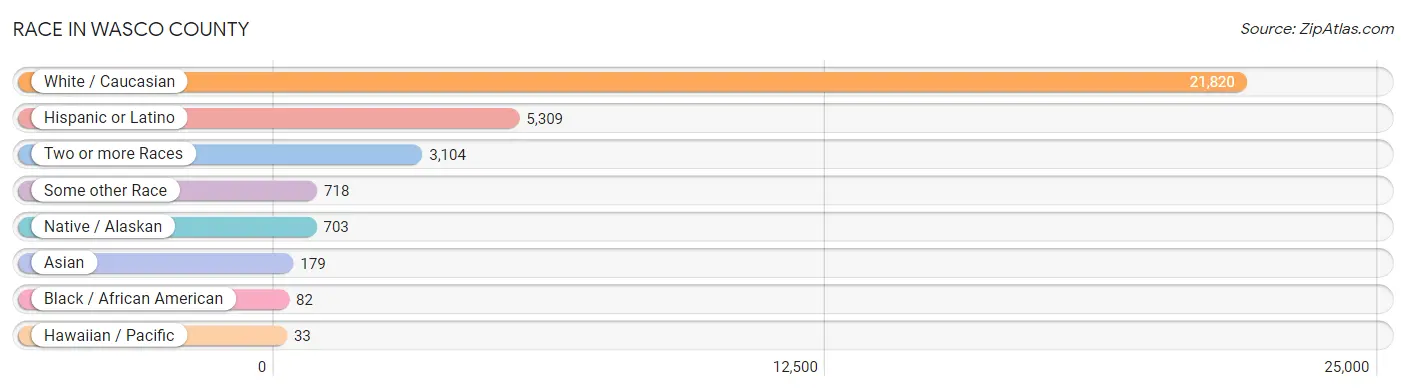
Race in Wasco County
The most populous races in Wasco County are White / Caucasian (21,820 | 81.9%), Hispanic or Latino (5,309 | 19.9%), and Two or more Races (3,104 | 11.7%).
| Race | # Population | % Population |
| Asian | 179 | 0.7% |
| Black / African American | 82 | 0.3% |
| Hawaiian / Pacific | 33 | 0.1% |
| Hispanic or Latino | 5,309 | 19.9% |
| Native / Alaskan | 703 | 2.6% |
| White / Caucasian | 21,820 | 81.9% |
| Two or more Races | 3,104 | 11.7% |
| Some other Race | 718 | 2.7% |
| Total | 26,639 | 100.0% |
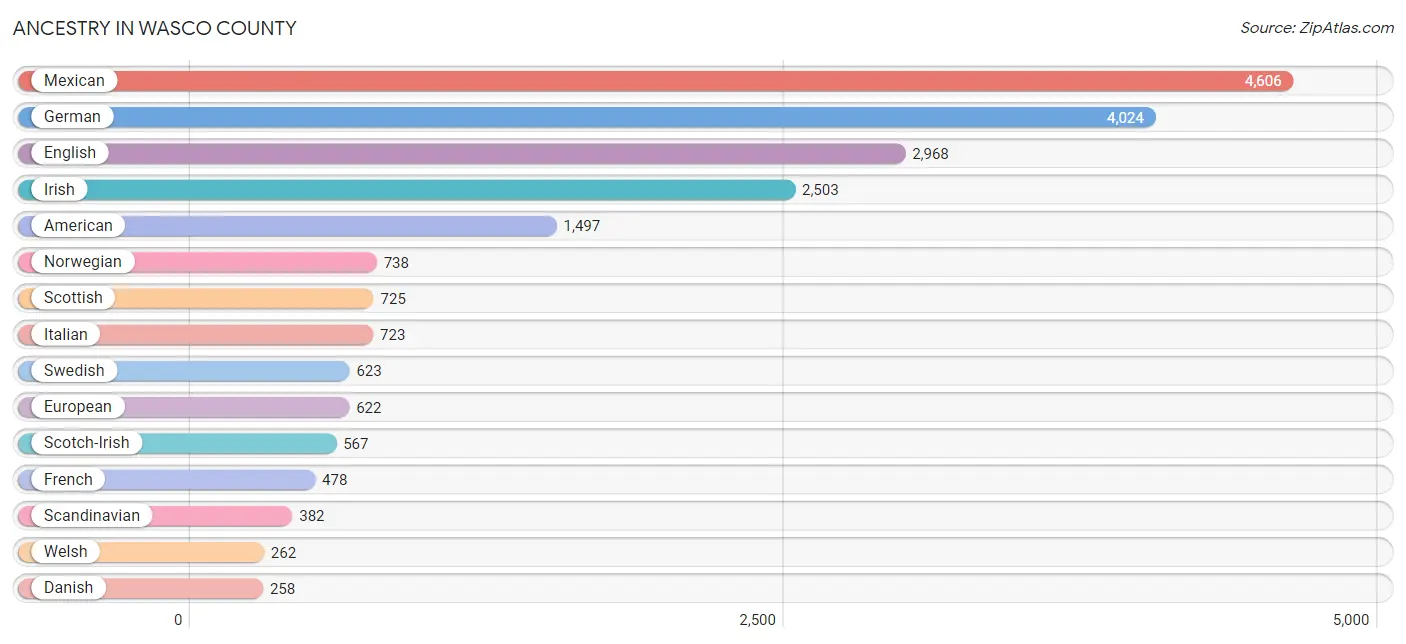
Ancestry in Wasco County
The most populous ancestries reported in Wasco County are Mexican (4,606 | 17.3%), German (4,024 | 15.1%), English (2,968 | 11.1%), Irish (2,503 | 9.4%), and American (1,497 | 5.6%), together accounting for 58.6% of all Wasco County residents.
| Ancestry | # Population | % Population |
| African | 88 | 0.3% |
| American | 1,497 | 5.6% |
| Arab | 51 | 0.2% |
| Argentinean | 3 | 0.0% |
| Armenian | 27 | 0.1% |
| Australian | 20 | 0.1% |
| Austrian | 18 | 0.1% |
| Belgian | 12 | 0.1% |
| Bhutanese | 7 | 0.0% |
| Blackfeet | 5 | 0.0% |
| British | 217 | 0.8% |
| Bulgarian | 129 | 0.5% |
| Burmese | 171 | 0.6% |
| Cajun | 1 | 0.0% |
| Canadian | 27 | 0.1% |
| Celtic | 9 | 0.0% |
| Central American | 143 | 0.5% |
| Cherokee | 46 | 0.2% |
| Chickasaw | 11 | 0.0% |
| Chinese | 18 | 0.1% |
| Chippewa | 8 | 0.0% |
| Choctaw | 6 | 0.0% |
| Colombian | 9 | 0.0% |
| Colville | 5 | 0.0% |
| Creek | 1 | 0.0% |
| Croatian | 11 | 0.0% |
| Cuban | 80 | 0.3% |
| Czech | 176 | 0.7% |
| Czechoslovakian | 9 | 0.0% |
| Danish | 258 | 1.0% |
| Dutch | 249 | 0.9% |
| Eastern European | 125 | 0.5% |
| Egyptian | 12 | 0.1% |
| English | 2,968 | 11.1% |
| European | 622 | 2.3% |
| Finnish | 119 | 0.4% |
| French | 478 | 1.8% |
| French Canadian | 218 | 0.8% |
| German | 4,024 | 15.1% |
| Greek | 15 | 0.1% |
| Guatemalan | 12 | 0.1% |
| Honduran | 1 | 0.0% |
| Hungarian | 29 | 0.1% |
| Icelander | 14 | 0.1% |
| Indian (Asian) | 104 | 0.4% |
| Irish | 2,503 | 9.4% |
| Iroquois | 27 | 0.1% |
| Italian | 723 | 2.7% |
| Korean | 54 | 0.2% |
| Lebanese | 27 | 0.1% |
| Lithuanian | 54 | 0.2% |
| Luxembourger | 5 | 0.0% |
| Malaysian | 18 | 0.1% |
| Maltese | 14 | 0.1% |
| Mexican | 4,606 | 17.3% |
| Mexican American Indian | 6 | 0.0% |
| Native Hawaiian | 32 | 0.1% |
| Navajo | 23 | 0.1% |
| New Zealander | 8 | 0.0% |
| Northern European | 118 | 0.4% |
| Norwegian | 738 | 2.8% |
| Panamanian | 13 | 0.1% |
| Polish | 234 | 0.9% |
| Portuguese | 10 | 0.0% |
| Potawatomi | 14 | 0.1% |
| Puerto Rican | 28 | 0.1% |
| Puget Sound Salish | 5 | 0.0% |
| Romanian | 17 | 0.1% |
| Russian | 204 | 0.8% |
| Salvadoran | 117 | 0.4% |
| Samoan | 28 | 0.1% |
| Scandinavian | 382 | 1.4% |
| Scotch-Irish | 567 | 2.1% |
| Scottish | 725 | 2.7% |
| Serbian | 6 | 0.0% |
| Sioux | 22 | 0.1% |
| Slavic | 13 | 0.1% |
| Slovak | 8 | 0.0% |
| South American | 12 | 0.1% |
| Spaniard | 233 | 0.9% |
| Spanish | 14 | 0.1% |
| Sri Lankan | 28 | 0.1% |
| Subsaharan African | 88 | 0.3% |
| Swedish | 623 | 2.3% |
| Swiss | 123 | 0.5% |
| Syrian | 11 | 0.0% |
| Thai | 12 | 0.1% |
| Tlingit-Haida | 5 | 0.0% |
| Ukrainian | 30 | 0.1% |
| Welsh | 262 | 1.0% |
| Yakama | 50 | 0.2% |
| Yuman | 8 | 0.0% | View All 92 Rows |
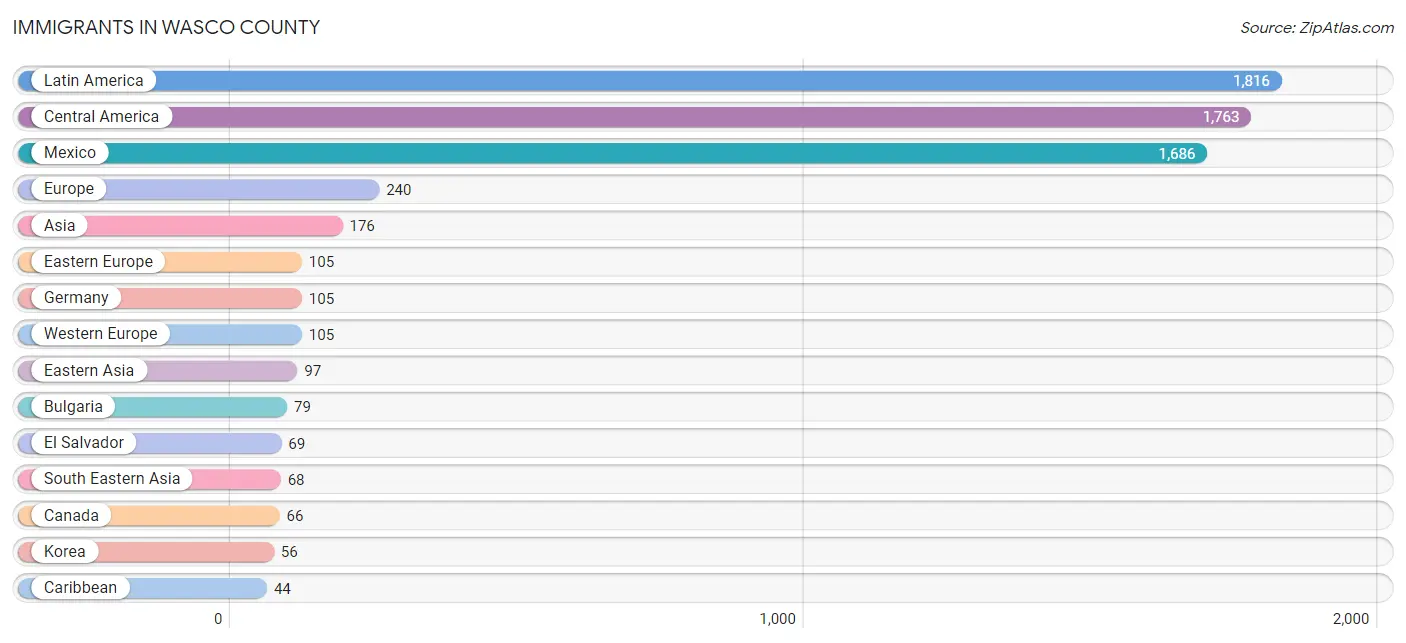
Immigrants in Wasco County
The most numerous immigrant groups reported in Wasco County came from Latin America (1,816 | 6.8%), Central America (1,763 | 6.6%), Mexico (1,686 | 6.3%), Europe (240 | 0.9%), and Asia (176 | 0.7%), together accounting for 21.3% of all Wasco County residents.
| Immigration Origin | # Population | % Population |
| Africa | 7 | 0.0% |
| Asia | 176 | 0.7% |
| Bulgaria | 79 | 0.3% |
| Canada | 66 | 0.3% |
| Caribbean | 44 | 0.2% |
| Central America | 1,763 | 6.6% |
| China | 27 | 0.1% |
| Colombia | 9 | 0.0% |
| Denmark | 8 | 0.0% |
| Eastern Asia | 97 | 0.4% |
| Eastern Europe | 105 | 0.4% |
| El Salvador | 69 | 0.3% |
| England | 14 | 0.1% |
| Europe | 240 | 0.9% |
| Fiji | 18 | 0.1% |
| Germany | 105 | 0.4% |
| Guatemala | 7 | 0.0% |
| Honduras | 1 | 0.0% |
| Hong Kong | 14 | 0.1% |
| India | 10 | 0.0% |
| Indonesia | 8 | 0.0% |
| Japan | 14 | 0.1% |
| Korea | 56 | 0.2% |
| Laos | 18 | 0.1% |
| Latin America | 1,816 | 6.8% |
| Mexico | 1,686 | 6.3% |
| Micronesia | 1 | 0.0% |
| Moldova | 3 | 0.0% |
| Northern Europe | 30 | 0.1% |
| Oceania | 27 | 0.1% |
| Philippines | 42 | 0.2% |
| Poland | 21 | 0.1% |
| South Africa | 7 | 0.0% |
| South America | 9 | 0.0% |
| South Central Asia | 10 | 0.0% |
| South Eastern Asia | 68 | 0.3% |
| Sweden | 4 | 0.0% |
| Trinidad and Tobago | 44 | 0.2% |
| Ukraine | 2 | 0.0% |
| Western Asia | 1 | 0.0% |
| Western Europe | 105 | 0.4% |
| Yemen | 1 | 0.0% | View All 42 Rows |
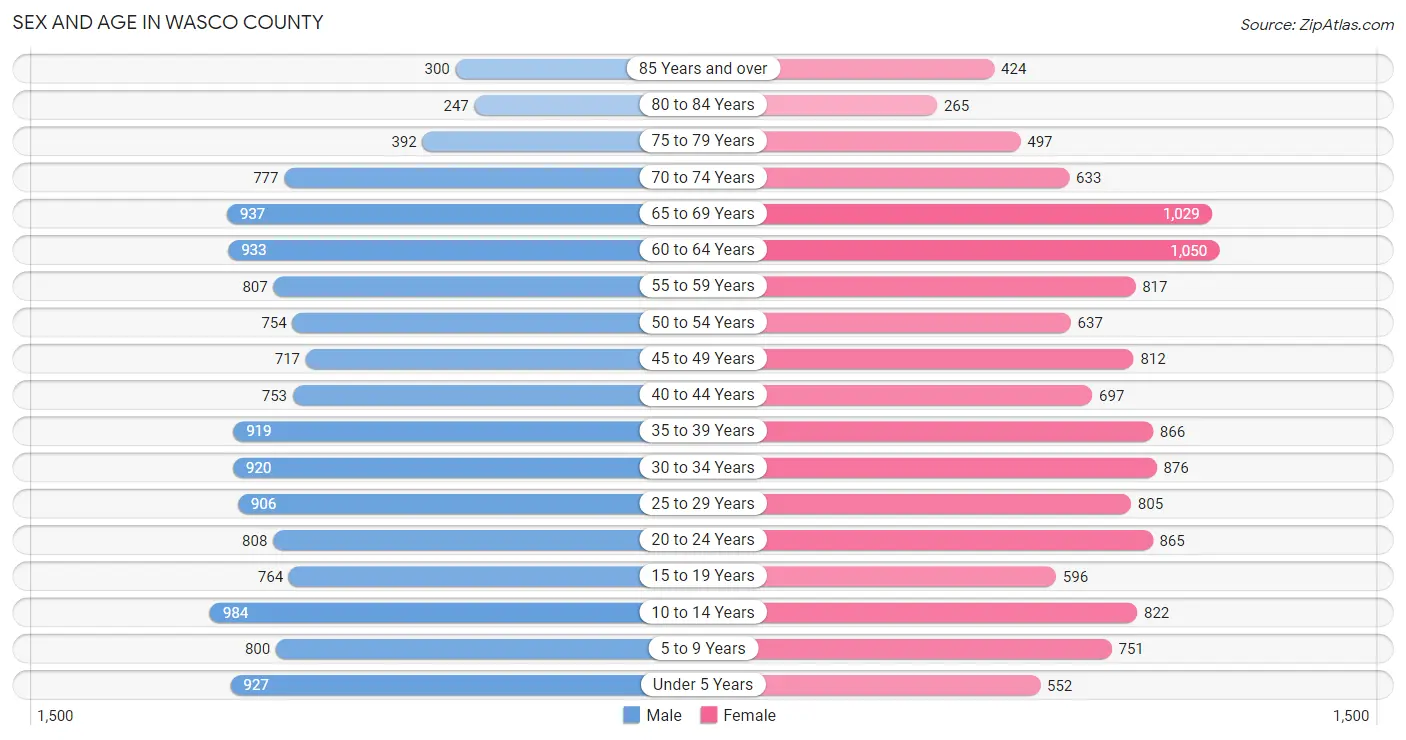
Sex and Age in Wasco County
Sex and Age in Wasco County
The most populous age groups in Wasco County are 10 to 14 Years (984 | 7.2%) for men and 60 to 64 Years (1,050 | 8.1%) for women.
| Age Bracket | Male | Female |
| Under 5 Years | 927 (6.8%) | 552 (4.3%) |
| 5 to 9 Years | 800 (5.9%) | 751 (5.8%) |
| 10 to 14 Years | 984 (7.2%) | 822 (6.3%) |
| 15 to 19 Years | 764 (5.6%) | 596 (4.6%) |
| 20 to 24 Years | 808 (5.9%) | 865 (6.7%) |
| 25 to 29 Years | 906 (6.6%) | 805 (6.2%) |
| 30 to 34 Years | 920 (6.7%) | 876 (6.7%) |
| 35 to 39 Years | 919 (6.7%) | 866 (6.7%) |
| 40 to 44 Years | 753 (5.5%) | 697 (5.4%) |
| 45 to 49 Years | 717 (5.2%) | 812 (6.2%) |
| 50 to 54 Years | 754 (5.5%) | 637 (4.9%) |
| 55 to 59 Years | 807 (5.9%) | 817 (6.3%) |
| 60 to 64 Years | 933 (6.8%) | 1,050 (8.1%) |
| 65 to 69 Years | 937 (6.9%) | 1,029 (7.9%) |
| 70 to 74 Years | 777 (5.7%) | 633 (4.9%) |
| 75 to 79 Years | 392 (2.9%) | 497 (3.8%) |
| 80 to 84 Years | 247 (1.8%) | 265 (2.0%) |
| 85 Years and over | 300 (2.2%) | 424 (3.3%) |
| Total | 13,645 (100.0%) | 12,994 (100.0%) |
Families and Households in Wasco County
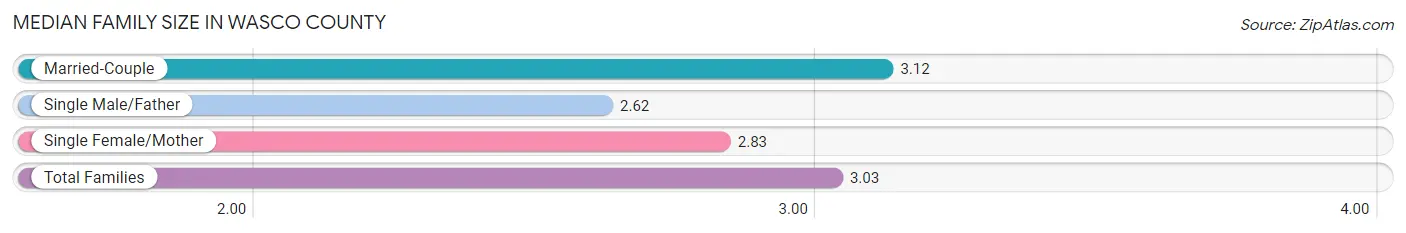
Median Family Size in Wasco County
The median family size in Wasco County is 3.03 persons per family, with married-couple families (4,837 | 75.7%) accounting for the largest median family size of 3.12 persons per family. On the other hand, single male/father families (546 | 8.5%) represent the smallest median family size with 2.62 persons per family.
| Family Type | # Families | Family Size |
| Married-Couple | 4,837 (75.7%) | 3.12 |
| Single Male/Father | 546 (8.5%) | 2.62 |
| Single Female/Mother | 1,010 (15.8%) | 2.83 |
| Total Families | 6,393 (100.0%) | 3.03 |
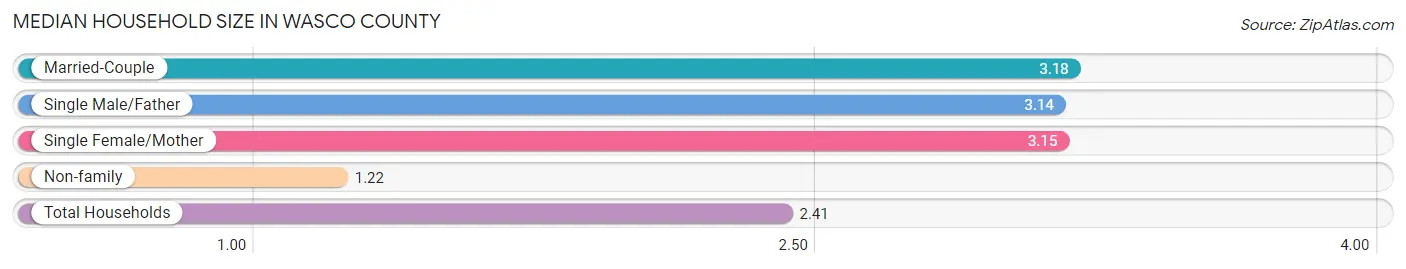
Median Household Size in Wasco County
The median household size in Wasco County is 2.41 persons per household, with married-couple households (4,837 | 46.1%) accounting for the largest median household size of 3.18 persons per household. non-family households (4,095 | 39.0%) represent the smallest median household size with 1.22 persons per household.
| Household Type | # Households | Household Size |
| Married-Couple | 4,837 (46.1%) | 3.18 |
| Single Male/Father | 546 (5.2%) | 3.14 |
| Single Female/Mother | 1,010 (9.6%) | 3.15 |
| Non-family | 4,095 (39.0%) | 1.22 |
| Total Households | 10,488 (100.0%) | 2.41 |
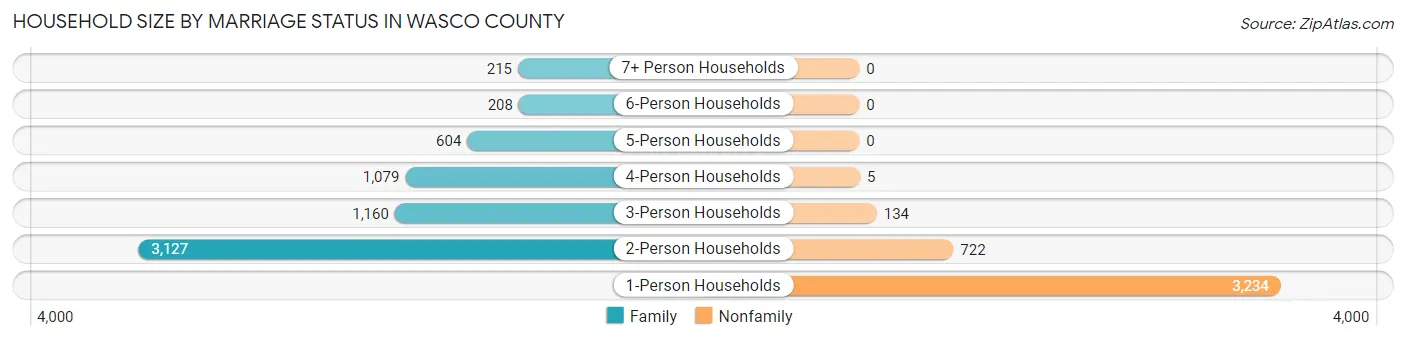
Household Size by Marriage Status in Wasco County
Out of a total of 10,488 households in Wasco County, 6,393 (61.0%) are family households, while 4,095 (39.0%) are nonfamily households. The most numerous type of family households are 2-person households, comprising 3,127, and the most common type of nonfamily households are 1-person households, comprising 3,234.
| Household Size | Family Households | Nonfamily Households |
| 1-Person Households | - | 3,234 (30.8%) |
| 2-Person Households | 3,127 (29.8%) | 722 (6.9%) |
| 3-Person Households | 1,160 (11.1%) | 134 (1.3%) |
| 4-Person Households | 1,079 (10.3%) | 5 (0.1%) |
| 5-Person Households | 604 (5.8%) | 0 (0.0%) |
| 6-Person Households | 208 (2.0%) | 0 (0.0%) |
| 7+ Person Households | 215 (2.1%) | 0 (0.0%) |
| Total | 6,393 (61.0%) | 4,095 (39.0%) |
Female Fertility in Wasco County
Fertility by Age in Wasco County
Average fertility rate in Wasco County is 56.0 births per 1,000 women. Women in the age bracket of 35 to 50 years have the highest fertility rate with 70.0 births per 1,000 women. Women in the age bracket of 35 to 50 years acount for 55.0% of all women with births.
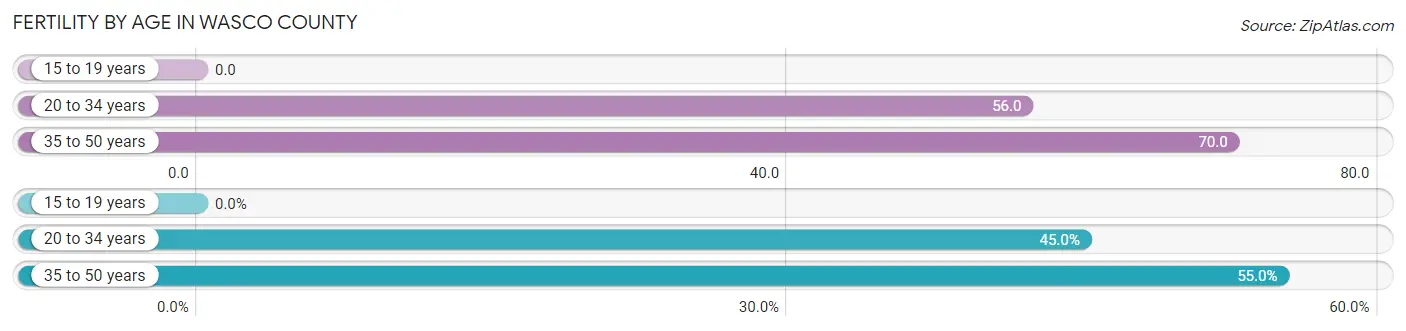
| Age Bracket | Women with Births | Births / 1,000 Women |
| 15 to 19 years | 0 (0.0%) | 0.0 |
| 20 to 34 years | 143 (45.0%) | 56.0 |
| 35 to 50 years | 175 (55.0%) | 70.0 |
| Total | 318 (100.0%) | 56.0 |
Fertility by Age by Marriage Status in Wasco County
77.4% of women with births (318) in Wasco County are married. The highest percentage of unmarried women with births falls into 20 to 34 years age bracket with 23.8% of them unmarried at the time of birth, while the lowest percentage of unmarried women with births belong to 35 to 50 years age bracket with 21.7% of them unmarried.
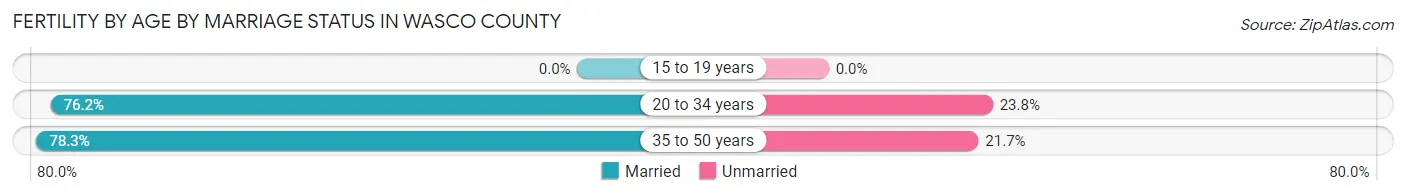
| Age Bracket | Married | Unmarried |
| 15 to 19 years | 0 (0.0%) | 0 (0.0%) |
| 20 to 34 years | 109 (76.2%) | 34 (23.8%) |
| 35 to 50 years | 137 (78.3%) | 38 (21.7%) |
| Total | 246 (77.4%) | 72 (22.6%) |
Fertility by Education in Wasco County
Average fertility rate in Wasco County is 56.0 births per 1,000 women. Women with the education attainment of less than high school have the highest fertility rate of 91.0 births per 1,000 women, while women with the education attainment of bachelor's degree have the lowest fertility at 29.0 births per 1,000 women. Women with the education attainment of less than high school represent 34.9% of all women with births.
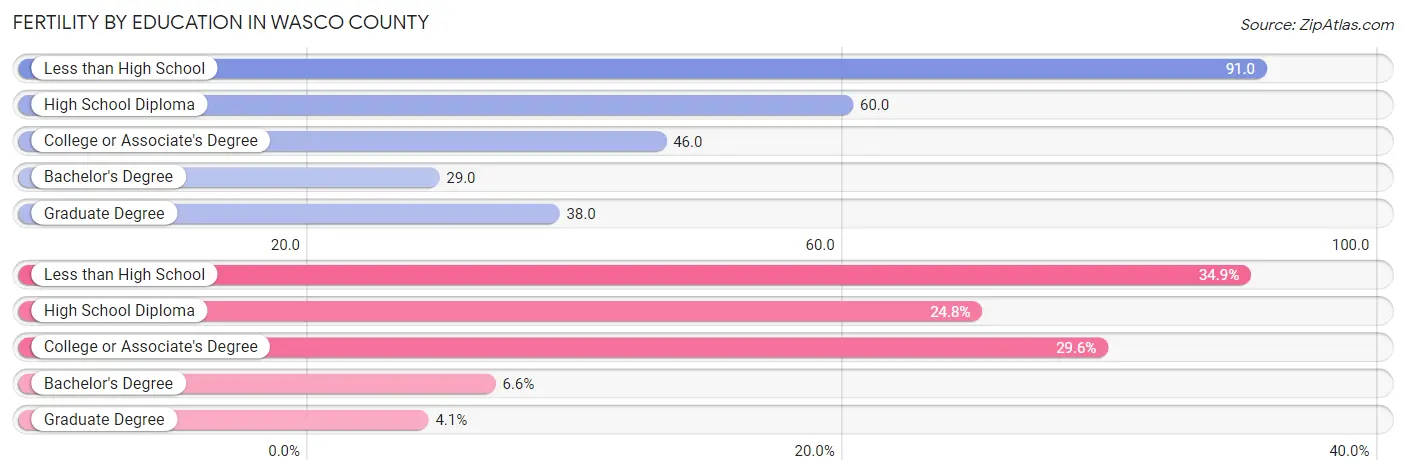
| Educational Attainment | Women with Births | Births / 1,000 Women |
| Less than High School | 111 (34.9%) | 91.0 |
| High School Diploma | 79 (24.8%) | 60.0 |
| College or Associate's Degree | 94 (29.6%) | 46.0 |
| Bachelor's Degree | 21 (6.6%) | 29.0 |
| Graduate Degree | 13 (4.1%) | 38.0 |
| Total | 318 (100.0%) | 56.0 |
Fertility by Education by Marriage Status in Wasco County
22.6% of women with births in Wasco County are unmarried. Women with the educational attainment of bachelor's degree are most likely to be married with 100.0% of them married at childbirth, while women with the educational attainment of less than high school are least likely to be married with 44.1% of them unmarried at childbirth.
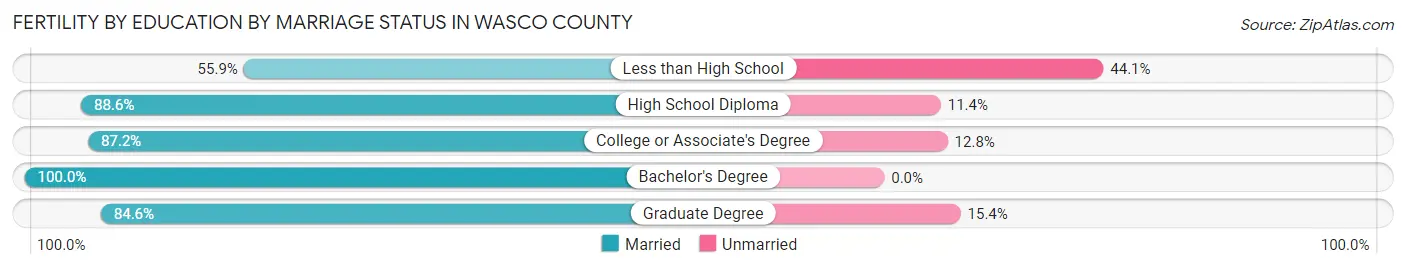
| Educational Attainment | Married | Unmarried |
| Less than High School | 62 (55.9%) | 49 (44.1%) |
| High School Diploma | 70 (88.6%) | 9 (11.4%) |
| College or Associate's Degree | 82 (87.2%) | 12 (12.8%) |
| Bachelor's Degree | 21 (100.0%) | 0 (0.0%) |
| Graduate Degree | 11 (84.6%) | 2 (15.4%) |
| Total | 246 (77.4%) | 72 (22.6%) |
Income in Wasco County
Income Overview in Wasco County
Per Capita Income in Wasco County is $35,869, while median incomes of families and households are $78,408 and $61,316 respectively.
| Characteristic | Number | Measure |
| Per Capita Income | 26,639 | $35,869 |
| Median Family Income | 6,393 | $78,408 |
| Mean Family Income | 6,393 | $112,326 |
| Median Household Income | 10,488 | $61,316 |
| Mean Household Income | 10,488 | $87,994 |
| Income Deficit | 6,393 | $7,461 |
| Wage / Income Gap (%) | 26,639 | 36.49% |
| Wage / Income Gap ($) | 26,639 | 63.51¢ per $1 |
| Gini / Inequality Index | 26,639 | 0.48 |
Earnings by Sex in Wasco County
Average Earnings in Wasco County are $36,914, $44,044 for men and $27,973 for women, a difference of 36.5%.
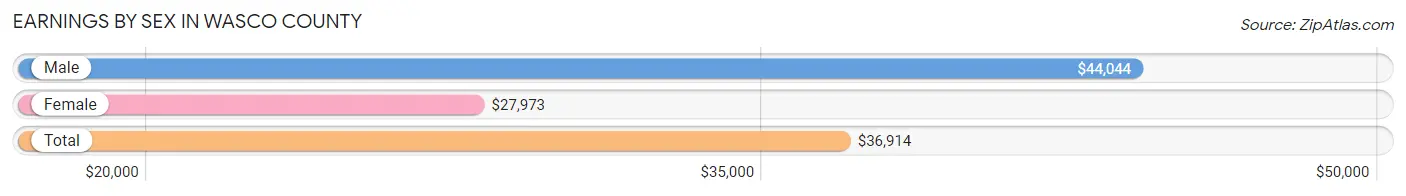
| Sex | Number | Average Earnings |
| Male | 6,950 (51.2%) | $44,044 |
| Female | 6,610 (48.7%) | $27,973 |
| Total | 13,560 (100.0%) | $36,914 |
Earnings by Sex by Income Bracket in Wasco County
The most common earnings brackets in Wasco County are $55,000 to $64,999 for men (749 | 10.8%) and $40,000 to $44,999 for women (600 | 9.1%).
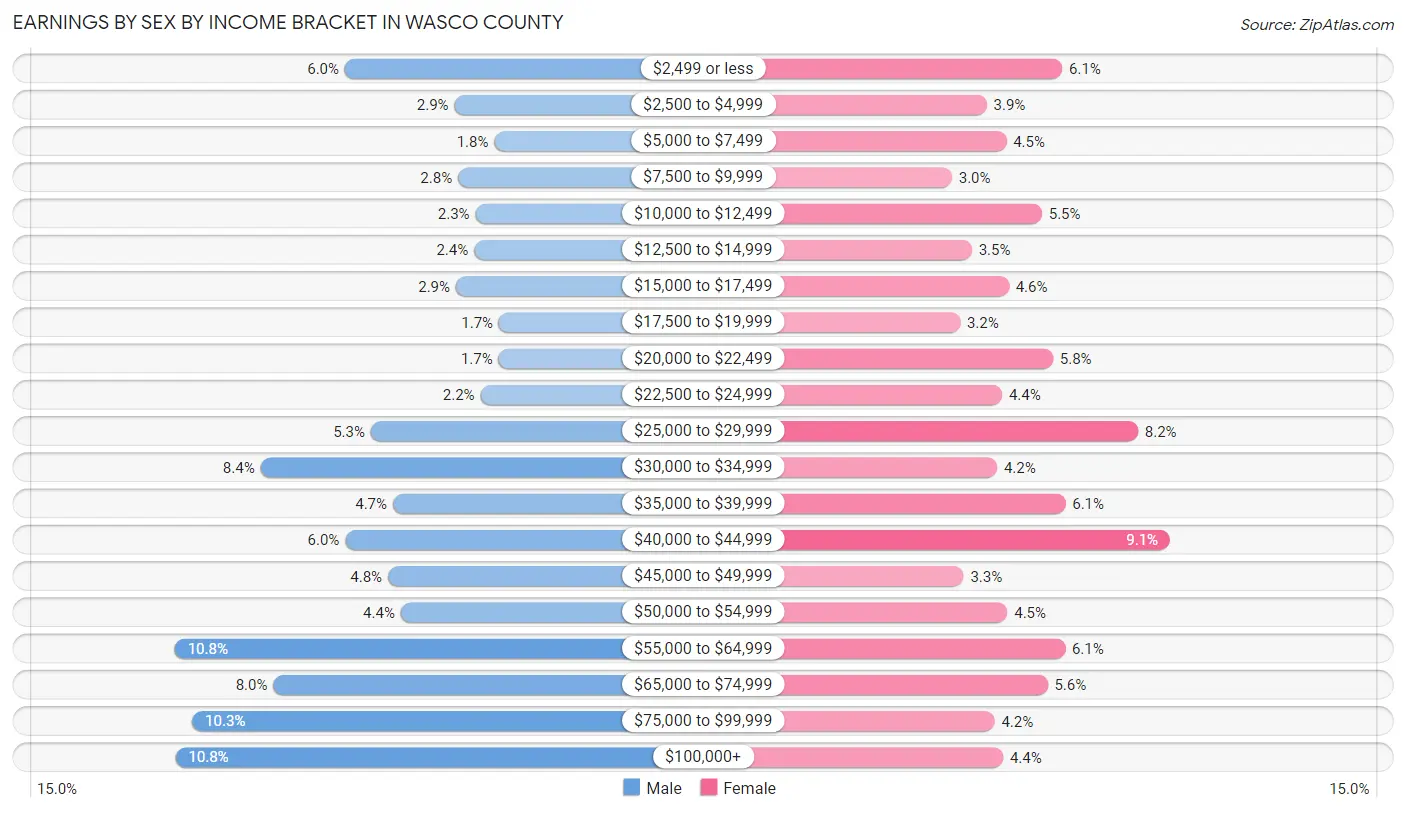
| Income | Male | Female |
| $2,499 or less | 417 (6.0%) | 400 (6.0%) |
| $2,500 to $4,999 | 203 (2.9%) | 260 (3.9%) |
| $5,000 to $7,499 | 125 (1.8%) | 296 (4.5%) |
| $7,500 to $9,999 | 196 (2.8%) | 195 (2.9%) |
| $10,000 to $12,499 | 162 (2.3%) | 362 (5.5%) |
| $12,500 to $14,999 | 165 (2.4%) | 232 (3.5%) |
| $15,000 to $17,499 | 200 (2.9%) | 301 (4.5%) |
| $17,500 to $19,999 | 116 (1.7%) | 210 (3.2%) |
| $20,000 to $22,499 | 117 (1.7%) | 383 (5.8%) |
| $22,500 to $24,999 | 152 (2.2%) | 288 (4.4%) |
| $25,000 to $29,999 | 366 (5.3%) | 541 (8.2%) |
| $30,000 to $34,999 | 582 (8.4%) | 279 (4.2%) |
| $35,000 to $39,999 | 323 (4.6%) | 406 (6.1%) |
| $40,000 to $44,999 | 416 (6.0%) | 600 (9.1%) |
| $45,000 to $49,999 | 333 (4.8%) | 217 (3.3%) |
| $50,000 to $54,999 | 308 (4.4%) | 298 (4.5%) |
| $55,000 to $64,999 | 749 (10.8%) | 405 (6.1%) |
| $65,000 to $74,999 | 557 (8.0%) | 373 (5.6%) |
| $75,000 to $99,999 | 715 (10.3%) | 274 (4.2%) |
| $100,000+ | 748 (10.8%) | 290 (4.4%) |
| Total | 6,950 (100.0%) | 6,610 (100.0%) |
Earnings by Sex by Educational Attainment in Wasco County
Average earnings in Wasco County are $46,542 for men and $35,020 for women, a difference of 24.8%. Men with an educational attainment of graduate degree enjoy the highest average annual earnings of $73,088, while those with high school diploma education earn the least with $31,189. Women with an educational attainment of graduate degree earn the most with the average annual earnings of $51,484, while those with less than high school education have the smallest earnings of $21,484.
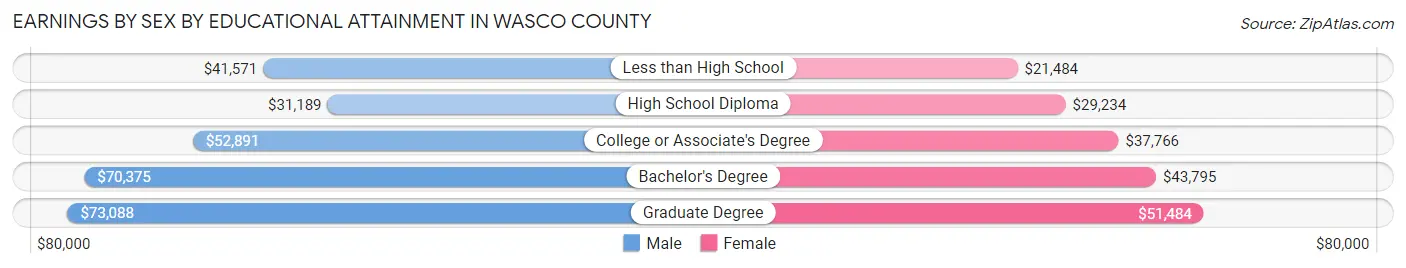
| Educational Attainment | Male Income | Female Income |
| Less than High School | $41,571 | $21,484 |
| High School Diploma | $31,189 | $29,234 |
| College or Associate's Degree | $52,891 | $37,766 |
| Bachelor's Degree | $70,375 | $43,795 |
| Graduate Degree | $73,088 | $51,484 |
| Total | $46,542 | $35,020 |
Family Income in Wasco County
Family Income Brackets in Wasco County
According to the Wasco County family income data, there are 1,534 families falling into the $50,000 to $74,999 income range, which is the most common income bracket and makes up 24.0% of all families. Conversely, the $10,000 to $14,999 income bracket is the least frequent group with only 58 families (0.9%) belonging to this category.
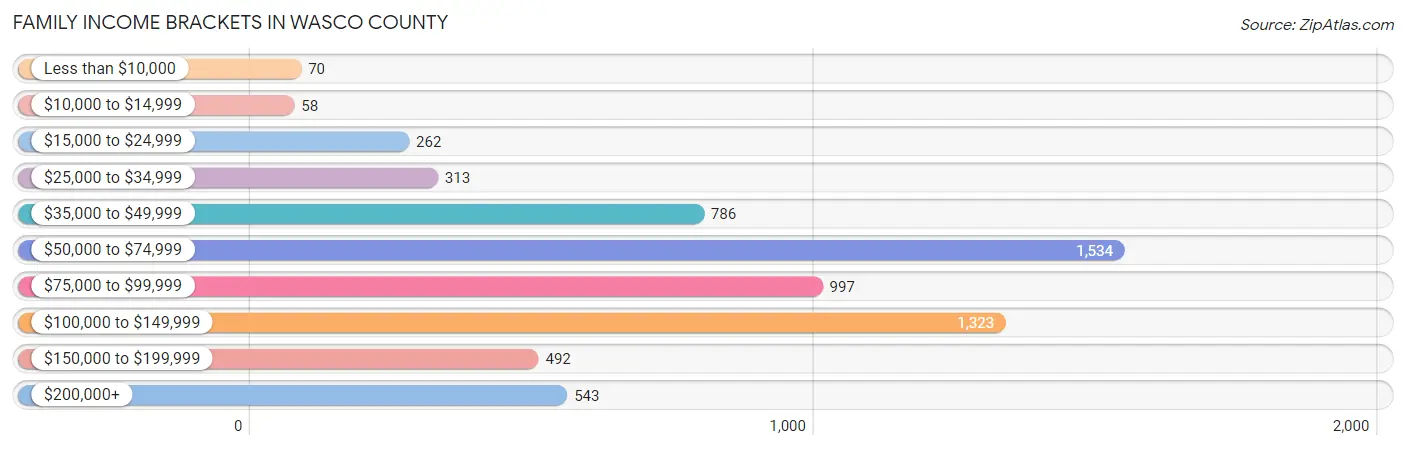
| Income Bracket | # Families | % Families |
| Less than $10,000 | 70 | 1.1% |
| $10,000 to $14,999 | 58 | 0.9% |
| $15,000 to $24,999 | 262 | 4.1% |
| $25,000 to $34,999 | 313 | 4.9% |
| $35,000 to $49,999 | 786 | 12.3% |
| $50,000 to $74,999 | 1,534 | 24.0% |
| $75,000 to $99,999 | 997 | 15.6% |
| $100,000 to $149,999 | 1,323 | 20.7% |
| $150,000 to $199,999 | 492 | 7.7% |
| $200,000+ | 543 | 8.5% |
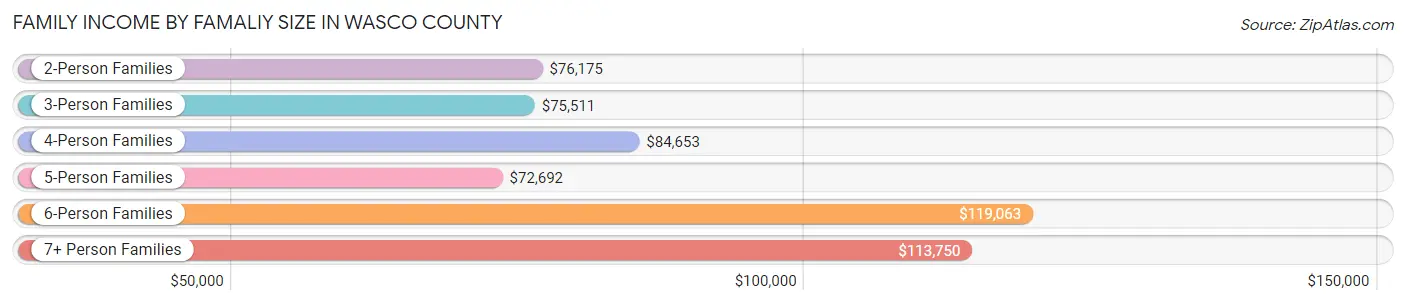
Family Income by Famaliy Size in Wasco County
6-person families (221 | 3.5%) account for the highest median family income in Wasco County with $119,063 per family, while 2-person families (3,469 | 54.3%) have the highest median income of $38,088 per family member.
| Income Bracket | # Families | Median Income |
| 2-Person Families | 3,469 (54.3%) | $76,175 |
| 3-Person Families | 971 (15.2%) | $75,511 |
| 4-Person Families | 1,091 (17.1%) | $84,653 |
| 5-Person Families | 568 (8.9%) | $72,692 |
| 6-Person Families | 221 (3.5%) | $119,063 |
| 7+ Person Families | 73 (1.1%) | $113,750 |
| Total | 6,393 (100.0%) | $78,408 |
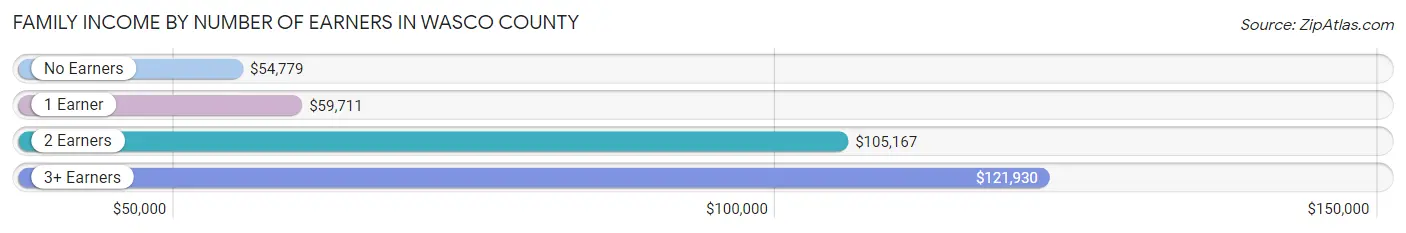
Family Income by Number of Earners in Wasco County
The median family income in Wasco County is $78,408, with families comprising 3+ earners (725) having the highest median family income of $121,930, while families with no earners (1,060) have the lowest median family income of $54,779, accounting for 11.3% and 16.6% of families, respectively.
| Number of Earners | # Families | Median Income |
| No Earners | 1,060 (16.6%) | $54,779 |
| 1 Earner | 2,102 (32.9%) | $59,711 |
| 2 Earners | 2,506 (39.2%) | $105,167 |
| 3+ Earners | 725 (11.3%) | $121,930 |
| Total | 6,393 (100.0%) | $78,408 |
Household Income in Wasco County
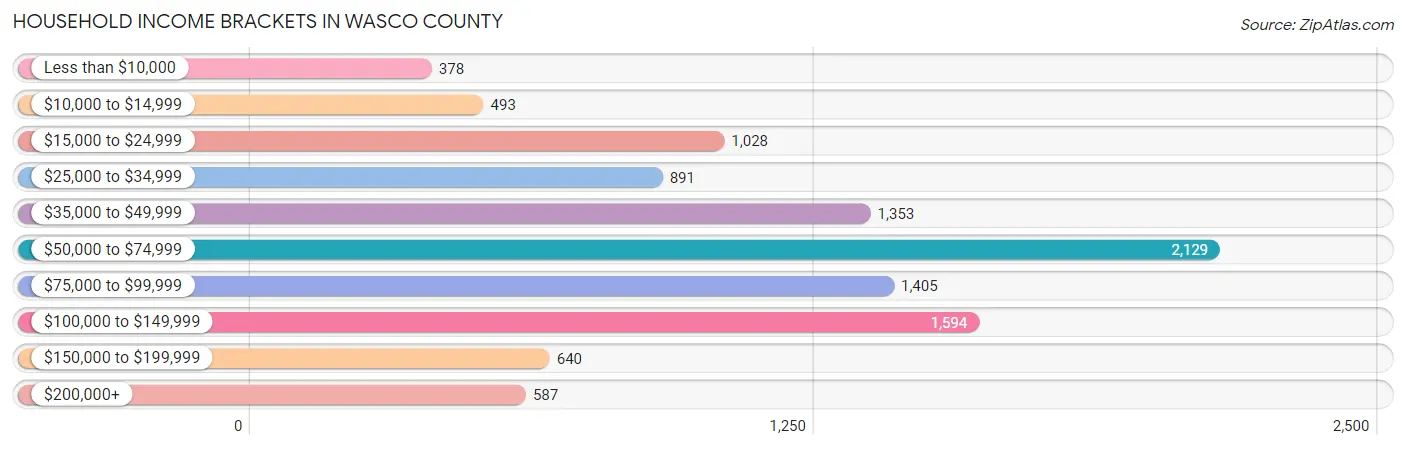
Household Income Brackets in Wasco County
With 2,129 households falling in the category, the $50,000 to $74,999 income range is the most frequent in Wasco County, accounting for 20.3% of all households. In contrast, only 378 households (3.6%) fall into the less than $10,000 income bracket, making it the least populous group.
| Income Bracket | # Households | % Households |
| Less than $10,000 | 378 | 3.6% |
| $10,000 to $14,999 | 493 | 4.7% |
| $15,000 to $24,999 | 1,028 | 9.8% |
| $25,000 to $34,999 | 891 | 8.5% |
| $35,000 to $49,999 | 1,353 | 12.9% |
| $50,000 to $74,999 | 2,129 | 20.3% |
| $75,000 to $99,999 | 1,405 | 13.4% |
| $100,000 to $149,999 | 1,594 | 15.2% |
| $150,000 to $199,999 | 640 | 6.1% |
| $200,000+ | 587 | 5.6% |
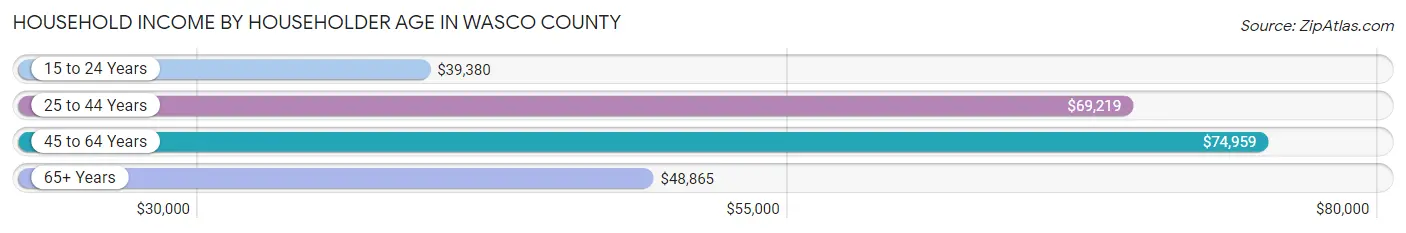
Household Income by Householder Age in Wasco County
The median household income in Wasco County is $61,316, with the highest median household income of $74,959 found in the 45 to 64 years age bracket for the primary householder. A total of 3,479 households (33.2%) fall into this category. Meanwhile, the 15 to 24 years age bracket for the primary householder has the lowest median household income of $39,380, with 480 households (4.6%) in this group.
| Income Bracket | # Households | Median Income |
| 15 to 24 Years | 480 (4.6%) | $39,380 |
| 25 to 44 Years | 3,034 (28.9%) | $69,219 |
| 45 to 64 Years | 3,479 (33.2%) | $74,959 |
| 65+ Years | 3,495 (33.3%) | $48,865 |
| Total | 10,488 (100.0%) | $61,316 |
Poverty in Wasco County
Income Below Poverty by Sex and Age in Wasco County
With 10.9% poverty level for males and 12.5% for females among the residents of Wasco County, 5 year old males and under 5 year old females are the most vulnerable to poverty, with 37 males (36.3%) and 136 females (24.6%) in their respective age groups living below the poverty level.
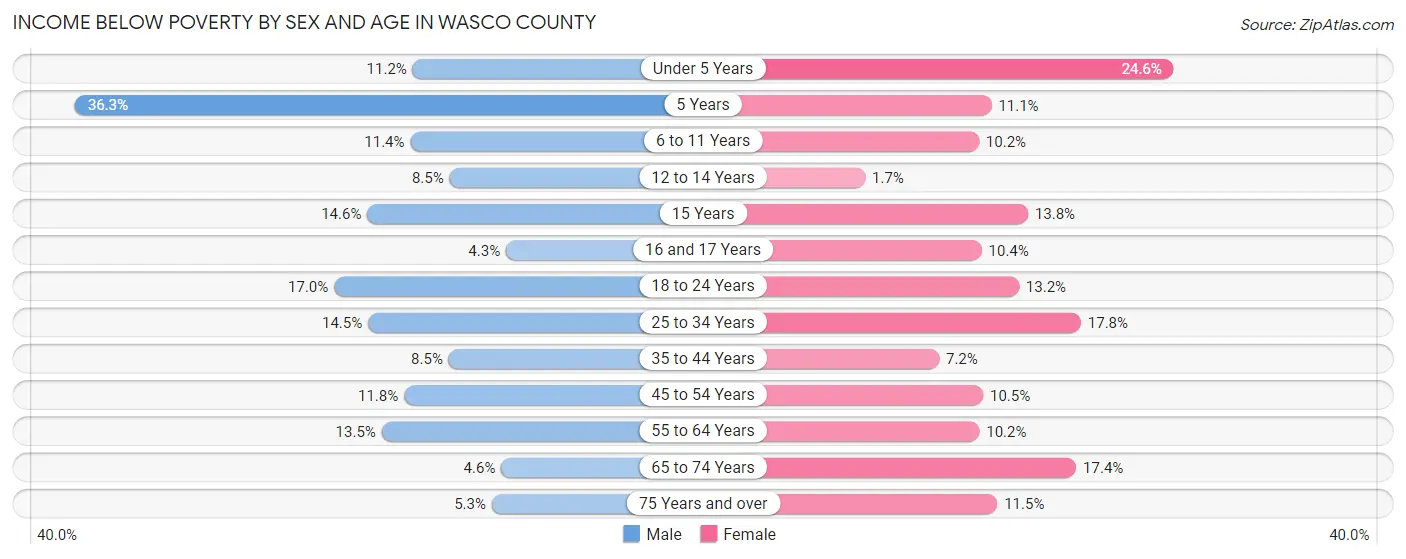
| Age Bracket | Male | Female |
| Under 5 Years | 100 (11.2%) | 136 (24.6%) |
| 5 Years | 37 (36.3%) | 30 (11.1%) |
| 6 to 11 Years | 124 (11.4%) | 79 (10.2%) |
| 12 to 14 Years | 42 (8.5%) | 9 (1.7%) |
| 15 Years | 30 (14.6%) | 17 (13.8%) |
| 16 and 17 Years | 13 (4.3%) | 33 (10.4%) |
| 18 to 24 Years | 178 (17.0%) | 134 (13.2%) |
| 25 to 34 Years | 260 (14.5%) | 298 (17.7%) |
| 35 to 44 Years | 140 (8.5%) | 112 (7.2%) |
| 45 to 54 Years | 174 (11.8%) | 152 (10.5%) |
| 55 to 64 Years | 232 (13.5%) | 190 (10.2%) |
| 65 to 74 Years | 77 (4.6%) | 289 (17.4%) |
| 75 Years and over | 44 (5.3%) | 119 (11.5%) |
| Total | 1,451 (10.9%) | 1,598 (12.5%) |
Income Above Poverty by Sex and Age in Wasco County
According to the poverty statistics in Wasco County, males aged 16 and 17 years and females aged 12 to 14 years are the age groups that are most secure financially, with 95.7% of males and 98.3% of females in these age groups living above the poverty line.
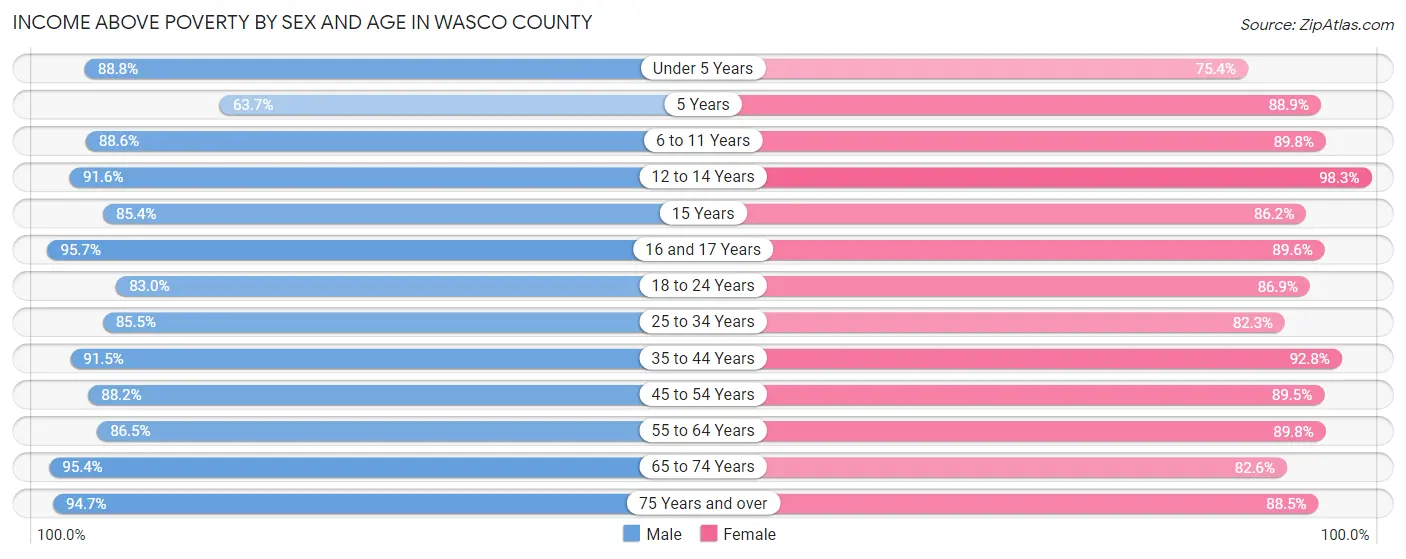
| Age Bracket | Male | Female |
| Under 5 Years | 794 (88.8%) | 416 (75.4%) |
| 5 Years | 65 (63.7%) | 240 (88.9%) |
| 6 to 11 Years | 968 (88.6%) | 697 (89.8%) |
| 12 to 14 Years | 455 (91.5%) | 511 (98.3%) |
| 15 Years | 176 (85.4%) | 106 (86.2%) |
| 16 and 17 Years | 292 (95.7%) | 285 (89.6%) |
| 18 to 24 Years | 868 (83.0%) | 885 (86.9%) |
| 25 to 34 Years | 1,533 (85.5%) | 1,381 (82.3%) |
| 35 to 44 Years | 1,506 (91.5%) | 1,439 (92.8%) |
| 45 to 54 Years | 1,297 (88.2%) | 1,297 (89.5%) |
| 55 to 64 Years | 1,488 (86.5%) | 1,671 (89.8%) |
| 65 to 74 Years | 1,595 (95.4%) | 1,372 (82.6%) |
| 75 Years and over | 784 (94.7%) | 912 (88.5%) |
| Total | 11,821 (89.1%) | 11,212 (87.5%) |
Income Below Poverty Among Married-Couple Families in Wasco County
The poverty statistics for married-couple families in Wasco County show that 2.3% or 110 of the total 4,837 families live below the poverty line. Families with 3 or 4 children have the highest poverty rate of 7.1%, comprising of 41 families. On the other hand, families with 5 or more children have the lowest poverty rate of 0.0%, which includes 0 families.
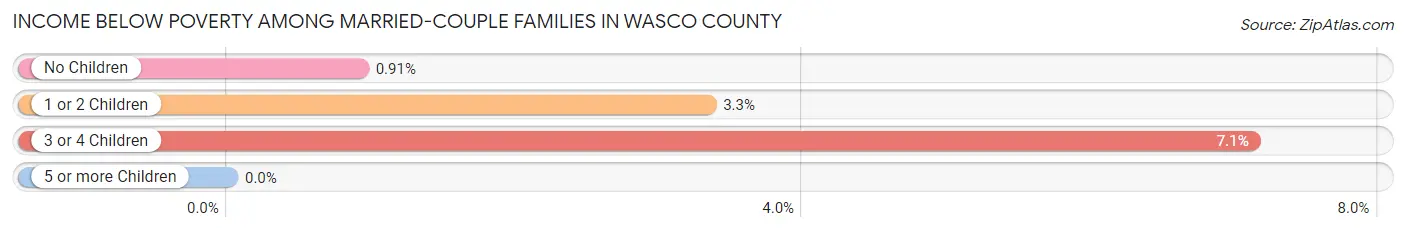
| Children | Above Poverty | Below Poverty |
| No Children | 2,948 (99.1%) | 27 (0.9%) |
| 1 or 2 Children | 1,219 (96.7%) | 42 (3.3%) |
| 3 or 4 Children | 535 (92.9%) | 41 (7.1%) |
| 5 or more Children | 25 (100.0%) | 0 (0.0%) |
| Total | 4,727 (97.7%) | 110 (2.3%) |
Income Below Poverty Among Single-Parent Households in Wasco County
According to the poverty data in Wasco County, 10.6% or 58 single-father households and 21.6% or 218 single-mother households are living below the poverty line. Among single-father households, those with 1 or 2 children have the highest poverty rate, with 54 households (17.4%) experiencing poverty. Likewise, among single-mother households, those with 5 or more children have the highest poverty rate, with 3 households (100.0%) falling below the poverty line.
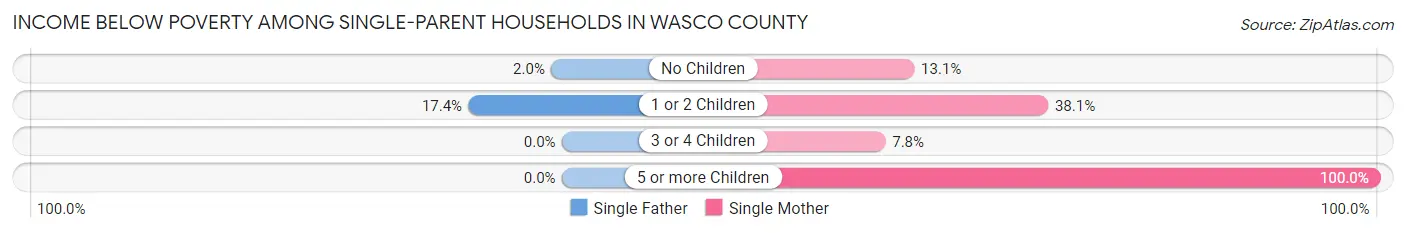
| Children | Single Father | Single Mother |
| No Children | 4 (2.0%) | 68 (13.1%) |
| 1 or 2 Children | 54 (17.4%) | 137 (38.1%) |
| 3 or 4 Children | 0 (0.0%) | 10 (7.7%) |
| 5 or more Children | 0 (0.0%) | 3 (100.0%) |
| Total | 58 (10.6%) | 218 (21.6%) |
Income Below Poverty Among Married-Couple vs Single-Parent Households in Wasco County
The poverty data for Wasco County shows that 110 of the married-couple family households (2.3%) and 276 of the single-parent households (17.7%) are living below the poverty level. Within the married-couple family households, those with 3 or 4 children have the highest poverty rate, with 41 households (7.1%) falling below the poverty line. Among the single-parent households, those with 5 or more children have the highest poverty rate, with 3 household (100.0%) living below poverty.
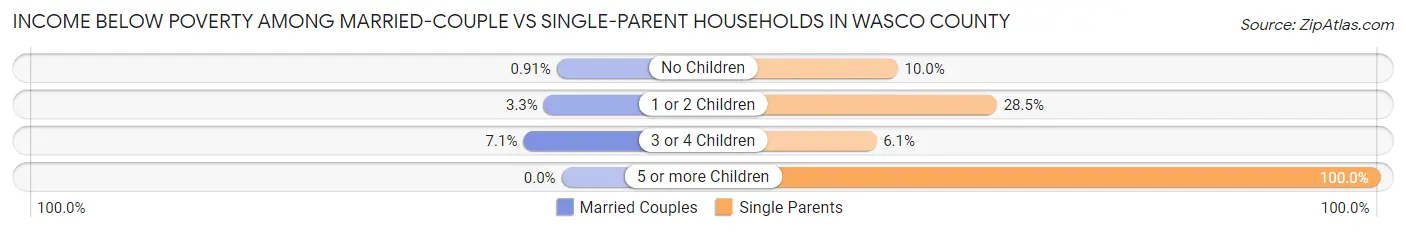
| Children | Married-Couple Families | Single-Parent Households |
| No Children | 27 (0.9%) | 72 (10.0%) |
| 1 or 2 Children | 42 (3.3%) | 191 (28.5%) |
| 3 or 4 Children | 41 (7.1%) | 10 (6.1%) |
| 5 or more Children | 0 (0.0%) | 3 (100.0%) |
| Total | 110 (2.3%) | 276 (17.7%) |
Employment Characteristics in Wasco County
Employment by Class of Employer in Wasco County
Among the 11,567 employed individuals in Wasco County, private company employees (7,257 | 62.7%), not-for-profit organizations (957 | 8.3%), and state government employees (897 | 7.7%) make up the most common classes of employment.
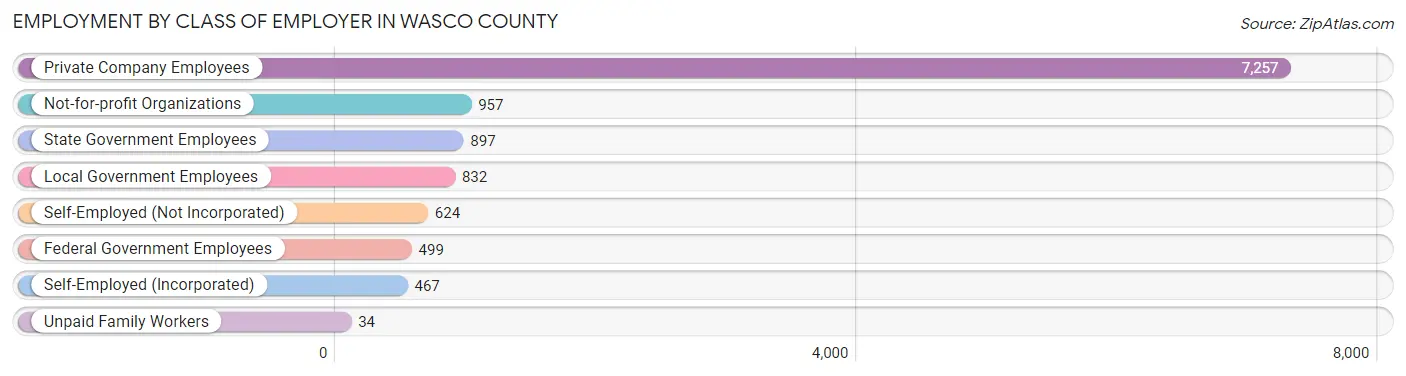
| Employer Class | # Employees | % Employees |
| Private Company Employees | 7,257 | 62.7% |
| Self-Employed (Incorporated) | 467 | 4.0% |
| Self-Employed (Not Incorporated) | 624 | 5.4% |
| Not-for-profit Organizations | 957 | 8.3% |
| Local Government Employees | 832 | 7.2% |
| State Government Employees | 897 | 7.7% |
| Federal Government Employees | 499 | 4.3% |
| Unpaid Family Workers | 34 | 0.3% |
| Total | 11,567 | 100.0% |
Employment Status by Age in Wasco County
According to the labor force statistics for Wasco County, out of the total population over 16 years of age (21,469), 59.7% or 12,817 individuals are in the labor force, with 7.1% or 910 of them unemployed. The age group with the highest labor force participation rate is 20 to 24 years, with 86.3% or 1,444 individuals in the labor force. Within the labor force, the 16 to 19 years age range has the highest percentage of unemployed individuals, with 15.0% or 73 of them being unemployed.
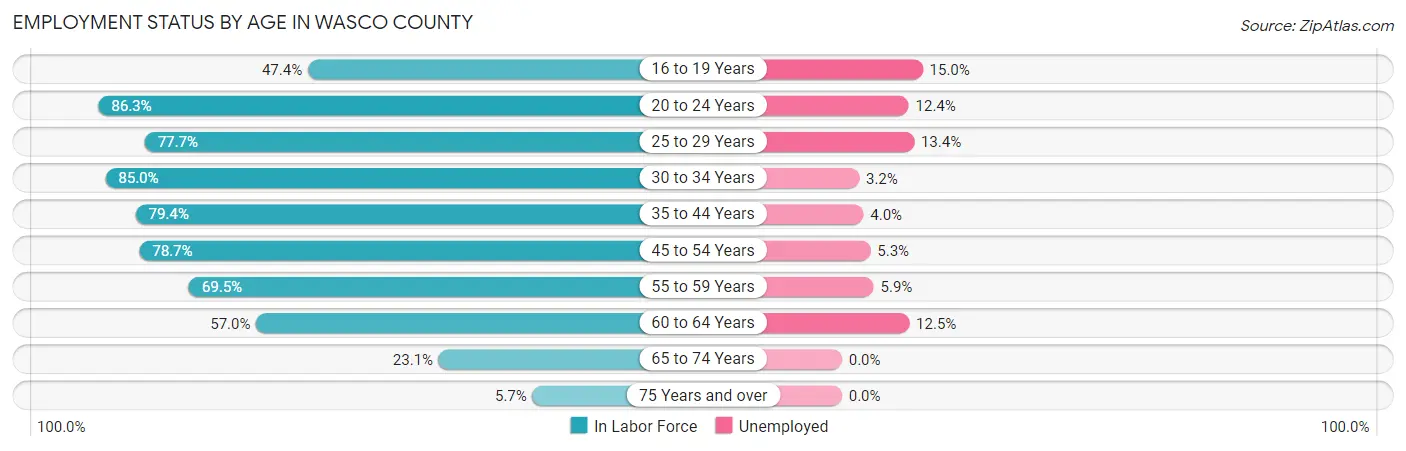
| Age Bracket | In Labor Force | Unemployed |
| 16 to 19 Years | 486 (47.4%) | 73 (15.0%) |
| 20 to 24 Years | 1,444 (86.3%) | 179 (12.4%) |
| 25 to 29 Years | 1,329 (77.7%) | 178 (13.4%) |
| 30 to 34 Years | 1,527 (85.0%) | 49 (3.2%) |
| 35 to 44 Years | 2,569 (79.4%) | 103 (4.0%) |
| 45 to 54 Years | 2,298 (78.7%) | 122 (5.3%) |
| 55 to 59 Years | 1,129 (69.5%) | 67 (5.9%) |
| 60 to 64 Years | 1,130 (57.0%) | 141 (12.5%) |
| 65 to 74 Years | 780 (23.1%) | 0 (0.0%) |
| 75 Years and over | 121 (5.7%) | 0 (0.0%) |
| Total | 12,817 (59.7%) | 910 (7.1%) |
Employment Status by Educational Attainment in Wasco County
According to labor force statistics for Wasco County, 75.2% of individuals (9,978) out of the total population between 25 and 64 years of age (13,269) are in the labor force, with 6.6% or 659 of them being unemployed. The group with the highest labor force participation rate are those with the educational attainment of bachelor's degree or higher, with 82.0% or 2,385 individuals in the labor force. Within the labor force, individuals with high school diploma education have the highest percentage of unemployment, with 11.4% or 287 of them being unemployed.
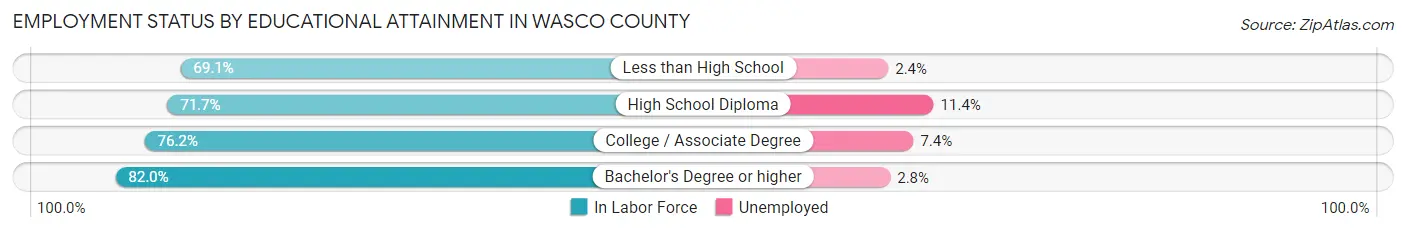
| Educational Attainment | In Labor Force | Unemployed |
| Less than High School | 1,380 (69.1%) | 48 (2.4%) |
| High School Diploma | 2,517 (71.7%) | 400 (11.4%) |
| College / Associate Degree | 3,699 (76.2%) | 359 (7.4%) |
| Bachelor's Degree or higher | 2,385 (82.0%) | 81 (2.8%) |
| Total | 9,978 (75.2%) | 876 (6.6%) |
Employment Occupations by Sex in Wasco County
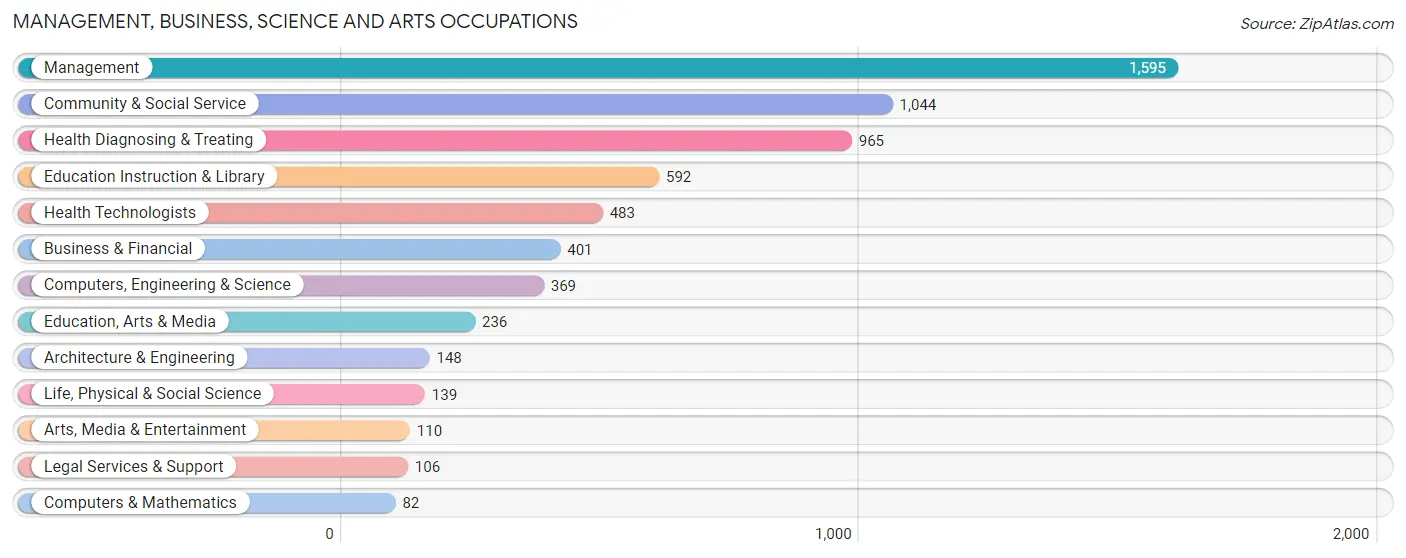
Management, Business, Science and Arts Occupations
The most common Management, Business, Science and Arts occupations in Wasco County are Management (1,595 | 13.4%), Community & Social Service (1,044 | 8.8%), Health Diagnosing & Treating (965 | 8.1%), Education Instruction & Library (592 | 5.0%), and Health Technologists (483 | 4.1%).
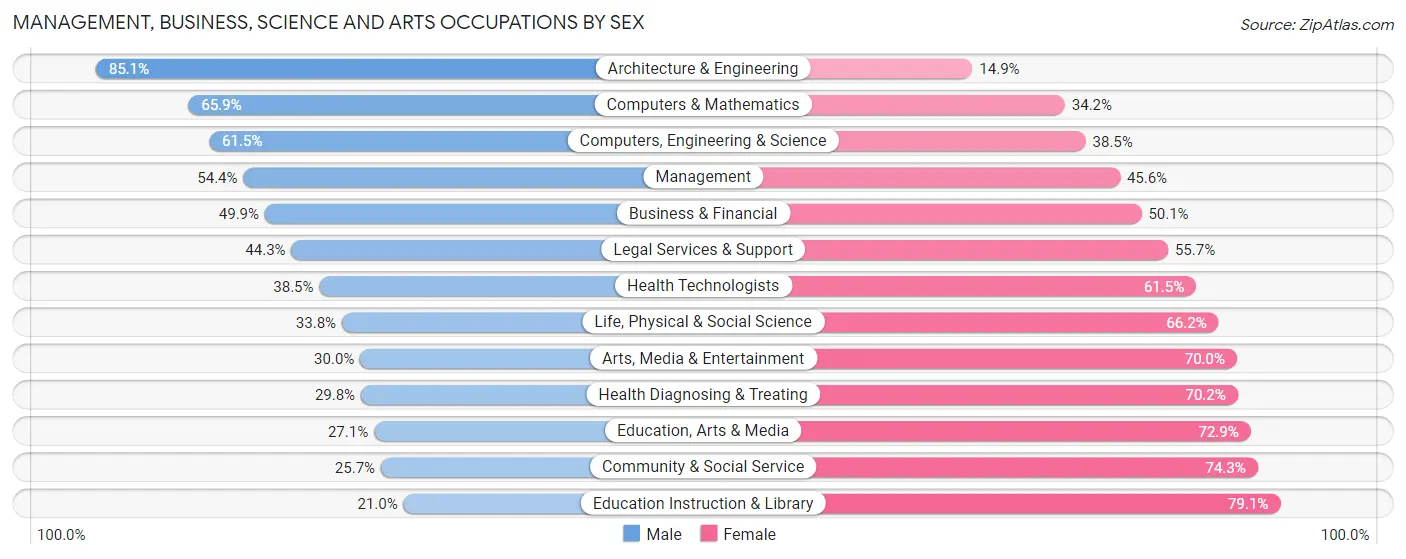
Management, Business, Science and Arts Occupations by Sex
Within the Management, Business, Science and Arts occupations in Wasco County, the most male-oriented occupations are Architecture & Engineering (85.1%), Computers & Mathematics (65.8%), and Computers, Engineering & Science (61.5%), while the most female-oriented occupations are Education Instruction & Library (79.0%), Community & Social Service (74.3%), and Education, Arts & Media (72.9%).
| Occupation | Male | Female |
| Management | 867 (54.4%) | 728 (45.6%) |
| Business & Financial | 200 (49.9%) | 201 (50.1%) |
| Computers, Engineering & Science | 227 (61.5%) | 142 (38.5%) |
| Computers & Mathematics | 54 (65.8%) | 28 (34.2%) |
| Architecture & Engineering | 126 (85.1%) | 22 (14.9%) |
| Life, Physical & Social Science | 47 (33.8%) | 92 (66.2%) |
| Community & Social Service | 268 (25.7%) | 776 (74.3%) |
| Education, Arts & Media | 64 (27.1%) | 172 (72.9%) |
| Legal Services & Support | 47 (44.3%) | 59 (55.7%) |
| Education Instruction & Library | 124 (20.9%) | 468 (79.0%) |
| Arts, Media & Entertainment | 33 (30.0%) | 77 (70.0%) |
| Health Diagnosing & Treating | 288 (29.8%) | 677 (70.2%) |
| Health Technologists | 186 (38.5%) | 297 (61.5%) |
| Total (Category) | 1,850 (42.3%) | 2,524 (57.7%) |
| Total (Overall) | 6,131 (51.6%) | 5,739 (48.3%) |
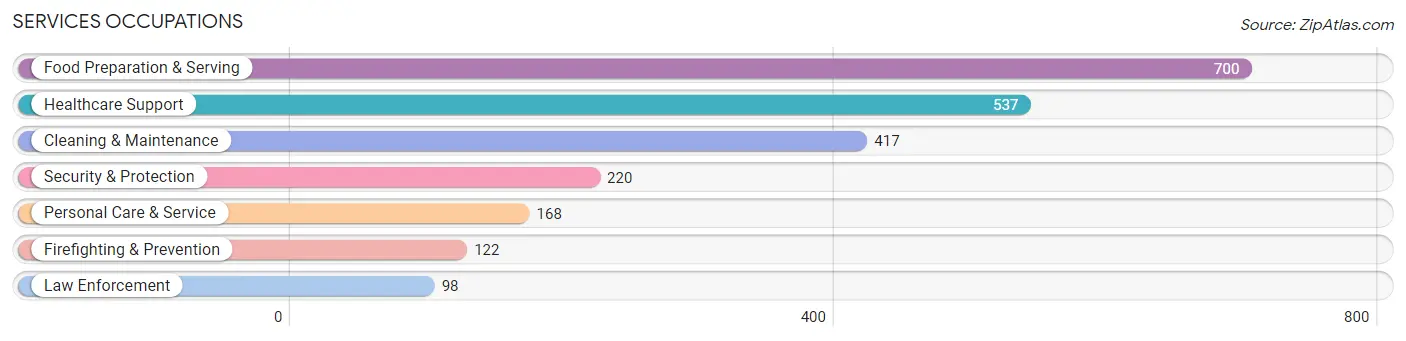
Services Occupations
The most common Services occupations in Wasco County are Food Preparation & Serving (700 | 5.9%), Healthcare Support (537 | 4.5%), Cleaning & Maintenance (417 | 3.5%), Security & Protection (220 | 1.8%), and Personal Care & Service (168 | 1.4%).
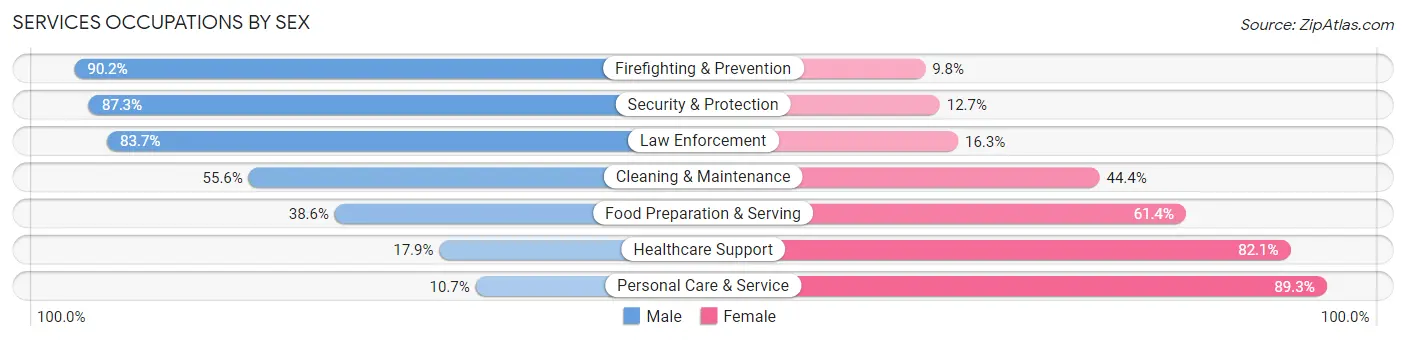
Services Occupations by Sex
Within the Services occupations in Wasco County, the most male-oriented occupations are Firefighting & Prevention (90.2%), Security & Protection (87.3%), and Law Enforcement (83.7%), while the most female-oriented occupations are Personal Care & Service (89.3%), Healthcare Support (82.1%), and Food Preparation & Serving (61.4%).
| Occupation | Male | Female |
| Healthcare Support | 96 (17.9%) | 441 (82.1%) |
| Security & Protection | 192 (87.3%) | 28 (12.7%) |
| Firefighting & Prevention | 110 (90.2%) | 12 (9.8%) |
| Law Enforcement | 82 (83.7%) | 16 (16.3%) |
| Food Preparation & Serving | 270 (38.6%) | 430 (61.4%) |
| Cleaning & Maintenance | 232 (55.6%) | 185 (44.4%) |
| Personal Care & Service | 18 (10.7%) | 150 (89.3%) |
| Total (Category) | 808 (39.6%) | 1,234 (60.4%) |
| Total (Overall) | 6,131 (51.6%) | 5,739 (48.3%) |
Sales and Office Occupations
The most common Sales and Office occupations in Wasco County are Office & Administration (1,204 | 10.1%), and Sales & Related (1,037 | 8.7%).

Sales and Office Occupations by Sex
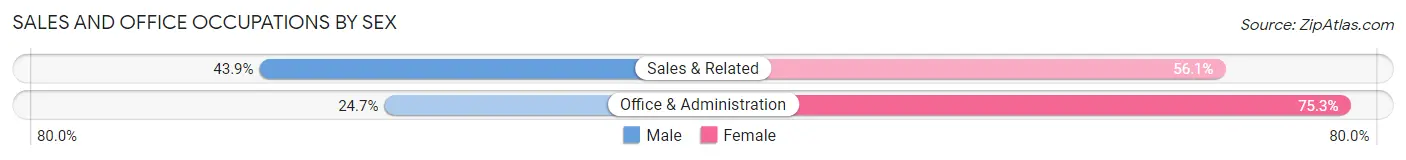
| Occupation | Male | Female |
| Sales & Related | 455 (43.9%) | 582 (56.1%) |
| Office & Administration | 297 (24.7%) | 907 (75.3%) |
| Total (Category) | 752 (33.6%) | 1,489 (66.4%) |
| Total (Overall) | 6,131 (51.6%) | 5,739 (48.3%) |
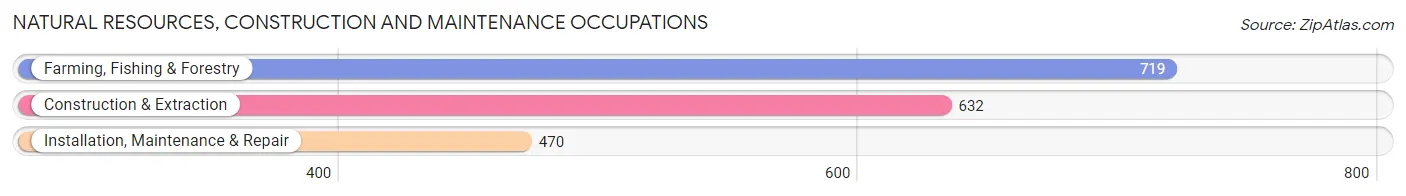
Natural Resources, Construction and Maintenance Occupations
The most common Natural Resources, Construction and Maintenance occupations in Wasco County are Farming, Fishing & Forestry (719 | 6.1%), Construction & Extraction (632 | 5.3%), and Installation, Maintenance & Repair (470 | 4.0%).
Natural Resources, Construction and Maintenance Occupations by Sex
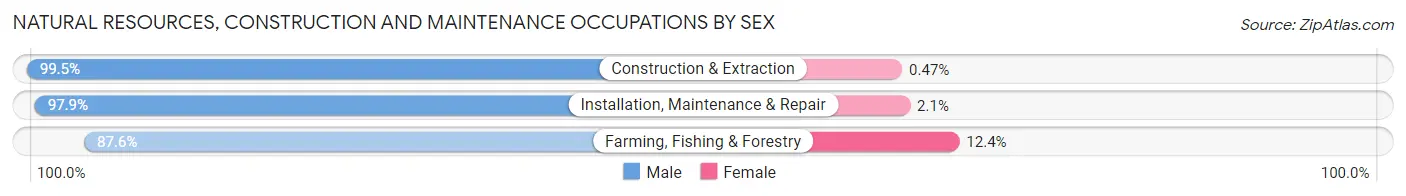
| Occupation | Male | Female |
| Farming, Fishing & Forestry | 630 (87.6%) | 89 (12.4%) |
| Construction & Extraction | 629 (99.5%) | 3 (0.5%) |
| Installation, Maintenance & Repair | 460 (97.9%) | 10 (2.1%) |
| Total (Category) | 1,719 (94.4%) | 102 (5.6%) |
| Total (Overall) | 6,131 (51.6%) | 5,739 (48.3%) |
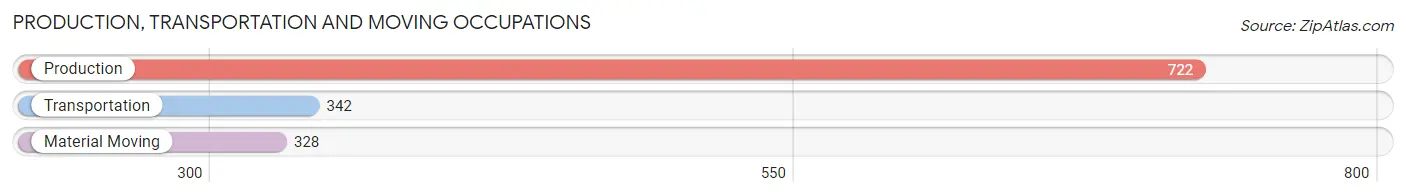
Production, Transportation and Moving Occupations
The most common Production, Transportation and Moving occupations in Wasco County are Production (722 | 6.1%), Transportation (342 | 2.9%), and Material Moving (328 | 2.8%).
Production, Transportation and Moving Occupations by Sex
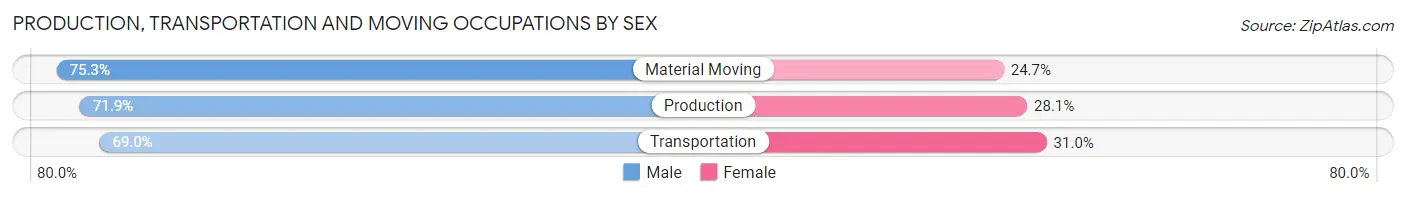
| Occupation | Male | Female |
| Production | 519 (71.9%) | 203 (28.1%) |
| Transportation | 236 (69.0%) | 106 (31.0%) |
| Material Moving | 247 (75.3%) | 81 (24.7%) |
| Total (Category) | 1,002 (72.0%) | 390 (28.0%) |
| Total (Overall) | 6,131 (51.6%) | 5,739 (48.3%) |
Employment Industries by Sex in Wasco County
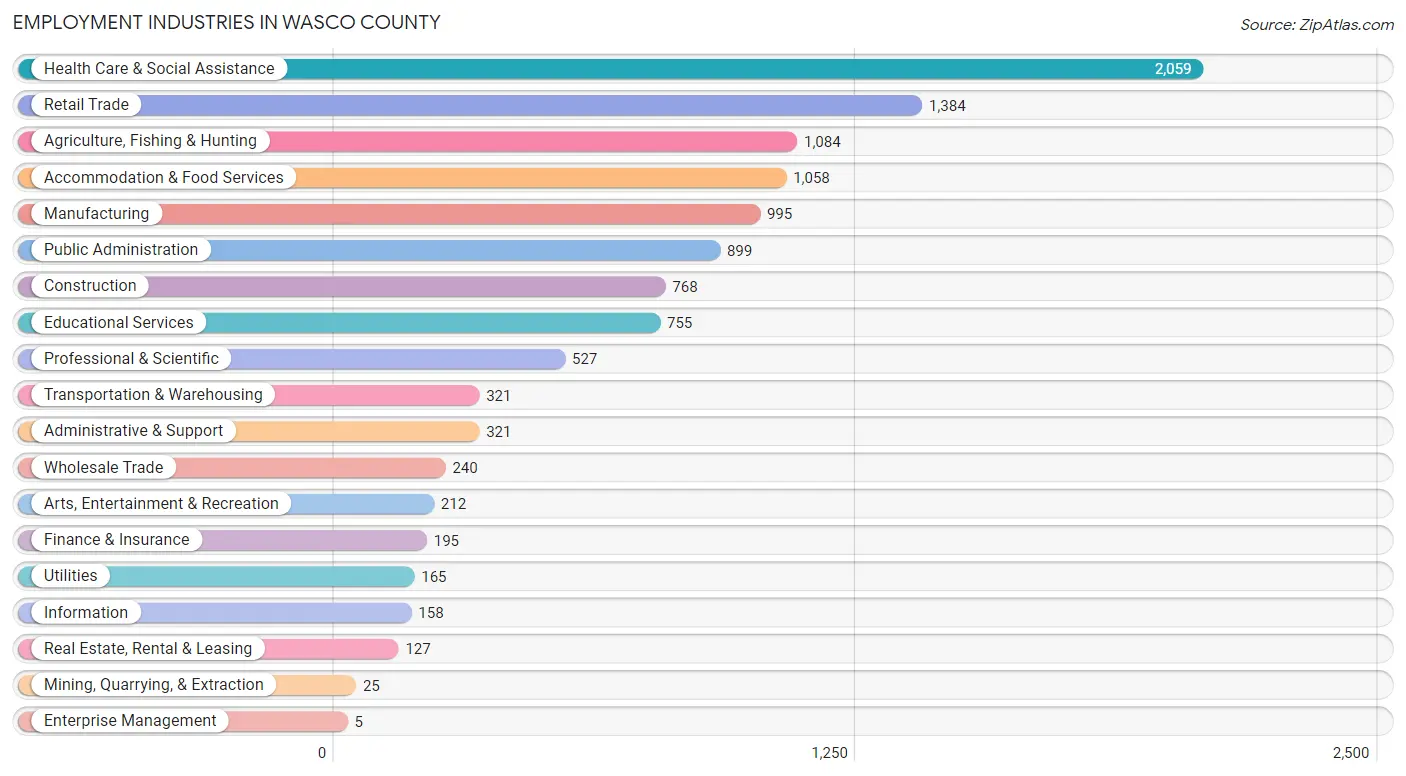
Employment Industries in Wasco County
The major employment industries in Wasco County include Health Care & Social Assistance (2,059 | 17.3%), Retail Trade (1,384 | 11.7%), Agriculture, Fishing & Hunting (1,084 | 9.1%), Accommodation & Food Services (1,058 | 8.9%), and Manufacturing (995 | 8.4%).
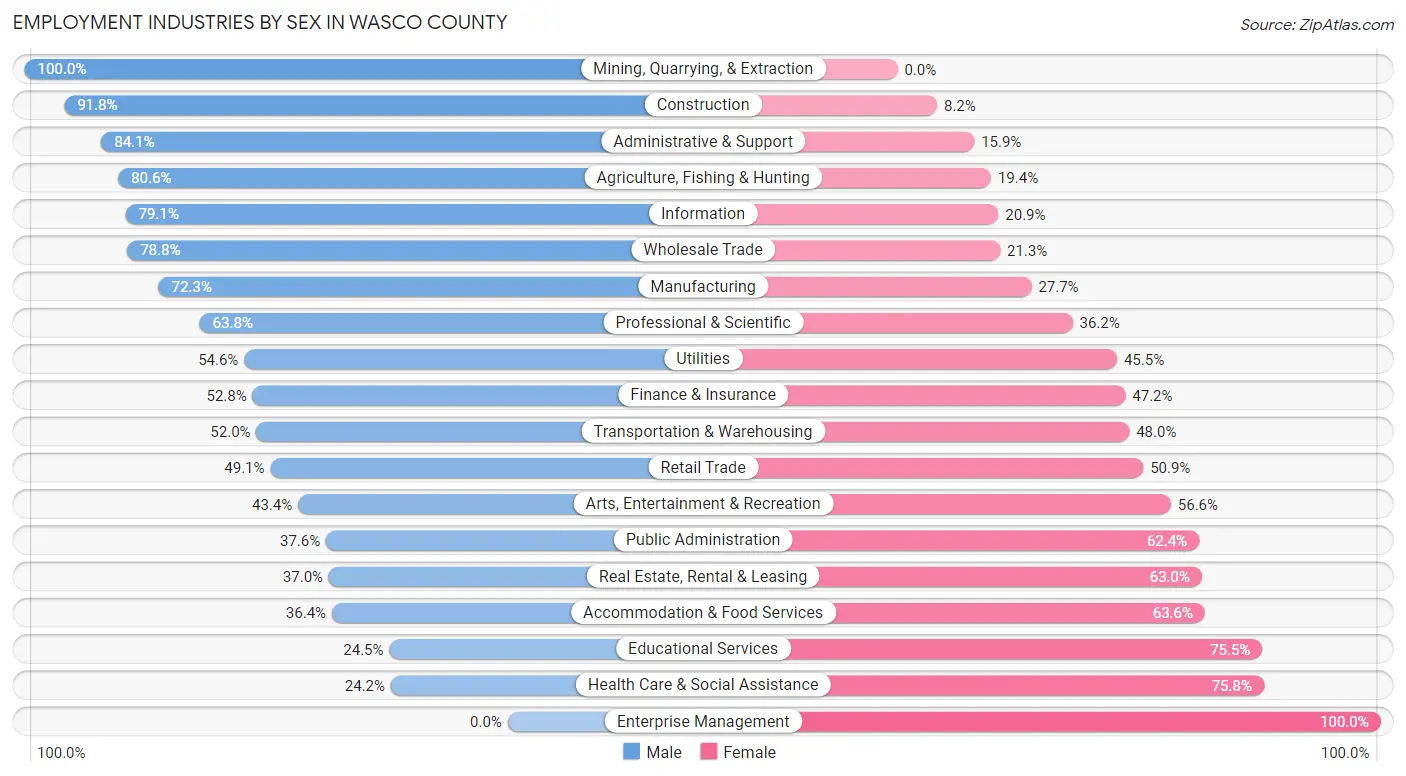
Employment Industries by Sex in Wasco County
The Wasco County industries that see more men than women are Mining, Quarrying, & Extraction (100.0%), Construction (91.8%), and Administrative & Support (84.1%), whereas the industries that tend to have a higher number of women are Enterprise Management (100.0%), Health Care & Social Assistance (75.8%), and Educational Services (75.5%).
| Industry | Male | Female |
| Agriculture, Fishing & Hunting | 874 (80.6%) | 210 (19.4%) |
| Mining, Quarrying, & Extraction | 25 (100.0%) | 0 (0.0%) |
| Construction | 705 (91.8%) | 63 (8.2%) |
| Manufacturing | 719 (72.3%) | 276 (27.7%) |
| Wholesale Trade | 189 (78.7%) | 51 (21.2%) |
| Retail Trade | 680 (49.1%) | 704 (50.9%) |
| Transportation & Warehousing | 167 (52.0%) | 154 (48.0%) |
| Utilities | 90 (54.5%) | 75 (45.5%) |
| Information | 125 (79.1%) | 33 (20.9%) |
| Finance & Insurance | 103 (52.8%) | 92 (47.2%) |
| Real Estate, Rental & Leasing | 47 (37.0%) | 80 (63.0%) |
| Professional & Scientific | 336 (63.8%) | 191 (36.2%) |
| Enterprise Management | 0 (0.0%) | 5 (100.0%) |
| Administrative & Support | 270 (84.1%) | 51 (15.9%) |
| Educational Services | 185 (24.5%) | 570 (75.5%) |
| Health Care & Social Assistance | 498 (24.2%) | 1,561 (75.8%) |
| Arts, Entertainment & Recreation | 92 (43.4%) | 120 (56.6%) |
| Accommodation & Food Services | 385 (36.4%) | 673 (63.6%) |
| Public Administration | 338 (37.6%) | 561 (62.4%) |
| Total | 6,131 (51.6%) | 5,739 (48.3%) |
Education in Wasco County
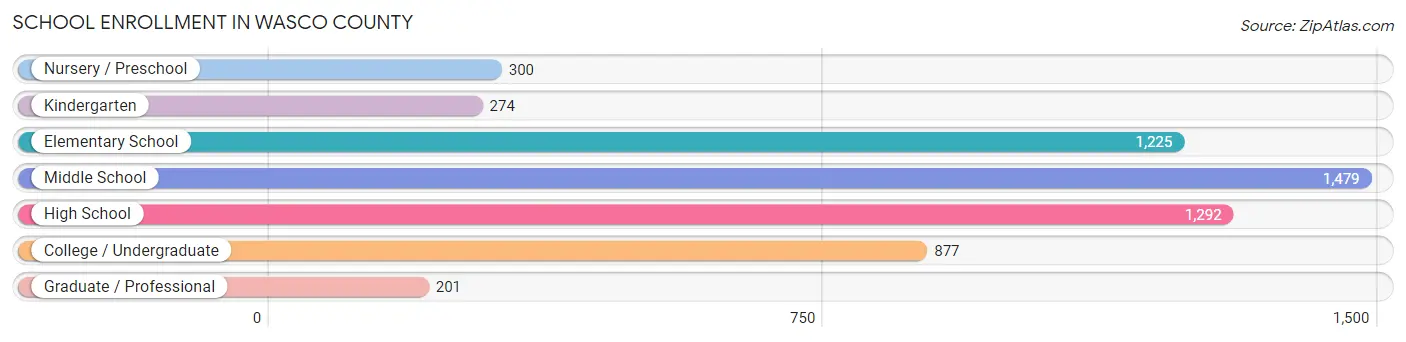
School Enrollment in Wasco County
The most common levels of schooling among the 5,648 students in Wasco County are middle school (1,479 | 26.2%), high school (1,292 | 22.9%), and elementary school (1,225 | 21.7%).
| School Level | # Students | % Students |
| Nursery / Preschool | 300 | 5.3% |
| Kindergarten | 274 | 4.9% |
| Elementary School | 1,225 | 21.7% |
| Middle School | 1,479 | 26.2% |
| High School | 1,292 | 22.9% |
| College / Undergraduate | 877 | 15.5% |
| Graduate / Professional | 201 | 3.6% |
| Total | 5,648 | 100.0% |
School Enrollment by Age by Funding Source in Wasco County
Out of a total of 5,648 students who are enrolled in schools in Wasco County, 774 (13.7%) attend a private institution, while the remaining 4,874 (86.3%) are enrolled in public schools. The age group of 25 to 34 year olds has the highest likelihood of being enrolled in private schools, with 132 (44.9% in the age bracket) enrolled. Conversely, the age group of 15 to 17 year olds has the lowest likelihood of being enrolled in a private school, with 909 (95.5% in the age bracket) attending a public institution.
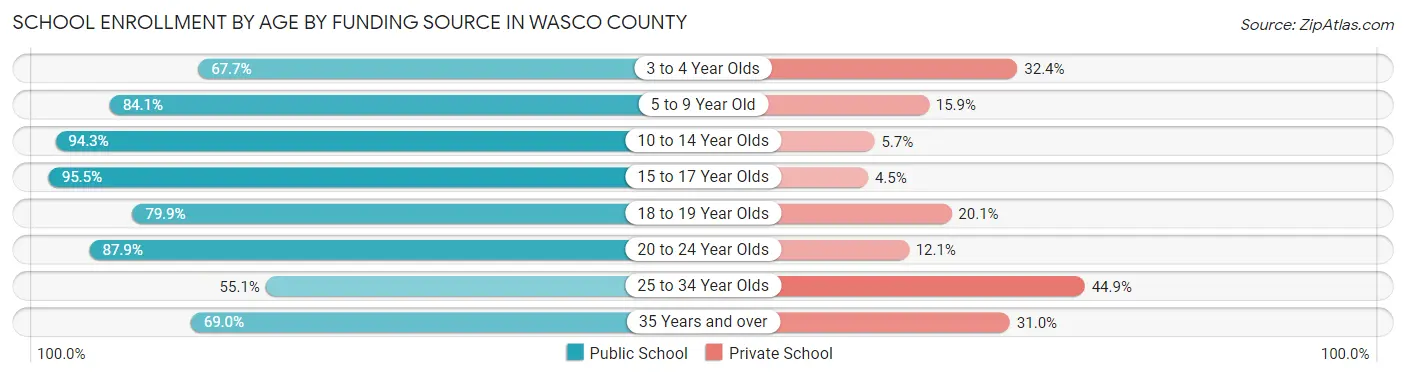
| Age Bracket | Public School | Private School |
| 3 to 4 Year Olds | 138 (67.6%) | 66 (32.4%) |
| 5 to 9 Year Old | 1,183 (84.1%) | 223 (15.9%) |
| 10 to 14 Year Olds | 1,644 (94.3%) | 100 (5.7%) |
| 15 to 17 Year Olds | 909 (95.5%) | 43 (4.5%) |
| 18 to 19 Year Olds | 223 (79.9%) | 56 (20.1%) |
| 20 to 24 Year Olds | 392 (87.9%) | 54 (12.1%) |
| 25 to 34 Year Olds | 162 (55.1%) | 132 (44.9%) |
| 35 Years and over | 223 (69.0%) | 100 (31.0%) |
| Total | 4,874 (86.3%) | 774 (13.7%) |
Educational Attainment by Field of Study in Wasco County
Education (725 | 16.5%), business (584 | 13.3%), bio, nature & agricultural (389 | 8.8%), liberal arts & history (389 | 8.8%), and science & technology (379 | 8.6%) are the most common fields of study among 4,407 individuals in Wasco County who have obtained a bachelor's degree or higher.
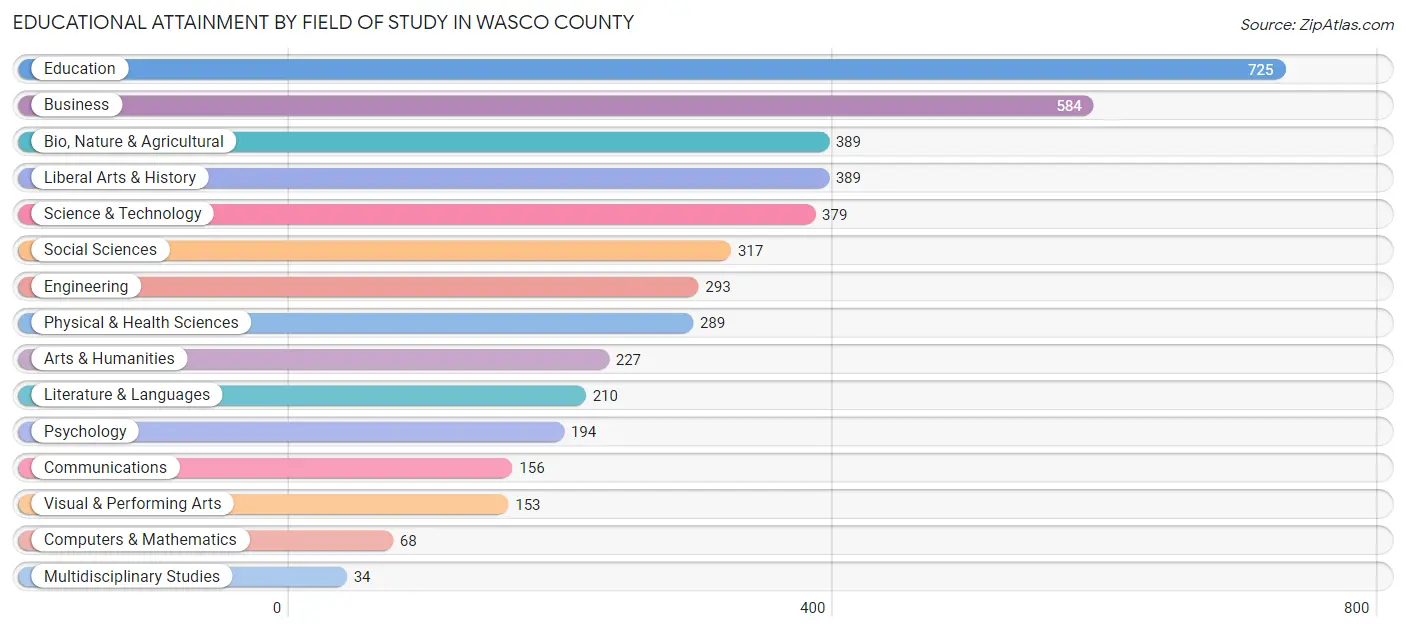
| Field of Study | # Graduates | % Graduates |
| Computers & Mathematics | 68 | 1.5% |
| Bio, Nature & Agricultural | 389 | 8.8% |
| Physical & Health Sciences | 289 | 6.6% |
| Psychology | 194 | 4.4% |
| Social Sciences | 317 | 7.2% |
| Engineering | 293 | 6.7% |
| Multidisciplinary Studies | 34 | 0.8% |
| Science & Technology | 379 | 8.6% |
| Business | 584 | 13.3% |
| Education | 725 | 16.5% |
| Literature & Languages | 210 | 4.8% |
| Liberal Arts & History | 389 | 8.8% |
| Visual & Performing Arts | 153 | 3.5% |
| Communications | 156 | 3.5% |
| Arts & Humanities | 227 | 5.1% |
| Total | 4,407 | 100.0% |
Transportation & Commute in Wasco County
Vehicle Availability by Sex in Wasco County
The most prevalent vehicle ownership categories in Wasco County are males with 2 vehicles (2,041, accounting for 36.2%) and females with 2 vehicles (1,926, making up 37.1%).
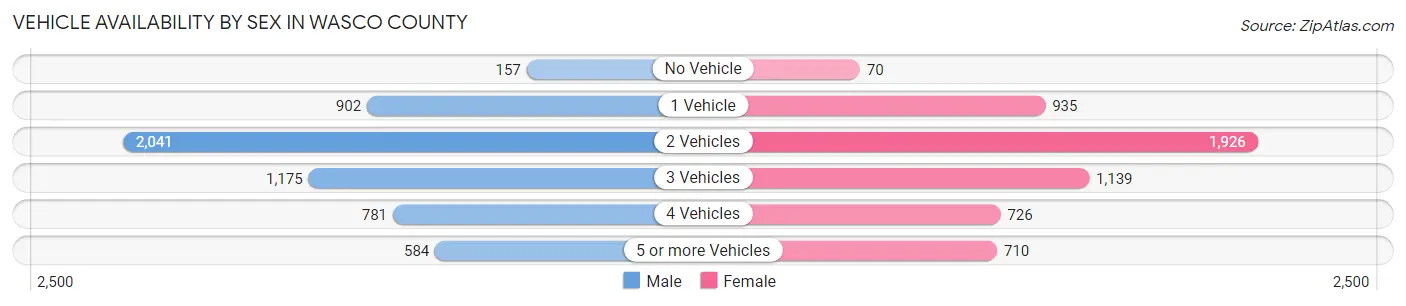
| Vehicles Available | Male | Female |
| No Vehicle | 157 (2.8%) | 70 (1.3%) |
| 1 Vehicle | 902 (16.0%) | 935 (17.0%) |
| 2 Vehicles | 2,041 (36.2%) | 1,926 (35.0%) |
| 3 Vehicles | 1,175 (20.8%) | 1,139 (20.7%) |
| 4 Vehicles | 781 (13.9%) | 726 (13.2%) |
| 5 or more Vehicles | 584 (10.3%) | 710 (12.9%) |
| Total | 5,640 (100.0%) | 5,506 (100.0%) |
Commute Time in Wasco County
The most frequently occuring commute durations in Wasco County are 5 to 9 minutes (2,911 commuters, 27.1%), 10 to 14 minutes (2,151 commuters, 20.0%), and 15 to 19 minutes (1,351 commuters, 12.6%).
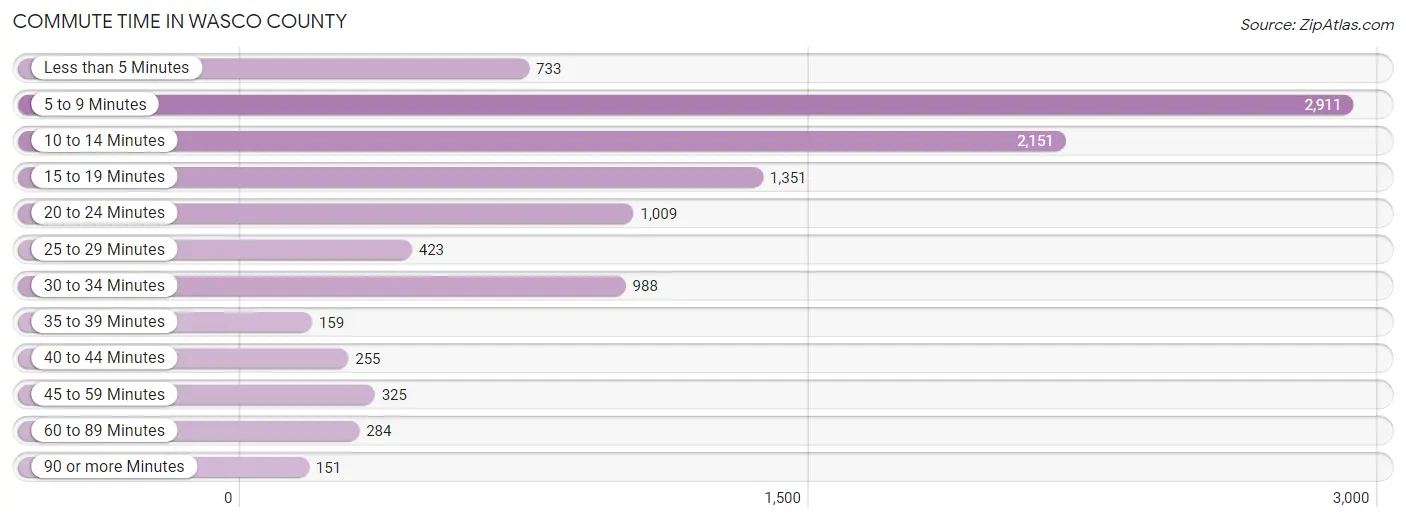
| Commute Time | # Commuters | % Commuters |
| Less than 5 Minutes | 733 | 6.8% |
| 5 to 9 Minutes | 2,911 | 27.1% |
| 10 to 14 Minutes | 2,151 | 20.0% |
| 15 to 19 Minutes | 1,351 | 12.6% |
| 20 to 24 Minutes | 1,009 | 9.4% |
| 25 to 29 Minutes | 423 | 3.9% |
| 30 to 34 Minutes | 988 | 9.2% |
| 35 to 39 Minutes | 159 | 1.5% |
| 40 to 44 Minutes | 255 | 2.4% |
| 45 to 59 Minutes | 325 | 3.0% |
| 60 to 89 Minutes | 284 | 2.6% |
| 90 or more Minutes | 151 | 1.4% |
Commute Time by Sex in Wasco County
The most common commute times in Wasco County are 5 to 9 minutes (1,486 commuters, 26.6%) for males and 5 to 9 minutes (1,425 commuters, 27.7%) for females.
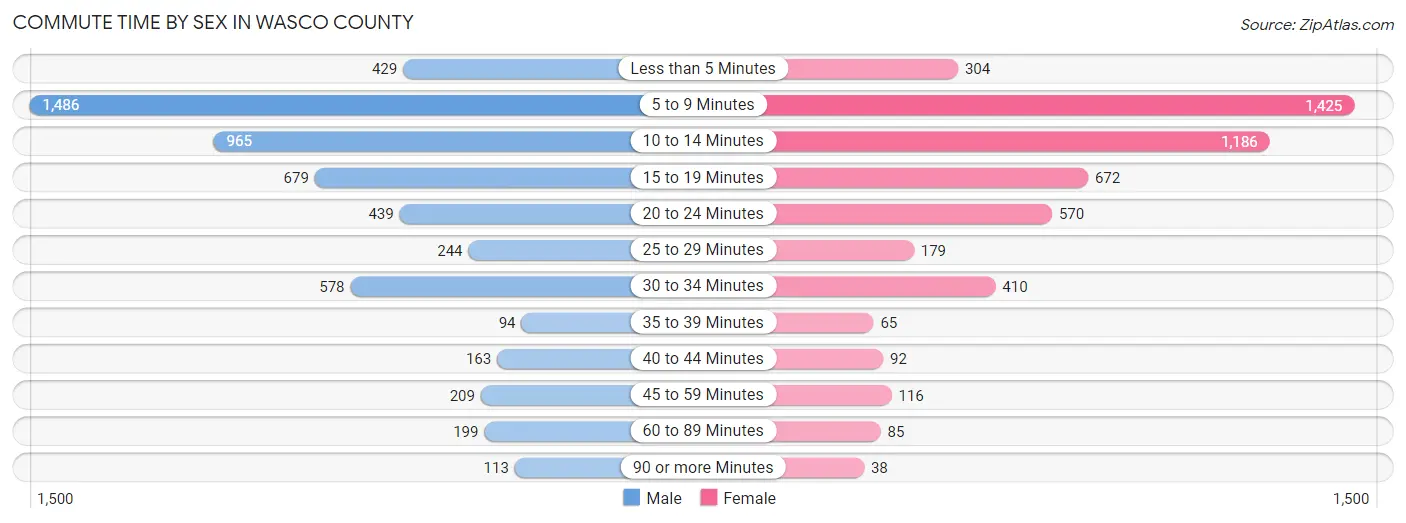
| Commute Time | Male | Female |
| Less than 5 Minutes | 429 (7.7%) | 304 (5.9%) |
| 5 to 9 Minutes | 1,486 (26.6%) | 1,425 (27.7%) |
| 10 to 14 Minutes | 965 (17.2%) | 1,186 (23.1%) |
| 15 to 19 Minutes | 679 (12.1%) | 672 (13.1%) |
| 20 to 24 Minutes | 439 (7.8%) | 570 (11.1%) |
| 25 to 29 Minutes | 244 (4.4%) | 179 (3.5%) |
| 30 to 34 Minutes | 578 (10.3%) | 410 (8.0%) |
| 35 to 39 Minutes | 94 (1.7%) | 65 (1.3%) |
| 40 to 44 Minutes | 163 (2.9%) | 92 (1.8%) |
| 45 to 59 Minutes | 209 (3.7%) | 116 (2.3%) |
| 60 to 89 Minutes | 199 (3.5%) | 85 (1.7%) |
| 90 or more Minutes | 113 (2.0%) | 38 (0.7%) |
Time of Departure to Work by Sex in Wasco County
The most frequent times of departure to work in Wasco County are 7:30 AM to 7:59 AM (798, 14.3%) for males and 7:30 AM to 7:59 AM (834, 16.2%) for females.
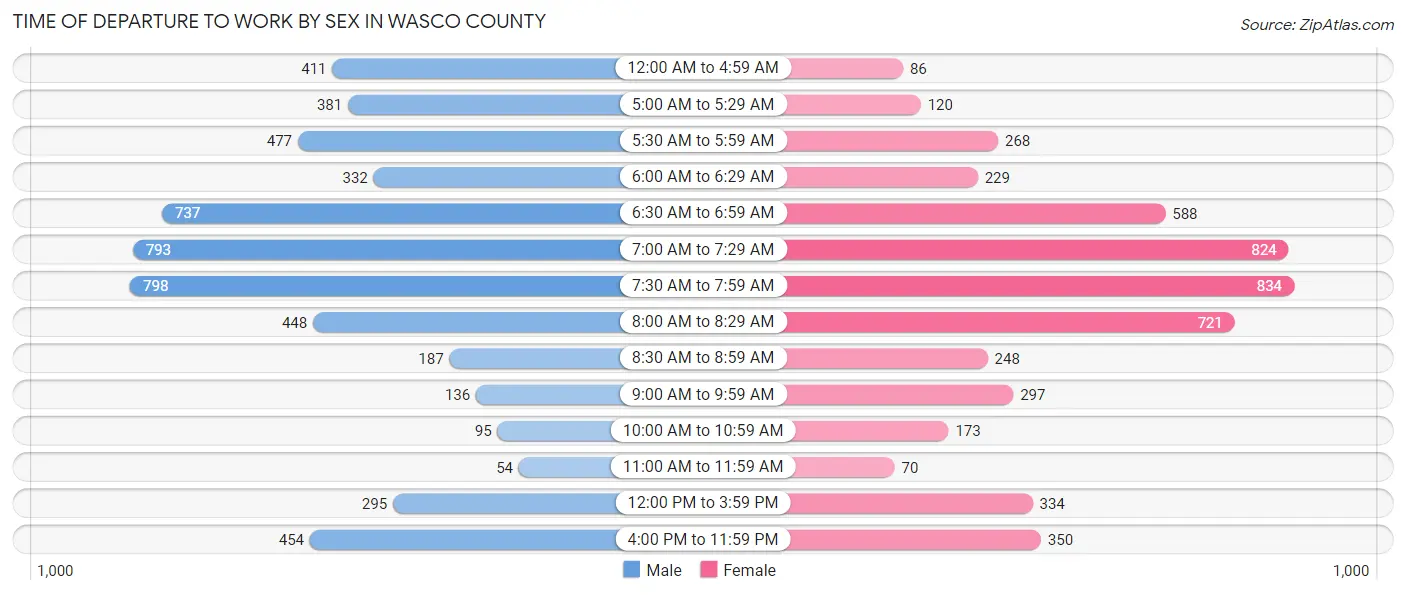
| Time of Departure | Male | Female |
| 12:00 AM to 4:59 AM | 411 (7.3%) | 86 (1.7%) |
| 5:00 AM to 5:29 AM | 381 (6.8%) | 120 (2.3%) |
| 5:30 AM to 5:59 AM | 477 (8.5%) | 268 (5.2%) |
| 6:00 AM to 6:29 AM | 332 (5.9%) | 229 (4.4%) |
| 6:30 AM to 6:59 AM | 737 (13.2%) | 588 (11.4%) |
| 7:00 AM to 7:29 AM | 793 (14.2%) | 824 (16.0%) |
| 7:30 AM to 7:59 AM | 798 (14.3%) | 834 (16.2%) |
| 8:00 AM to 8:29 AM | 448 (8.0%) | 721 (14.0%) |
| 8:30 AM to 8:59 AM | 187 (3.3%) | 248 (4.8%) |
| 9:00 AM to 9:59 AM | 136 (2.4%) | 297 (5.8%) |
| 10:00 AM to 10:59 AM | 95 (1.7%) | 173 (3.4%) |
| 11:00 AM to 11:59 AM | 54 (1.0%) | 70 (1.4%) |
| 12:00 PM to 3:59 PM | 295 (5.3%) | 334 (6.5%) |
| 4:00 PM to 11:59 PM | 454 (8.1%) | 350 (6.8%) |
| Total | 5,598 (100.0%) | 5,142 (100.0%) |
Housing Occupancy in Wasco County
Occupancy by Ownership in Wasco County
Of the total 10,488 dwellings in Wasco County, owner-occupied units account for 6,830 (65.1%), while renter-occupied units make up 3,658 (34.9%).
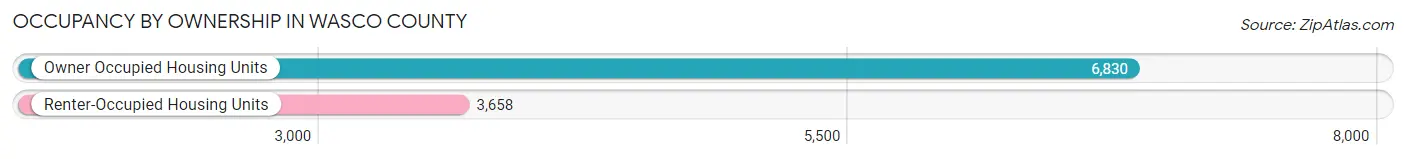
| Occupancy | # Housing Units | % Housing Units |
| Owner Occupied Housing Units | 6,830 | 65.1% |
| Renter-Occupied Housing Units | 3,658 | 34.9% |
| Total Occupied Housing Units | 10,488 | 100.0% |
Occupancy by Household Size in Wasco County
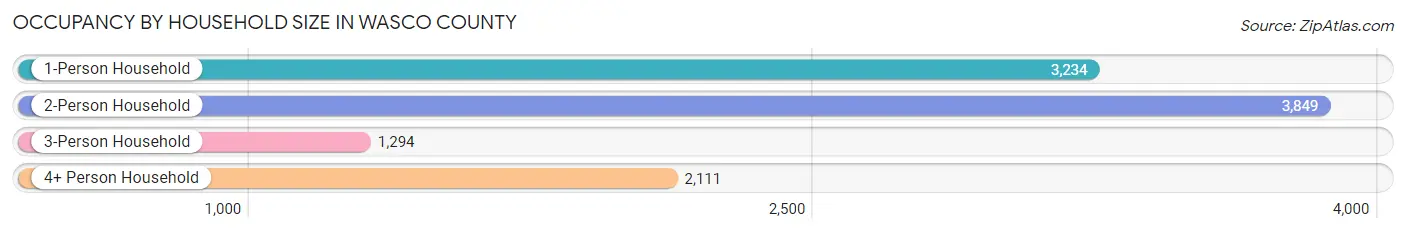
| Household Size | # Housing Units | % Housing Units |
| 1-Person Household | 3,234 | 30.8% |
| 2-Person Household | 3,849 | 36.7% |
| 3-Person Household | 1,294 | 12.3% |
| 4+ Person Household | 2,111 | 20.1% |
| Total Housing Units | 10,488 | 100.0% |
Occupancy by Ownership by Household Size in Wasco County
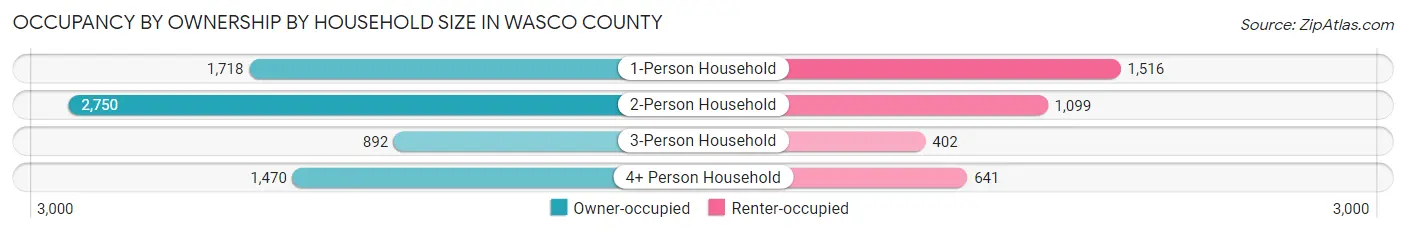
| Household Size | Owner-occupied | Renter-occupied |
| 1-Person Household | 1,718 (53.1%) | 1,516 (46.9%) |
| 2-Person Household | 2,750 (71.5%) | 1,099 (28.5%) |
| 3-Person Household | 892 (68.9%) | 402 (31.1%) |
| 4+ Person Household | 1,470 (69.6%) | 641 (30.4%) |
| Total Housing Units | 6,830 (65.1%) | 3,658 (34.9%) |
Occupancy by Educational Attainment in Wasco County
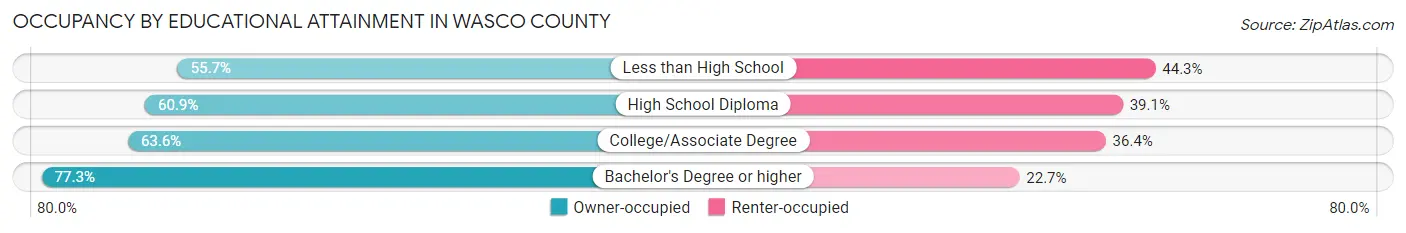
| Household Size | Owner-occupied | Renter-occupied |
| Less than High School | 716 (55.7%) | 569 (44.3%) |
| High School Diploma | 1,566 (60.9%) | 1,006 (39.1%) |
| College/Associate Degree | 2,680 (63.6%) | 1,534 (36.4%) |
| Bachelor's Degree or higher | 1,868 (77.3%) | 549 (22.7%) |
Occupancy by Age of Householder in Wasco County
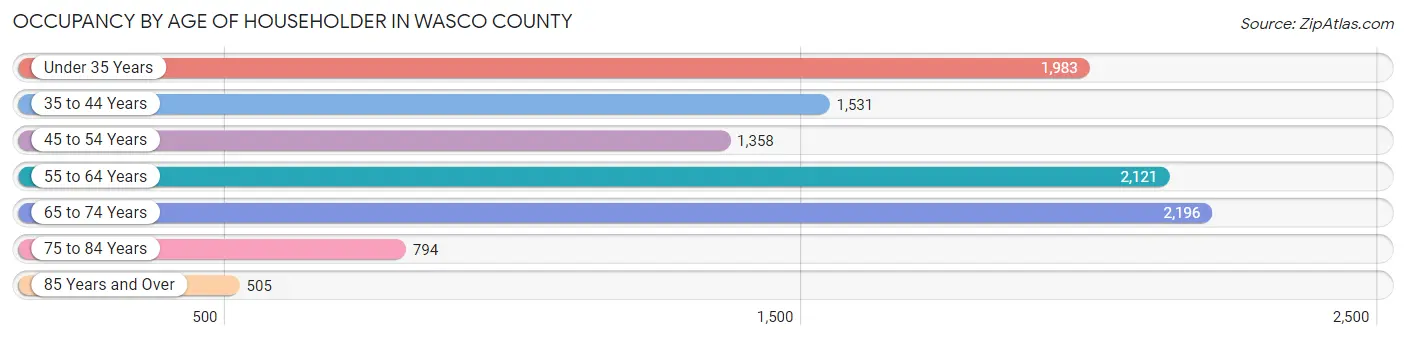
| Age Bracket | # Households | % Households |
| Under 35 Years | 1,983 | 18.9% |
| 35 to 44 Years | 1,531 | 14.6% |
| 45 to 54 Years | 1,358 | 13.0% |
| 55 to 64 Years | 2,121 | 20.2% |
| 65 to 74 Years | 2,196 | 20.9% |
| 75 to 84 Years | 794 | 7.6% |
| 85 Years and Over | 505 | 4.8% |
| Total | 10,488 | 100.0% |
Housing Finances in Wasco County
Median Income by Occupancy in Wasco County
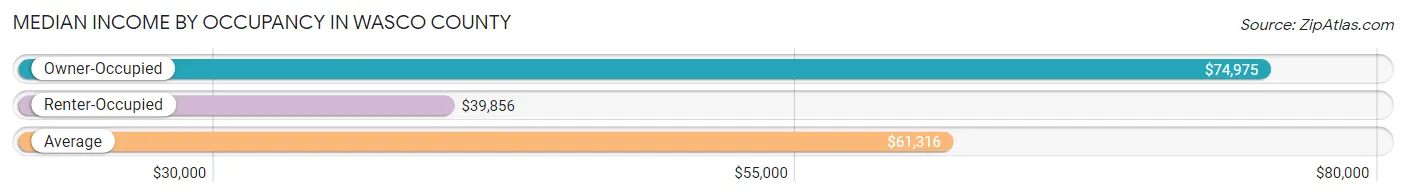
| Occupancy Type | # Households | Median Income |
| Owner-Occupied | 6,830 (65.1%) | $74,975 |
| Renter-Occupied | 3,658 (34.9%) | $39,856 |
| Average | 10,488 (100.0%) | $61,316 |
Occupancy by Householder Income Bracket in Wasco County
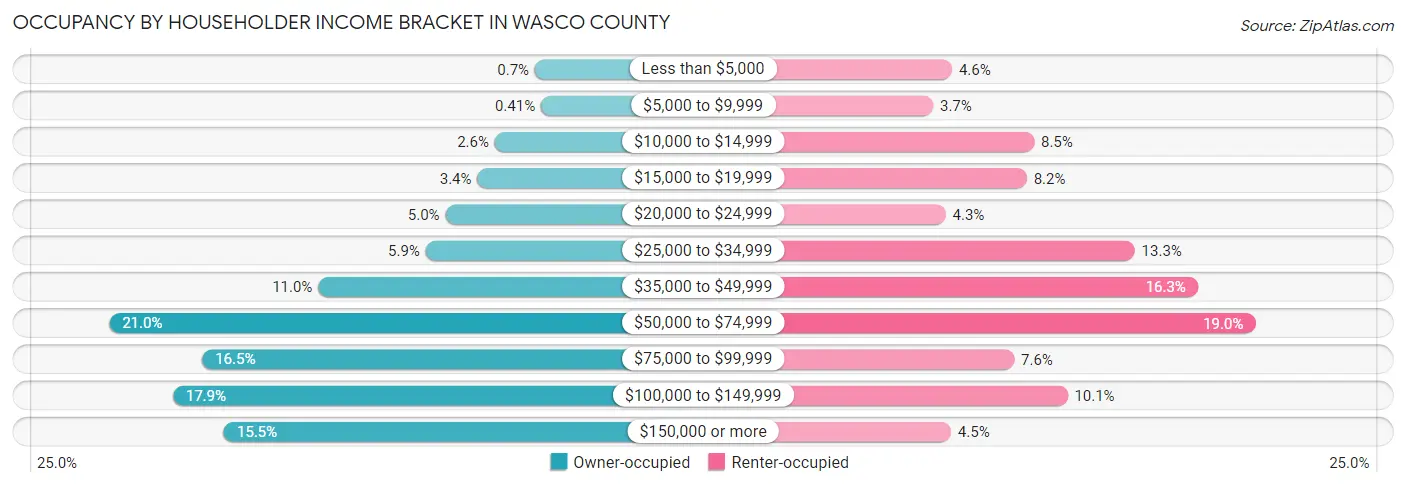
| Income Bracket | Owner-occupied | Renter-occupied |
| Less than $5,000 | 48 (0.7%) | 168 (4.6%) |
| $5,000 to $9,999 | 28 (0.4%) | 135 (3.7%) |
| $10,000 to $14,999 | 178 (2.6%) | 311 (8.5%) |
| $15,000 to $19,999 | 235 (3.4%) | 298 (8.2%) |
| $20,000 to $24,999 | 339 (5.0%) | 157 (4.3%) |
| $25,000 to $34,999 | 403 (5.9%) | 486 (13.3%) |
| $35,000 to $49,999 | 753 (11.0%) | 596 (16.3%) |
| $50,000 to $74,999 | 1,432 (21.0%) | 696 (19.0%) |
| $75,000 to $99,999 | 1,130 (16.5%) | 276 (7.5%) |
| $100,000 to $149,999 | 1,225 (17.9%) | 369 (10.1%) |
| $150,000 or more | 1,059 (15.5%) | 166 (4.5%) |
| Total | 6,830 (100.0%) | 3,658 (100.0%) |
Monthly Housing Cost Tiers in Wasco County
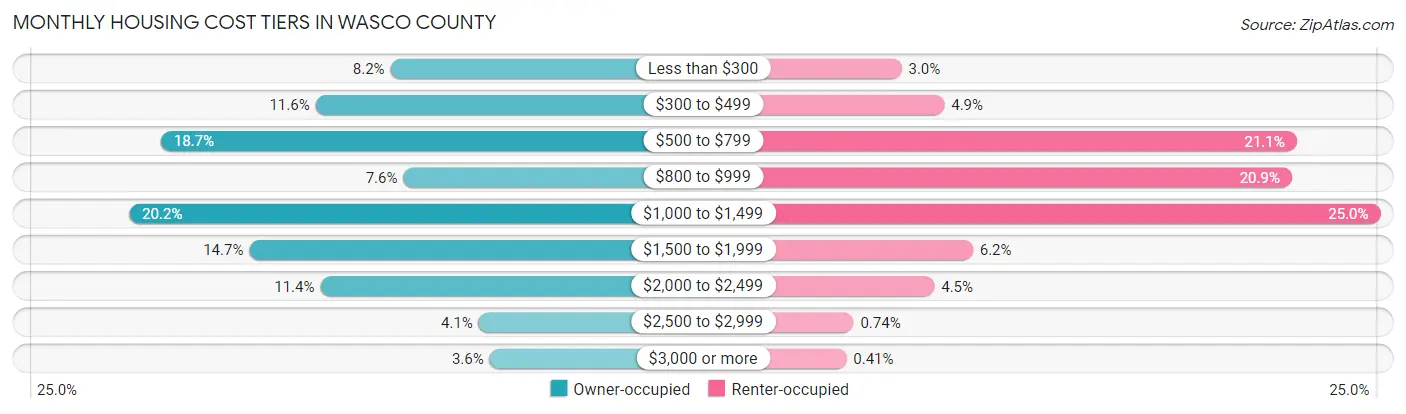
| Monthly Cost | Owner-occupied | Renter-occupied |
| Less than $300 | 557 (8.2%) | 108 (2.9%) |
| $300 to $499 | 793 (11.6%) | 180 (4.9%) |
| $500 to $799 | 1,279 (18.7%) | 773 (21.1%) |
| $800 to $999 | 517 (7.6%) | 765 (20.9%) |
| $1,000 to $1,499 | 1,379 (20.2%) | 914 (25.0%) |
| $1,500 to $1,999 | 1,001 (14.7%) | 228 (6.2%) |
| $2,000 to $2,499 | 778 (11.4%) | 163 (4.5%) |
| $2,500 to $2,999 | 280 (4.1%) | 27 (0.7%) |
| $3,000 or more | 246 (3.6%) | 15 (0.4%) |
| Total | 6,830 (100.0%) | 3,658 (100.0%) |
Physical Housing Characteristics in Wasco County
Housing Structures in Wasco County
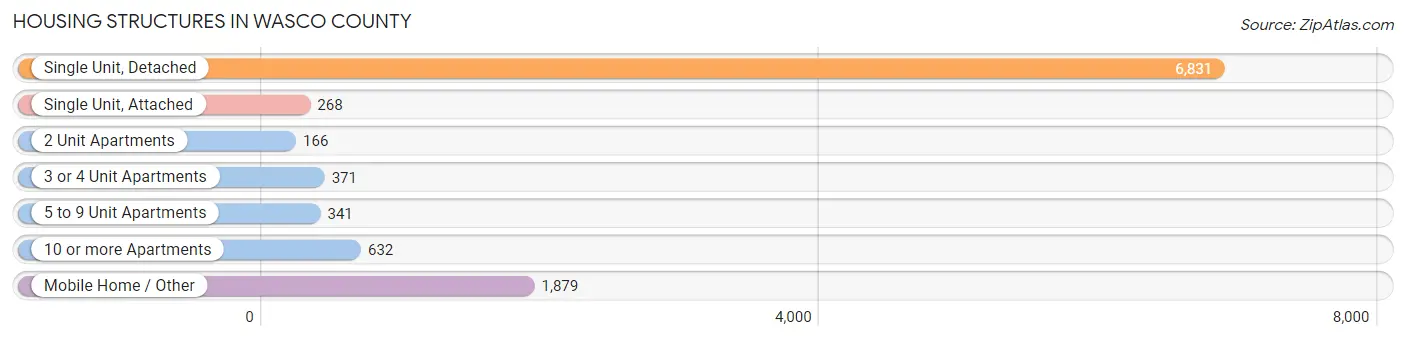
| Structure Type | # Housing Units | % Housing Units |
| Single Unit, Detached | 6,831 | 65.1% |
| Single Unit, Attached | 268 | 2.6% |
| 2 Unit Apartments | 166 | 1.6% |
| 3 or 4 Unit Apartments | 371 | 3.5% |
| 5 to 9 Unit Apartments | 341 | 3.3% |
| 10 or more Apartments | 632 | 6.0% |
| Mobile Home / Other | 1,879 | 17.9% |
| Total | 10,488 | 100.0% |
Housing Structures by Occupancy in Wasco County
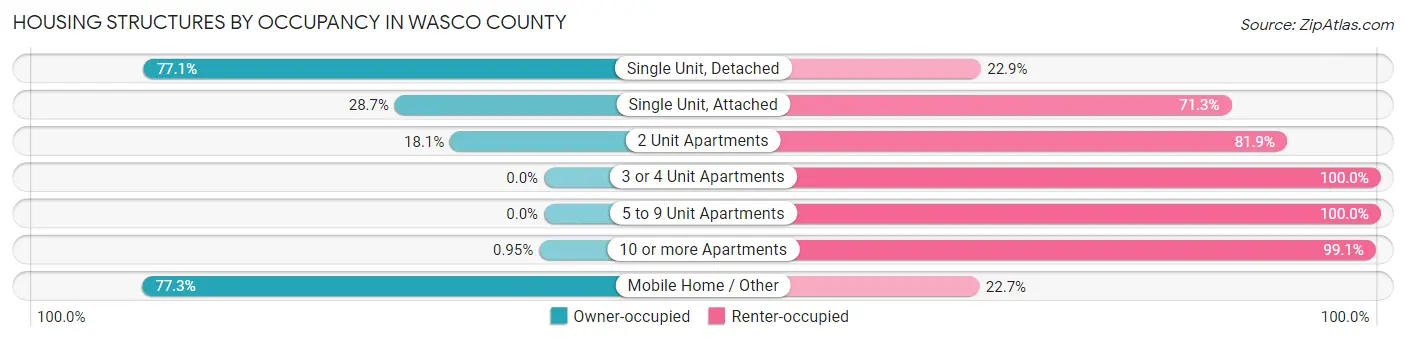
| Structure Type | Owner-occupied | Renter-occupied |
| Single Unit, Detached | 5,264 (77.1%) | 1,567 (22.9%) |
| Single Unit, Attached | 77 (28.7%) | 191 (71.3%) |
| 2 Unit Apartments | 30 (18.1%) | 136 (81.9%) |
| 3 or 4 Unit Apartments | 0 (0.0%) | 371 (100.0%) |
| 5 to 9 Unit Apartments | 0 (0.0%) | 341 (100.0%) |
| 10 or more Apartments | 6 (0.9%) | 626 (99.1%) |
| Mobile Home / Other | 1,453 (77.3%) | 426 (22.7%) |
| Total | 6,830 (65.1%) | 3,658 (34.9%) |
Housing Structures by Number of Rooms in Wasco County
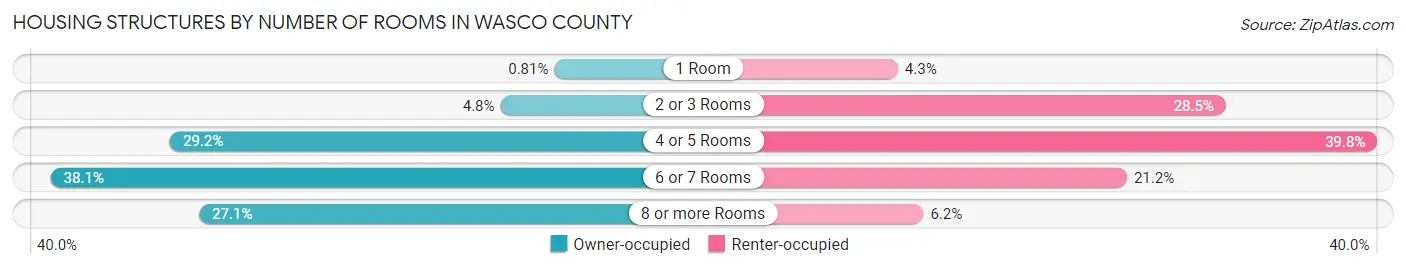
| Number of Rooms | Owner-occupied | Renter-occupied |
| 1 Room | 55 (0.8%) | 157 (4.3%) |
| 2 or 3 Rooms | 328 (4.8%) | 1,044 (28.5%) |
| 4 or 5 Rooms | 1,997 (29.2%) | 1,454 (39.8%) |
| 6 or 7 Rooms | 2,600 (38.1%) | 777 (21.2%) |
| 8 or more Rooms | 1,850 (27.1%) | 226 (6.2%) |
| Total | 6,830 (100.0%) | 3,658 (100.0%) |
Housing Structure by Heating Type in Wasco County
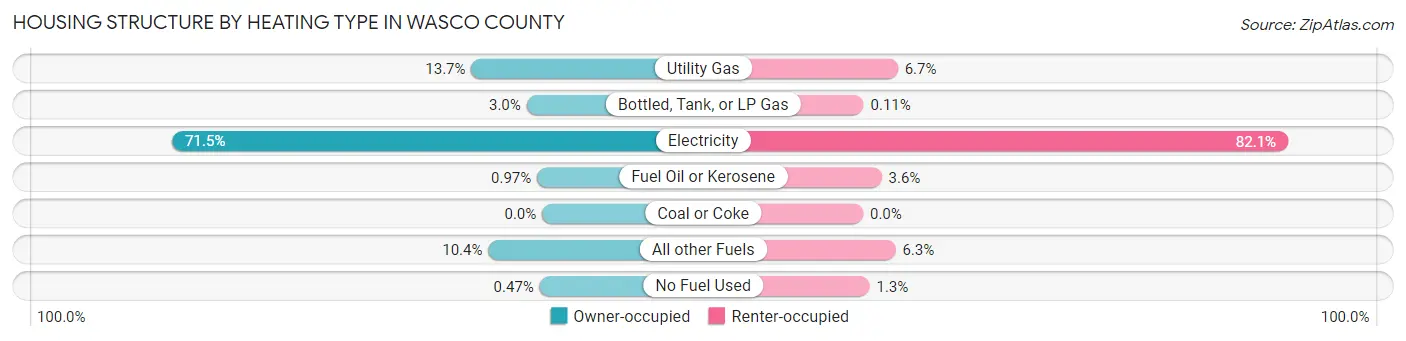
| Heating Type | Owner-occupied | Renter-occupied |
| Utility Gas | 934 (13.7%) | 245 (6.7%) |
| Bottled, Tank, or LP Gas | 204 (3.0%) | 4 (0.1%) |
| Electricity | 4,884 (71.5%) | 3,003 (82.1%) |
| Fuel Oil or Kerosene | 66 (1.0%) | 131 (3.6%) |
| Coal or Coke | 0 (0.0%) | 0 (0.0%) |
| All other Fuels | 710 (10.4%) | 229 (6.3%) |
| No Fuel Used | 32 (0.5%) | 46 (1.3%) |
| Total | 6,830 (100.0%) | 3,658 (100.0%) |
Household Vehicle Usage in Wasco County
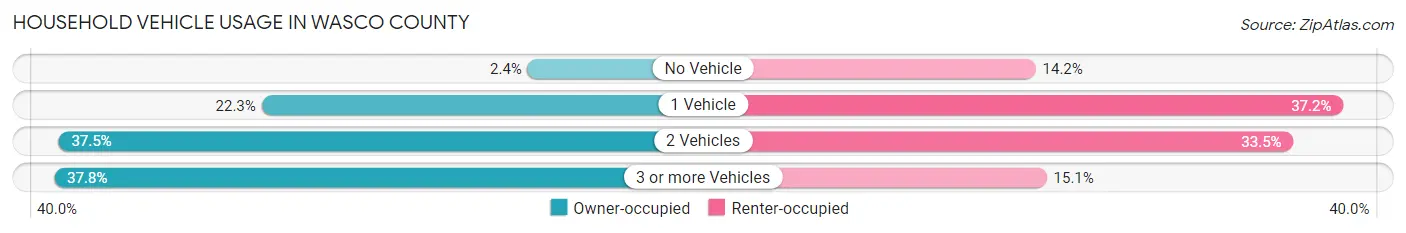
| Vehicles per Household | Owner-occupied | Renter-occupied |
| No Vehicle | 166 (2.4%) | 521 (14.2%) |
| 1 Vehicle | 1,523 (22.3%) | 1,361 (37.2%) |
| 2 Vehicles | 2,559 (37.5%) | 1,225 (33.5%) |
| 3 or more Vehicles | 2,582 (37.8%) | 551 (15.1%) |
| Total | 6,830 (100.0%) | 3,658 (100.0%) |
Real Estate & Mortgages in Wasco County
Real Estate and Mortgage Overview in Wasco County
| Characteristic | Without Mortgage | With Mortgage |
| Housing Units | 2,914 | 3,916 |
| Median Property Value | $273,500 | $315,200 |
| Median Household Income | $52,378 | $811 |
| Monthly Housing Costs | $532 | $246 |
| Real Estate Taxes | $2,512 | $142 |
Property Value by Mortgage Status in Wasco County
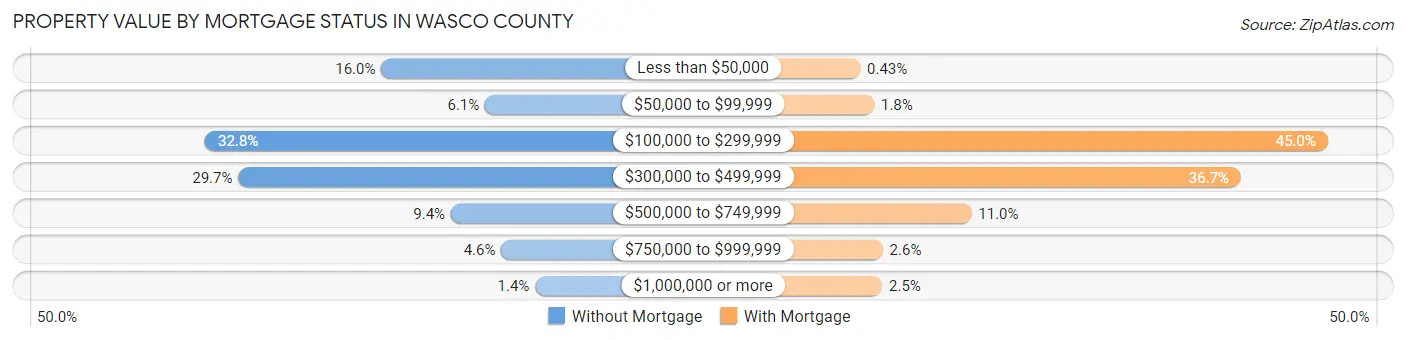
| Property Value | Without Mortgage | With Mortgage |
| Less than $50,000 | 467 (16.0%) | 17 (0.4%) |
| $50,000 to $99,999 | 179 (6.1%) | 69 (1.8%) |
| $100,000 to $299,999 | 956 (32.8%) | 1,761 (45.0%) |
| $300,000 to $499,999 | 864 (29.6%) | 1,437 (36.7%) |
| $500,000 to $749,999 | 274 (9.4%) | 432 (11.0%) |
| $750,000 to $999,999 | 134 (4.6%) | 101 (2.6%) |
| $1,000,000 or more | 40 (1.4%) | 99 (2.5%) |
| Total | 2,914 (100.0%) | 3,916 (100.0%) |
Household Income by Mortgage Status in Wasco County
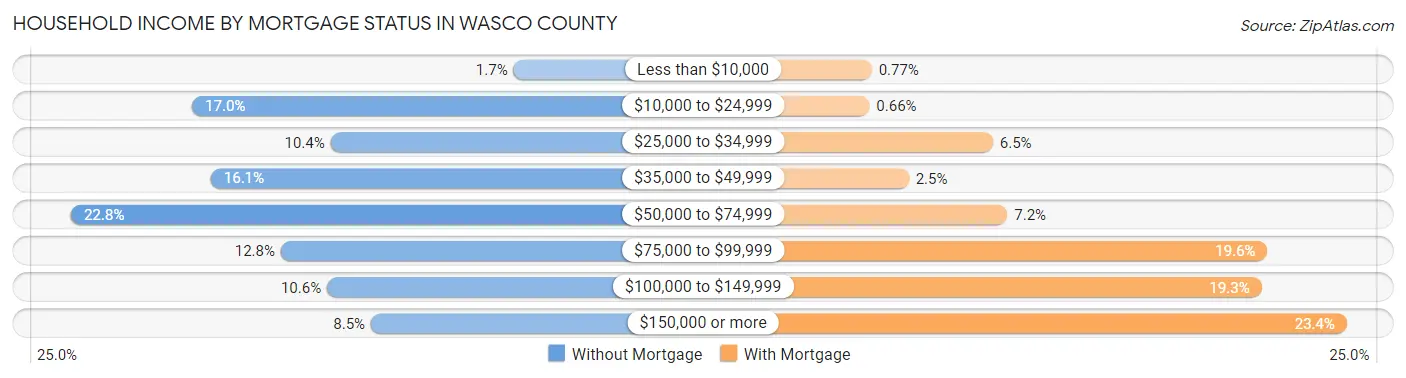
| Household Income | Without Mortgage | With Mortgage |
| Less than $10,000 | 50 (1.7%) | 30 (0.8%) |
| $10,000 to $24,999 | 496 (17.0%) | 26 (0.7%) |
| $25,000 to $34,999 | 304 (10.4%) | 256 (6.5%) |
| $35,000 to $49,999 | 470 (16.1%) | 99 (2.5%) |
| $50,000 to $74,999 | 664 (22.8%) | 283 (7.2%) |
| $75,000 to $99,999 | 373 (12.8%) | 768 (19.6%) |
| $100,000 to $149,999 | 309 (10.6%) | 757 (19.3%) |
| $150,000 or more | 248 (8.5%) | 916 (23.4%) |
| Total | 2,914 (100.0%) | 3,916 (100.0%) |
Property Value to Household Income Ratio in Wasco County
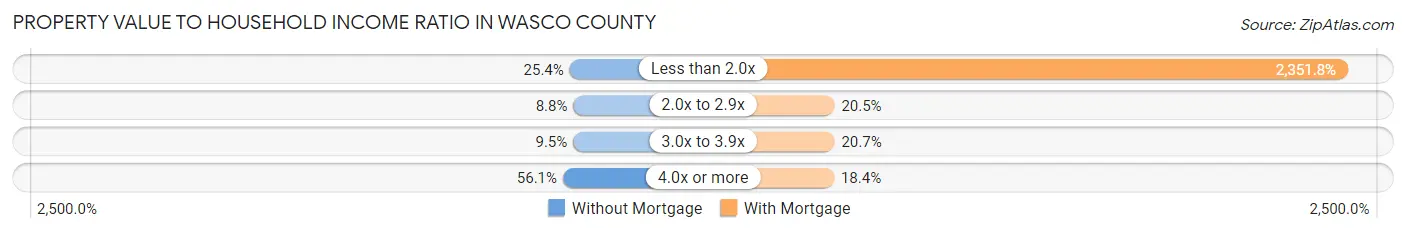
| Value-to-Income Ratio | Without Mortgage | With Mortgage |
| Less than 2.0x | 740 (25.4%) | 92,095 (2,351.8%) |
| 2.0x to 2.9x | 255 (8.7%) | 803 (20.5%) |
| 3.0x to 3.9x | 278 (9.5%) | 811 (20.7%) |
| 4.0x or more | 1,634 (56.1%) | 721 (18.4%) |
| Total | 2,914 (100.0%) | 3,916 (100.0%) |
Real Estate Taxes by Mortgage Status in Wasco County

| Property Taxes | Without Mortgage | With Mortgage |
| Less than $800 | 467 (16.0%) | 0 (0.0%) |
| $800 to $1,499 | 262 (9.0%) | 101 (2.6%) |
| $800 to $1,499 | 1,837 (63.0%) | 372 (9.5%) |
| Total | 2,914 (100.0%) | 3,916 (100.0%) |
Health & Disability in Wasco County
Health Insurance Coverage by Age in Wasco County
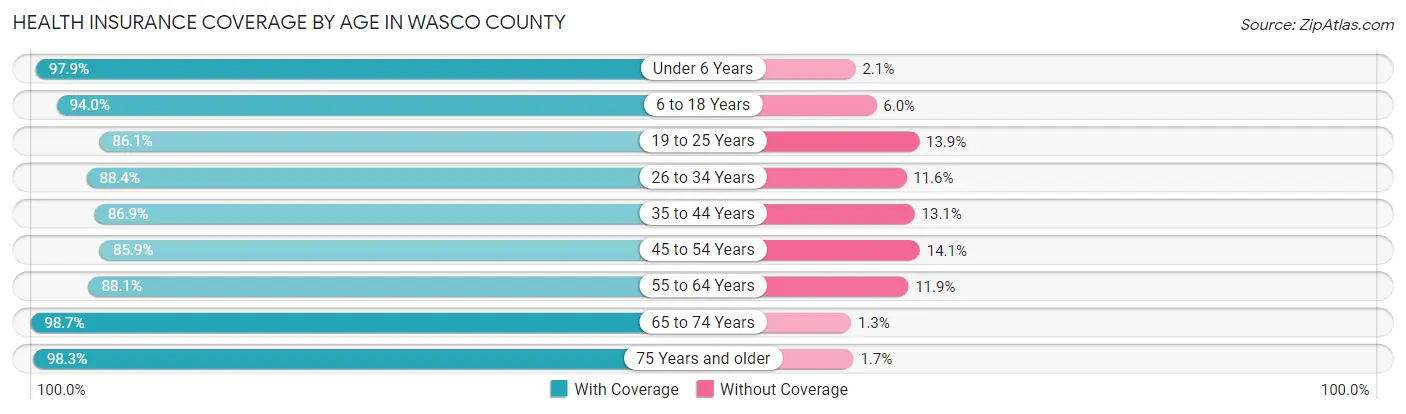
| Age Bracket | With Coverage | Without Coverage |
| Under 6 Years | 1,823 (97.9%) | 39 (2.1%) |
| 6 to 18 Years | 3,964 (94.0%) | 252 (6.0%) |
| 19 to 25 Years | 1,797 (86.1%) | 291 (13.9%) |
| 26 to 34 Years | 2,761 (88.4%) | 361 (11.6%) |
| 35 to 44 Years | 2,778 (86.9%) | 419 (13.1%) |
| 45 to 54 Years | 2,509 (85.9%) | 411 (14.1%) |
| 55 to 64 Years | 3,154 (88.1%) | 427 (11.9%) |
| 65 to 74 Years | 3,291 (98.7%) | 42 (1.3%) |
| 75 Years and older | 1,827 (98.3%) | 32 (1.7%) |
| Total | 23,904 (91.3%) | 2,274 (8.7%) |
Health Insurance Coverage by Citizenship Status in Wasco County
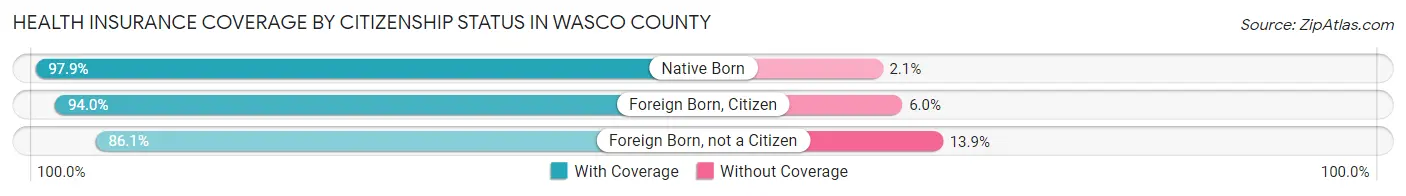
| Citizenship Status | With Coverage | Without Coverage |
| Native Born | 1,823 (97.9%) | 39 (2.1%) |
| Foreign Born, Citizen | 3,964 (94.0%) | 252 (6.0%) |
| Foreign Born, not a Citizen | 1,797 (86.1%) | 291 (13.9%) |
Health Insurance Coverage by Household Income in Wasco County
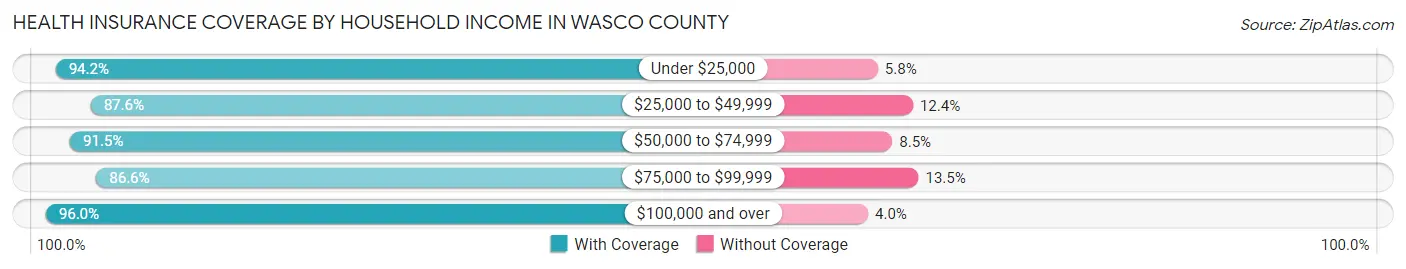
| Household Income | With Coverage | Without Coverage |
| Under $25,000 | 2,392 (94.2%) | 148 (5.8%) |
| $25,000 to $49,999 | 4,049 (87.6%) | 573 (12.4%) |
| $50,000 to $74,999 | 4,710 (91.5%) | 439 (8.5%) |
| $75,000 to $99,999 | 3,623 (86.6%) | 563 (13.5%) |
| $100,000 and over | 8,432 (96.0%) | 350 (4.0%) |
Public vs Private Health Insurance Coverage by Age in Wasco County
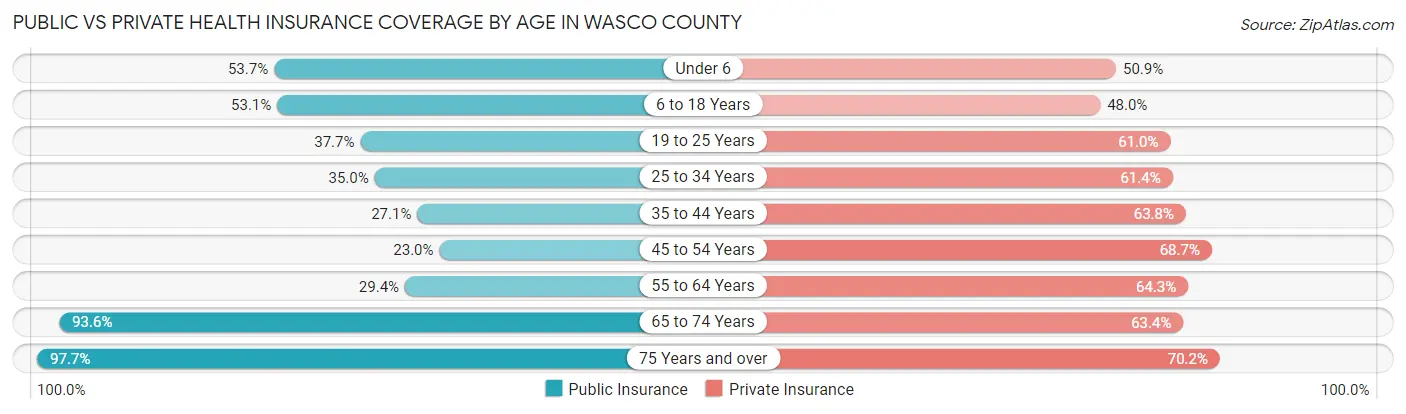
| Age Bracket | Public Insurance | Private Insurance |
| Under 6 | 1,000 (53.7%) | 948 (50.9%) |
| 6 to 18 Years | 2,240 (53.1%) | 2,022 (48.0%) |
| 19 to 25 Years | 787 (37.7%) | 1,273 (61.0%) |
| 25 to 34 Years | 1,094 (35.0%) | 1,916 (61.4%) |
| 35 to 44 Years | 867 (27.1%) | 2,041 (63.8%) |
| 45 to 54 Years | 672 (23.0%) | 2,005 (68.7%) |
| 55 to 64 Years | 1,053 (29.4%) | 2,301 (64.3%) |
| 65 to 74 Years | 3,120 (93.6%) | 2,112 (63.4%) |
| 75 Years and over | 1,816 (97.7%) | 1,304 (70.2%) |
| Total | 12,649 (48.3%) | 15,922 (60.8%) |
Disability Status by Sex by Age in Wasco County
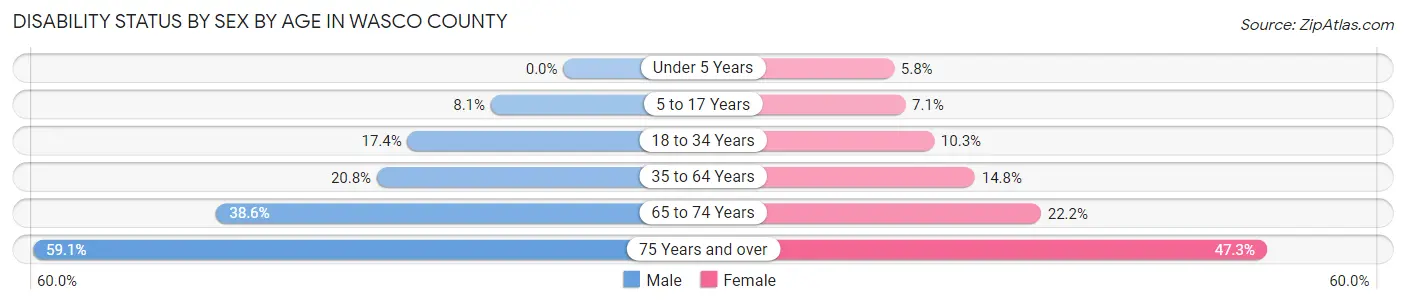
| Age Bracket | Male | Female |
| Under 5 Years | 0 (0.0%) | 32 (5.8%) |
| 5 to 17 Years | 185 (8.1%) | 142 (7.0%) |
| 18 to 34 Years | 488 (17.3%) | 276 (10.3%) |
| 35 to 64 Years | 1,004 (20.8%) | 720 (14.8%) |
| 65 to 74 Years | 646 (38.6%) | 368 (22.2%) |
| 75 Years and over | 489 (59.1%) | 488 (47.3%) |
Disability Class by Sex by Age in Wasco County
Disability Class: Hearing Difficulty
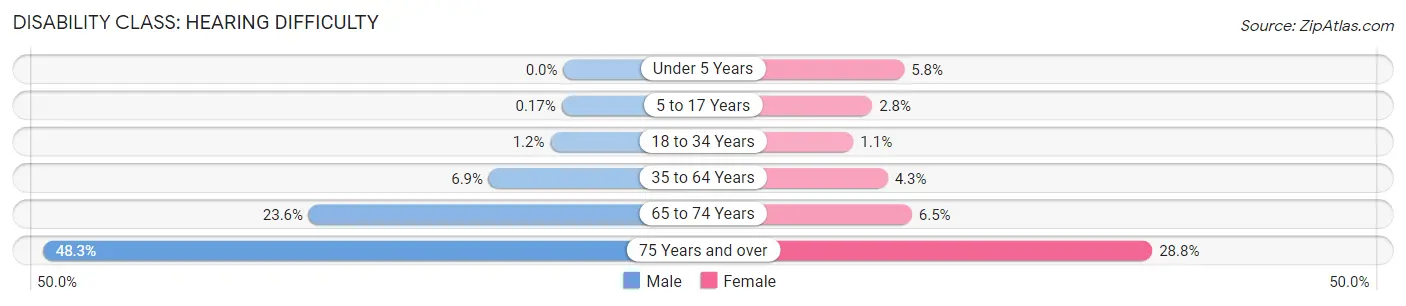
| Age Bracket | Male | Female |
| Under 5 Years | 0 (0.0%) | 32 (5.8%) |
| 5 to 17 Years | 4 (0.2%) | 57 (2.8%) |
| 18 to 34 Years | 34 (1.2%) | 29 (1.1%) |
| 35 to 64 Years | 334 (6.9%) | 207 (4.3%) |
| 65 to 74 Years | 395 (23.6%) | 108 (6.5%) |
| 75 Years and over | 400 (48.3%) | 297 (28.8%) |
Disability Class: Vision Difficulty
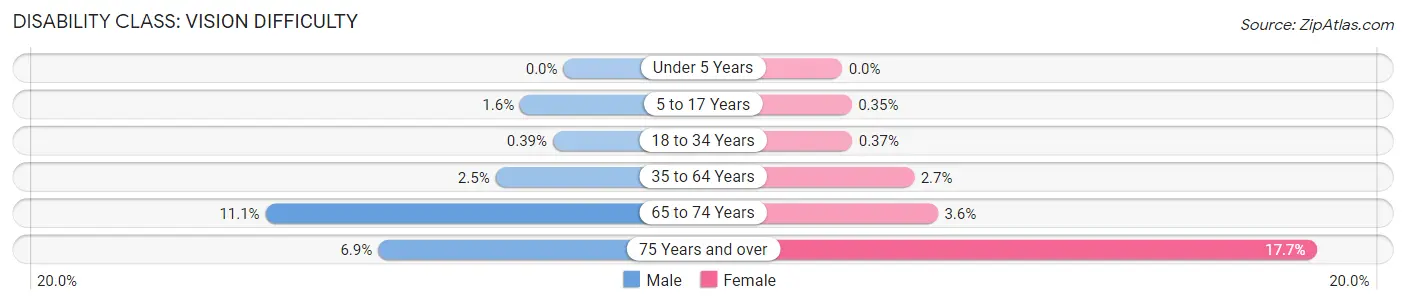
| Age Bracket | Male | Female |
| Under 5 Years | 0 (0.0%) | 0 (0.0%) |
| 5 to 17 Years | 37 (1.6%) | 7 (0.4%) |
| 18 to 34 Years | 11 (0.4%) | 10 (0.4%) |
| 35 to 64 Years | 122 (2.5%) | 130 (2.7%) |
| 65 to 74 Years | 185 (11.1%) | 59 (3.5%) |
| 75 Years and over | 57 (6.9%) | 182 (17.6%) |
Disability Class: Cognitive Difficulty
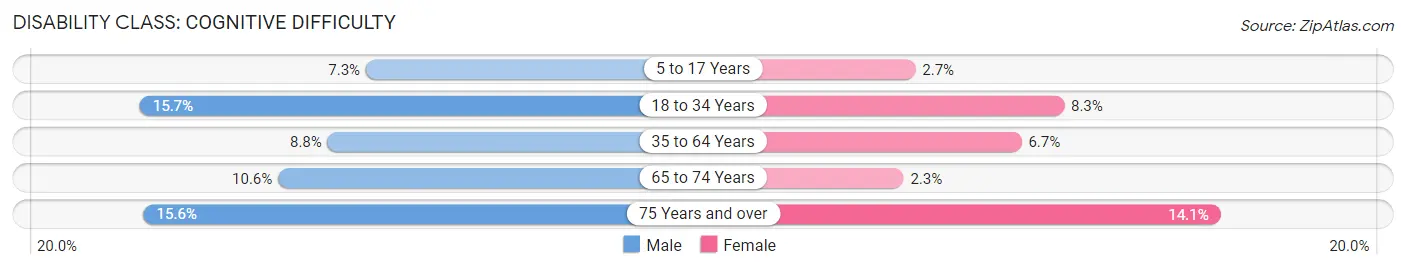
| Age Bracket | Male | Female |
| 5 to 17 Years | 168 (7.3%) | 55 (2.7%) |
| 18 to 34 Years | 442 (15.7%) | 222 (8.3%) |
| 35 to 64 Years | 423 (8.7%) | 324 (6.7%) |
| 65 to 74 Years | 177 (10.6%) | 38 (2.3%) |
| 75 Years and over | 129 (15.6%) | 145 (14.1%) |
Disability Class: Ambulatory Difficulty
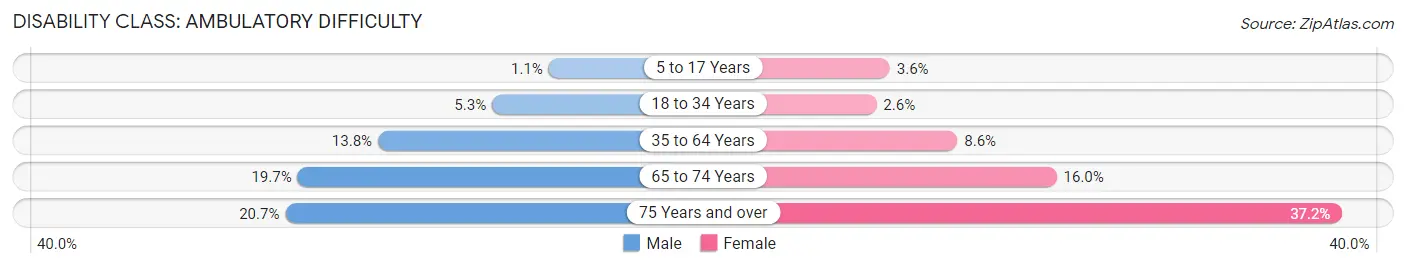
| Age Bracket | Male | Female |
| 5 to 17 Years | 25 (1.1%) | 72 (3.6%) |
| 18 to 34 Years | 149 (5.3%) | 69 (2.6%) |
| 35 to 64 Years | 666 (13.8%) | 417 (8.6%) |
| 65 to 74 Years | 330 (19.7%) | 265 (16.0%) |
| 75 Years and over | 171 (20.6%) | 383 (37.1%) |
Disability Class: Self-Care Difficulty
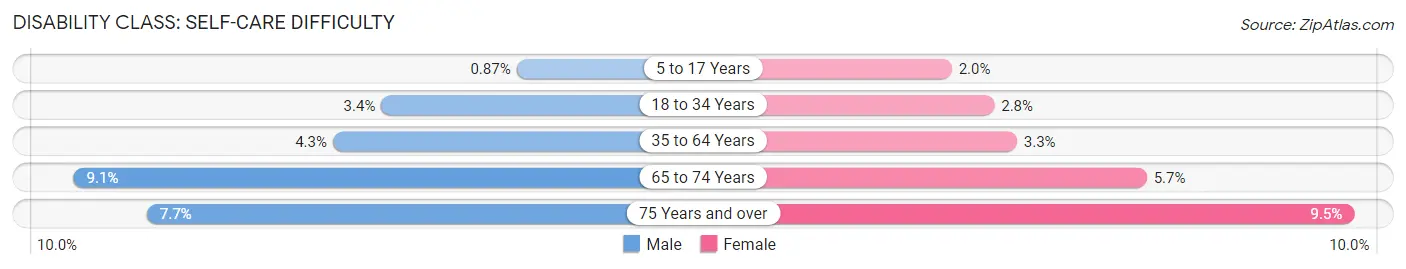
| Age Bracket | Male | Female |
| 5 to 17 Years | 20 (0.9%) | 41 (2.0%) |
| 18 to 34 Years | 95 (3.4%) | 76 (2.8%) |
| 35 to 64 Years | 207 (4.3%) | 158 (3.3%) |
| 65 to 74 Years | 152 (9.1%) | 94 (5.7%) |
| 75 Years and over | 64 (7.7%) | 98 (9.5%) |
Technology Access in Wasco County
Computing Device Access in Wasco County
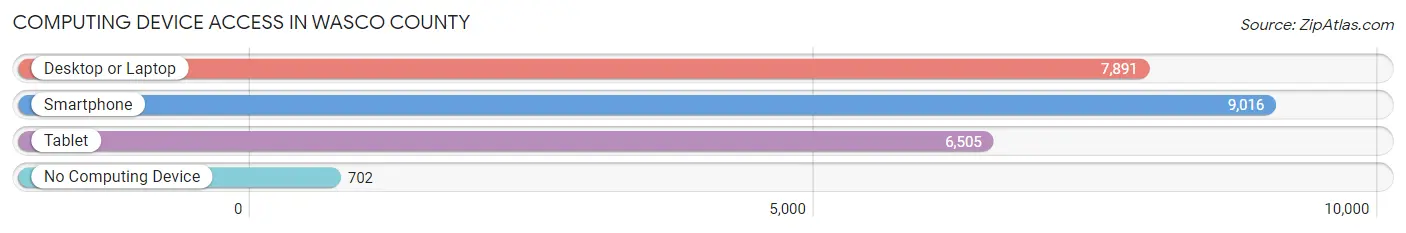
| Device Type | # Households | % Households |
| Desktop or Laptop | 7,891 | 75.2% |
| Smartphone | 9,016 | 86.0% |
| Tablet | 6,505 | 62.0% |
| No Computing Device | 702 | 6.7% |
| Total | 10,488 | 100.0% |
Internet Access in Wasco County
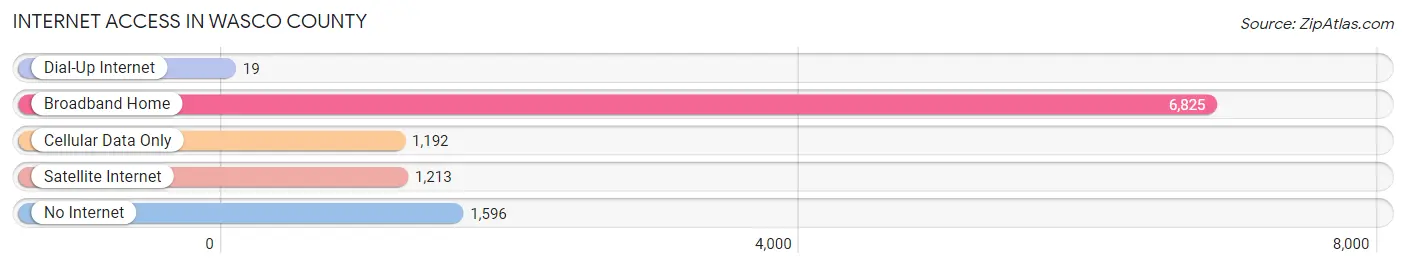
| Internet Type | # Households | % Households |
| Dial-Up Internet | 19 | 0.2% |
| Broadband Home | 6,825 | 65.1% |
| Cellular Data Only | 1,192 | 11.4% |
| Satellite Internet | 1,213 | 11.6% |
| No Internet | 1,596 | 15.2% |
| Total | 10,488 | 100.0% |
Wasco County Summary
Wasco County is located in the north-central region of Oregon, and is bordered by Hood River County to the north, Sherman County to the east, Gilliam County to the south, and Klickitat County, Washington to the west. The county seat is The Dalles, and the largest city is The Dalles. Wasco County covers an area of 2,395 square miles, and has a population of 25,213 as of the 2010 census.
History
The area that is now Wasco County was originally inhabited by the Wasco-Wishram people, a Native American tribe of the Chinookan language family. The first Europeans to explore the area were members of the Lewis and Clark Expedition, who arrived in 1805. The area was part of the Oregon Territory until 1854, when it became part of the newly created Washington Territory. In 1859, Wasco County was created from the western part of the Washington Territory, and was named after the Wasco-Wishram people.
The county was initially sparsely populated, but the discovery of gold in the area in the 1860s led to an influx of miners and settlers. The county seat was established in The Dalles in 1864, and the city quickly became the largest in the county. The county continued to grow throughout the late 19th and early 20th centuries, and by the 1950s, the population had reached its peak of over 30,000.
Geography
Wasco County is located in the north-central region of Oregon, and is bordered by Hood River County to the north, Sherman County to the east, Gilliam County to the south, and Klickitat County, Washington to the west. The county covers an area of 2,395 square miles, and is located in the Columbia River Gorge. The terrain is mostly mountainous, with the Cascade Range to the west and the Columbia River to the east. The highest point in the county is Mount Hood, which rises to an elevation of 11,249 feet.
The county is home to several rivers, including the Deschutes, John Day, and Columbia Rivers. The Deschutes River flows through the county from north to south, and is the largest river in the county. The John Day River flows through the eastern part of the county, and the Columbia River forms the western border of the county.
Economy
The economy of Wasco County is largely based on agriculture and tourism. The county is home to several wineries, and is known for its production of apples, pears, cherries, and other fruits. The county is also home to several cattle ranches, and is a major producer of hay and other forage crops.
Tourism is also an important part of the economy, with the Columbia River Gorge National Scenic Area being a major draw for visitors. The county is also home to several state parks, including The Dalles Dam State Park, Deschutes State Recreation Area, and John Day Fossil Beds National Monument.
Demographics
As of the 2010 census, Wasco County had a population of 25,213. The racial makeup of the county was 87.3% White, 0.7% African American, 1.2% Native American, 0.7% Asian, 0.1% Pacific Islander, 8.2% from other races, and 1.9% from two or more races. Hispanic or Latino of any race were 16.2% of the population.
The median income for a household in the county was $41,945, and the median income for a family was $50,945. The per capita income for the county was $20,945. About 13.2% of the population was below the poverty line.
Common Questions
What is the Total Population of Wasco County?
Total Population of Wasco County is 26,639.
What is the Total Male Population of Wasco County?
Total Male Population of Wasco County is 13,645.
What is the Total Female Population of Wasco County?
Total Female Population of Wasco County is 12,994.
What is the Ratio of Males per 100 Females in Wasco County?
There are 105.01 Males per 100 Females in Wasco County.
What is the Ratio of Females per 100 Males in Wasco County?
There are 95.23 Females per 100 Males in Wasco County.
What is the Median Population Age in Wasco County?
Median Population Age in Wasco County is 40.4 Years.
What is the Average Family Size in Wasco County
Average Family Size in Wasco County is 3.0 People.
What is the Average Household Size in Wasco County
Average Household Size in Wasco County is 2.4 People.
What is Per Capita Income in Wasco County?
Per Capita income in Wasco County is $35,869.
What is the Median Family Income in Wasco County?
Median Family Income in Wasco County is $78,408.
What is the Median Household income in Wasco County?
Median Household Income in Wasco County is $61,316.
What is Income or Wage Gap in Wasco County?
Income or Wage Gap in Wasco County is 36.5%.
Women in Wasco County earn 63.5 cents for every dollar earned by a man.
What is Family Income Deficit in Wasco County?
Family Income Deficit in Wasco County is $7,461.
Families that are below poverty line in Wasco County earn $7,461 less on average than the poverty threshold level.
What is Inequality or Gini Index in Wasco County?
Inequality or Gini Index in Wasco County is 0.48.
How Large is the Labor Force in Wasco County?
There are 12,817 People in the Labor Forcein in Wasco County.
What is the Percentage of People in the Labor Force in Wasco County?
59.7% of People are in the Labor Force in Wasco County.
What is the Unemployment Rate in Wasco County?
Unemployment Rate in Wasco County is 7.1%.