Wallowa County, OR
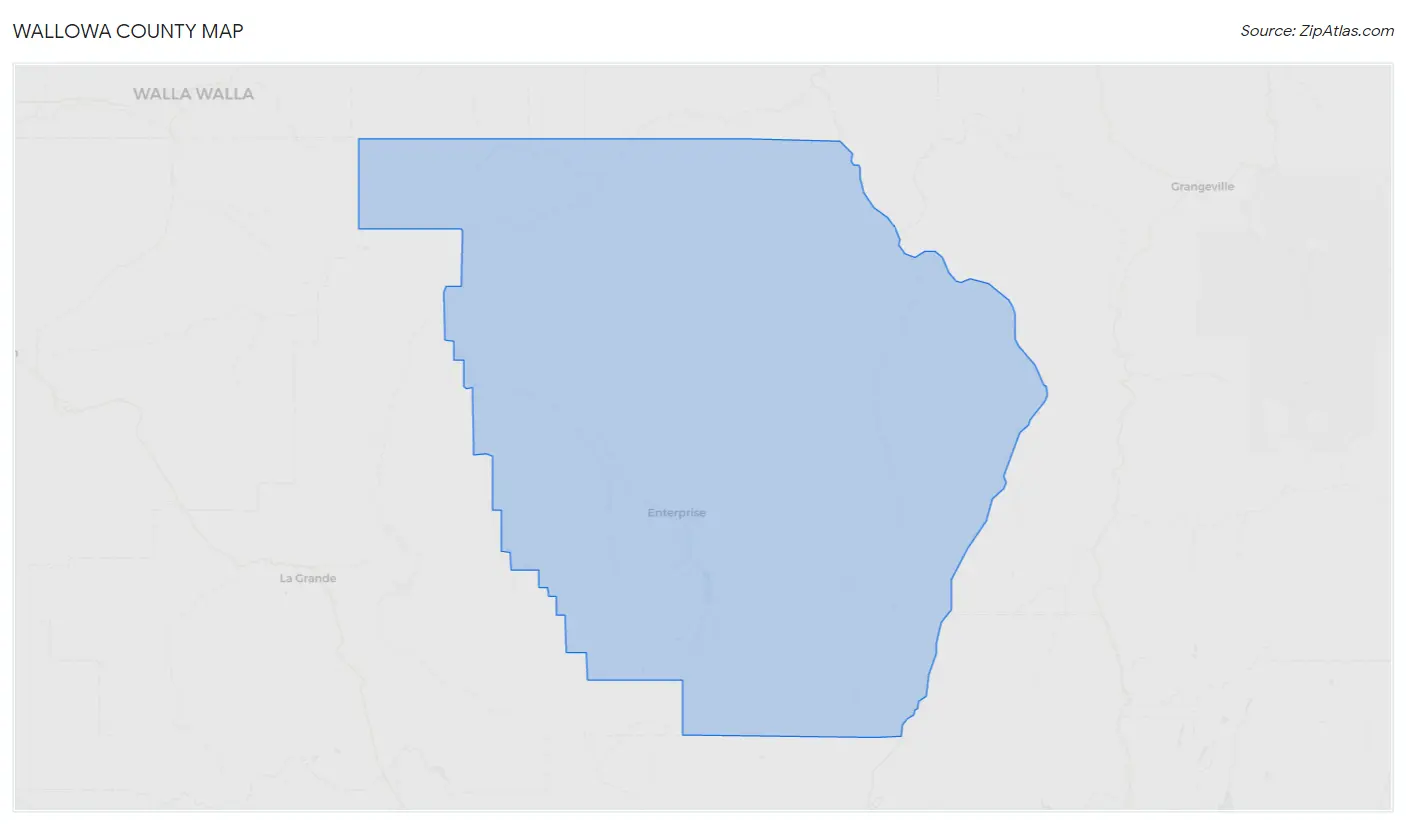
Wallowa County Map
Wallowa County Overview
7,439
TOTAL POPULATION
3,673
MALE POPULATION
3,766
FEMALE POPULATION
97.53
MALES / 100 FEMALES
102.53
FEMALES / 100 MALES
50.9
MEDIAN AGE
2.8
AVG FAMILY SIZE
2.2
AVG HOUSEHOLD SIZE
$37,378
PER CAPITA INCOME
$76,023
AVG FAMILY INCOME
$62,238
AVG HOUSEHOLD INCOME
24.5%
WAGE / INCOME GAP [ % ]
75.5¢/ $1
WAGE / INCOME GAP [ $ ]
0.46
INEQUALITY / GINI INDEX
3,504
LABOR FORCE [ PEOPLE ]
57.1%
PERCENT IN LABOR FORCE
6.0%
UNEMPLOYMENT RATE
Wallowa County Area Codes
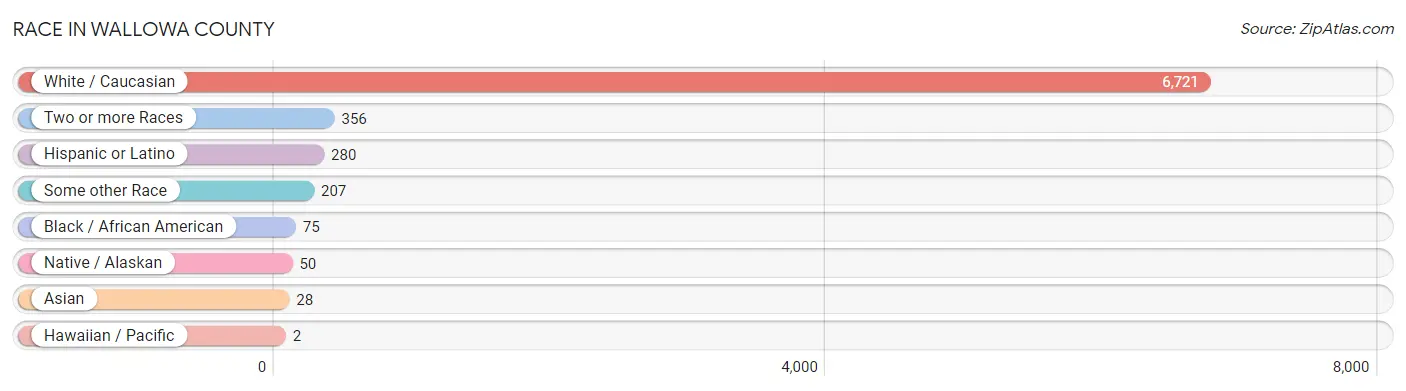
Race in Wallowa County
The most populous races in Wallowa County are White / Caucasian (6,721 | 90.3%), Two or more Races (356 | 4.8%), and Hispanic or Latino (280 | 3.8%).
| Race | # Population | % Population |
| Asian | 28 | 0.4% |
| Black / African American | 75 | 1.0% |
| Hawaiian / Pacific | 2 | 0.0% |
| Hispanic or Latino | 280 | 3.8% |
| Native / Alaskan | 50 | 0.7% |
| White / Caucasian | 6,721 | 90.3% |
| Two or more Races | 356 | 4.8% |
| Some other Race | 207 | 2.8% |
| Total | 7,439 | 100.0% |
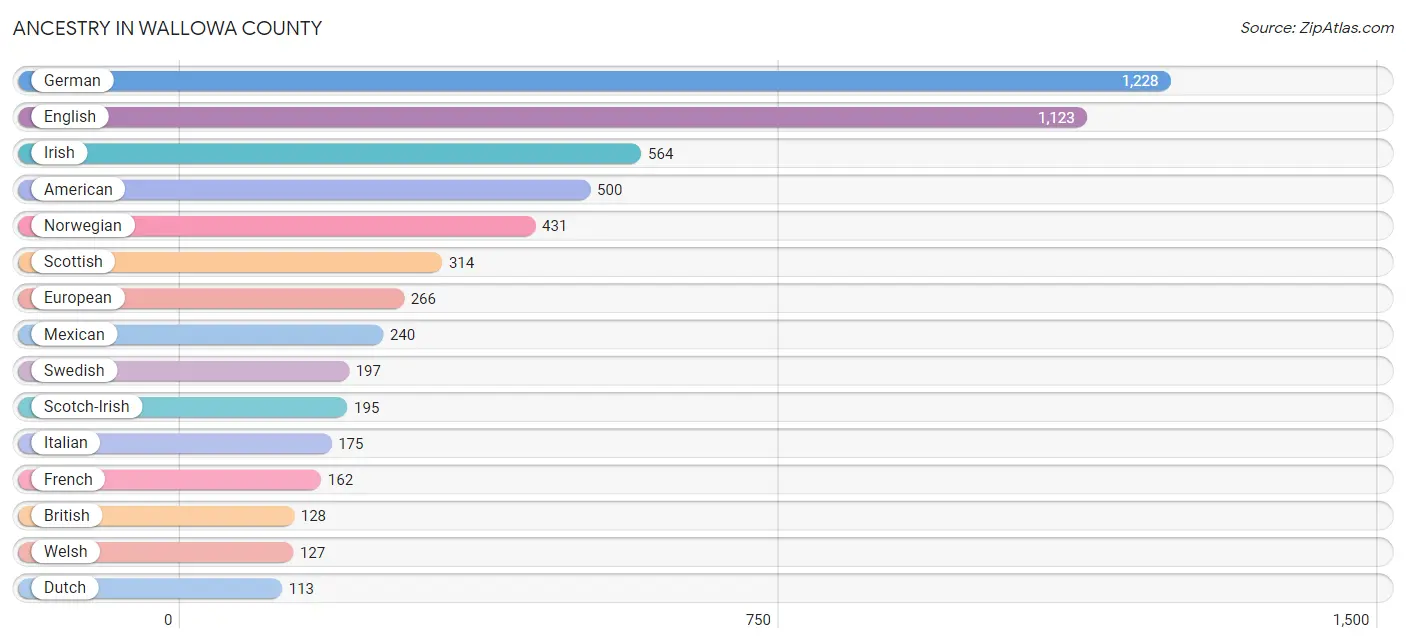
Ancestry in Wallowa County
The most populous ancestries reported in Wallowa County are German (1,228 | 16.5%), English (1,123 | 15.1%), Irish (564 | 7.6%), American (500 | 6.7%), and Norwegian (431 | 5.8%), together accounting for 51.7% of all Wallowa County residents.
| Ancestry | # Population | % Population |
| American | 500 | 6.7% |
| Austrian | 5 | 0.1% |
| Belgian | 6 | 0.1% |
| Blackfeet | 4 | 0.1% |
| British | 128 | 1.7% |
| Burmese | 12 | 0.2% |
| Celtic | 9 | 0.1% |
| Central American | 4 | 0.1% |
| Chippewa | 14 | 0.2% |
| Cuban | 18 | 0.2% |
| Czech | 36 | 0.5% |
| Czechoslovakian | 15 | 0.2% |
| Danish | 81 | 1.1% |
| Dutch | 113 | 1.5% |
| Eastern European | 49 | 0.7% |
| English | 1,123 | 15.1% |
| European | 266 | 3.6% |
| Finnish | 32 | 0.4% |
| French | 162 | 2.2% |
| French Canadian | 7 | 0.1% |
| German | 1,228 | 16.5% |
| Greek | 23 | 0.3% |
| Guamanian / Chamorro | 2 | 0.0% |
| Hmong | 7 | 0.1% |
| Honduran | 4 | 0.1% |
| Hungarian | 15 | 0.2% |
| Indian (Asian) | 25 | 0.3% |
| Irish | 564 | 7.6% |
| Italian | 175 | 2.4% |
| Korean | 4 | 0.1% |
| Laotian | 8 | 0.1% |
| Mexican | 240 | 3.2% |
| Native Hawaiian | 7 | 0.1% |
| Nigerian | 5 | 0.1% |
| Northern European | 30 | 0.4% |
| Norwegian | 431 | 5.8% |
| Pakistani | 5 | 0.1% |
| Polish | 22 | 0.3% |
| Portuguese | 12 | 0.2% |
| Potawatomi | 11 | 0.2% |
| Puerto Rican | 11 | 0.2% |
| Russian | 33 | 0.4% |
| Scandinavian | 47 | 0.6% |
| Scotch-Irish | 195 | 2.6% |
| Scottish | 314 | 4.2% |
| Sioux | 5 | 0.1% |
| Slavic | 27 | 0.4% |
| Slovak | 15 | 0.2% |
| Slovene | 6 | 0.1% |
| Spaniard | 7 | 0.1% |
| Subsaharan African | 5 | 0.1% |
| Swedish | 197 | 2.6% |
| Swiss | 47 | 0.6% |
| Ukrainian | 2 | 0.0% |
| Welsh | 127 | 1.7% |
| Yakama | 3 | 0.0% |
| Yugoslavian | 7 | 0.1% | View All 57 Rows |
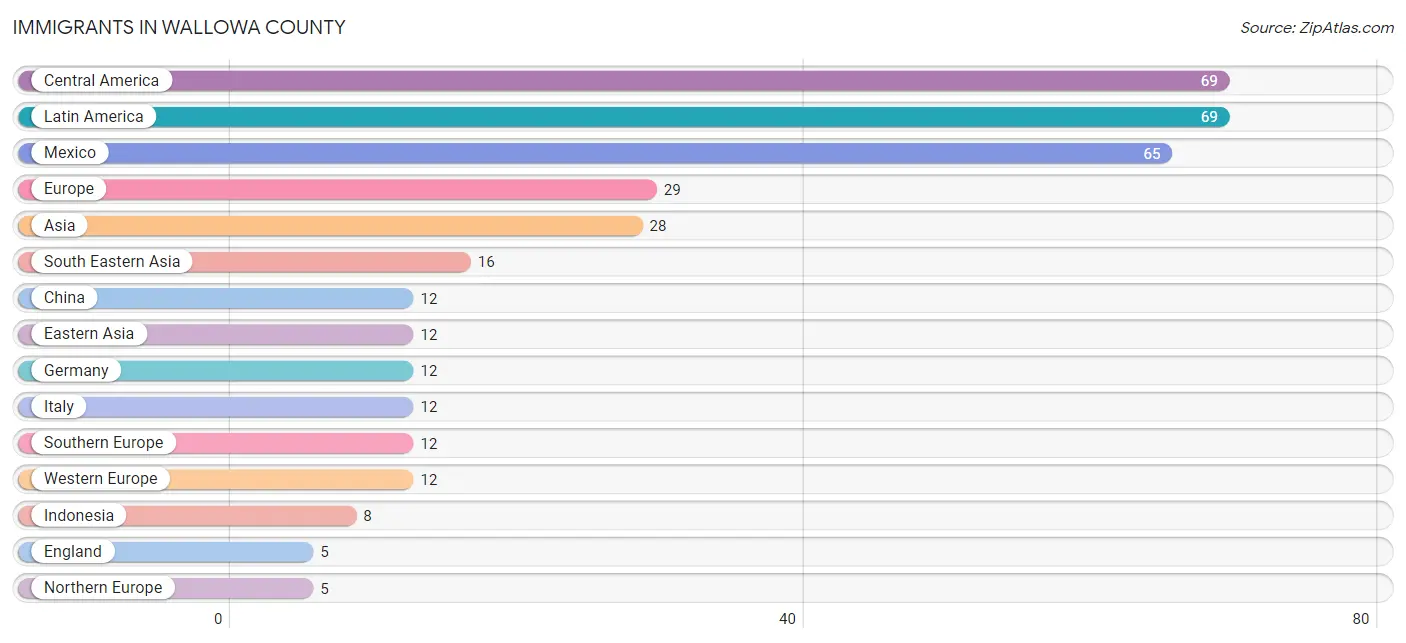
Immigrants in Wallowa County
The most numerous immigrant groups reported in Wallowa County came from Central America (69 | 0.9%), Latin America (69 | 0.9%), Mexico (65 | 0.9%), Europe (29 | 0.4%), and Asia (28 | 0.4%), together accounting for 3.5% of all Wallowa County residents.
| Immigration Origin | # Population | % Population |
| Asia | 28 | 0.4% |
| Central America | 69 | 0.9% |
| China | 12 | 0.2% |
| Eastern Asia | 12 | 0.2% |
| England | 5 | 0.1% |
| Europe | 29 | 0.4% |
| Germany | 12 | 0.2% |
| Honduras | 4 | 0.1% |
| Indonesia | 8 | 0.1% |
| Italy | 12 | 0.2% |
| Latin America | 69 | 0.9% |
| Mexico | 65 | 0.9% |
| Northern Europe | 5 | 0.1% |
| Philippines | 4 | 0.1% |
| South Eastern Asia | 16 | 0.2% |
| Southern Europe | 12 | 0.2% |
| Thailand | 4 | 0.1% |
| Western Europe | 12 | 0.2% | View All 18 Rows |
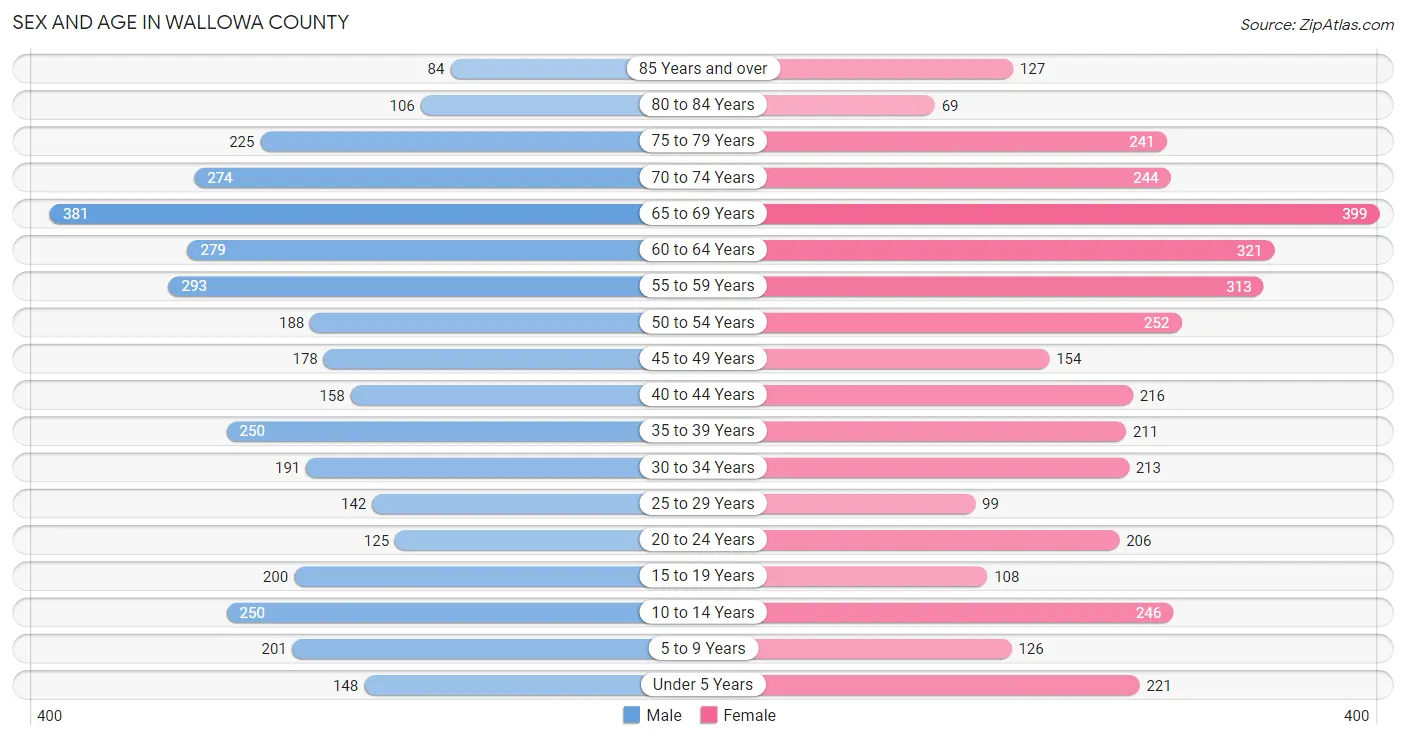
Sex and Age in Wallowa County
Sex and Age in Wallowa County
The most populous age groups in Wallowa County are 65 to 69 Years (381 | 10.4%) for men and 65 to 69 Years (399 | 10.6%) for women.
| Age Bracket | Male | Female |
| Under 5 Years | 148 (4.0%) | 221 (5.9%) |
| 5 to 9 Years | 201 (5.5%) | 126 (3.4%) |
| 10 to 14 Years | 250 (6.8%) | 246 (6.5%) |
| 15 to 19 Years | 200 (5.4%) | 108 (2.9%) |
| 20 to 24 Years | 125 (3.4%) | 206 (5.5%) |
| 25 to 29 Years | 142 (3.9%) | 99 (2.6%) |
| 30 to 34 Years | 191 (5.2%) | 213 (5.7%) |
| 35 to 39 Years | 250 (6.8%) | 211 (5.6%) |
| 40 to 44 Years | 158 (4.3%) | 216 (5.7%) |
| 45 to 49 Years | 178 (4.9%) | 154 (4.1%) |
| 50 to 54 Years | 188 (5.1%) | 252 (6.7%) |
| 55 to 59 Years | 293 (8.0%) | 313 (8.3%) |
| 60 to 64 Years | 279 (7.6%) | 321 (8.5%) |
| 65 to 69 Years | 381 (10.4%) | 399 (10.6%) |
| 70 to 74 Years | 274 (7.5%) | 244 (6.5%) |
| 75 to 79 Years | 225 (6.1%) | 241 (6.4%) |
| 80 to 84 Years | 106 (2.9%) | 69 (1.8%) |
| 85 Years and over | 84 (2.3%) | 127 (3.4%) |
| Total | 3,673 (100.0%) | 3,766 (100.0%) |
Families and Households in Wallowa County
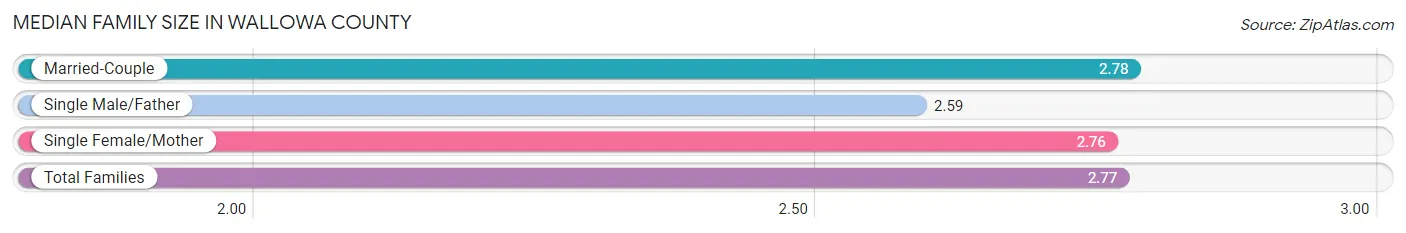
Median Family Size in Wallowa County
The median family size in Wallowa County is 2.77 persons per family, with married-couple families (1,791 | 85.9%) accounting for the largest median family size of 2.78 persons per family. On the other hand, single male/father families (83 | 4.0%) represent the smallest median family size with 2.59 persons per family.
| Family Type | # Families | Family Size |
| Married-Couple | 1,791 (85.9%) | 2.78 |
| Single Male/Father | 83 (4.0%) | 2.59 |
| Single Female/Mother | 210 (10.1%) | 2.76 |
| Total Families | 2,084 (100.0%) | 2.77 |
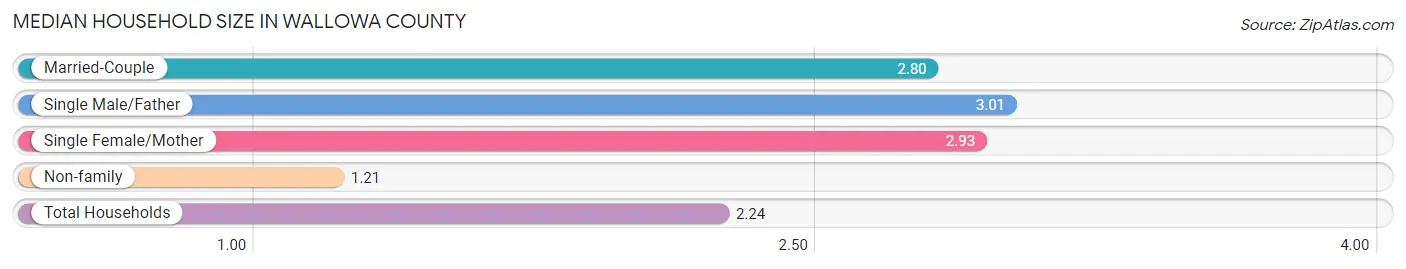
Median Household Size in Wallowa County
The median household size in Wallowa County is 2.24 persons per household, with single male/father households (83 | 2.5%) accounting for the largest median household size of 3.01 persons per household. non-family households (1,187 | 36.3%) represent the smallest median household size with 1.21 persons per household.
| Household Type | # Households | Household Size |
| Married-Couple | 1,791 (54.7%) | 2.80 |
| Single Male/Father | 83 (2.5%) | 3.01 |
| Single Female/Mother | 210 (6.4%) | 2.93 |
| Non-family | 1,187 (36.3%) | 1.21 |
| Total Households | 3,271 (100.0%) | 2.24 |
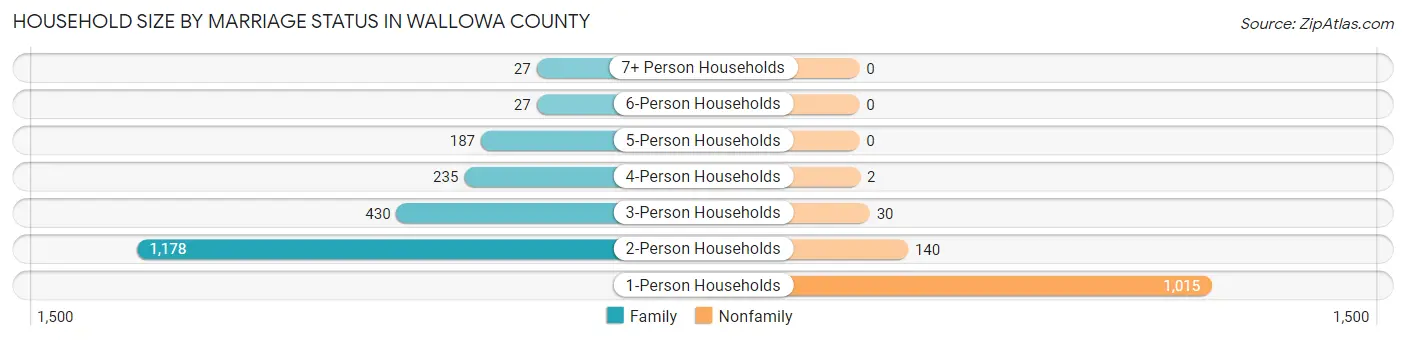
Household Size by Marriage Status in Wallowa County
Out of a total of 3,271 households in Wallowa County, 2,084 (63.7%) are family households, while 1,187 (36.3%) are nonfamily households. The most numerous type of family households are 2-person households, comprising 1,178, and the most common type of nonfamily households are 1-person households, comprising 1,015.
| Household Size | Family Households | Nonfamily Households |
| 1-Person Households | - | 1,015 (31.0%) |
| 2-Person Households | 1,178 (36.0%) | 140 (4.3%) |
| 3-Person Households | 430 (13.2%) | 30 (0.9%) |
| 4-Person Households | 235 (7.2%) | 2 (0.1%) |
| 5-Person Households | 187 (5.7%) | 0 (0.0%) |
| 6-Person Households | 27 (0.8%) | 0 (0.0%) |
| 7+ Person Households | 27 (0.8%) | 0 (0.0%) |
| Total | 2,084 (63.7%) | 1,187 (36.3%) |
Female Fertility in Wallowa County
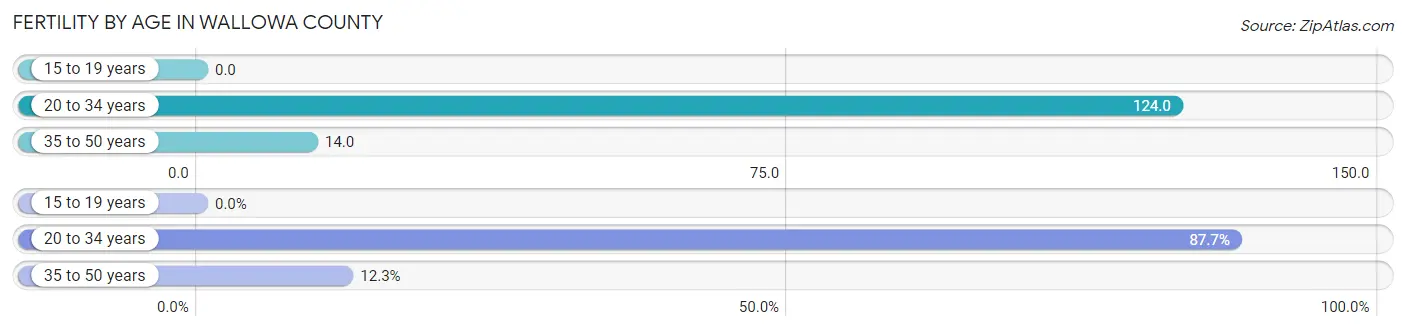
Fertility by Age in Wallowa County
Average fertility rate in Wallowa County is 58.0 births per 1,000 women. Women in the age bracket of 20 to 34 years have the highest fertility rate with 124.0 births per 1,000 women. Women in the age bracket of 20 to 34 years acount for 87.7% of all women with births.
| Age Bracket | Women with Births | Births / 1,000 Women |
| 15 to 19 years | 0 (0.0%) | 0.0 |
| 20 to 34 years | 64 (87.7%) | 124.0 |
| 35 to 50 years | 9 (12.3%) | 14.0 |
| Total | 73 (100.0%) | 58.0 |
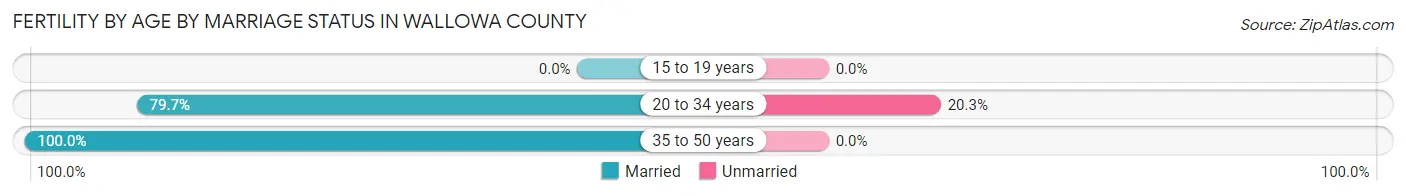
Fertility by Age by Marriage Status in Wallowa County
82.2% of women with births (73) in Wallowa County are married. The highest percentage of unmarried women with births falls into 20 to 34 years age bracket with 20.3% of them unmarried at the time of birth, while the lowest percentage of unmarried women with births belong to 35 to 50 years age bracket with 0.0% of them unmarried.
| Age Bracket | Married | Unmarried |
| 15 to 19 years | 0 (0.0%) | 0 (0.0%) |
| 20 to 34 years | 51 (79.7%) | 13 (20.3%) |
| 35 to 50 years | 9 (100.0%) | 0 (0.0%) |
| Total | 60 (82.2%) | 13 (17.8%) |
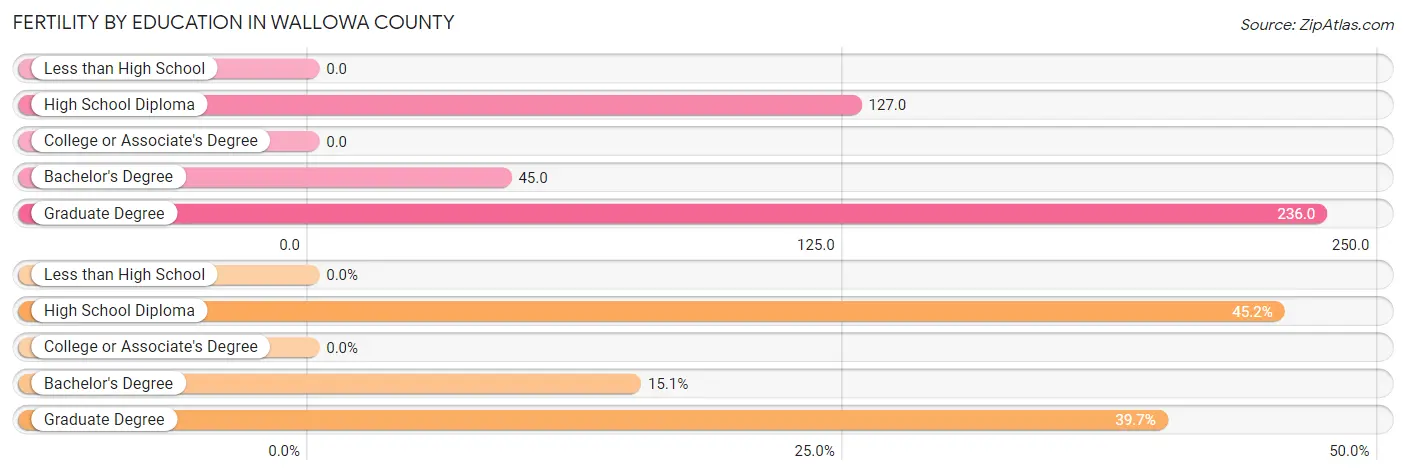
Fertility by Education in Wallowa County
| Educational Attainment | Women with Births | Births / 1,000 Women |
| Less than High School | 0 (0.0%) | 0.0 |
| High School Diploma | 33 (45.2%) | 127.0 |
| College or Associate's Degree | 0 (0.0%) | 0.0 |
| Bachelor's Degree | 11 (15.1%) | 45.0 |
| Graduate Degree | 29 (39.7%) | 236.0 |
| Total | 73 (100.0%) | 58.0 |
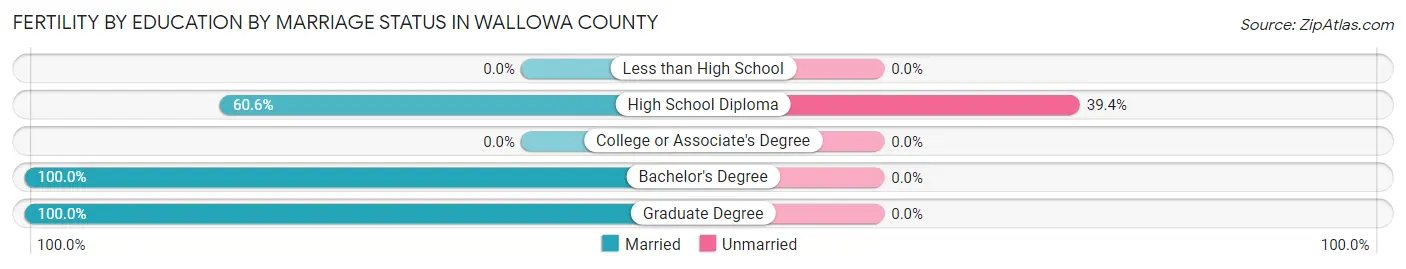
Fertility by Education by Marriage Status in Wallowa County
17.8% of women with births in Wallowa County are unmarried. Women with the educational attainment of bachelor's degree are most likely to be married with 100.0% of them married at childbirth, while women with the educational attainment of high school diploma are least likely to be married with 39.4% of them unmarried at childbirth.
| Educational Attainment | Married | Unmarried |
| Less than High School | 0 (0.0%) | 0 (0.0%) |
| High School Diploma | 20 (60.6%) | 13 (39.4%) |
| College or Associate's Degree | 0 (0.0%) | 0 (0.0%) |
| Bachelor's Degree | 11 (100.0%) | 0 (0.0%) |
| Graduate Degree | 29 (100.0%) | 0 (0.0%) |
| Total | 60 (82.2%) | 13 (17.8%) |
Income in Wallowa County
Income Overview in Wallowa County
Per Capita Income in Wallowa County is $37,378, while median incomes of families and households are $76,023 and $62,238 respectively.
| Characteristic | Number | Measure |
| Per Capita Income | 7,439 | $37,378 |
| Median Family Income | 2,084 | $76,023 |
| Mean Family Income | 2,084 | $97,705 |
| Median Household Income | 3,271 | $62,238 |
| Mean Household Income | 3,271 | $84,003 |
| Income Deficit | 2,084 | $0 |
| Wage / Income Gap (%) | 7,439 | 24.50% |
| Wage / Income Gap ($) | 7,439 | 75.50¢ per $1 |
| Gini / Inequality Index | 7,439 | 0.46 |
Earnings by Sex in Wallowa County
Average Earnings in Wallowa County are $31,138, $38,026 for men and $28,708 for women, a difference of 24.5%.
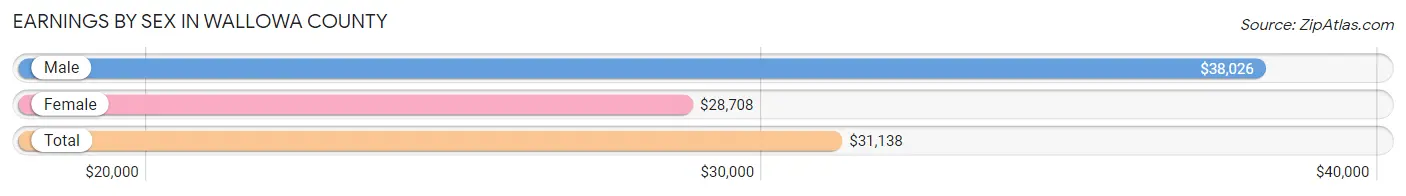
| Sex | Number | Average Earnings |
| Male | 1,930 (49.7%) | $38,026 |
| Female | 1,954 (50.3%) | $28,708 |
| Total | 3,884 (100.0%) | $31,138 |
Earnings by Sex by Income Bracket in Wallowa County
The most common earnings brackets in Wallowa County are $75,000 to $99,999 for men (292 | 15.1%) and $30,000 to $34,999 for women (178 | 9.1%).
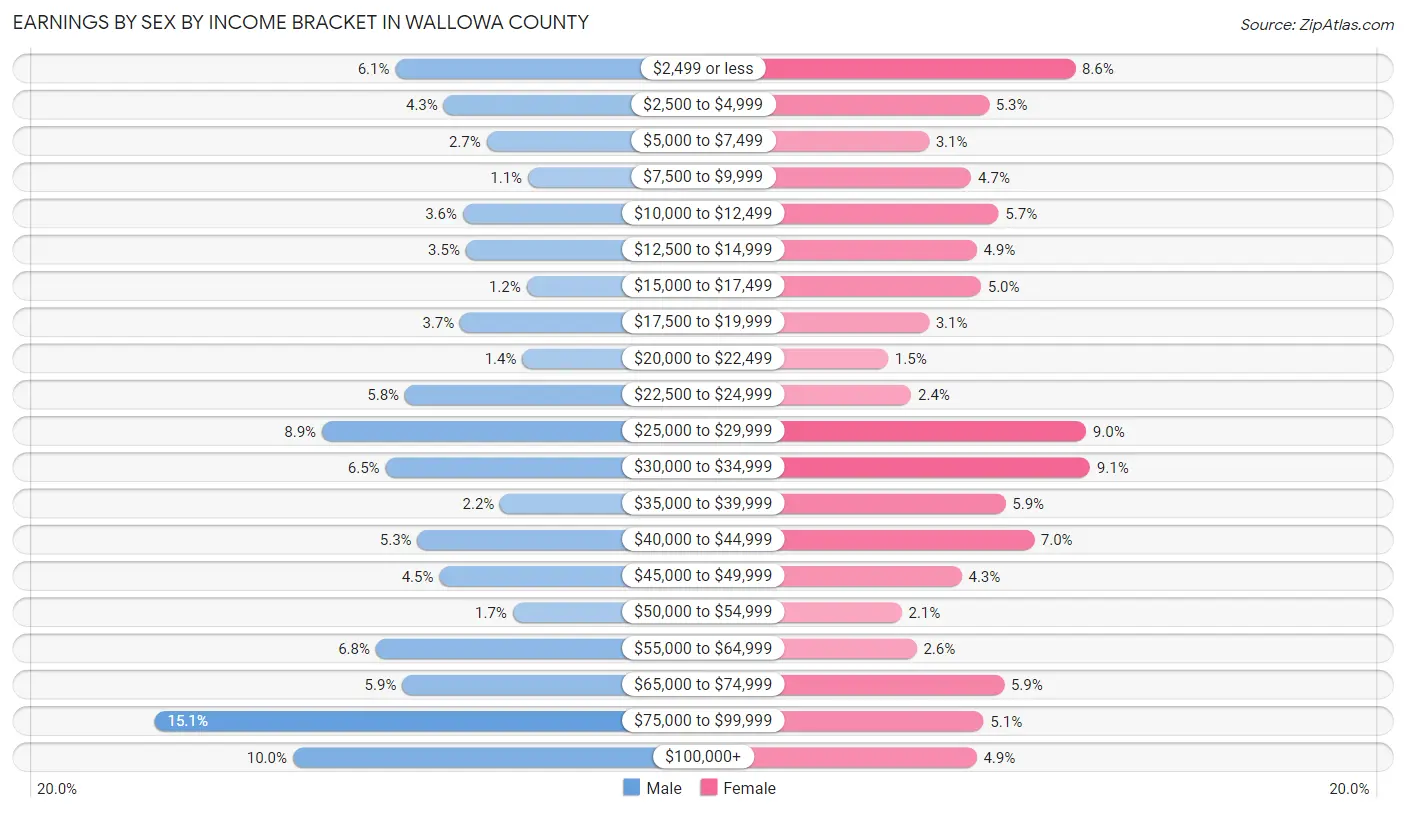
| Income | Male | Female |
| $2,499 or less | 118 (6.1%) | 167 (8.6%) |
| $2,500 to $4,999 | 83 (4.3%) | 104 (5.3%) |
| $5,000 to $7,499 | 52 (2.7%) | 60 (3.1%) |
| $7,500 to $9,999 | 22 (1.1%) | 91 (4.7%) |
| $10,000 to $12,499 | 69 (3.6%) | 111 (5.7%) |
| $12,500 to $14,999 | 67 (3.5%) | 95 (4.9%) |
| $15,000 to $17,499 | 23 (1.2%) | 98 (5.0%) |
| $17,500 to $19,999 | 71 (3.7%) | 60 (3.1%) |
| $20,000 to $22,499 | 26 (1.3%) | 30 (1.5%) |
| $22,500 to $24,999 | 111 (5.8%) | 47 (2.4%) |
| $25,000 to $29,999 | 171 (8.9%) | 175 (9.0%) |
| $30,000 to $34,999 | 125 (6.5%) | 178 (9.1%) |
| $35,000 to $39,999 | 42 (2.2%) | 116 (5.9%) |
| $40,000 to $44,999 | 102 (5.3%) | 137 (7.0%) |
| $45,000 to $49,999 | 86 (4.5%) | 84 (4.3%) |
| $50,000 to $54,999 | 33 (1.7%) | 40 (2.1%) |
| $55,000 to $64,999 | 132 (6.8%) | 51 (2.6%) |
| $65,000 to $74,999 | 113 (5.9%) | 115 (5.9%) |
| $75,000 to $99,999 | 292 (15.1%) | 100 (5.1%) |
| $100,000+ | 192 (10.0%) | 95 (4.9%) |
| Total | 1,930 (100.0%) | 1,954 (100.0%) |
Earnings by Sex by Educational Attainment in Wallowa County
Average earnings in Wallowa County are $44,347 for men and $30,873 for women, a difference of 30.4%. Men with an educational attainment of graduate degree enjoy the highest average annual earnings of $79,609, while those with high school diploma education earn the least with $29,673. Women with an educational attainment of graduate degree earn the most with the average annual earnings of $45,179, while those with high school diploma education have the smallest earnings of $25,724.
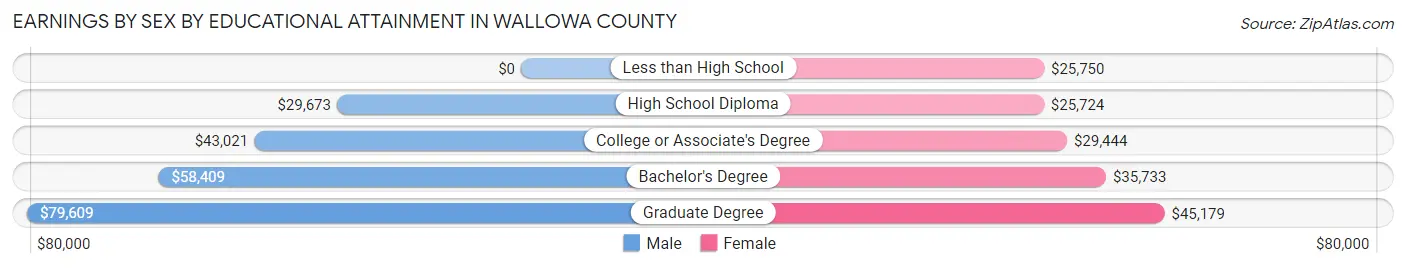
| Educational Attainment | Male Income | Female Income |
| Less than High School | - | - |
| High School Diploma | $29,673 | $25,724 |
| College or Associate's Degree | $43,021 | $29,444 |
| Bachelor's Degree | $58,409 | $35,733 |
| Graduate Degree | $79,609 | $45,179 |
| Total | $44,347 | $30,873 |
Family Income in Wallowa County
Family Income Brackets in Wallowa County
According to the Wallowa County family income data, there are 483 families falling into the $50,000 to $74,999 income range, which is the most common income bracket and makes up 23.2% of all families. Conversely, the $10,000 to $14,999 income bracket is the least frequent group with only 8 families (0.4%) belonging to this category.
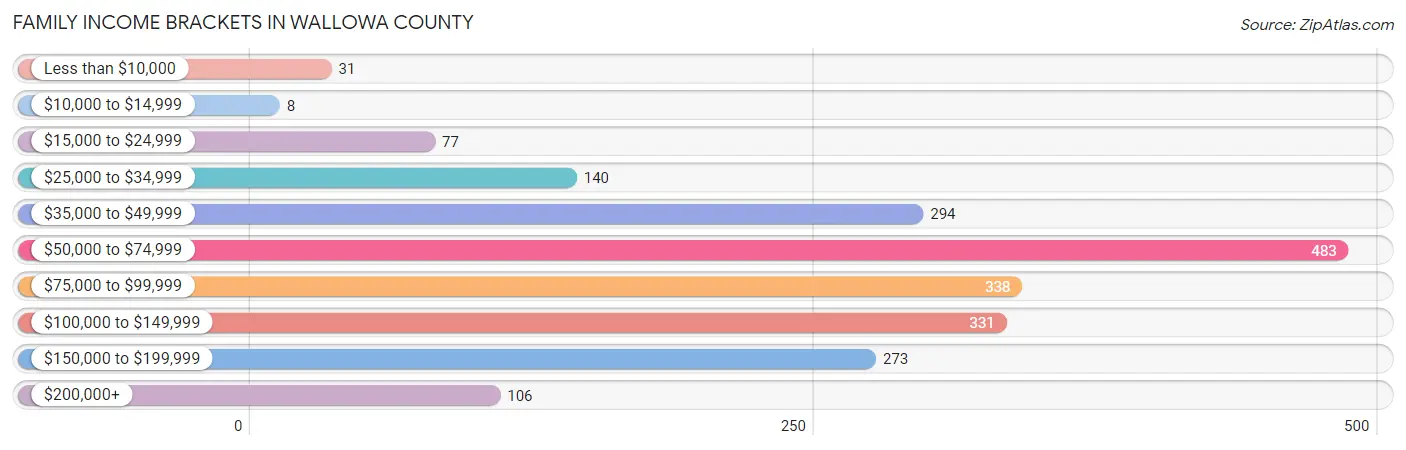
| Income Bracket | # Families | % Families |
| Less than $10,000 | 31 | 1.5% |
| $10,000 to $14,999 | 8 | 0.4% |
| $15,000 to $24,999 | 77 | 3.7% |
| $25,000 to $34,999 | 140 | 6.7% |
| $35,000 to $49,999 | 294 | 14.1% |
| $50,000 to $74,999 | 483 | 23.2% |
| $75,000 to $99,999 | 338 | 16.2% |
| $100,000 to $149,999 | 331 | 15.9% |
| $150,000 to $199,999 | 273 | 13.1% |
| $200,000+ | 106 | 5.1% |
Family Income by Famaliy Size in Wallowa County
5-person families (170 | 8.2%) account for the highest median family income in Wallowa County with $156,250 per family, while 2-person families (1,207 | 57.9%) have the highest median income of $35,521 per family member.
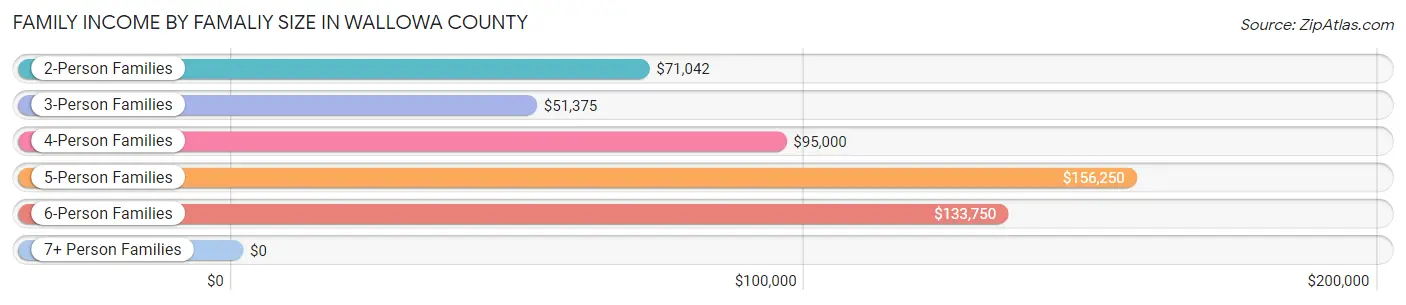
| Income Bracket | # Families | Median Income |
| 2-Person Families | 1,207 (57.9%) | $71,042 |
| 3-Person Families | 415 (19.9%) | $51,375 |
| 4-Person Families | 242 (11.6%) | $95,000 |
| 5-Person Families | 170 (8.2%) | $156,250 |
| 6-Person Families | 50 (2.4%) | $133,750 |
| 7+ Person Families | 0 (0.0%) | $0 |
| Total | 2,084 (100.0%) | $76,023 |
Family Income by Number of Earners in Wallowa County
The median family income in Wallowa County is $76,023, with families comprising 3+ earners (249) having the highest median family income of $138,304, while families with no earners (430) have the lowest median family income of $54,766, accounting for 11.9% and 20.6% of families, respectively.
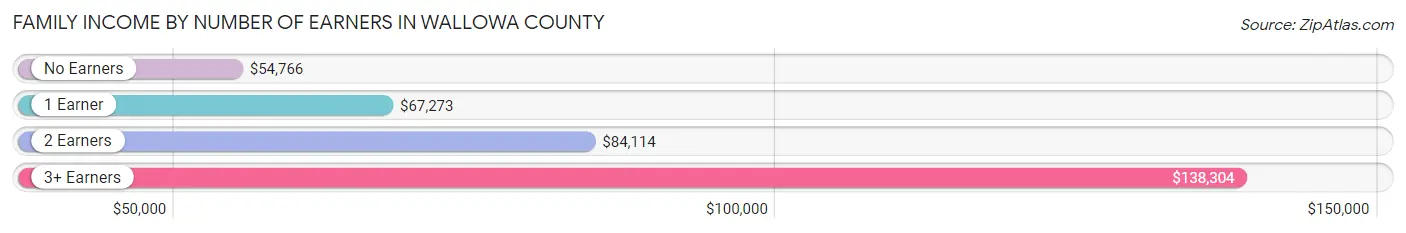
| Number of Earners | # Families | Median Income |
| No Earners | 430 (20.6%) | $54,766 |
| 1 Earner | 496 (23.8%) | $67,273 |
| 2 Earners | 909 (43.6%) | $84,114 |
| 3+ Earners | 249 (11.9%) | $138,304 |
| Total | 2,084 (100.0%) | $76,023 |
Household Income in Wallowa County
Household Income Brackets in Wallowa County
With 690 households falling in the category, the $50,000 to $74,999 income range is the most frequent in Wallowa County, accounting for 21.1% of all households. In contrast, only 121 households (3.7%) fall into the $10,000 to $14,999 income bracket, making it the least populous group.
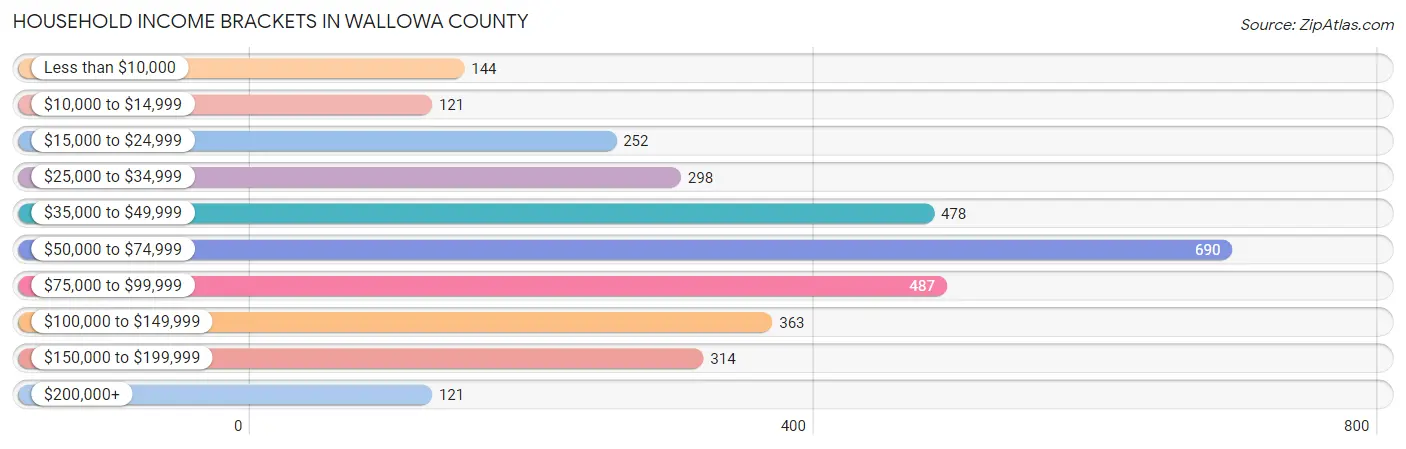
| Income Bracket | # Households | % Households |
| Less than $10,000 | 144 | 4.4% |
| $10,000 to $14,999 | 121 | 3.7% |
| $15,000 to $24,999 | 252 | 7.7% |
| $25,000 to $34,999 | 298 | 9.1% |
| $35,000 to $49,999 | 478 | 14.6% |
| $50,000 to $74,999 | 690 | 21.1% |
| $75,000 to $99,999 | 487 | 14.9% |
| $100,000 to $149,999 | 363 | 11.1% |
| $150,000 to $199,999 | 314 | 9.6% |
| $200,000+ | 121 | 3.7% |
Household Income by Householder Age in Wallowa County
The median household income in Wallowa County is $62,238, with the highest median household income of $66,538 found in the 25 to 44 years age bracket for the primary householder. A total of 776 households (23.7%) fall into this category. Meanwhile, the 15 to 24 years age bracket for the primary householder has the lowest median household income of $31,199, with 100 households (3.1%) in this group.
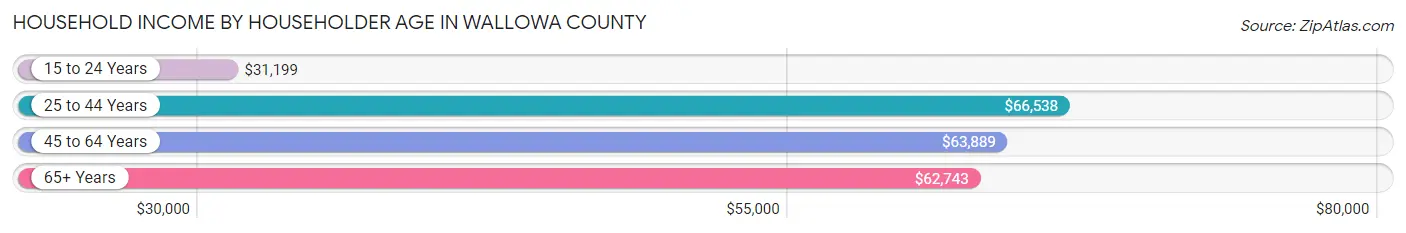
| Income Bracket | # Households | Median Income |
| 15 to 24 Years | 100 (3.1%) | $31,199 |
| 25 to 44 Years | 776 (23.7%) | $66,538 |
| 45 to 64 Years | 1,196 (36.6%) | $63,889 |
| 65+ Years | 1,199 (36.7%) | $62,743 |
| Total | 3,271 (100.0%) | $62,238 |
Poverty in Wallowa County
Income Below Poverty by Sex and Age in Wallowa County
With 11.1% poverty level for males and 7.3% for females among the residents of Wallowa County, 15 year old males and 5 year old females are the most vulnerable to poverty, with 47 males (43.5%) and 8 females (19.5%) in their respective age groups living below the poverty level.
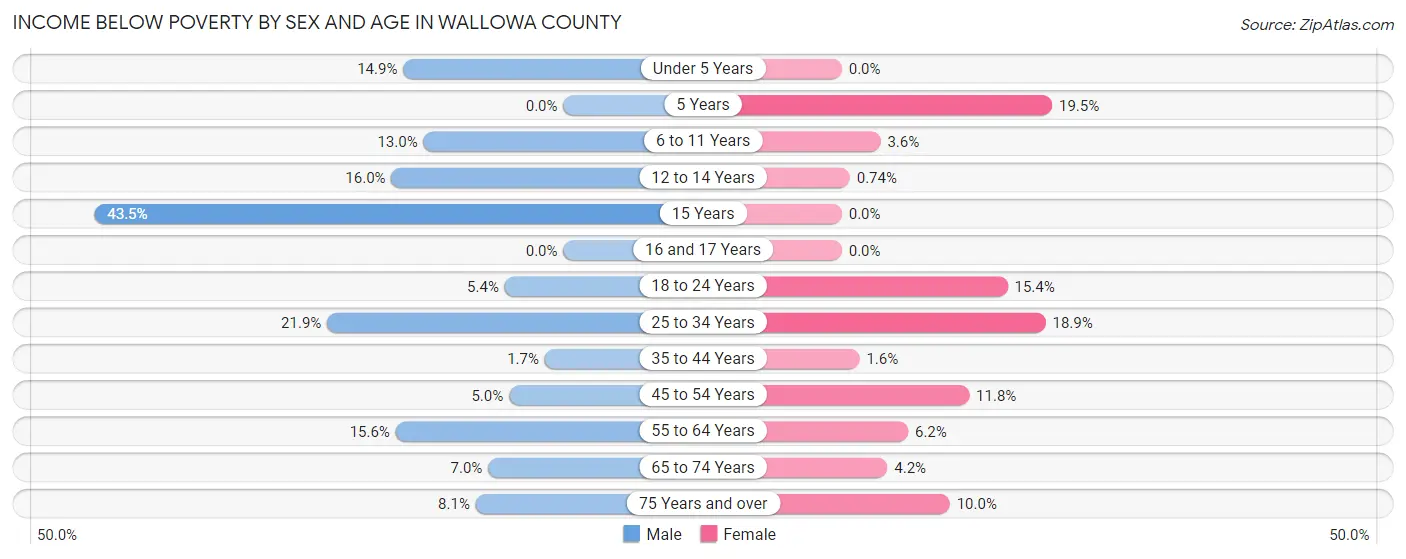
| Age Bracket | Male | Female |
| Under 5 Years | 22 (14.9%) | 0 (0.0%) |
| 5 Years | 0 (0.0%) | 8 (19.5%) |
| 6 to 11 Years | 27 (13.0%) | 7 (3.6%) |
| 12 to 14 Years | 34 (16.0%) | 1 (0.7%) |
| 15 Years | 47 (43.5%) | 0 (0.0%) |
| 16 and 17 Years | 0 (0.0%) | 0 (0.0%) |
| 18 to 24 Years | 8 (5.4%) | 36 (15.4%) |
| 25 to 34 Years | 73 (21.9%) | 59 (18.9%) |
| 35 to 44 Years | 7 (1.7%) | 7 (1.6%) |
| 45 to 54 Years | 18 (5.0%) | 48 (11.8%) |
| 55 to 64 Years | 89 (15.6%) | 39 (6.1%) |
| 65 to 74 Years | 44 (7.0%) | 26 (4.2%) |
| 75 Years and over | 33 (8.1%) | 43 (10.0%) |
| Total | 402 (11.1%) | 274 (7.3%) |
Income Above Poverty by Sex and Age in Wallowa County
According to the poverty statistics in Wallowa County, males aged 5 years and females aged under 5 years are the age groups that are most secure financially, with 100.0% of males and 100.0% of females in these age groups living above the poverty line.
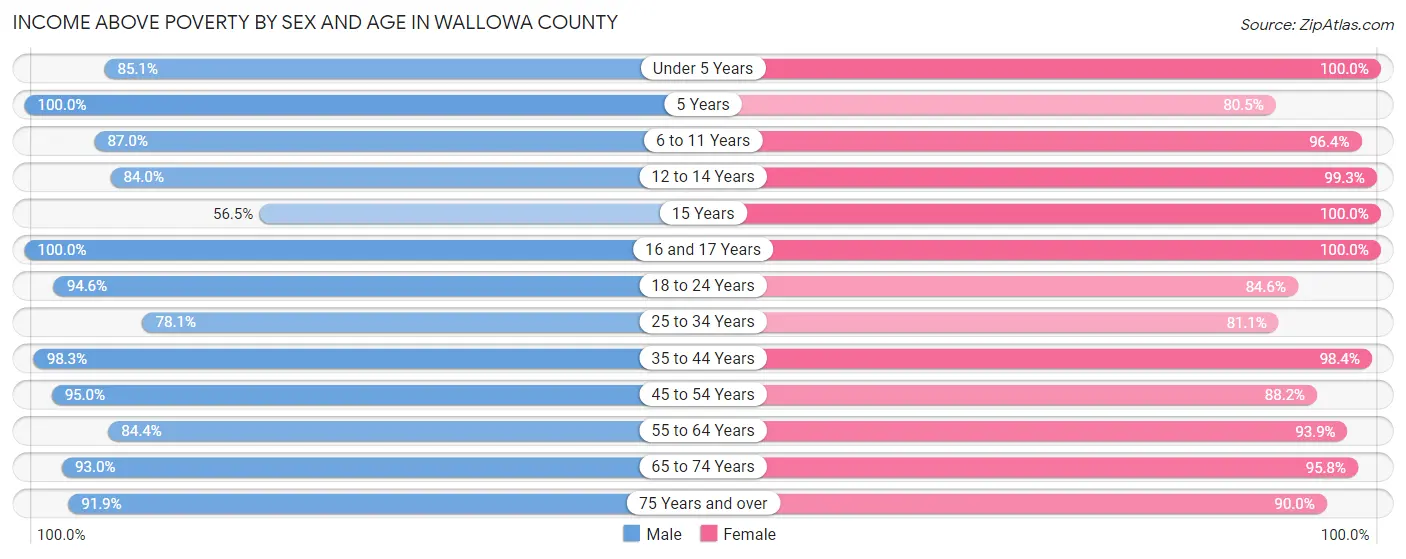
| Age Bracket | Male | Female |
| Under 5 Years | 126 (85.1%) | 221 (100.0%) |
| 5 Years | 22 (100.0%) | 33 (80.5%) |
| 6 to 11 Years | 181 (87.0%) | 188 (96.4%) |
| 12 to 14 Years | 179 (84.0%) | 135 (99.3%) |
| 15 Years | 61 (56.5%) | 3 (100.0%) |
| 16 and 17 Years | 70 (100.0%) | 77 (100.0%) |
| 18 to 24 Years | 139 (94.6%) | 198 (84.6%) |
| 25 to 34 Years | 260 (78.1%) | 253 (81.1%) |
| 35 to 44 Years | 401 (98.3%) | 420 (98.4%) |
| 45 to 54 Years | 339 (95.0%) | 358 (88.2%) |
| 55 to 64 Years | 483 (84.4%) | 595 (93.9%) |
| 65 to 74 Years | 586 (93.0%) | 588 (95.8%) |
| 75 Years and over | 373 (91.9%) | 386 (90.0%) |
| Total | 3,220 (88.9%) | 3,455 (92.6%) |
Income Below Poverty Among Married-Couple Families in Wallowa County
The poverty statistics for married-couple families in Wallowa County show that 1.9% or 34 of the total 1,791 families live below the poverty line. Families with 3 or 4 children have the highest poverty rate of 5.4%, comprising of 6 families. On the other hand, families with 1 or 2 children have the lowest poverty rate of 0.9%, which includes 4 families.
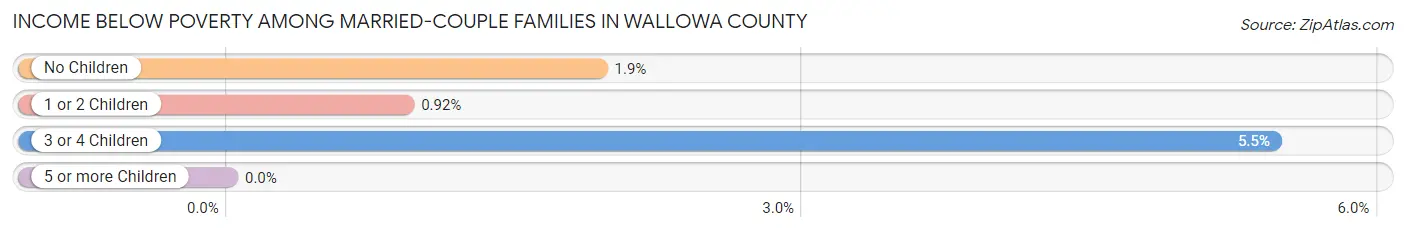
| Children | Above Poverty | Below Poverty |
| No Children | 1,222 (98.1%) | 24 (1.9%) |
| 1 or 2 Children | 431 (99.1%) | 4 (0.9%) |
| 3 or 4 Children | 104 (94.6%) | 6 (5.4%) |
| 5 or more Children | 0 (0.0%) | 0 (0.0%) |
| Total | 1,757 (98.1%) | 34 (1.9%) |
Income Below Poverty Among Single-Parent Households in Wallowa County
According to the poverty data in Wallowa County, 20.5% or 17 single-father households and 21.9% or 46 single-mother households are living below the poverty line. Among single-father households, those with 3 or 4 children have the highest poverty rate, with 17 households (100.0%) experiencing poverty. Likewise, among single-mother households, those with 1 or 2 children have the highest poverty rate, with 46 households (29.9%) falling below the poverty line.
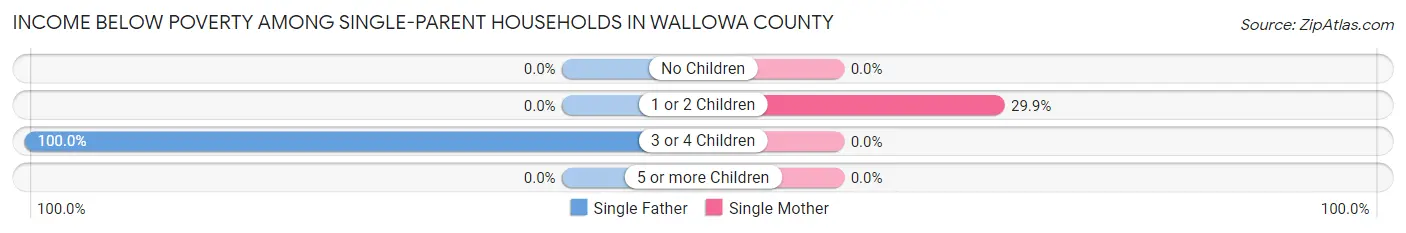
| Children | Single Father | Single Mother |
| No Children | 0 (0.0%) | 0 (0.0%) |
| 1 or 2 Children | 0 (0.0%) | 46 (29.9%) |
| 3 or 4 Children | 17 (100.0%) | 0 (0.0%) |
| 5 or more Children | 0 (0.0%) | 0 (0.0%) |
| Total | 17 (20.5%) | 46 (21.9%) |
Income Below Poverty Among Married-Couple vs Single-Parent Households in Wallowa County
The poverty data for Wallowa County shows that 34 of the married-couple family households (1.9%) and 63 of the single-parent households (21.5%) are living below the poverty level. Within the married-couple family households, those with 3 or 4 children have the highest poverty rate, with 6 households (5.4%) falling below the poverty line. Among the single-parent households, those with 3 or 4 children have the highest poverty rate, with 17 household (70.8%) living below poverty.
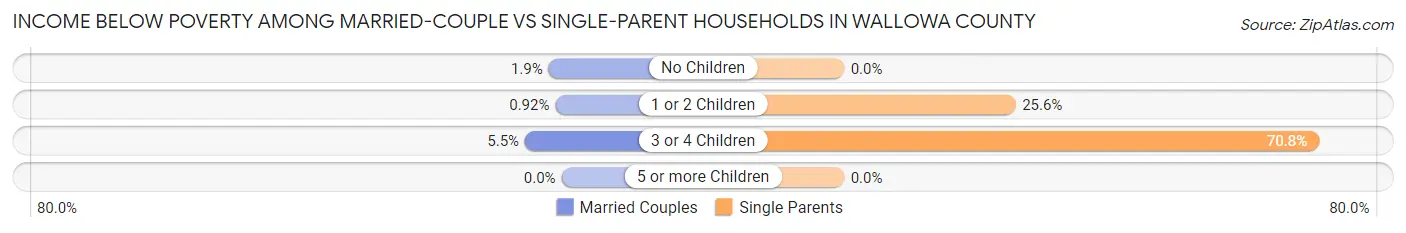
| Children | Married-Couple Families | Single-Parent Households |
| No Children | 24 (1.9%) | 0 (0.0%) |
| 1 or 2 Children | 4 (0.9%) | 46 (25.6%) |
| 3 or 4 Children | 6 (5.4%) | 17 (70.8%) |
| 5 or more Children | 0 (0.0%) | 0 (0.0%) |
| Total | 34 (1.9%) | 63 (21.5%) |
Employment Characteristics in Wallowa County
Employment by Class of Employer in Wallowa County
Among the 3,284 employed individuals in Wallowa County, private company employees (1,765 | 53.7%), self-employed (incorporated) (394 | 12.0%), and local government employees (345 | 10.5%) make up the most common classes of employment.
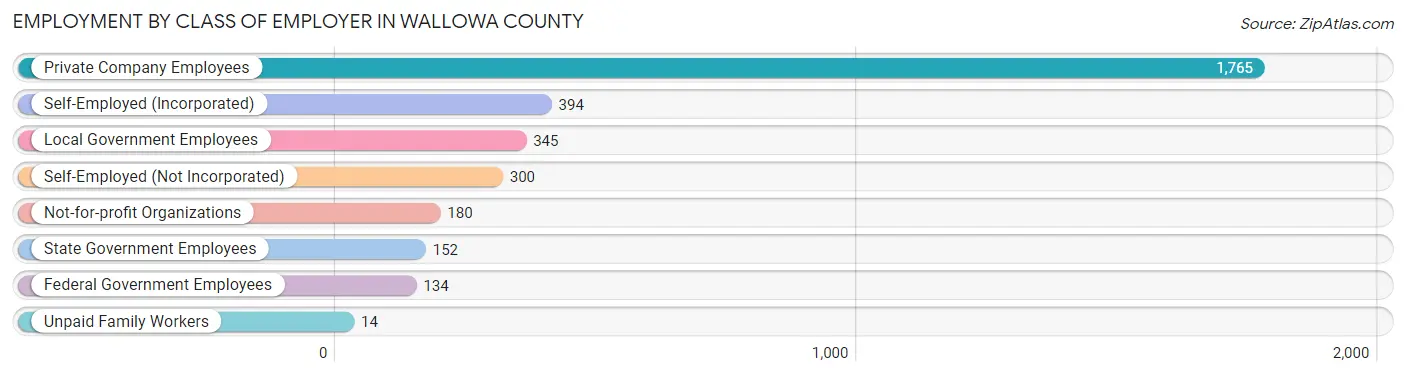
| Employer Class | # Employees | % Employees |
| Private Company Employees | 1,765 | 53.7% |
| Self-Employed (Incorporated) | 394 | 12.0% |
| Self-Employed (Not Incorporated) | 300 | 9.1% |
| Not-for-profit Organizations | 180 | 5.5% |
| Local Government Employees | 345 | 10.5% |
| State Government Employees | 152 | 4.6% |
| Federal Government Employees | 134 | 4.1% |
| Unpaid Family Workers | 14 | 0.4% |
| Total | 3,284 | 100.0% |
Employment Status by Age in Wallowa County
According to the labor force statistics for Wallowa County, out of the total population over 16 years of age (6,136), 57.1% or 3,504 individuals are in the labor force, with 6.0% or 210 of them unemployed. The age group with the highest labor force participation rate is 20 to 24 years, with 92.7% or 307 individuals in the labor force. Within the labor force, the 55 to 59 years age range has the highest percentage of unemployed individuals, with 18.1% or 88 of them being unemployed.
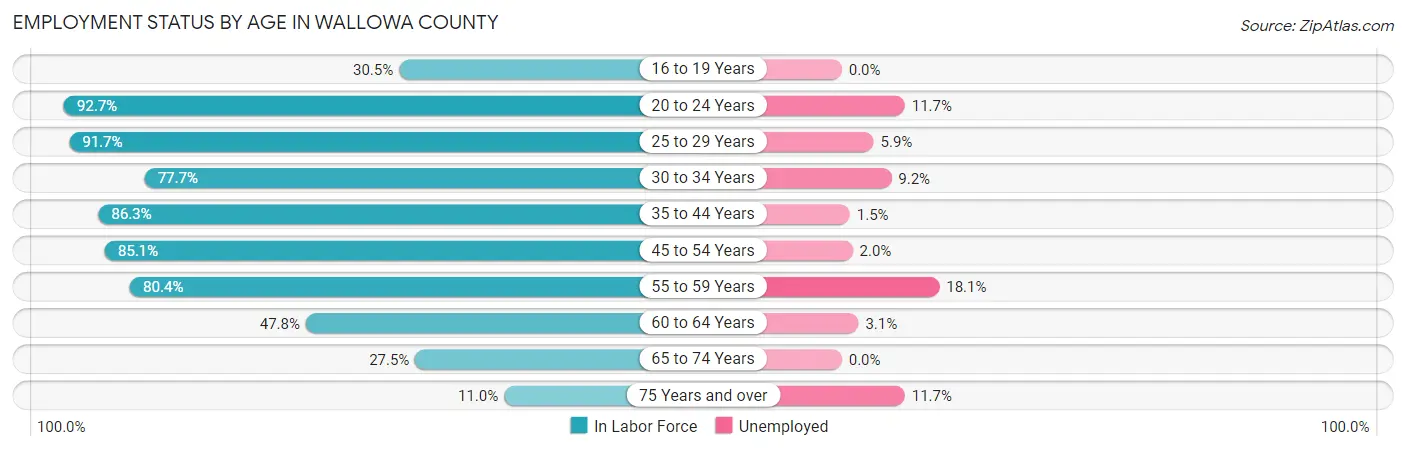
| Age Bracket | In Labor Force | Unemployed |
| 16 to 19 Years | 60 (30.5%) | 0 (0.0%) |
| 20 to 24 Years | 307 (92.7%) | 36 (11.7%) |
| 25 to 29 Years | 221 (91.7%) | 13 (5.9%) |
| 30 to 34 Years | 314 (77.7%) | 29 (9.2%) |
| 35 to 44 Years | 721 (86.3%) | 11 (1.5%) |
| 45 to 54 Years | 657 (85.1%) | 13 (2.0%) |
| 55 to 59 Years | 487 (80.4%) | 88 (18.1%) |
| 60 to 64 Years | 287 (47.8%) | 9 (3.1%) |
| 65 to 74 Years | 357 (27.5%) | 0 (0.0%) |
| 75 Years and over | 94 (11.0%) | 11 (11.7%) |
| Total | 3,504 (57.1%) | 210 (6.0%) |
Employment Status by Educational Attainment in Wallowa County
According to labor force statistics for Wallowa County, 77.7% of individuals (2,687) out of the total population between 25 and 64 years of age (3,458) are in the labor force, with 6.1% or 164 of them being unemployed. The group with the highest labor force participation rate are those with the educational attainment of bachelor's degree or higher, with 89.3% or 995 individuals in the labor force. Within the labor force, individuals with high school diploma education have the highest percentage of unemployment, with 7.7% or 47 of them being unemployed.
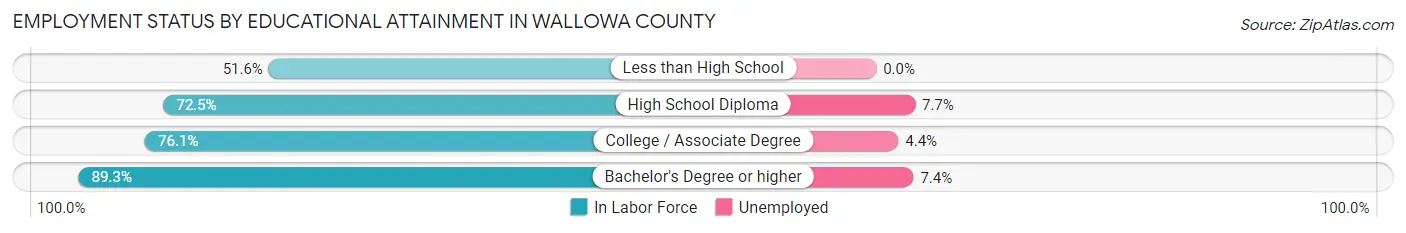
| Educational Attainment | In Labor Force | Unemployed |
| Less than High School | 130 (51.6%) | 0 (0.0%) |
| High School Diploma | 610 (72.5%) | 65 (7.7%) |
| College / Associate Degree | 952 (76.1%) | 55 (4.4%) |
| Bachelor's Degree or higher | 995 (89.3%) | 82 (7.4%) |
| Total | 2,687 (77.7%) | 211 (6.1%) |
Employment Occupations by Sex in Wallowa County
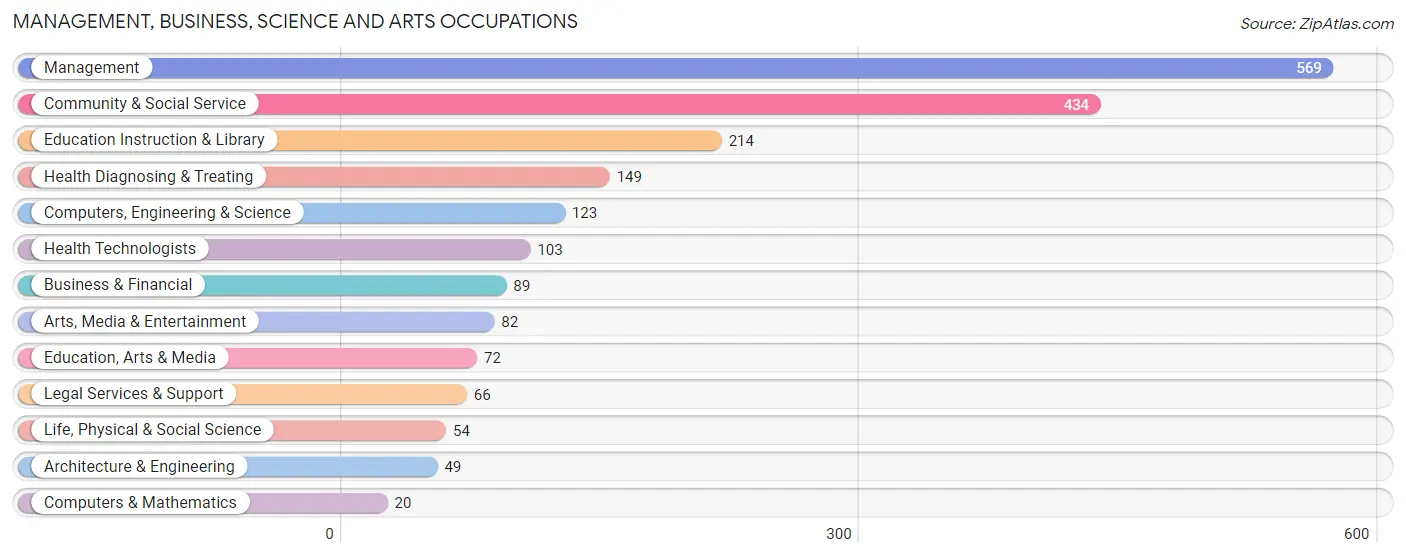
Management, Business, Science and Arts Occupations
The most common Management, Business, Science and Arts occupations in Wallowa County are Management (569 | 17.3%), Community & Social Service (434 | 13.2%), Education Instruction & Library (214 | 6.5%), Health Diagnosing & Treating (149 | 4.5%), and Computers, Engineering & Science (123 | 3.7%).
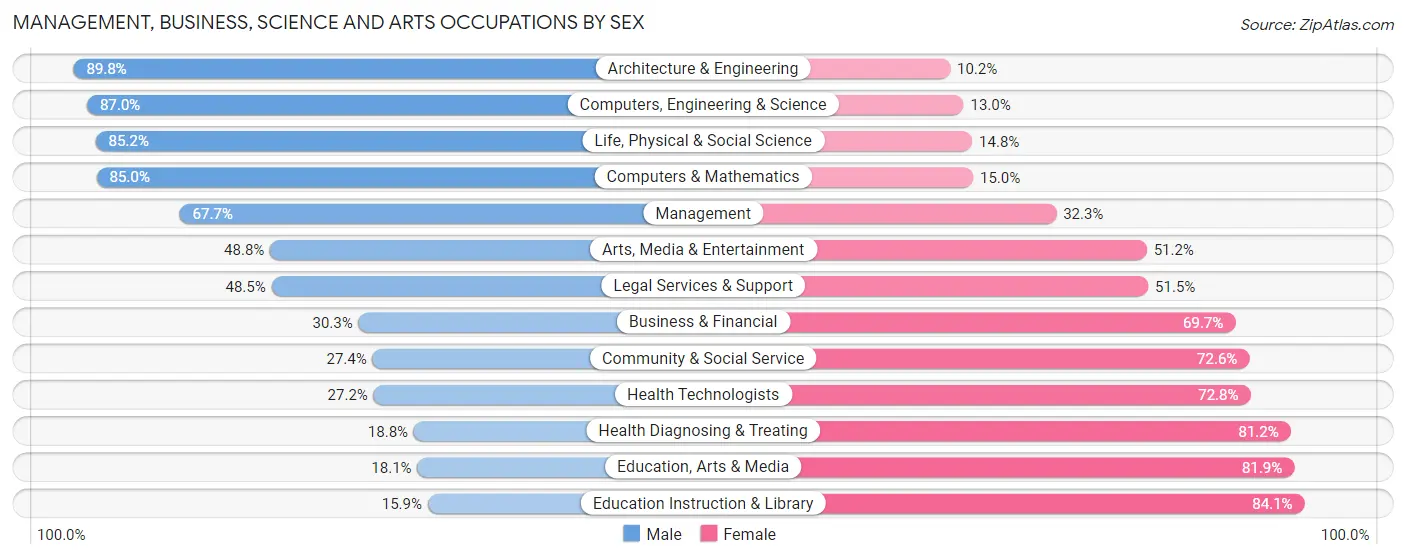
Management, Business, Science and Arts Occupations by Sex
Within the Management, Business, Science and Arts occupations in Wallowa County, the most male-oriented occupations are Architecture & Engineering (89.8%), Computers, Engineering & Science (87.0%), and Life, Physical & Social Science (85.2%), while the most female-oriented occupations are Education Instruction & Library (84.1%), Education, Arts & Media (81.9%), and Health Diagnosing & Treating (81.2%).
| Occupation | Male | Female |
| Management | 385 (67.7%) | 184 (32.3%) |
| Business & Financial | 27 (30.3%) | 62 (69.7%) |
| Computers, Engineering & Science | 107 (87.0%) | 16 (13.0%) |
| Computers & Mathematics | 17 (85.0%) | 3 (15.0%) |
| Architecture & Engineering | 44 (89.8%) | 5 (10.2%) |
| Life, Physical & Social Science | 46 (85.2%) | 8 (14.8%) |
| Community & Social Service | 119 (27.4%) | 315 (72.6%) |
| Education, Arts & Media | 13 (18.1%) | 59 (81.9%) |
| Legal Services & Support | 32 (48.5%) | 34 (51.5%) |
| Education Instruction & Library | 34 (15.9%) | 180 (84.1%) |
| Arts, Media & Entertainment | 40 (48.8%) | 42 (51.2%) |
| Health Diagnosing & Treating | 28 (18.8%) | 121 (81.2%) |
| Health Technologists | 28 (27.2%) | 75 (72.8%) |
| Total (Category) | 666 (48.8%) | 698 (51.2%) |
| Total (Overall) | 1,675 (50.8%) | 1,620 (49.2%) |
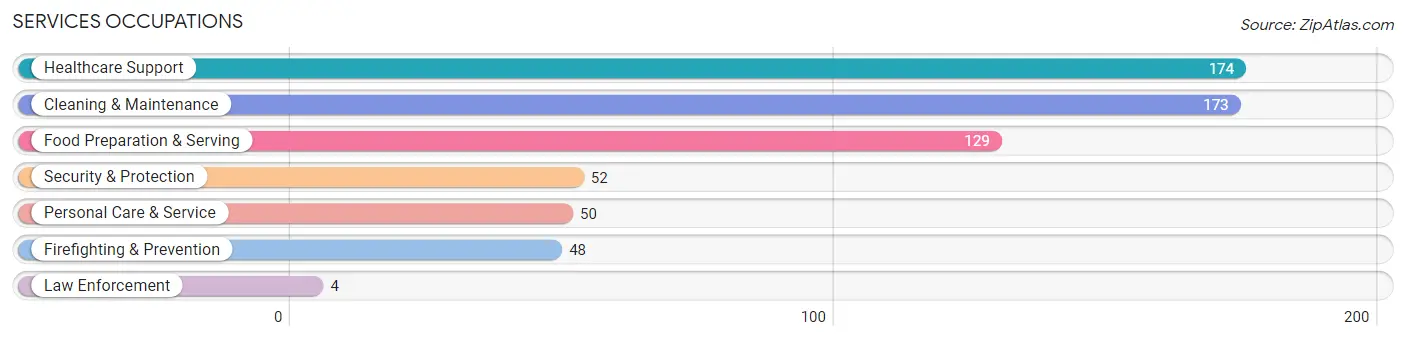
Services Occupations
The most common Services occupations in Wallowa County are Healthcare Support (174 | 5.3%), Cleaning & Maintenance (173 | 5.2%), Food Preparation & Serving (129 | 3.9%), Security & Protection (52 | 1.6%), and Personal Care & Service (50 | 1.5%).
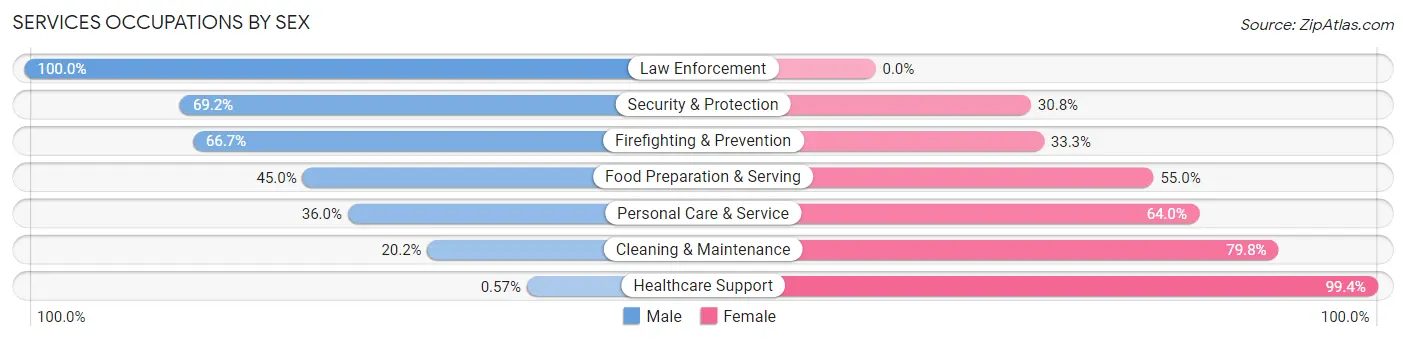
Services Occupations by Sex
Within the Services occupations in Wallowa County, the most male-oriented occupations are Law Enforcement (100.0%), Security & Protection (69.2%), and Firefighting & Prevention (66.7%), while the most female-oriented occupations are Healthcare Support (99.4%), Cleaning & Maintenance (79.8%), and Personal Care & Service (64.0%).
| Occupation | Male | Female |
| Healthcare Support | 1 (0.6%) | 173 (99.4%) |
| Security & Protection | 36 (69.2%) | 16 (30.8%) |
| Firefighting & Prevention | 32 (66.7%) | 16 (33.3%) |
| Law Enforcement | 4 (100.0%) | 0 (0.0%) |
| Food Preparation & Serving | 58 (45.0%) | 71 (55.0%) |
| Cleaning & Maintenance | 35 (20.2%) | 138 (79.8%) |
| Personal Care & Service | 18 (36.0%) | 32 (64.0%) |
| Total (Category) | 148 (25.6%) | 430 (74.4%) |
| Total (Overall) | 1,675 (50.8%) | 1,620 (49.2%) |
Sales and Office Occupations
The most common Sales and Office occupations in Wallowa County are Office & Administration (347 | 10.5%), and Sales & Related (293 | 8.9%).

Sales and Office Occupations by Sex

| Occupation | Male | Female |
| Sales & Related | 199 (67.9%) | 94 (32.1%) |
| Office & Administration | 51 (14.7%) | 296 (85.3%) |
| Total (Category) | 250 (39.1%) | 390 (60.9%) |
| Total (Overall) | 1,675 (50.8%) | 1,620 (49.2%) |
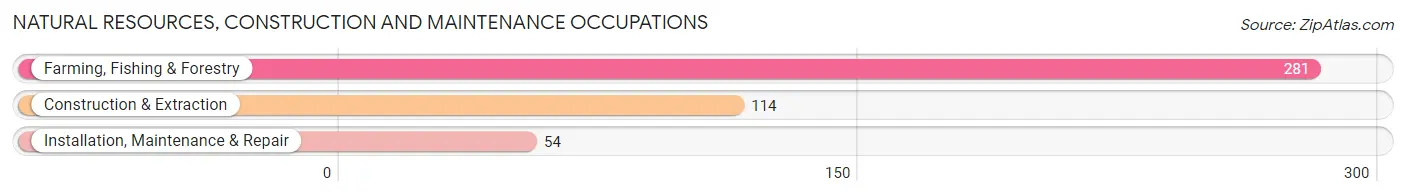
Natural Resources, Construction and Maintenance Occupations
The most common Natural Resources, Construction and Maintenance occupations in Wallowa County are Farming, Fishing & Forestry (281 | 8.5%), Construction & Extraction (114 | 3.5%), and Installation, Maintenance & Repair (54 | 1.6%).
Natural Resources, Construction and Maintenance Occupations by Sex
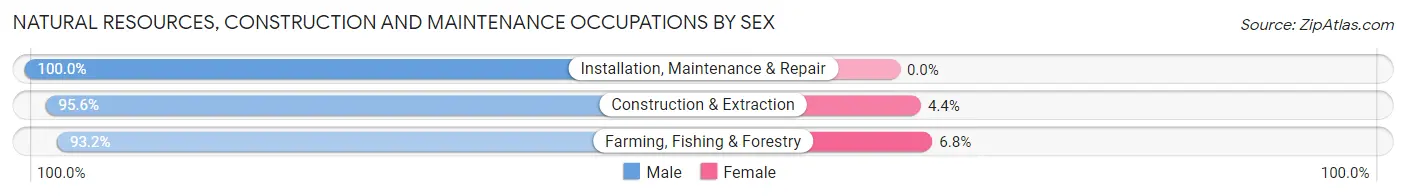
| Occupation | Male | Female |
| Farming, Fishing & Forestry | 262 (93.2%) | 19 (6.8%) |
| Construction & Extraction | 109 (95.6%) | 5 (4.4%) |
| Installation, Maintenance & Repair | 54 (100.0%) | 0 (0.0%) |
| Total (Category) | 425 (94.7%) | 24 (5.3%) |
| Total (Overall) | 1,675 (50.8%) | 1,620 (49.2%) |
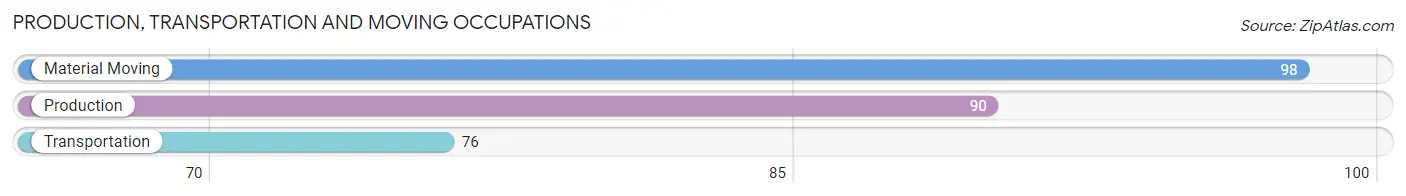
Production, Transportation and Moving Occupations
The most common Production, Transportation and Moving occupations in Wallowa County are Material Moving (98 | 3.0%), Production (90 | 2.7%), and Transportation (76 | 2.3%).
Production, Transportation and Moving Occupations by Sex
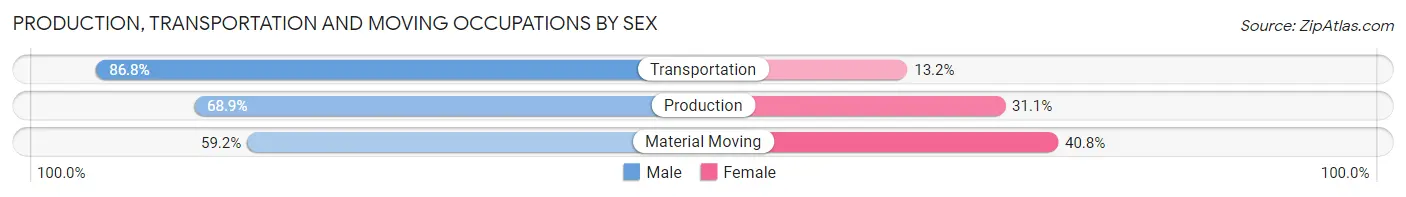
| Occupation | Male | Female |
| Production | 62 (68.9%) | 28 (31.1%) |
| Transportation | 66 (86.8%) | 10 (13.2%) |
| Material Moving | 58 (59.2%) | 40 (40.8%) |
| Total (Category) | 186 (70.5%) | 78 (29.5%) |
| Total (Overall) | 1,675 (50.8%) | 1,620 (49.2%) |
Employment Industries by Sex in Wallowa County
Employment Industries in Wallowa County
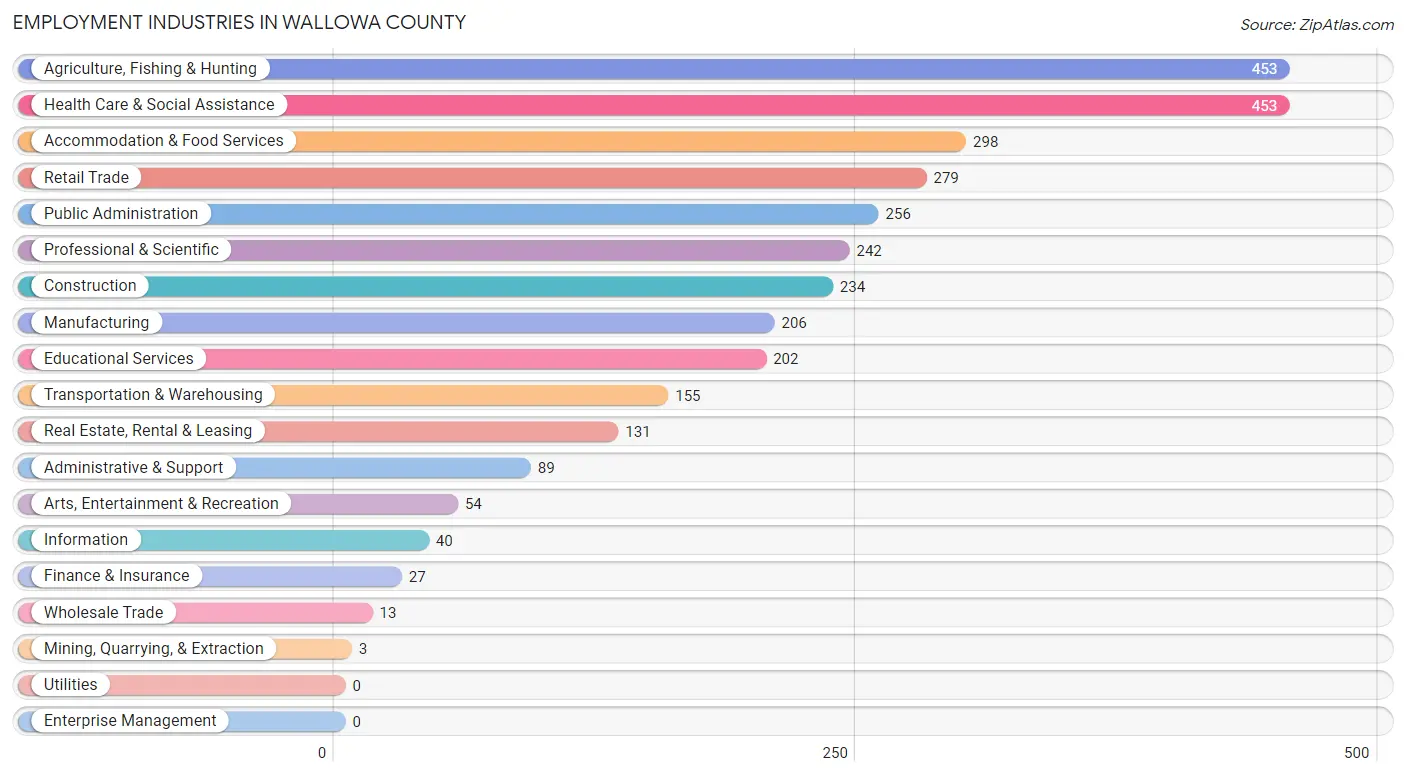
The major employment industries in Wallowa County include Agriculture, Fishing & Hunting (453 | 13.8%), Health Care & Social Assistance (453 | 13.8%), Accommodation & Food Services (298 | 9.0%), Retail Trade (279 | 8.5%), and Public Administration (256 | 7.8%).
Employment Industries by Sex in Wallowa County
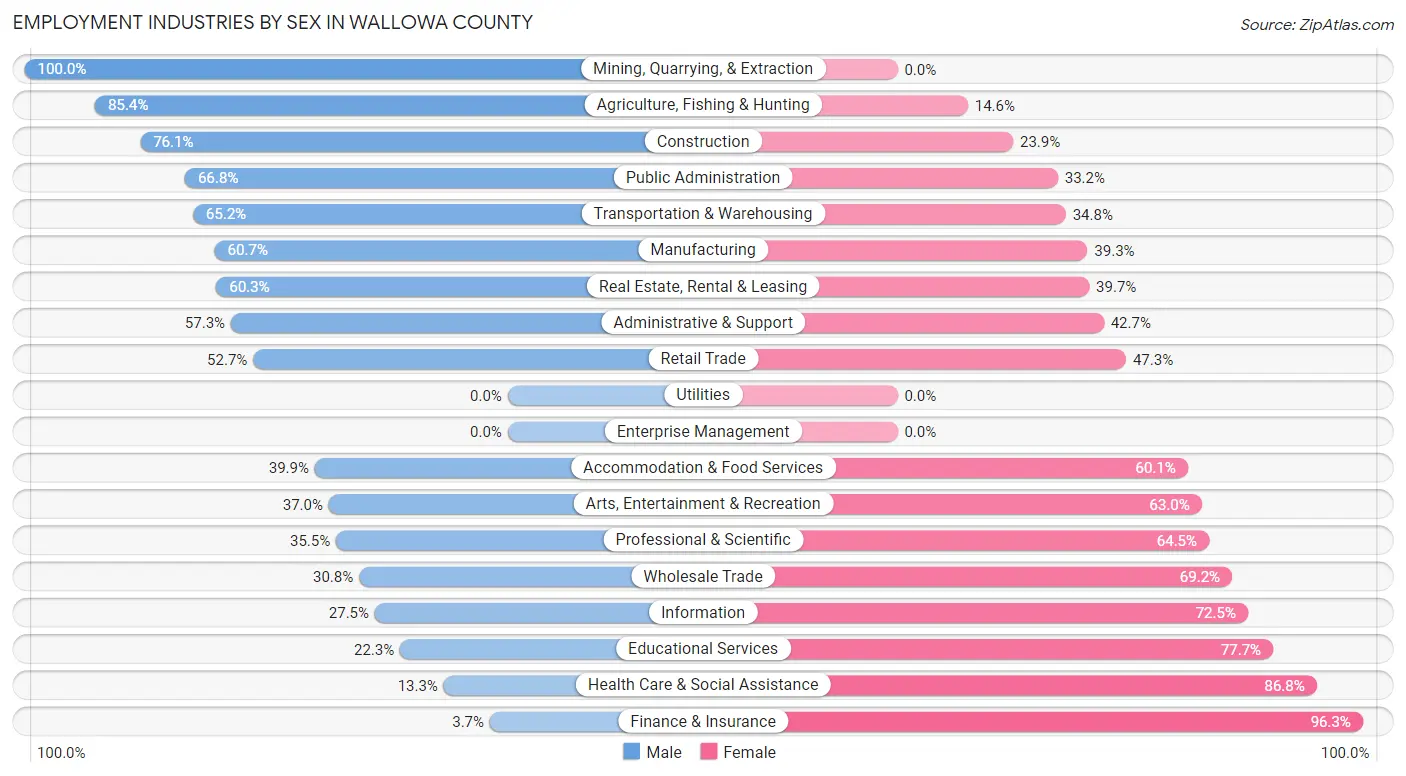
The Wallowa County industries that see more men than women are Mining, Quarrying, & Extraction (100.0%), Agriculture, Fishing & Hunting (85.4%), and Construction (76.1%), whereas the industries that tend to have a higher number of women are Finance & Insurance (96.3%), Health Care & Social Assistance (86.8%), and Educational Services (77.7%).
| Industry | Male | Female |
| Agriculture, Fishing & Hunting | 387 (85.4%) | 66 (14.6%) |
| Mining, Quarrying, & Extraction | 3 (100.0%) | 0 (0.0%) |
| Construction | 178 (76.1%) | 56 (23.9%) |
| Manufacturing | 125 (60.7%) | 81 (39.3%) |
| Wholesale Trade | 4 (30.8%) | 9 (69.2%) |
| Retail Trade | 147 (52.7%) | 132 (47.3%) |
| Transportation & Warehousing | 101 (65.2%) | 54 (34.8%) |
| Utilities | 0 (0.0%) | 0 (0.0%) |
| Information | 11 (27.5%) | 29 (72.5%) |
| Finance & Insurance | 1 (3.7%) | 26 (96.3%) |
| Real Estate, Rental & Leasing | 79 (60.3%) | 52 (39.7%) |
| Professional & Scientific | 86 (35.5%) | 156 (64.5%) |
| Enterprise Management | 0 (0.0%) | 0 (0.0%) |
| Administrative & Support | 51 (57.3%) | 38 (42.7%) |
| Educational Services | 45 (22.3%) | 157 (77.7%) |
| Health Care & Social Assistance | 60 (13.3%) | 393 (86.8%) |
| Arts, Entertainment & Recreation | 20 (37.0%) | 34 (63.0%) |
| Accommodation & Food Services | 119 (39.9%) | 179 (60.1%) |
| Public Administration | 171 (66.8%) | 85 (33.2%) |
| Total | 1,675 (50.8%) | 1,620 (49.2%) |
Education in Wallowa County
School Enrollment in Wallowa County
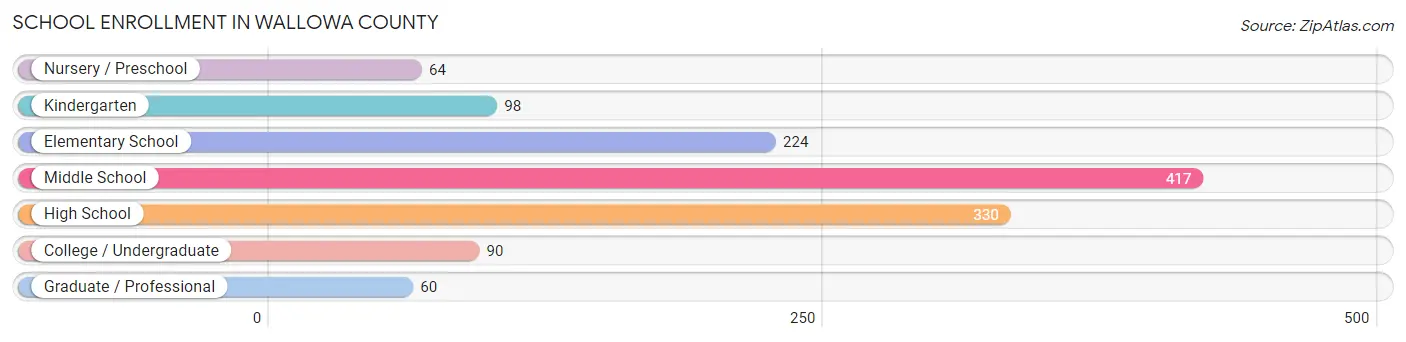
The most common levels of schooling among the 1,283 students in Wallowa County are middle school (417 | 32.5%), high school (330 | 25.7%), and elementary school (224 | 17.5%).
| School Level | # Students | % Students |
| Nursery / Preschool | 64 | 5.0% |
| Kindergarten | 98 | 7.6% |
| Elementary School | 224 | 17.5% |
| Middle School | 417 | 32.5% |
| High School | 330 | 25.7% |
| College / Undergraduate | 90 | 7.0% |
| Graduate / Professional | 60 | 4.7% |
| Total | 1,283 | 100.0% |
School Enrollment by Age by Funding Source in Wallowa County
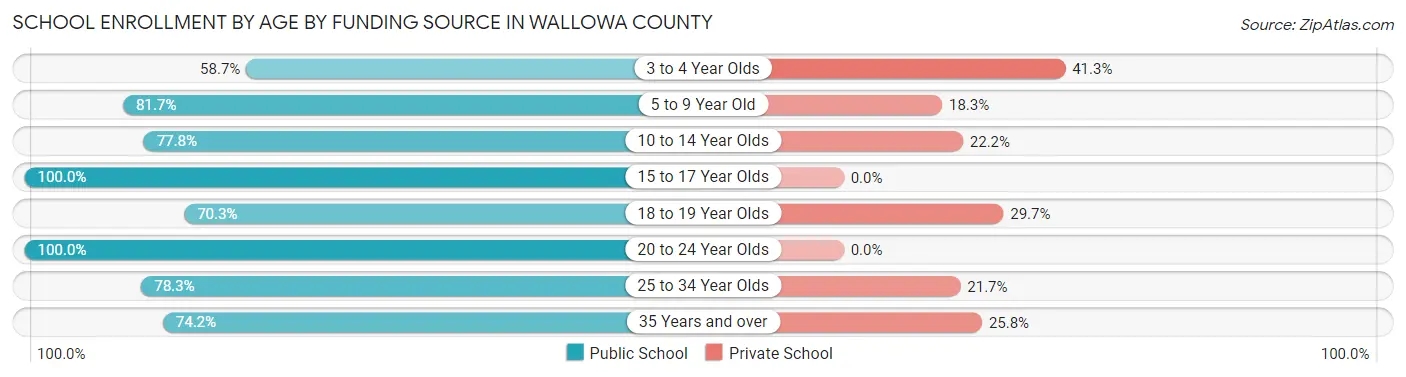
Out of a total of 1,283 students who are enrolled in schools in Wallowa County, 225 (17.5%) attend a private institution, while the remaining 1,058 (82.5%) are enrolled in public schools. The age group of 3 to 4 year olds has the highest likelihood of being enrolled in private schools, with 26 (41.3% in the age bracket) enrolled. Conversely, the age group of 15 to 17 year olds has the lowest likelihood of being enrolled in a private school, with 258 (100.0% in the age bracket) attending a public institution.
| Age Bracket | Public School | Private School |
| 3 to 4 Year Olds | 37 (58.7%) | 26 (41.3%) |
| 5 to 9 Year Old | 254 (81.7%) | 57 (18.3%) |
| 10 to 14 Year Olds | 382 (77.8%) | 109 (22.2%) |
| 15 to 17 Year Olds | 258 (100.0%) | 0 (0.0%) |
| 18 to 19 Year Olds | 26 (70.3%) | 11 (29.7%) |
| 20 to 24 Year Olds | 34 (100.0%) | 0 (0.0%) |
| 25 to 34 Year Olds | 18 (78.3%) | 5 (21.7%) |
| 35 Years and over | 49 (74.2%) | 17 (25.8%) |
| Total | 1,058 (82.5%) | 225 (17.5%) |
Educational Attainment by Field of Study in Wallowa County
Education (350 | 17.4%), bio, nature & agricultural (315 | 15.7%), social sciences (202 | 10.1%), physical & health sciences (154 | 7.7%), and science & technology (154 | 7.7%) are the most common fields of study among 2,007 individuals in Wallowa County who have obtained a bachelor's degree or higher.
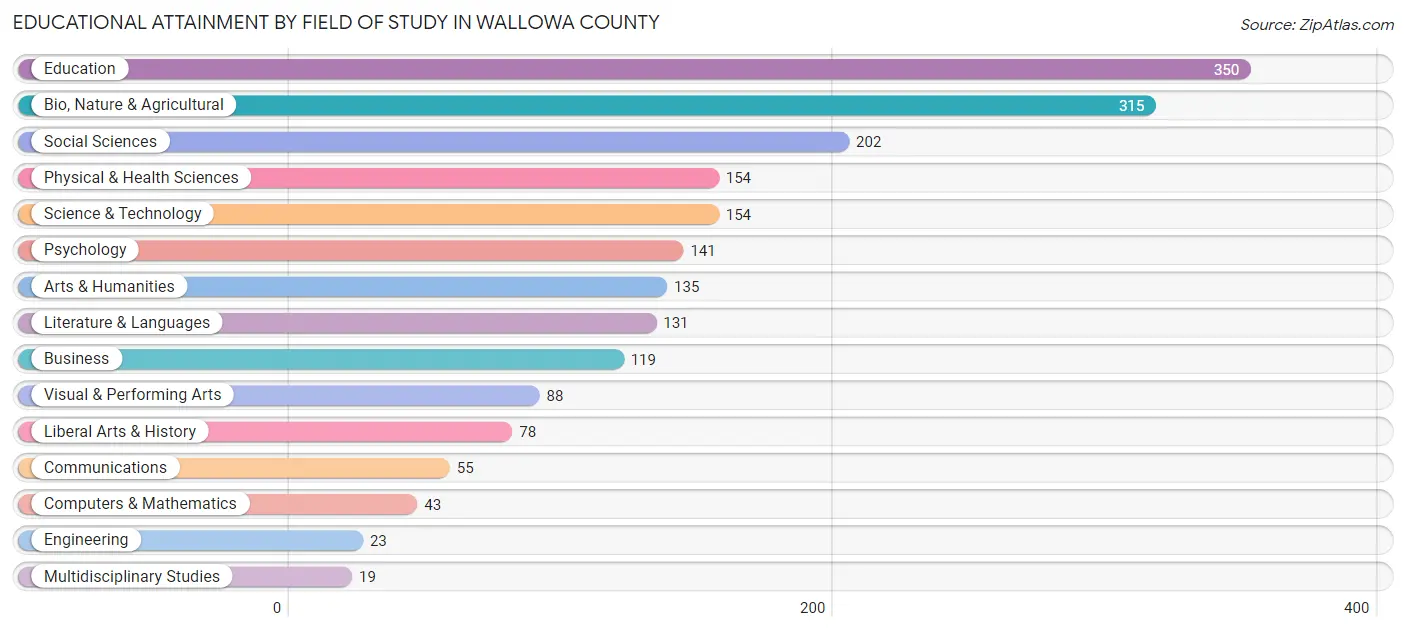
| Field of Study | # Graduates | % Graduates |
| Computers & Mathematics | 43 | 2.1% |
| Bio, Nature & Agricultural | 315 | 15.7% |
| Physical & Health Sciences | 154 | 7.7% |
| Psychology | 141 | 7.0% |
| Social Sciences | 202 | 10.1% |
| Engineering | 23 | 1.1% |
| Multidisciplinary Studies | 19 | 0.9% |
| Science & Technology | 154 | 7.7% |
| Business | 119 | 5.9% |
| Education | 350 | 17.4% |
| Literature & Languages | 131 | 6.5% |
| Liberal Arts & History | 78 | 3.9% |
| Visual & Performing Arts | 88 | 4.4% |
| Communications | 55 | 2.7% |
| Arts & Humanities | 135 | 6.7% |
| Total | 2,007 | 100.0% |
Transportation & Commute in Wallowa County
Vehicle Availability by Sex in Wallowa County
The most prevalent vehicle ownership categories in Wallowa County are males with 2 vehicles (606, accounting for 36.4%) and females with 2 vehicles (542, making up 37.4%).
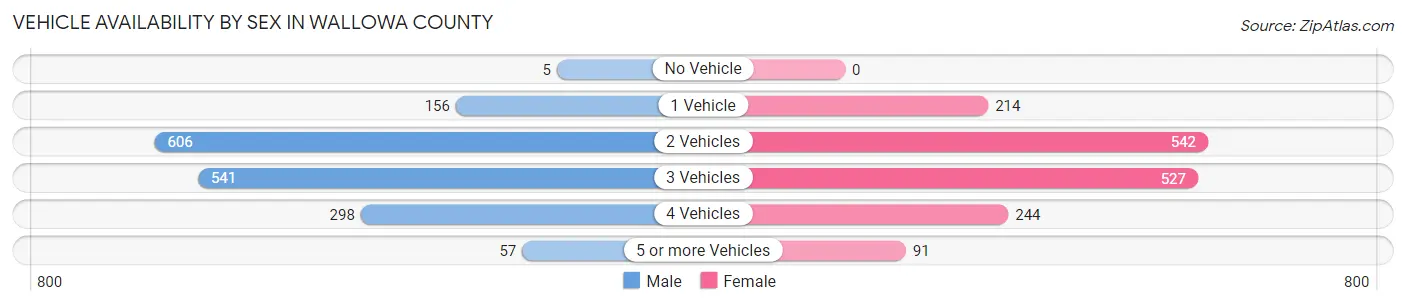
| Vehicles Available | Male | Female |
| No Vehicle | 5 (0.3%) | 0 (0.0%) |
| 1 Vehicle | 156 (9.4%) | 214 (13.2%) |
| 2 Vehicles | 606 (36.4%) | 542 (33.5%) |
| 3 Vehicles | 541 (32.5%) | 527 (32.6%) |
| 4 Vehicles | 298 (17.9%) | 244 (15.1%) |
| 5 or more Vehicles | 57 (3.4%) | 91 (5.6%) |
| Total | 1,663 (100.0%) | 1,618 (100.0%) |
Commute Time in Wallowa County
The most frequently occuring commute durations in Wallowa County are 5 to 9 minutes (680 commuters, 24.7%), 10 to 14 minutes (504 commuters, 18.3%), and less than 5 minutes (451 commuters, 16.4%).
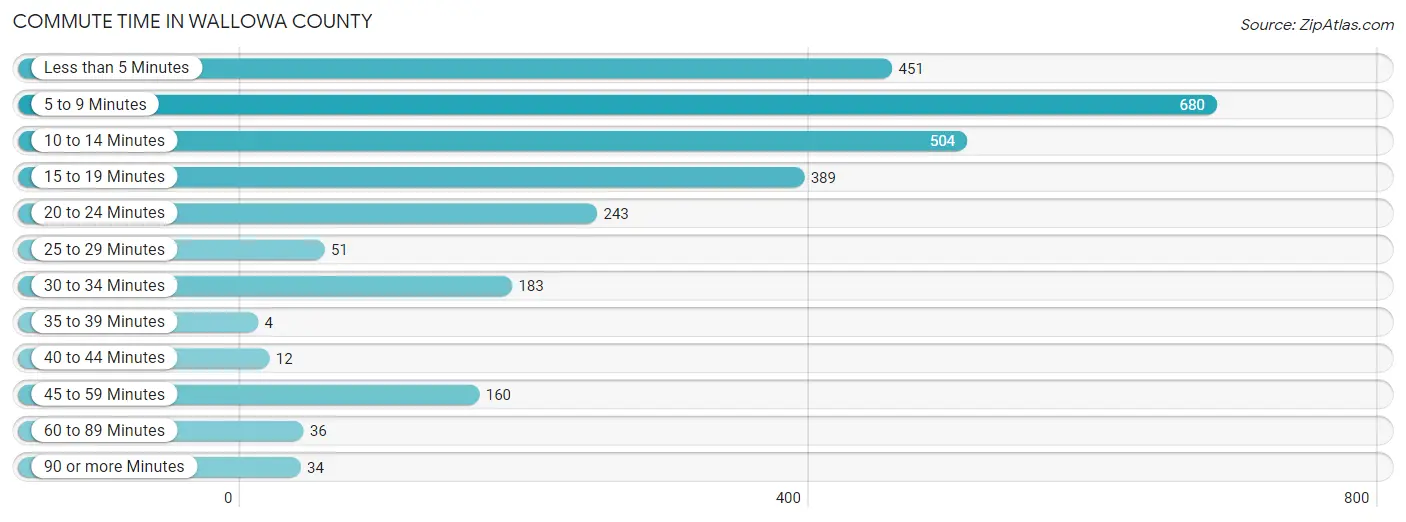
| Commute Time | # Commuters | % Commuters |
| Less than 5 Minutes | 451 | 16.4% |
| 5 to 9 Minutes | 680 | 24.7% |
| 10 to 14 Minutes | 504 | 18.3% |
| 15 to 19 Minutes | 389 | 14.2% |
| 20 to 24 Minutes | 243 | 8.8% |
| 25 to 29 Minutes | 51 | 1.9% |
| 30 to 34 Minutes | 183 | 6.7% |
| 35 to 39 Minutes | 4 | 0.2% |
| 40 to 44 Minutes | 12 | 0.4% |
| 45 to 59 Minutes | 160 | 5.8% |
| 60 to 89 Minutes | 36 | 1.3% |
| 90 or more Minutes | 34 | 1.2% |
Commute Time by Sex in Wallowa County
The most common commute times in Wallowa County are 10 to 14 minutes (280 commuters, 20.5%) for males and 5 to 9 minutes (472 commuters, 34.1%) for females.
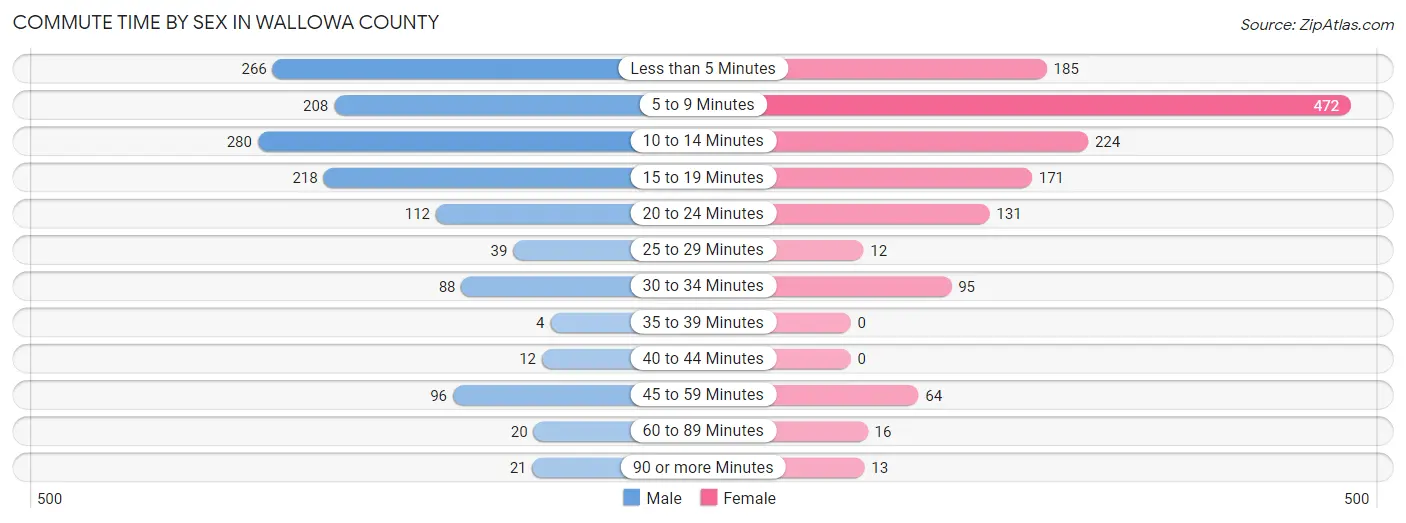
| Commute Time | Male | Female |
| Less than 5 Minutes | 266 (19.5%) | 185 (13.4%) |
| 5 to 9 Minutes | 208 (15.2%) | 472 (34.1%) |
| 10 to 14 Minutes | 280 (20.5%) | 224 (16.2%) |
| 15 to 19 Minutes | 218 (16.0%) | 171 (12.4%) |
| 20 to 24 Minutes | 112 (8.2%) | 131 (9.5%) |
| 25 to 29 Minutes | 39 (2.9%) | 12 (0.9%) |
| 30 to 34 Minutes | 88 (6.5%) | 95 (6.9%) |
| 35 to 39 Minutes | 4 (0.3%) | 0 (0.0%) |
| 40 to 44 Minutes | 12 (0.9%) | 0 (0.0%) |
| 45 to 59 Minutes | 96 (7.0%) | 64 (4.6%) |
| 60 to 89 Minutes | 20 (1.5%) | 16 (1.2%) |
| 90 or more Minutes | 21 (1.5%) | 13 (0.9%) |
Time of Departure to Work by Sex in Wallowa County
The most frequent times of departure to work in Wallowa County are 7:30 AM to 7:59 AM (283, 20.7%) for males and 7:30 AM to 7:59 AM (294, 21.3%) for females.
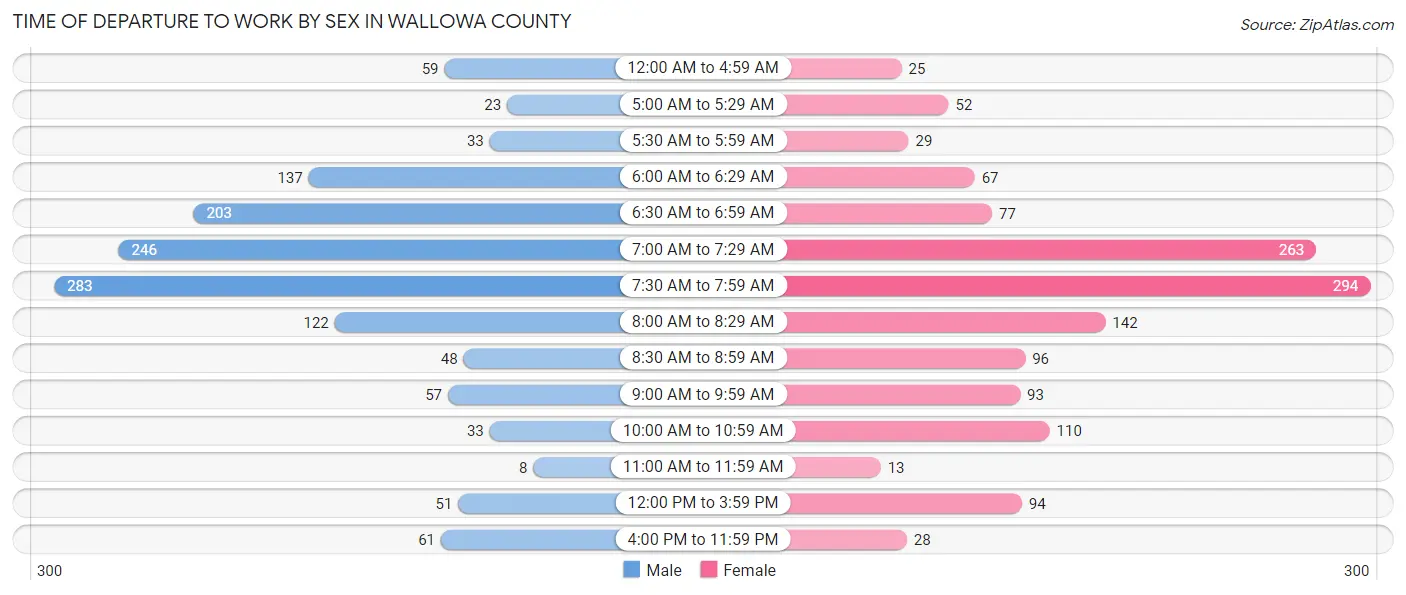
| Time of Departure | Male | Female |
| 12:00 AM to 4:59 AM | 59 (4.3%) | 25 (1.8%) |
| 5:00 AM to 5:29 AM | 23 (1.7%) | 52 (3.8%) |
| 5:30 AM to 5:59 AM | 33 (2.4%) | 29 (2.1%) |
| 6:00 AM to 6:29 AM | 137 (10.0%) | 67 (4.8%) |
| 6:30 AM to 6:59 AM | 203 (14.9%) | 77 (5.6%) |
| 7:00 AM to 7:29 AM | 246 (18.0%) | 263 (19.0%) |
| 7:30 AM to 7:59 AM | 283 (20.7%) | 294 (21.3%) |
| 8:00 AM to 8:29 AM | 122 (8.9%) | 142 (10.3%) |
| 8:30 AM to 8:59 AM | 48 (3.5%) | 96 (6.9%) |
| 9:00 AM to 9:59 AM | 57 (4.2%) | 93 (6.7%) |
| 10:00 AM to 10:59 AM | 33 (2.4%) | 110 (8.0%) |
| 11:00 AM to 11:59 AM | 8 (0.6%) | 13 (0.9%) |
| 12:00 PM to 3:59 PM | 51 (3.7%) | 94 (6.8%) |
| 4:00 PM to 11:59 PM | 61 (4.5%) | 28 (2.0%) |
| Total | 1,364 (100.0%) | 1,383 (100.0%) |
Housing Occupancy in Wallowa County
Occupancy by Ownership in Wallowa County
Of the total 3,271 dwellings in Wallowa County, owner-occupied units account for 2,417 (73.9%), while renter-occupied units make up 854 (26.1%).
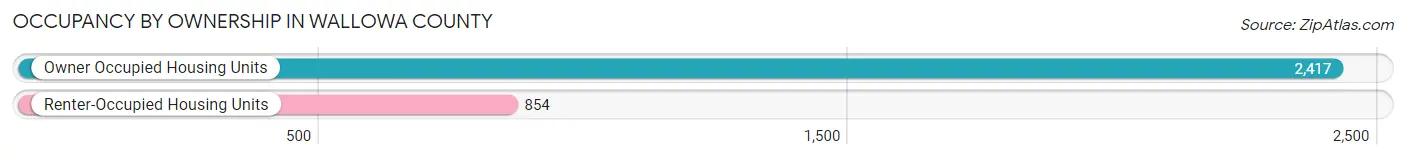
| Occupancy | # Housing Units | % Housing Units |
| Owner Occupied Housing Units | 2,417 | 73.9% |
| Renter-Occupied Housing Units | 854 | 26.1% |
| Total Occupied Housing Units | 3,271 | 100.0% |
Occupancy by Household Size in Wallowa County
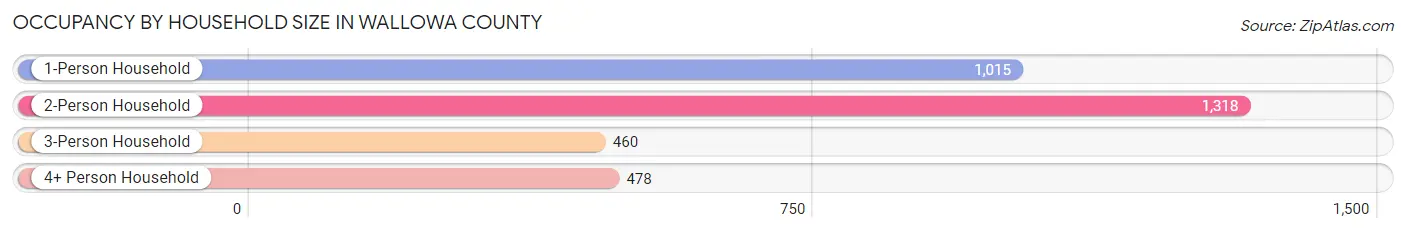
| Household Size | # Housing Units | % Housing Units |
| 1-Person Household | 1,015 | 31.0% |
| 2-Person Household | 1,318 | 40.3% |
| 3-Person Household | 460 | 14.1% |
| 4+ Person Household | 478 | 14.6% |
| Total Housing Units | 3,271 | 100.0% |
Occupancy by Ownership by Household Size in Wallowa County
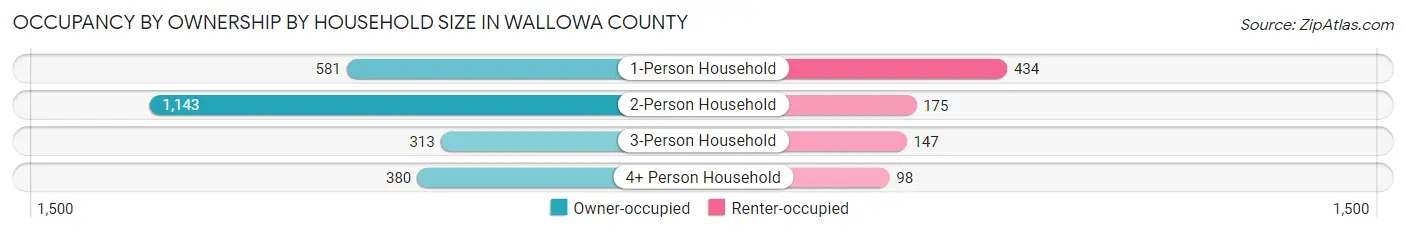
| Household Size | Owner-occupied | Renter-occupied |
| 1-Person Household | 581 (57.2%) | 434 (42.8%) |
| 2-Person Household | 1,143 (86.7%) | 175 (13.3%) |
| 3-Person Household | 313 (68.0%) | 147 (32.0%) |
| 4+ Person Household | 380 (79.5%) | 98 (20.5%) |
| Total Housing Units | 2,417 (73.9%) | 854 (26.1%) |
Occupancy by Educational Attainment in Wallowa County
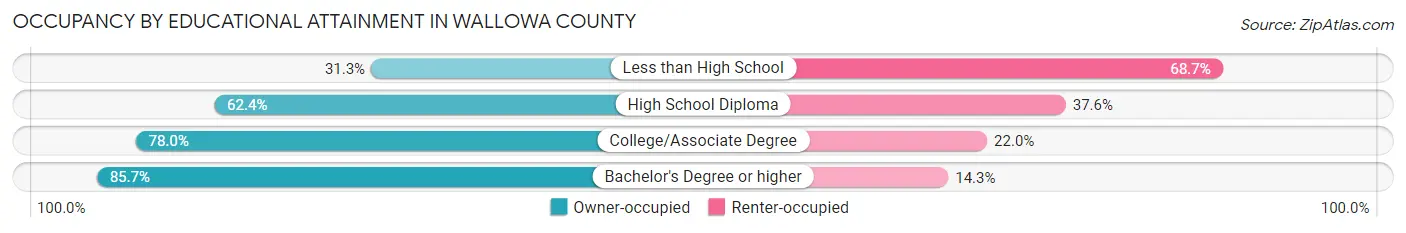
| Household Size | Owner-occupied | Renter-occupied |
| Less than High School | 78 (31.3%) | 171 (68.7%) |
| High School Diploma | 435 (62.4%) | 262 (37.6%) |
| College/Associate Degree | 897 (78.0%) | 253 (22.0%) |
| Bachelor's Degree or higher | 1,007 (85.7%) | 168 (14.3%) |
Occupancy by Age of Householder in Wallowa County
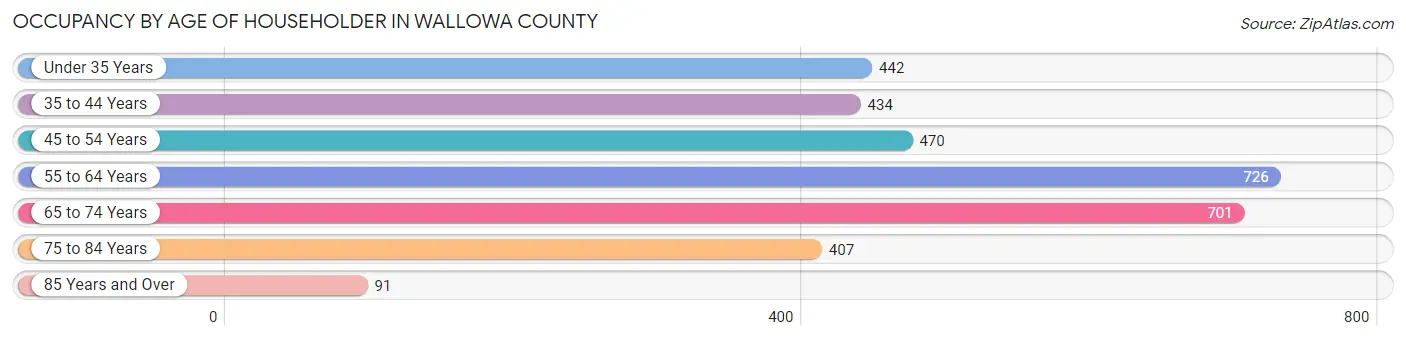
| Age Bracket | # Households | % Households |
| Under 35 Years | 442 | 13.5% |
| 35 to 44 Years | 434 | 13.3% |
| 45 to 54 Years | 470 | 14.4% |
| 55 to 64 Years | 726 | 22.2% |
| 65 to 74 Years | 701 | 21.4% |
| 75 to 84 Years | 407 | 12.4% |
| 85 Years and Over | 91 | 2.8% |
| Total | 3,271 | 100.0% |
Housing Finances in Wallowa County
Median Income by Occupancy in Wallowa County
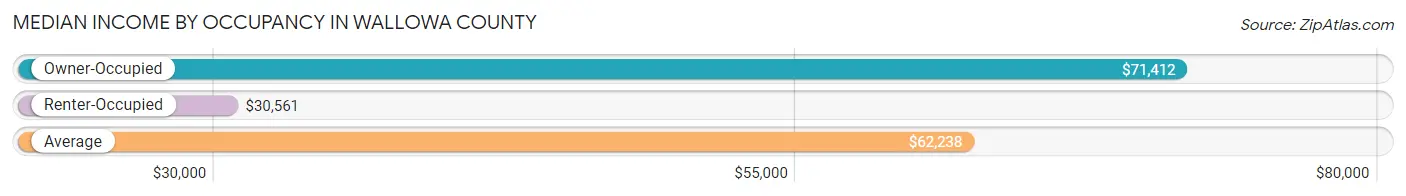
| Occupancy Type | # Households | Median Income |
| Owner-Occupied | 2,417 (73.9%) | $71,412 |
| Renter-Occupied | 854 (26.1%) | $30,561 |
| Average | 3,271 (100.0%) | $62,238 |
Occupancy by Householder Income Bracket in Wallowa County
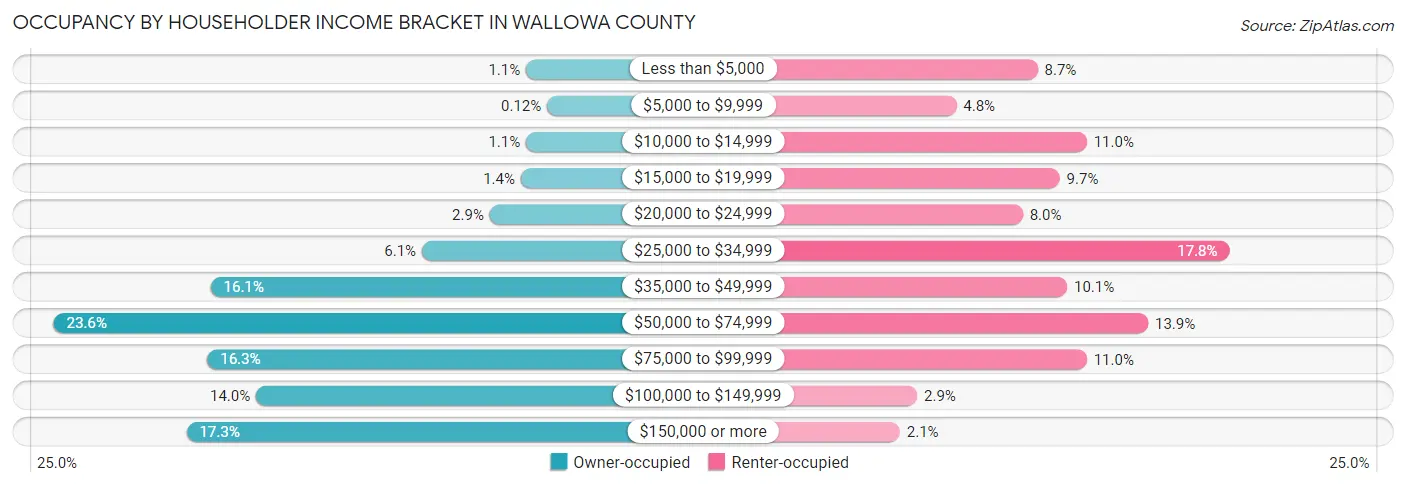
| Income Bracket | Owner-occupied | Renter-occupied |
| Less than $5,000 | 27 (1.1%) | 74 (8.7%) |
| $5,000 to $9,999 | 3 (0.1%) | 41 (4.8%) |
| $10,000 to $14,999 | 27 (1.1%) | 94 (11.0%) |
| $15,000 to $19,999 | 33 (1.4%) | 83 (9.7%) |
| $20,000 to $24,999 | 69 (2.9%) | 68 (8.0%) |
| $25,000 to $34,999 | 147 (6.1%) | 152 (17.8%) |
| $35,000 to $49,999 | 390 (16.1%) | 86 (10.1%) |
| $50,000 to $74,999 | 571 (23.6%) | 119 (13.9%) |
| $75,000 to $99,999 | 394 (16.3%) | 94 (11.0%) |
| $100,000 to $149,999 | 338 (14.0%) | 25 (2.9%) |
| $150,000 or more | 418 (17.3%) | 18 (2.1%) |
| Total | 2,417 (100.0%) | 854 (100.0%) |
Monthly Housing Cost Tiers in Wallowa County
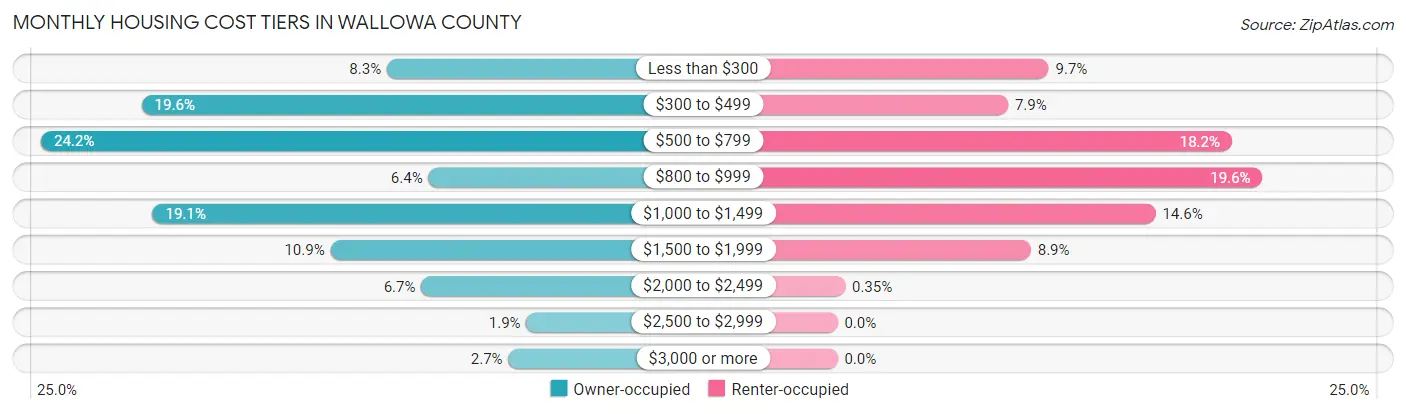
| Monthly Cost | Owner-occupied | Renter-occupied |
| Less than $300 | 201 (8.3%) | 83 (9.7%) |
| $300 to $499 | 474 (19.6%) | 67 (7.9%) |
| $500 to $799 | 586 (24.2%) | 155 (18.1%) |
| $800 to $999 | 155 (6.4%) | 167 (19.6%) |
| $1,000 to $1,499 | 462 (19.1%) | 125 (14.6%) |
| $1,500 to $1,999 | 264 (10.9%) | 76 (8.9%) |
| $2,000 to $2,499 | 163 (6.7%) | 3 (0.4%) |
| $2,500 to $2,999 | 46 (1.9%) | 0 (0.0%) |
| $3,000 or more | 66 (2.7%) | 0 (0.0%) |
| Total | 2,417 (100.0%) | 854 (100.0%) |
Physical Housing Characteristics in Wallowa County
Housing Structures in Wallowa County
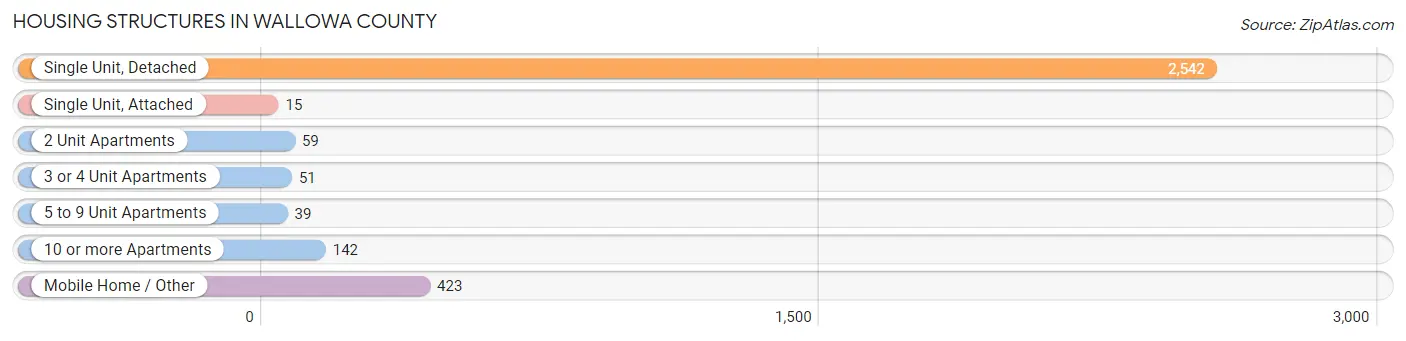
| Structure Type | # Housing Units | % Housing Units |
| Single Unit, Detached | 2,542 | 77.7% |
| Single Unit, Attached | 15 | 0.5% |
| 2 Unit Apartments | 59 | 1.8% |
| 3 or 4 Unit Apartments | 51 | 1.6% |
| 5 to 9 Unit Apartments | 39 | 1.2% |
| 10 or more Apartments | 142 | 4.3% |
| Mobile Home / Other | 423 | 12.9% |
| Total | 3,271 | 100.0% |
Housing Structures by Occupancy in Wallowa County
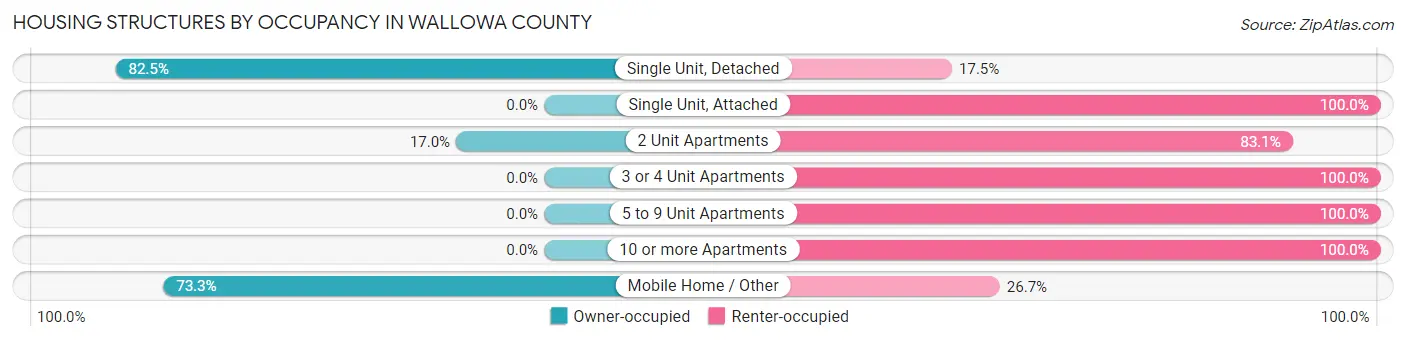
| Structure Type | Owner-occupied | Renter-occupied |
| Single Unit, Detached | 2,097 (82.5%) | 445 (17.5%) |
| Single Unit, Attached | 0 (0.0%) | 15 (100.0%) |
| 2 Unit Apartments | 10 (17.0%) | 49 (83.1%) |
| 3 or 4 Unit Apartments | 0 (0.0%) | 51 (100.0%) |
| 5 to 9 Unit Apartments | 0 (0.0%) | 39 (100.0%) |
| 10 or more Apartments | 0 (0.0%) | 142 (100.0%) |
| Mobile Home / Other | 310 (73.3%) | 113 (26.7%) |
| Total | 2,417 (73.9%) | 854 (26.1%) |
Housing Structures by Number of Rooms in Wallowa County
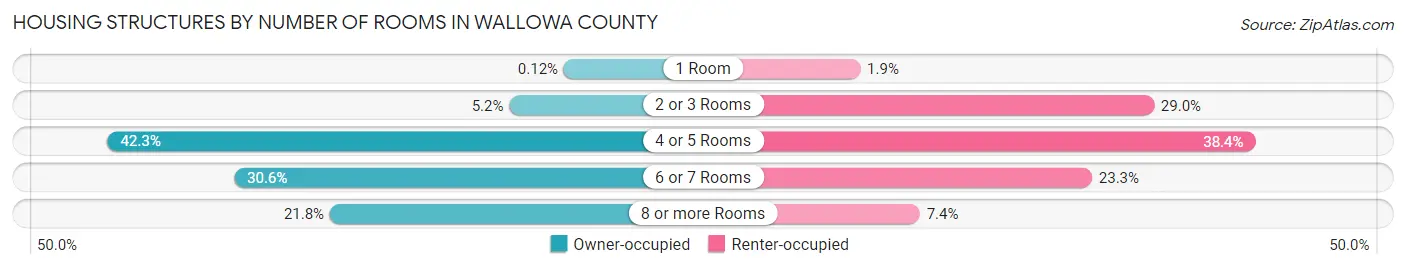
| Number of Rooms | Owner-occupied | Renter-occupied |
| 1 Room | 3 (0.1%) | 16 (1.9%) |
| 2 or 3 Rooms | 125 (5.2%) | 248 (29.0%) |
| 4 or 5 Rooms | 1,023 (42.3%) | 328 (38.4%) |
| 6 or 7 Rooms | 740 (30.6%) | 199 (23.3%) |
| 8 or more Rooms | 526 (21.8%) | 63 (7.4%) |
| Total | 2,417 (100.0%) | 854 (100.0%) |
Housing Structure by Heating Type in Wallowa County
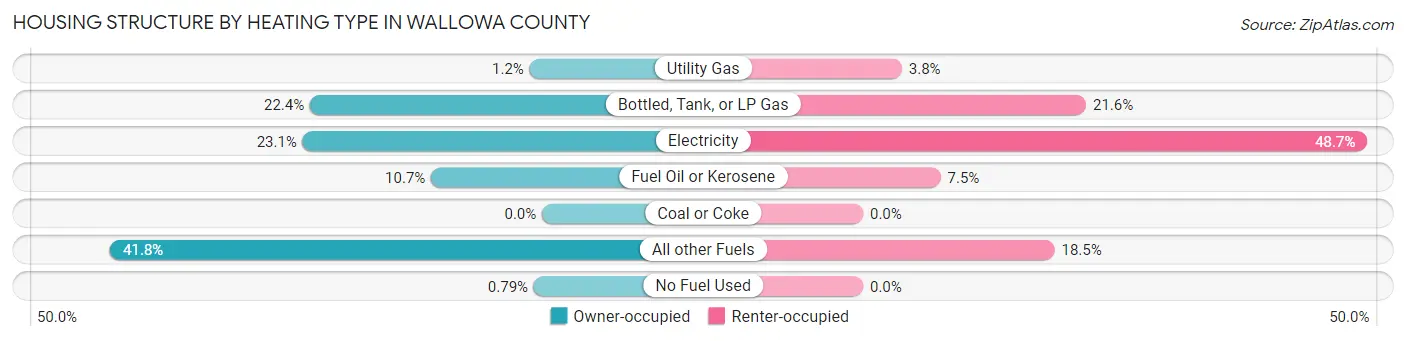
| Heating Type | Owner-occupied | Renter-occupied |
| Utility Gas | 29 (1.2%) | 32 (3.7%) |
| Bottled, Tank, or LP Gas | 542 (22.4%) | 184 (21.5%) |
| Electricity | 559 (23.1%) | 416 (48.7%) |
| Fuel Oil or Kerosene | 259 (10.7%) | 64 (7.5%) |
| Coal or Coke | 0 (0.0%) | 0 (0.0%) |
| All other Fuels | 1,009 (41.7%) | 158 (18.5%) |
| No Fuel Used | 19 (0.8%) | 0 (0.0%) |
| Total | 2,417 (100.0%) | 854 (100.0%) |
Household Vehicle Usage in Wallowa County
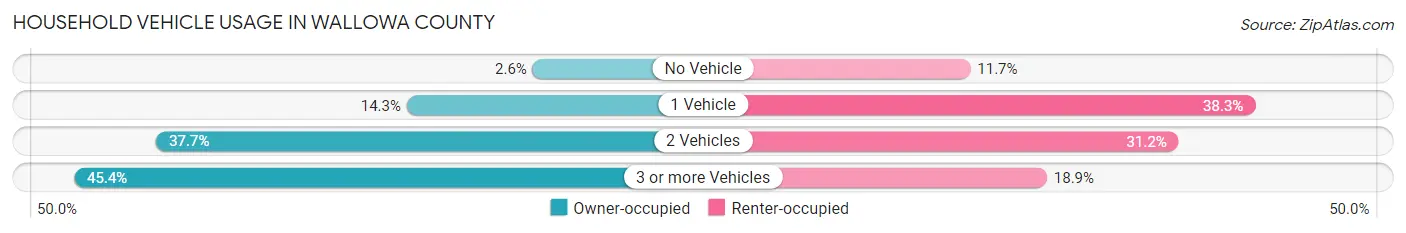
| Vehicles per Household | Owner-occupied | Renter-occupied |
| No Vehicle | 62 (2.6%) | 100 (11.7%) |
| 1 Vehicle | 346 (14.3%) | 327 (38.3%) |
| 2 Vehicles | 912 (37.7%) | 266 (31.1%) |
| 3 or more Vehicles | 1,097 (45.4%) | 161 (18.9%) |
| Total | 2,417 (100.0%) | 854 (100.0%) |
Real Estate & Mortgages in Wallowa County
Real Estate and Mortgage Overview in Wallowa County
| Characteristic | Without Mortgage | With Mortgage |
| Housing Units | 1,354 | 1,063 |
| Median Property Value | $353,100 | $313,600 |
| Median Household Income | $65,035 | $223 |
| Monthly Housing Costs | $505 | $61 |
| Real Estate Taxes | $2,195 | $6 |
Property Value by Mortgage Status in Wallowa County
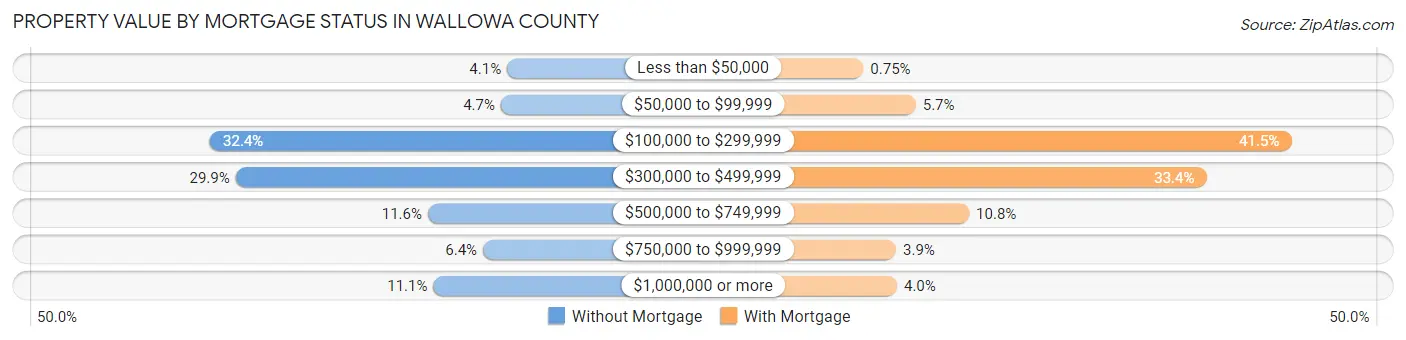
| Property Value | Without Mortgage | With Mortgage |
| Less than $50,000 | 55 (4.1%) | 8 (0.7%) |
| $50,000 to $99,999 | 63 (4.6%) | 61 (5.7%) |
| $100,000 to $299,999 | 438 (32.4%) | 441 (41.5%) |
| $300,000 to $499,999 | 405 (29.9%) | 355 (33.4%) |
| $500,000 to $749,999 | 157 (11.6%) | 115 (10.8%) |
| $750,000 to $999,999 | 86 (6.4%) | 41 (3.9%) |
| $1,000,000 or more | 150 (11.1%) | 42 (4.0%) |
| Total | 1,354 (100.0%) | 1,063 (100.0%) |
Household Income by Mortgage Status in Wallowa County
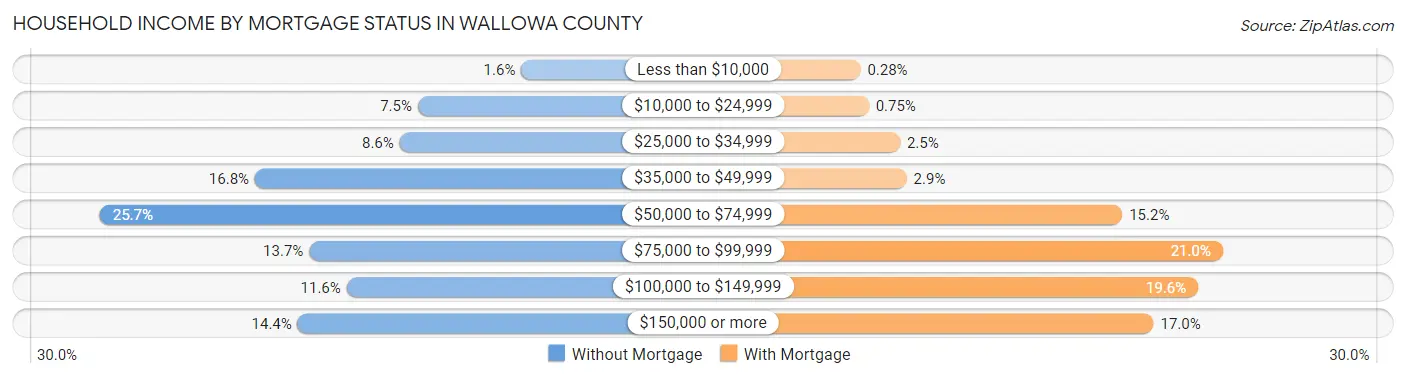
| Household Income | Without Mortgage | With Mortgage |
| Less than $10,000 | 22 (1.6%) | 3 (0.3%) |
| $10,000 to $24,999 | 102 (7.5%) | 8 (0.7%) |
| $25,000 to $34,999 | 116 (8.6%) | 27 (2.5%) |
| $35,000 to $49,999 | 228 (16.8%) | 31 (2.9%) |
| $50,000 to $74,999 | 348 (25.7%) | 162 (15.2%) |
| $75,000 to $99,999 | 186 (13.7%) | 223 (21.0%) |
| $100,000 to $149,999 | 157 (11.6%) | 208 (19.6%) |
| $150,000 or more | 195 (14.4%) | 181 (17.0%) |
| Total | 1,354 (100.0%) | 1,063 (100.0%) |
Property Value to Household Income Ratio in Wallowa County
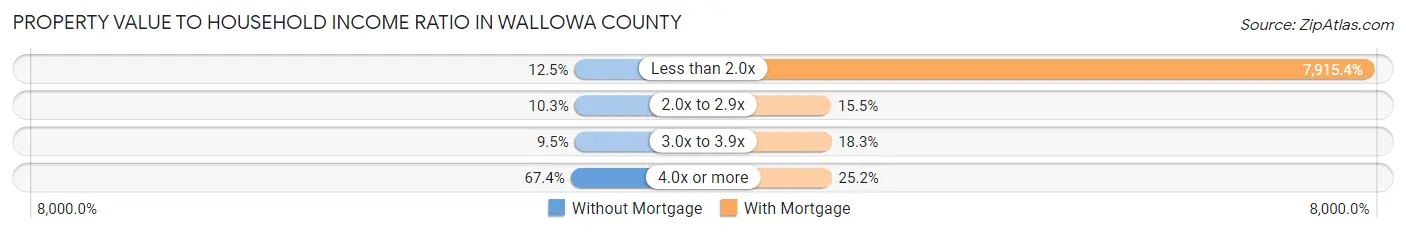
| Value-to-Income Ratio | Without Mortgage | With Mortgage |
| Less than 2.0x | 169 (12.5%) | 84,141 (7,915.4%) |
| 2.0x to 2.9x | 139 (10.3%) | 165 (15.5%) |
| 3.0x to 3.9x | 129 (9.5%) | 194 (18.2%) |
| 4.0x or more | 913 (67.4%) | 268 (25.2%) |
| Total | 1,354 (100.0%) | 1,063 (100.0%) |
Real Estate Taxes by Mortgage Status in Wallowa County
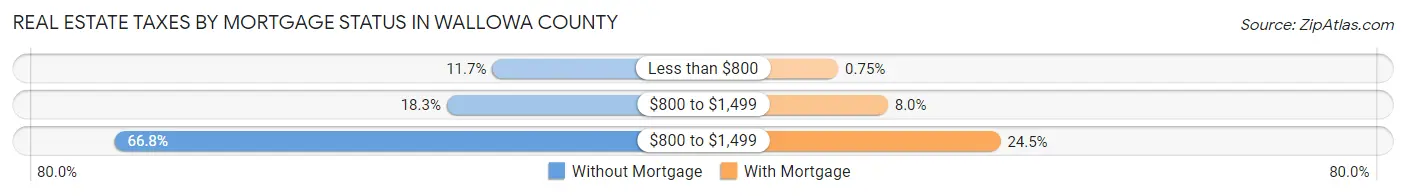
| Property Taxes | Without Mortgage | With Mortgage |
| Less than $800 | 158 (11.7%) | 8 (0.7%) |
| $800 to $1,499 | 248 (18.3%) | 85 (8.0%) |
| $800 to $1,499 | 905 (66.8%) | 260 (24.5%) |
| Total | 1,354 (100.0%) | 1,063 (100.0%) |
Health & Disability in Wallowa County
Health Insurance Coverage by Age in Wallowa County
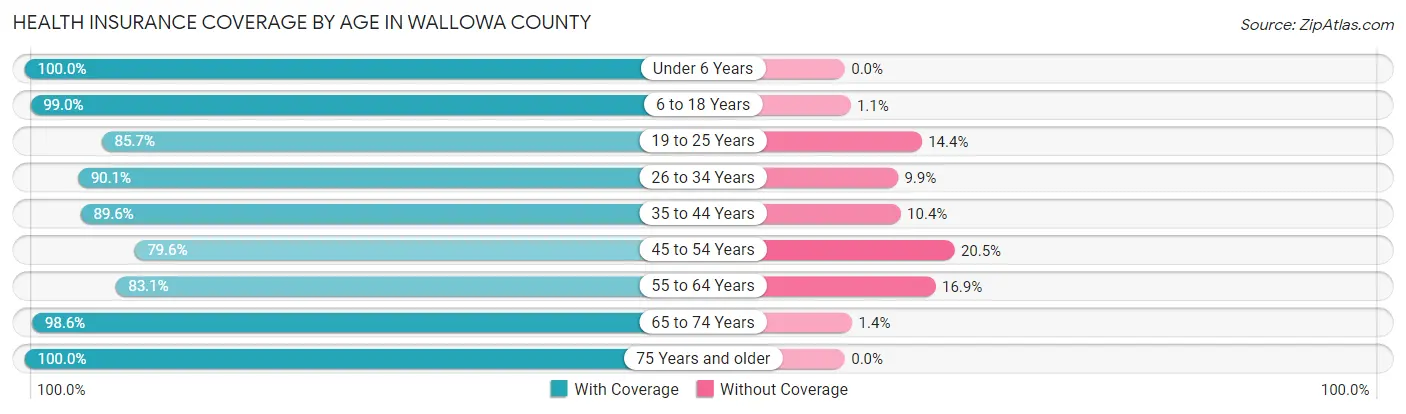
| Age Bracket | With Coverage | Without Coverage |
| Under 6 Years | 432 (100.0%) | 0 (0.0%) |
| 6 to 18 Years | 1,036 (99.0%) | 11 (1.1%) |
| 19 to 25 Years | 370 (85.7%) | 62 (14.3%) |
| 26 to 34 Years | 509 (90.1%) | 56 (9.9%) |
| 35 to 44 Years | 748 (89.6%) | 87 (10.4%) |
| 45 to 54 Years | 607 (79.5%) | 156 (20.4%) |
| 55 to 64 Years | 1,002 (83.1%) | 204 (16.9%) |
| 65 to 74 Years | 1,227 (98.6%) | 17 (1.4%) |
| 75 Years and older | 835 (100.0%) | 0 (0.0%) |
| Total | 6,766 (91.9%) | 593 (8.1%) |
Health Insurance Coverage by Citizenship Status in Wallowa County
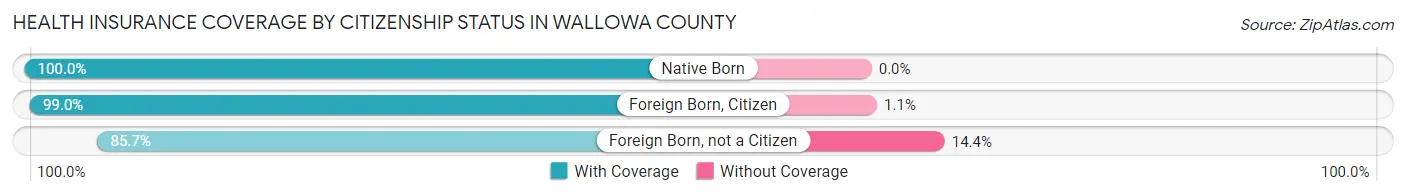
| Citizenship Status | With Coverage | Without Coverage |
| Native Born | 432 (100.0%) | 0 (0.0%) |
| Foreign Born, Citizen | 1,036 (99.0%) | 11 (1.1%) |
| Foreign Born, not a Citizen | 370 (85.7%) | 62 (14.3%) |
Health Insurance Coverage by Household Income in Wallowa County
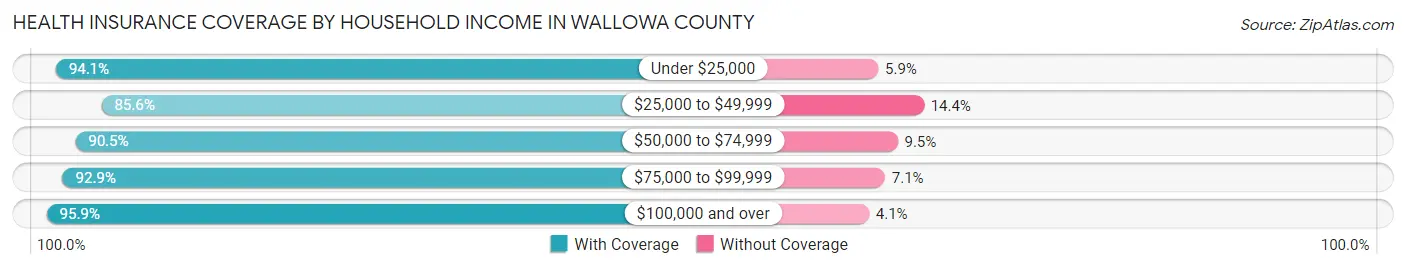
| Household Income | With Coverage | Without Coverage |
| Under $25,000 | 707 (94.1%) | 44 (5.9%) |
| $25,000 to $49,999 | 1,301 (85.6%) | 219 (14.4%) |
| $50,000 to $74,999 | 1,475 (90.5%) | 155 (9.5%) |
| $75,000 to $99,999 | 1,055 (92.9%) | 81 (7.1%) |
| $100,000 and over | 2,183 (95.9%) | 94 (4.1%) |
Public vs Private Health Insurance Coverage by Age in Wallowa County
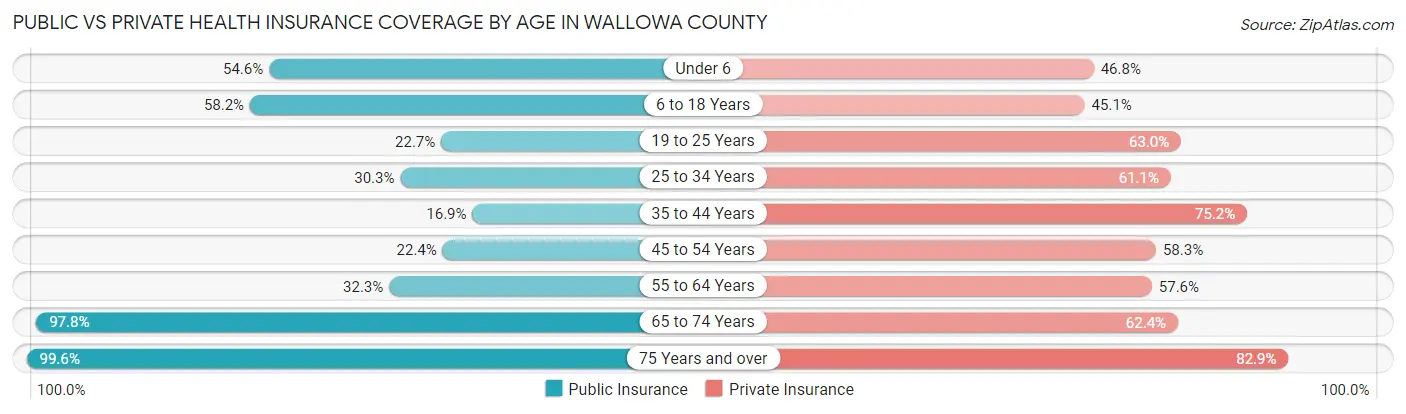
| Age Bracket | Public Insurance | Private Insurance |
| Under 6 | 236 (54.6%) | 202 (46.8%) |
| 6 to 18 Years | 609 (58.2%) | 472 (45.1%) |
| 19 to 25 Years | 98 (22.7%) | 272 (63.0%) |
| 25 to 34 Years | 171 (30.3%) | 345 (61.1%) |
| 35 to 44 Years | 141 (16.9%) | 628 (75.2%) |
| 45 to 54 Years | 171 (22.4%) | 445 (58.3%) |
| 55 to 64 Years | 390 (32.3%) | 694 (57.6%) |
| 65 to 74 Years | 1,217 (97.8%) | 776 (62.4%) |
| 75 Years and over | 832 (99.6%) | 692 (82.9%) |
| Total | 3,865 (52.5%) | 4,526 (61.5%) |
Disability Status by Sex by Age in Wallowa County
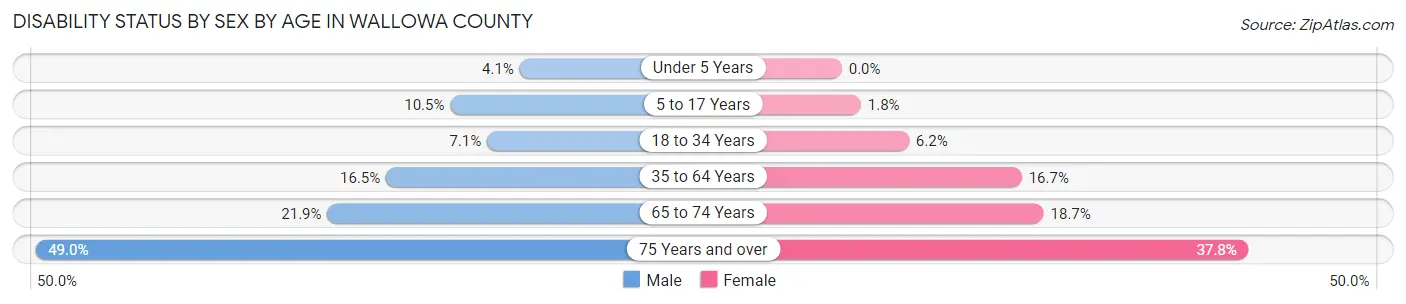
| Age Bracket | Male | Female |
| Under 5 Years | 6 (4.1%) | 0 (0.0%) |
| 5 to 17 Years | 66 (10.5%) | 8 (1.8%) |
| 18 to 34 Years | 34 (7.1%) | 34 (6.2%) |
| 35 to 64 Years | 220 (16.5%) | 245 (16.7%) |
| 65 to 74 Years | 138 (21.9%) | 115 (18.7%) |
| 75 Years and over | 199 (49.0%) | 162 (37.8%) |
Disability Class by Sex by Age in Wallowa County
Disability Class: Hearing Difficulty
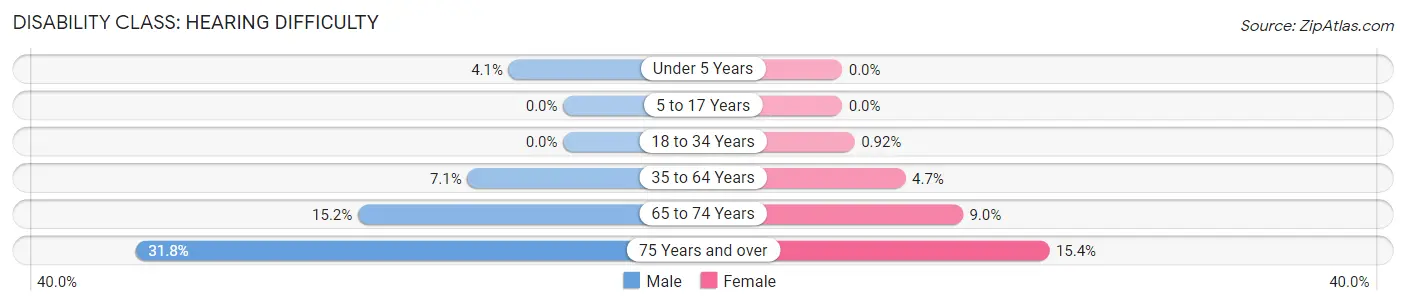
| Age Bracket | Male | Female |
| Under 5 Years | 6 (4.1%) | 0 (0.0%) |
| 5 to 17 Years | 0 (0.0%) | 0 (0.0%) |
| 18 to 34 Years | 0 (0.0%) | 5 (0.9%) |
| 35 to 64 Years | 95 (7.1%) | 69 (4.7%) |
| 65 to 74 Years | 96 (15.2%) | 55 (9.0%) |
| 75 Years and over | 129 (31.8%) | 66 (15.4%) |
Disability Class: Vision Difficulty
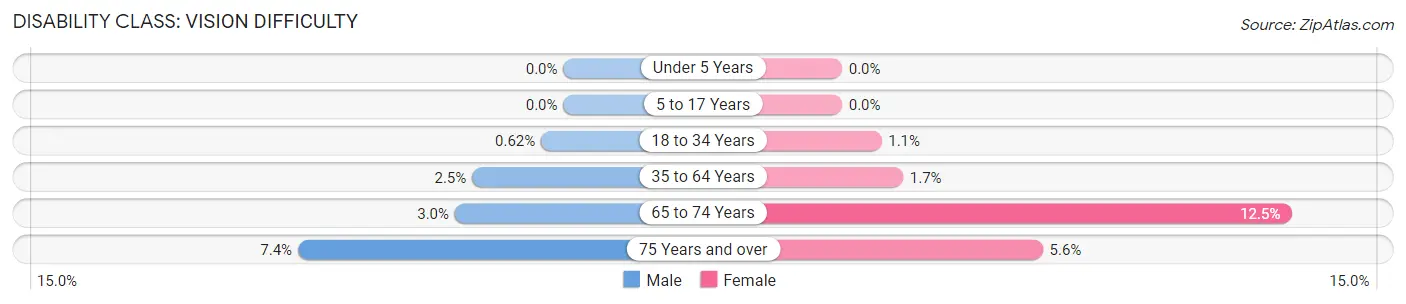
| Age Bracket | Male | Female |
| Under 5 Years | 0 (0.0%) | 0 (0.0%) |
| 5 to 17 Years | 0 (0.0%) | 0 (0.0%) |
| 18 to 34 Years | 3 (0.6%) | 6 (1.1%) |
| 35 to 64 Years | 34 (2.5%) | 25 (1.7%) |
| 65 to 74 Years | 19 (3.0%) | 77 (12.5%) |
| 75 Years and over | 30 (7.4%) | 24 (5.6%) |
Disability Class: Cognitive Difficulty
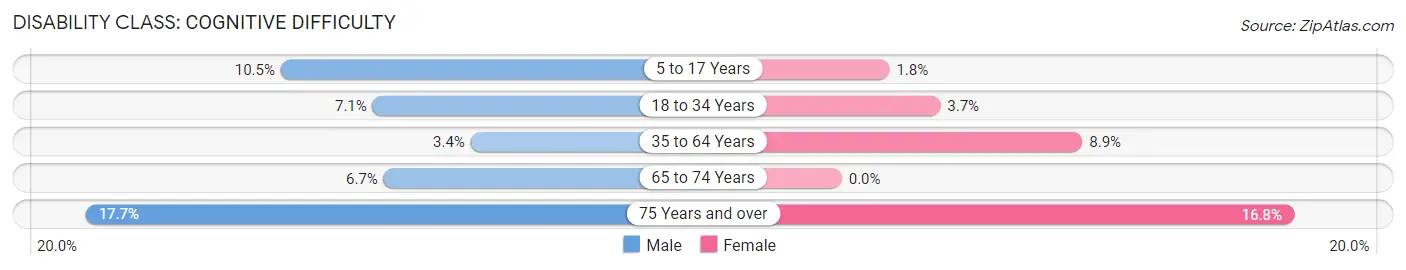
| Age Bracket | Male | Female |
| 5 to 17 Years | 66 (10.5%) | 8 (1.8%) |
| 18 to 34 Years | 34 (7.1%) | 20 (3.7%) |
| 35 to 64 Years | 46 (3.4%) | 131 (8.9%) |
| 65 to 74 Years | 42 (6.7%) | 0 (0.0%) |
| 75 Years and over | 72 (17.7%) | 72 (16.8%) |
Disability Class: Ambulatory Difficulty
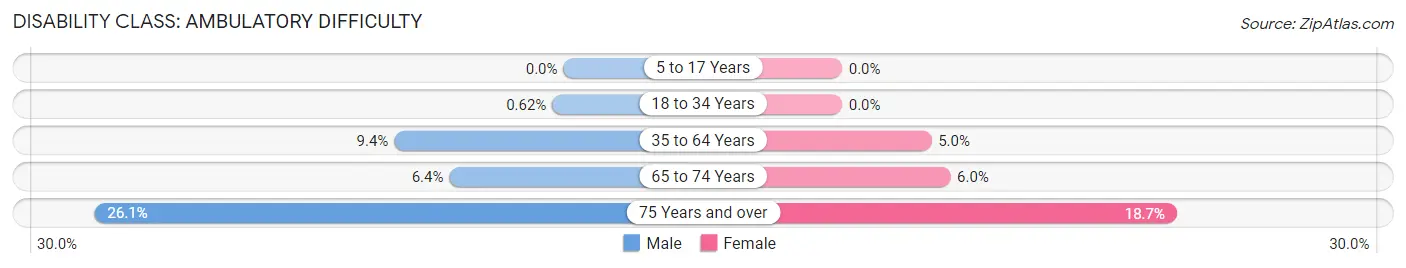
| Age Bracket | Male | Female |
| 5 to 17 Years | 0 (0.0%) | 0 (0.0%) |
| 18 to 34 Years | 3 (0.6%) | 0 (0.0%) |
| 35 to 64 Years | 126 (9.4%) | 73 (5.0%) |
| 65 to 74 Years | 40 (6.4%) | 37 (6.0%) |
| 75 Years and over | 106 (26.1%) | 80 (18.6%) |
Disability Class: Self-Care Difficulty
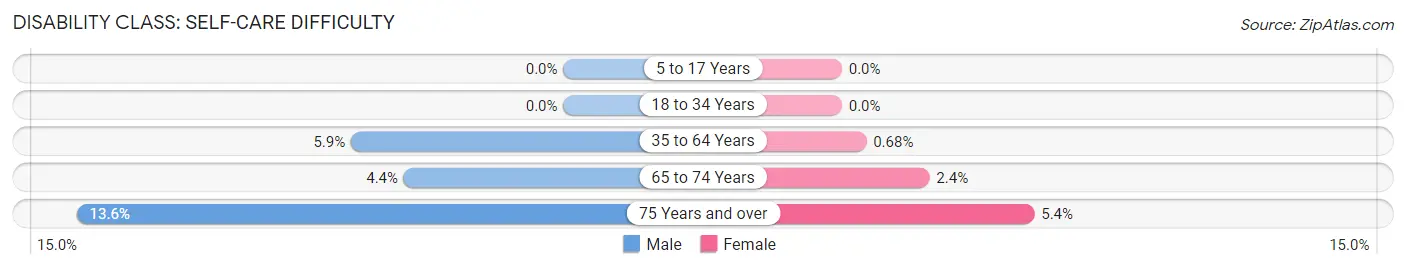
| Age Bracket | Male | Female |
| 5 to 17 Years | 0 (0.0%) | 0 (0.0%) |
| 18 to 34 Years | 0 (0.0%) | 0 (0.0%) |
| 35 to 64 Years | 79 (5.9%) | 10 (0.7%) |
| 65 to 74 Years | 28 (4.4%) | 15 (2.4%) |
| 75 Years and over | 55 (13.6%) | 23 (5.4%) |
Technology Access in Wallowa County
Computing Device Access in Wallowa County
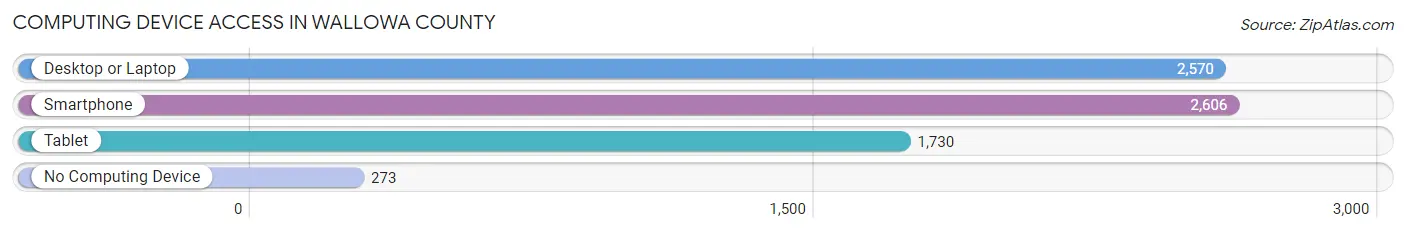
| Device Type | # Households | % Households |
| Desktop or Laptop | 2,570 | 78.6% |
| Smartphone | 2,606 | 79.7% |
| Tablet | 1,730 | 52.9% |
| No Computing Device | 273 | 8.4% |
| Total | 3,271 | 100.0% |
Internet Access in Wallowa County
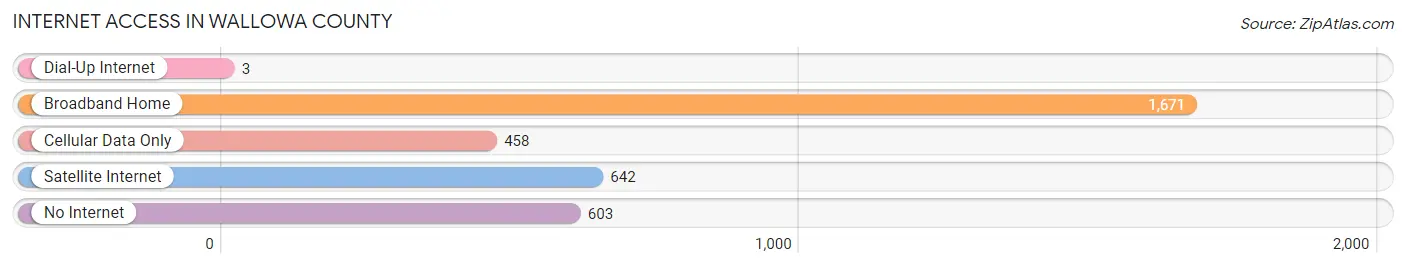
| Internet Type | # Households | % Households |
| Dial-Up Internet | 3 | 0.1% |
| Broadband Home | 1,671 | 51.1% |
| Cellular Data Only | 458 | 14.0% |
| Satellite Internet | 642 | 19.6% |
| No Internet | 603 | 18.4% |
| Total | 3,271 | 100.0% |
Wallowa County Summary
Wallowa County is located in the northeast corner of Oregon, and is bordered by the states of Washington and Idaho. It is part of the Blue Mountains region of the state, and is home to the Wallowa Mountains, which are part of the larger Wallowa-Whitman National Forest. The county seat is Enterprise, and the largest city is Joseph. The county has a total area of 2,225 square miles, and a population of 7,008 as of the 2010 census.
History
The area that is now Wallowa County was originally inhabited by the Nez Perce, Cayuse, and Walla Walla tribes. The first white settlers arrived in the area in the early 1860s, and the county was officially established in 1887. The county was named after the Wallowa River, which was named by the Nez Perce for the many salmon that swam in its waters.
The county was largely agricultural in its early years, with wheat, oats, and barley being the main crops. Cattle ranching was also popular, and the county was home to several large ranches. In the early 1900s, the county began to develop its timber industry, and by the 1950s, it was the largest timber producer in the state.
Geography
Wallowa County is located in the northeast corner of Oregon, and is bordered by the states of Washington and Idaho. It is part of the Blue Mountains region of the state, and is home to the Wallowa Mountains, which are part of the larger Wallowa-Whitman National Forest. The county has a total area of 2,225 square miles, and is mostly mountainous, with the Wallowa Mountains dominating the landscape. The highest point in the county is the summit of Sacajawea Peak, which rises to an elevation of 9,838 feet.
Economy
The economy of Wallowa County is largely based on agriculture, timber, and tourism. Agriculture is the largest sector of the economy, with wheat, oats, barley, and hay being the main crops. Cattle ranching is also popular, and the county is home to several large ranches.
The timber industry is also important to the economy, and the county is home to several large sawmills. Tourism is also an important part of the economy, with the county being home to several popular outdoor recreation areas, including the Wallowa-Whitman National Forest, Hells Canyon National Recreation Area, and the Eagle Cap Wilderness.
Demographics
As of the 2010 census, there were 7,008 people, 2,845 households, and 1,945 families living in Wallowa County. The population density was 3.1 people per square mile. The racial makeup of the county was 94.3% White, 0.3% African American, 1.2% Native American, 0.3% Asian, 0.1% Pacific Islander, 1.2% from other races, and 2.6% from two or more races. Hispanic or Latino of any race were 4.2% of the population.
The median income for a household in the county was $35,938, and the median income for a family was $41,944. The per capita income for the county was $17,945. About 13.2% of families and 17.2% of the population were below the poverty line, including 22.2% of those under age 18 and 8.2% of those age 65 or over.
Common Questions
What is the Total Population of Wallowa County?
Total Population of Wallowa County is 7,439.
What is the Total Male Population of Wallowa County?
Total Male Population of Wallowa County is 3,673.
What is the Total Female Population of Wallowa County?
Total Female Population of Wallowa County is 3,766.
What is the Ratio of Males per 100 Females in Wallowa County?
There are 97.53 Males per 100 Females in Wallowa County.
What is the Ratio of Females per 100 Males in Wallowa County?
There are 102.53 Females per 100 Males in Wallowa County.
What is the Median Population Age in Wallowa County?
Median Population Age in Wallowa County is 50.9 Years.
What is the Average Family Size in Wallowa County
Average Family Size in Wallowa County is 2.8 People.
What is the Average Household Size in Wallowa County
Average Household Size in Wallowa County is 2.2 People.
What is Per Capita Income in Wallowa County?
Per Capita income in Wallowa County is $37,378.
What is the Median Family Income in Wallowa County?
Median Family Income in Wallowa County is $76,023.
What is the Median Household income in Wallowa County?
Median Household Income in Wallowa County is $62,238.
What is Income or Wage Gap in Wallowa County?
Income or Wage Gap in Wallowa County is 24.5%.
Women in Wallowa County earn 75.5 cents for every dollar earned by a man.
What is Inequality or Gini Index in Wallowa County?
Inequality or Gini Index in Wallowa County is 0.46.
How Large is the Labor Force in Wallowa County?
There are 3,504 People in the Labor Forcein in Wallowa County.
What is the Percentage of People in the Labor Force in Wallowa County?
57.1% of People are in the Labor Force in Wallowa County.
What is the Unemployment Rate in Wallowa County?
Unemployment Rate in Wallowa County is 6.0%.