Umatilla County, OR
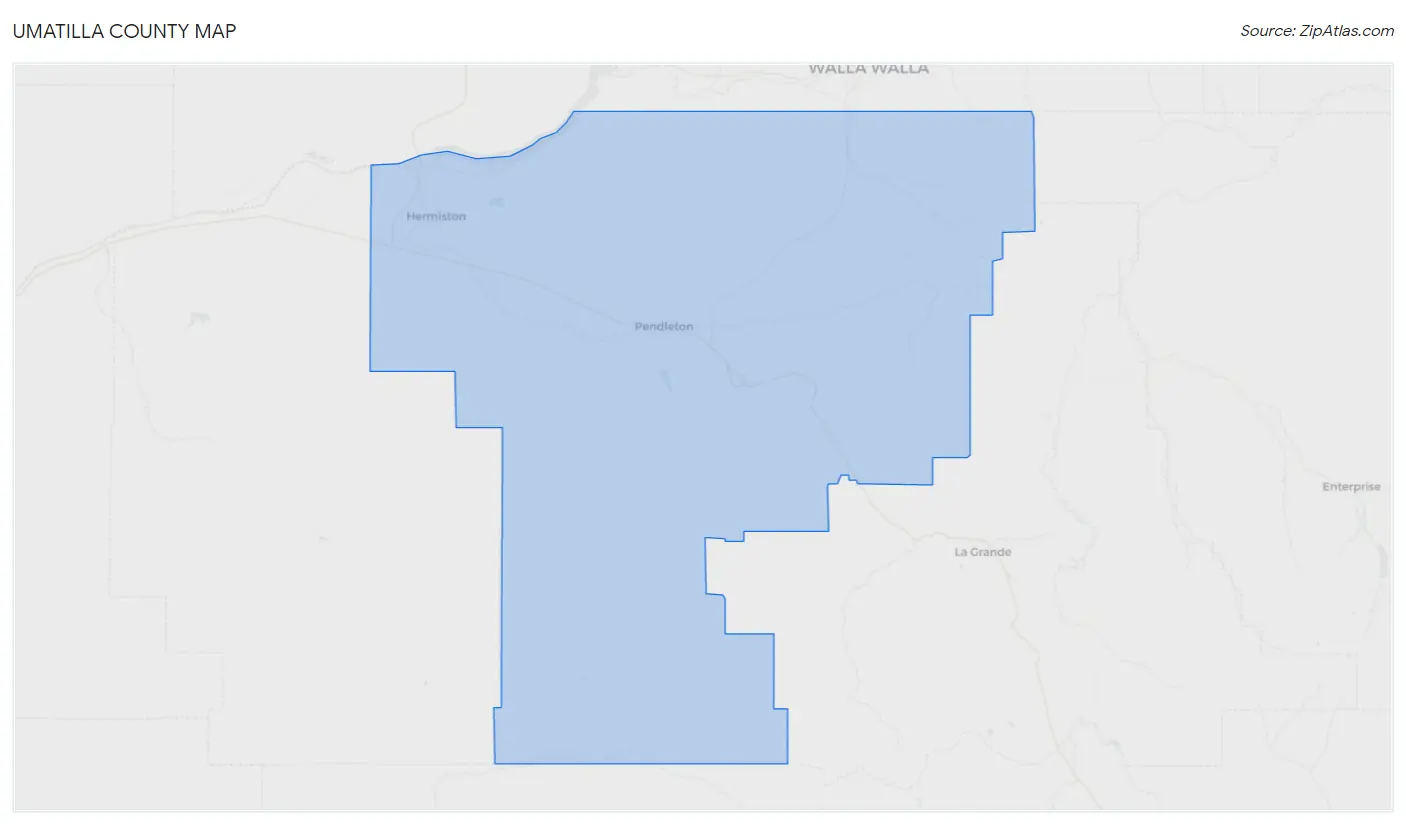
Umatilla County Map
Umatilla County Overview
79,904
TOTAL POPULATION
41,890
MALE POPULATION
38,014
FEMALE POPULATION
110.20
MALES / 100 FEMALES
90.75
FEMALES / 100 MALES
36.9
MEDIAN AGE
3.2
AVG FAMILY SIZE
2.8
AVG HOUSEHOLD SIZE
$30,263
PER CAPITA INCOME
$80,919
AVG FAMILY INCOME
$70,322
AVG HOUSEHOLD INCOME
26.7%
WAGE / INCOME GAP [ % ]
73.3¢/ $1
WAGE / INCOME GAP [ $ ]
$9,531
FAMILY INCOME DEFICIT
0.41
INEQUALITY / GINI INDEX
36,471
LABOR FORCE [ PEOPLE ]
58.4%
PERCENT IN LABOR FORCE
6.7%
UNEMPLOYMENT RATE
Umatilla County Area Codes
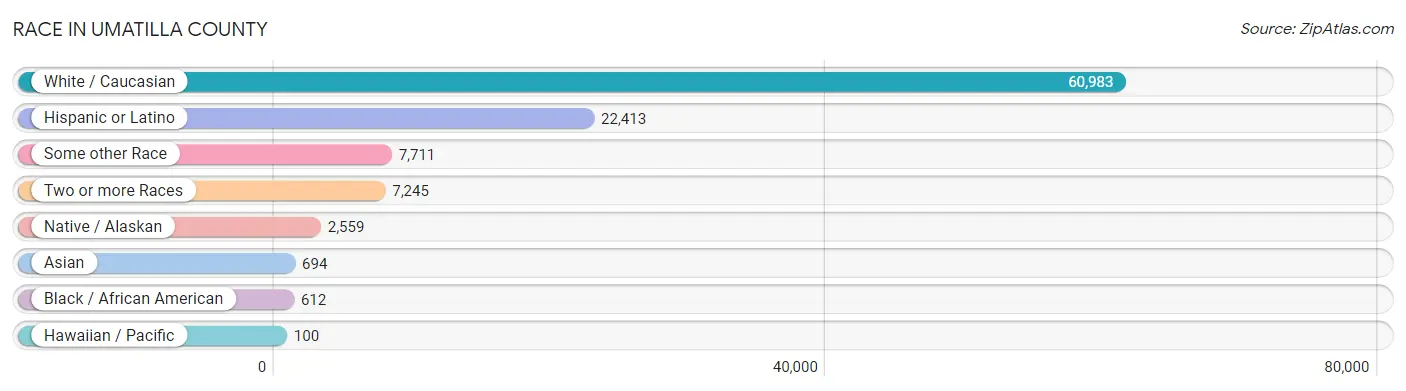
Race in Umatilla County
The most populous races in Umatilla County are White / Caucasian (60,983 | 76.3%), Hispanic or Latino (22,413 | 28.1%), and Some other Race (7,711 | 9.7%).
| Race | # Population | % Population |
| Asian | 694 | 0.9% |
| Black / African American | 612 | 0.8% |
| Hawaiian / Pacific | 100 | 0.1% |
| Hispanic or Latino | 22,413 | 28.1% |
| Native / Alaskan | 2,559 | 3.2% |
| White / Caucasian | 60,983 | 76.3% |
| Two or more Races | 7,245 | 9.1% |
| Some other Race | 7,711 | 9.7% |
| Total | 79,904 | 100.0% |
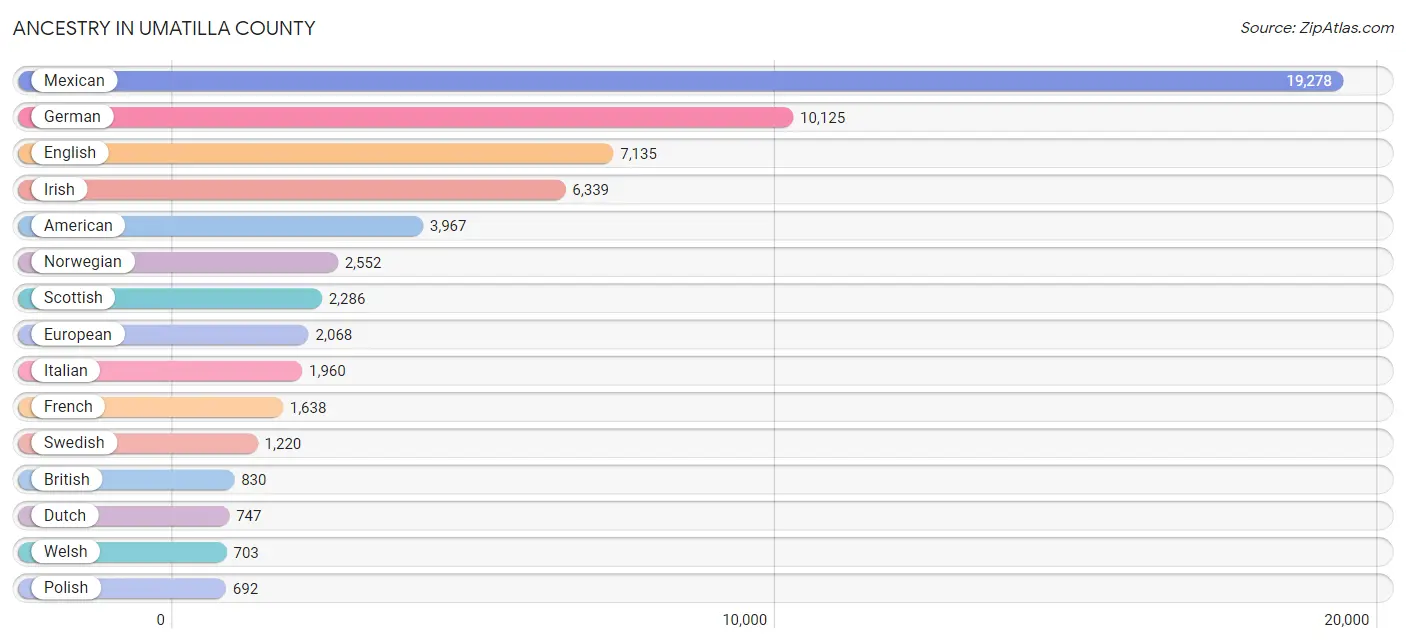
Ancestry in Umatilla County
The most populous ancestries reported in Umatilla County are Mexican (19,278 | 24.1%), German (10,125 | 12.7%), English (7,135 | 8.9%), Irish (6,339 | 7.9%), and American (3,967 | 5.0%), together accounting for 58.6% of all Umatilla County residents.
| Ancestry | # Population | % Population |
| African | 19 | 0.0% |
| Alaska Native | 6 | 0.0% |
| American | 3,967 | 5.0% |
| Apache | 65 | 0.1% |
| Arab | 8 | 0.0% |
| Arapaho | 5 | 0.0% |
| Argentinean | 60 | 0.1% |
| Armenian | 9 | 0.0% |
| Australian | 8 | 0.0% |
| Austrian | 39 | 0.1% |
| Basque | 76 | 0.1% |
| Belgian | 3 | 0.0% |
| Bhutanese | 447 | 0.6% |
| Blackfeet | 122 | 0.2% |
| Brazilian | 38 | 0.1% |
| British | 830 | 1.0% |
| Burmese | 231 | 0.3% |
| Cajun | 30 | 0.0% |
| Canadian | 104 | 0.1% |
| Celtic | 65 | 0.1% |
| Central American | 531 | 0.7% |
| Central American Indian | 14 | 0.0% |
| Cherokee | 252 | 0.3% |
| Cheyenne | 17 | 0.0% |
| Chickasaw | 30 | 0.0% |
| Chilean | 11 | 0.0% |
| Chinese | 6 | 0.0% |
| Chippewa | 52 | 0.1% |
| Choctaw | 23 | 0.0% |
| Colombian | 37 | 0.1% |
| Colville | 22 | 0.0% |
| Costa Rican | 18 | 0.0% |
| Cree | 53 | 0.1% |
| Creek | 69 | 0.1% |
| Croatian | 43 | 0.1% |
| Crow | 3 | 0.0% |
| Cuban | 148 | 0.2% |
| Czech | 195 | 0.2% |
| Czechoslovakian | 78 | 0.1% |
| Danish | 381 | 0.5% |
| Delaware | 2 | 0.0% |
| Dominican | 24 | 0.0% |
| Dutch | 747 | 0.9% |
| Eastern European | 138 | 0.2% |
| Ecuadorian | 48 | 0.1% |
| English | 7,135 | 8.9% |
| European | 2,068 | 2.6% |
| Finnish | 167 | 0.2% |
| French | 1,638 | 2.1% |
| French American Indian | 6 | 0.0% |
| French Canadian | 338 | 0.4% |
| German | 10,125 | 12.7% |
| German Russian | 36 | 0.1% |
| Greek | 11 | 0.0% |
| Guamanian / Chamorro | 31 | 0.0% |
| Guatemalan | 238 | 0.3% |
| Honduran | 14 | 0.0% |
| Hopi | 3 | 0.0% |
| Hungarian | 39 | 0.1% |
| Icelander | 114 | 0.1% |
| Indian (Asian) | 178 | 0.2% |
| Inupiat | 24 | 0.0% |
| Irish | 6,339 | 7.9% |
| Iroquois | 61 | 0.1% |
| Italian | 1,960 | 2.5% |
| Jamaican | 10 | 0.0% |
| Japanese | 13 | 0.0% |
| Kiowa | 4 | 0.0% |
| Korean | 146 | 0.2% |
| Laotian | 13 | 0.0% |
| Lebanese | 7 | 0.0% |
| Liberian | 14 | 0.0% |
| Lithuanian | 15 | 0.0% |
| Lumbee | 11 | 0.0% |
| Luxembourger | 11 | 0.0% |
| Malaysian | 1 | 0.0% |
| Marshallese | 1 | 0.0% |
| Mexican | 19,278 | 24.1% |
| Mexican American Indian | 142 | 0.2% |
| Moroccan | 1 | 0.0% |
| Native Hawaiian | 88 | 0.1% |
| Navajo | 23 | 0.0% |
| Northern European | 77 | 0.1% |
| Norwegian | 2,552 | 3.2% |
| Osage | 13 | 0.0% |
| Paiute | 27 | 0.0% |
| Pakistani | 13 | 0.0% |
| Pennsylvania German | 61 | 0.1% |
| Peruvian | 131 | 0.2% |
| Polish | 692 | 0.9% |
| Portuguese | 62 | 0.1% |
| Potawatomi | 5 | 0.0% |
| Pueblo | 2 | 0.0% |
| Puerto Rican | 98 | 0.1% |
| Puget Sound Salish | 3 | 0.0% |
| Romanian | 51 | 0.1% |
| Russian | 154 | 0.2% |
| Salvadoran | 261 | 0.3% |
| Samoan | 64 | 0.1% |
| Scandinavian | 570 | 0.7% |
| Scotch-Irish | 632 | 0.8% |
| Scottish | 2,286 | 2.9% |
| Shoshone | 14 | 0.0% |
| Sioux | 70 | 0.1% |
| Slavic | 7 | 0.0% |
| Slovak | 13 | 0.0% |
| South African | 90 | 0.1% |
| South American | 287 | 0.4% |
| Spaniard | 423 | 0.5% |
| Spanish | 513 | 0.6% |
| Sri Lankan | 72 | 0.1% |
| Subsaharan African | 300 | 0.4% |
| Swedish | 1,220 | 1.5% |
| Swiss | 184 | 0.2% |
| Thai | 24 | 0.0% |
| Tlingit-Haida | 21 | 0.0% |
| Ukrainian | 42 | 0.1% |
| Ute | 3 | 0.0% |
| Welsh | 703 | 0.9% |
| Yakama | 92 | 0.1% |
| Yaqui | 86 | 0.1% | View All 121 Rows |
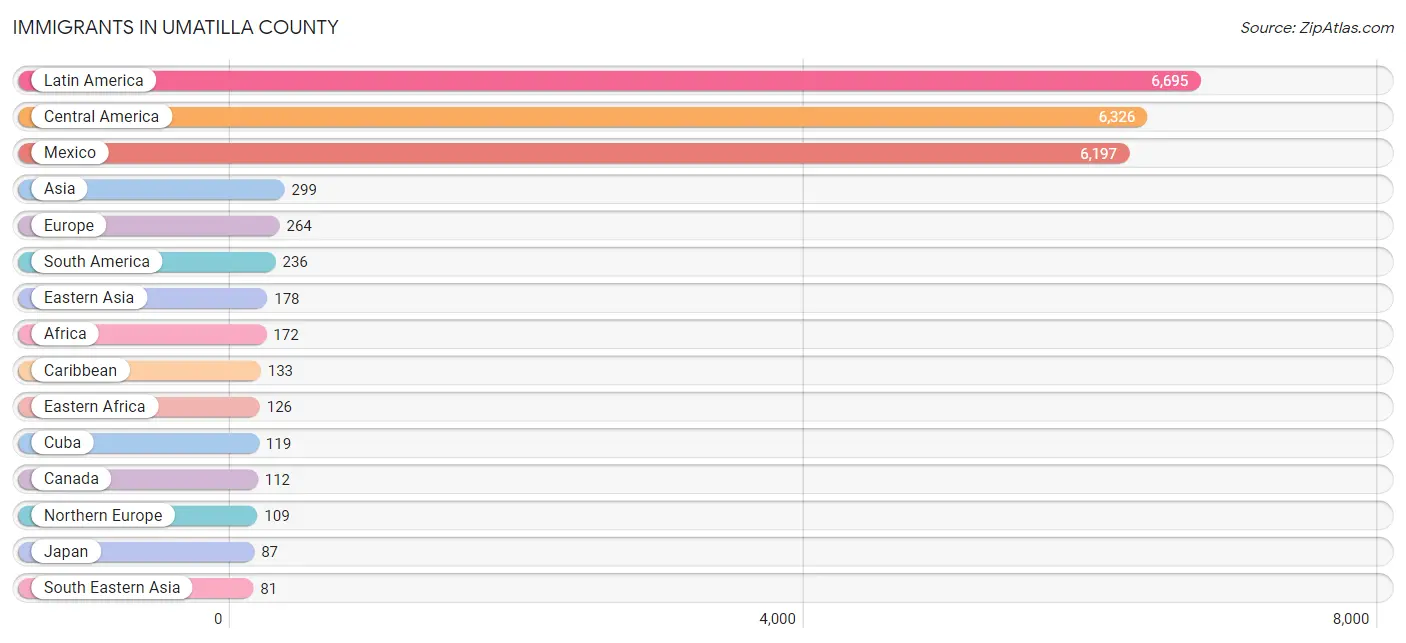
Immigrants in Umatilla County
The most numerous immigrant groups reported in Umatilla County came from Latin America (6,695 | 8.4%), Central America (6,326 | 7.9%), Mexico (6,197 | 7.8%), Asia (299 | 0.4%), and Europe (264 | 0.3%), together accounting for 24.8% of all Umatilla County residents.
| Immigration Origin | # Population | % Population |
| Africa | 172 | 0.2% |
| Argentina | 8 | 0.0% |
| Asia | 299 | 0.4% |
| Australia | 6 | 0.0% |
| Brazil | 30 | 0.0% |
| Cambodia | 17 | 0.0% |
| Canada | 112 | 0.1% |
| Caribbean | 133 | 0.2% |
| Central America | 6,326 | 7.9% |
| Chile | 11 | 0.0% |
| China | 15 | 0.0% |
| Colombia | 16 | 0.0% |
| Costa Rica | 18 | 0.0% |
| Croatia | 11 | 0.0% |
| Cuba | 119 | 0.2% |
| Dominican Republic | 14 | 0.0% |
| Eastern Africa | 126 | 0.2% |
| Eastern Asia | 178 | 0.2% |
| Eastern Europe | 57 | 0.1% |
| Ecuador | 11 | 0.0% |
| El Salvador | 26 | 0.0% |
| England | 34 | 0.0% |
| Europe | 264 | 0.3% |
| Fiji | 21 | 0.0% |
| France | 18 | 0.0% |
| Germany | 56 | 0.1% |
| Greece | 6 | 0.0% |
| Guatemala | 69 | 0.1% |
| Honduras | 16 | 0.0% |
| India | 13 | 0.0% |
| Japan | 87 | 0.1% |
| Korea | 76 | 0.1% |
| Latin America | 6,695 | 8.4% |
| Liberia | 14 | 0.0% |
| Mexico | 6,197 | 7.8% |
| Nepal | 27 | 0.0% |
| Netherlands | 7 | 0.0% |
| Northern Europe | 109 | 0.1% |
| Oceania | 42 | 0.1% |
| Peru | 79 | 0.1% |
| Philippines | 12 | 0.0% |
| Poland | 11 | 0.0% |
| Portugal | 4 | 0.0% |
| Romania | 35 | 0.0% |
| Scotland | 14 | 0.0% |
| South America | 236 | 0.3% |
| South Central Asia | 40 | 0.1% |
| South Eastern Asia | 81 | 0.1% |
| Southern Europe | 14 | 0.0% |
| Spain | 4 | 0.0% |
| Thailand | 2 | 0.0% |
| Venezuela | 81 | 0.1% |
| Vietnam | 50 | 0.1% |
| Western Africa | 14 | 0.0% |
| Western Europe | 81 | 0.1% | View All 55 Rows |
Sex and Age in Umatilla County
Sex and Age in Umatilla County
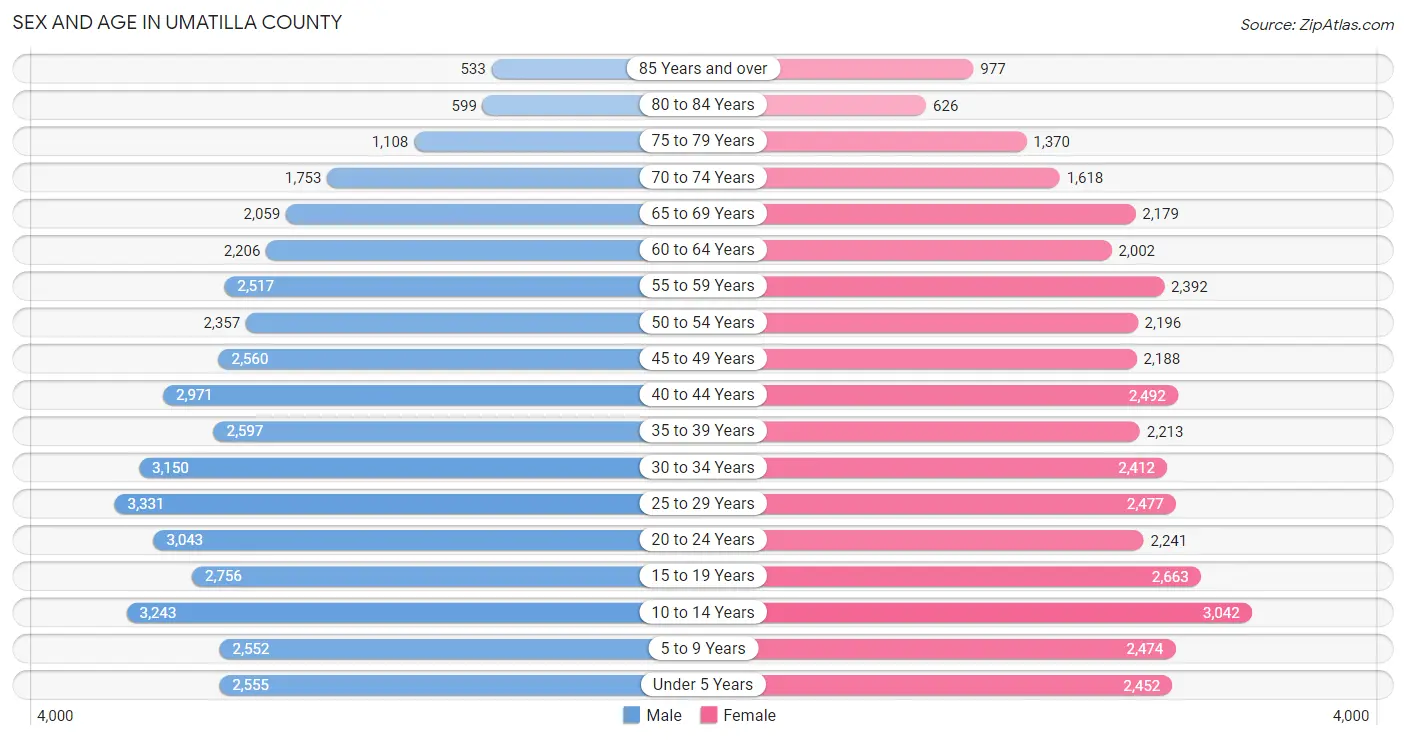
The most populous age groups in Umatilla County are 25 to 29 Years (3,331 | 8.0%) for men and 10 to 14 Years (3,042 | 8.0%) for women.
| Age Bracket | Male | Female |
| Under 5 Years | 2,555 (6.1%) | 2,452 (6.5%) |
| 5 to 9 Years | 2,552 (6.1%) | 2,474 (6.5%) |
| 10 to 14 Years | 3,243 (7.7%) | 3,042 (8.0%) |
| 15 to 19 Years | 2,756 (6.6%) | 2,663 (7.0%) |
| 20 to 24 Years | 3,043 (7.3%) | 2,241 (5.9%) |
| 25 to 29 Years | 3,331 (8.0%) | 2,477 (6.5%) |
| 30 to 34 Years | 3,150 (7.5%) | 2,412 (6.4%) |
| 35 to 39 Years | 2,597 (6.2%) | 2,213 (5.8%) |
| 40 to 44 Years | 2,971 (7.1%) | 2,492 (6.6%) |
| 45 to 49 Years | 2,560 (6.1%) | 2,188 (5.8%) |
| 50 to 54 Years | 2,357 (5.6%) | 2,196 (5.8%) |
| 55 to 59 Years | 2,517 (6.0%) | 2,392 (6.3%) |
| 60 to 64 Years | 2,206 (5.3%) | 2,002 (5.3%) |
| 65 to 69 Years | 2,059 (4.9%) | 2,179 (5.7%) |
| 70 to 74 Years | 1,753 (4.2%) | 1,618 (4.3%) |
| 75 to 79 Years | 1,108 (2.6%) | 1,370 (3.6%) |
| 80 to 84 Years | 599 (1.4%) | 626 (1.7%) |
| 85 Years and over | 533 (1.3%) | 977 (2.6%) |
| Total | 41,890 (100.0%) | 38,014 (100.0%) |
Families and Households in Umatilla County
Median Family Size in Umatilla County
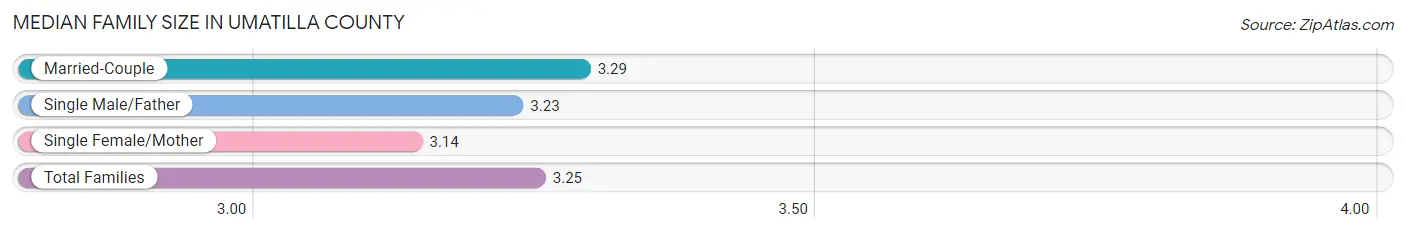
The median family size in Umatilla County is 3.25 persons per family, with married-couple families (13,250 | 70.5%) accounting for the largest median family size of 3.29 persons per family. On the other hand, single female/mother families (3,883 | 20.7%) represent the smallest median family size with 3.14 persons per family.
| Family Type | # Families | Family Size |
| Married-Couple | 13,250 (70.5%) | 3.29 |
| Single Male/Father | 1,650 (8.8%) | 3.23 |
| Single Female/Mother | 3,883 (20.7%) | 3.14 |
| Total Families | 18,783 (100.0%) | 3.25 |
Median Household Size in Umatilla County
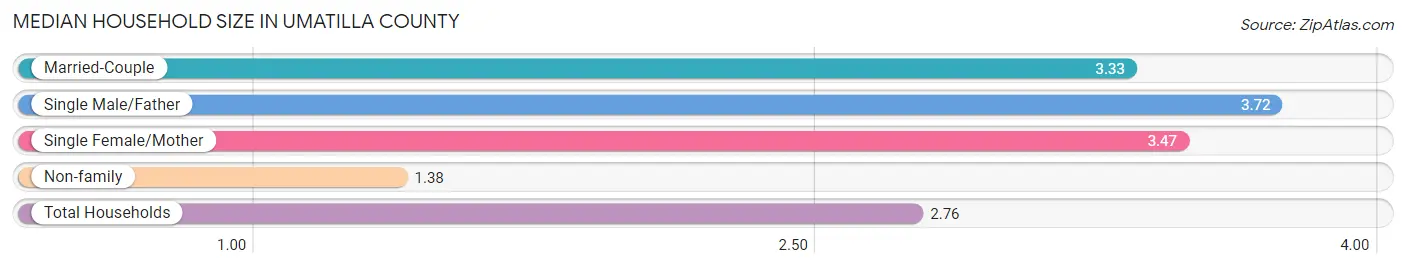
The median household size in Umatilla County is 2.76 persons per household, with single male/father households (1,650 | 6.0%) accounting for the largest median household size of 3.72 persons per household. non-family households (8,639 | 31.5%) represent the smallest median household size with 1.38 persons per household.
| Household Type | # Households | Household Size |
| Married-Couple | 13,250 (48.3%) | 3.33 |
| Single Male/Father | 1,650 (6.0%) | 3.72 |
| Single Female/Mother | 3,883 (14.2%) | 3.47 |
| Non-family | 8,639 (31.5%) | 1.38 |
| Total Households | 27,422 (100.0%) | 2.76 |
Household Size by Marriage Status in Umatilla County
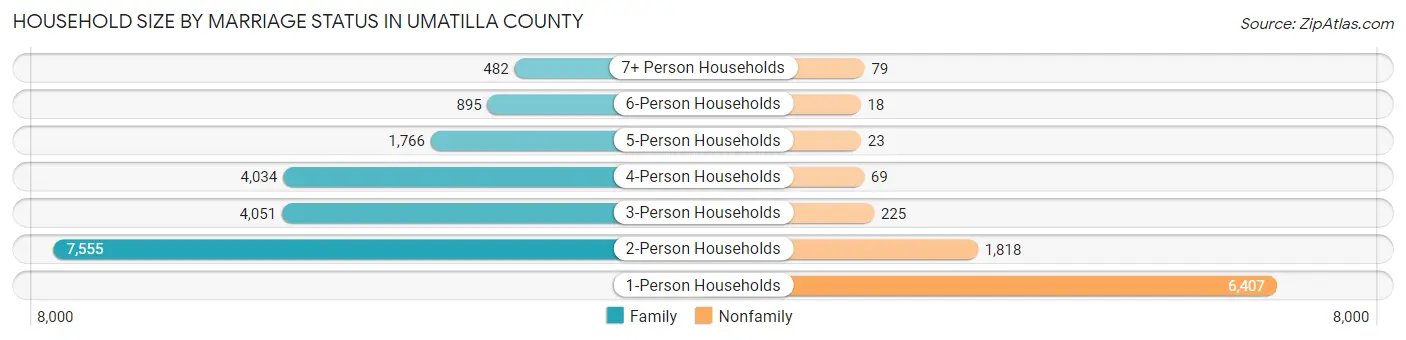
Out of a total of 27,422 households in Umatilla County, 18,783 (68.5%) are family households, while 8,639 (31.5%) are nonfamily households. The most numerous type of family households are 2-person households, comprising 7,555, and the most common type of nonfamily households are 1-person households, comprising 6,407.
| Household Size | Family Households | Nonfamily Households |
| 1-Person Households | - | 6,407 (23.4%) |
| 2-Person Households | 7,555 (27.6%) | 1,818 (6.6%) |
| 3-Person Households | 4,051 (14.8%) | 225 (0.8%) |
| 4-Person Households | 4,034 (14.7%) | 69 (0.3%) |
| 5-Person Households | 1,766 (6.4%) | 23 (0.1%) |
| 6-Person Households | 895 (3.3%) | 18 (0.1%) |
| 7+ Person Households | 482 (1.8%) | 79 (0.3%) |
| Total | 18,783 (68.5%) | 8,639 (31.5%) |
Female Fertility in Umatilla County
Fertility by Age in Umatilla County
Average fertility rate in Umatilla County is 50.0 births per 1,000 women. Women in the age bracket of 20 to 34 years have the highest fertility rate with 80.0 births per 1,000 women. Women in the age bracket of 20 to 34 years acount for 66.5% of all women with births.
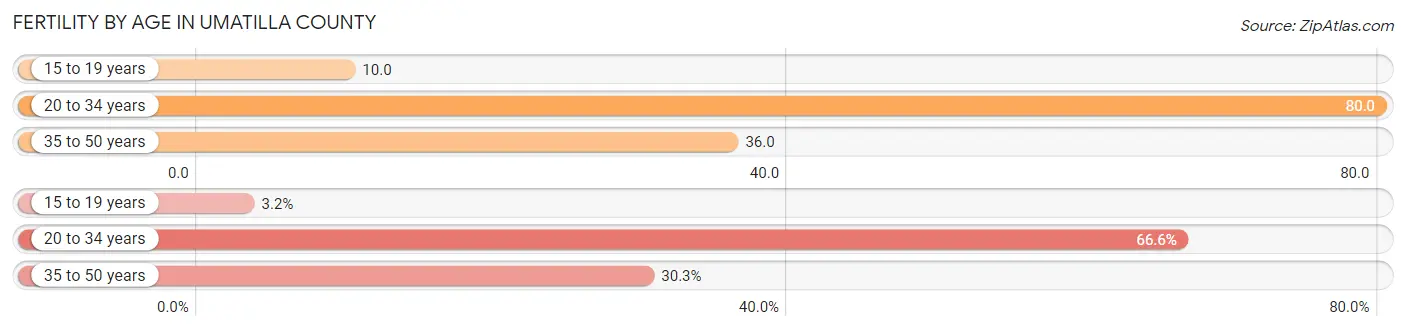
| Age Bracket | Women with Births | Births / 1,000 Women |
| 15 to 19 years | 27 (3.2%) | 10.0 |
| 20 to 34 years | 569 (66.5%) | 80.0 |
| 35 to 50 years | 259 (30.3%) | 36.0 |
| Total | 855 (100.0%) | 50.0 |
Fertility by Age by Marriage Status in Umatilla County
70.4% of women with births (855) in Umatilla County are married. The highest percentage of unmarried women with births falls into 15 to 19 years age bracket with 100.0% of them unmarried at the time of birth, while the lowest percentage of unmarried women with births belong to 35 to 50 years age bracket with 23.9% of them unmarried.
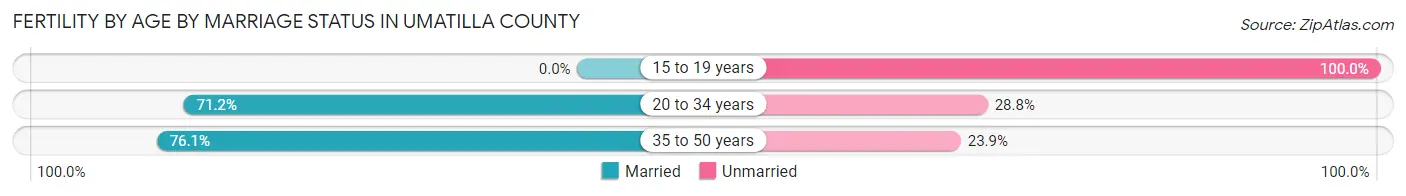
| Age Bracket | Married | Unmarried |
| 15 to 19 years | 0 (0.0%) | 27 (100.0%) |
| 20 to 34 years | 405 (71.2%) | 164 (28.8%) |
| 35 to 50 years | 197 (76.1%) | 62 (23.9%) |
| Total | 602 (70.4%) | 253 (29.6%) |
Fertility by Education in Umatilla County
Average fertility rate in Umatilla County is 50.0 births per 1,000 women. Women with the education attainment of bachelor's degree have the highest fertility rate of 126.0 births per 1,000 women, while women with the education attainment of graduate degree have the lowest fertility at 19.0 births per 1,000 women. Women with the education attainment of college or associate's degree represent 33.9% of all women with births.
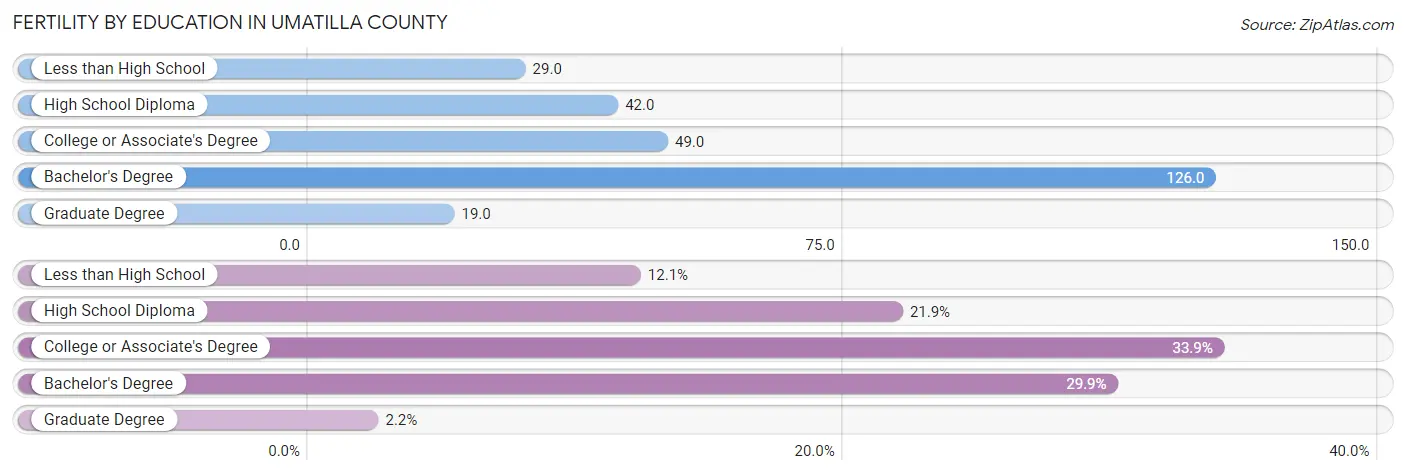
| Educational Attainment | Women with Births | Births / 1,000 Women |
| Less than High School | 103 (12.0%) | 29.0 |
| High School Diploma | 187 (21.9%) | 42.0 |
| College or Associate's Degree | 290 (33.9%) | 49.0 |
| Bachelor's Degree | 256 (29.9%) | 126.0 |
| Graduate Degree | 19 (2.2%) | 19.0 |
| Total | 855 (100.0%) | 50.0 |
Fertility by Education by Marriage Status in Umatilla County
29.6% of women with births in Umatilla County are unmarried. Women with the educational attainment of graduate degree are most likely to be married with 100.0% of them married at childbirth, while women with the educational attainment of high school diploma are least likely to be married with 47.6% of them unmarried at childbirth.
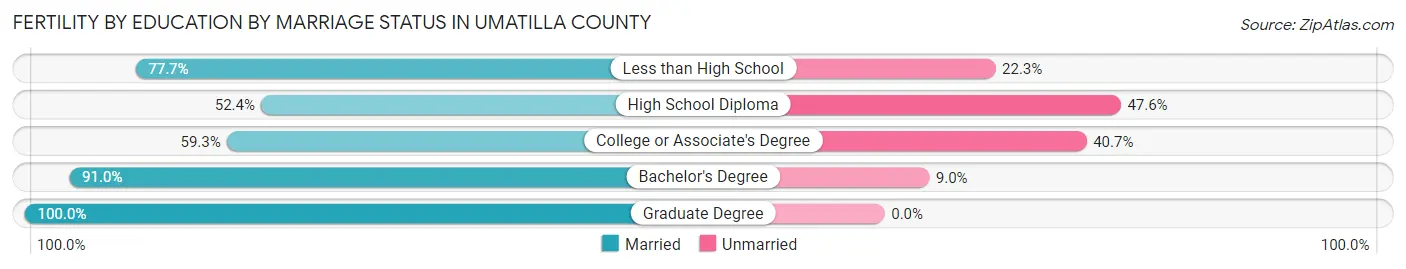
| Educational Attainment | Married | Unmarried |
| Less than High School | 80 (77.7%) | 23 (22.3%) |
| High School Diploma | 98 (52.4%) | 89 (47.6%) |
| College or Associate's Degree | 172 (59.3%) | 118 (40.7%) |
| Bachelor's Degree | 233 (91.0%) | 23 (9.0%) |
| Graduate Degree | 19 (100.0%) | 0 (0.0%) |
| Total | 602 (70.4%) | 253 (29.6%) |
Income in Umatilla County
Income Overview in Umatilla County
Per Capita Income in Umatilla County is $30,263, while median incomes of families and households are $80,919 and $70,322 respectively.
| Characteristic | Number | Measure |
| Per Capita Income | 79,904 | $30,263 |
| Median Family Income | 18,783 | $80,919 |
| Mean Family Income | 18,783 | $94,916 |
| Median Household Income | 27,422 | $70,322 |
| Mean Household Income | 27,422 | $84,404 |
| Income Deficit | 18,783 | $9,531 |
| Wage / Income Gap (%) | 79,904 | 26.69% |
| Wage / Income Gap ($) | 79,904 | 73.31¢ per $1 |
| Gini / Inequality Index | 79,904 | 0.41 |
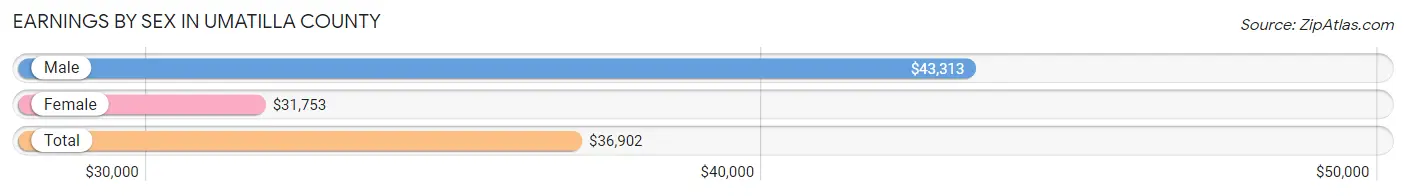
Earnings by Sex in Umatilla County
Average Earnings in Umatilla County are $36,902, $43,313 for men and $31,753 for women, a difference of 26.7%.
| Sex | Number | Average Earnings |
| Male | 21,407 (54.4%) | $43,313 |
| Female | 17,925 (45.6%) | $31,753 |
| Total | 39,332 (100.0%) | $36,902 |
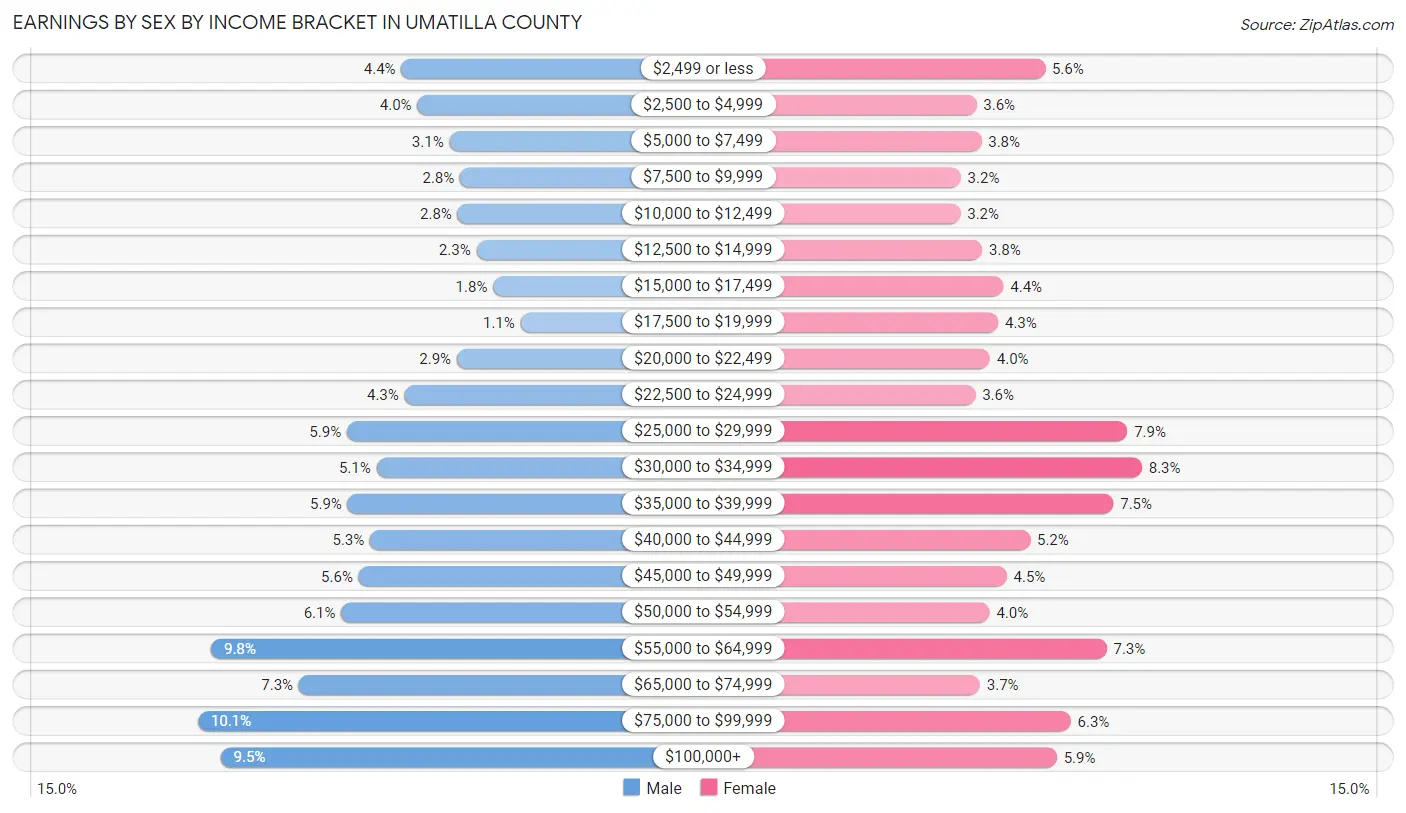
Earnings by Sex by Income Bracket in Umatilla County
The most common earnings brackets in Umatilla County are $75,000 to $99,999 for men (2,169 | 10.1%) and $30,000 to $34,999 for women (1,486 | 8.3%).
| Income | Male | Female |
| $2,499 or less | 945 (4.4%) | 998 (5.6%) |
| $2,500 to $4,999 | 848 (4.0%) | 653 (3.6%) |
| $5,000 to $7,499 | 654 (3.1%) | 678 (3.8%) |
| $7,500 to $9,999 | 591 (2.8%) | 574 (3.2%) |
| $10,000 to $12,499 | 605 (2.8%) | 571 (3.2%) |
| $12,500 to $14,999 | 492 (2.3%) | 682 (3.8%) |
| $15,000 to $17,499 | 391 (1.8%) | 789 (4.4%) |
| $17,500 to $19,999 | 226 (1.1%) | 762 (4.3%) |
| $20,000 to $22,499 | 610 (2.9%) | 721 (4.0%) |
| $22,500 to $24,999 | 924 (4.3%) | 647 (3.6%) |
| $25,000 to $29,999 | 1,271 (5.9%) | 1,412 (7.9%) |
| $30,000 to $34,999 | 1,093 (5.1%) | 1,486 (8.3%) |
| $35,000 to $39,999 | 1,267 (5.9%) | 1,343 (7.5%) |
| $40,000 to $44,999 | 1,132 (5.3%) | 923 (5.1%) |
| $45,000 to $49,999 | 1,202 (5.6%) | 804 (4.5%) |
| $50,000 to $54,999 | 1,306 (6.1%) | 719 (4.0%) |
| $55,000 to $64,999 | 2,089 (9.8%) | 1,309 (7.3%) |
| $65,000 to $74,999 | 1,561 (7.3%) | 670 (3.7%) |
| $75,000 to $99,999 | 2,169 (10.1%) | 1,127 (6.3%) |
| $100,000+ | 2,031 (9.5%) | 1,057 (5.9%) |
| Total | 21,407 (100.0%) | 17,925 (100.0%) |
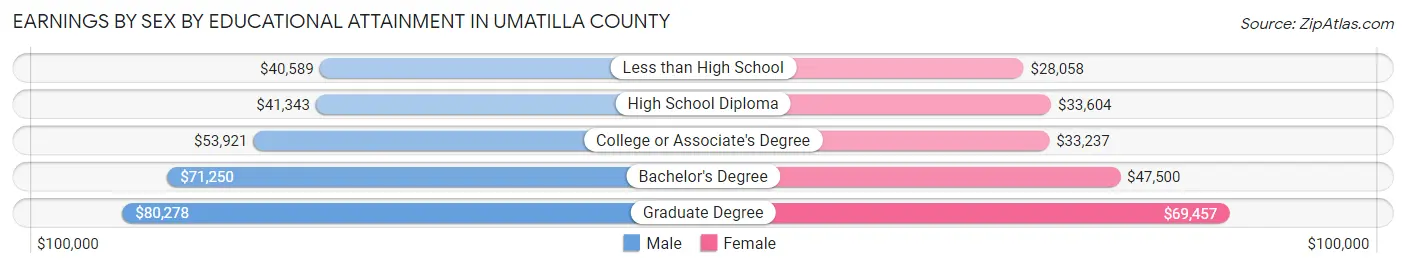
Earnings by Sex by Educational Attainment in Umatilla County
Average earnings in Umatilla County are $49,081 for men and $35,555 for women, a difference of 27.6%. Men with an educational attainment of graduate degree enjoy the highest average annual earnings of $80,278, while those with less than high school education earn the least with $40,589. Women with an educational attainment of graduate degree earn the most with the average annual earnings of $69,457, while those with less than high school education have the smallest earnings of $28,058.
| Educational Attainment | Male Income | Female Income |
| Less than High School | $40,589 | $28,058 |
| High School Diploma | $41,343 | $33,604 |
| College or Associate's Degree | $53,921 | $33,237 |
| Bachelor's Degree | $71,250 | $47,500 |
| Graduate Degree | $80,278 | $69,457 |
| Total | $49,081 | $35,555 |
Family Income in Umatilla County
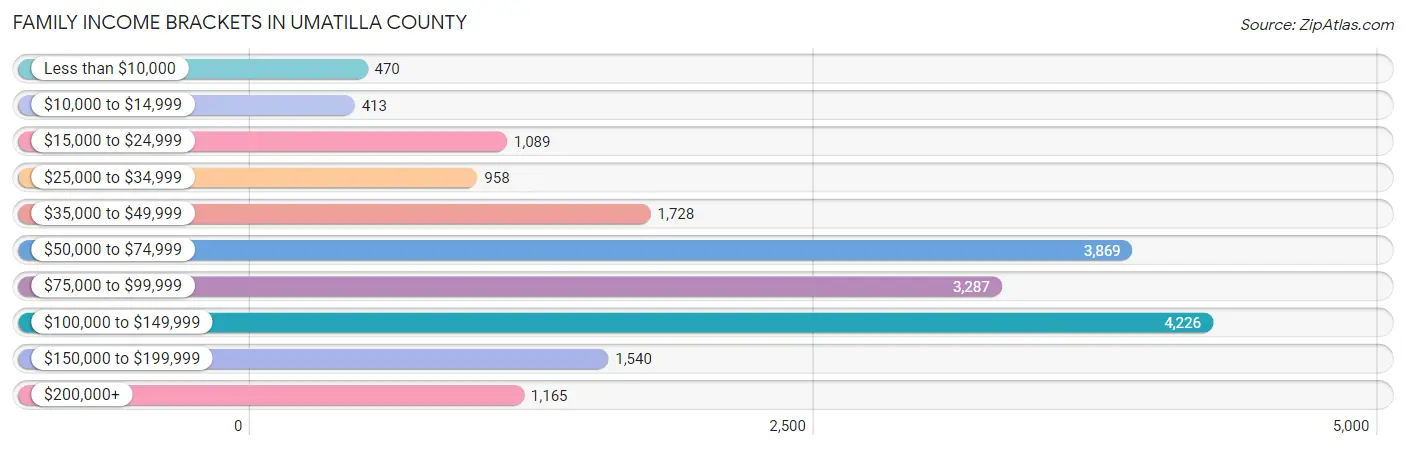
Family Income Brackets in Umatilla County
According to the Umatilla County family income data, there are 4,226 families falling into the $100,000 to $149,999 income range, which is the most common income bracket and makes up 22.5% of all families. Conversely, the $10,000 to $14,999 income bracket is the least frequent group with only 413 families (2.2%) belonging to this category.
| Income Bracket | # Families | % Families |
| Less than $10,000 | 470 | 2.5% |
| $10,000 to $14,999 | 413 | 2.2% |
| $15,000 to $24,999 | 1,089 | 5.8% |
| $25,000 to $34,999 | 958 | 5.1% |
| $35,000 to $49,999 | 1,728 | 9.2% |
| $50,000 to $74,999 | 3,869 | 20.6% |
| $75,000 to $99,999 | 3,287 | 17.5% |
| $100,000 to $149,999 | 4,226 | 22.5% |
| $150,000 to $199,999 | 1,540 | 8.2% |
| $200,000+ | 1,165 | 6.2% |
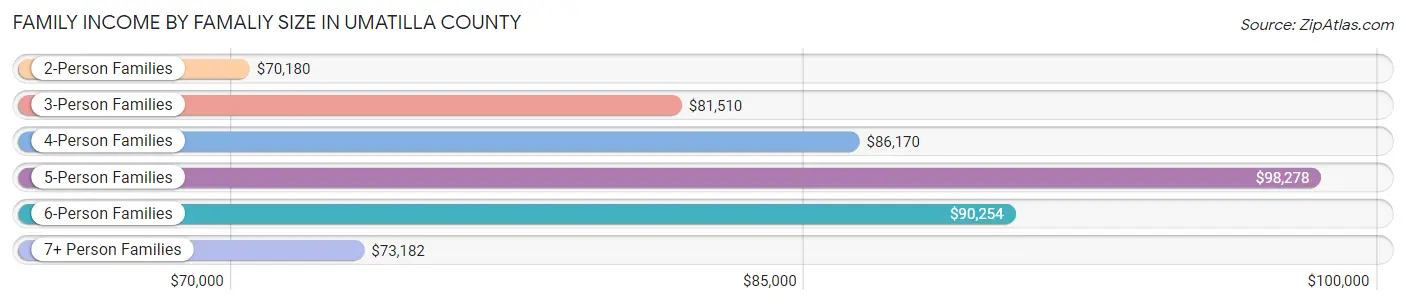
Family Income by Famaliy Size in Umatilla County
5-person families (1,648 | 8.8%) account for the highest median family income in Umatilla County with $98,278 per family, while 2-person families (8,260 | 44.0%) have the highest median income of $35,090 per family member.
| Income Bracket | # Families | Median Income |
| 2-Person Families | 8,260 (44.0%) | $70,180 |
| 3-Person Families | 3,973 (21.1%) | $81,510 |
| 4-Person Families | 3,914 (20.8%) | $86,170 |
| 5-Person Families | 1,648 (8.8%) | $98,278 |
| 6-Person Families | 544 (2.9%) | $90,254 |
| 7+ Person Families | 444 (2.4%) | $73,182 |
| Total | 18,783 (100.0%) | $80,919 |
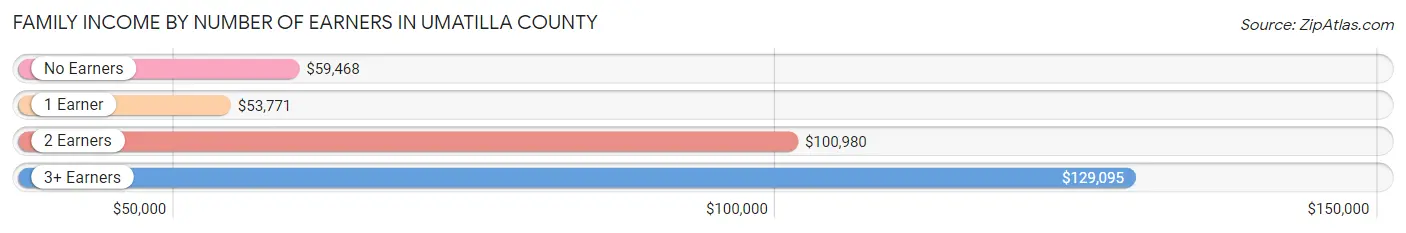
Family Income by Number of Earners in Umatilla County
The median family income in Umatilla County is $80,919, with families comprising 3+ earners (2,183) having the highest median family income of $129,095, while families with 1 earner (6,158) have the lowest median family income of $53,771, accounting for 11.6% and 32.8% of families, respectively.
| Number of Earners | # Families | Median Income |
| No Earners | 2,953 (15.7%) | $59,468 |
| 1 Earner | 6,158 (32.8%) | $53,771 |
| 2 Earners | 7,489 (39.9%) | $100,980 |
| 3+ Earners | 2,183 (11.6%) | $129,095 |
| Total | 18,783 (100.0%) | $80,919 |
Household Income in Umatilla County
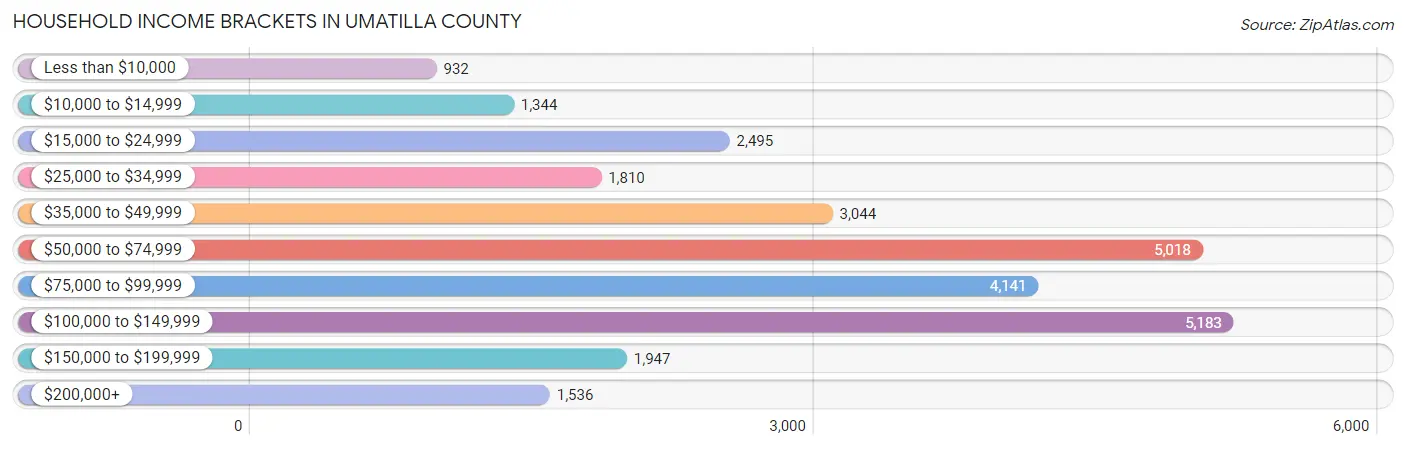
Household Income Brackets in Umatilla County
With 5,183 households falling in the category, the $100,000 to $149,999 income range is the most frequent in Umatilla County, accounting for 18.9% of all households. In contrast, only 932 households (3.4%) fall into the less than $10,000 income bracket, making it the least populous group.
| Income Bracket | # Households | % Households |
| Less than $10,000 | 932 | 3.4% |
| $10,000 to $14,999 | 1,344 | 4.9% |
| $15,000 to $24,999 | 2,495 | 9.1% |
| $25,000 to $34,999 | 1,810 | 6.6% |
| $35,000 to $49,999 | 3,044 | 11.1% |
| $50,000 to $74,999 | 5,018 | 18.3% |
| $75,000 to $99,999 | 4,141 | 15.1% |
| $100,000 to $149,999 | 5,183 | 18.9% |
| $150,000 to $199,999 | 1,947 | 7.1% |
| $200,000+ | 1,536 | 5.6% |
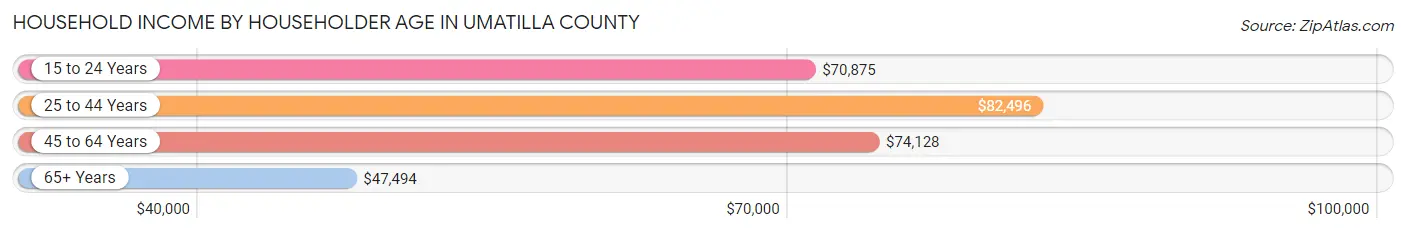
Household Income by Householder Age in Umatilla County
The median household income in Umatilla County is $70,322, with the highest median household income of $82,496 found in the 25 to 44 years age bracket for the primary householder. A total of 9,381 households (34.2%) fall into this category. Meanwhile, the 65+ years age bracket for the primary householder has the lowest median household income of $47,494, with 7,677 households (28.0%) in this group.
| Income Bracket | # Households | Median Income |
| 15 to 24 Years | 1,064 (3.9%) | $70,875 |
| 25 to 44 Years | 9,381 (34.2%) | $82,496 |
| 45 to 64 Years | 9,300 (33.9%) | $74,128 |
| 65+ Years | 7,677 (28.0%) | $47,494 |
| Total | 27,422 (100.0%) | $70,322 |
Poverty in Umatilla County
Income Below Poverty by Sex and Age in Umatilla County
With 10.9% poverty level for males and 12.5% for females among the residents of Umatilla County, 18 to 24 year old males and under 5 year old females are the most vulnerable to poverty, with 814 males (21.3%) and 388 females (16.0%) in their respective age groups living below the poverty level.
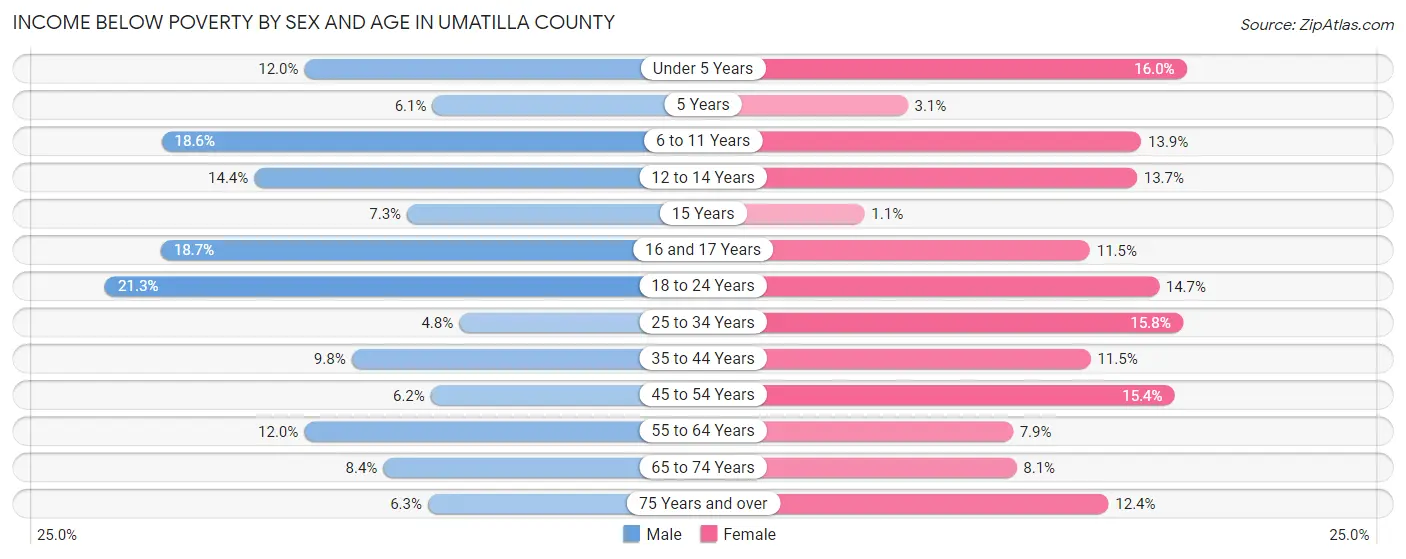
| Age Bracket | Male | Female |
| Under 5 Years | 295 (12.0%) | 388 (16.0%) |
| 5 Years | 54 (6.1%) | 10 (3.0%) |
| 6 to 11 Years | 539 (18.6%) | 447 (13.9%) |
| 12 to 14 Years | 277 (14.3%) | 256 (13.7%) |
| 15 Years | 48 (7.3%) | 5 (1.1%) |
| 16 and 17 Years | 192 (18.7%) | 148 (11.5%) |
| 18 to 24 Years | 814 (21.3%) | 459 (14.7%) |
| 25 to 34 Years | 259 (4.8%) | 773 (15.8%) |
| 35 to 44 Years | 473 (9.8%) | 540 (11.5%) |
| 45 to 54 Years | 265 (6.2%) | 673 (15.4%) |
| 55 to 64 Years | 512 (12.0%) | 347 (7.9%) |
| 65 to 74 Years | 304 (8.4%) | 306 (8.1%) |
| 75 Years and over | 132 (6.3%) | 352 (12.4%) |
| Total | 4,164 (10.9%) | 4,704 (12.5%) |
Income Above Poverty by Sex and Age in Umatilla County
According to the poverty statistics in Umatilla County, males aged 25 to 34 years and females aged 15 years are the age groups that are most secure financially, with 95.2% of males and 99.0% of females in these age groups living above the poverty line.
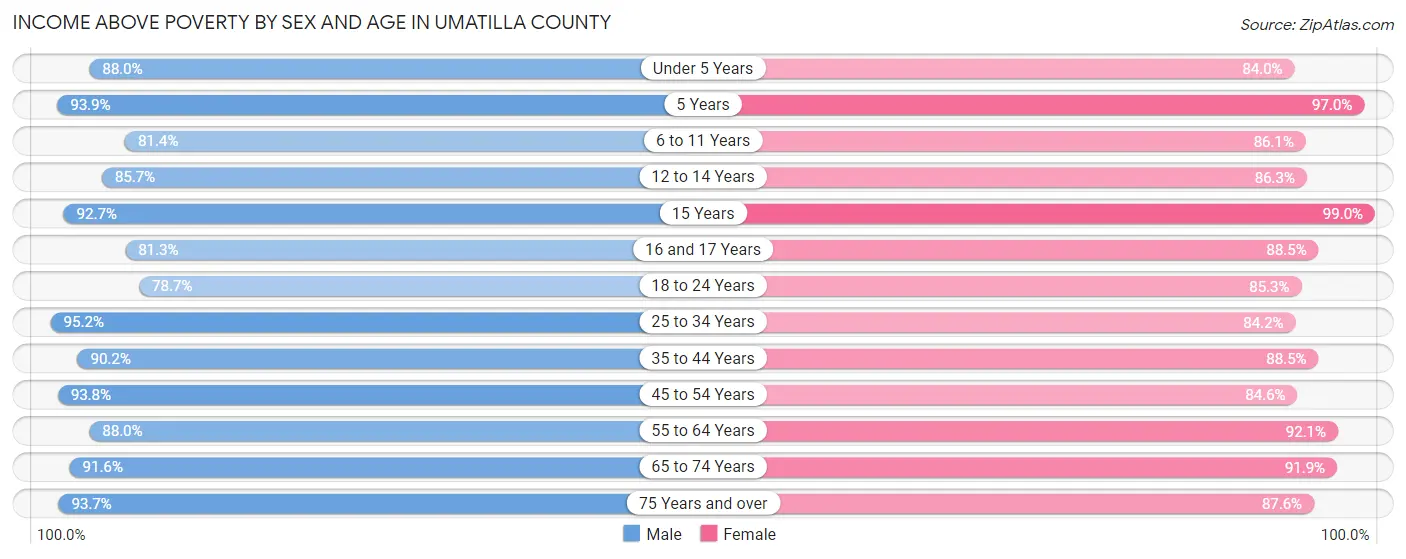
| Age Bracket | Male | Female |
| Under 5 Years | 2,159 (88.0%) | 2,038 (84.0%) |
| 5 Years | 834 (93.9%) | 318 (97.0%) |
| 6 to 11 Years | 2,352 (81.4%) | 2,770 (86.1%) |
| 12 to 14 Years | 1,653 (85.7%) | 1,614 (86.3%) |
| 15 Years | 613 (92.7%) | 469 (99.0%) |
| 16 and 17 Years | 836 (81.3%) | 1,138 (88.5%) |
| 18 to 24 Years | 3,014 (78.7%) | 2,662 (85.3%) |
| 25 to 34 Years | 5,094 (95.2%) | 4,115 (84.2%) |
| 35 to 44 Years | 4,341 (90.2%) | 4,141 (88.5%) |
| 45 to 54 Years | 4,038 (93.8%) | 3,688 (84.6%) |
| 55 to 64 Years | 3,743 (88.0%) | 4,030 (92.1%) |
| 65 to 74 Years | 3,334 (91.6%) | 3,471 (91.9%) |
| 75 Years and over | 1,967 (93.7%) | 2,494 (87.6%) |
| Total | 33,978 (89.1%) | 32,948 (87.5%) |
Income Below Poverty Among Married-Couple Families in Umatilla County
The poverty statistics for married-couple families in Umatilla County show that 3.4% or 445 of the total 13,250 families live below the poverty line. Families with 3 or 4 children have the highest poverty rate of 5.7%, comprising of 75 families. On the other hand, families with 5 or more children have the lowest poverty rate of 2.0%, which includes 4 families.
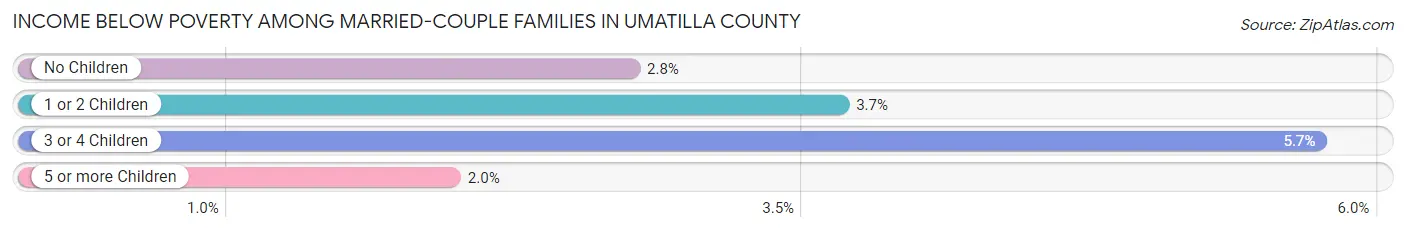
| Children | Above Poverty | Below Poverty |
| No Children | 6,814 (97.3%) | 193 (2.8%) |
| 1 or 2 Children | 4,560 (96.3%) | 173 (3.7%) |
| 3 or 4 Children | 1,232 (94.3%) | 75 (5.7%) |
| 5 or more Children | 199 (98.0%) | 4 (2.0%) |
| Total | 12,805 (96.6%) | 445 (3.4%) |
Income Below Poverty Among Single-Parent Households in Umatilla County
According to the poverty data in Umatilla County, 13.5% or 222 single-father households and 23.1% or 895 single-mother households are living below the poverty line. Among single-father households, those with 5 or more children have the highest poverty rate, with 40 households (100.0%) experiencing poverty. Likewise, among single-mother households, those with 5 or more children have the highest poverty rate, with 41 households (89.1%) falling below the poverty line.
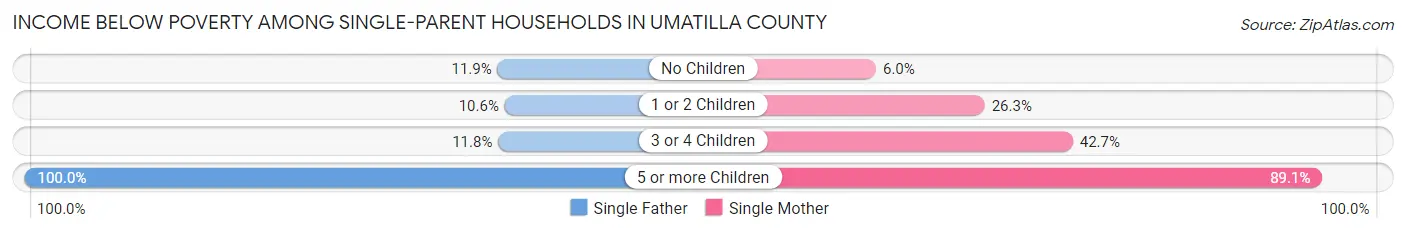
| Children | Single Father | Single Mother |
| No Children | 71 (11.9%) | 68 (6.0%) |
| 1 or 2 Children | 74 (10.6%) | 594 (26.3%) |
| 3 or 4 Children | 37 (11.8%) | 192 (42.7%) |
| 5 or more Children | 40 (100.0%) | 41 (89.1%) |
| Total | 222 (13.5%) | 895 (23.1%) |
Income Below Poverty Among Married-Couple vs Single-Parent Households in Umatilla County
The poverty data for Umatilla County shows that 445 of the married-couple family households (3.4%) and 1,117 of the single-parent households (20.2%) are living below the poverty level. Within the married-couple family households, those with 3 or 4 children have the highest poverty rate, with 75 households (5.7%) falling below the poverty line. Among the single-parent households, those with 5 or more children have the highest poverty rate, with 81 household (94.2%) living below poverty.
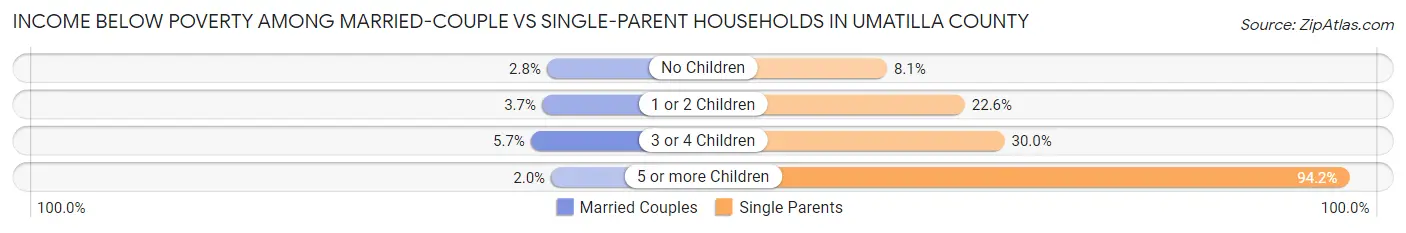
| Children | Married-Couple Families | Single-Parent Households |
| No Children | 193 (2.8%) | 139 (8.1%) |
| 1 or 2 Children | 173 (3.7%) | 668 (22.6%) |
| 3 or 4 Children | 75 (5.7%) | 229 (30.0%) |
| 5 or more Children | 4 (2.0%) | 81 (94.2%) |
| Total | 445 (3.4%) | 1,117 (20.2%) |
Employment Characteristics in Umatilla County
Employment by Class of Employer in Umatilla County
Among the 33,310 employed individuals in Umatilla County, private company employees (21,791 | 65.4%), local government employees (3,339 | 10.0%), and not-for-profit organizations (2,567 | 7.7%) make up the most common classes of employment.
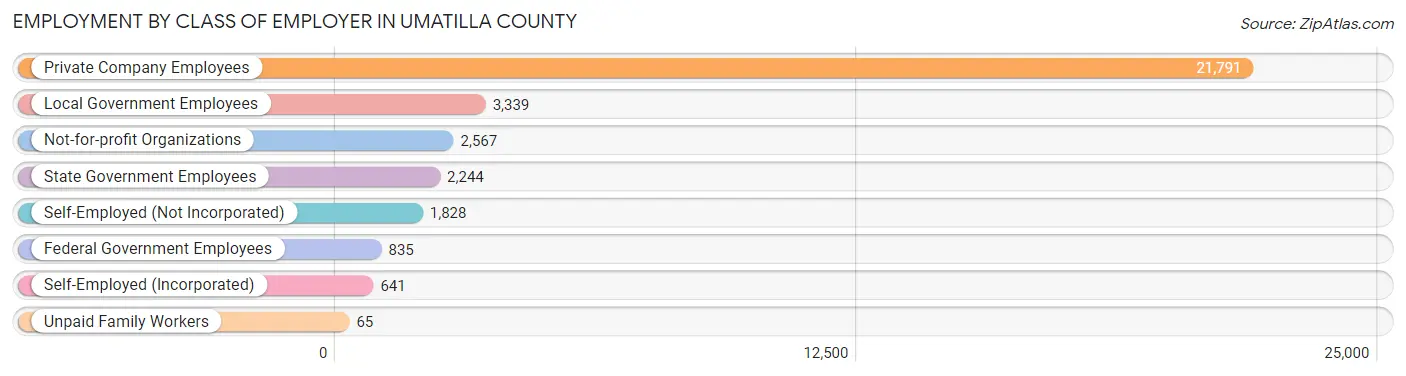
| Employer Class | # Employees | % Employees |
| Private Company Employees | 21,791 | 65.4% |
| Self-Employed (Incorporated) | 641 | 1.9% |
| Self-Employed (Not Incorporated) | 1,828 | 5.5% |
| Not-for-profit Organizations | 2,567 | 7.7% |
| Local Government Employees | 3,339 | 10.0% |
| State Government Employees | 2,244 | 6.7% |
| Federal Government Employees | 835 | 2.5% |
| Unpaid Family Workers | 65 | 0.2% |
| Total | 33,310 | 100.0% |
Employment Status by Age in Umatilla County
According to the labor force statistics for Umatilla County, out of the total population over 16 years of age (62,451), 58.4% or 36,471 individuals are in the labor force, with 6.7% or 2,444 of them unemployed. The age group with the highest labor force participation rate is 35 to 44 years, with 79.5% or 8,167 individuals in the labor force. Within the labor force, the 16 to 19 years age range has the highest percentage of unemployed individuals, with 22.2% or 434 of them being unemployed.
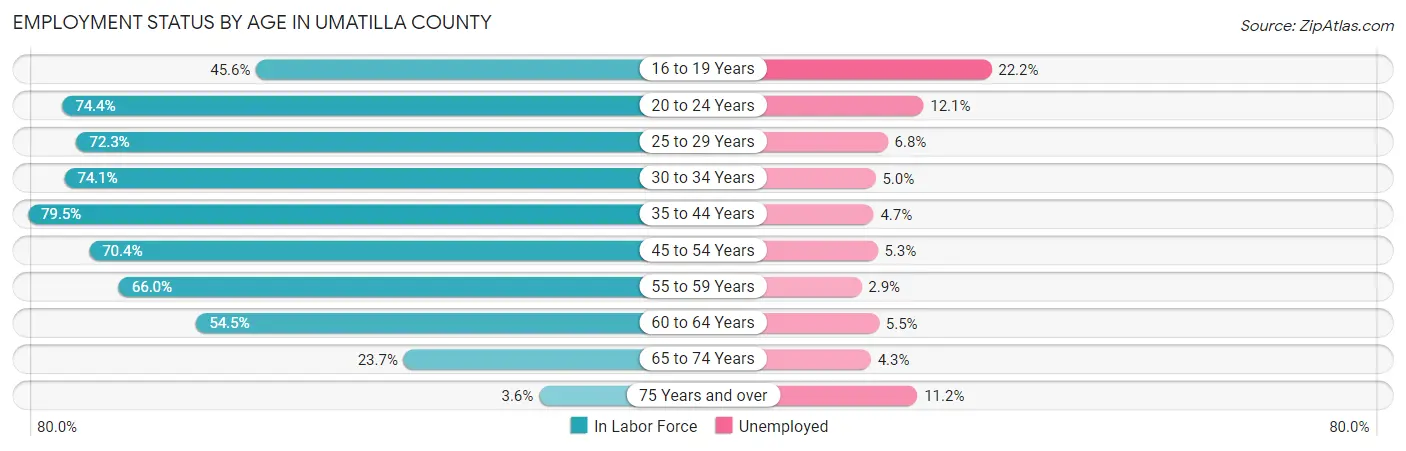
| Age Bracket | In Labor Force | Unemployed |
| 16 to 19 Years | 1,954 (45.6%) | 434 (22.2%) |
| 20 to 24 Years | 3,931 (74.4%) | 476 (12.1%) |
| 25 to 29 Years | 4,199 (72.3%) | 286 (6.8%) |
| 30 to 34 Years | 4,121 (74.1%) | 206 (5.0%) |
| 35 to 44 Years | 8,167 (79.5%) | 384 (4.7%) |
| 45 to 54 Years | 6,548 (70.4%) | 347 (5.3%) |
| 55 to 59 Years | 3,240 (66.0%) | 94 (2.9%) |
| 60 to 64 Years | 2,293 (54.5%) | 126 (5.5%) |
| 65 to 74 Years | 1,803 (23.7%) | 78 (4.3%) |
| 75 Years and over | 188 (3.6%) | 21 (11.2%) |
| Total | 36,471 (58.4%) | 2,444 (6.7%) |
Employment Status by Educational Attainment in Umatilla County
According to labor force statistics for Umatilla County, 71.3% of individuals (28,563) out of the total population between 25 and 64 years of age (40,061) are in the labor force, with 5.1% or 1,457 of them being unemployed. The group with the highest labor force participation rate are those with the educational attainment of bachelor's degree or higher, with 83.4% or 6,107 individuals in the labor force. Within the labor force, individuals with less than high school education have the highest percentage of unemployment, with 9.4% or 380 of them being unemployed.
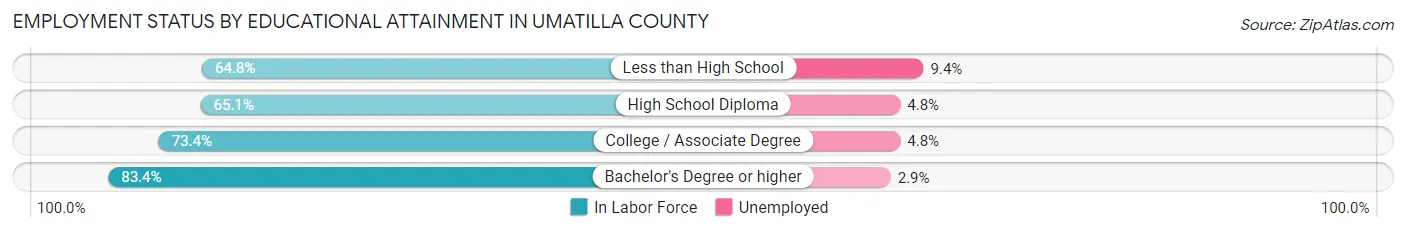
| Educational Attainment | In Labor Force | Unemployed |
| Less than High School | 4,040 (64.8%) | 586 (9.4%) |
| High School Diploma | 8,034 (65.1%) | 592 (4.8%) |
| College / Associate Degree | 10,395 (73.4%) | 680 (4.8%) |
| Bachelor's Degree or higher | 6,107 (83.4%) | 212 (2.9%) |
| Total | 28,563 (71.3%) | 2,043 (5.1%) |
Employment Occupations by Sex in Umatilla County
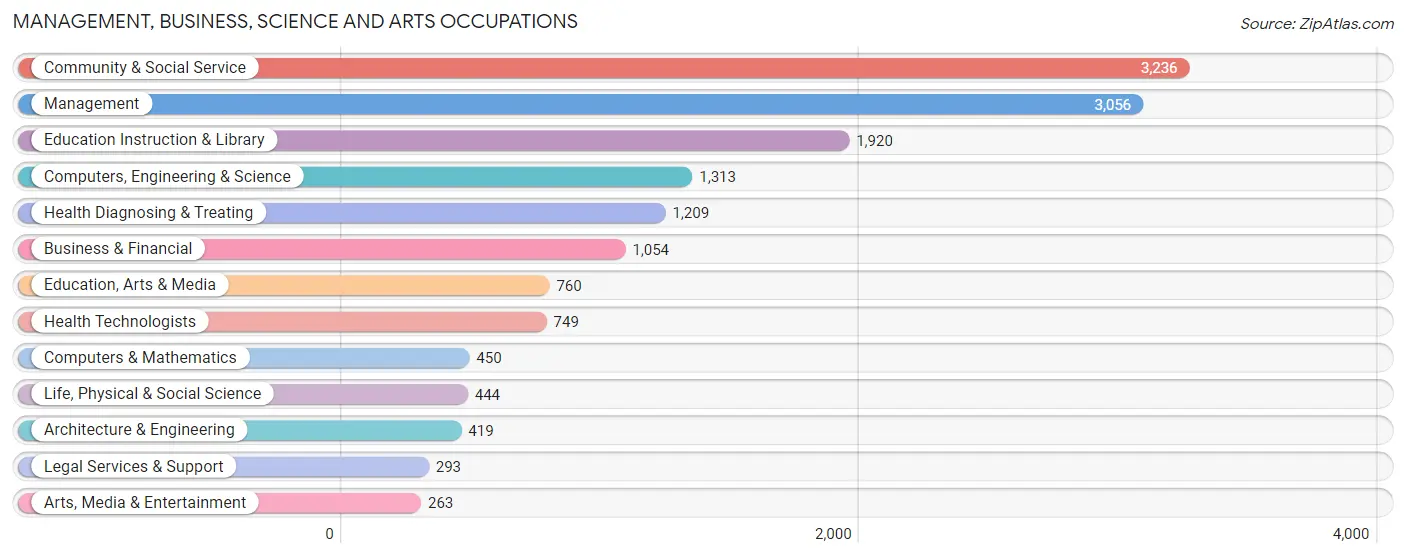
Management, Business, Science and Arts Occupations
The most common Management, Business, Science and Arts occupations in Umatilla County are Community & Social Service (3,236 | 9.5%), Management (3,056 | 9.0%), Education Instruction & Library (1,920 | 5.7%), Computers, Engineering & Science (1,313 | 3.9%), and Health Diagnosing & Treating (1,209 | 3.6%).
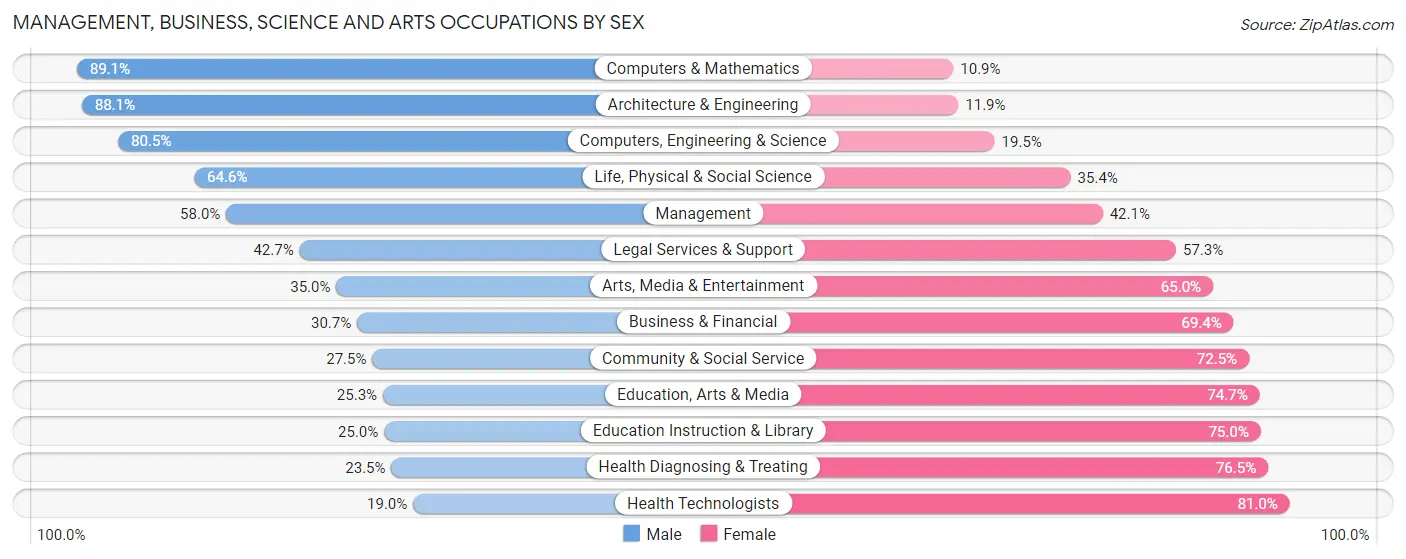
Management, Business, Science and Arts Occupations by Sex
Within the Management, Business, Science and Arts occupations in Umatilla County, the most male-oriented occupations are Computers & Mathematics (89.1%), Architecture & Engineering (88.1%), and Computers, Engineering & Science (80.5%), while the most female-oriented occupations are Health Technologists (81.0%), Health Diagnosing & Treating (76.5%), and Education Instruction & Library (75.0%).
| Occupation | Male | Female |
| Management | 1,771 (58.0%) | 1,285 (42.0%) |
| Business & Financial | 323 (30.6%) | 731 (69.4%) |
| Computers, Engineering & Science | 1,057 (80.5%) | 256 (19.5%) |
| Computers & Mathematics | 401 (89.1%) | 49 (10.9%) |
| Architecture & Engineering | 369 (88.1%) | 50 (11.9%) |
| Life, Physical & Social Science | 287 (64.6%) | 157 (35.4%) |
| Community & Social Service | 889 (27.5%) | 2,347 (72.5%) |
| Education, Arts & Media | 192 (25.3%) | 568 (74.7%) |
| Legal Services & Support | 125 (42.7%) | 168 (57.3%) |
| Education Instruction & Library | 480 (25.0%) | 1,440 (75.0%) |
| Arts, Media & Entertainment | 92 (35.0%) | 171 (65.0%) |
| Health Diagnosing & Treating | 284 (23.5%) | 925 (76.5%) |
| Health Technologists | 142 (19.0%) | 607 (81.0%) |
| Total (Category) | 4,324 (43.8%) | 5,544 (56.2%) |
| Total (Overall) | 18,009 (53.0%) | 15,970 (47.0%) |
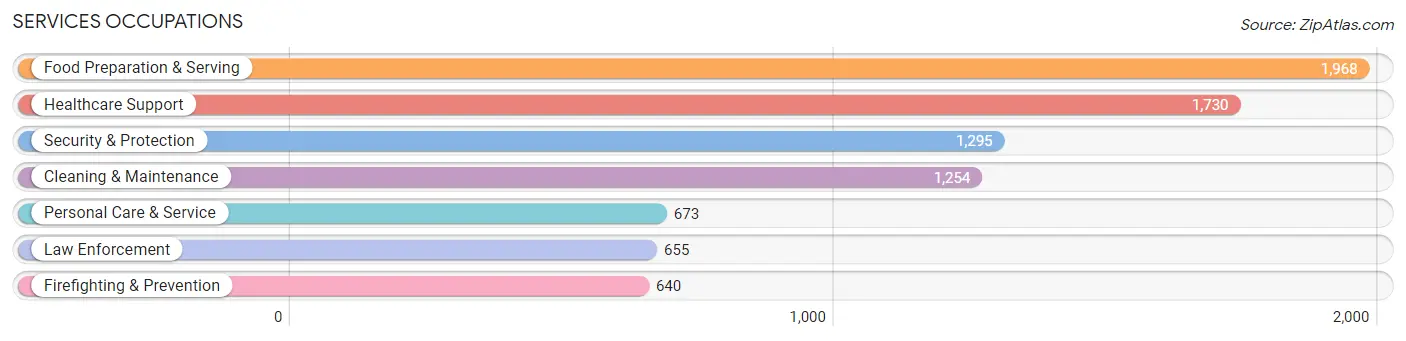
Services Occupations
The most common Services occupations in Umatilla County are Food Preparation & Serving (1,968 | 5.8%), Healthcare Support (1,730 | 5.1%), Security & Protection (1,295 | 3.8%), Cleaning & Maintenance (1,254 | 3.7%), and Personal Care & Service (673 | 2.0%).
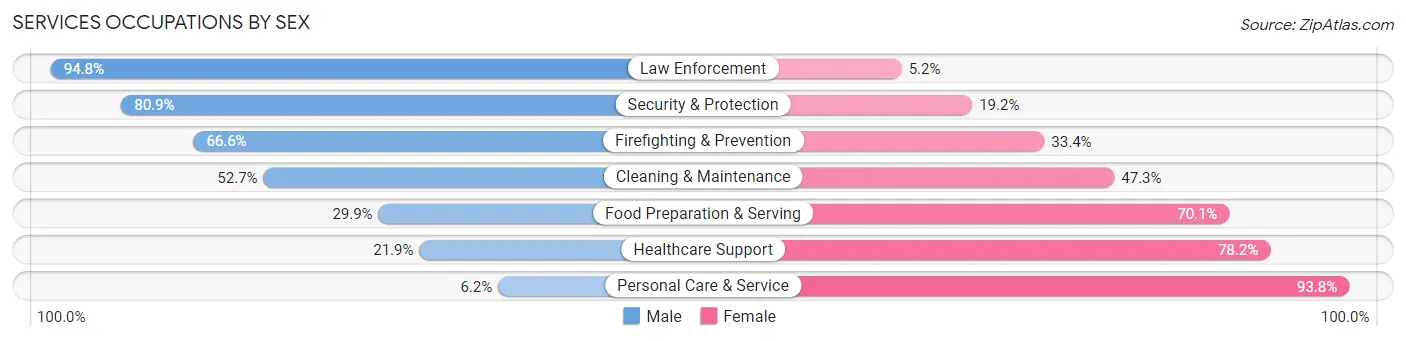
Services Occupations by Sex
Within the Services occupations in Umatilla County, the most male-oriented occupations are Law Enforcement (94.8%), Security & Protection (80.8%), and Firefighting & Prevention (66.6%), while the most female-oriented occupations are Personal Care & Service (93.8%), Healthcare Support (78.1%), and Food Preparation & Serving (70.1%).
| Occupation | Male | Female |
| Healthcare Support | 378 (21.8%) | 1,352 (78.1%) |
| Security & Protection | 1,047 (80.8%) | 248 (19.2%) |
| Firefighting & Prevention | 426 (66.6%) | 214 (33.4%) |
| Law Enforcement | 621 (94.8%) | 34 (5.2%) |
| Food Preparation & Serving | 589 (29.9%) | 1,379 (70.1%) |
| Cleaning & Maintenance | 661 (52.7%) | 593 (47.3%) |
| Personal Care & Service | 42 (6.2%) | 631 (93.8%) |
| Total (Category) | 2,717 (39.3%) | 4,203 (60.7%) |
| Total (Overall) | 18,009 (53.0%) | 15,970 (47.0%) |
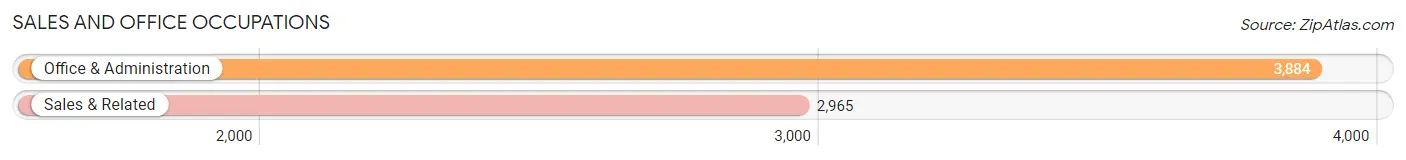
Sales and Office Occupations
The most common Sales and Office occupations in Umatilla County are Office & Administration (3,884 | 11.4%), and Sales & Related (2,965 | 8.7%).
Sales and Office Occupations by Sex
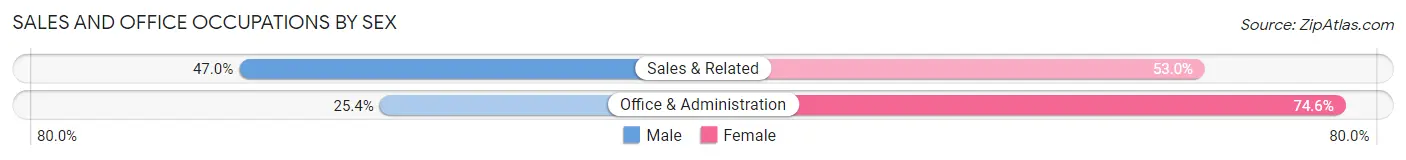
| Occupation | Male | Female |
| Sales & Related | 1,394 (47.0%) | 1,571 (53.0%) |
| Office & Administration | 986 (25.4%) | 2,898 (74.6%) |
| Total (Category) | 2,380 (34.7%) | 4,469 (65.2%) |
| Total (Overall) | 18,009 (53.0%) | 15,970 (47.0%) |
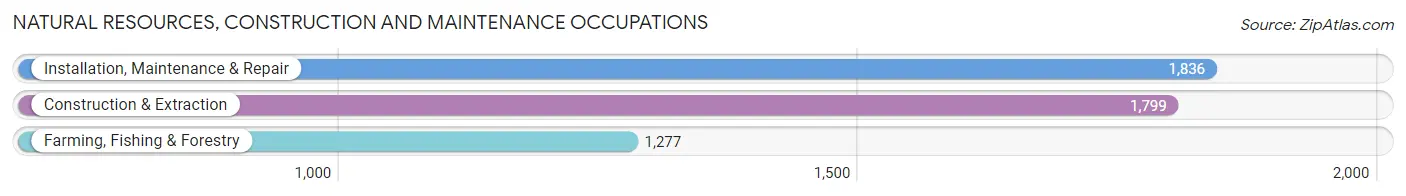
Natural Resources, Construction and Maintenance Occupations
The most common Natural Resources, Construction and Maintenance occupations in Umatilla County are Installation, Maintenance & Repair (1,836 | 5.4%), Construction & Extraction (1,799 | 5.3%), and Farming, Fishing & Forestry (1,277 | 3.8%).
Natural Resources, Construction and Maintenance Occupations by Sex
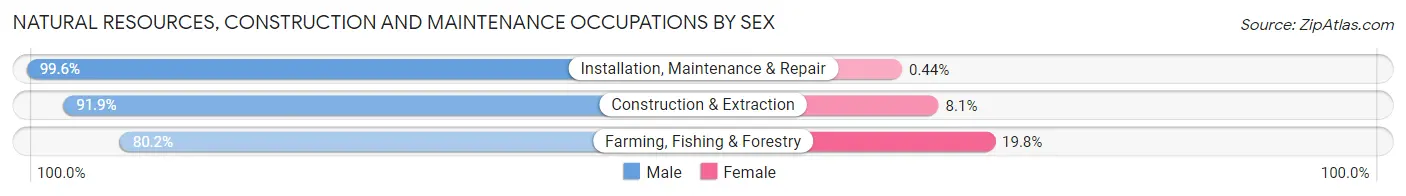
| Occupation | Male | Female |
| Farming, Fishing & Forestry | 1,024 (80.2%) | 253 (19.8%) |
| Construction & Extraction | 1,654 (91.9%) | 145 (8.1%) |
| Installation, Maintenance & Repair | 1,828 (99.6%) | 8 (0.4%) |
| Total (Category) | 4,506 (91.7%) | 406 (8.3%) |
| Total (Overall) | 18,009 (53.0%) | 15,970 (47.0%) |
Production, Transportation and Moving Occupations
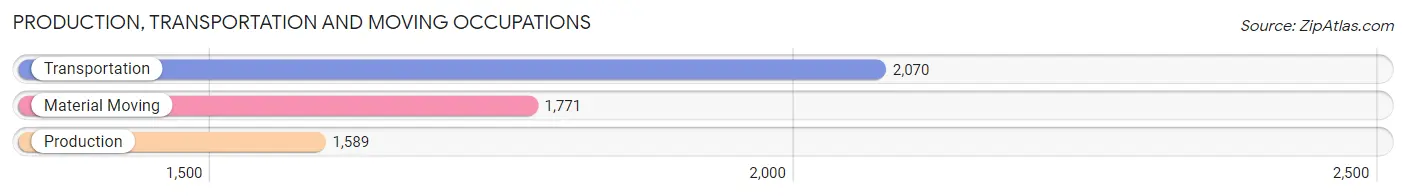
The most common Production, Transportation and Moving occupations in Umatilla County are Transportation (2,070 | 6.1%), Material Moving (1,771 | 5.2%), and Production (1,589 | 4.7%).
Production, Transportation and Moving Occupations by Sex
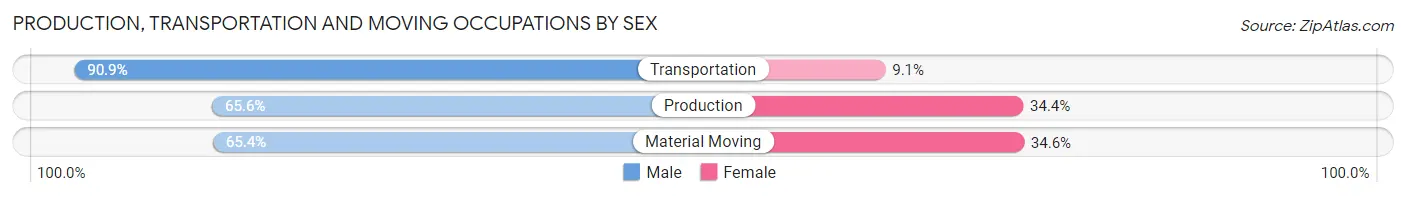
| Occupation | Male | Female |
| Production | 1,042 (65.6%) | 547 (34.4%) |
| Transportation | 1,881 (90.9%) | 189 (9.1%) |
| Material Moving | 1,159 (65.4%) | 612 (34.6%) |
| Total (Category) | 4,082 (75.2%) | 1,348 (24.8%) |
| Total (Overall) | 18,009 (53.0%) | 15,970 (47.0%) |
Employment Industries by Sex in Umatilla County
Employment Industries in Umatilla County
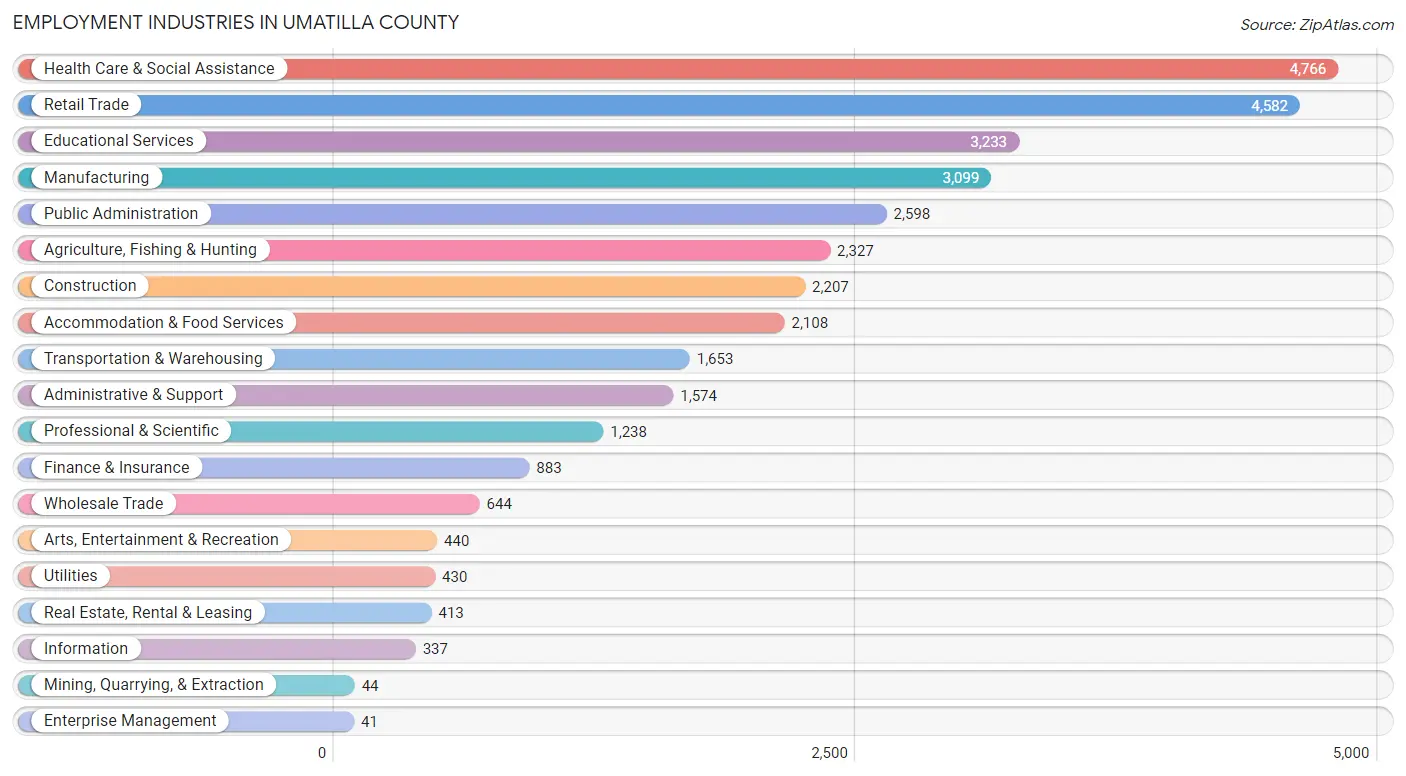
The major employment industries in Umatilla County include Health Care & Social Assistance (4,766 | 14.0%), Retail Trade (4,582 | 13.5%), Educational Services (3,233 | 9.5%), Manufacturing (3,099 | 9.1%), and Public Administration (2,598 | 7.6%).
Employment Industries by Sex in Umatilla County
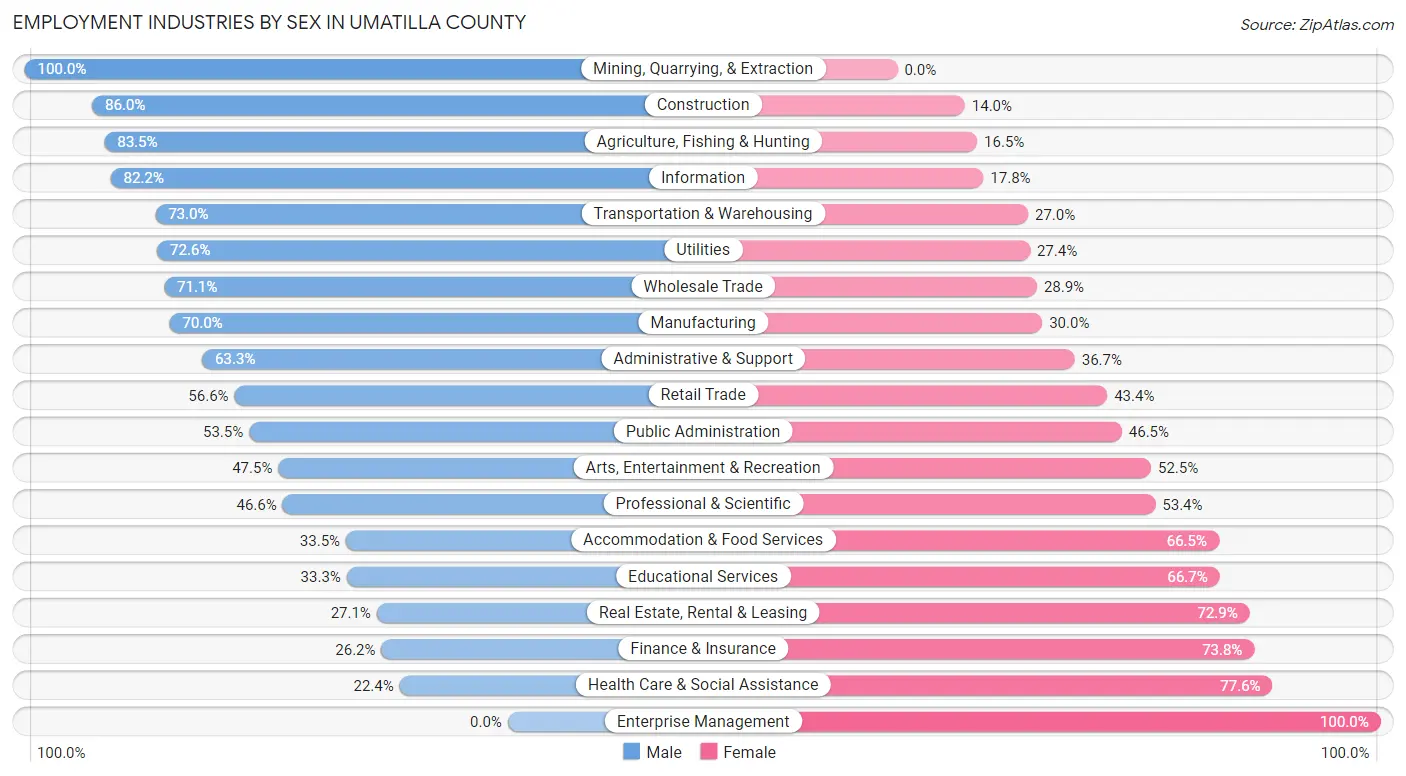
The Umatilla County industries that see more men than women are Mining, Quarrying, & Extraction (100.0%), Construction (86.0%), and Agriculture, Fishing & Hunting (83.5%), whereas the industries that tend to have a higher number of women are Enterprise Management (100.0%), Health Care & Social Assistance (77.6%), and Finance & Insurance (73.8%).
| Industry | Male | Female |
| Agriculture, Fishing & Hunting | 1,943 (83.5%) | 384 (16.5%) |
| Mining, Quarrying, & Extraction | 44 (100.0%) | 0 (0.0%) |
| Construction | 1,899 (86.0%) | 308 (14.0%) |
| Manufacturing | 2,170 (70.0%) | 929 (30.0%) |
| Wholesale Trade | 458 (71.1%) | 186 (28.9%) |
| Retail Trade | 2,592 (56.6%) | 1,990 (43.4%) |
| Transportation & Warehousing | 1,206 (73.0%) | 447 (27.0%) |
| Utilities | 312 (72.6%) | 118 (27.4%) |
| Information | 277 (82.2%) | 60 (17.8%) |
| Finance & Insurance | 231 (26.2%) | 652 (73.8%) |
| Real Estate, Rental & Leasing | 112 (27.1%) | 301 (72.9%) |
| Professional & Scientific | 577 (46.6%) | 661 (53.4%) |
| Enterprise Management | 0 (0.0%) | 41 (100.0%) |
| Administrative & Support | 996 (63.3%) | 578 (36.7%) |
| Educational Services | 1,078 (33.3%) | 2,155 (66.7%) |
| Health Care & Social Assistance | 1,067 (22.4%) | 3,699 (77.6%) |
| Arts, Entertainment & Recreation | 209 (47.5%) | 231 (52.5%) |
| Accommodation & Food Services | 706 (33.5%) | 1,402 (66.5%) |
| Public Administration | 1,391 (53.5%) | 1,207 (46.5%) |
| Total | 18,009 (53.0%) | 15,970 (47.0%) |
Education in Umatilla County
School Enrollment in Umatilla County
The most common levels of schooling among the 19,724 students in Umatilla County are high school (5,114 | 25.9%), middle school (4,724 | 23.9%), and elementary school (3,893 | 19.7%).
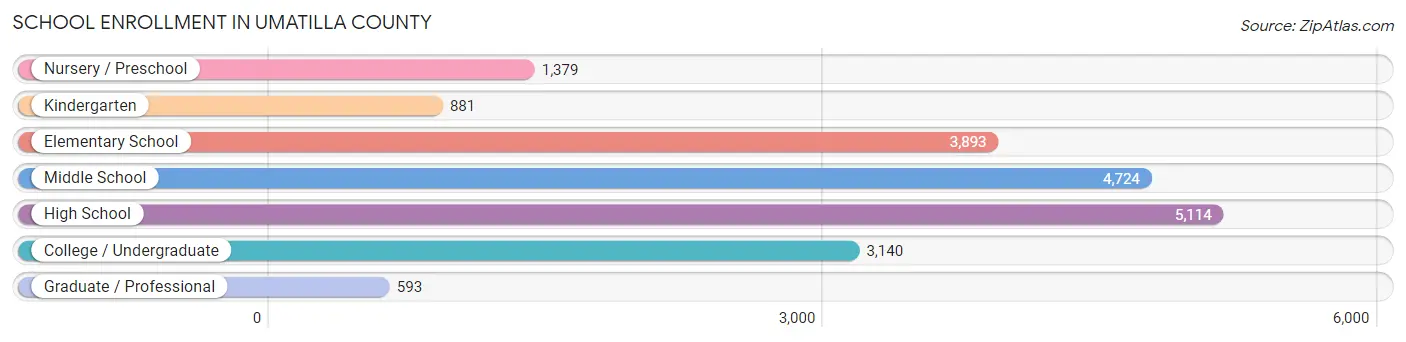
| School Level | # Students | % Students |
| Nursery / Preschool | 1,379 | 7.0% |
| Kindergarten | 881 | 4.5% |
| Elementary School | 3,893 | 19.7% |
| Middle School | 4,724 | 23.9% |
| High School | 5,114 | 25.9% |
| College / Undergraduate | 3,140 | 15.9% |
| Graduate / Professional | 593 | 3.0% |
| Total | 19,724 | 100.0% |
School Enrollment by Age by Funding Source in Umatilla County
Out of a total of 19,724 students who are enrolled in schools in Umatilla County, 1,972 (10.0%) attend a private institution, while the remaining 17,752 (90.0%) are enrolled in public schools. The age group of 35 years and over has the highest likelihood of being enrolled in private schools, with 350 (40.9% in the age bracket) enrolled. Conversely, the age group of 18 to 19 year olds has the lowest likelihood of being enrolled in a private school, with 1,440 (97.6% in the age bracket) attending a public institution.
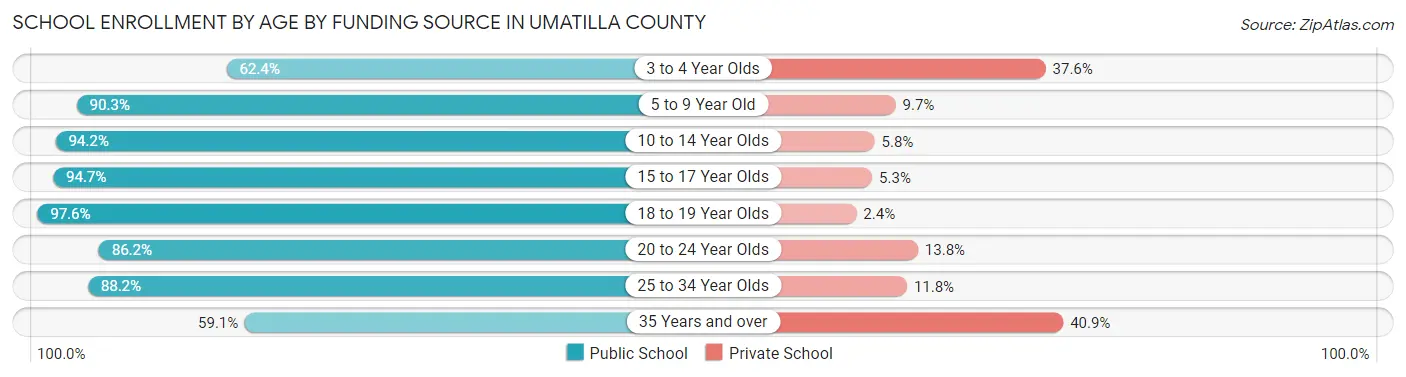
| Age Bracket | Public School | Private School |
| 3 to 4 Year Olds | 438 (62.4%) | 264 (37.6%) |
| 5 to 9 Year Old | 4,182 (90.3%) | 448 (9.7%) |
| 10 to 14 Year Olds | 5,598 (94.2%) | 342 (5.8%) |
| 15 to 17 Year Olds | 3,244 (94.7%) | 182 (5.3%) |
| 18 to 19 Year Olds | 1,440 (97.6%) | 35 (2.4%) |
| 20 to 24 Year Olds | 1,533 (86.2%) | 246 (13.8%) |
| 25 to 34 Year Olds | 808 (88.2%) | 108 (11.8%) |
| 35 Years and over | 506 (59.1%) | 350 (40.9%) |
| Total | 17,752 (90.0%) | 1,972 (10.0%) |
Educational Attainment by Field of Study in Umatilla County
Education (1,874 | 17.6%), business (1,318 | 12.4%), social sciences (996 | 9.3%), bio, nature & agricultural (980 | 9.2%), and science & technology (980 | 9.2%) are the most common fields of study among 10,658 individuals in Umatilla County who have obtained a bachelor's degree or higher.
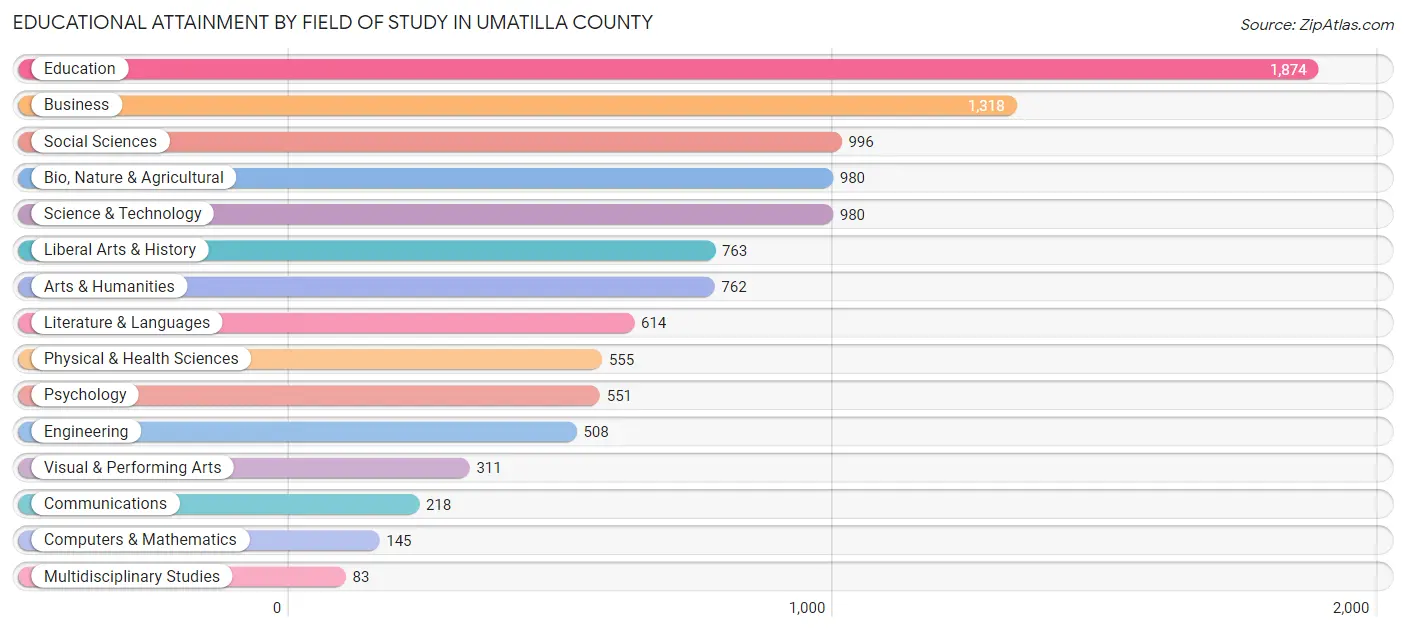
| Field of Study | # Graduates | % Graduates |
| Computers & Mathematics | 145 | 1.4% |
| Bio, Nature & Agricultural | 980 | 9.2% |
| Physical & Health Sciences | 555 | 5.2% |
| Psychology | 551 | 5.2% |
| Social Sciences | 996 | 9.3% |
| Engineering | 508 | 4.8% |
| Multidisciplinary Studies | 83 | 0.8% |
| Science & Technology | 980 | 9.2% |
| Business | 1,318 | 12.4% |
| Education | 1,874 | 17.6% |
| Literature & Languages | 614 | 5.8% |
| Liberal Arts & History | 763 | 7.2% |
| Visual & Performing Arts | 311 | 2.9% |
| Communications | 218 | 2.1% |
| Arts & Humanities | 762 | 7.1% |
| Total | 10,658 | 100.0% |
Transportation & Commute in Umatilla County
Vehicle Availability by Sex in Umatilla County
The most prevalent vehicle ownership categories in Umatilla County are males with 2 vehicles (5,972, accounting for 33.5%) and females with 2 vehicles (5,777, making up 38.7%).
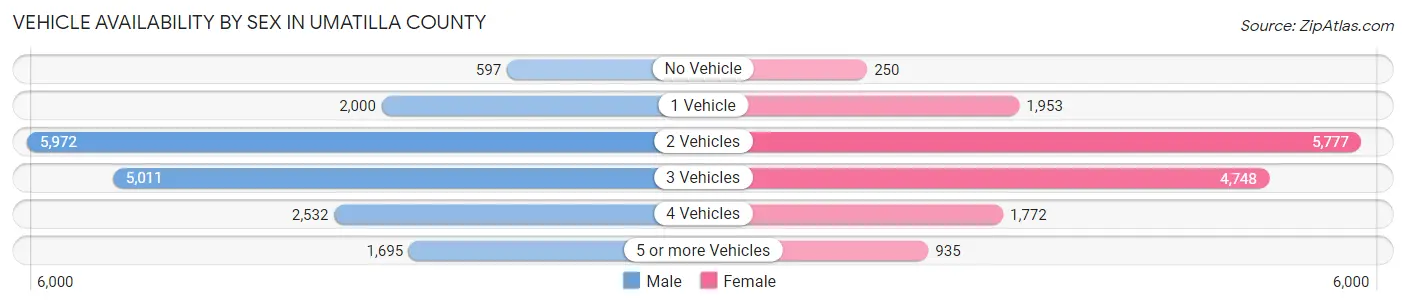
| Vehicles Available | Male | Female |
| No Vehicle | 597 (3.4%) | 250 (1.6%) |
| 1 Vehicle | 2,000 (11.2%) | 1,953 (12.7%) |
| 2 Vehicles | 5,972 (33.5%) | 5,777 (37.4%) |
| 3 Vehicles | 5,011 (28.1%) | 4,748 (30.8%) |
| 4 Vehicles | 2,532 (14.2%) | 1,772 (11.5%) |
| 5 or more Vehicles | 1,695 (9.5%) | 935 (6.1%) |
| Total | 17,807 (100.0%) | 15,435 (100.0%) |
Commute Time in Umatilla County
The most frequently occuring commute durations in Umatilla County are 5 to 9 minutes (6,491 commuters, 20.5%), 10 to 14 minutes (6,221 commuters, 19.7%), and 15 to 19 minutes (4,200 commuters, 13.3%).
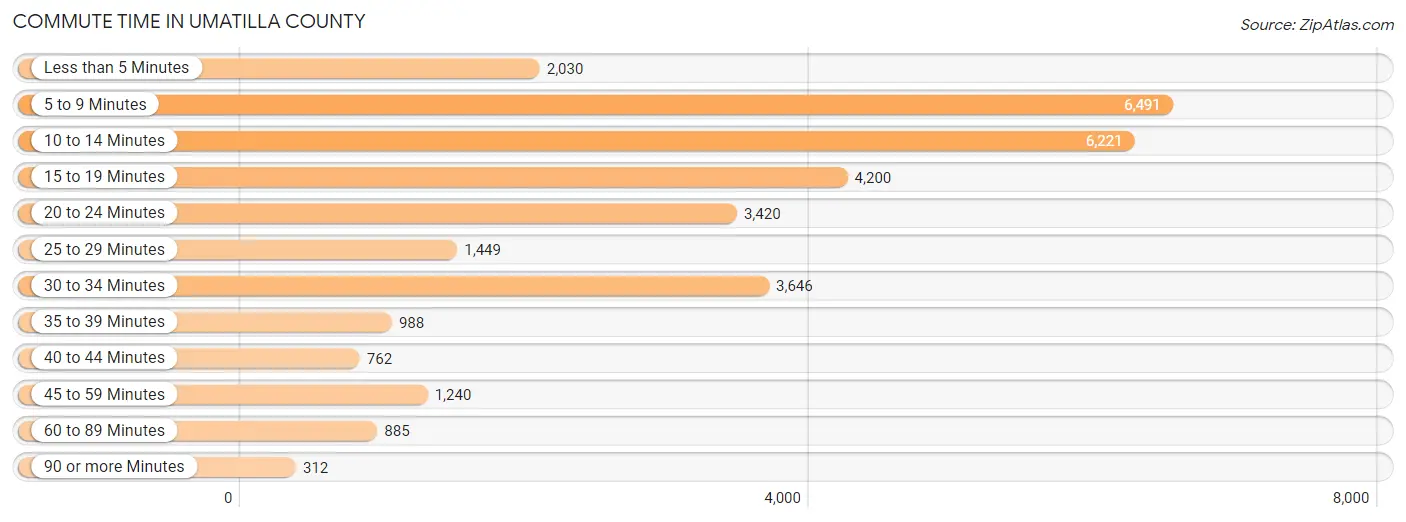
| Commute Time | # Commuters | % Commuters |
| Less than 5 Minutes | 2,030 | 6.4% |
| 5 to 9 Minutes | 6,491 | 20.5% |
| 10 to 14 Minutes | 6,221 | 19.7% |
| 15 to 19 Minutes | 4,200 | 13.3% |
| 20 to 24 Minutes | 3,420 | 10.8% |
| 25 to 29 Minutes | 1,449 | 4.6% |
| 30 to 34 Minutes | 3,646 | 11.5% |
| 35 to 39 Minutes | 988 | 3.1% |
| 40 to 44 Minutes | 762 | 2.4% |
| 45 to 59 Minutes | 1,240 | 3.9% |
| 60 to 89 Minutes | 885 | 2.8% |
| 90 or more Minutes | 312 | 1.0% |
Commute Time by Sex in Umatilla County
The most common commute times in Umatilla County are 10 to 14 minutes (3,144 commuters, 18.3%) for males and 5 to 9 minutes (3,541 commuters, 24.5%) for females.
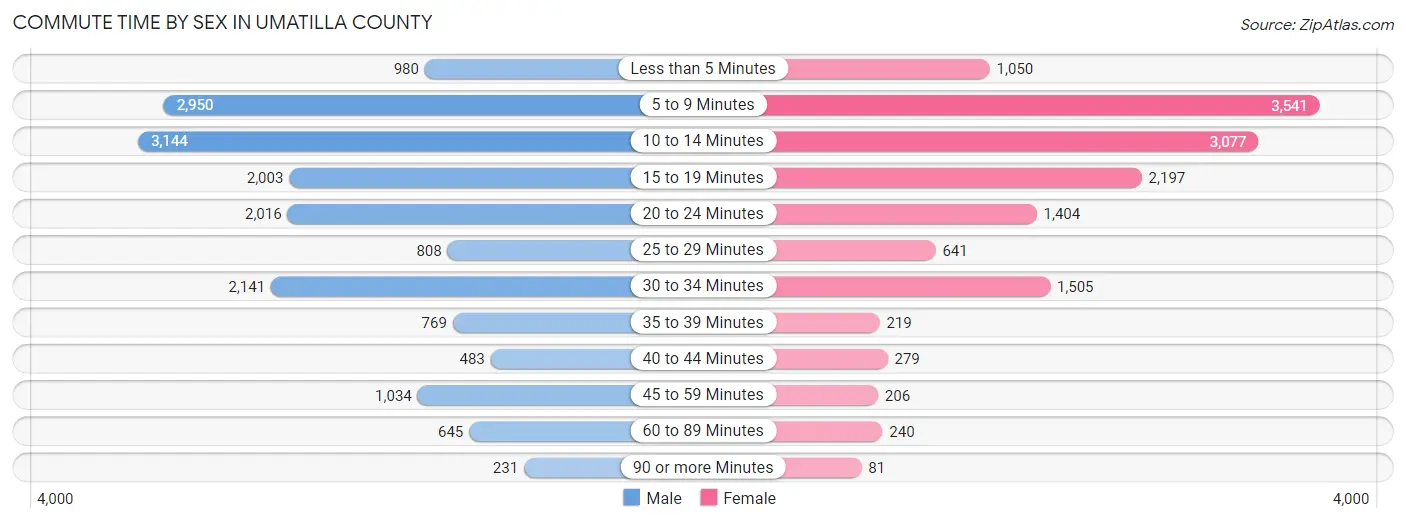
| Commute Time | Male | Female |
| Less than 5 Minutes | 980 (5.7%) | 1,050 (7.3%) |
| 5 to 9 Minutes | 2,950 (17.2%) | 3,541 (24.5%) |
| 10 to 14 Minutes | 3,144 (18.3%) | 3,077 (21.3%) |
| 15 to 19 Minutes | 2,003 (11.6%) | 2,197 (15.2%) |
| 20 to 24 Minutes | 2,016 (11.7%) | 1,404 (9.7%) |
| 25 to 29 Minutes | 808 (4.7%) | 641 (4.4%) |
| 30 to 34 Minutes | 2,141 (12.4%) | 1,505 (10.4%) |
| 35 to 39 Minutes | 769 (4.5%) | 219 (1.5%) |
| 40 to 44 Minutes | 483 (2.8%) | 279 (1.9%) |
| 45 to 59 Minutes | 1,034 (6.0%) | 206 (1.4%) |
| 60 to 89 Minutes | 645 (3.7%) | 240 (1.7%) |
| 90 or more Minutes | 231 (1.3%) | 81 (0.6%) |
Time of Departure to Work by Sex in Umatilla County
The most frequent times of departure to work in Umatilla County are 7:00 AM to 7:29 AM (2,281, 13.3%) for males and 7:30 AM to 7:59 AM (2,519, 17.4%) for females.
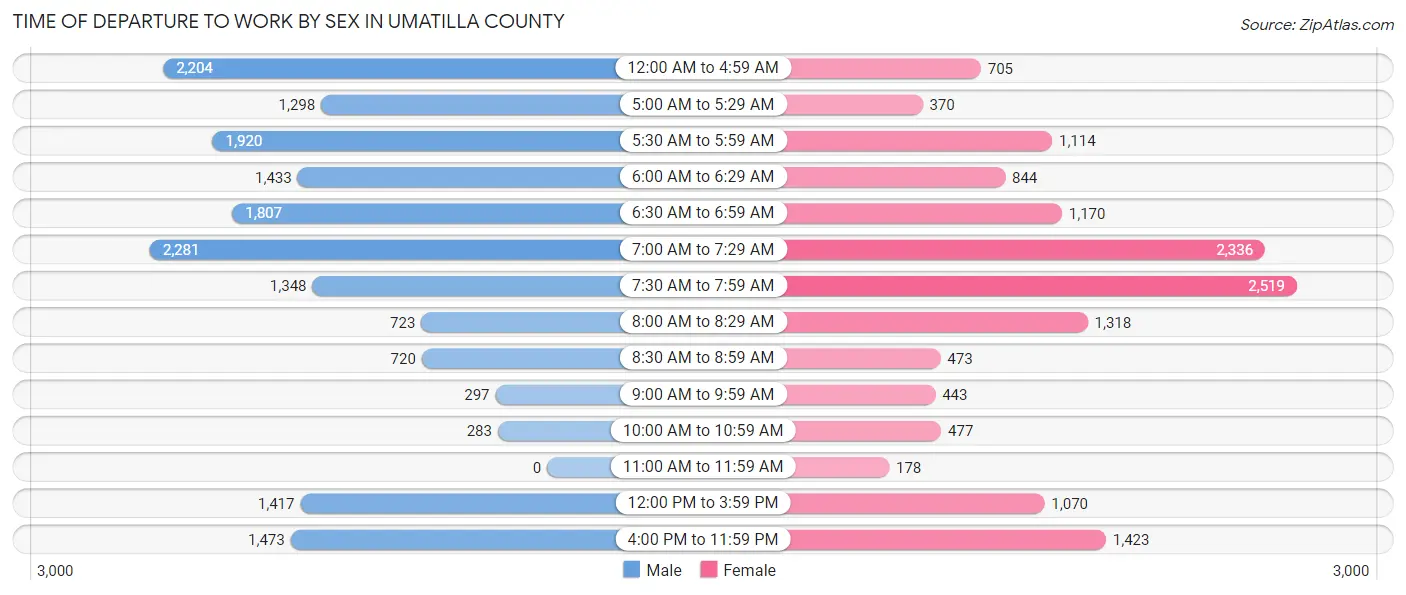
| Time of Departure | Male | Female |
| 12:00 AM to 4:59 AM | 2,204 (12.8%) | 705 (4.9%) |
| 5:00 AM to 5:29 AM | 1,298 (7.5%) | 370 (2.6%) |
| 5:30 AM to 5:59 AM | 1,920 (11.2%) | 1,114 (7.7%) |
| 6:00 AM to 6:29 AM | 1,433 (8.3%) | 844 (5.8%) |
| 6:30 AM to 6:59 AM | 1,807 (10.5%) | 1,170 (8.1%) |
| 7:00 AM to 7:29 AM | 2,281 (13.3%) | 2,336 (16.2%) |
| 7:30 AM to 7:59 AM | 1,348 (7.8%) | 2,519 (17.4%) |
| 8:00 AM to 8:29 AM | 723 (4.2%) | 1,318 (9.1%) |
| 8:30 AM to 8:59 AM | 720 (4.2%) | 473 (3.3%) |
| 9:00 AM to 9:59 AM | 297 (1.7%) | 443 (3.1%) |
| 10:00 AM to 10:59 AM | 283 (1.6%) | 477 (3.3%) |
| 11:00 AM to 11:59 AM | 0 (0.0%) | 178 (1.2%) |
| 12:00 PM to 3:59 PM | 1,417 (8.2%) | 1,070 (7.4%) |
| 4:00 PM to 11:59 PM | 1,473 (8.6%) | 1,423 (9.9%) |
| Total | 17,204 (100.0%) | 14,440 (100.0%) |
Housing Occupancy in Umatilla County
Occupancy by Ownership in Umatilla County
Of the total 27,422 dwellings in Umatilla County, owner-occupied units account for 18,247 (66.5%), while renter-occupied units make up 9,175 (33.5%).
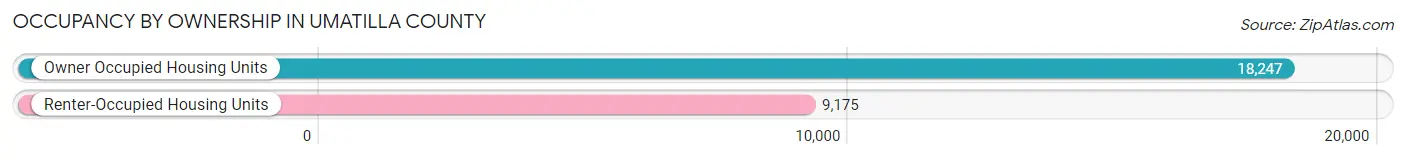
| Occupancy | # Housing Units | % Housing Units |
| Owner Occupied Housing Units | 18,247 | 66.5% |
| Renter-Occupied Housing Units | 9,175 | 33.5% |
| Total Occupied Housing Units | 27,422 | 100.0% |
Occupancy by Household Size in Umatilla County
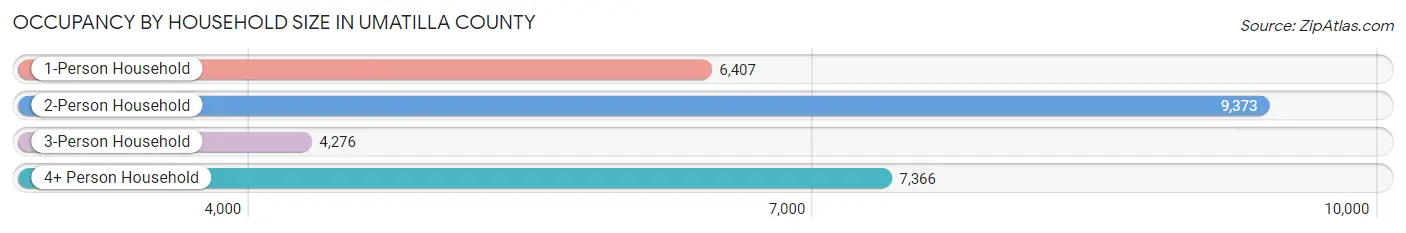
| Household Size | # Housing Units | % Housing Units |
| 1-Person Household | 6,407 | 23.4% |
| 2-Person Household | 9,373 | 34.2% |
| 3-Person Household | 4,276 | 15.6% |
| 4+ Person Household | 7,366 | 26.9% |
| Total Housing Units | 27,422 | 100.0% |
Occupancy by Ownership by Household Size in Umatilla County
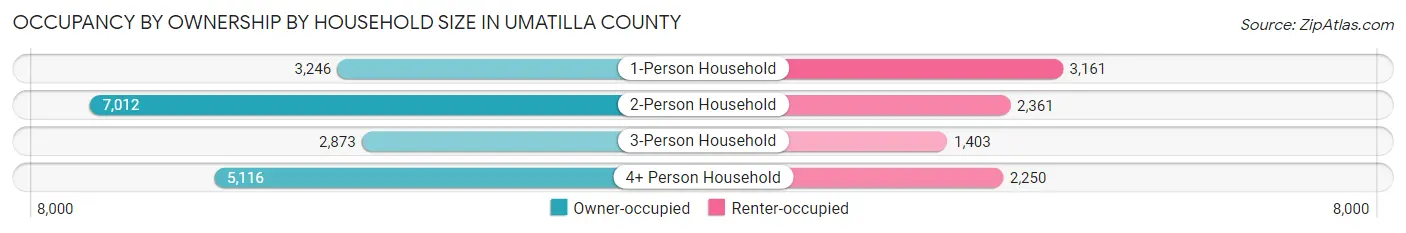
| Household Size | Owner-occupied | Renter-occupied |
| 1-Person Household | 3,246 (50.7%) | 3,161 (49.3%) |
| 2-Person Household | 7,012 (74.8%) | 2,361 (25.2%) |
| 3-Person Household | 2,873 (67.2%) | 1,403 (32.8%) |
| 4+ Person Household | 5,116 (69.5%) | 2,250 (30.5%) |
| Total Housing Units | 18,247 (66.5%) | 9,175 (33.5%) |
Occupancy by Educational Attainment in Umatilla County
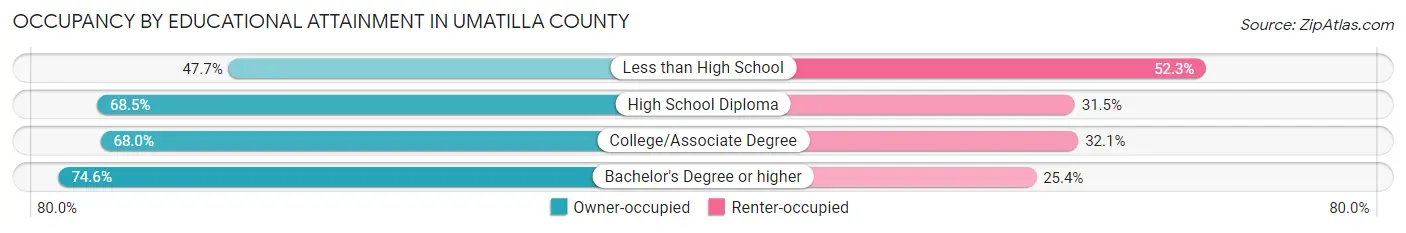
| Household Size | Owner-occupied | Renter-occupied |
| Less than High School | 1,874 (47.7%) | 2,058 (52.3%) |
| High School Diploma | 5,246 (68.5%) | 2,412 (31.5%) |
| College/Associate Degree | 6,999 (67.9%) | 3,301 (32.1%) |
| Bachelor's Degree or higher | 4,128 (74.6%) | 1,404 (25.4%) |
Occupancy by Age of Householder in Umatilla County
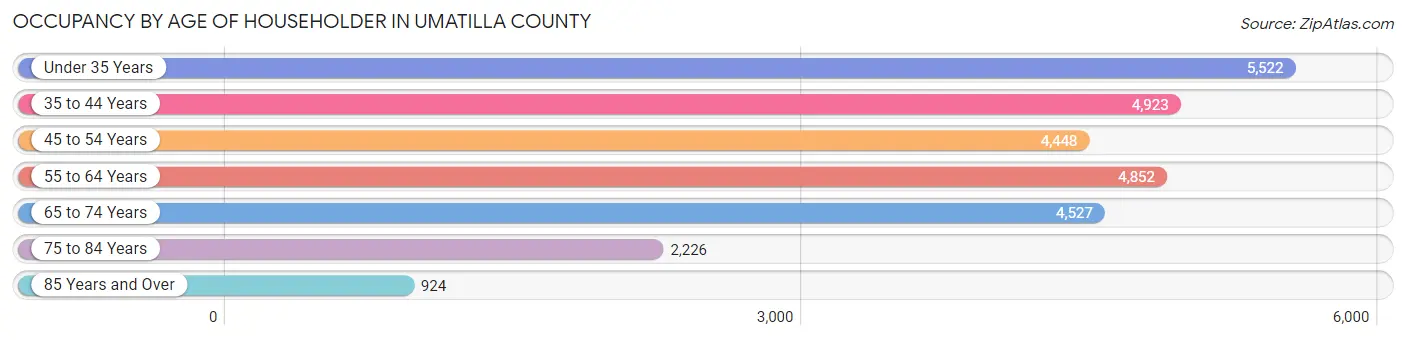
| Age Bracket | # Households | % Households |
| Under 35 Years | 5,522 | 20.1% |
| 35 to 44 Years | 4,923 | 17.9% |
| 45 to 54 Years | 4,448 | 16.2% |
| 55 to 64 Years | 4,852 | 17.7% |
| 65 to 74 Years | 4,527 | 16.5% |
| 75 to 84 Years | 2,226 | 8.1% |
| 85 Years and Over | 924 | 3.4% |
| Total | 27,422 | 100.0% |
Housing Finances in Umatilla County
Median Income by Occupancy in Umatilla County
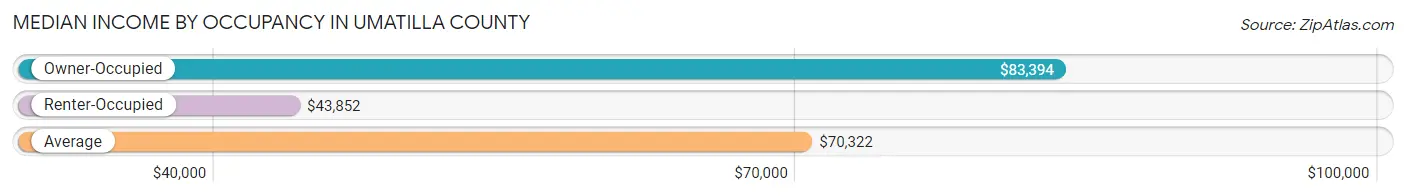
| Occupancy Type | # Households | Median Income |
| Owner-Occupied | 18,247 (66.5%) | $83,394 |
| Renter-Occupied | 9,175 (33.5%) | $43,852 |
| Average | 27,422 (100.0%) | $70,322 |
Occupancy by Householder Income Bracket in Umatilla County
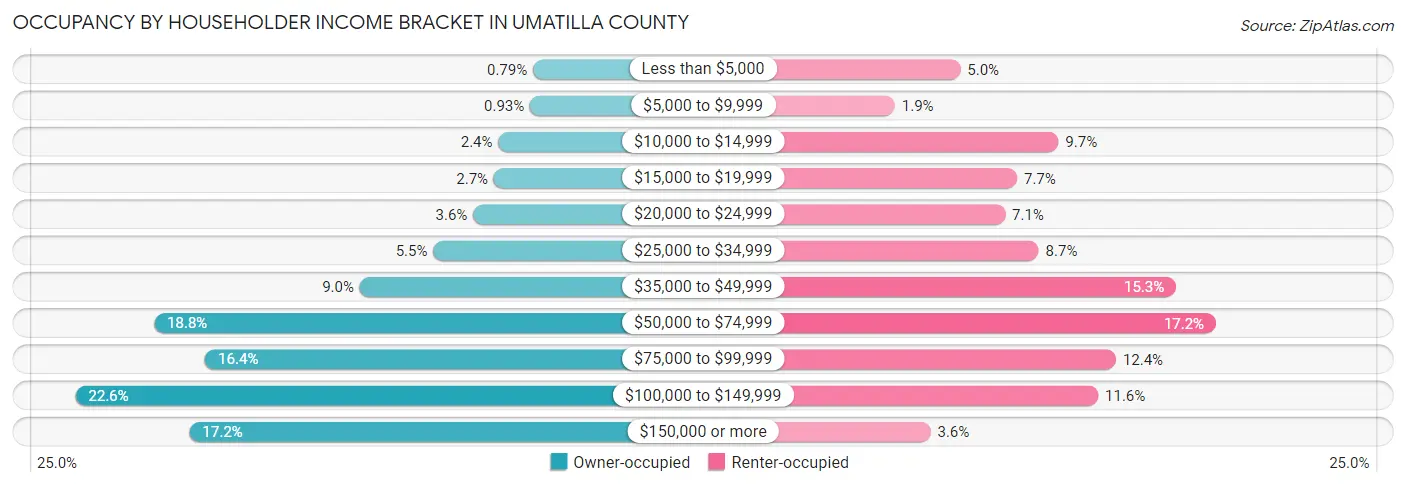
| Income Bracket | Owner-occupied | Renter-occupied |
| Less than $5,000 | 144 (0.8%) | 458 (5.0%) |
| $5,000 to $9,999 | 169 (0.9%) | 172 (1.9%) |
| $10,000 to $14,999 | 446 (2.4%) | 886 (9.7%) |
| $15,000 to $19,999 | 483 (2.6%) | 706 (7.7%) |
| $20,000 to $24,999 | 664 (3.6%) | 653 (7.1%) |
| $25,000 to $34,999 | 1,011 (5.5%) | 800 (8.7%) |
| $35,000 to $49,999 | 1,650 (9.0%) | 1,400 (15.3%) |
| $50,000 to $74,999 | 3,437 (18.8%) | 1,574 (17.2%) |
| $75,000 to $99,999 | 2,993 (16.4%) | 1,138 (12.4%) |
| $100,000 to $149,999 | 4,120 (22.6%) | 1,060 (11.6%) |
| $150,000 or more | 3,130 (17.2%) | 328 (3.6%) |
| Total | 18,247 (100.0%) | 9,175 (100.0%) |
Monthly Housing Cost Tiers in Umatilla County
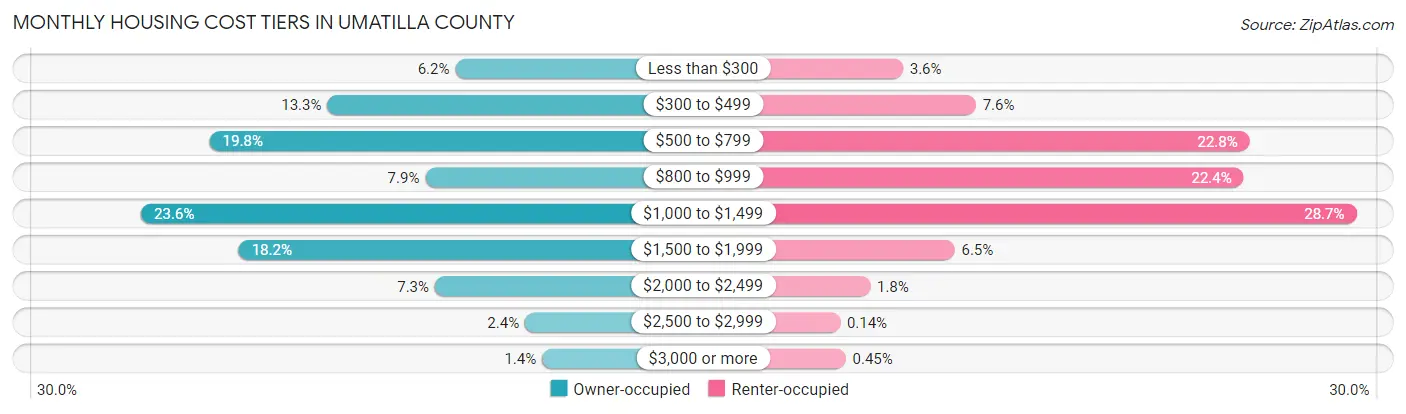
| Monthly Cost | Owner-occupied | Renter-occupied |
| Less than $300 | 1,134 (6.2%) | 331 (3.6%) |
| $300 to $499 | 2,423 (13.3%) | 701 (7.6%) |
| $500 to $799 | 3,610 (19.8%) | 2,088 (22.8%) |
| $800 to $999 | 1,436 (7.9%) | 2,058 (22.4%) |
| $1,000 to $1,499 | 4,300 (23.6%) | 2,630 (28.7%) |
| $1,500 to $1,999 | 3,316 (18.2%) | 594 (6.5%) |
| $2,000 to $2,499 | 1,339 (7.3%) | 165 (1.8%) |
| $2,500 to $2,999 | 430 (2.4%) | 13 (0.1%) |
| $3,000 or more | 259 (1.4%) | 41 (0.4%) |
| Total | 18,247 (100.0%) | 9,175 (100.0%) |
Physical Housing Characteristics in Umatilla County
Housing Structures in Umatilla County
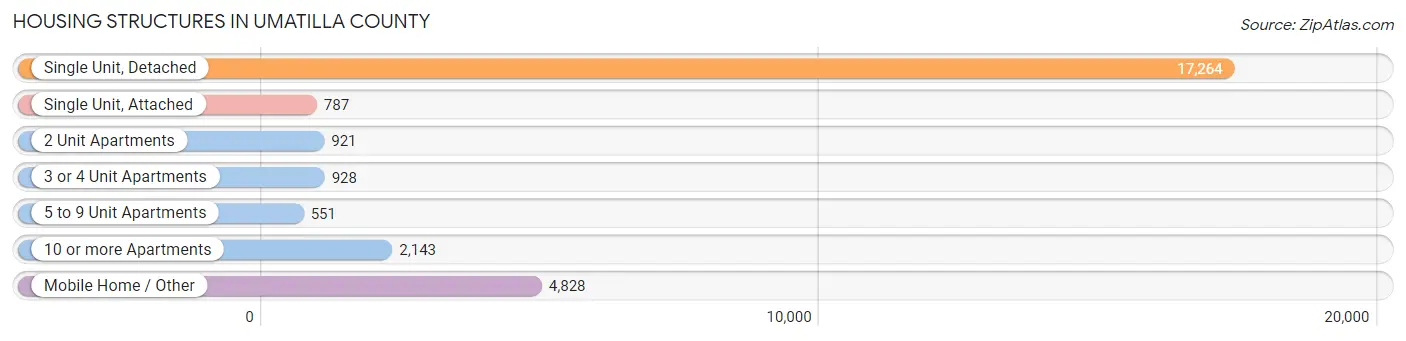
| Structure Type | # Housing Units | % Housing Units |
| Single Unit, Detached | 17,264 | 63.0% |
| Single Unit, Attached | 787 | 2.9% |
| 2 Unit Apartments | 921 | 3.4% |
| 3 or 4 Unit Apartments | 928 | 3.4% |
| 5 to 9 Unit Apartments | 551 | 2.0% |
| 10 or more Apartments | 2,143 | 7.8% |
| Mobile Home / Other | 4,828 | 17.6% |
| Total | 27,422 | 100.0% |
Housing Structures by Occupancy in Umatilla County
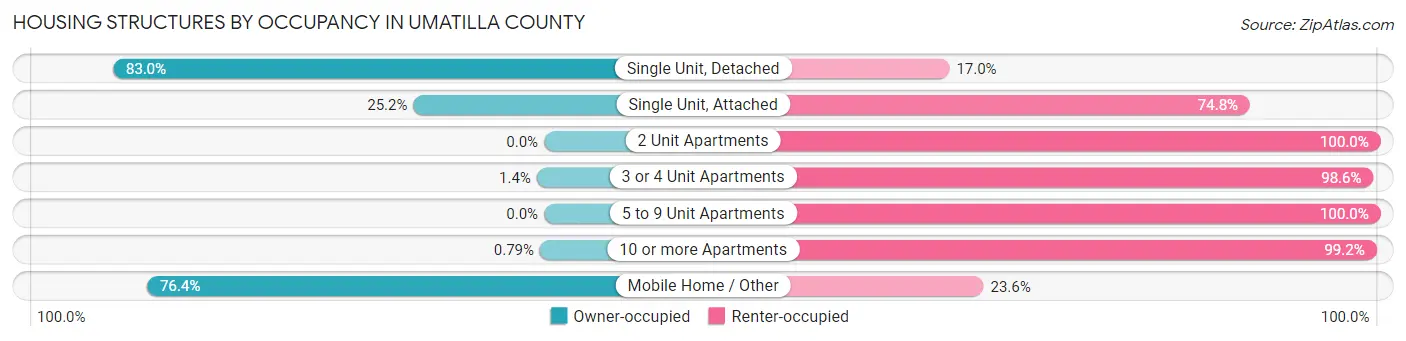
| Structure Type | Owner-occupied | Renter-occupied |
| Single Unit, Detached | 14,329 (83.0%) | 2,935 (17.0%) |
| Single Unit, Attached | 198 (25.2%) | 589 (74.8%) |
| 2 Unit Apartments | 0 (0.0%) | 921 (100.0%) |
| 3 or 4 Unit Apartments | 13 (1.4%) | 915 (98.6%) |
| 5 to 9 Unit Apartments | 0 (0.0%) | 551 (100.0%) |
| 10 or more Apartments | 17 (0.8%) | 2,126 (99.2%) |
| Mobile Home / Other | 3,690 (76.4%) | 1,138 (23.6%) |
| Total | 18,247 (66.5%) | 9,175 (33.5%) |
Housing Structures by Number of Rooms in Umatilla County
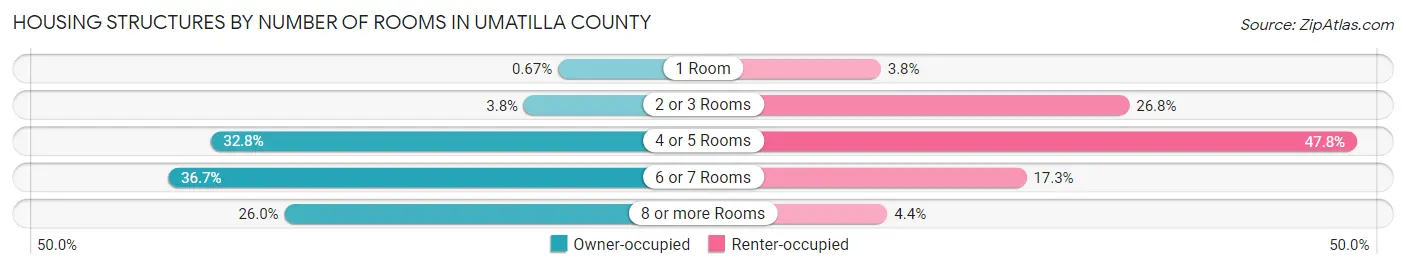
| Number of Rooms | Owner-occupied | Renter-occupied |
| 1 Room | 122 (0.7%) | 347 (3.8%) |
| 2 or 3 Rooms | 697 (3.8%) | 2,455 (26.8%) |
| 4 or 5 Rooms | 5,989 (32.8%) | 4,387 (47.8%) |
| 6 or 7 Rooms | 6,701 (36.7%) | 1,583 (17.2%) |
| 8 or more Rooms | 4,738 (26.0%) | 403 (4.4%) |
| Total | 18,247 (100.0%) | 9,175 (100.0%) |
Housing Structure by Heating Type in Umatilla County
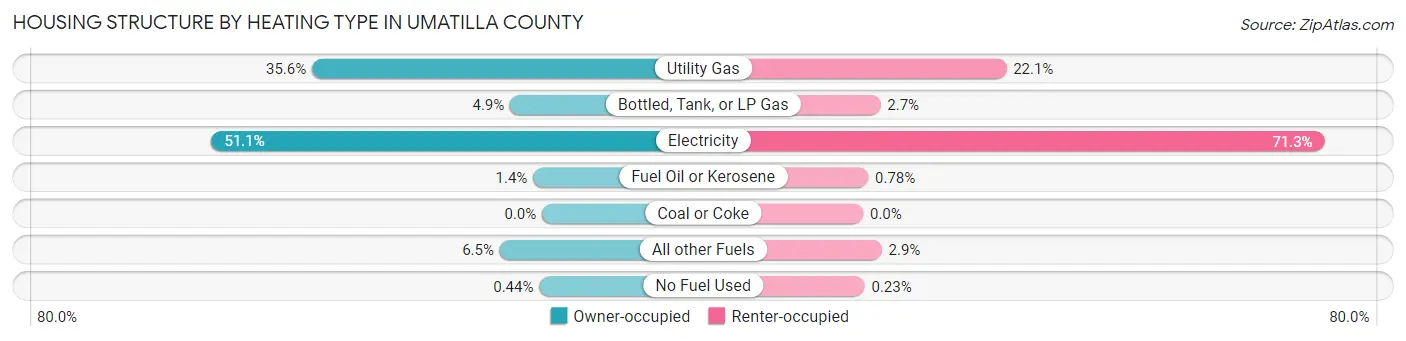
| Heating Type | Owner-occupied | Renter-occupied |
| Utility Gas | 6,489 (35.6%) | 2,030 (22.1%) |
| Bottled, Tank, or LP Gas | 901 (4.9%) | 245 (2.7%) |
| Electricity | 9,330 (51.1%) | 6,544 (71.3%) |
| Fuel Oil or Kerosene | 252 (1.4%) | 72 (0.8%) |
| Coal or Coke | 0 (0.0%) | 0 (0.0%) |
| All other Fuels | 1,194 (6.5%) | 263 (2.9%) |
| No Fuel Used | 81 (0.4%) | 21 (0.2%) |
| Total | 18,247 (100.0%) | 9,175 (100.0%) |
Household Vehicle Usage in Umatilla County
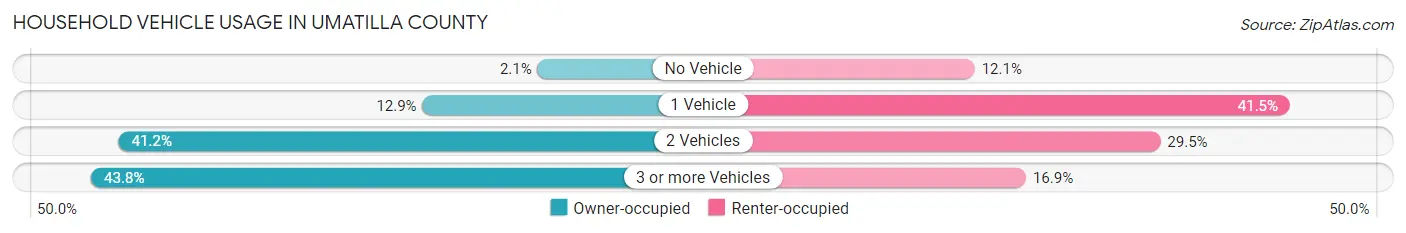
| Vehicles per Household | Owner-occupied | Renter-occupied |
| No Vehicle | 387 (2.1%) | 1,112 (12.1%) |
| 1 Vehicle | 2,346 (12.9%) | 3,810 (41.5%) |
| 2 Vehicles | 7,524 (41.2%) | 2,702 (29.4%) |
| 3 or more Vehicles | 7,990 (43.8%) | 1,551 (16.9%) |
| Total | 18,247 (100.0%) | 9,175 (100.0%) |
Real Estate & Mortgages in Umatilla County
Real Estate and Mortgage Overview in Umatilla County
| Characteristic | Without Mortgage | With Mortgage |
| Housing Units | 7,496 | 10,751 |
| Median Property Value | $198,800 | $247,900 |
| Median Household Income | $64,261 | $2,270 |
| Monthly Housing Costs | $514 | $246 |
| Real Estate Taxes | $2,206 | $132 |
Property Value by Mortgage Status in Umatilla County
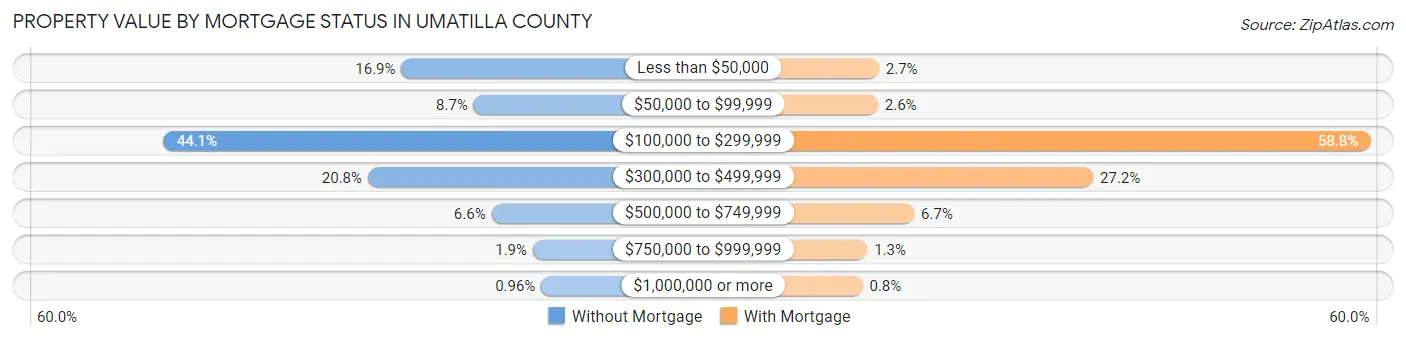
| Property Value | Without Mortgage | With Mortgage |
| Less than $50,000 | 1,270 (16.9%) | 286 (2.7%) |
| $50,000 to $99,999 | 651 (8.7%) | 274 (2.5%) |
| $100,000 to $299,999 | 3,305 (44.1%) | 6,322 (58.8%) |
| $300,000 to $499,999 | 1,557 (20.8%) | 2,919 (27.2%) |
| $500,000 to $749,999 | 498 (6.6%) | 720 (6.7%) |
| $750,000 to $999,999 | 143 (1.9%) | 144 (1.3%) |
| $1,000,000 or more | 72 (1.0%) | 86 (0.8%) |
| Total | 7,496 (100.0%) | 10,751 (100.0%) |
Household Income by Mortgage Status in Umatilla County
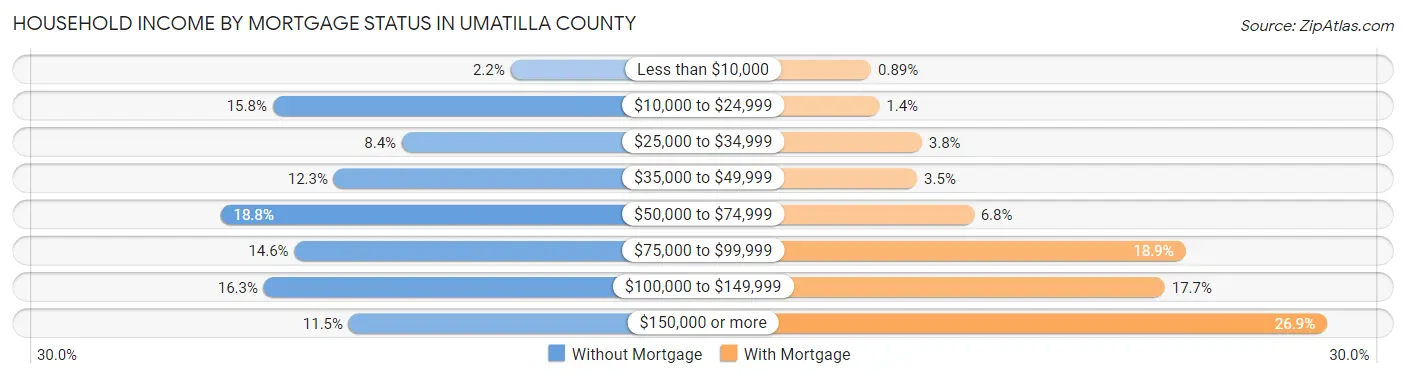
| Household Income | Without Mortgage | With Mortgage |
| Less than $10,000 | 167 (2.2%) | 96 (0.9%) |
| $10,000 to $24,999 | 1,186 (15.8%) | 146 (1.4%) |
| $25,000 to $34,999 | 633 (8.4%) | 407 (3.8%) |
| $35,000 to $49,999 | 924 (12.3%) | 378 (3.5%) |
| $50,000 to $74,999 | 1,409 (18.8%) | 726 (6.8%) |
| $75,000 to $99,999 | 1,093 (14.6%) | 2,028 (18.9%) |
| $100,000 to $149,999 | 1,224 (16.3%) | 1,900 (17.7%) |
| $150,000 or more | 860 (11.5%) | 2,896 (26.9%) |
| Total | 7,496 (100.0%) | 10,751 (100.0%) |
Property Value to Household Income Ratio in Umatilla County
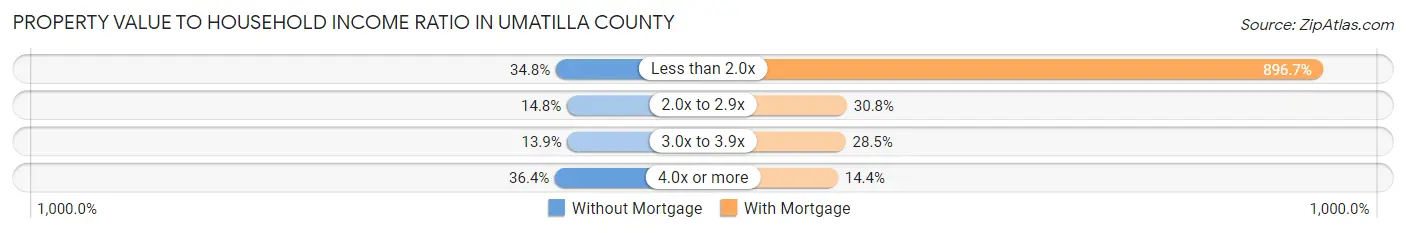
| Value-to-Income Ratio | Without Mortgage | With Mortgage |
| Less than 2.0x | 2,605 (34.7%) | 96,403 (896.7%) |
| 2.0x to 2.9x | 1,108 (14.8%) | 3,306 (30.7%) |
| 3.0x to 3.9x | 1,044 (13.9%) | 3,060 (28.5%) |
| 4.0x or more | 2,730 (36.4%) | 1,544 (14.4%) |
| Total | 7,496 (100.0%) | 10,751 (100.0%) |
Real Estate Taxes by Mortgage Status in Umatilla County
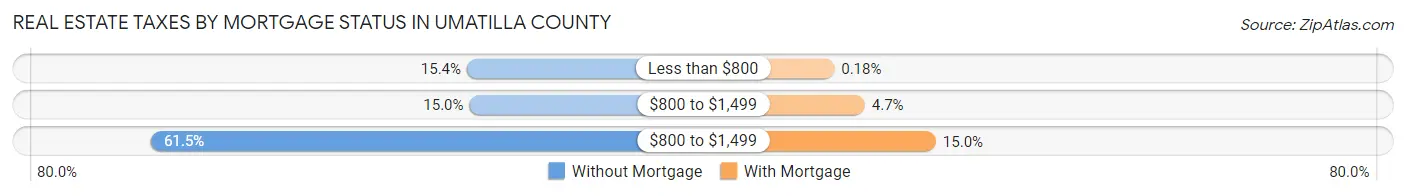
| Property Taxes | Without Mortgage | With Mortgage |
| Less than $800 | 1,153 (15.4%) | 19 (0.2%) |
| $800 to $1,499 | 1,125 (15.0%) | 500 (4.6%) |
| $800 to $1,499 | 4,612 (61.5%) | 1,616 (15.0%) |
| Total | 7,496 (100.0%) | 10,751 (100.0%) |
Health & Disability in Umatilla County
Health Insurance Coverage by Age in Umatilla County
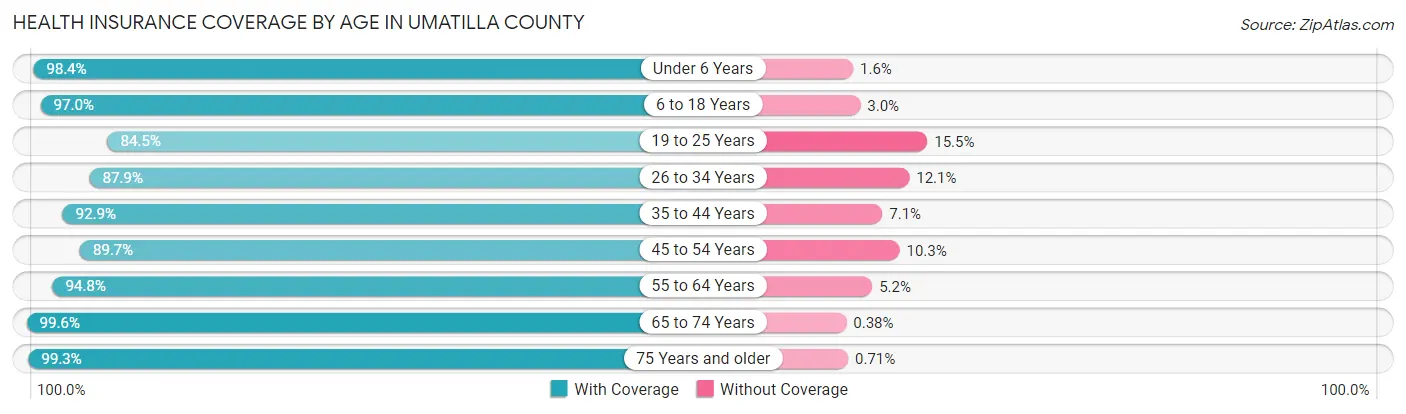
| Age Bracket | With Coverage | Without Coverage |
| Under 6 Years | 6,184 (98.4%) | 103 (1.6%) |
| 6 to 18 Years | 14,147 (97.0%) | 438 (3.0%) |
| 19 to 25 Years | 5,928 (84.5%) | 1,086 (15.5%) |
| 26 to 34 Years | 8,023 (87.9%) | 1,106 (12.1%) |
| 35 to 44 Years | 8,802 (92.9%) | 673 (7.1%) |
| 45 to 54 Years | 7,768 (89.7%) | 893 (10.3%) |
| 55 to 64 Years | 8,182 (94.8%) | 450 (5.2%) |
| 65 to 74 Years | 7,387 (99.6%) | 28 (0.4%) |
| 75 Years and older | 4,910 (99.3%) | 35 (0.7%) |
| Total | 71,331 (93.7%) | 4,812 (6.3%) |
Health Insurance Coverage by Citizenship Status in Umatilla County
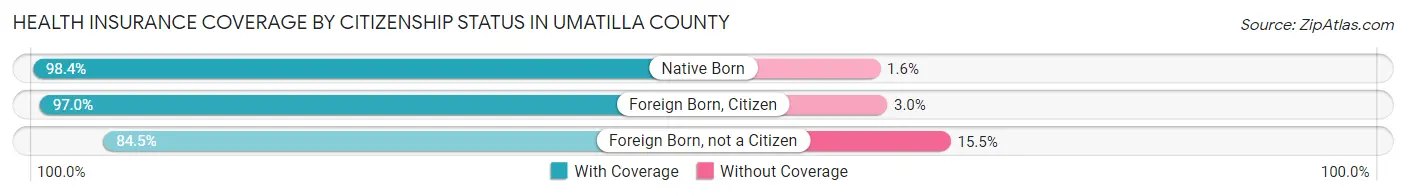
| Citizenship Status | With Coverage | Without Coverage |
| Native Born | 6,184 (98.4%) | 103 (1.6%) |
| Foreign Born, Citizen | 14,147 (97.0%) | 438 (3.0%) |
| Foreign Born, not a Citizen | 5,928 (84.5%) | 1,086 (15.5%) |
Health Insurance Coverage by Household Income in Umatilla County
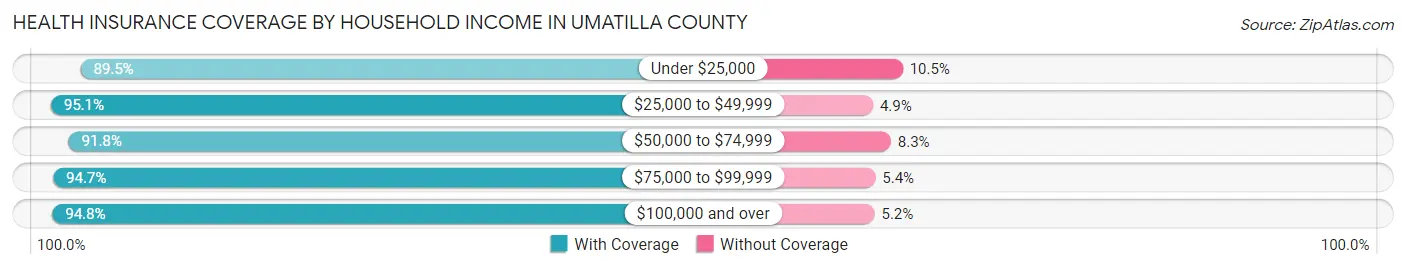
| Household Income | With Coverage | Without Coverage |
| Under $25,000 | 7,305 (89.5%) | 854 (10.5%) |
| $25,000 to $49,999 | 10,030 (95.1%) | 518 (4.9%) |
| $50,000 to $74,999 | 13,319 (91.7%) | 1,197 (8.3%) |
| $75,000 to $99,999 | 12,425 (94.7%) | 703 (5.3%) |
| $100,000 and over | 27,735 (94.8%) | 1,522 (5.2%) |
Public vs Private Health Insurance Coverage by Age in Umatilla County
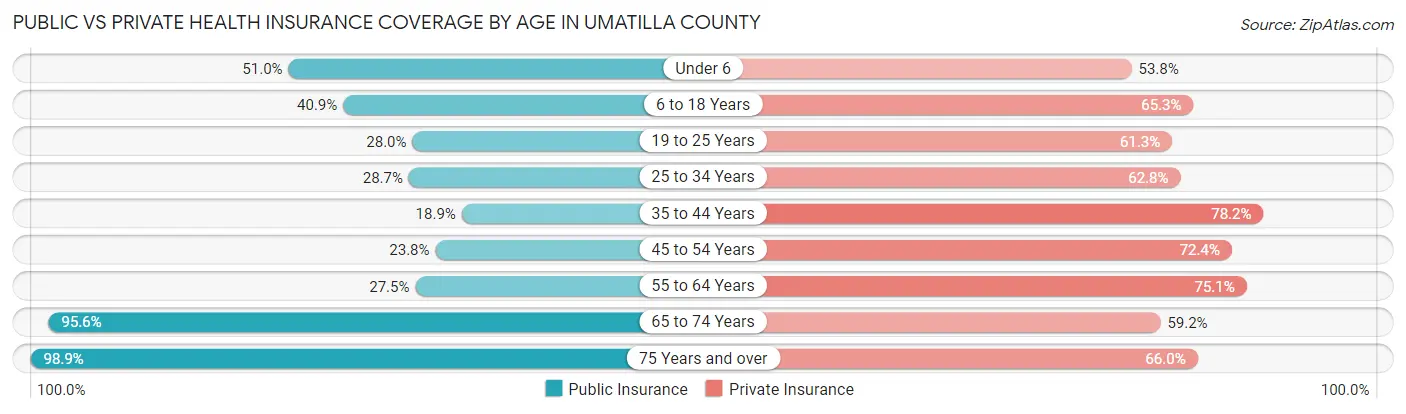
| Age Bracket | Public Insurance | Private Insurance |
| Under 6 | 3,208 (51.0%) | 3,381 (53.8%) |
| 6 to 18 Years | 5,963 (40.9%) | 9,516 (65.2%) |
| 19 to 25 Years | 1,966 (28.0%) | 4,300 (61.3%) |
| 25 to 34 Years | 2,619 (28.7%) | 5,737 (62.8%) |
| 35 to 44 Years | 1,789 (18.9%) | 7,412 (78.2%) |
| 45 to 54 Years | 2,058 (23.8%) | 6,268 (72.4%) |
| 55 to 64 Years | 2,372 (27.5%) | 6,484 (75.1%) |
| 65 to 74 Years | 7,087 (95.6%) | 4,386 (59.2%) |
| 75 Years and over | 4,891 (98.9%) | 3,264 (66.0%) |
| Total | 31,953 (42.0%) | 50,748 (66.6%) |
Disability Status by Sex by Age in Umatilla County
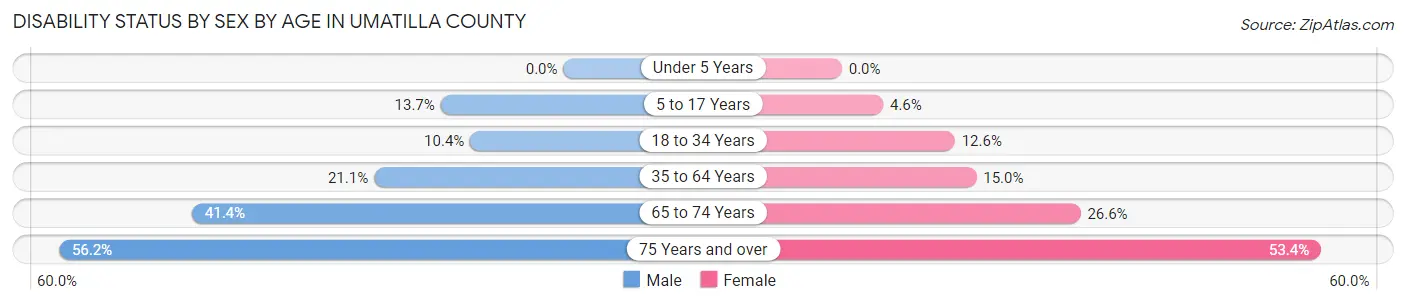
| Age Bracket | Male | Female |
| Under 5 Years | 0 (0.0%) | 0 (0.0%) |
| 5 to 17 Years | 1,023 (13.7%) | 334 (4.6%) |
| 18 to 34 Years | 957 (10.4%) | 1,010 (12.6%) |
| 35 to 64 Years | 2,815 (21.1%) | 2,010 (15.0%) |
| 65 to 74 Years | 1,505 (41.4%) | 1,004 (26.6%) |
| 75 Years and over | 1,179 (56.2%) | 1,519 (53.4%) |
Disability Class by Sex by Age in Umatilla County
Disability Class: Hearing Difficulty
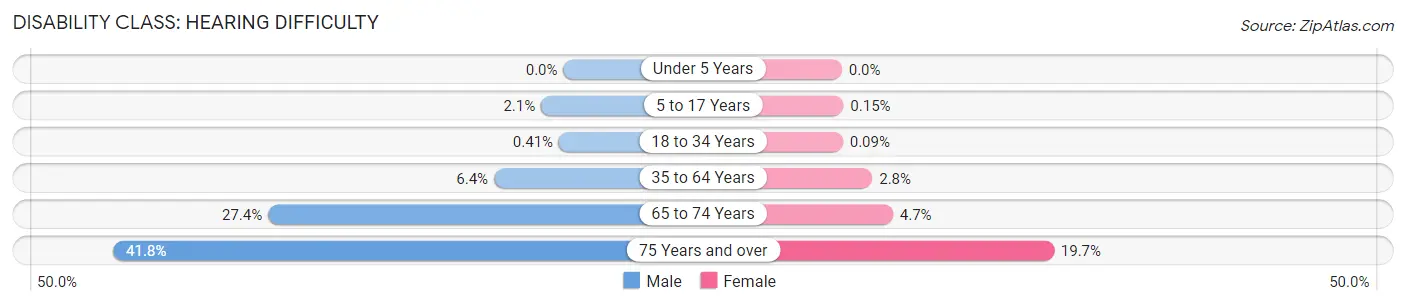
| Age Bracket | Male | Female |
| Under 5 Years | 0 (0.0%) | 0 (0.0%) |
| 5 to 17 Years | 155 (2.1%) | 11 (0.2%) |
| 18 to 34 Years | 38 (0.4%) | 7 (0.1%) |
| 35 to 64 Years | 860 (6.4%) | 380 (2.8%) |
| 65 to 74 Years | 997 (27.4%) | 179 (4.7%) |
| 75 Years and over | 877 (41.8%) | 560 (19.7%) |
Disability Class: Vision Difficulty
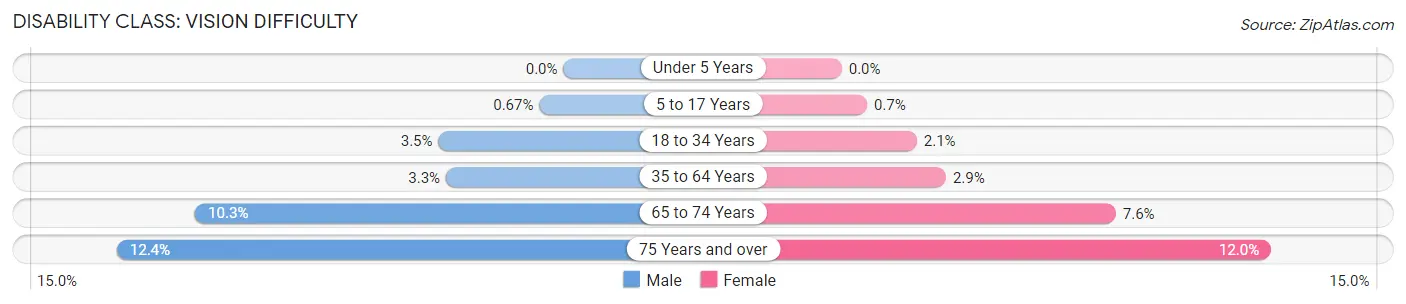
| Age Bracket | Male | Female |
| Under 5 Years | 0 (0.0%) | 0 (0.0%) |
| 5 to 17 Years | 50 (0.7%) | 51 (0.7%) |
| 18 to 34 Years | 321 (3.5%) | 168 (2.1%) |
| 35 to 64 Years | 437 (3.3%) | 389 (2.9%) |
| 65 to 74 Years | 373 (10.2%) | 288 (7.6%) |
| 75 Years and over | 261 (12.4%) | 340 (11.9%) |
Disability Class: Cognitive Difficulty
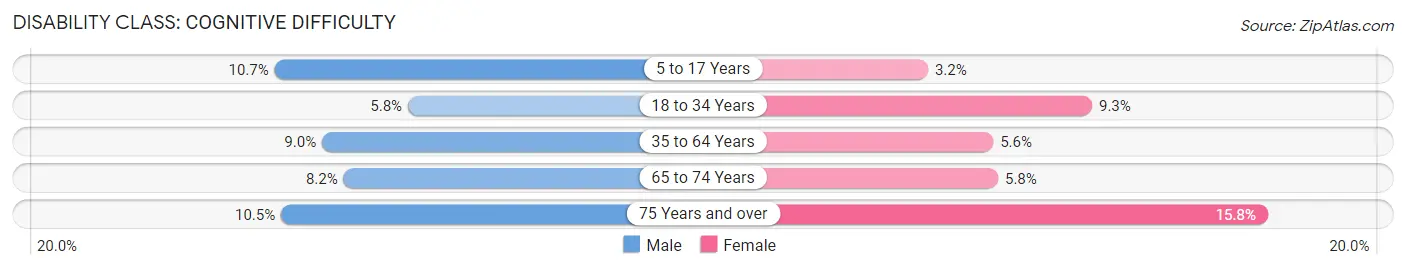
| Age Bracket | Male | Female |
| 5 to 17 Years | 802 (10.7%) | 233 (3.2%) |
| 18 to 34 Years | 532 (5.8%) | 746 (9.3%) |
| 35 to 64 Years | 1,196 (9.0%) | 754 (5.6%) |
| 65 to 74 Years | 297 (8.2%) | 219 (5.8%) |
| 75 Years and over | 220 (10.5%) | 450 (15.8%) |
Disability Class: Ambulatory Difficulty
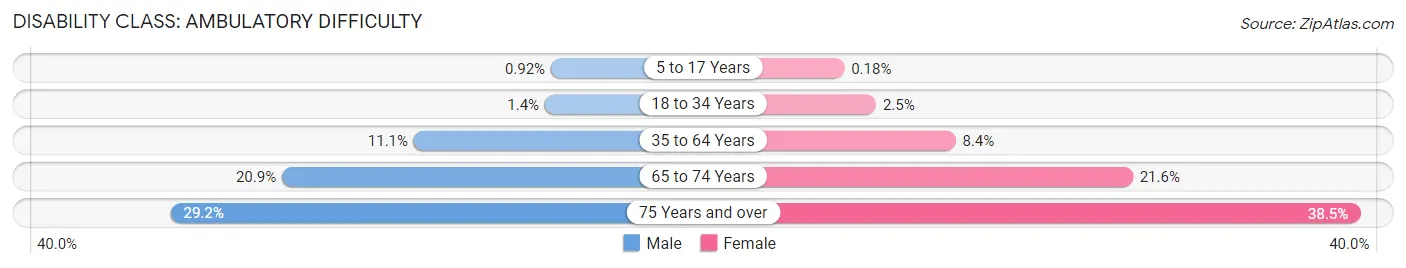
| Age Bracket | Male | Female |
| 5 to 17 Years | 69 (0.9%) | 13 (0.2%) |
| 18 to 34 Years | 126 (1.4%) | 204 (2.5%) |
| 35 to 64 Years | 1,482 (11.1%) | 1,133 (8.4%) |
| 65 to 74 Years | 760 (20.9%) | 816 (21.6%) |
| 75 Years and over | 612 (29.2%) | 1,095 (38.5%) |
Disability Class: Self-Care Difficulty
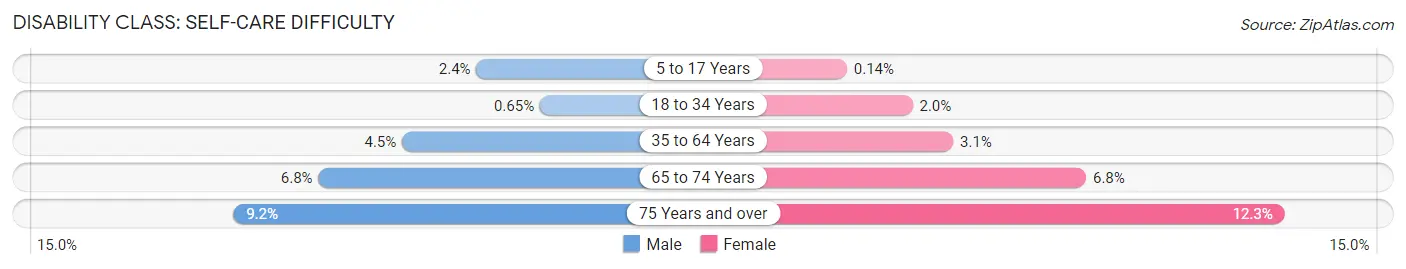
| Age Bracket | Male | Female |
| 5 to 17 Years | 181 (2.4%) | 10 (0.1%) |
| 18 to 34 Years | 60 (0.6%) | 158 (2.0%) |
| 35 to 64 Years | 600 (4.5%) | 416 (3.1%) |
| 65 to 74 Years | 248 (6.8%) | 257 (6.8%) |
| 75 Years and over | 193 (9.2%) | 351 (12.3%) |
Technology Access in Umatilla County
Computing Device Access in Umatilla County
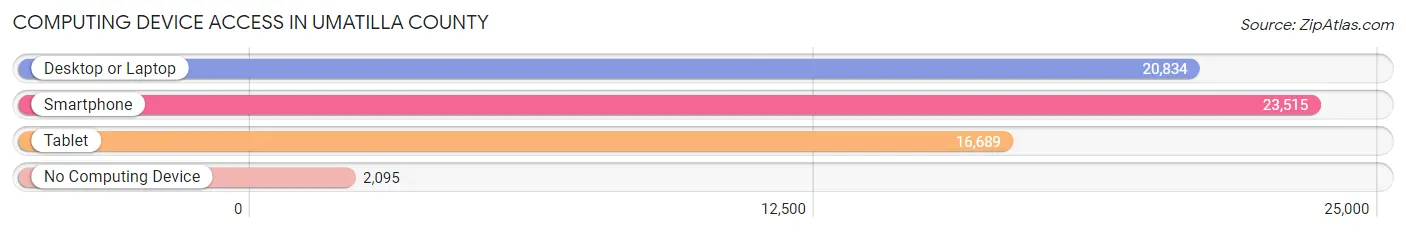
| Device Type | # Households | % Households |
| Desktop or Laptop | 20,834 | 76.0% |
| Smartphone | 23,515 | 85.8% |
| Tablet | 16,689 | 60.9% |
| No Computing Device | 2,095 | 7.6% |
| Total | 27,422 | 100.0% |
Internet Access in Umatilla County
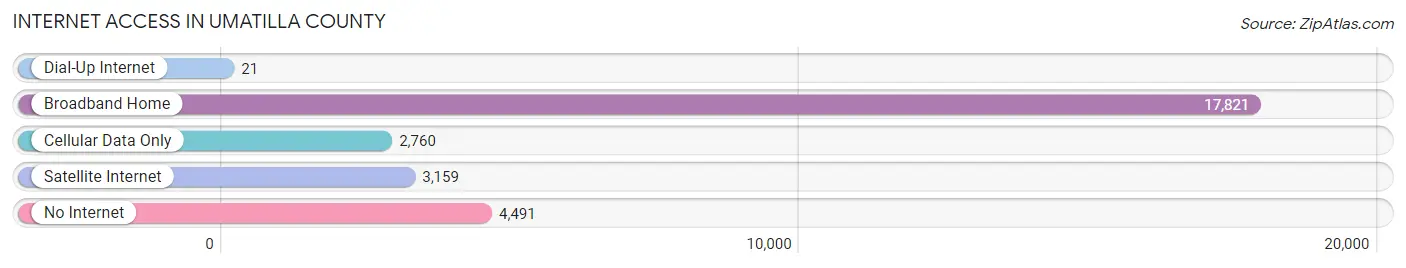
| Internet Type | # Households | % Households |
| Dial-Up Internet | 21 | 0.1% |
| Broadband Home | 17,821 | 65.0% |
| Cellular Data Only | 2,760 | 10.1% |
| Satellite Internet | 3,159 | 11.5% |
| No Internet | 4,491 | 16.4% |
| Total | 27,422 | 100.0% |
Umatilla County Summary
Umatilla County is located in the northeastern corner of Oregon, and is bordered by the Columbia River to the north, the Umatilla River to the east, and the Blue Mountains to the south. The county covers an area of 2,890 square miles, and is home to an estimated population of 77,000 people.
Geography
Umatilla County is located in the Columbia Plateau region of the Pacific Northwest. The county is characterized by rolling hills, deep canyons, and wide valleys. The Blue Mountains, which form the southern border of the county, are part of the Cascade Range and are home to several peaks over 8,000 feet in elevation. The Umatilla River, which flows through the county, is a tributary of the Columbia River. The county is also home to several lakes, including Lake Wallula, Lake Umatilla, and Lake Wallowa.
The climate of Umatilla County is generally dry and semi-arid, with hot summers and cold winters. The average annual precipitation is around 12 inches, with most of it falling in the winter months.
Economy
The economy of Umatilla County is largely based on agriculture and manufacturing. The county is home to several large agricultural operations, including wheat, barley, and hay farms. The county is also home to several large food processing plants, including a Nestle plant in Hermiston and a ConAgra plant in Pendleton.
Manufacturing is also an important part of the county's economy. The county is home to several large factories, including a Boeing plant in Pendleton and a John Deere plant in Hermiston. The county is also home to several smaller factories, including a furniture factory in Pendleton and a plastics factory in Hermiston.
Demographics
As of the 2010 census, Umatilla County had an estimated population of 77,000 people. The population is largely white (86.3%), with smaller percentages of Hispanic (7.2%), Native American (3.2%), and Asian (1.3%) residents. The median household income in the county is $45,000, and the median home value is $150,000.
The county is home to several large cities, including Pendleton (population 16,000), Hermiston (population 16,000), and Milton-Freewater (population 7,000). The county is also home to several smaller towns, including Athena (population 1,000), Umatilla (population 1,000), and Stanfield (population 500).
History
Umatilla County was first settled by Native Americans, who lived in the area for thousands of years before the arrival of European settlers. The first Europeans to settle in the area were fur traders, who arrived in the early 1800s. The first permanent settlers arrived in the 1840s, and the county was officially established in 1862.
The county was named after the Umatilla tribe, which had lived in the area for centuries. The county was largely agricultural in its early years, and the economy was based on wheat, barley, and hay farming. The county also had several small mining operations, which produced gold, silver, and copper.
In the late 1800s, the county began to develop its manufacturing sector. The first factories were built in Pendleton and Hermiston, and the county soon became a major producer of furniture, clothing, and other goods. The county also became a major producer of food products, including canned fruits and vegetables.
The county continued to grow and develop throughout the 20th century. The population increased steadily, and the economy diversified to include manufacturing, agriculture, and tourism. The county is now home to several large companies, including Boeing, Nestle, and ConAgra.
Common Questions
What is the Total Population of Umatilla County?
Total Population of Umatilla County is 79,904.
What is the Total Male Population of Umatilla County?
Total Male Population of Umatilla County is 41,890.
What is the Total Female Population of Umatilla County?
Total Female Population of Umatilla County is 38,014.
What is the Ratio of Males per 100 Females in Umatilla County?
There are 110.20 Males per 100 Females in Umatilla County.
What is the Ratio of Females per 100 Males in Umatilla County?
There are 90.75 Females per 100 Males in Umatilla County.
What is the Median Population Age in Umatilla County?
Median Population Age in Umatilla County is 36.9 Years.
What is the Average Family Size in Umatilla County
Average Family Size in Umatilla County is 3.2 People.
What is the Average Household Size in Umatilla County
Average Household Size in Umatilla County is 2.8 People.
What is Per Capita Income in Umatilla County?
Per Capita income in Umatilla County is $30,263.
What is the Median Family Income in Umatilla County?
Median Family Income in Umatilla County is $80,919.
What is the Median Household income in Umatilla County?
Median Household Income in Umatilla County is $70,322.
What is Income or Wage Gap in Umatilla County?
Income or Wage Gap in Umatilla County is 26.7%.
Women in Umatilla County earn 73.3 cents for every dollar earned by a man.
What is Family Income Deficit in Umatilla County?
Family Income Deficit in Umatilla County is $9,531.
Families that are below poverty line in Umatilla County earn $9,531 less on average than the poverty threshold level.
What is Inequality or Gini Index in Umatilla County?
Inequality or Gini Index in Umatilla County is 0.41.
How Large is the Labor Force in Umatilla County?
There are 36,471 People in the Labor Forcein in Umatilla County.
What is the Percentage of People in the Labor Force in Umatilla County?
58.4% of People are in the Labor Force in Umatilla County.
What is the Unemployment Rate in Umatilla County?
Unemployment Rate in Umatilla County is 6.7%.