Tillamook County, OR
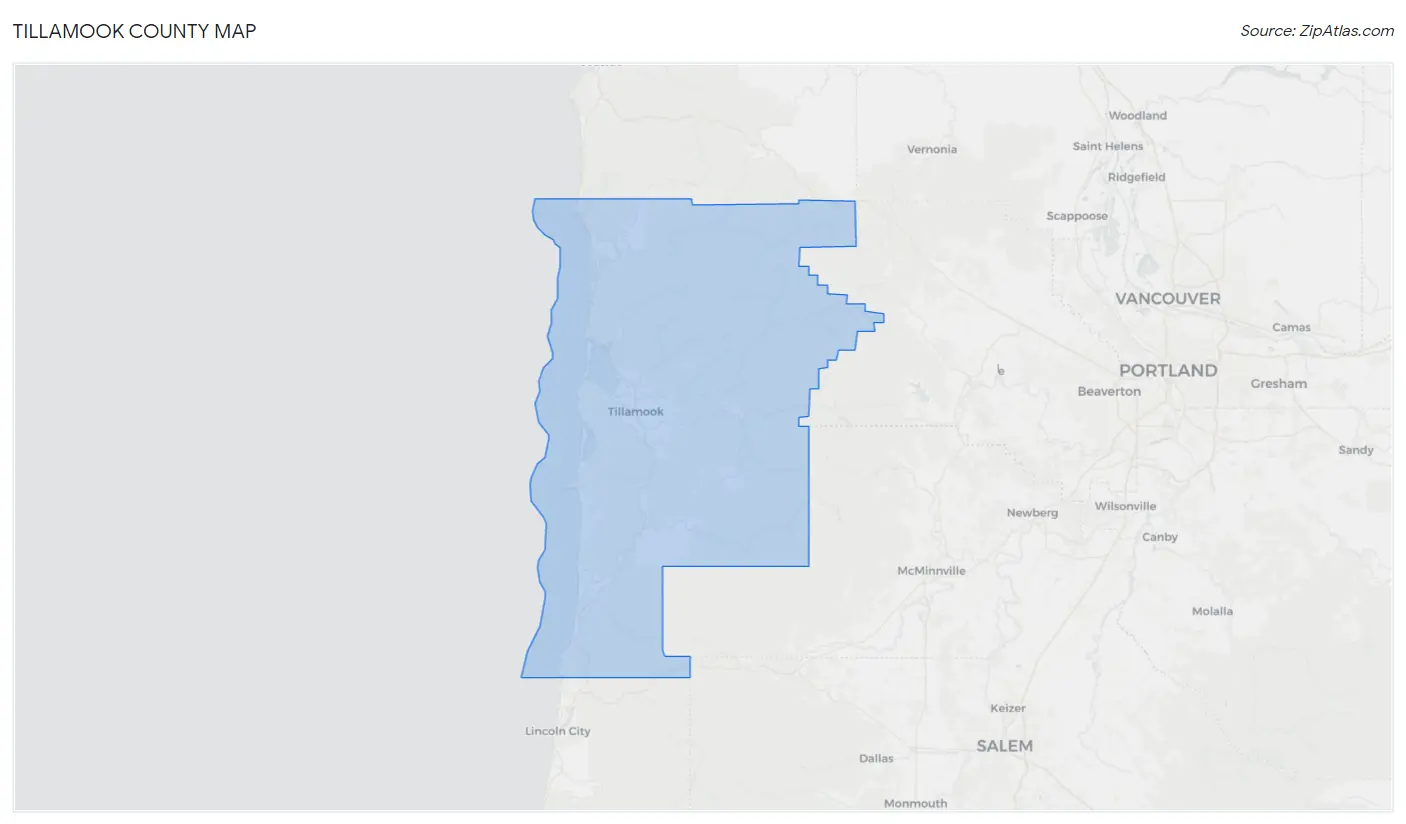
Tillamook County Map
Tillamook County Overview
27,345
TOTAL POPULATION
13,835
MALE POPULATION
13,510
FEMALE POPULATION
102.41
MALES / 100 FEMALES
97.65
FEMALES / 100 MALES
48.7
MEDIAN AGE
2.8
AVG FAMILY SIZE
2.3
AVG HOUSEHOLD SIZE
$35,433
PER CAPITA INCOME
$73,101
AVG FAMILY INCOME
$63,098
AVG HOUSEHOLD INCOME
30.8%
WAGE / INCOME GAP [ % ]
69.2¢/ $1
WAGE / INCOME GAP [ $ ]
$9,926
FAMILY INCOME DEFICIT
0.44
INEQUALITY / GINI INDEX
11,517
LABOR FORCE [ PEOPLE ]
50.3%
PERCENT IN LABOR FORCE
5.2%
UNEMPLOYMENT RATE
Race in Tillamook County
The most populous races in Tillamook County are White / Caucasian (24,024 | 87.9%), Hispanic or Latino (2,943 | 10.8%), and Two or more Races (1,693 | 6.2%).
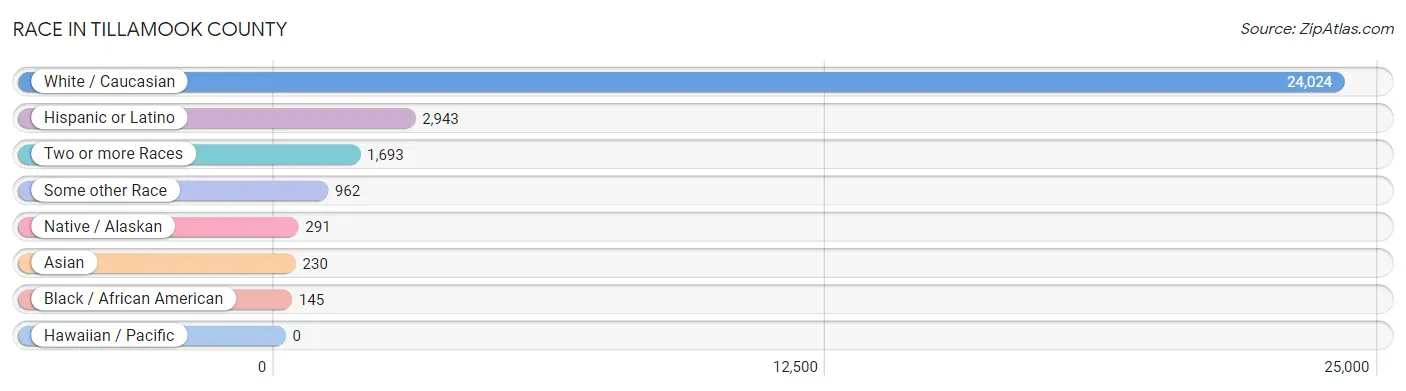
| Race | # Population | % Population |
| Asian | 230 | 0.8% |
| Black / African American | 145 | 0.5% |
| Hawaiian / Pacific | 0 | 0.0% |
| Hispanic or Latino | 2,943 | 10.8% |
| Native / Alaskan | 291 | 1.1% |
| White / Caucasian | 24,024 | 87.9% |
| Two or more Races | 1,693 | 6.2% |
| Some other Race | 962 | 3.5% |
| Total | 27,345 | 100.0% |
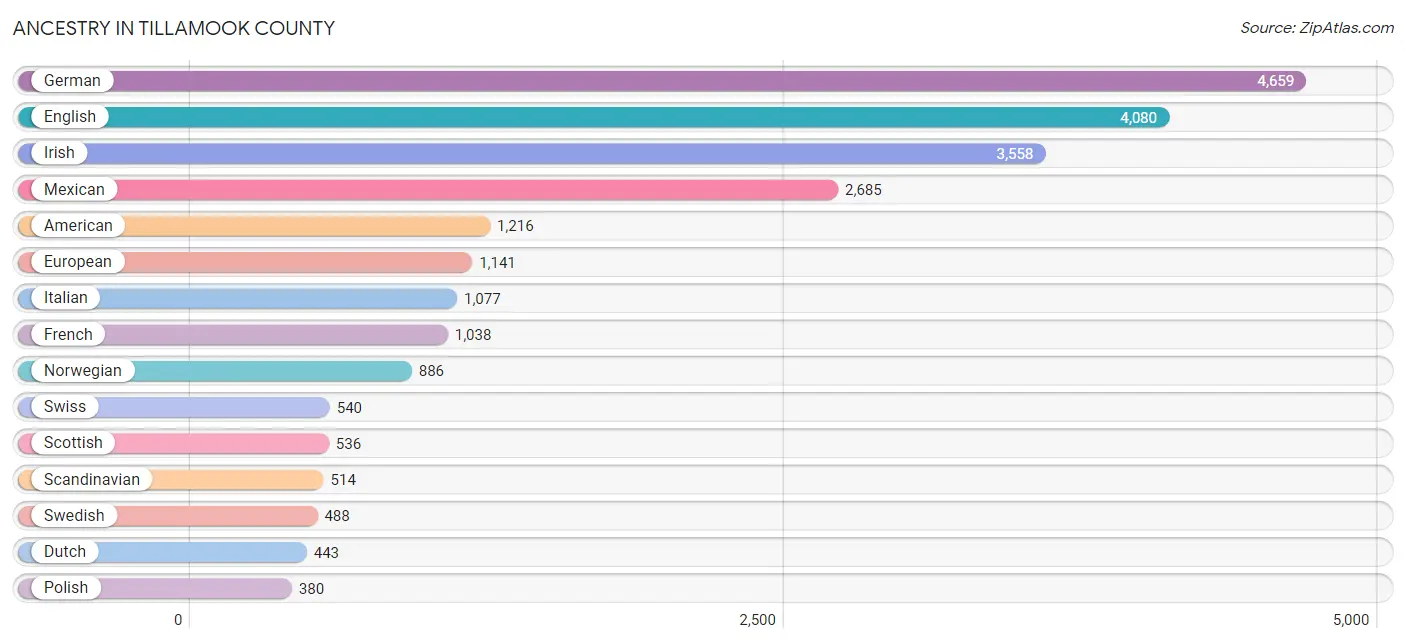
Ancestry in Tillamook County
The most populous ancestries reported in Tillamook County are German (4,659 | 17.0%), English (4,080 | 14.9%), Irish (3,558 | 13.0%), Mexican (2,685 | 9.8%), and American (1,216 | 4.4%), together accounting for 59.2% of all Tillamook County residents.
| Ancestry | # Population | % Population |
| African | 48 | 0.2% |
| Alaskan Athabascan | 7 | 0.0% |
| Aleut | 16 | 0.1% |
| American | 1,216 | 4.4% |
| Apache | 15 | 0.1% |
| Arab | 114 | 0.4% |
| Armenian | 4 | 0.0% |
| Austrian | 10 | 0.0% |
| Belgian | 49 | 0.2% |
| Bhutanese | 141 | 0.5% |
| Blackfeet | 24 | 0.1% |
| Brazilian | 3 | 0.0% |
| British | 185 | 0.7% |
| Burmese | 4 | 0.0% |
| Canadian | 64 | 0.2% |
| Celtic | 10 | 0.0% |
| Central American | 66 | 0.2% |
| Cherokee | 77 | 0.3% |
| Chickasaw | 46 | 0.2% |
| Chippewa | 13 | 0.1% |
| Choctaw | 2 | 0.0% |
| Colombian | 5 | 0.0% |
| Colville | 35 | 0.1% |
| Comanche | 2 | 0.0% |
| Croatian | 3 | 0.0% |
| Cuban | 30 | 0.1% |
| Czech | 88 | 0.3% |
| Czechoslovakian | 19 | 0.1% |
| Danish | 150 | 0.5% |
| Dominican | 1 | 0.0% |
| Dutch | 443 | 1.6% |
| Eastern European | 76 | 0.3% |
| Ecuadorian | 11 | 0.0% |
| Egyptian | 3 | 0.0% |
| English | 4,080 | 14.9% |
| European | 1,141 | 4.2% |
| Filipino | 1 | 0.0% |
| Finnish | 89 | 0.3% |
| French | 1,038 | 3.8% |
| French American Indian | 2 | 0.0% |
| French Canadian | 86 | 0.3% |
| German | 4,659 | 17.0% |
| Greek | 41 | 0.2% |
| Guatemalan | 61 | 0.2% |
| Haitian | 1 | 0.0% |
| Hungarian | 26 | 0.1% |
| Icelander | 7 | 0.0% |
| Indian (Asian) | 68 | 0.3% |
| Irish | 3,558 | 13.0% |
| Iroquois | 4 | 0.0% |
| Italian | 1,077 | 3.9% |
| Korean | 64 | 0.2% |
| Laotian | 27 | 0.1% |
| Latvian | 10 | 0.0% |
| Lebanese | 24 | 0.1% |
| Lithuanian | 13 | 0.1% |
| Luxembourger | 24 | 0.1% |
| Mexican | 2,685 | 9.8% |
| Mexican American Indian | 23 | 0.1% |
| Mongolian | 6 | 0.0% |
| Native Hawaiian | 105 | 0.4% |
| Navajo | 24 | 0.1% |
| New Zealander | 3 | 0.0% |
| Northern European | 117 | 0.4% |
| Norwegian | 886 | 3.2% |
| Pakistani | 109 | 0.4% |
| Panamanian | 5 | 0.0% |
| Polish | 380 | 1.4% |
| Portuguese | 226 | 0.8% |
| Potawatomi | 1 | 0.0% |
| Puerto Rican | 71 | 0.3% |
| Puget Sound Salish | 8 | 0.0% |
| Romanian | 20 | 0.1% |
| Russian | 67 | 0.3% |
| Samoan | 3 | 0.0% |
| Scandinavian | 514 | 1.9% |
| Scotch-Irish | 264 | 1.0% |
| Scottish | 536 | 2.0% |
| Sioux | 26 | 0.1% |
| Slovak | 11 | 0.0% |
| Somali | 23 | 0.1% |
| South American | 16 | 0.1% |
| Spaniard | 24 | 0.1% |
| Spanish | 2 | 0.0% |
| Subsaharan African | 71 | 0.3% |
| Swedish | 488 | 1.8% |
| Swiss | 540 | 2.0% |
| Syrian | 70 | 0.3% |
| Tlingit-Haida | 77 | 0.3% |
| Ukrainian | 17 | 0.1% |
| Welsh | 190 | 0.7% |
| Yaqui | 13 | 0.1% | View All 92 Rows |
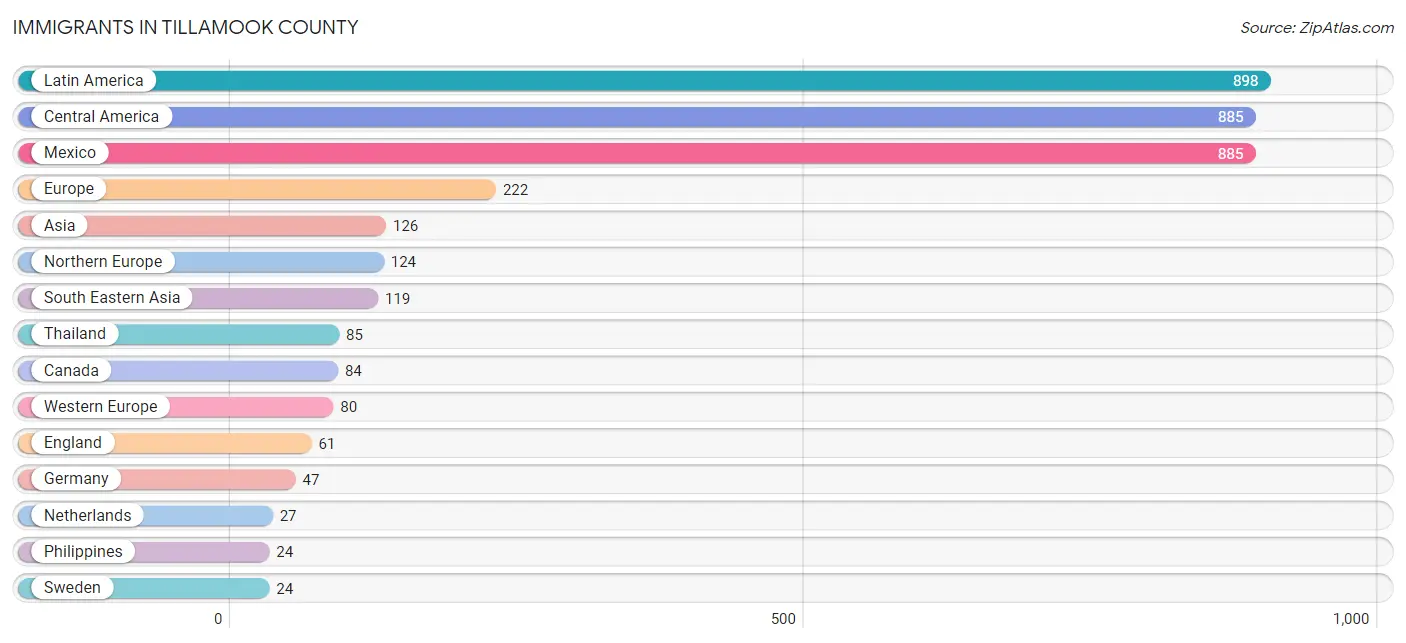
Immigrants in Tillamook County
The most numerous immigrant groups reported in Tillamook County came from Latin America (898 | 3.3%), Central America (885 | 3.2%), Mexico (885 | 3.2%), Europe (222 | 0.8%), and Asia (126 | 0.5%), together accounting for 11.0% of all Tillamook County residents.
| Immigration Origin | # Population | % Population |
| Asia | 126 | 0.5% |
| Australia | 9 | 0.0% |
| Canada | 84 | 0.3% |
| Caribbean | 8 | 0.0% |
| Central America | 885 | 3.2% |
| China | 3 | 0.0% |
| Colombia | 5 | 0.0% |
| Cuba | 8 | 0.0% |
| Eastern Asia | 7 | 0.0% |
| Eastern Europe | 3 | 0.0% |
| England | 61 | 0.2% |
| Europe | 222 | 0.8% |
| France | 6 | 0.0% |
| Germany | 47 | 0.2% |
| Hungary | 3 | 0.0% |
| Ireland | 15 | 0.1% |
| Italy | 15 | 0.1% |
| Korea | 4 | 0.0% |
| Latin America | 898 | 3.3% |
| Malaysia | 10 | 0.0% |
| Mexico | 885 | 3.2% |
| Netherlands | 27 | 0.1% |
| Northern Europe | 124 | 0.4% |
| Oceania | 20 | 0.1% |
| Philippines | 24 | 0.1% |
| Scotland | 3 | 0.0% |
| South America | 5 | 0.0% |
| South Eastern Asia | 119 | 0.4% |
| Southern Europe | 15 | 0.1% |
| Sweden | 24 | 0.1% |
| Thailand | 85 | 0.3% |
| Western Europe | 80 | 0.3% | View All 32 Rows |
Sex and Age in Tillamook County
Sex and Age in Tillamook County
The most populous age groups in Tillamook County are 65 to 69 Years (1,367 | 9.9%) for men and 60 to 64 Years (1,456 | 10.8%) for women.
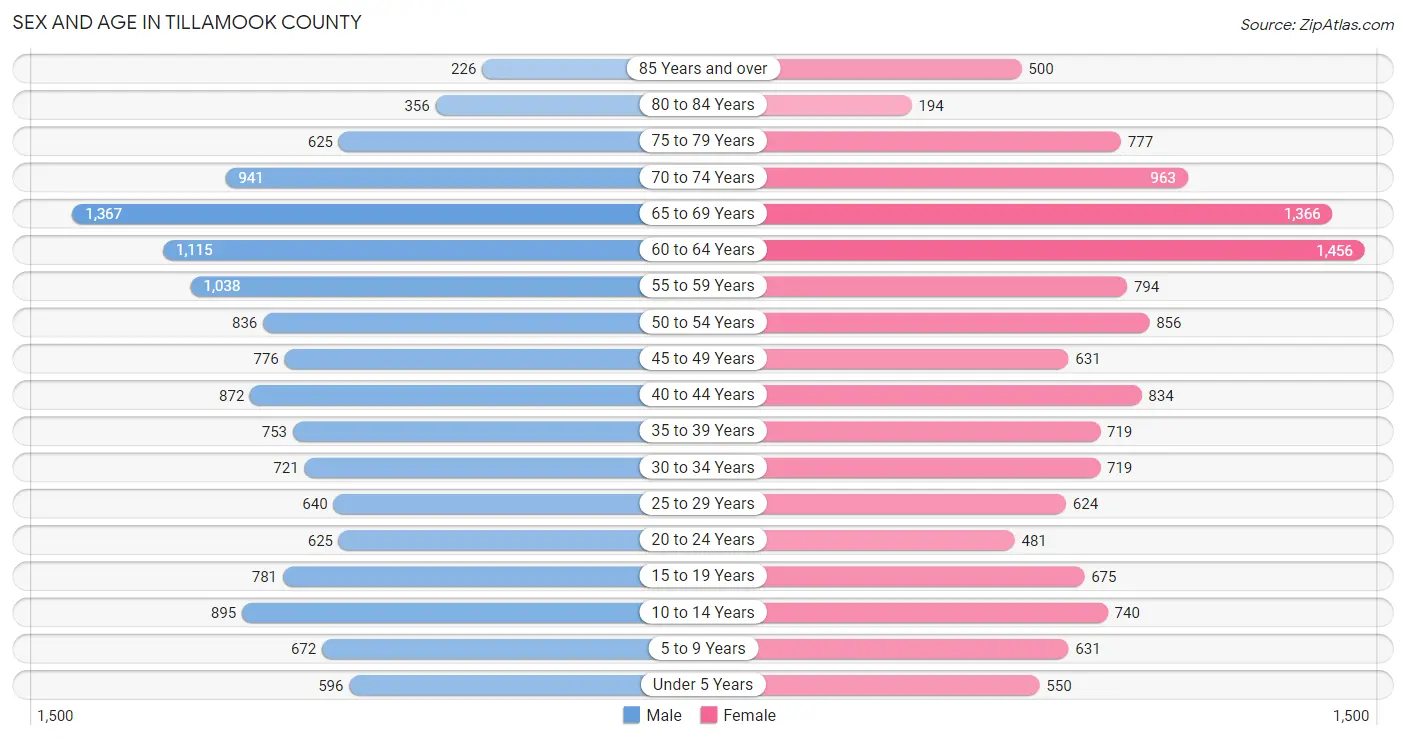
| Age Bracket | Male | Female |
| Under 5 Years | 596 (4.3%) | 550 (4.1%) |
| 5 to 9 Years | 672 (4.9%) | 631 (4.7%) |
| 10 to 14 Years | 895 (6.5%) | 740 (5.5%) |
| 15 to 19 Years | 781 (5.7%) | 675 (5.0%) |
| 20 to 24 Years | 625 (4.5%) | 481 (3.6%) |
| 25 to 29 Years | 640 (4.6%) | 624 (4.6%) |
| 30 to 34 Years | 721 (5.2%) | 719 (5.3%) |
| 35 to 39 Years | 753 (5.4%) | 719 (5.3%) |
| 40 to 44 Years | 872 (6.3%) | 834 (6.2%) |
| 45 to 49 Years | 776 (5.6%) | 631 (4.7%) |
| 50 to 54 Years | 836 (6.0%) | 856 (6.3%) |
| 55 to 59 Years | 1,038 (7.5%) | 794 (5.9%) |
| 60 to 64 Years | 1,115 (8.1%) | 1,456 (10.8%) |
| 65 to 69 Years | 1,367 (9.9%) | 1,366 (10.1%) |
| 70 to 74 Years | 941 (6.8%) | 963 (7.1%) |
| 75 to 79 Years | 625 (4.5%) | 777 (5.8%) |
| 80 to 84 Years | 356 (2.6%) | 194 (1.4%) |
| 85 Years and over | 226 (1.6%) | 500 (3.7%) |
| Total | 13,835 (100.0%) | 13,510 (100.0%) |
Families and Households in Tillamook County
Median Family Size in Tillamook County
The median family size in Tillamook County is 2.81 persons per family, with married-couple families (5,655 | 77.8%) accounting for the largest median family size of 2.85 persons per family. On the other hand, single female/mother families (1,011 | 13.9%) represent the smallest median family size with 2.65 persons per family.
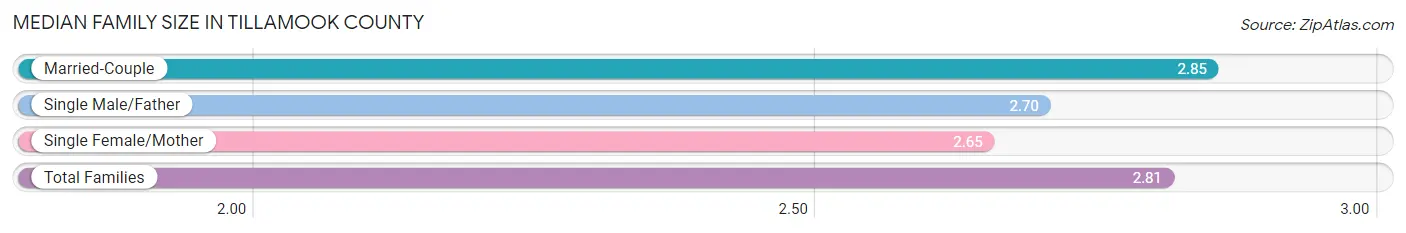
| Family Type | # Families | Family Size |
| Married-Couple | 5,655 (77.8%) | 2.85 |
| Single Male/Father | 598 (8.2%) | 2.70 |
| Single Female/Mother | 1,011 (13.9%) | 2.65 |
| Total Families | 7,264 (100.0%) | 2.81 |
Median Household Size in Tillamook County
The median household size in Tillamook County is 2.30 persons per household, with single female/mother households (1,011 | 8.8%) accounting for the largest median household size of 3 persons per household. non-family households (4,258 | 37.0%) represent the smallest median household size with 1.24 persons per household.
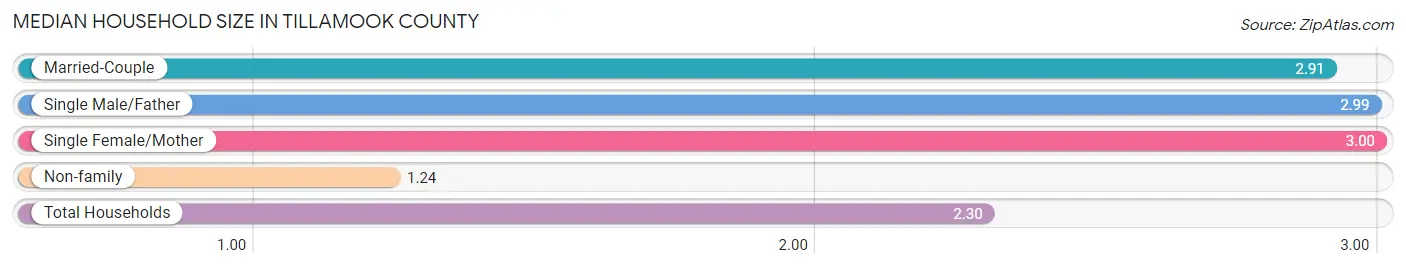
| Household Type | # Households | Household Size |
| Married-Couple | 5,655 (49.1%) | 2.91 |
| Single Male/Father | 598 (5.2%) | 2.99 |
| Single Female/Mother | 1,011 (8.8%) | 3.00 |
| Non-family | 4,258 (37.0%) | 1.24 |
| Total Households | 11,522 (100.0%) | 2.30 |
Household Size by Marriage Status in Tillamook County
Out of a total of 11,522 households in Tillamook County, 7,264 (63.0%) are family households, while 4,258 (37.0%) are nonfamily households. The most numerous type of family households are 2-person households, comprising 4,317, and the most common type of nonfamily households are 1-person households, comprising 3,369.
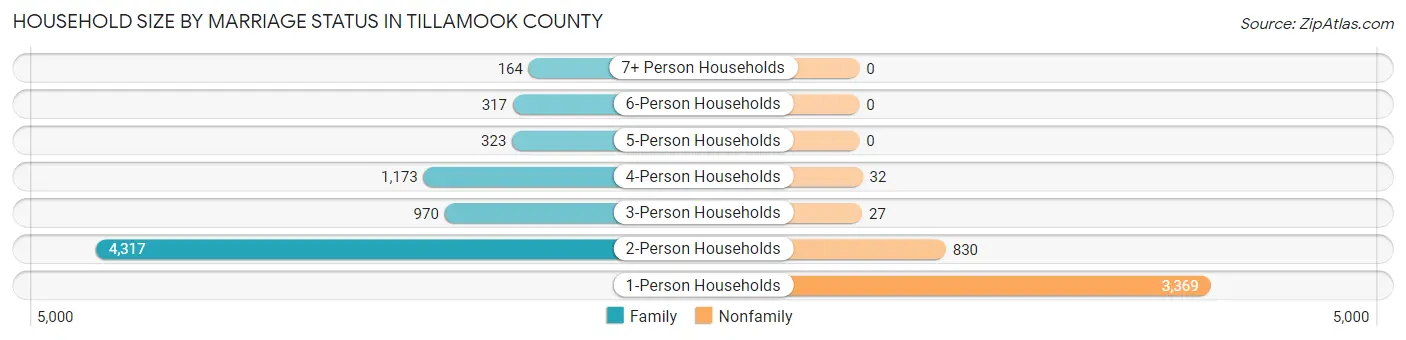
| Household Size | Family Households | Nonfamily Households |
| 1-Person Households | - | 3,369 (29.2%) |
| 2-Person Households | 4,317 (37.5%) | 830 (7.2%) |
| 3-Person Households | 970 (8.4%) | 27 (0.2%) |
| 4-Person Households | 1,173 (10.2%) | 32 (0.3%) |
| 5-Person Households | 323 (2.8%) | 0 (0.0%) |
| 6-Person Households | 317 (2.8%) | 0 (0.0%) |
| 7+ Person Households | 164 (1.4%) | 0 (0.0%) |
| Total | 7,264 (63.0%) | 4,258 (37.0%) |
Female Fertility in Tillamook County
Fertility by Age in Tillamook County
Average fertility rate in Tillamook County is 78.0 births per 1,000 women. Women in the age bracket of 20 to 34 years have the highest fertility rate with 138.0 births per 1,000 women. Women in the age bracket of 20 to 34 years acount for 67.2% of all women with births.
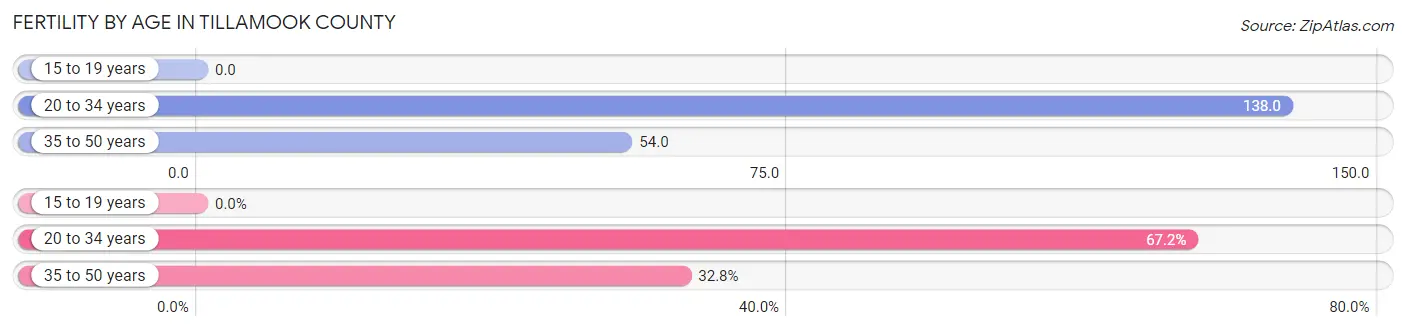
| Age Bracket | Women with Births | Births / 1,000 Women |
| 15 to 19 years | 0 (0.0%) | 0.0 |
| 20 to 34 years | 252 (67.2%) | 138.0 |
| 35 to 50 years | 123 (32.8%) | 54.0 |
| Total | 375 (100.0%) | 78.0 |
Fertility by Age by Marriage Status in Tillamook County
57.9% of women with births (375) in Tillamook County are married. The highest percentage of unmarried women with births falls into 20 to 34 years age bracket with 59.9% of them unmarried at the time of birth, while the lowest percentage of unmarried women with births belong to 35 to 50 years age bracket with 5.7% of them unmarried.
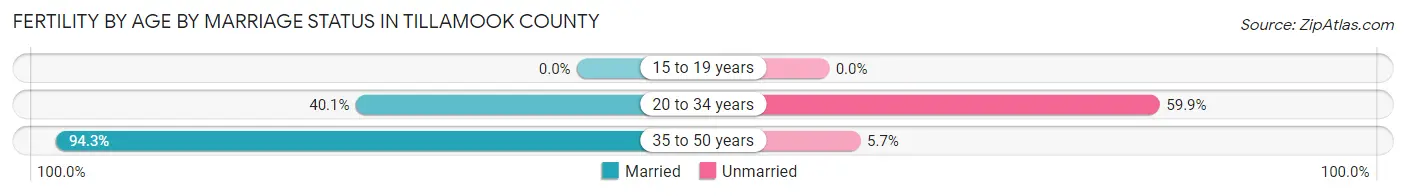
| Age Bracket | Married | Unmarried |
| 15 to 19 years | 0 (0.0%) | 0 (0.0%) |
| 20 to 34 years | 101 (40.1%) | 151 (59.9%) |
| 35 to 50 years | 116 (94.3%) | 7 (5.7%) |
| Total | 217 (57.9%) | 158 (42.1%) |
Fertility by Education in Tillamook County
Average fertility rate in Tillamook County is 78.0 births per 1,000 women. Women with the education attainment of graduate degree have the highest fertility rate of 115.0 births per 1,000 women, while women with the education attainment of less than high school have the lowest fertility at 52.0 births per 1,000 women. Women with the education attainment of college or associate's degree represent 38.1% of all women with births.
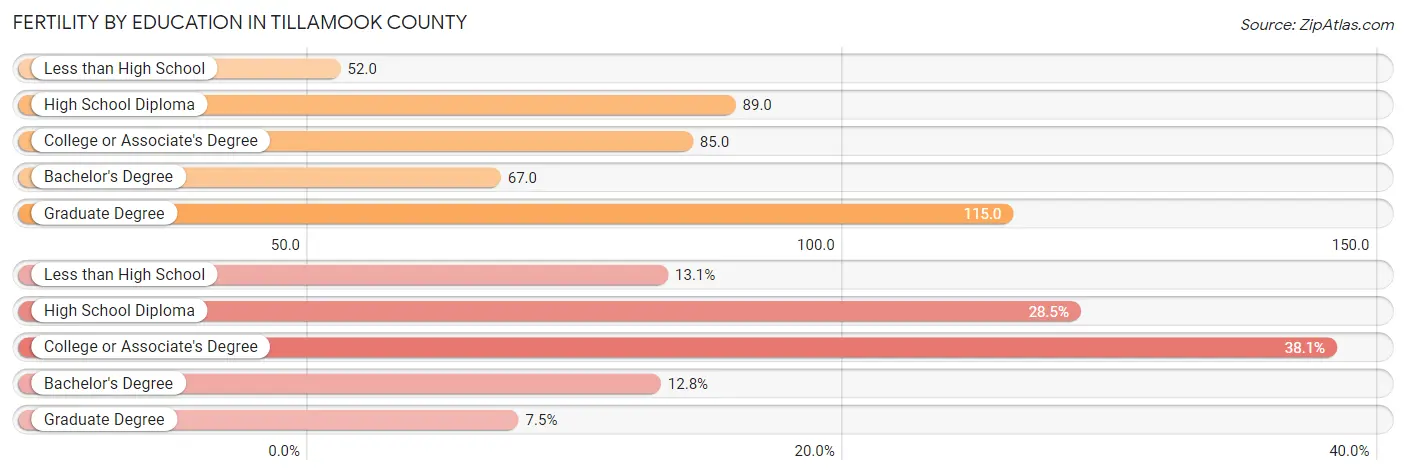
| Educational Attainment | Women with Births | Births / 1,000 Women |
| Less than High School | 49 (13.1%) | 52.0 |
| High School Diploma | 107 (28.5%) | 89.0 |
| College or Associate's Degree | 143 (38.1%) | 85.0 |
| Bachelor's Degree | 48 (12.8%) | 67.0 |
| Graduate Degree | 28 (7.5%) | 115.0 |
| Total | 375 (100.0%) | 78.0 |
Fertility by Education by Marriage Status in Tillamook County
42.1% of women with births in Tillamook County are unmarried. Women with the educational attainment of bachelor's degree are most likely to be married with 100.0% of them married at childbirth, while women with the educational attainment of college or associate's degree are least likely to be married with 77.6% of them unmarried at childbirth.
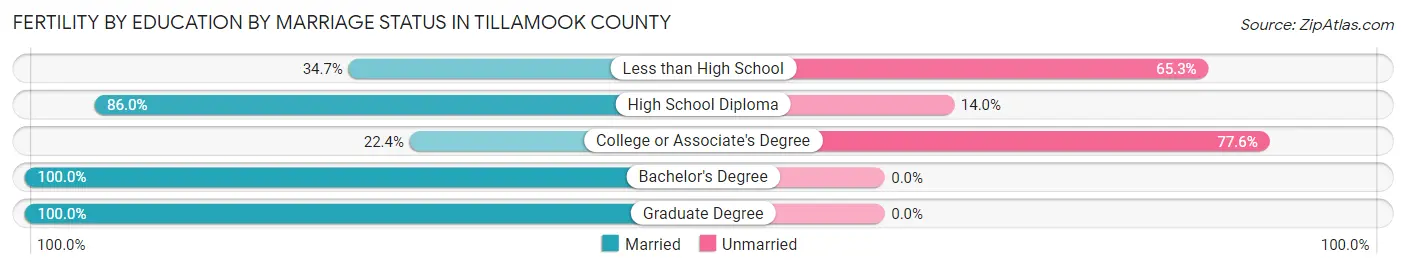
| Educational Attainment | Married | Unmarried |
| Less than High School | 17 (34.7%) | 32 (65.3%) |
| High School Diploma | 92 (86.0%) | 15 (14.0%) |
| College or Associate's Degree | 32 (22.4%) | 111 (77.6%) |
| Bachelor's Degree | 48 (100.0%) | 0 (0.0%) |
| Graduate Degree | 28 (100.0%) | 0 (0.0%) |
| Total | 217 (57.9%) | 158 (42.1%) |
Income in Tillamook County
Income Overview in Tillamook County
Per Capita Income in Tillamook County is $35,433, while median incomes of families and households are $73,101 and $63,098 respectively.
| Characteristic | Number | Measure |
| Per Capita Income | 27,345 | $35,433 |
| Median Family Income | 7,264 | $73,101 |
| Mean Family Income | 7,264 | $97,106 |
| Median Household Income | 11,522 | $63,098 |
| Mean Household Income | 11,522 | $81,374 |
| Income Deficit | 7,264 | $9,926 |
| Wage / Income Gap (%) | 27,345 | 30.82% |
| Wage / Income Gap ($) | 27,345 | 69.18¢ per $1 |
| Gini / Inequality Index | 27,345 | 0.44 |
Earnings by Sex in Tillamook County
Average Earnings in Tillamook County are $36,458, $42,285 for men and $29,251 for women, a difference of 30.8%.
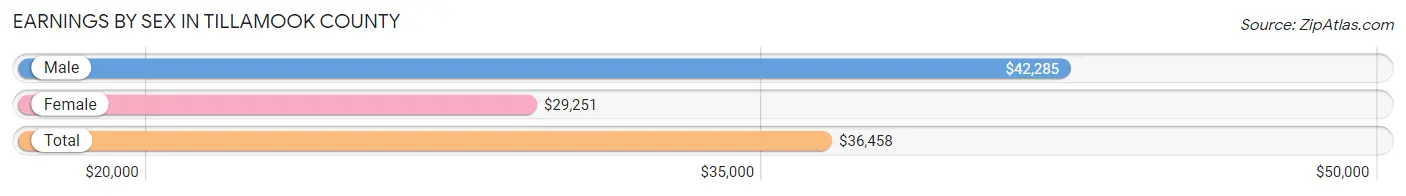
| Sex | Number | Average Earnings |
| Male | 6,923 (53.3%) | $42,285 |
| Female | 6,054 (46.7%) | $29,251 |
| Total | 12,977 (100.0%) | $36,458 |
Earnings by Sex by Income Bracket in Tillamook County
The most common earnings brackets in Tillamook County are $100,000+ for men (918 | 13.3%) and $25,000 to $29,999 for women (678 | 11.2%).
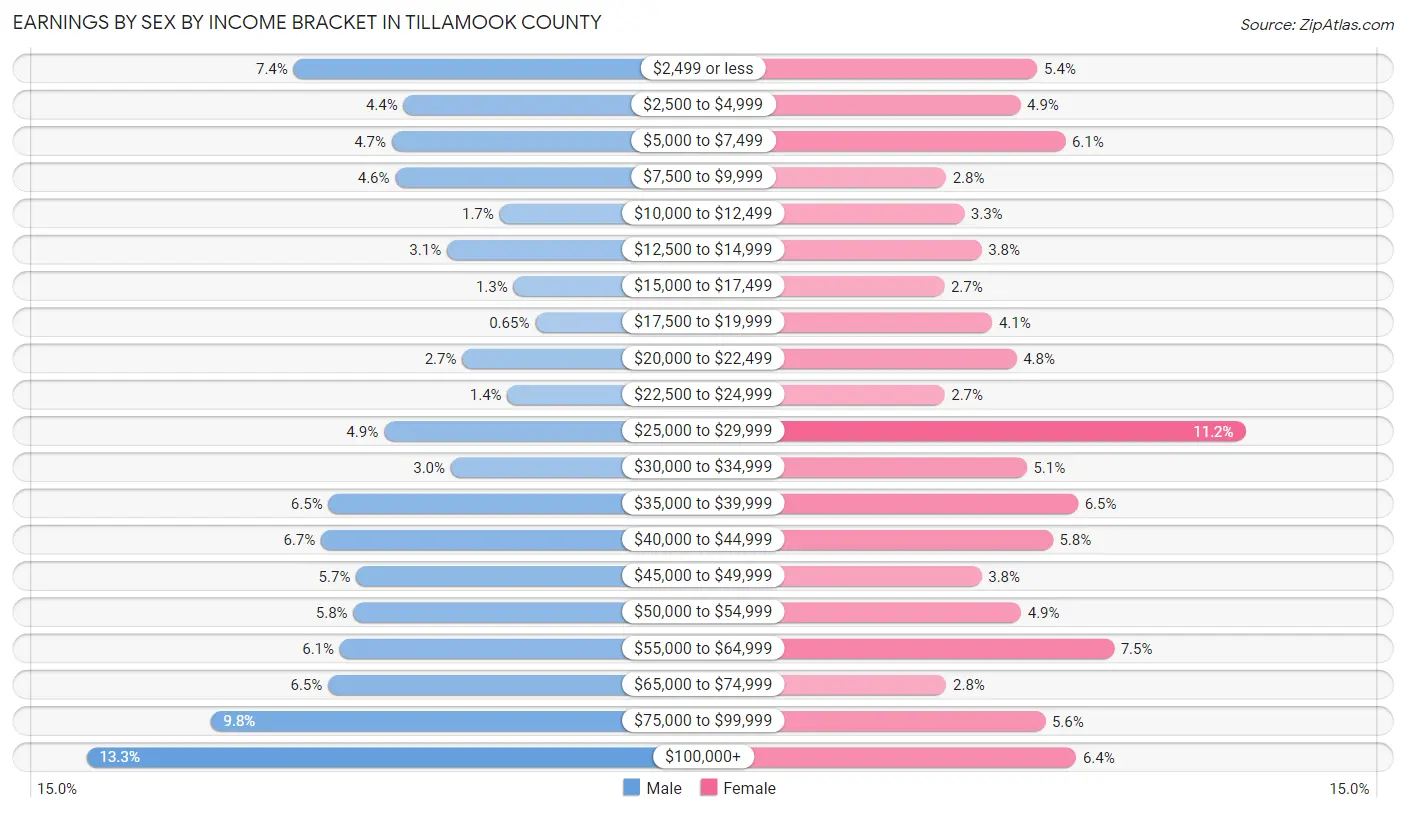
| Income | Male | Female |
| $2,499 or less | 515 (7.4%) | 324 (5.3%) |
| $2,500 to $4,999 | 301 (4.3%) | 295 (4.9%) |
| $5,000 to $7,499 | 324 (4.7%) | 371 (6.1%) |
| $7,500 to $9,999 | 317 (4.6%) | 168 (2.8%) |
| $10,000 to $12,499 | 114 (1.7%) | 199 (3.3%) |
| $12,500 to $14,999 | 217 (3.1%) | 229 (3.8%) |
| $15,000 to $17,499 | 87 (1.3%) | 165 (2.7%) |
| $17,500 to $19,999 | 45 (0.6%) | 247 (4.1%) |
| $20,000 to $22,499 | 187 (2.7%) | 288 (4.8%) |
| $22,500 to $24,999 | 99 (1.4%) | 166 (2.7%) |
| $25,000 to $29,999 | 339 (4.9%) | 678 (11.2%) |
| $30,000 to $34,999 | 209 (3.0%) | 306 (5.1%) |
| $35,000 to $39,999 | 447 (6.5%) | 393 (6.5%) |
| $40,000 to $44,999 | 462 (6.7%) | 350 (5.8%) |
| $45,000 to $49,999 | 393 (5.7%) | 229 (3.8%) |
| $50,000 to $54,999 | 399 (5.8%) | 296 (4.9%) |
| $55,000 to $64,999 | 425 (6.1%) | 454 (7.5%) |
| $65,000 to $74,999 | 448 (6.5%) | 169 (2.8%) |
| $75,000 to $99,999 | 677 (9.8%) | 337 (5.6%) |
| $100,000+ | 918 (13.3%) | 390 (6.4%) |
| Total | 6,923 (100.0%) | 6,054 (100.0%) |
Earnings by Sex by Educational Attainment in Tillamook County
Average earnings in Tillamook County are $47,189 for men and $31,758 for women, a difference of 32.7%. Men with an educational attainment of bachelor's degree enjoy the highest average annual earnings of $69,559, while those with less than high school education earn the least with $41,130. Women with an educational attainment of graduate degree earn the most with the average annual earnings of $58,322, while those with high school diploma education have the smallest earnings of $21,927.
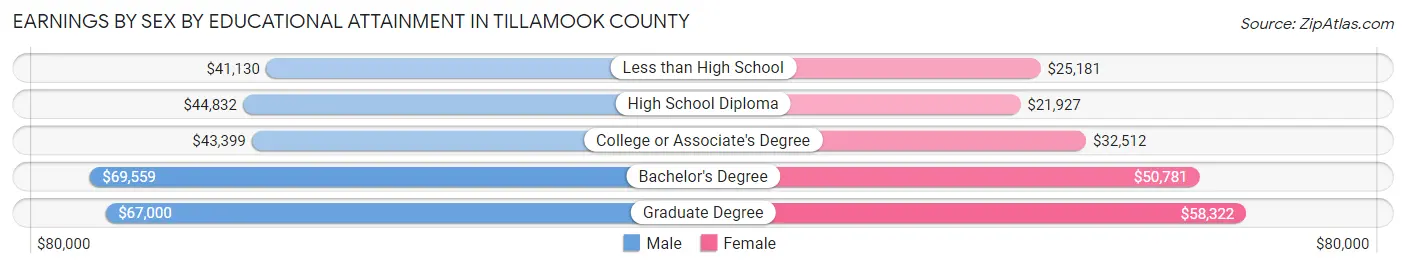
| Educational Attainment | Male Income | Female Income |
| Less than High School | $41,130 | $25,181 |
| High School Diploma | $44,832 | $21,927 |
| College or Associate's Degree | $43,399 | $32,512 |
| Bachelor's Degree | $69,559 | $50,781 |
| Graduate Degree | $67,000 | $58,322 |
| Total | $47,189 | $31,758 |
Family Income in Tillamook County
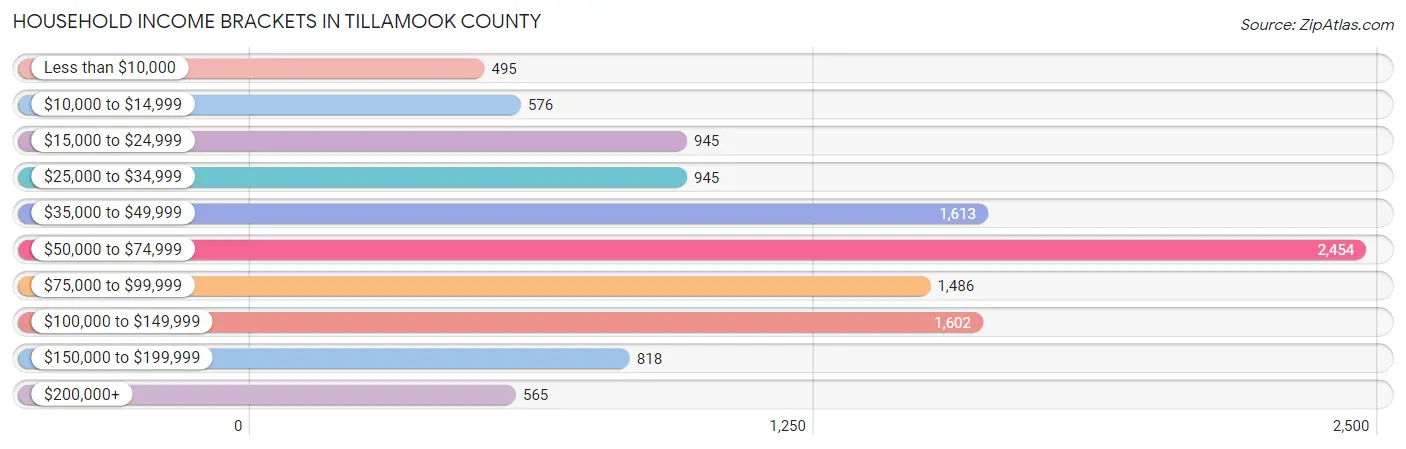
Family Income Brackets in Tillamook County
According to the Tillamook County family income data, there are 1,743 families falling into the $50,000 to $74,999 income range, which is the most common income bracket and makes up 24.0% of all families. Conversely, the less than $10,000 income bracket is the least frequent group with only 153 families (2.1%) belonging to this category.
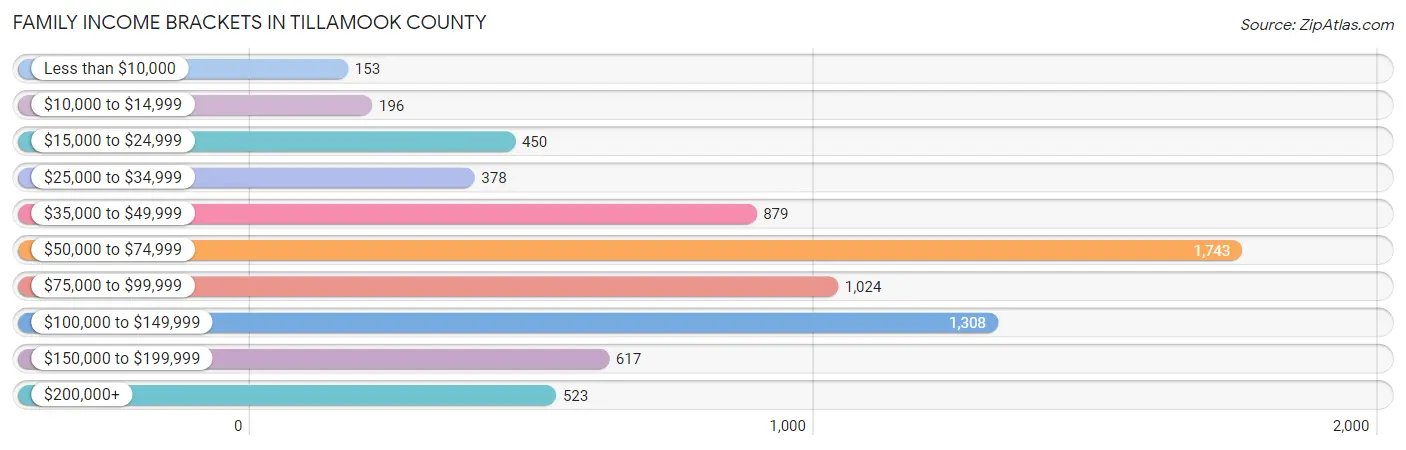
| Income Bracket | # Families | % Families |
| Less than $10,000 | 153 | 2.1% |
| $10,000 to $14,999 | 196 | 2.7% |
| $15,000 to $24,999 | 450 | 6.2% |
| $25,000 to $34,999 | 378 | 5.2% |
| $35,000 to $49,999 | 879 | 12.1% |
| $50,000 to $74,999 | 1,743 | 24.0% |
| $75,000 to $99,999 | 1,024 | 14.1% |
| $100,000 to $149,999 | 1,308 | 18.0% |
| $150,000 to $199,999 | 617 | 8.5% |
| $200,000+ | 523 | 7.2% |
Family Income by Famaliy Size in Tillamook County
5-person families (364 | 5.0%) account for the highest median family income in Tillamook County with $95,946 per family, while 2-person families (4,581 | 63.1%) have the highest median income of $34,616 per family member.
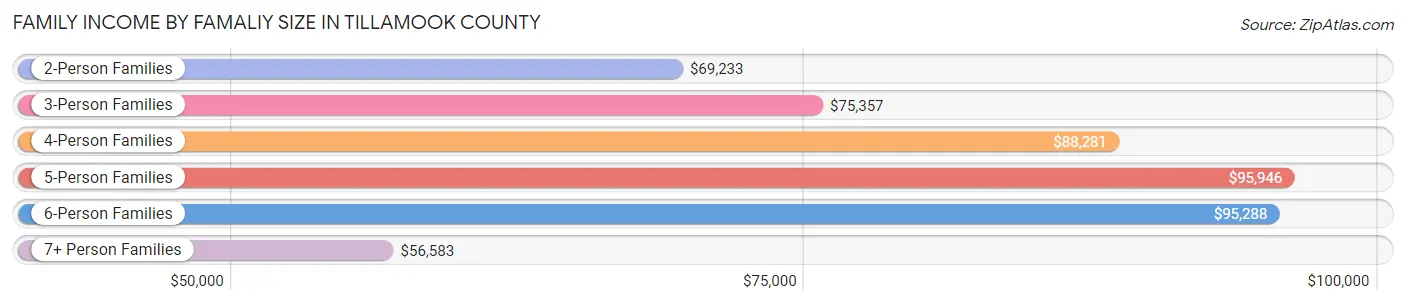
| Income Bracket | # Families | Median Income |
| 2-Person Families | 4,581 (63.1%) | $69,233 |
| 3-Person Families | 972 (13.4%) | $75,357 |
| 4-Person Families | 1,000 (13.8%) | $88,281 |
| 5-Person Families | 364 (5.0%) | $95,946 |
| 6-Person Families | 223 (3.1%) | $95,288 |
| 7+ Person Families | 124 (1.7%) | $56,583 |
| Total | 7,264 (100.0%) | $73,101 |
Family Income by Number of Earners in Tillamook County
The median family income in Tillamook County is $73,101, with families comprising 3+ earners (609) having the highest median family income of $118,309, while families with no earners (1,831) have the lowest median family income of $60,694, accounting for 8.4% and 25.2% of families, respectively.
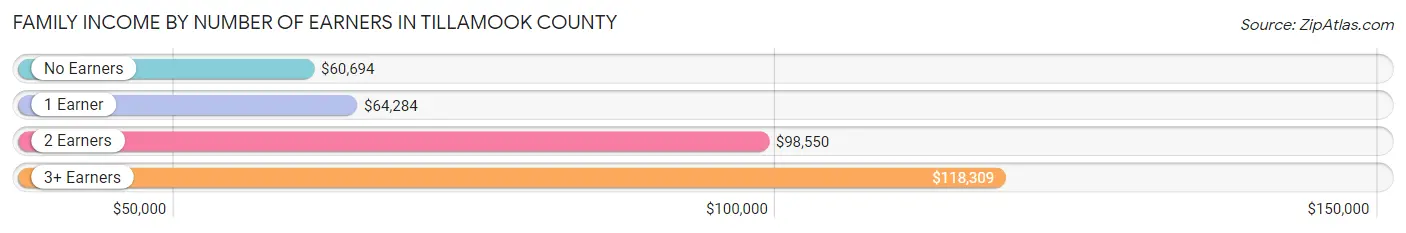
| Number of Earners | # Families | Median Income |
| No Earners | 1,831 (25.2%) | $60,694 |
| 1 Earner | 2,435 (33.5%) | $64,284 |
| 2 Earners | 2,389 (32.9%) | $98,550 |
| 3+ Earners | 609 (8.4%) | $118,309 |
| Total | 7,264 (100.0%) | $73,101 |
Household Income in Tillamook County
Household Income Brackets in Tillamook County
With 2,454 households falling in the category, the $50,000 to $74,999 income range is the most frequent in Tillamook County, accounting for 21.3% of all households. In contrast, only 495 households (4.3%) fall into the less than $10,000 income bracket, making it the least populous group.
| Income Bracket | # Households | % Households |
| Less than $10,000 | 495 | 4.3% |
| $10,000 to $14,999 | 576 | 5.0% |
| $15,000 to $24,999 | 945 | 8.2% |
| $25,000 to $34,999 | 945 | 8.2% |
| $35,000 to $49,999 | 1,613 | 14.0% |
| $50,000 to $74,999 | 2,454 | 21.3% |
| $75,000 to $99,999 | 1,486 | 12.9% |
| $100,000 to $149,999 | 1,602 | 13.9% |
| $150,000 to $199,999 | 818 | 7.1% |
| $200,000+ | 565 | 4.9% |
Household Income by Householder Age in Tillamook County
The median household income in Tillamook County is $63,098, with the highest median household income of $74,076 found in the 45 to 64 years age bracket for the primary householder. A total of 3,790 households (32.9%) fall into this category. Meanwhile, the 15 to 24 years age bracket for the primary householder has the lowest median household income of $0, with 221 households (1.9%) in this group.
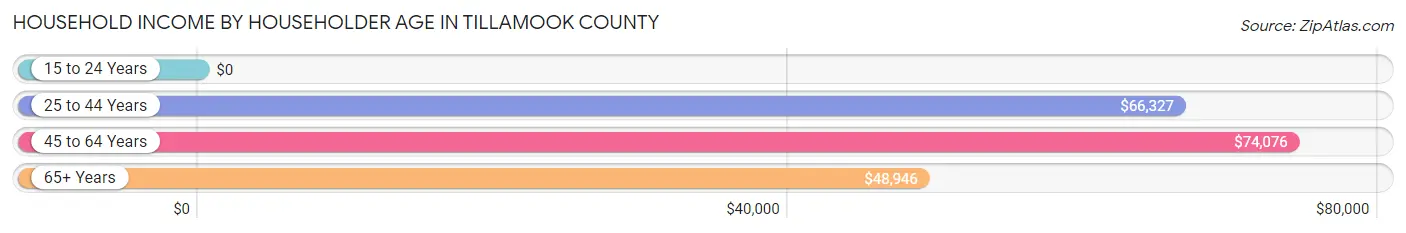
| Income Bracket | # Households | Median Income |
| 15 to 24 Years | 221 (1.9%) | $0 |
| 25 to 44 Years | 2,707 (23.5%) | $66,327 |
| 45 to 64 Years | 3,790 (32.9%) | $74,076 |
| 65+ Years | 4,804 (41.7%) | $48,946 |
| Total | 11,522 (100.0%) | $63,098 |
Poverty in Tillamook County
Income Below Poverty by Sex and Age in Tillamook County
With 13.0% poverty level for males and 12.0% for females among the residents of Tillamook County, 5 year old males and 12 to 14 year old females are the most vulnerable to poverty, with 50 males (44.6%) and 75 females (18.6%) in their respective age groups living below the poverty level.
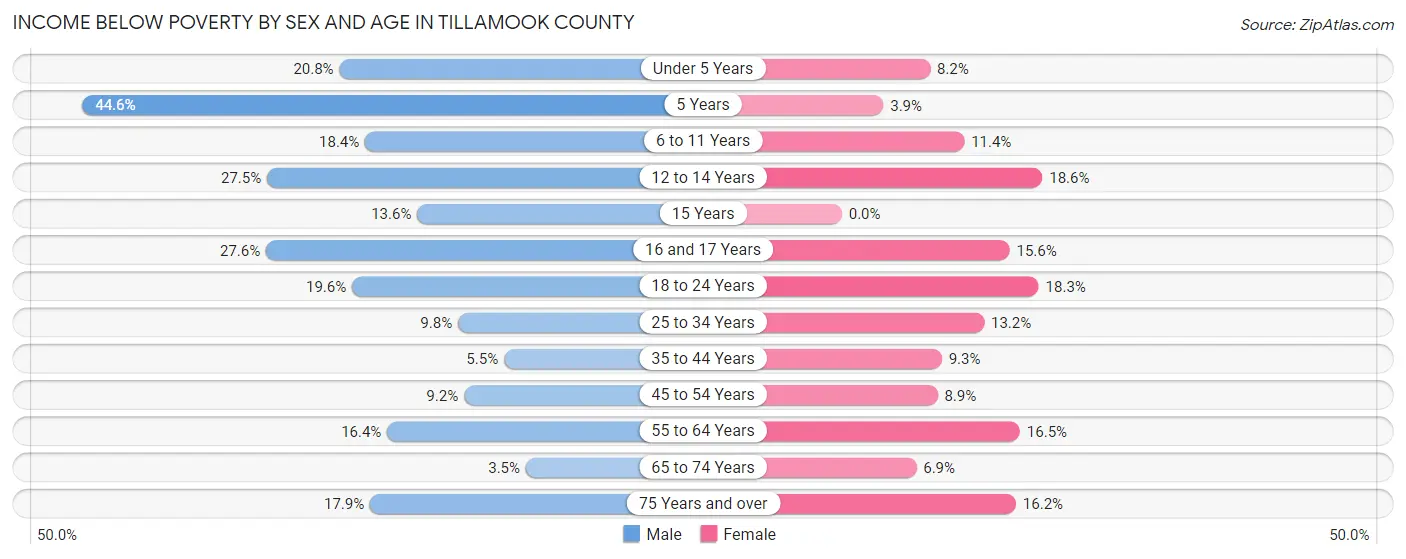
| Age Bracket | Male | Female |
| Under 5 Years | 122 (20.8%) | 45 (8.2%) |
| 5 Years | 50 (44.6%) | 5 (3.8%) |
| 6 to 11 Years | 163 (18.4%) | 92 (11.4%) |
| 12 to 14 Years | 140 (27.5%) | 75 (18.6%) |
| 15 Years | 32 (13.6%) | 0 (0.0%) |
| 16 and 17 Years | 56 (27.6%) | 52 (15.6%) |
| 18 to 24 Years | 172 (19.6%) | 127 (18.3%) |
| 25 to 34 Years | 118 (9.8%) | 177 (13.2%) |
| 35 to 44 Years | 80 (5.5%) | 144 (9.3%) |
| 45 to 54 Years | 133 (9.2%) | 132 (8.9%) |
| 55 to 64 Years | 346 (16.4%) | 372 (16.5%) |
| 65 to 74 Years | 80 (3.5%) | 161 (6.9%) |
| 75 Years and over | 212 (17.9%) | 233 (16.2%) |
| Total | 1,704 (13.0%) | 1,615 (12.0%) |
Income Above Poverty by Sex and Age in Tillamook County
According to the poverty statistics in Tillamook County, males aged 65 to 74 years and females aged 15 years are the age groups that are most secure financially, with 96.5% of males and 100.0% of females in these age groups living above the poverty line.
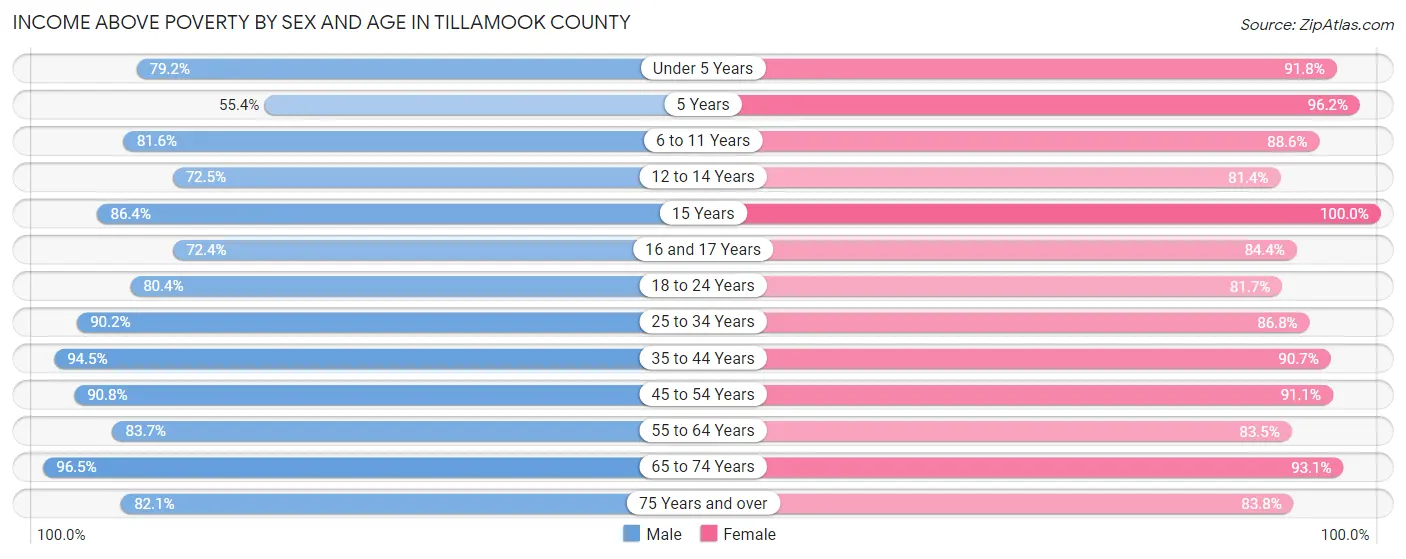
| Age Bracket | Male | Female |
| Under 5 Years | 465 (79.2%) | 505 (91.8%) |
| 5 Years | 62 (55.4%) | 125 (96.2%) |
| 6 to 11 Years | 723 (81.6%) | 718 (88.6%) |
| 12 to 14 Years | 369 (72.5%) | 328 (81.4%) |
| 15 Years | 204 (86.4%) | 125 (100.0%) |
| 16 and 17 Years | 147 (72.4%) | 282 (84.4%) |
| 18 to 24 Years | 705 (80.4%) | 568 (81.7%) |
| 25 to 34 Years | 1,088 (90.2%) | 1,164 (86.8%) |
| 35 to 44 Years | 1,373 (94.5%) | 1,409 (90.7%) |
| 45 to 54 Years | 1,310 (90.8%) | 1,355 (91.1%) |
| 55 to 64 Years | 1,770 (83.7%) | 1,878 (83.5%) |
| 65 to 74 Years | 2,219 (96.5%) | 2,168 (93.1%) |
| 75 Years and over | 970 (82.1%) | 1,209 (83.8%) |
| Total | 11,405 (87.0%) | 11,834 (88.0%) |
Income Below Poverty Among Married-Couple Families in Tillamook County
The poverty statistics for married-couple families in Tillamook County show that 4.4% or 248 of the total 5,655 families live below the poverty line. Families with 5 or more children have the highest poverty rate of 23.3%, comprising of 20 families. On the other hand, families with no children have the lowest poverty rate of 3.2%, which includes 130 families.
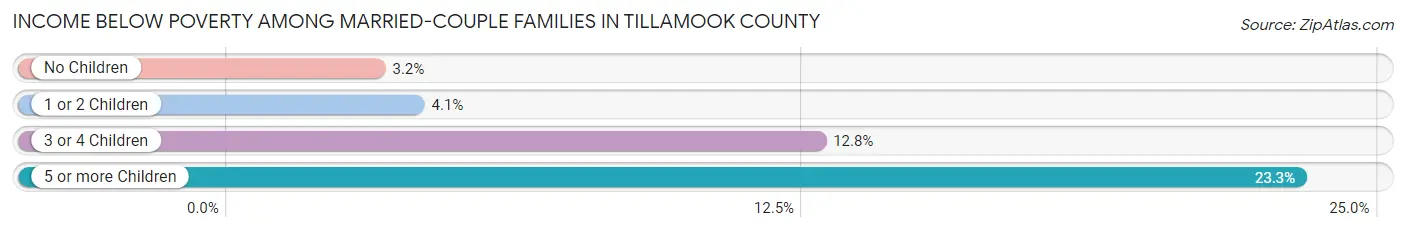
| Children | Above Poverty | Below Poverty |
| No Children | 3,916 (96.8%) | 130 (3.2%) |
| 1 or 2 Children | 1,064 (95.9%) | 45 (4.1%) |
| 3 or 4 Children | 361 (87.2%) | 53 (12.8%) |
| 5 or more Children | 66 (76.7%) | 20 (23.3%) |
| Total | 5,407 (95.6%) | 248 (4.4%) |
Income Below Poverty Among Single-Parent Households in Tillamook County
According to the poverty data in Tillamook County, 36.4% or 218 single-father households and 12.7% or 128 single-mother households are living below the poverty line. Among single-father households, those with 3 or 4 children have the highest poverty rate, with 32 households (51.6%) experiencing poverty. Likewise, among single-mother households, those with 5 or more children have the highest poverty rate, with 5 households (100.0%) falling below the poverty line.
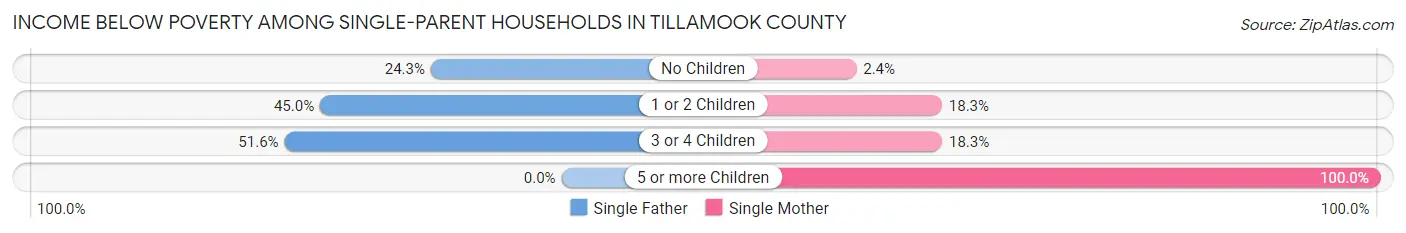
| Children | Single Father | Single Mother |
| No Children | 65 (24.3%) | 9 (2.4%) |
| 1 or 2 Children | 121 (45.0%) | 103 (18.3%) |
| 3 or 4 Children | 32 (51.6%) | 11 (18.3%) |
| 5 or more Children | 0 (0.0%) | 5 (100.0%) |
| Total | 218 (36.4%) | 128 (12.7%) |
Income Below Poverty Among Married-Couple vs Single-Parent Households in Tillamook County
The poverty data for Tillamook County shows that 248 of the married-couple family households (4.4%) and 346 of the single-parent households (21.5%) are living below the poverty level. Within the married-couple family households, those with 5 or more children have the highest poverty rate, with 20 households (23.3%) falling below the poverty line. Among the single-parent households, those with 5 or more children have the highest poverty rate, with 5 household (100.0%) living below poverty.
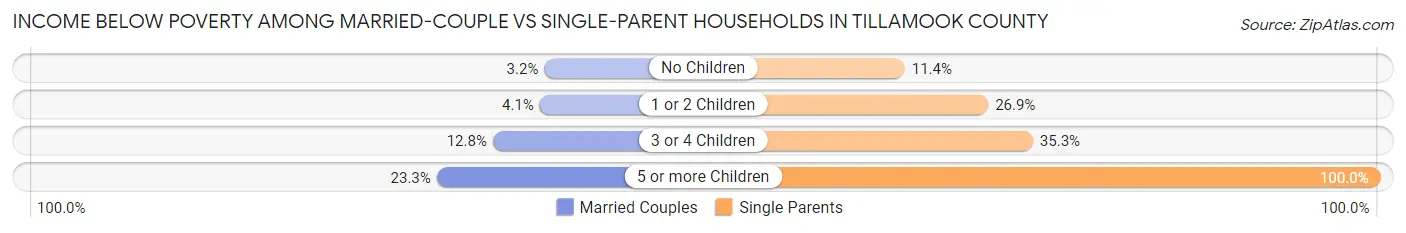
| Children | Married-Couple Families | Single-Parent Households |
| No Children | 130 (3.2%) | 74 (11.4%) |
| 1 or 2 Children | 45 (4.1%) | 224 (26.9%) |
| 3 or 4 Children | 53 (12.8%) | 43 (35.2%) |
| 5 or more Children | 20 (23.3%) | 5 (100.0%) |
| Total | 248 (4.4%) | 346 (21.5%) |
Employment Characteristics in Tillamook County
Employment by Class of Employer in Tillamook County
Among the 10,750 employed individuals in Tillamook County, private company employees (6,018 | 56.0%), self-employed (not incorporated) (1,110 | 10.3%), and not-for-profit organizations (1,015 | 9.4%) make up the most common classes of employment.
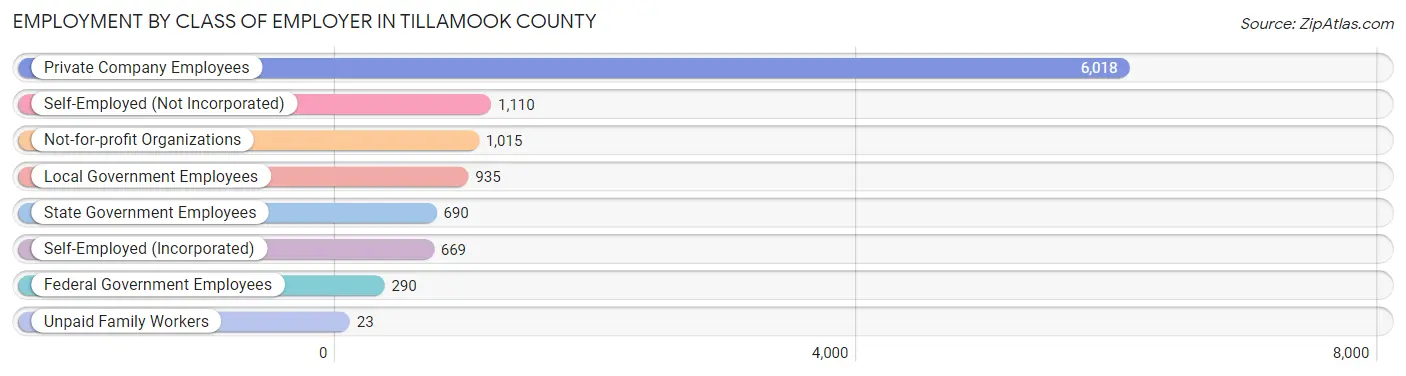
| Employer Class | # Employees | % Employees |
| Private Company Employees | 6,018 | 56.0% |
| Self-Employed (Incorporated) | 669 | 6.2% |
| Self-Employed (Not Incorporated) | 1,110 | 10.3% |
| Not-for-profit Organizations | 1,015 | 9.4% |
| Local Government Employees | 935 | 8.7% |
| State Government Employees | 690 | 6.4% |
| Federal Government Employees | 290 | 2.7% |
| Unpaid Family Workers | 23 | 0.2% |
| Total | 10,750 | 100.0% |
Employment Status by Age in Tillamook County
According to the labor force statistics for Tillamook County, out of the total population over 16 years of age (22,897), 50.3% or 11,517 individuals are in the labor force, with 5.2% or 599 of them unemployed. The age group with the highest labor force participation rate is 30 to 34 years, with 85.2% or 1,227 individuals in the labor force. Within the labor force, the 16 to 19 years age range has the highest percentage of unemployed individuals, with 17.9% or 82 of them being unemployed.
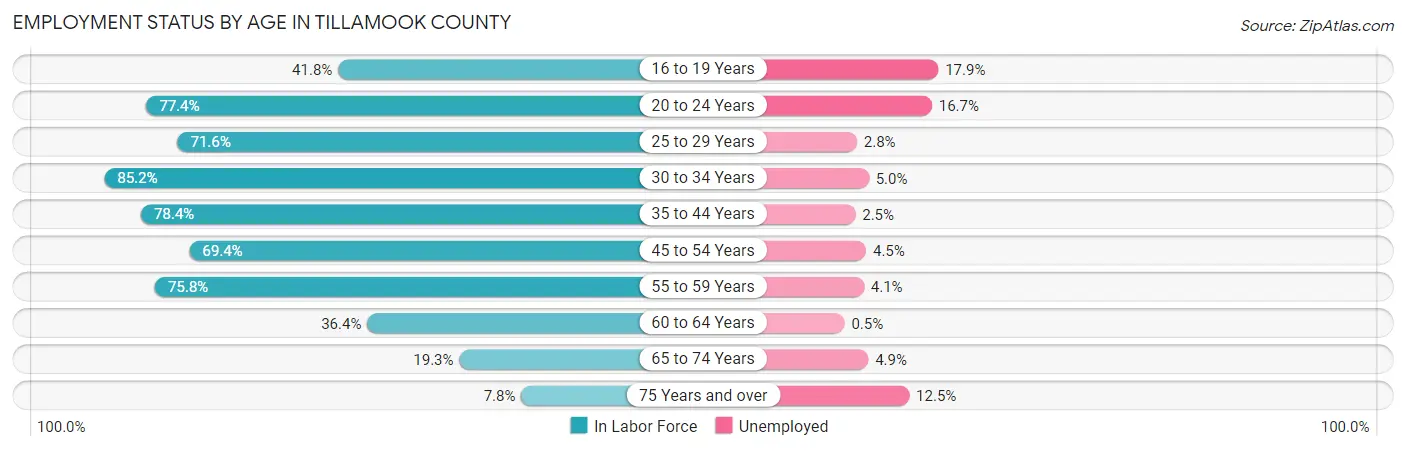
| Age Bracket | In Labor Force | Unemployed |
| 16 to 19 Years | 456 (41.8%) | 82 (17.9%) |
| 20 to 24 Years | 856 (77.4%) | 143 (16.7%) |
| 25 to 29 Years | 905 (71.6%) | 25 (2.8%) |
| 30 to 34 Years | 1,227 (85.2%) | 61 (5.0%) |
| 35 to 44 Years | 2,492 (78.4%) | 62 (2.5%) |
| 45 to 54 Years | 2,151 (69.4%) | 97 (4.5%) |
| 55 to 59 Years | 1,389 (75.8%) | 57 (4.1%) |
| 60 to 64 Years | 936 (36.4%) | 5 (0.5%) |
| 65 to 74 Years | 895 (19.3%) | 44 (4.9%) |
| 75 Years and over | 209 (7.8%) | 26 (12.5%) |
| Total | 11,517 (50.3%) | 599 (5.2%) |
Employment Status by Educational Attainment in Tillamook County
According to labor force statistics for Tillamook County, 68.0% of individuals (9,101) out of the total population between 25 and 64 years of age (13,384) are in the labor force, with 3.4% or 309 of them being unemployed. The group with the highest labor force participation rate are those with the educational attainment of bachelor's degree or higher, with 79.7% or 2,516 individuals in the labor force. Within the labor force, individuals with less than high school education have the highest percentage of unemployment, with 5.1% or 44 of them being unemployed.
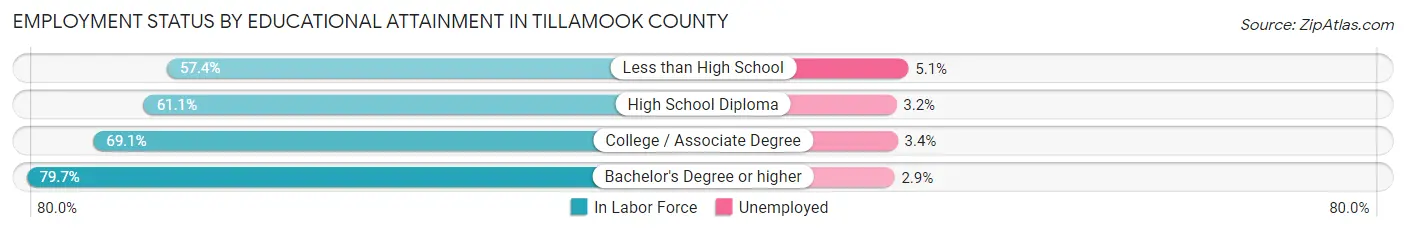
| Educational Attainment | In Labor Force | Unemployed |
| Less than High School | 871 (57.4%) | 77 (5.1%) |
| High School Diploma | 2,313 (61.1%) | 121 (3.2%) |
| College / Associate Degree | 3,402 (69.1%) | 167 (3.4%) |
| Bachelor's Degree or higher | 2,516 (79.7%) | 92 (2.9%) |
| Total | 9,101 (68.0%) | 455 (3.4%) |
Employment Occupations by Sex in Tillamook County
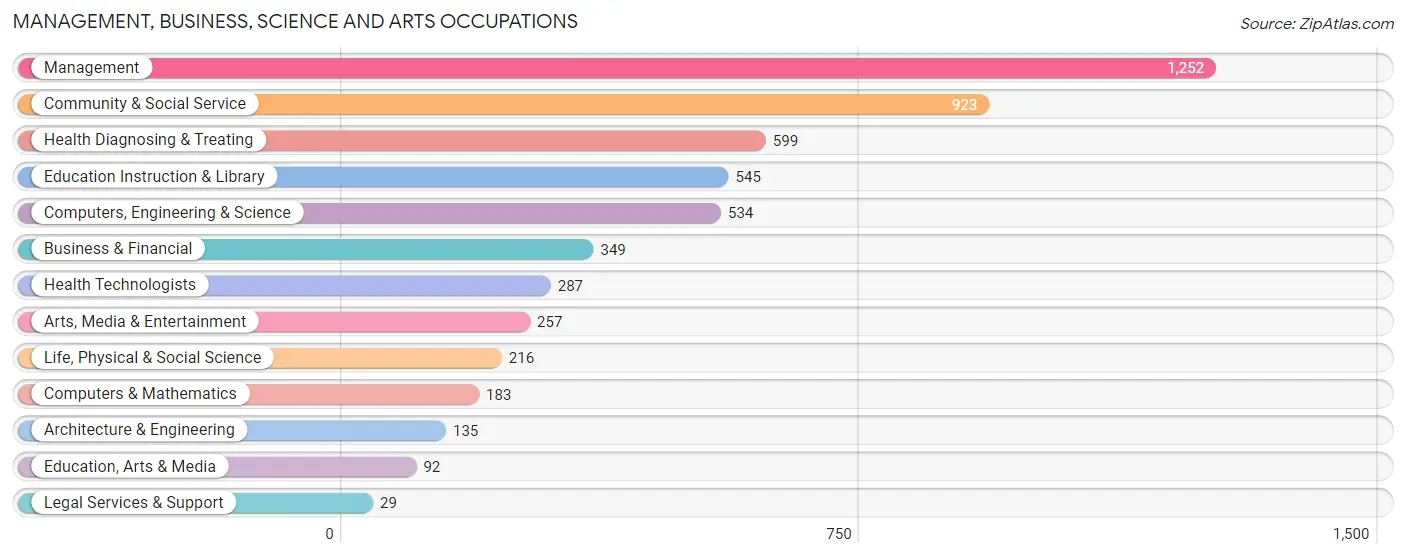
Management, Business, Science and Arts Occupations
The most common Management, Business, Science and Arts occupations in Tillamook County are Management (1,252 | 11.5%), Community & Social Service (923 | 8.5%), Health Diagnosing & Treating (599 | 5.5%), Education Instruction & Library (545 | 5.0%), and Computers, Engineering & Science (534 | 4.9%).
Management, Business, Science and Arts Occupations by Sex
Within the Management, Business, Science and Arts occupations in Tillamook County, the most male-oriented occupations are Legal Services & Support (89.7%), Life, Physical & Social Science (85.2%), and Architecture & Engineering (80.0%), while the most female-oriented occupations are Business & Financial (81.1%), Education, Arts & Media (75.0%), and Health Diagnosing & Treating (73.5%).
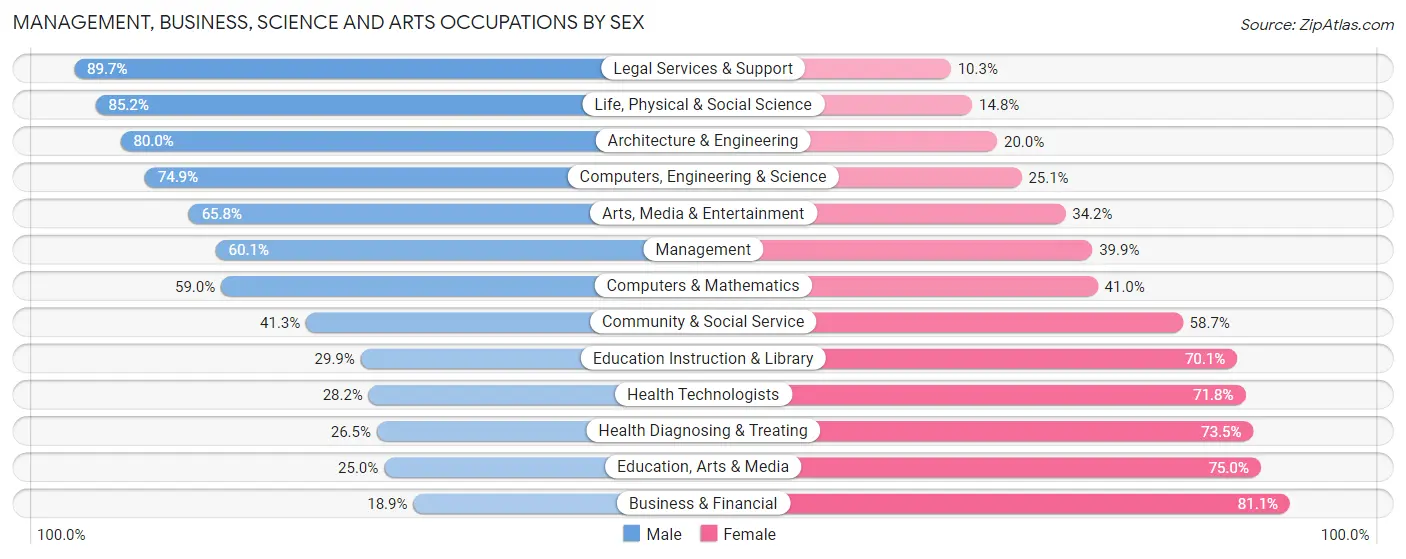
| Occupation | Male | Female |
| Management | 753 (60.1%) | 499 (39.9%) |
| Business & Financial | 66 (18.9%) | 283 (81.1%) |
| Computers, Engineering & Science | 400 (74.9%) | 134 (25.1%) |
| Computers & Mathematics | 108 (59.0%) | 75 (41.0%) |
| Architecture & Engineering | 108 (80.0%) | 27 (20.0%) |
| Life, Physical & Social Science | 184 (85.2%) | 32 (14.8%) |
| Community & Social Service | 381 (41.3%) | 542 (58.7%) |
| Education, Arts & Media | 23 (25.0%) | 69 (75.0%) |
| Legal Services & Support | 26 (89.7%) | 3 (10.3%) |
| Education Instruction & Library | 163 (29.9%) | 382 (70.1%) |
| Arts, Media & Entertainment | 169 (65.8%) | 88 (34.2%) |
| Health Diagnosing & Treating | 159 (26.5%) | 440 (73.5%) |
| Health Technologists | 81 (28.2%) | 206 (71.8%) |
| Total (Category) | 1,759 (48.1%) | 1,898 (51.9%) |
| Total (Overall) | 5,758 (52.8%) | 5,138 (47.1%) |
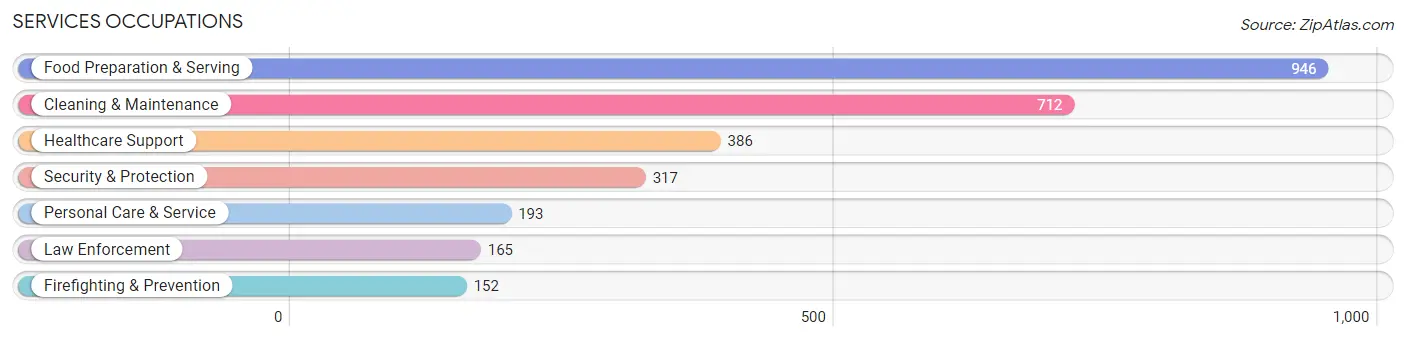
Services Occupations
The most common Services occupations in Tillamook County are Food Preparation & Serving (946 | 8.7%), Cleaning & Maintenance (712 | 6.5%), Healthcare Support (386 | 3.5%), Security & Protection (317 | 2.9%), and Personal Care & Service (193 | 1.8%).
Services Occupations by Sex
Within the Services occupations in Tillamook County, the most male-oriented occupations are Firefighting & Prevention (85.5%), Security & Protection (81.4%), and Law Enforcement (77.6%), while the most female-oriented occupations are Personal Care & Service (95.3%), Healthcare Support (74.1%), and Food Preparation & Serving (73.5%).
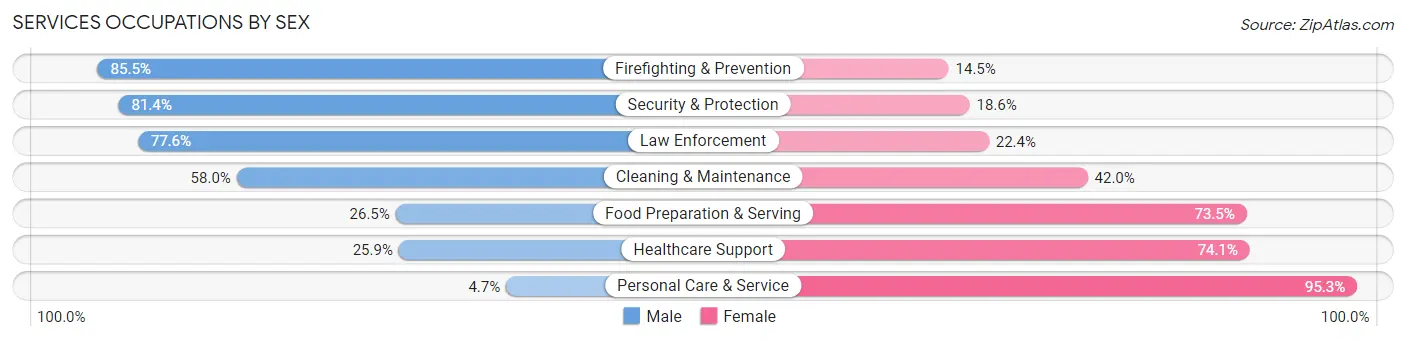
| Occupation | Male | Female |
| Healthcare Support | 100 (25.9%) | 286 (74.1%) |
| Security & Protection | 258 (81.4%) | 59 (18.6%) |
| Firefighting & Prevention | 130 (85.5%) | 22 (14.5%) |
| Law Enforcement | 128 (77.6%) | 37 (22.4%) |
| Food Preparation & Serving | 251 (26.5%) | 695 (73.5%) |
| Cleaning & Maintenance | 413 (58.0%) | 299 (42.0%) |
| Personal Care & Service | 9 (4.7%) | 184 (95.3%) |
| Total (Category) | 1,031 (40.4%) | 1,523 (59.6%) |
| Total (Overall) | 5,758 (52.8%) | 5,138 (47.1%) |
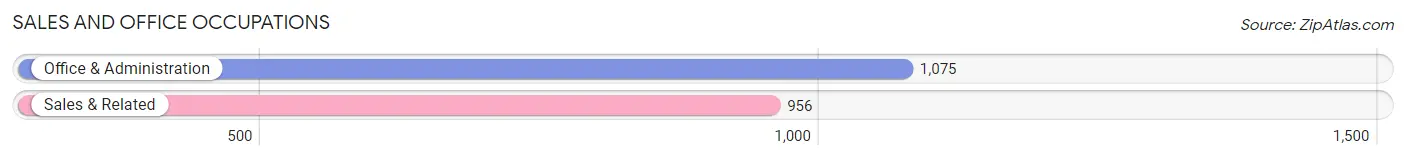
Sales and Office Occupations
The most common Sales and Office occupations in Tillamook County are Office & Administration (1,075 | 9.9%), and Sales & Related (956 | 8.8%).
Sales and Office Occupations by Sex
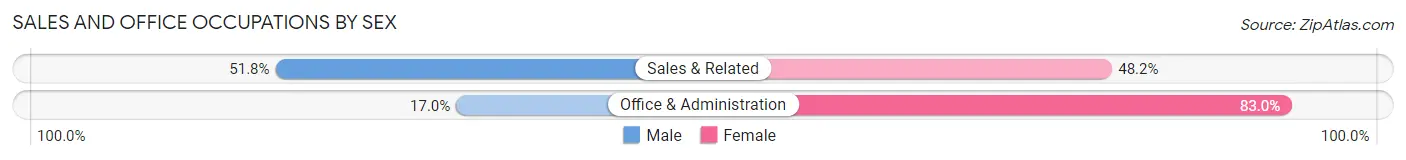
| Occupation | Male | Female |
| Sales & Related | 495 (51.8%) | 461 (48.2%) |
| Office & Administration | 183 (17.0%) | 892 (83.0%) |
| Total (Category) | 678 (33.4%) | 1,353 (66.6%) |
| Total (Overall) | 5,758 (52.8%) | 5,138 (47.1%) |
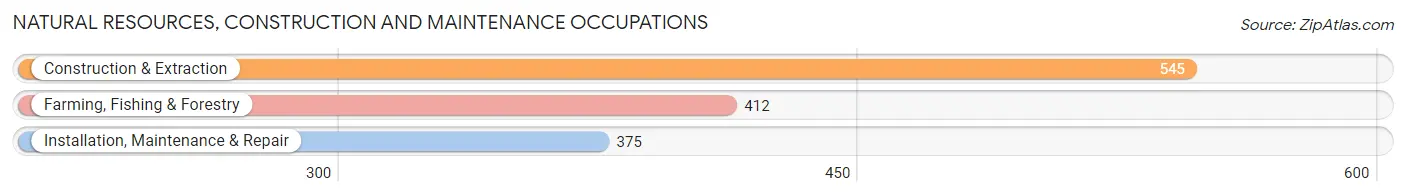
Natural Resources, Construction and Maintenance Occupations
The most common Natural Resources, Construction and Maintenance occupations in Tillamook County are Construction & Extraction (545 | 5.0%), Farming, Fishing & Forestry (412 | 3.8%), and Installation, Maintenance & Repair (375 | 3.4%).
Natural Resources, Construction and Maintenance Occupations by Sex
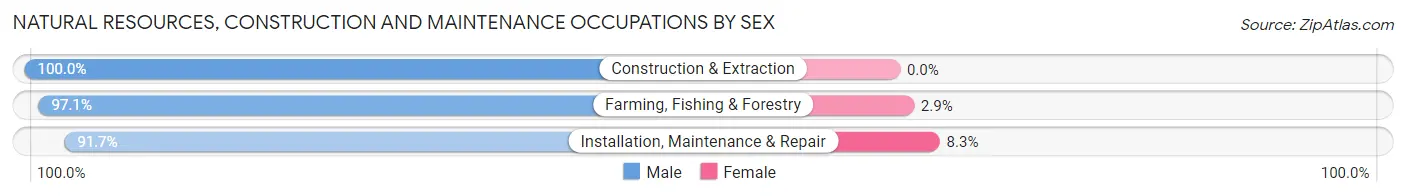
| Occupation | Male | Female |
| Farming, Fishing & Forestry | 400 (97.1%) | 12 (2.9%) |
| Construction & Extraction | 545 (100.0%) | 0 (0.0%) |
| Installation, Maintenance & Repair | 344 (91.7%) | 31 (8.3%) |
| Total (Category) | 1,289 (96.8%) | 43 (3.2%) |
| Total (Overall) | 5,758 (52.8%) | 5,138 (47.1%) |
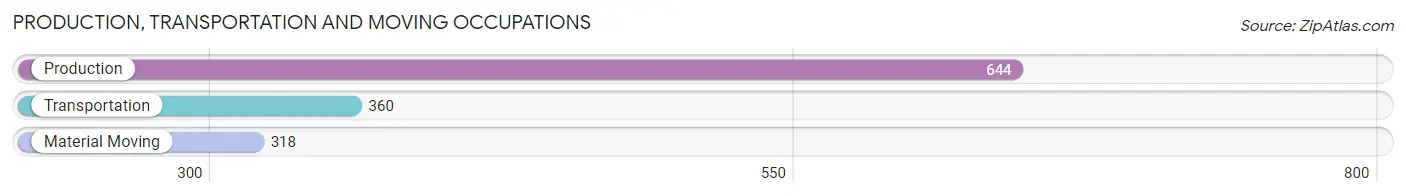
Production, Transportation and Moving Occupations
The most common Production, Transportation and Moving occupations in Tillamook County are Production (644 | 5.9%), Transportation (360 | 3.3%), and Material Moving (318 | 2.9%).
Production, Transportation and Moving Occupations by Sex
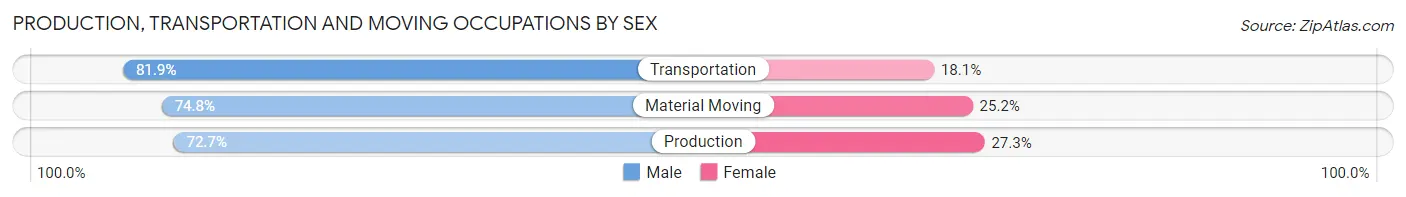
| Occupation | Male | Female |
| Production | 468 (72.7%) | 176 (27.3%) |
| Transportation | 295 (81.9%) | 65 (18.1%) |
| Material Moving | 238 (74.8%) | 80 (25.2%) |
| Total (Category) | 1,001 (75.7%) | 321 (24.3%) |
| Total (Overall) | 5,758 (52.8%) | 5,138 (47.1%) |
Employment Industries by Sex in Tillamook County
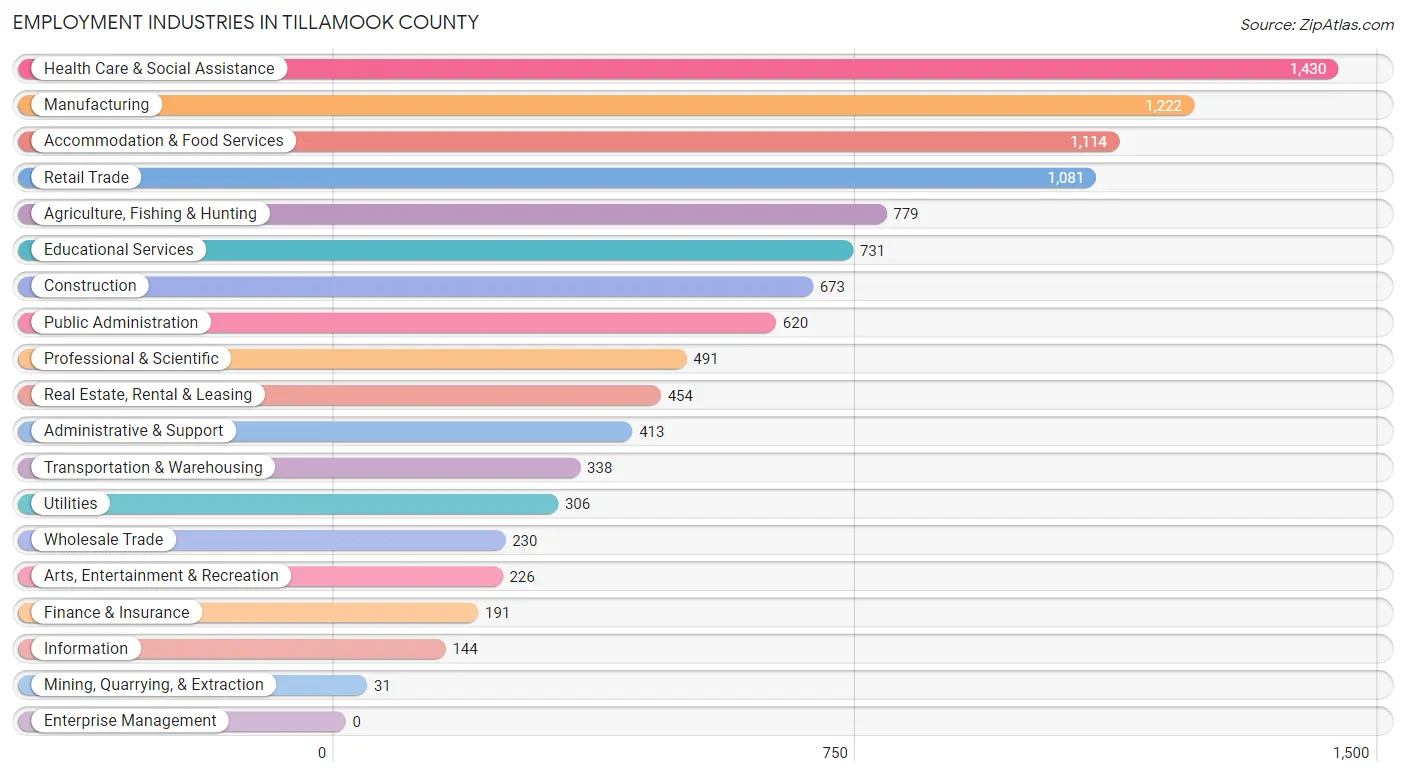
Employment Industries in Tillamook County
The major employment industries in Tillamook County include Health Care & Social Assistance (1,430 | 13.1%), Manufacturing (1,222 | 11.2%), Accommodation & Food Services (1,114 | 10.2%), Retail Trade (1,081 | 9.9%), and Agriculture, Fishing & Hunting (779 | 7.1%).
Employment Industries by Sex in Tillamook County
The Tillamook County industries that see more men than women are Construction (92.0%), Mining, Quarrying, & Extraction (90.3%), and Transportation & Warehousing (84.3%), whereas the industries that tend to have a higher number of women are Health Care & Social Assistance (75.7%), Wholesale Trade (74.4%), and Arts, Entertainment & Recreation (70.8%).
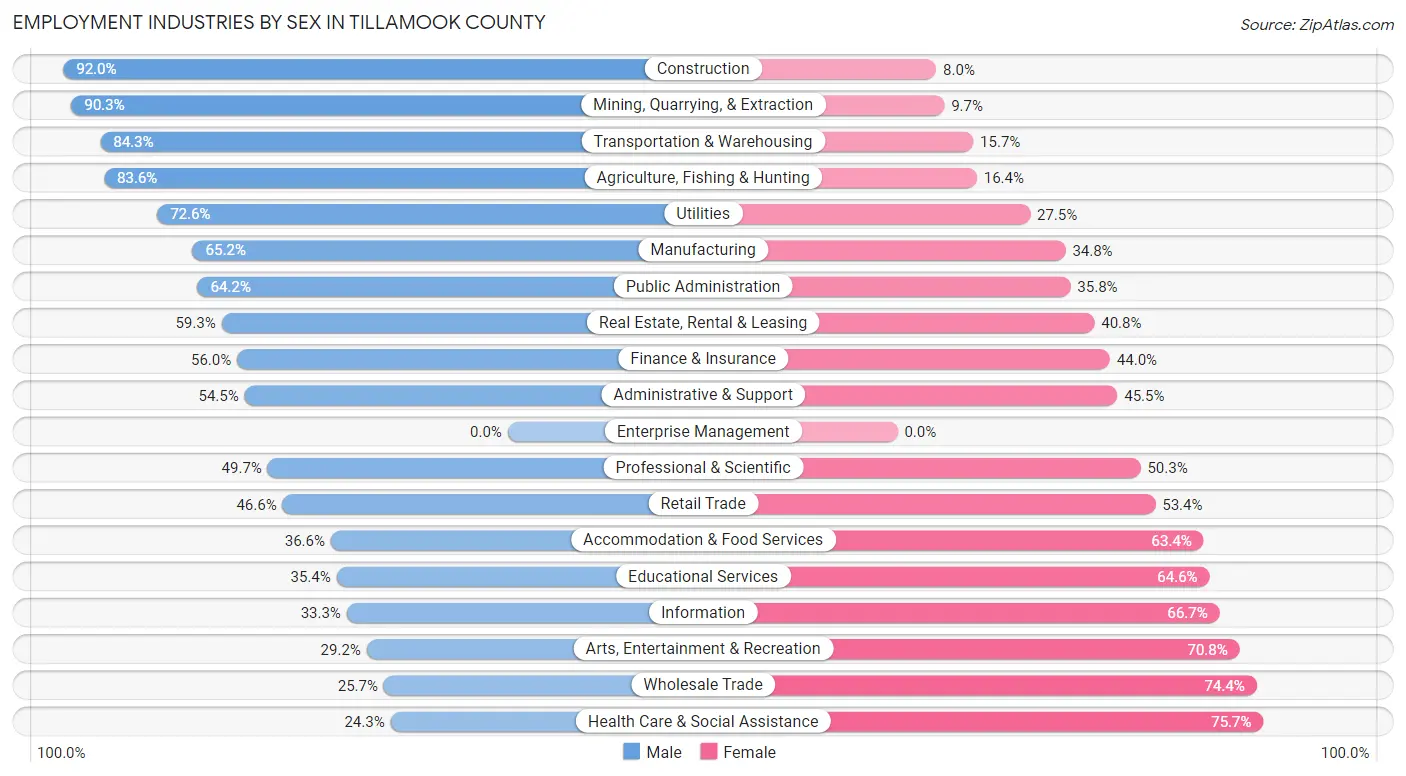
| Industry | Male | Female |
| Agriculture, Fishing & Hunting | 651 (83.6%) | 128 (16.4%) |
| Mining, Quarrying, & Extraction | 28 (90.3%) | 3 (9.7%) |
| Construction | 619 (92.0%) | 54 (8.0%) |
| Manufacturing | 797 (65.2%) | 425 (34.8%) |
| Wholesale Trade | 59 (25.7%) | 171 (74.4%) |
| Retail Trade | 504 (46.6%) | 577 (53.4%) |
| Transportation & Warehousing | 285 (84.3%) | 53 (15.7%) |
| Utilities | 222 (72.6%) | 84 (27.5%) |
| Information | 48 (33.3%) | 96 (66.7%) |
| Finance & Insurance | 107 (56.0%) | 84 (44.0%) |
| Real Estate, Rental & Leasing | 269 (59.3%) | 185 (40.7%) |
| Professional & Scientific | 244 (49.7%) | 247 (50.3%) |
| Enterprise Management | 0 (0.0%) | 0 (0.0%) |
| Administrative & Support | 225 (54.5%) | 188 (45.5%) |
| Educational Services | 259 (35.4%) | 472 (64.6%) |
| Health Care & Social Assistance | 347 (24.3%) | 1,083 (75.7%) |
| Arts, Entertainment & Recreation | 66 (29.2%) | 160 (70.8%) |
| Accommodation & Food Services | 408 (36.6%) | 706 (63.4%) |
| Public Administration | 398 (64.2%) | 222 (35.8%) |
| Total | 5,758 (52.8%) | 5,138 (47.1%) |
Education in Tillamook County
School Enrollment in Tillamook County
The most common levels of schooling among the 4,795 students in Tillamook County are elementary school (1,253 | 26.1%), middle school (1,214 | 25.3%), and high school (1,149 | 24.0%).
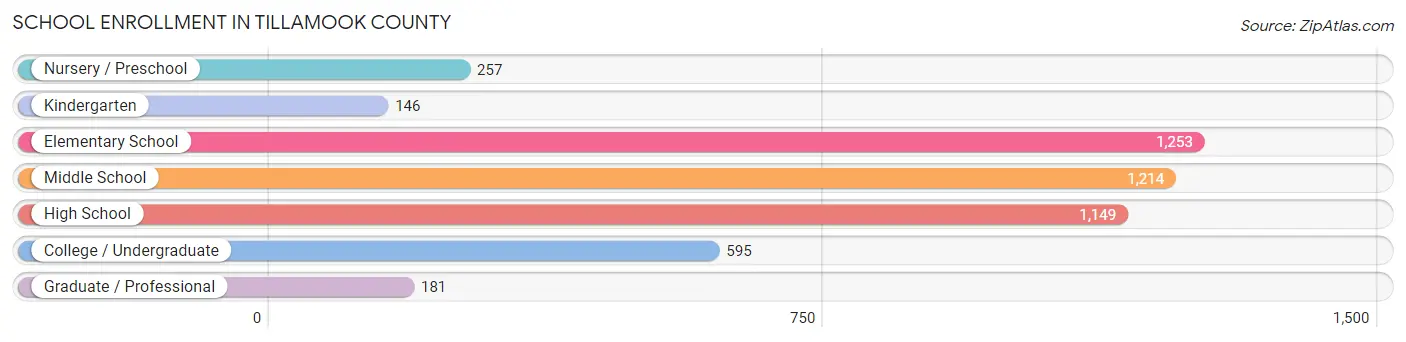
| School Level | # Students | % Students |
| Nursery / Preschool | 257 | 5.4% |
| Kindergarten | 146 | 3.0% |
| Elementary School | 1,253 | 26.1% |
| Middle School | 1,214 | 25.3% |
| High School | 1,149 | 24.0% |
| College / Undergraduate | 595 | 12.4% |
| Graduate / Professional | 181 | 3.8% |
| Total | 4,795 | 100.0% |
School Enrollment by Age by Funding Source in Tillamook County
Out of a total of 4,795 students who are enrolled in schools in Tillamook County, 532 (11.1%) attend a private institution, while the remaining 4,263 (88.9%) are enrolled in public schools. The age group of 3 to 4 year olds has the highest likelihood of being enrolled in private schools, with 44 (28.0% in the age bracket) enrolled. Conversely, the age group of 10 to 14 year olds has the lowest likelihood of being enrolled in a private school, with 1,495 (96.7% in the age bracket) attending a public institution.
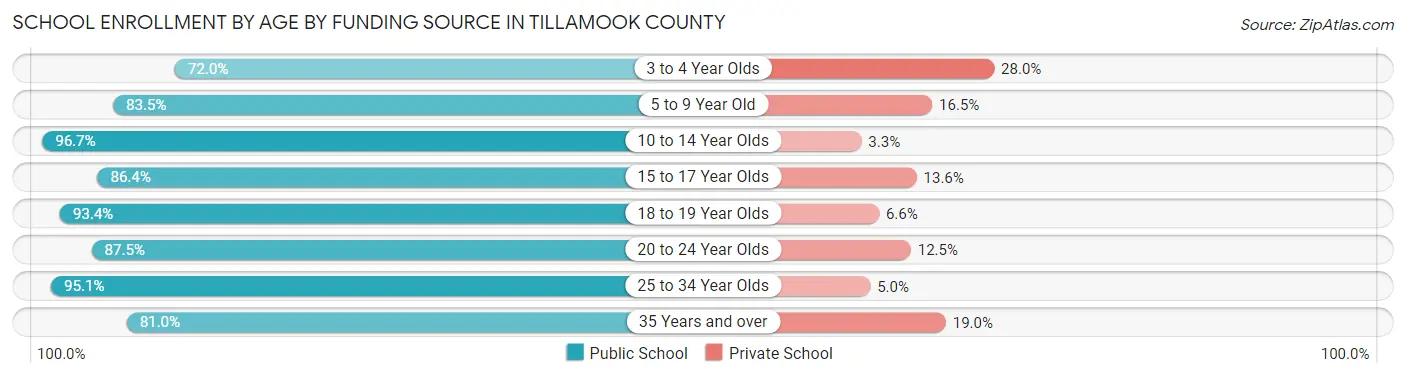
| Age Bracket | Public School | Private School |
| 3 to 4 Year Olds | 113 (72.0%) | 44 (28.0%) |
| 5 to 9 Year Old | 1,019 (83.5%) | 201 (16.5%) |
| 10 to 14 Year Olds | 1,495 (96.7%) | 51 (3.3%) |
| 15 to 17 Year Olds | 750 (86.4%) | 118 (13.6%) |
| 18 to 19 Year Olds | 227 (93.4%) | 16 (6.6%) |
| 20 to 24 Year Olds | 217 (87.5%) | 31 (12.5%) |
| 25 to 34 Year Olds | 173 (95.1%) | 9 (5.0%) |
| 35 Years and over | 268 (81.0%) | 63 (19.0%) |
| Total | 4,263 (88.9%) | 532 (11.1%) |
Educational Attainment by Field of Study in Tillamook County
Business (760 | 14.5%), education (700 | 13.4%), bio, nature & agricultural (611 | 11.7%), science & technology (551 | 10.5%), and liberal arts & history (538 | 10.3%) are the most common fields of study among 5,237 individuals in Tillamook County who have obtained a bachelor's degree or higher.
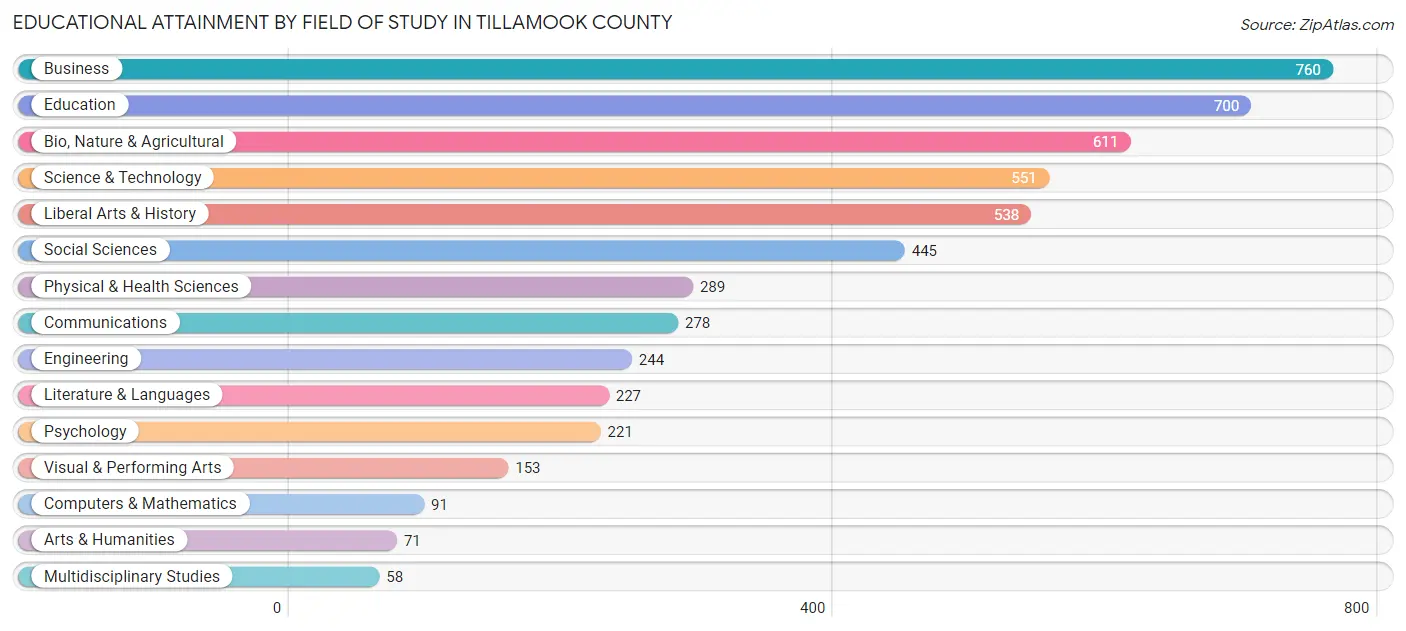
| Field of Study | # Graduates | % Graduates |
| Computers & Mathematics | 91 | 1.7% |
| Bio, Nature & Agricultural | 611 | 11.7% |
| Physical & Health Sciences | 289 | 5.5% |
| Psychology | 221 | 4.2% |
| Social Sciences | 445 | 8.5% |
| Engineering | 244 | 4.7% |
| Multidisciplinary Studies | 58 | 1.1% |
| Science & Technology | 551 | 10.5% |
| Business | 760 | 14.5% |
| Education | 700 | 13.4% |
| Literature & Languages | 227 | 4.3% |
| Liberal Arts & History | 538 | 10.3% |
| Visual & Performing Arts | 153 | 2.9% |
| Communications | 278 | 5.3% |
| Arts & Humanities | 71 | 1.4% |
| Total | 5,237 | 100.0% |
Transportation & Commute in Tillamook County
Vehicle Availability by Sex in Tillamook County
The most prevalent vehicle ownership categories in Tillamook County are males with 2 vehicles (2,211, accounting for 38.9%) and females with 2 vehicles (2,014, making up 43.9%).
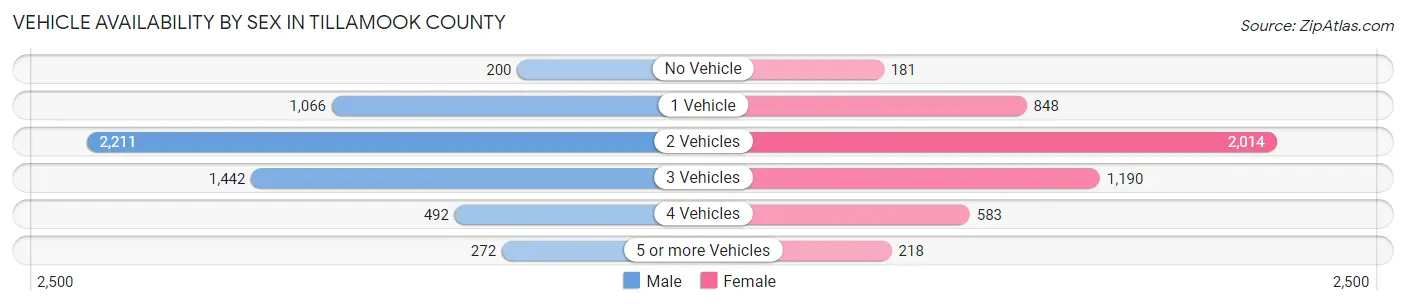
| Vehicles Available | Male | Female |
| No Vehicle | 200 (3.5%) | 181 (3.6%) |
| 1 Vehicle | 1,066 (18.8%) | 848 (16.9%) |
| 2 Vehicles | 2,211 (38.9%) | 2,014 (40.0%) |
| 3 Vehicles | 1,442 (25.4%) | 1,190 (23.6%) |
| 4 Vehicles | 492 (8.7%) | 583 (11.6%) |
| 5 or more Vehicles | 272 (4.8%) | 218 (4.3%) |
| Total | 5,683 (100.0%) | 5,034 (100.0%) |
Commute Time in Tillamook County
The most frequently occuring commute durations in Tillamook County are 5 to 9 minutes (2,449 commuters, 25.7%), 10 to 14 minutes (1,901 commuters, 19.9%), and 15 to 19 minutes (1,283 commuters, 13.5%).
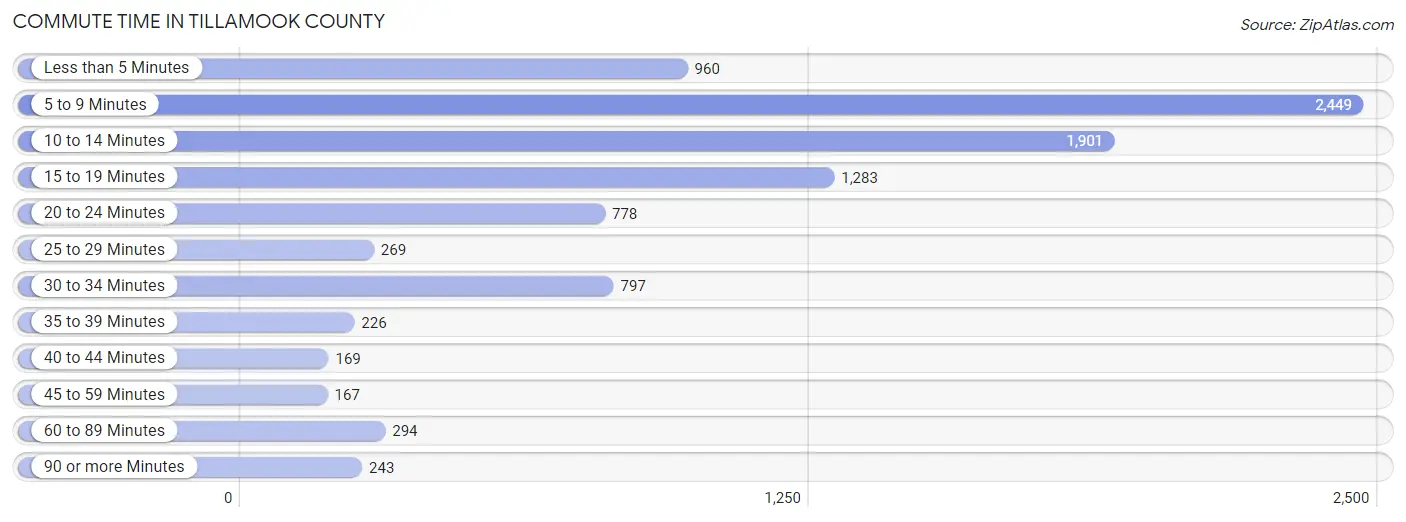
| Commute Time | # Commuters | % Commuters |
| Less than 5 Minutes | 960 | 10.1% |
| 5 to 9 Minutes | 2,449 | 25.7% |
| 10 to 14 Minutes | 1,901 | 19.9% |
| 15 to 19 Minutes | 1,283 | 13.5% |
| 20 to 24 Minutes | 778 | 8.2% |
| 25 to 29 Minutes | 269 | 2.8% |
| 30 to 34 Minutes | 797 | 8.4% |
| 35 to 39 Minutes | 226 | 2.4% |
| 40 to 44 Minutes | 169 | 1.8% |
| 45 to 59 Minutes | 167 | 1.8% |
| 60 to 89 Minutes | 294 | 3.1% |
| 90 or more Minutes | 243 | 2.5% |
Commute Time by Sex in Tillamook County
The most common commute times in Tillamook County are 5 to 9 minutes (1,311 commuters, 25.5%) for males and 5 to 9 minutes (1,138 commuters, 25.9%) for females.
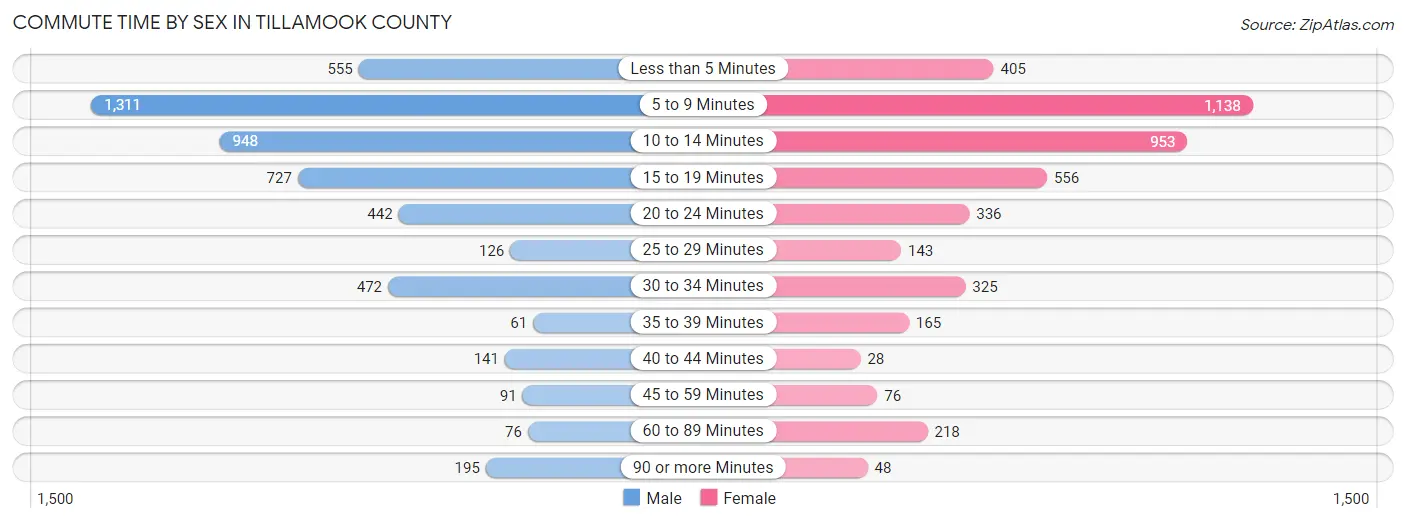
| Commute Time | Male | Female |
| Less than 5 Minutes | 555 (10.8%) | 405 (9.2%) |
| 5 to 9 Minutes | 1,311 (25.5%) | 1,138 (25.9%) |
| 10 to 14 Minutes | 948 (18.4%) | 953 (21.7%) |
| 15 to 19 Minutes | 727 (14.1%) | 556 (12.7%) |
| 20 to 24 Minutes | 442 (8.6%) | 336 (7.6%) |
| 25 to 29 Minutes | 126 (2.5%) | 143 (3.3%) |
| 30 to 34 Minutes | 472 (9.2%) | 325 (7.4%) |
| 35 to 39 Minutes | 61 (1.2%) | 165 (3.8%) |
| 40 to 44 Minutes | 141 (2.7%) | 28 (0.6%) |
| 45 to 59 Minutes | 91 (1.8%) | 76 (1.7%) |
| 60 to 89 Minutes | 76 (1.5%) | 218 (5.0%) |
| 90 or more Minutes | 195 (3.8%) | 48 (1.1%) |
Time of Departure to Work by Sex in Tillamook County
The most frequent times of departure to work in Tillamook County are 7:00 AM to 7:29 AM (806, 15.7%) for males and 7:30 AM to 7:59 AM (1,070, 24.4%) for females.
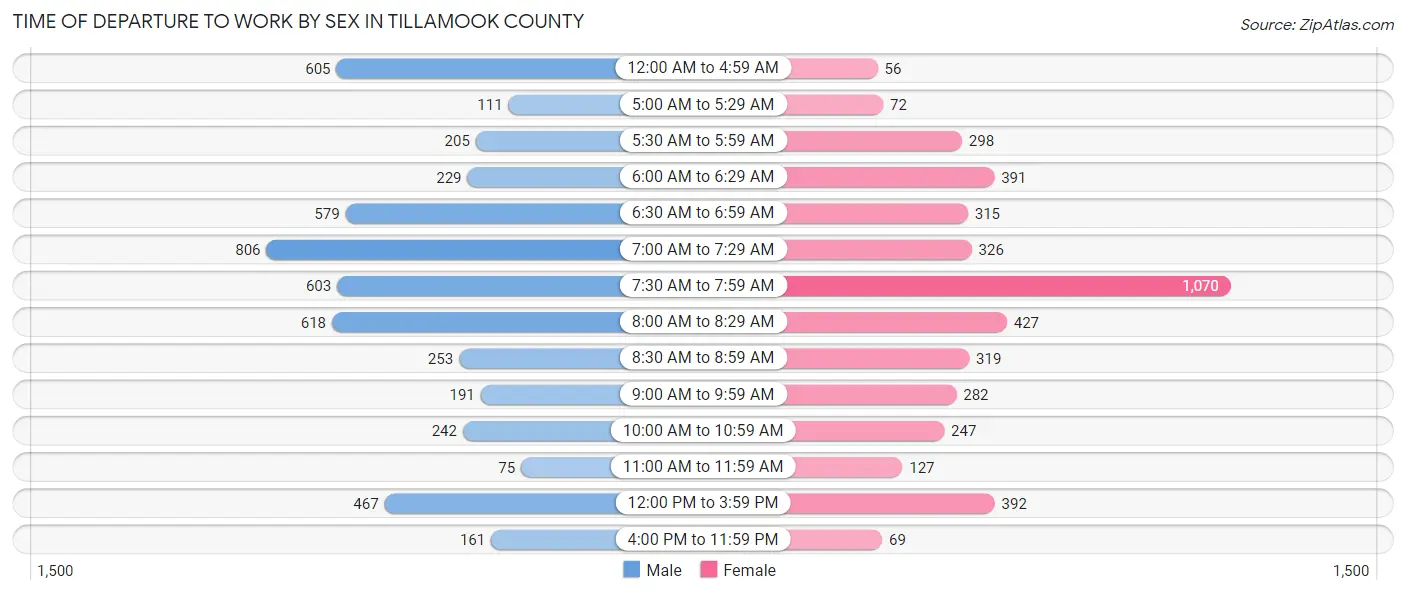
| Time of Departure | Male | Female |
| 12:00 AM to 4:59 AM | 605 (11.8%) | 56 (1.3%) |
| 5:00 AM to 5:29 AM | 111 (2.2%) | 72 (1.6%) |
| 5:30 AM to 5:59 AM | 205 (4.0%) | 298 (6.8%) |
| 6:00 AM to 6:29 AM | 229 (4.4%) | 391 (8.9%) |
| 6:30 AM to 6:59 AM | 579 (11.3%) | 315 (7.2%) |
| 7:00 AM to 7:29 AM | 806 (15.7%) | 326 (7.4%) |
| 7:30 AM to 7:59 AM | 603 (11.7%) | 1,070 (24.4%) |
| 8:00 AM to 8:29 AM | 618 (12.0%) | 427 (9.7%) |
| 8:30 AM to 8:59 AM | 253 (4.9%) | 319 (7.3%) |
| 9:00 AM to 9:59 AM | 191 (3.7%) | 282 (6.4%) |
| 10:00 AM to 10:59 AM | 242 (4.7%) | 247 (5.6%) |
| 11:00 AM to 11:59 AM | 75 (1.5%) | 127 (2.9%) |
| 12:00 PM to 3:59 PM | 467 (9.1%) | 392 (8.9%) |
| 4:00 PM to 11:59 PM | 161 (3.1%) | 69 (1.6%) |
| Total | 5,145 (100.0%) | 4,391 (100.0%) |
Housing Occupancy in Tillamook County
Occupancy by Ownership in Tillamook County
Of the total 11,522 dwellings in Tillamook County, owner-occupied units account for 8,464 (73.5%), while renter-occupied units make up 3,058 (26.5%).
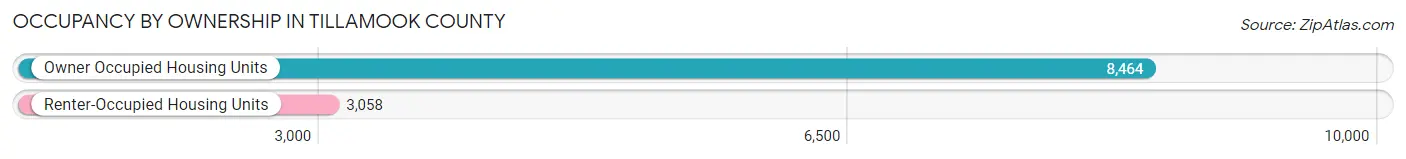
| Occupancy | # Housing Units | % Housing Units |
| Owner Occupied Housing Units | 8,464 | 73.5% |
| Renter-Occupied Housing Units | 3,058 | 26.5% |
| Total Occupied Housing Units | 11,522 | 100.0% |
Occupancy by Household Size in Tillamook County
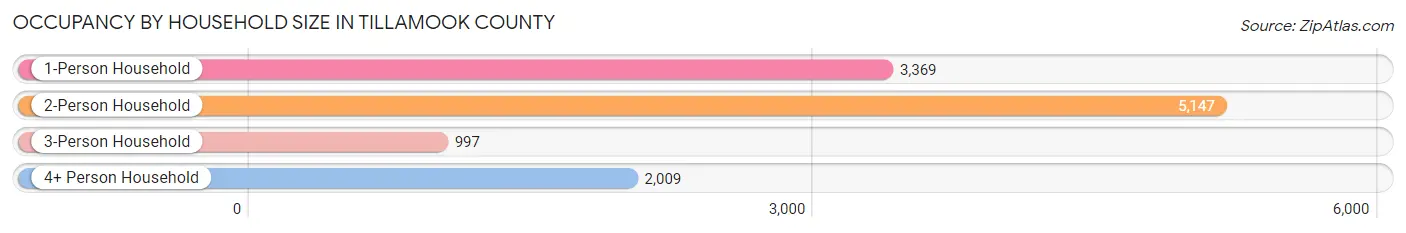
| Household Size | # Housing Units | % Housing Units |
| 1-Person Household | 3,369 | 29.2% |
| 2-Person Household | 5,147 | 44.7% |
| 3-Person Household | 997 | 8.6% |
| 4+ Person Household | 2,009 | 17.4% |
| Total Housing Units | 11,522 | 100.0% |
Occupancy by Ownership by Household Size in Tillamook County
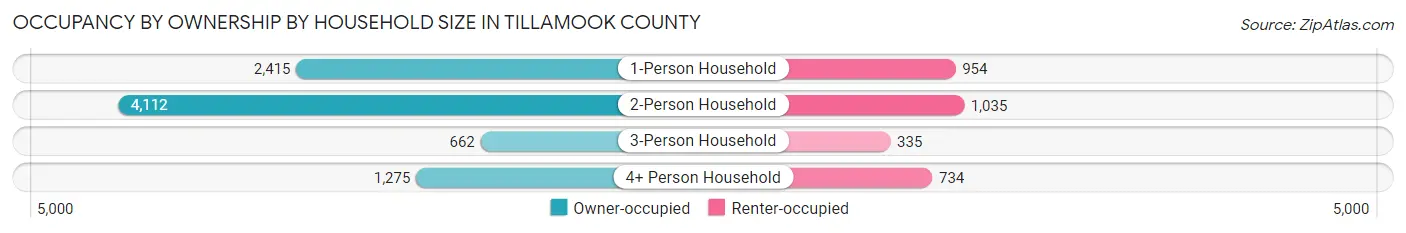
| Household Size | Owner-occupied | Renter-occupied |
| 1-Person Household | 2,415 (71.7%) | 954 (28.3%) |
| 2-Person Household | 4,112 (79.9%) | 1,035 (20.1%) |
| 3-Person Household | 662 (66.4%) | 335 (33.6%) |
| 4+ Person Household | 1,275 (63.5%) | 734 (36.5%) |
| Total Housing Units | 8,464 (73.5%) | 3,058 (26.5%) |
Occupancy by Educational Attainment in Tillamook County
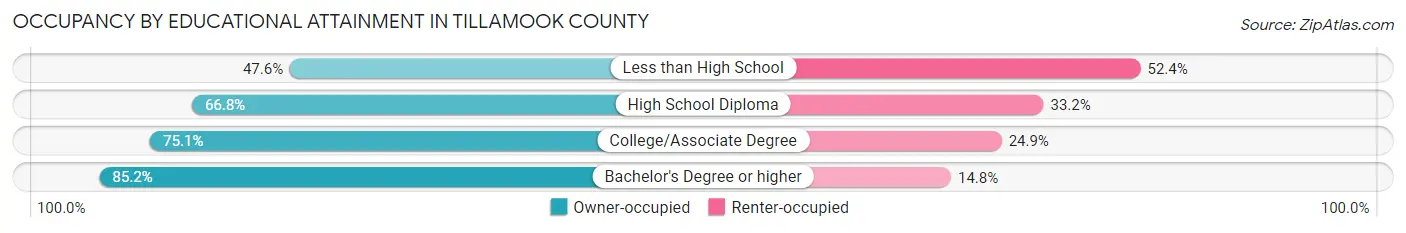
| Household Size | Owner-occupied | Renter-occupied |
| Less than High School | 432 (47.6%) | 476 (52.4%) |
| High School Diploma | 2,015 (66.8%) | 1,001 (33.2%) |
| College/Associate Degree | 3,389 (75.1%) | 1,123 (24.9%) |
| Bachelor's Degree or higher | 2,628 (85.2%) | 458 (14.8%) |
Occupancy by Age of Householder in Tillamook County
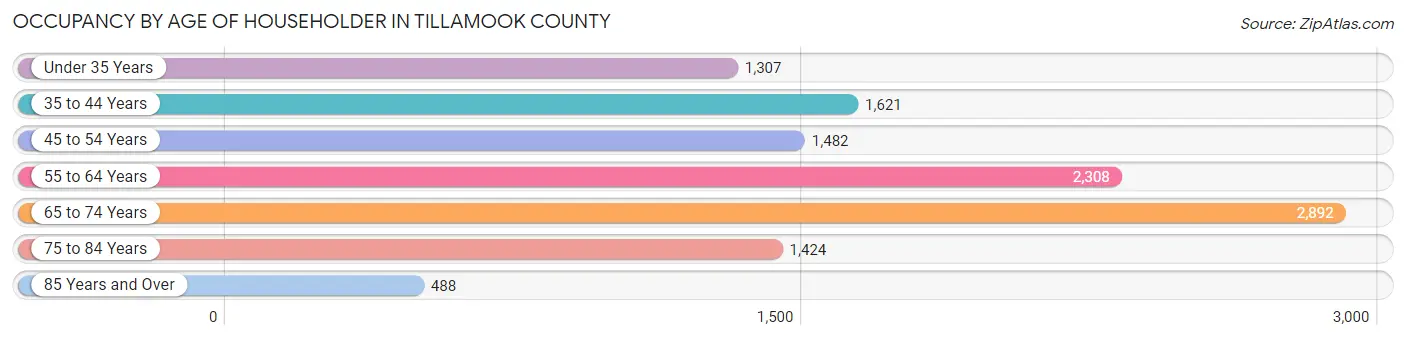
| Age Bracket | # Households | % Households |
| Under 35 Years | 1,307 | 11.3% |
| 35 to 44 Years | 1,621 | 14.1% |
| 45 to 54 Years | 1,482 | 12.9% |
| 55 to 64 Years | 2,308 | 20.0% |
| 65 to 74 Years | 2,892 | 25.1% |
| 75 to 84 Years | 1,424 | 12.4% |
| 85 Years and Over | 488 | 4.2% |
| Total | 11,522 | 100.0% |
Housing Finances in Tillamook County
Median Income by Occupancy in Tillamook County
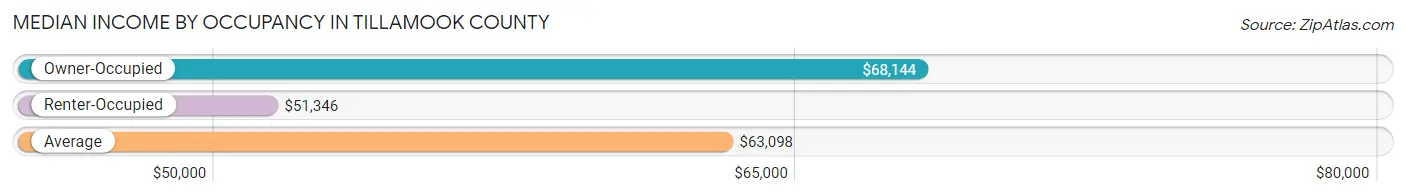
| Occupancy Type | # Households | Median Income |
| Owner-Occupied | 8,464 (73.5%) | $68,144 |
| Renter-Occupied | 3,058 (26.5%) | $51,346 |
| Average | 11,522 (100.0%) | $63,098 |
Occupancy by Householder Income Bracket in Tillamook County
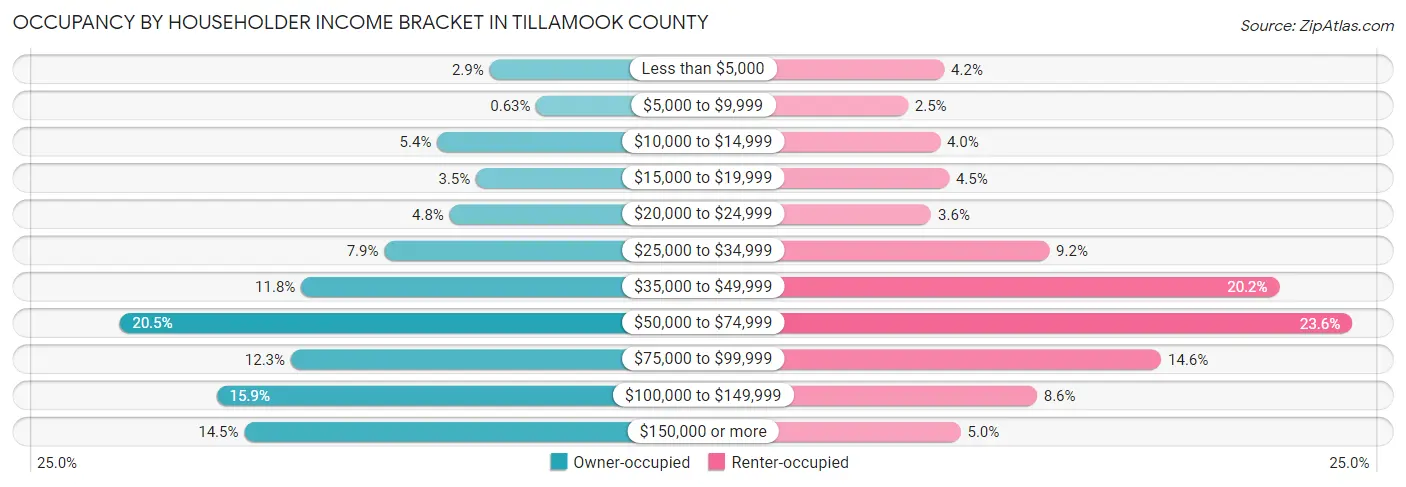
| Income Bracket | Owner-occupied | Renter-occupied |
| Less than $5,000 | 242 (2.9%) | 129 (4.2%) |
| $5,000 to $9,999 | 53 (0.6%) | 76 (2.5%) |
| $10,000 to $14,999 | 453 (5.3%) | 123 (4.0%) |
| $15,000 to $19,999 | 296 (3.5%) | 136 (4.4%) |
| $20,000 to $24,999 | 403 (4.8%) | 110 (3.6%) |
| $25,000 to $34,999 | 666 (7.9%) | 282 (9.2%) |
| $35,000 to $49,999 | 1,001 (11.8%) | 617 (20.2%) |
| $50,000 to $74,999 | 1,734 (20.5%) | 723 (23.6%) |
| $75,000 to $99,999 | 1,043 (12.3%) | 445 (14.5%) |
| $100,000 to $149,999 | 1,342 (15.9%) | 264 (8.6%) |
| $150,000 or more | 1,231 (14.5%) | 153 (5.0%) |
| Total | 8,464 (100.0%) | 3,058 (100.0%) |
Monthly Housing Cost Tiers in Tillamook County
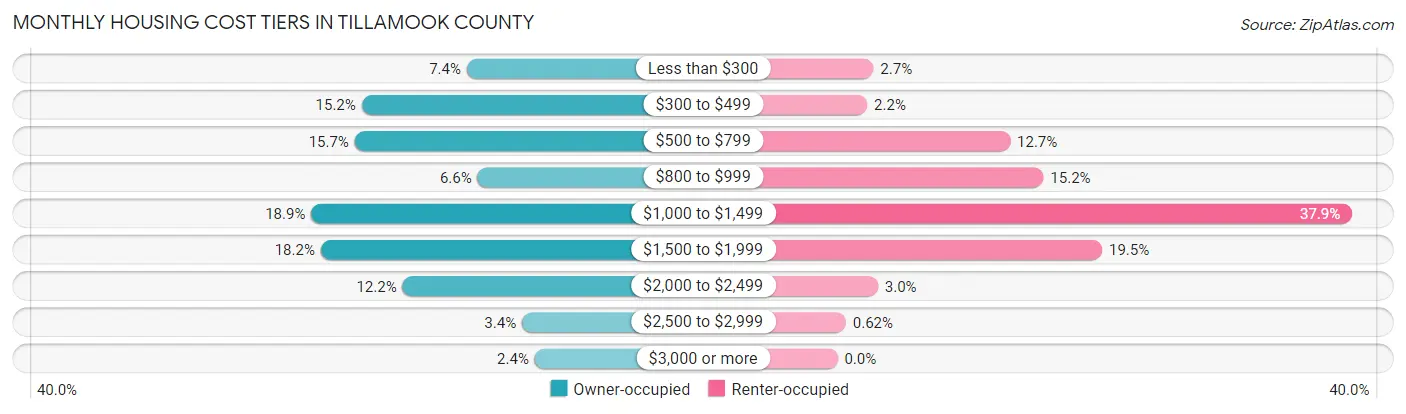
| Monthly Cost | Owner-occupied | Renter-occupied |
| Less than $300 | 629 (7.4%) | 81 (2.6%) |
| $300 to $499 | 1,285 (15.2%) | 67 (2.2%) |
| $500 to $799 | 1,328 (15.7%) | 389 (12.7%) |
| $800 to $999 | 562 (6.6%) | 464 (15.2%) |
| $1,000 to $1,499 | 1,599 (18.9%) | 1,159 (37.9%) |
| $1,500 to $1,999 | 1,540 (18.2%) | 596 (19.5%) |
| $2,000 to $2,499 | 1,030 (12.2%) | 91 (3.0%) |
| $2,500 to $2,999 | 285 (3.4%) | 19 (0.6%) |
| $3,000 or more | 206 (2.4%) | 0 (0.0%) |
| Total | 8,464 (100.0%) | 3,058 (100.0%) |
Physical Housing Characteristics in Tillamook County
Housing Structures in Tillamook County
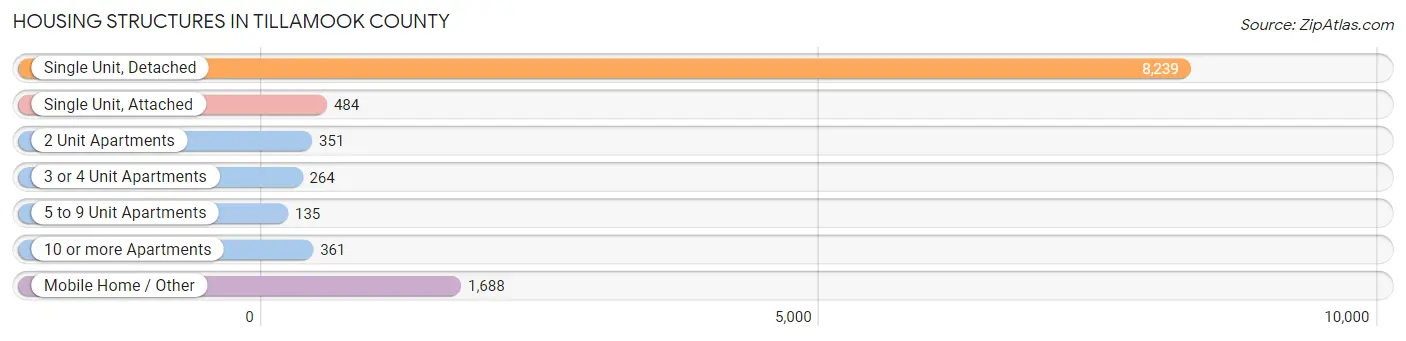
| Structure Type | # Housing Units | % Housing Units |
| Single Unit, Detached | 8,239 | 71.5% |
| Single Unit, Attached | 484 | 4.2% |
| 2 Unit Apartments | 351 | 3.0% |
| 3 or 4 Unit Apartments | 264 | 2.3% |
| 5 to 9 Unit Apartments | 135 | 1.2% |
| 10 or more Apartments | 361 | 3.1% |
| Mobile Home / Other | 1,688 | 14.6% |
| Total | 11,522 | 100.0% |
Housing Structures by Occupancy in Tillamook County
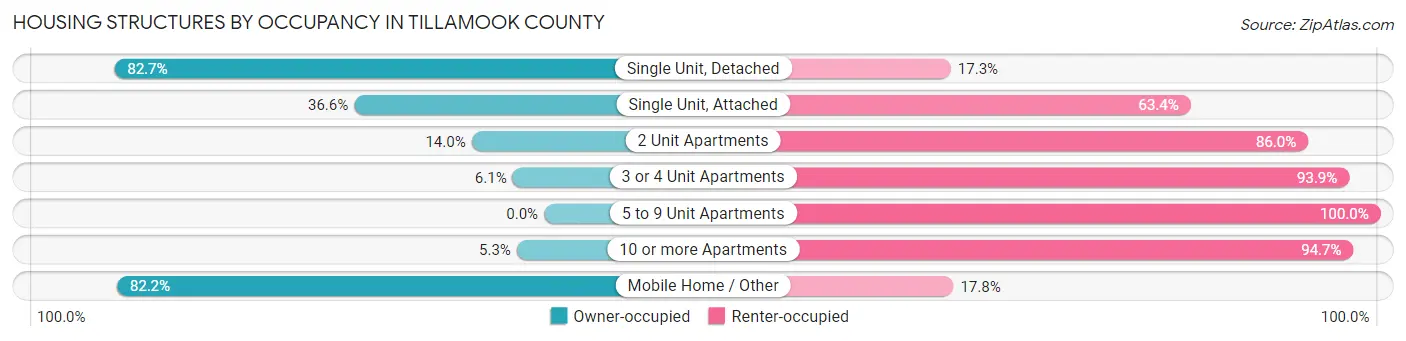
| Structure Type | Owner-occupied | Renter-occupied |
| Single Unit, Detached | 6,815 (82.7%) | 1,424 (17.3%) |
| Single Unit, Attached | 177 (36.6%) | 307 (63.4%) |
| 2 Unit Apartments | 49 (14.0%) | 302 (86.0%) |
| 3 or 4 Unit Apartments | 16 (6.1%) | 248 (93.9%) |
| 5 to 9 Unit Apartments | 0 (0.0%) | 135 (100.0%) |
| 10 or more Apartments | 19 (5.3%) | 342 (94.7%) |
| Mobile Home / Other | 1,388 (82.2%) | 300 (17.8%) |
| Total | 8,464 (73.5%) | 3,058 (26.5%) |
Housing Structures by Number of Rooms in Tillamook County
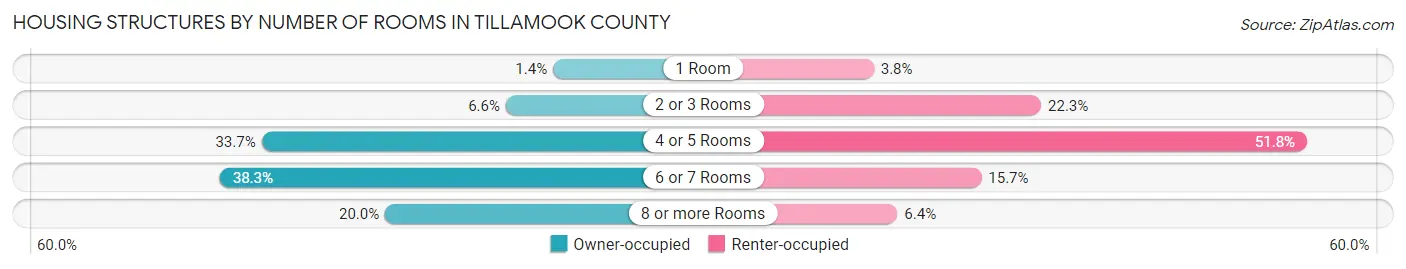
| Number of Rooms | Owner-occupied | Renter-occupied |
| 1 Room | 115 (1.4%) | 115 (3.8%) |
| 2 or 3 Rooms | 559 (6.6%) | 683 (22.3%) |
| 4 or 5 Rooms | 2,853 (33.7%) | 1,585 (51.8%) |
| 6 or 7 Rooms | 3,244 (38.3%) | 480 (15.7%) |
| 8 or more Rooms | 1,693 (20.0%) | 195 (6.4%) |
| Total | 8,464 (100.0%) | 3,058 (100.0%) |
Housing Structure by Heating Type in Tillamook County
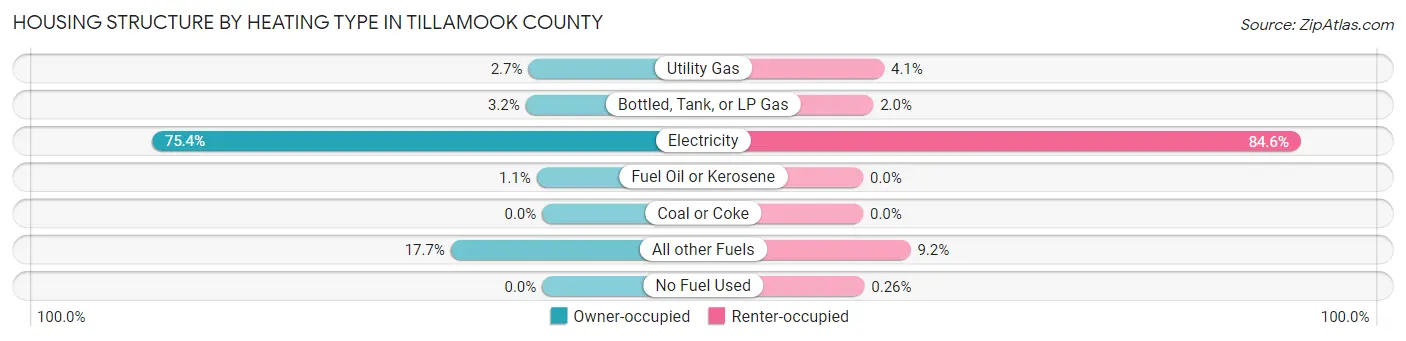
| Heating Type | Owner-occupied | Renter-occupied |
| Utility Gas | 226 (2.7%) | 124 (4.1%) |
| Bottled, Tank, or LP Gas | 270 (3.2%) | 60 (2.0%) |
| Electricity | 6,383 (75.4%) | 2,586 (84.6%) |
| Fuel Oil or Kerosene | 90 (1.1%) | 0 (0.0%) |
| Coal or Coke | 0 (0.0%) | 0 (0.0%) |
| All other Fuels | 1,495 (17.7%) | 280 (9.2%) |
| No Fuel Used | 0 (0.0%) | 8 (0.3%) |
| Total | 8,464 (100.0%) | 3,058 (100.0%) |
Household Vehicle Usage in Tillamook County
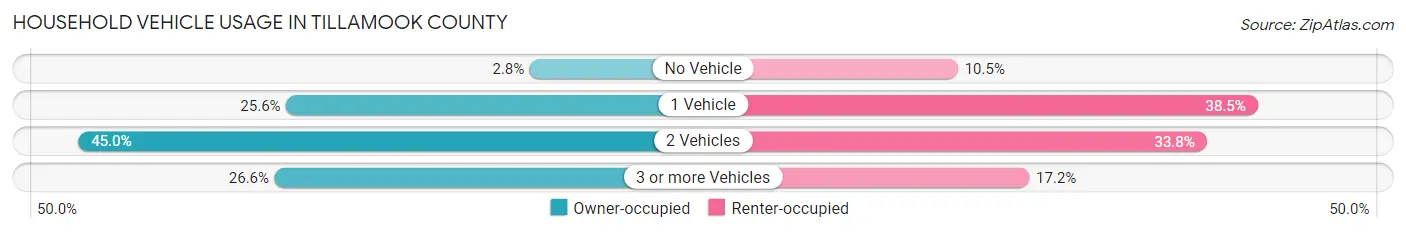
| Vehicles per Household | Owner-occupied | Renter-occupied |
| No Vehicle | 238 (2.8%) | 322 (10.5%) |
| 1 Vehicle | 2,163 (25.6%) | 1,178 (38.5%) |
| 2 Vehicles | 3,808 (45.0%) | 1,032 (33.8%) |
| 3 or more Vehicles | 2,255 (26.6%) | 526 (17.2%) |
| Total | 8,464 (100.0%) | 3,058 (100.0%) |
Real Estate & Mortgages in Tillamook County
Real Estate and Mortgage Overview in Tillamook County
| Characteristic | Without Mortgage | With Mortgage |
| Housing Units | 3,773 | 4,691 |
| Median Property Value | $330,800 | $392,300 |
| Median Household Income | $48,569 | $964 |
| Monthly Housing Costs | $505 | $206 |
| Real Estate Taxes | $2,287 | $55 |
Property Value by Mortgage Status in Tillamook County
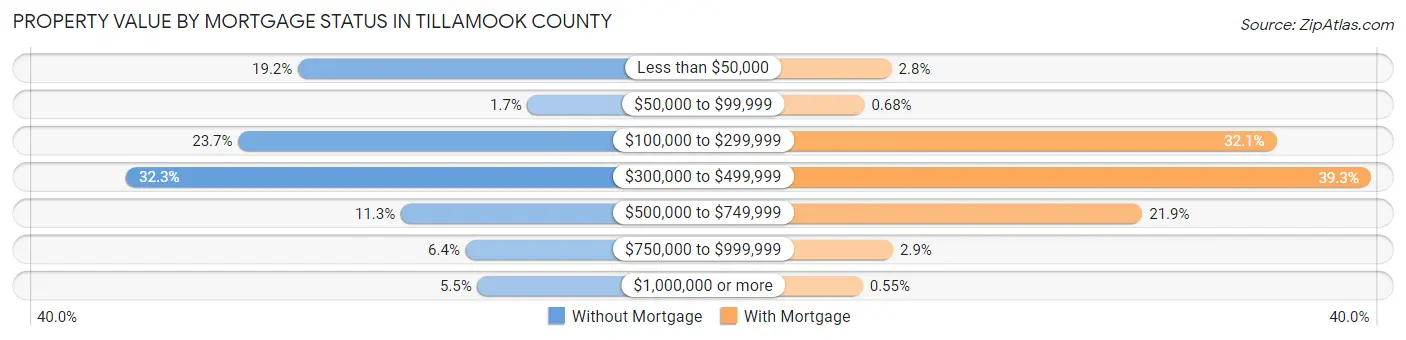
| Property Value | Without Mortgage | With Mortgage |
| Less than $50,000 | 723 (19.2%) | 129 (2.8%) |
| $50,000 to $99,999 | 63 (1.7%) | 32 (0.7%) |
| $100,000 to $299,999 | 895 (23.7%) | 1,504 (32.1%) |
| $300,000 to $499,999 | 1,217 (32.3%) | 1,841 (39.3%) |
| $500,000 to $749,999 | 427 (11.3%) | 1,025 (21.8%) |
| $750,000 to $999,999 | 241 (6.4%) | 134 (2.9%) |
| $1,000,000 or more | 207 (5.5%) | 26 (0.5%) |
| Total | 3,773 (100.0%) | 4,691 (100.0%) |
Household Income by Mortgage Status in Tillamook County
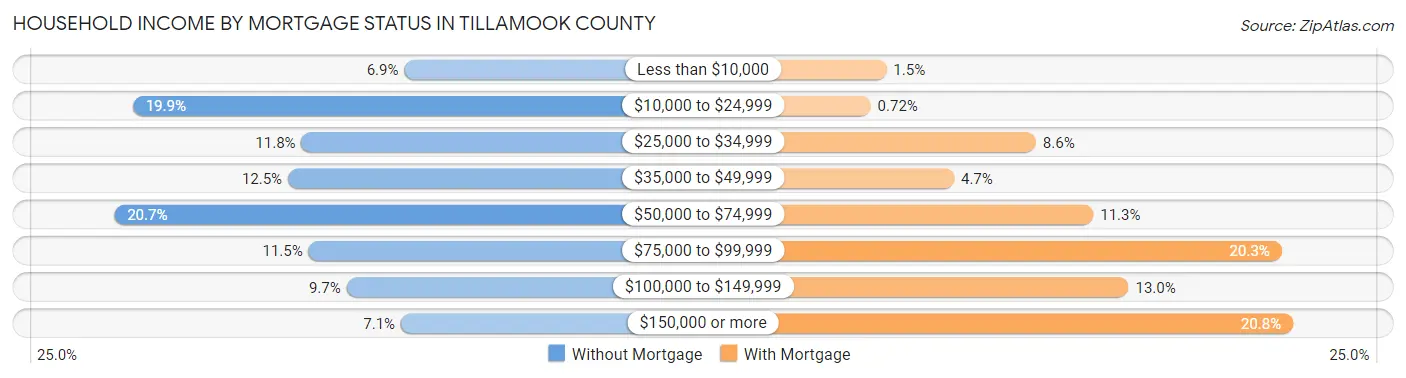
| Household Income | Without Mortgage | With Mortgage |
| Less than $10,000 | 261 (6.9%) | 69 (1.5%) |
| $10,000 to $24,999 | 749 (19.9%) | 34 (0.7%) |
| $25,000 to $34,999 | 446 (11.8%) | 403 (8.6%) |
| $35,000 to $49,999 | 470 (12.5%) | 220 (4.7%) |
| $50,000 to $74,999 | 782 (20.7%) | 531 (11.3%) |
| $75,000 to $99,999 | 433 (11.5%) | 952 (20.3%) |
| $100,000 to $149,999 | 365 (9.7%) | 610 (13.0%) |
| $150,000 or more | 267 (7.1%) | 977 (20.8%) |
| Total | 3,773 (100.0%) | 4,691 (100.0%) |
Property Value to Household Income Ratio in Tillamook County
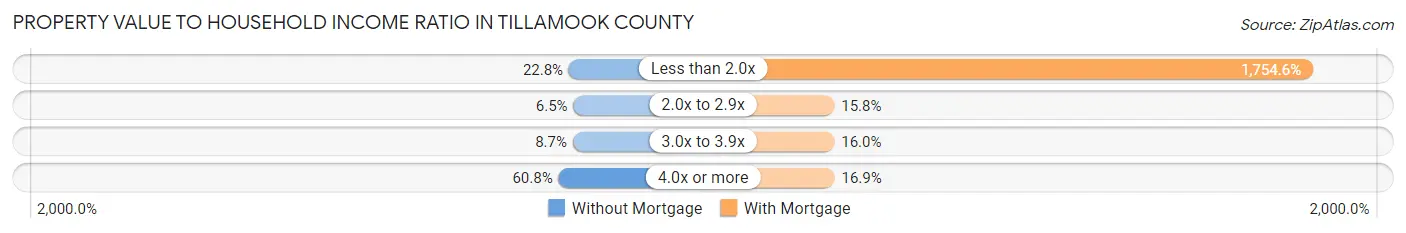
| Value-to-Income Ratio | Without Mortgage | With Mortgage |
| Less than 2.0x | 861 (22.8%) | 82,307 (1,754.6%) |
| 2.0x to 2.9x | 246 (6.5%) | 741 (15.8%) |
| 3.0x to 3.9x | 328 (8.7%) | 752 (16.0%) |
| 4.0x or more | 2,292 (60.8%) | 791 (16.9%) |
| Total | 3,773 (100.0%) | 4,691 (100.0%) |
Real Estate Taxes by Mortgage Status in Tillamook County
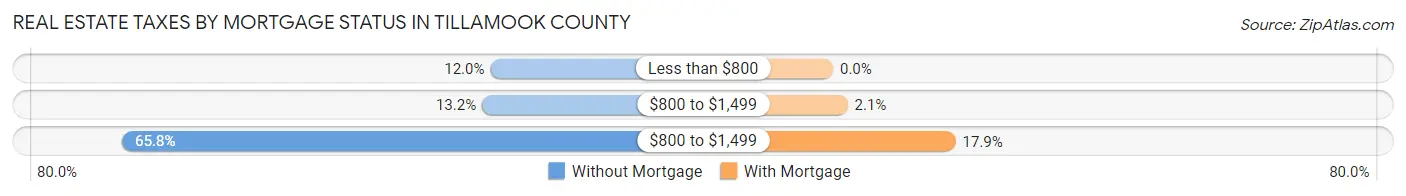
| Property Taxes | Without Mortgage | With Mortgage |
| Less than $800 | 451 (11.9%) | 0 (0.0%) |
| $800 to $1,499 | 497 (13.2%) | 100 (2.1%) |
| $800 to $1,499 | 2,481 (65.8%) | 840 (17.9%) |
| Total | 3,773 (100.0%) | 4,691 (100.0%) |
Health & Disability in Tillamook County
Health Insurance Coverage by Age in Tillamook County
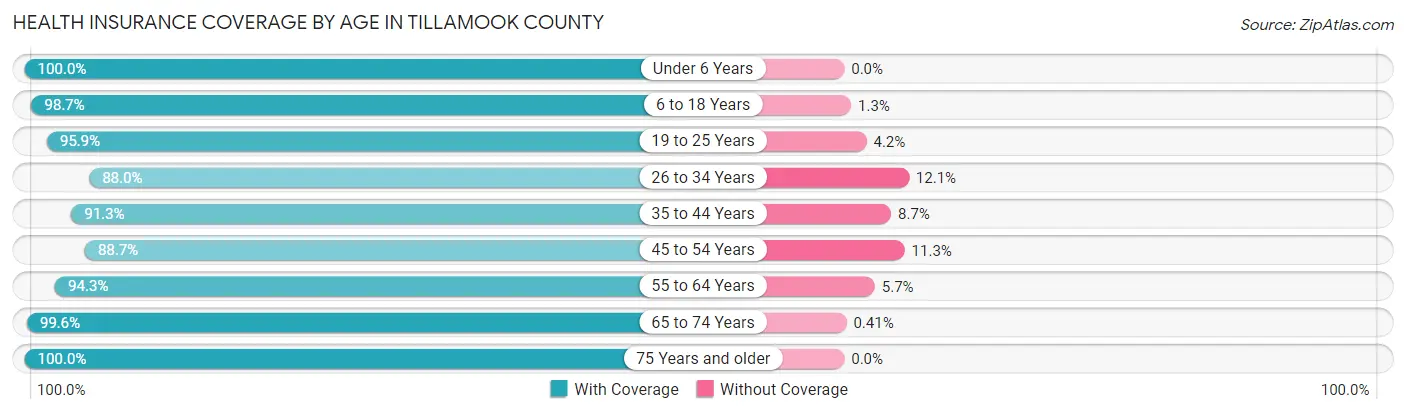
| Age Bracket | With Coverage | Without Coverage |
| Under 6 Years | 1,388 (100.0%) | 0 (0.0%) |
| 6 to 18 Years | 3,819 (98.7%) | 49 (1.3%) |
| 19 to 25 Years | 1,431 (95.9%) | 62 (4.2%) |
| 26 to 34 Years | 2,058 (87.9%) | 282 (12.0%) |
| 35 to 44 Years | 2,744 (91.3%) | 262 (8.7%) |
| 45 to 54 Years | 2,600 (88.7%) | 330 (11.3%) |
| 55 to 64 Years | 4,117 (94.3%) | 249 (5.7%) |
| 65 to 74 Years | 4,609 (99.6%) | 19 (0.4%) |
| 75 Years and older | 2,624 (100.0%) | 0 (0.0%) |
| Total | 25,390 (95.3%) | 1,253 (4.7%) |
Health Insurance Coverage by Citizenship Status in Tillamook County
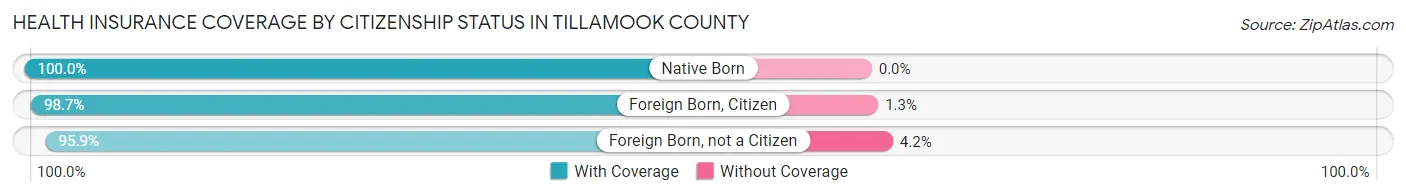
| Citizenship Status | With Coverage | Without Coverage |
| Native Born | 1,388 (100.0%) | 0 (0.0%) |
| Foreign Born, Citizen | 3,819 (98.7%) | 49 (1.3%) |
| Foreign Born, not a Citizen | 1,431 (95.9%) | 62 (4.2%) |
Health Insurance Coverage by Household Income in Tillamook County
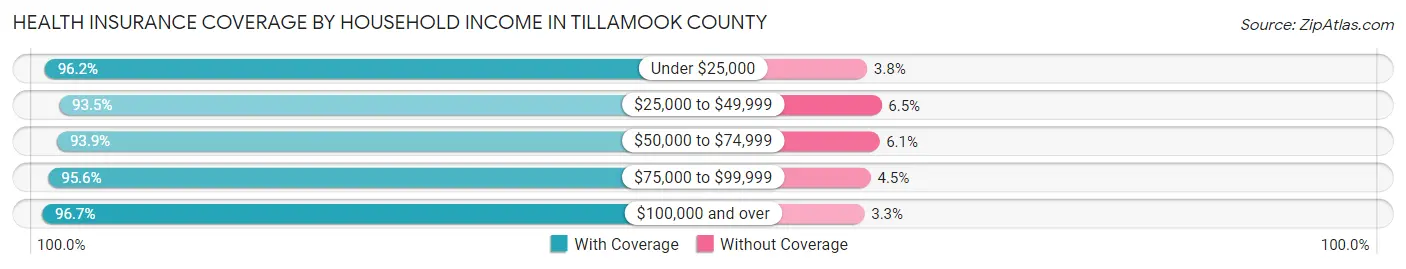
| Household Income | With Coverage | Without Coverage |
| Under $25,000 | 2,961 (96.2%) | 116 (3.8%) |
| $25,000 to $49,999 | 4,580 (93.5%) | 317 (6.5%) |
| $50,000 to $74,999 | 5,491 (93.9%) | 355 (6.1%) |
| $75,000 to $99,999 | 3,868 (95.6%) | 180 (4.4%) |
| $100,000 and over | 8,399 (96.7%) | 285 (3.3%) |
Public vs Private Health Insurance Coverage by Age in Tillamook County
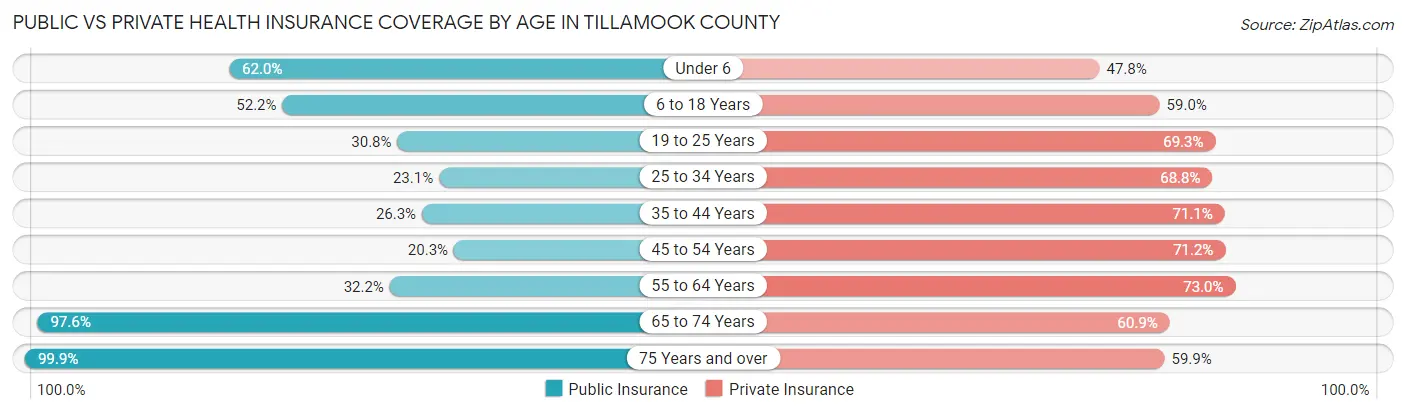
| Age Bracket | Public Insurance | Private Insurance |
| Under 6 | 861 (62.0%) | 664 (47.8%) |
| 6 to 18 Years | 2,017 (52.1%) | 2,282 (59.0%) |
| 19 to 25 Years | 460 (30.8%) | 1,035 (69.3%) |
| 25 to 34 Years | 540 (23.1%) | 1,609 (68.8%) |
| 35 to 44 Years | 789 (26.3%) | 2,136 (71.1%) |
| 45 to 54 Years | 595 (20.3%) | 2,085 (71.2%) |
| 55 to 64 Years | 1,407 (32.2%) | 3,189 (73.0%) |
| 65 to 74 Years | 4,517 (97.6%) | 2,816 (60.9%) |
| 75 Years and over | 2,622 (99.9%) | 1,572 (59.9%) |
| Total | 13,808 (51.8%) | 17,388 (65.3%) |
Disability Status by Sex by Age in Tillamook County
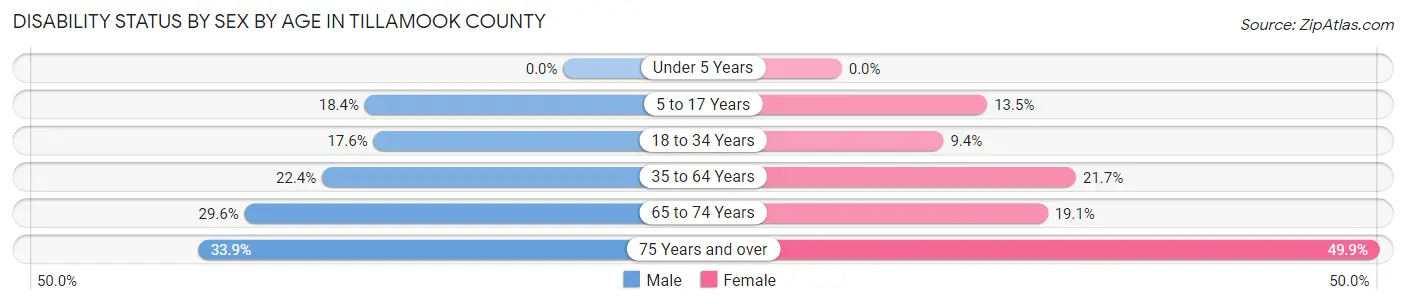
| Age Bracket | Male | Female |
| Under 5 Years | 0 (0.0%) | 0 (0.0%) |
| 5 to 17 Years | 368 (18.4%) | 247 (13.5%) |
| 18 to 34 Years | 367 (17.6%) | 192 (9.4%) |
| 35 to 64 Years | 1,122 (22.4%) | 1,150 (21.7%) |
| 65 to 74 Years | 680 (29.6%) | 445 (19.1%) |
| 75 Years and over | 401 (33.9%) | 720 (49.9%) |
Disability Class by Sex by Age in Tillamook County
Disability Class: Hearing Difficulty
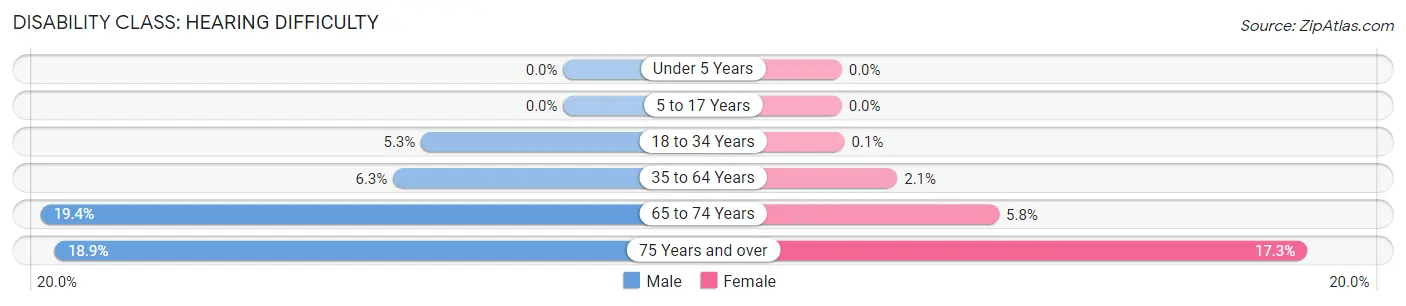
| Age Bracket | Male | Female |
| Under 5 Years | 0 (0.0%) | 0 (0.0%) |
| 5 to 17 Years | 0 (0.0%) | 0 (0.0%) |
| 18 to 34 Years | 110 (5.3%) | 2 (0.1%) |
| 35 to 64 Years | 317 (6.3%) | 109 (2.1%) |
| 65 to 74 Years | 446 (19.4%) | 136 (5.8%) |
| 75 Years and over | 223 (18.9%) | 249 (17.3%) |
Disability Class: Vision Difficulty
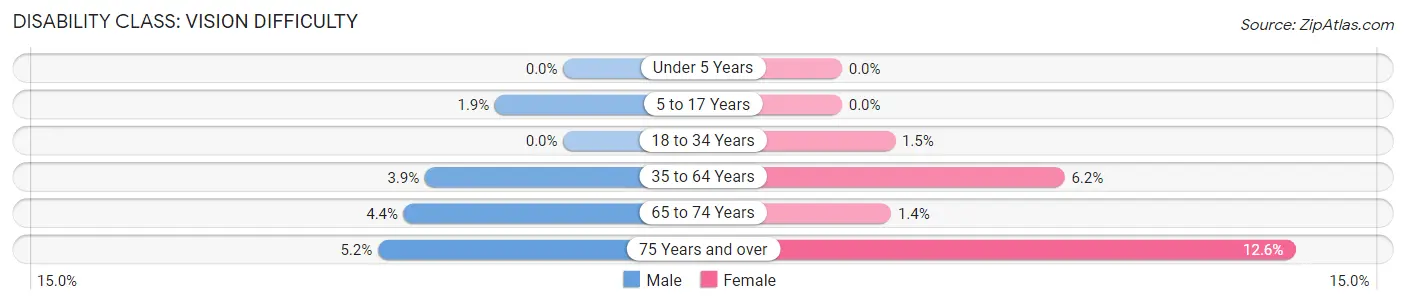
| Age Bracket | Male | Female |
| Under 5 Years | 0 (0.0%) | 0 (0.0%) |
| 5 to 17 Years | 38 (1.9%) | 0 (0.0%) |
| 18 to 34 Years | 0 (0.0%) | 30 (1.5%) |
| 35 to 64 Years | 193 (3.8%) | 328 (6.2%) |
| 65 to 74 Years | 102 (4.4%) | 32 (1.4%) |
| 75 Years and over | 61 (5.2%) | 182 (12.6%) |
Disability Class: Cognitive Difficulty
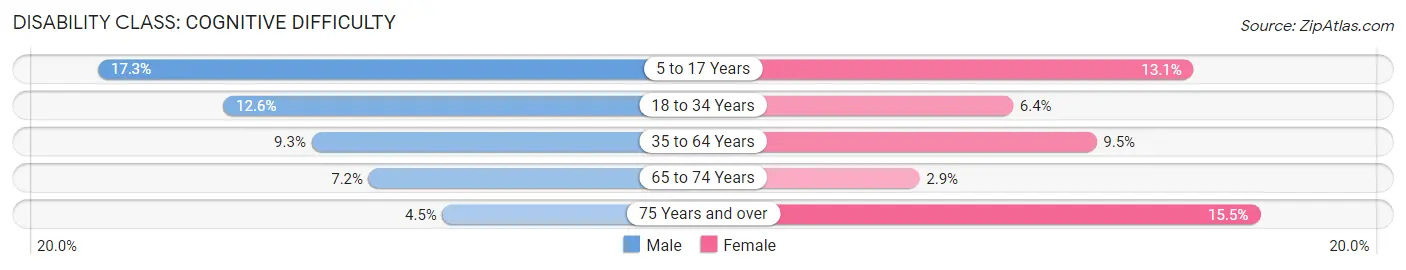
| Age Bracket | Male | Female |
| 5 to 17 Years | 345 (17.3%) | 239 (13.1%) |
| 18 to 34 Years | 263 (12.6%) | 129 (6.4%) |
| 35 to 64 Years | 468 (9.3%) | 500 (9.5%) |
| 65 to 74 Years | 166 (7.2%) | 67 (2.9%) |
| 75 Years and over | 53 (4.5%) | 224 (15.5%) |
Disability Class: Ambulatory Difficulty
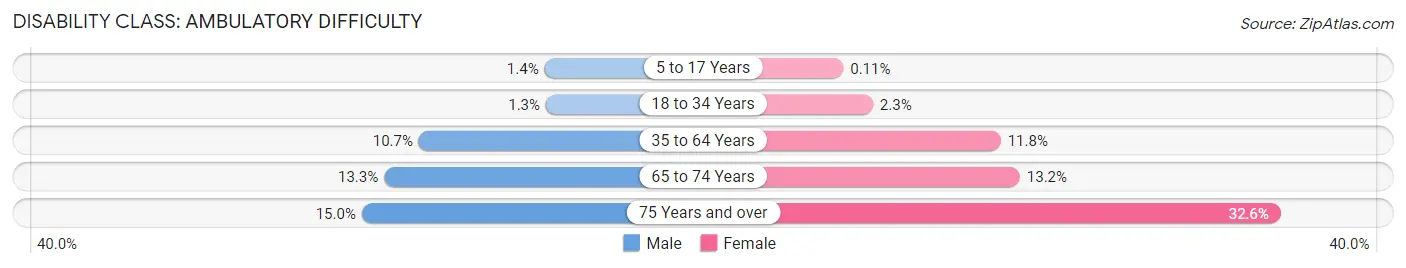
| Age Bracket | Male | Female |
| 5 to 17 Years | 28 (1.4%) | 2 (0.1%) |
| 18 to 34 Years | 27 (1.3%) | 47 (2.3%) |
| 35 to 64 Years | 538 (10.7%) | 624 (11.8%) |
| 65 to 74 Years | 306 (13.3%) | 308 (13.2%) |
| 75 Years and over | 177 (15.0%) | 470 (32.6%) |
Disability Class: Self-Care Difficulty
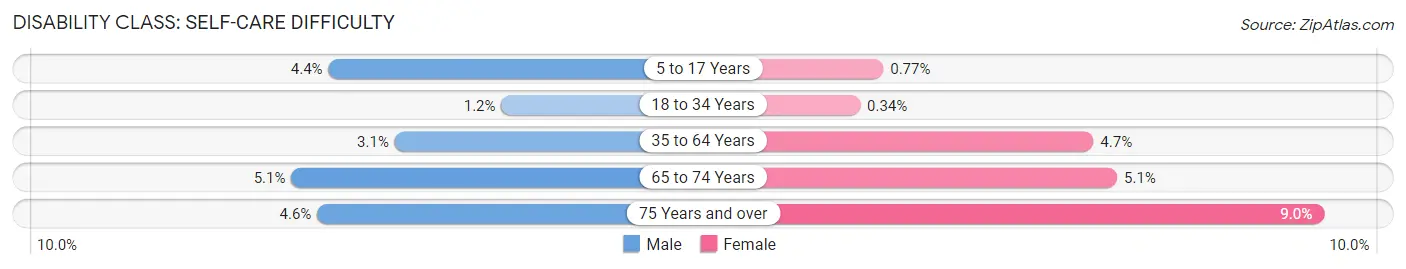
| Age Bracket | Male | Female |
| 5 to 17 Years | 87 (4.4%) | 14 (0.8%) |
| 18 to 34 Years | 24 (1.1%) | 7 (0.3%) |
| 35 to 64 Years | 157 (3.1%) | 247 (4.7%) |
| 65 to 74 Years | 116 (5.1%) | 119 (5.1%) |
| 75 Years and over | 54 (4.6%) | 129 (8.9%) |
Technology Access in Tillamook County
Computing Device Access in Tillamook County
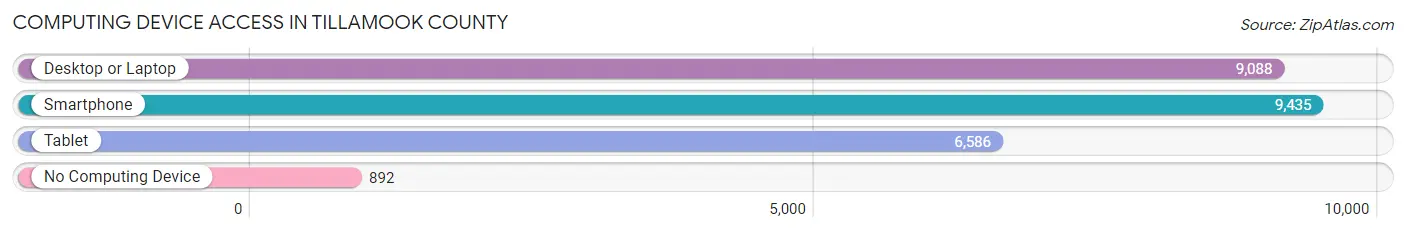
| Device Type | # Households | % Households |
| Desktop or Laptop | 9,088 | 78.9% |
| Smartphone | 9,435 | 81.9% |
| Tablet | 6,586 | 57.2% |
| No Computing Device | 892 | 7.7% |
| Total | 11,522 | 100.0% |
Internet Access in Tillamook County
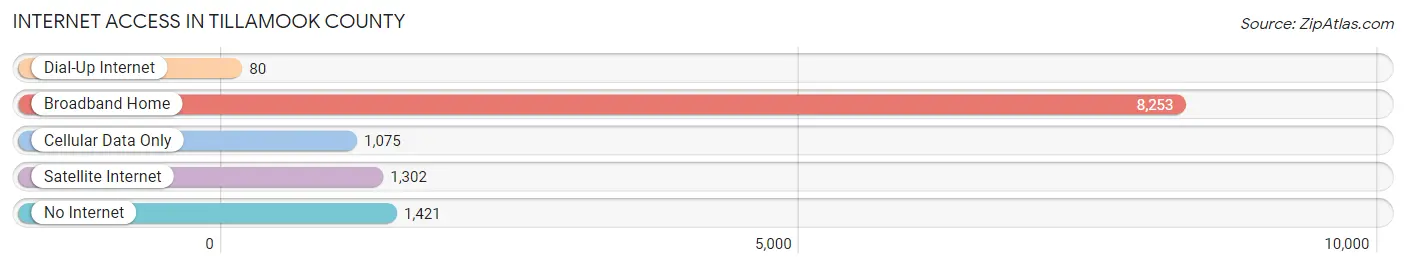
| Internet Type | # Households | % Households |
| Dial-Up Internet | 80 | 0.7% |
| Broadband Home | 8,253 | 71.6% |
| Cellular Data Only | 1,075 | 9.3% |
| Satellite Internet | 1,302 | 11.3% |
| No Internet | 1,421 | 12.3% |
| Total | 11,522 | 100.0% |
Tillamook County Summary
Tillamook County is located in the northwest corner of Oregon, along the Pacific Ocean. It is bordered by Clatsop County to the north, Washington County to the east, Yamhill County to the south, and the Pacific Ocean to the west. The county seat is Tillamook, and the largest city is Tillamook. The county has a total area of 1,333 square miles, of which 1,099 square miles is land and 234 square miles is water.
History
Tillamook County was created in 1853 from the western portion of Clatsop County. It was named after the Tillamook people, a Native American tribe that lived in the area. The first settlers arrived in the area in the early 1850s, and the county was officially organized in 1853.
The county was initially a logging and fishing center, and the first sawmill was built in 1854. The county was also home to several dairy farms, and the Tillamook Cheese Factory was established in 1909. The county was also home to several lumber mills, and the Port of Tillamook Bay was established in 1912.
Geography
Tillamook County is located in the northwest corner of Oregon, along the Pacific Ocean. It is bordered by Clatsop County to the north, Washington County to the east, Yamhill County to the south, and the Pacific Ocean to the west. The county has a total area of 1,333 square miles, of which 1,099 square miles is land and 234 square miles is water.
The county is home to several rivers, including the Tillamook, Nehalem, Wilson, Trask, and Kilchis. The county is also home to several lakes, including Trask Lake, Kilchis Lake, and Wilson Lake. The highest point in the county is Saddle Mountain, which has an elevation of 3,283 feet.
Economy
Tillamook County’s economy is largely based on agriculture, forestry, and fishing. The county is home to several dairy farms, and the Tillamook Cheese Factory is one of the largest employers in the county. The county is also home to several lumber mills, and the Port of Tillamook Bay is a major shipping port.
Tourism is also an important part of the county’s economy. The county is home to several state parks, including Cape Lookout State Park, Nehalem Bay State Park, and Tillamook State Forest. The county is also home to several beaches, including Rockaway Beach, Manzanita Beach, and Oceanside Beach.
Demographics
As of the 2010 census, the population of Tillamook County was 25,250. The racial makeup of the county was 91.3% White, 0.7% African American, 1.2% Native American, 0.7% Asian, 0.1% Pacific Islander, 3.2% from other races, and 2.9% from two or more races. The median household income was $41,945, and the median family income was $48,945.
Tillamook County is home to several Native American tribes, including the Tillamook, Nehalem, and Clatsop. The county is also home to several religious denominations, including Catholic, Lutheran, Methodist, and Baptist.
Conclusion
Tillamook County is located in the northwest corner of Oregon, along the Pacific Ocean. It is bordered by Clatsop County to the north, Washington County to the east, Yamhill County to the south, and the Pacific Ocean to the west. The county has a total area of 1,333 square miles, of which 1,099 square miles is land and 234 square miles is water. The county’s economy is largely based on agriculture, forestry, and fishing, and tourism is also an important part of the economy. As of the 2010 census, the population of Tillamook County was 25,250. The county is home to several Native American tribes, and several religious denominations.
Common Questions
What is the Total Population of Tillamook County?
Total Population of Tillamook County is 27,345.
What is the Total Male Population of Tillamook County?
Total Male Population of Tillamook County is 13,835.
What is the Total Female Population of Tillamook County?
Total Female Population of Tillamook County is 13,510.
What is the Ratio of Males per 100 Females in Tillamook County?
There are 102.41 Males per 100 Females in Tillamook County.
What is the Ratio of Females per 100 Males in Tillamook County?
There are 97.65 Females per 100 Males in Tillamook County.
What is the Median Population Age in Tillamook County?
Median Population Age in Tillamook County is 48.7 Years.
What is the Average Family Size in Tillamook County
Average Family Size in Tillamook County is 2.8 People.
What is the Average Household Size in Tillamook County
Average Household Size in Tillamook County is 2.3 People.
What is Per Capita Income in Tillamook County?
Per Capita income in Tillamook County is $35,433.
What is the Median Family Income in Tillamook County?
Median Family Income in Tillamook County is $73,101.
What is the Median Household income in Tillamook County?
Median Household Income in Tillamook County is $63,098.
What is Income or Wage Gap in Tillamook County?
Income or Wage Gap in Tillamook County is 30.8%.
Women in Tillamook County earn 69.2 cents for every dollar earned by a man.
What is Family Income Deficit in Tillamook County?
Family Income Deficit in Tillamook County is $9,926.
Families that are below poverty line in Tillamook County earn $9,926 less on average than the poverty threshold level.
What is Inequality or Gini Index in Tillamook County?
Inequality or Gini Index in Tillamook County is 0.44.
How Large is the Labor Force in Tillamook County?
There are 11,517 People in the Labor Forcein in Tillamook County.
What is the Percentage of People in the Labor Force in Tillamook County?
50.3% of People are in the Labor Force in Tillamook County.
What is the Unemployment Rate in Tillamook County?
Unemployment Rate in Tillamook County is 5.2%.