Sherman County, OR
Sherman County Map
Sherman County Overview
1,900
TOTAL POPULATION
932
MALE POPULATION
968
FEMALE POPULATION
96.28
MALES / 100 FEMALES
103.86
FEMALES / 100 MALES
45.7
MEDIAN AGE
3.1
AVG FAMILY SIZE
2.5
AVG HOUSEHOLD SIZE
$33,206
PER CAPITA INCOME
$74,063
AVG FAMILY INCOME
$57,171
AVG HOUSEHOLD INCOME
44.5%
WAGE / INCOME GAP [ % ]
55.5¢/ $1
WAGE / INCOME GAP [ $ ]
0.44
INEQUALITY / GINI INDEX
828
LABOR FORCE [ PEOPLE ]
52.5%
PERCENT IN LABOR FORCE
2.2%
UNEMPLOYMENT RATE
Sherman County Area Codes
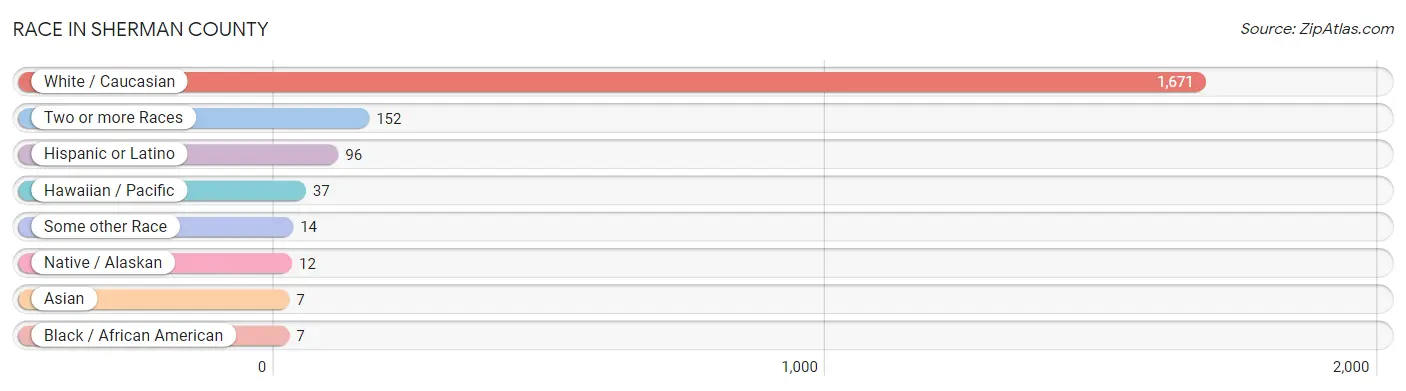
Race in Sherman County
The most populous races in Sherman County are White / Caucasian (1,671 | 87.9%), Two or more Races (152 | 8.0%), and Hispanic or Latino (96 | 5.1%).
| Race | # Population | % Population |
| Asian | 7 | 0.4% |
| Black / African American | 7 | 0.4% |
| Hawaiian / Pacific | 37 | 1.9% |
| Hispanic or Latino | 96 | 5.1% |
| Native / Alaskan | 12 | 0.6% |
| White / Caucasian | 1,671 | 87.9% |
| Two or more Races | 152 | 8.0% |
| Some other Race | 14 | 0.7% |
| Total | 1,900 | 100.0% |
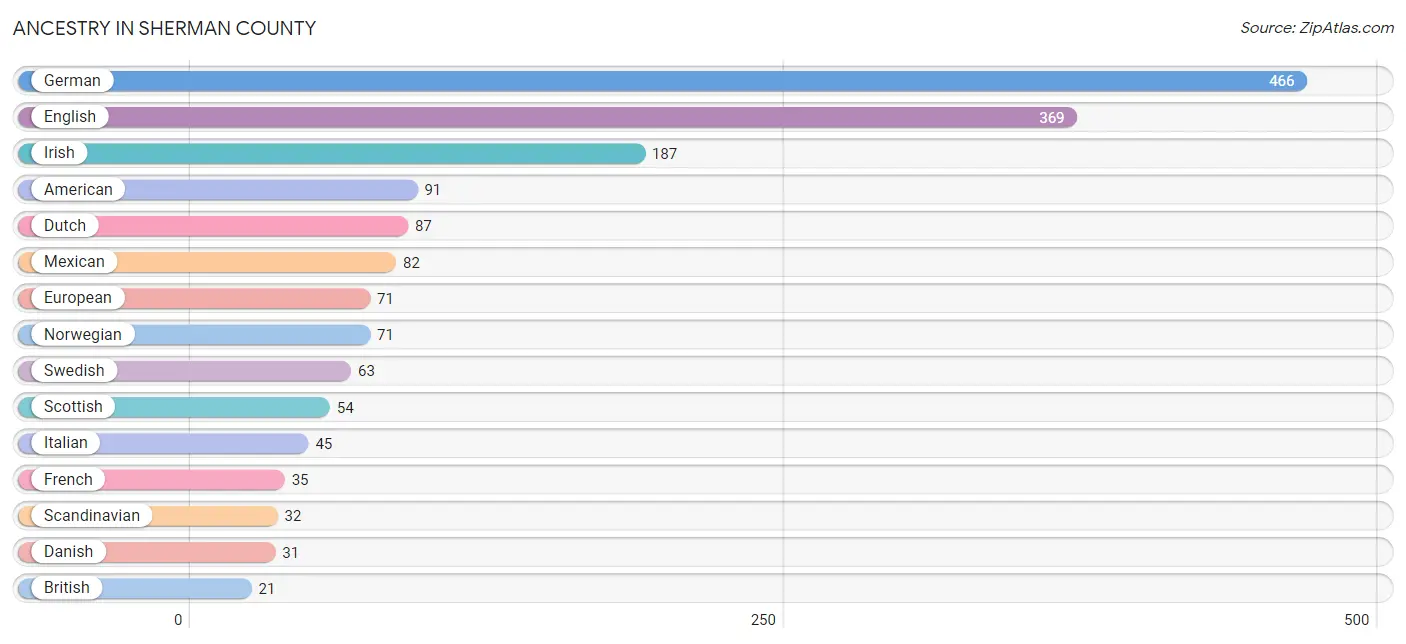
Ancestry in Sherman County
The most populous ancestries reported in Sherman County are German (466 | 24.5%), English (369 | 19.4%), Irish (187 | 9.8%), American (91 | 4.8%), and Dutch (87 | 4.6%), together accounting for 63.2% of all Sherman County residents.
| Ancestry | # Population | % Population |
| African | 7 | 0.4% |
| American | 91 | 4.8% |
| Australian | 3 | 0.2% |
| Austrian | 20 | 1.1% |
| Bangladeshi | 7 | 0.4% |
| Bhutanese | 7 | 0.4% |
| Blackfeet | 2 | 0.1% |
| British | 21 | 1.1% |
| Canadian | 3 | 0.2% |
| Cherokee | 3 | 0.2% |
| Chickasaw | 3 | 0.2% |
| Cuban | 5 | 0.3% |
| Czech | 1 | 0.1% |
| Danish | 31 | 1.6% |
| Dutch | 87 | 4.6% |
| Eastern European | 17 | 0.9% |
| English | 369 | 19.4% |
| European | 71 | 3.7% |
| Finnish | 6 | 0.3% |
| French | 35 | 1.8% |
| French Canadian | 5 | 0.3% |
| German | 466 | 24.5% |
| Greek | 4 | 0.2% |
| Inupiat | 4 | 0.2% |
| Irish | 187 | 9.8% |
| Italian | 45 | 2.4% |
| Korean | 20 | 1.1% |
| Lithuanian | 2 | 0.1% |
| Marshallese | 7 | 0.4% |
| Mexican | 82 | 4.3% |
| Native Hawaiian | 20 | 1.1% |
| Navajo | 3 | 0.2% |
| Northern European | 10 | 0.5% |
| Norwegian | 71 | 3.7% |
| Polish | 19 | 1.0% |
| Portuguese | 5 | 0.3% |
| Russian | 5 | 0.3% |
| Samoan | 1 | 0.1% |
| Scandinavian | 32 | 1.7% |
| Scotch-Irish | 13 | 0.7% |
| Scottish | 54 | 2.8% |
| Sioux | 1 | 0.1% |
| Spaniard | 6 | 0.3% |
| Subsaharan African | 7 | 0.4% |
| Swedish | 63 | 3.3% |
| Swiss | 7 | 0.4% |
| Welsh | 16 | 0.8% | View All 47 Rows |
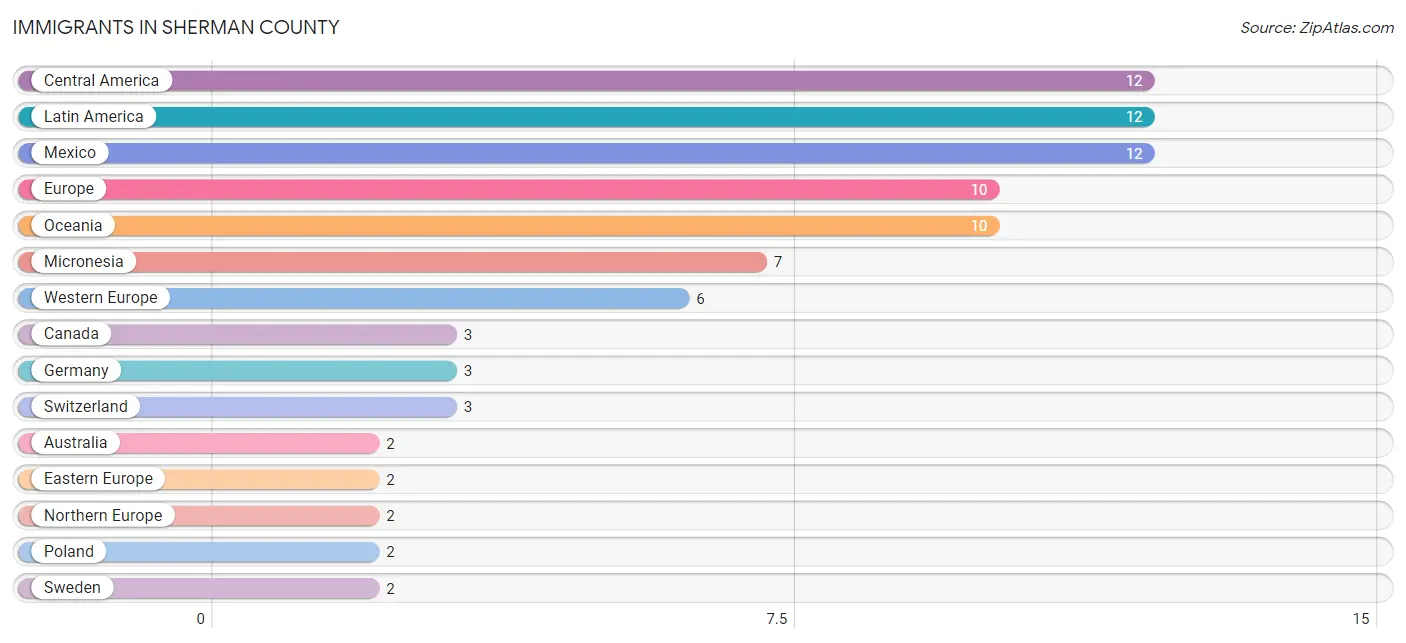
Immigrants in Sherman County
The most numerous immigrant groups reported in Sherman County came from Central America (12 | 0.6%), Latin America (12 | 0.6%), Mexico (12 | 0.6%), Europe (10 | 0.5%), and Oceania (10 | 0.5%), together accounting for 2.9% of all Sherman County residents.
| Immigration Origin | # Population | % Population |
| Australia | 2 | 0.1% |
| Canada | 3 | 0.2% |
| Central America | 12 | 0.6% |
| Eastern Europe | 2 | 0.1% |
| Europe | 10 | 0.5% |
| Germany | 3 | 0.2% |
| Latin America | 12 | 0.6% |
| Mexico | 12 | 0.6% |
| Micronesia | 7 | 0.4% |
| Northern Europe | 2 | 0.1% |
| Oceania | 10 | 0.5% |
| Poland | 2 | 0.1% |
| Sweden | 2 | 0.1% |
| Switzerland | 3 | 0.2% |
| Western Europe | 6 | 0.3% | View All 15 Rows |
Sex and Age in Sherman County
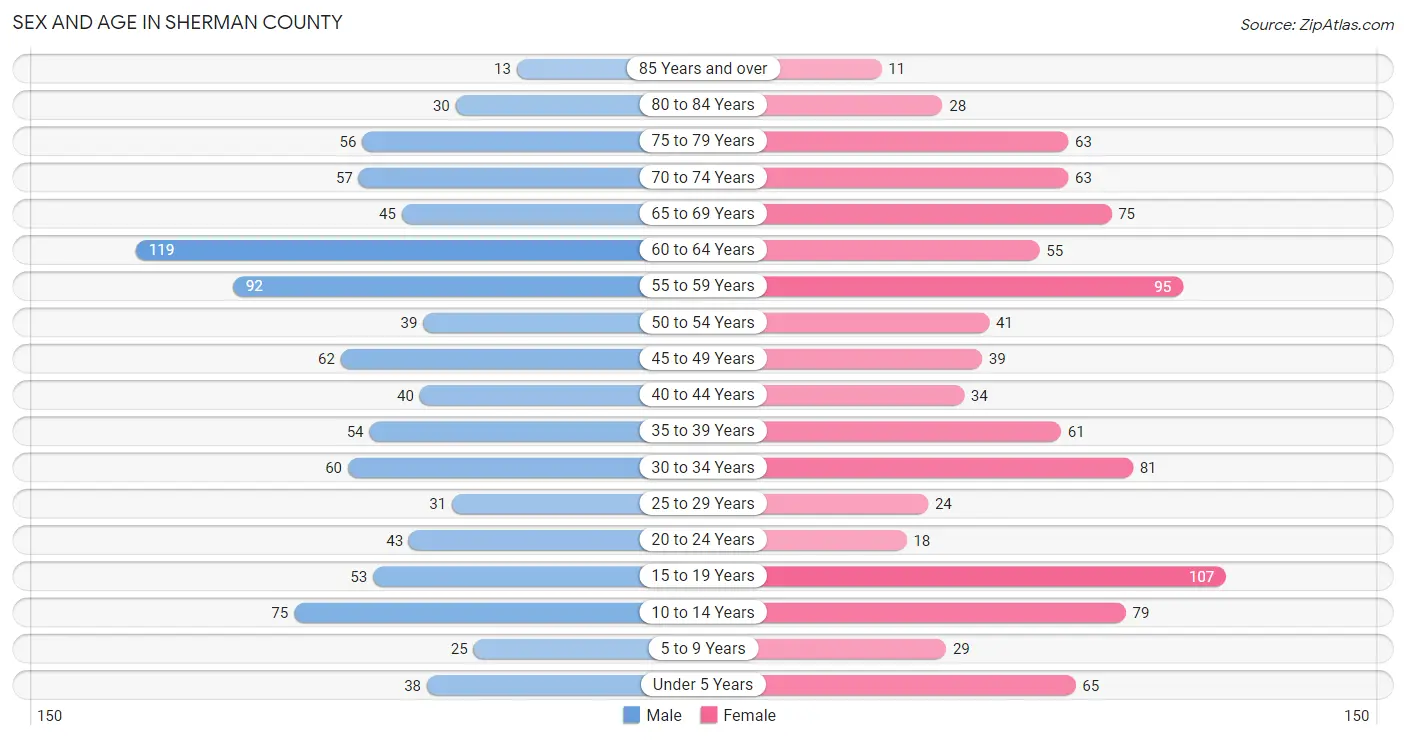
Sex and Age in Sherman County
The most populous age groups in Sherman County are 60 to 64 Years (119 | 12.8%) for men and 15 to 19 Years (107 | 11.1%) for women.
| Age Bracket | Male | Female |
| Under 5 Years | 38 (4.1%) | 65 (6.7%) |
| 5 to 9 Years | 25 (2.7%) | 29 (3.0%) |
| 10 to 14 Years | 75 (8.1%) | 79 (8.2%) |
| 15 to 19 Years | 53 (5.7%) | 107 (11.1%) |
| 20 to 24 Years | 43 (4.6%) | 18 (1.9%) |
| 25 to 29 Years | 31 (3.3%) | 24 (2.5%) |
| 30 to 34 Years | 60 (6.4%) | 81 (8.4%) |
| 35 to 39 Years | 54 (5.8%) | 61 (6.3%) |
| 40 to 44 Years | 40 (4.3%) | 34 (3.5%) |
| 45 to 49 Years | 62 (6.7%) | 39 (4.0%) |
| 50 to 54 Years | 39 (4.2%) | 41 (4.2%) |
| 55 to 59 Years | 92 (9.9%) | 95 (9.8%) |
| 60 to 64 Years | 119 (12.8%) | 55 (5.7%) |
| 65 to 69 Years | 45 (4.8%) | 75 (7.7%) |
| 70 to 74 Years | 57 (6.1%) | 63 (6.5%) |
| 75 to 79 Years | 56 (6.0%) | 63 (6.5%) |
| 80 to 84 Years | 30 (3.2%) | 28 (2.9%) |
| 85 Years and over | 13 (1.4%) | 11 (1.1%) |
| Total | 932 (100.0%) | 968 (100.0%) |
Families and Households in Sherman County
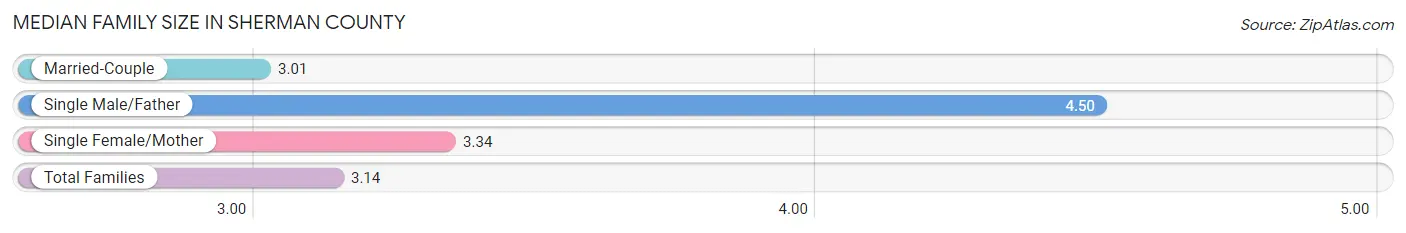
Median Family Size in Sherman County
The median family size in Sherman County is 3.14 persons per family, with single male/father families (20 | 4.4%) accounting for the largest median family size of 4.5 persons per family. On the other hand, married-couple families (356 | 78.2%) represent the smallest median family size with 3.01 persons per family.
| Family Type | # Families | Family Size |
| Married-Couple | 356 (78.2%) | 3.01 |
| Single Male/Father | 20 (4.4%) | 4.50 |
| Single Female/Mother | 79 (17.4%) | 3.34 |
| Total Families | 455 (100.0%) | 3.14 |
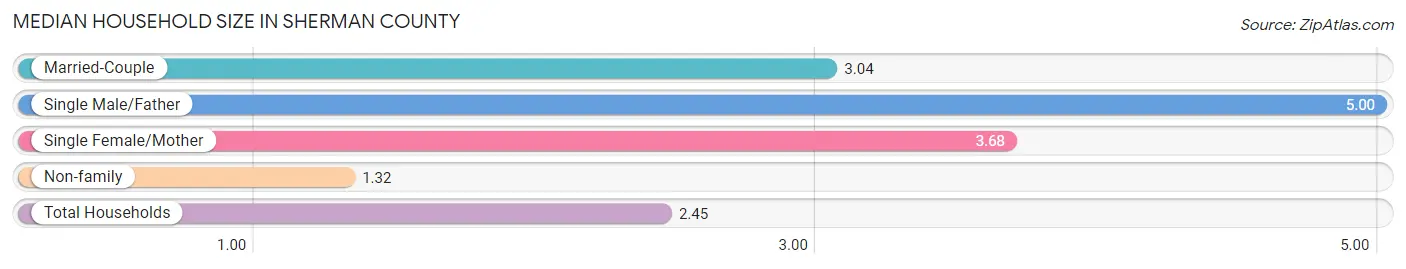
Median Household Size in Sherman County
The median household size in Sherman County is 2.45 persons per household, with single male/father households (20 | 2.6%) accounting for the largest median household size of 5 persons per household. non-family households (315 | 40.9%) represent the smallest median household size with 1.32 persons per household.
| Household Type | # Households | Household Size |
| Married-Couple | 356 (46.2%) | 3.04 |
| Single Male/Father | 20 (2.6%) | 5.00 |
| Single Female/Mother | 79 (10.3%) | 3.68 |
| Non-family | 315 (40.9%) | 1.32 |
| Total Households | 770 (100.0%) | 2.45 |
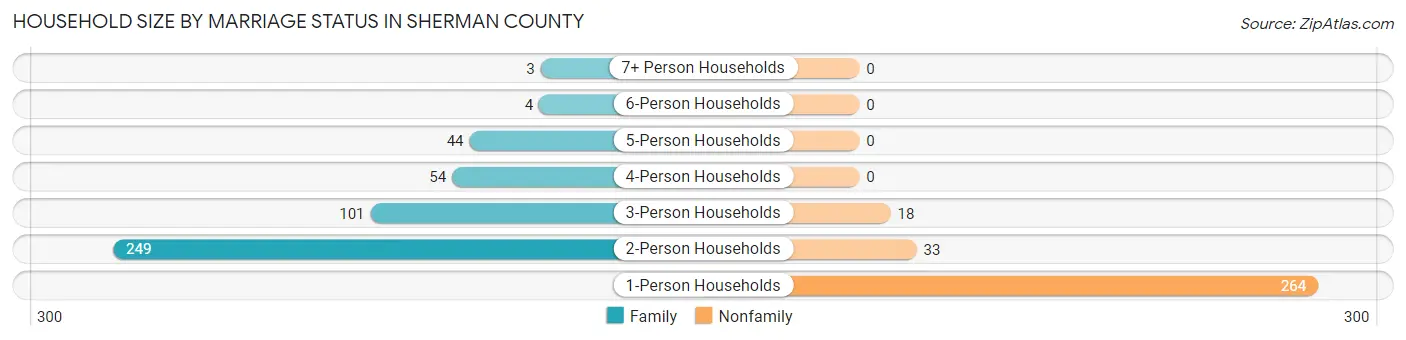
Household Size by Marriage Status in Sherman County
Out of a total of 770 households in Sherman County, 455 (59.1%) are family households, while 315 (40.9%) are nonfamily households. The most numerous type of family households are 2-person households, comprising 249, and the most common type of nonfamily households are 1-person households, comprising 264.
| Household Size | Family Households | Nonfamily Households |
| 1-Person Households | - | 264 (34.3%) |
| 2-Person Households | 249 (32.3%) | 33 (4.3%) |
| 3-Person Households | 101 (13.1%) | 18 (2.3%) |
| 4-Person Households | 54 (7.0%) | 0 (0.0%) |
| 5-Person Households | 44 (5.7%) | 0 (0.0%) |
| 6-Person Households | 4 (0.5%) | 0 (0.0%) |
| 7+ Person Households | 3 (0.4%) | 0 (0.0%) |
| Total | 455 (59.1%) | 315 (40.9%) |
Female Fertility in Sherman County
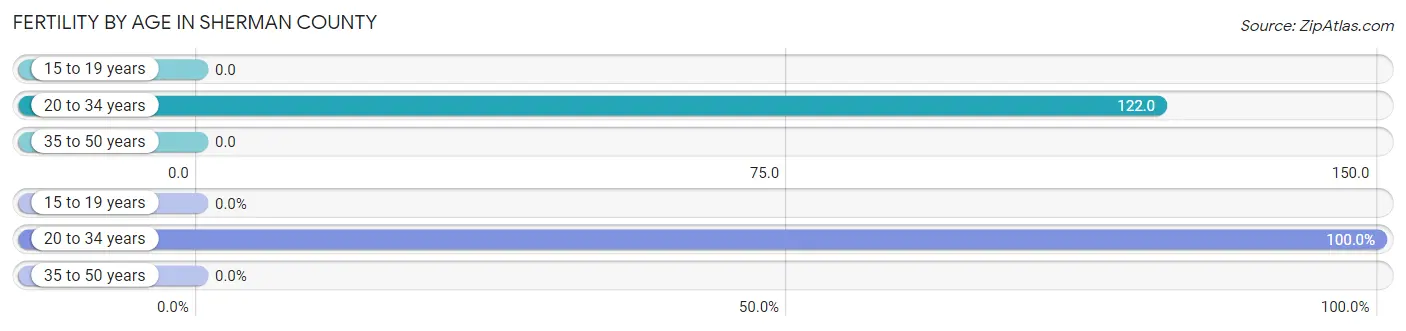
Fertility by Age in Sherman County
Average fertility rate in Sherman County is 41.0 births per 1,000 women. Women in the age bracket of 20 to 34 years have the highest fertility rate with 122.0 births per 1,000 women. Women in the age bracket of 20 to 34 years acount for 100.0% of all women with births.
| Age Bracket | Women with Births | Births / 1,000 Women |
| 15 to 19 years | 0 (0.0%) | 0.0 |
| 20 to 34 years | 15 (100.0%) | 122.0 |
| 35 to 50 years | 0 (0.0%) | 0.0 |
| Total | 15 (100.0%) | 41.0 |
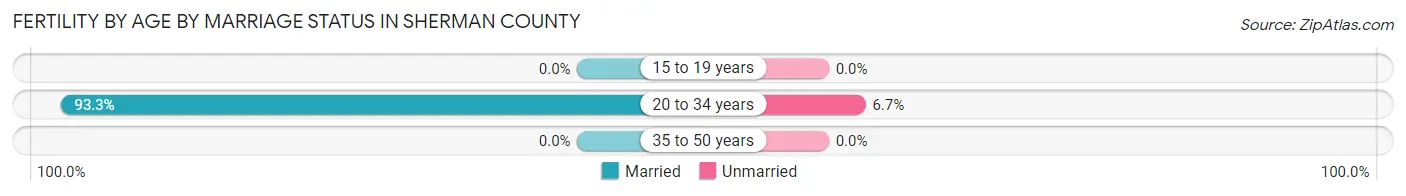
Fertility by Age by Marriage Status in Sherman County
93.3% of women with births (15) in Sherman County are married. The highest percentage of unmarried women with births falls into 20 to 34 years age bracket with 6.7% of them unmarried at the time of birth, while the lowest percentage of unmarried women with births belong to 20 to 34 years age bracket with 6.7% of them unmarried.
| Age Bracket | Married | Unmarried |
| 15 to 19 years | 0 (0.0%) | 0 (0.0%) |
| 20 to 34 years | 14 (93.3%) | 1 (6.7%) |
| 35 to 50 years | 0 (0.0%) | 0 (0.0%) |
| Total | 14 (93.3%) | 1 (6.7%) |
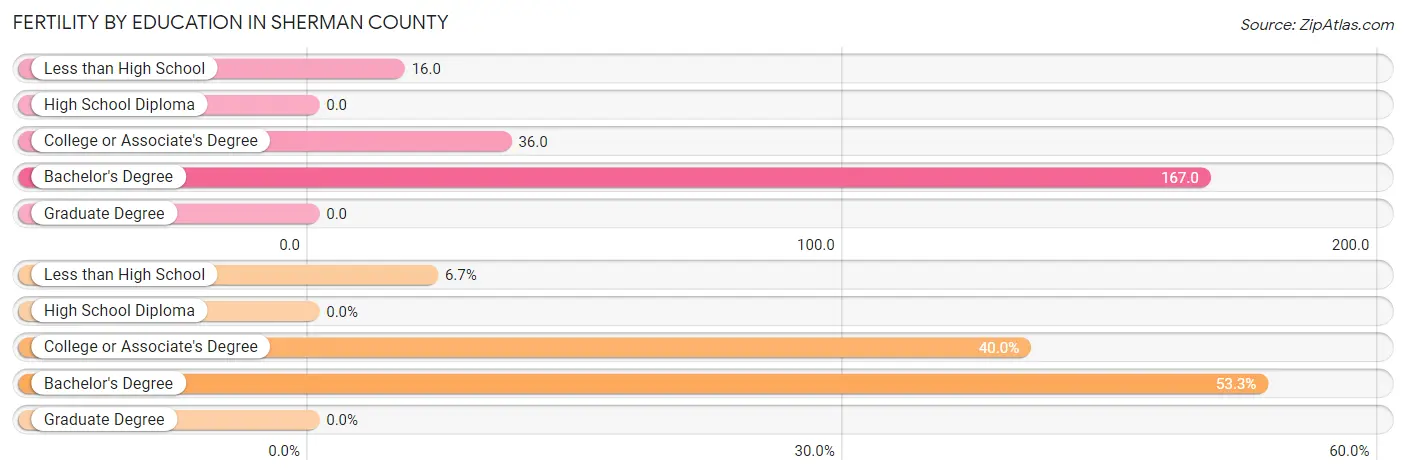
Fertility by Education in Sherman County
| Educational Attainment | Women with Births | Births / 1,000 Women |
| Less than High School | 1 (6.7%) | 16.0 |
| High School Diploma | 0 (0.0%) | 0.0 |
| College or Associate's Degree | 6 (40.0%) | 36.0 |
| Bachelor's Degree | 8 (53.3%) | 167.0 |
| Graduate Degree | 0 (0.0%) | 0.0 |
| Total | 15 (100.0%) | 41.0 |
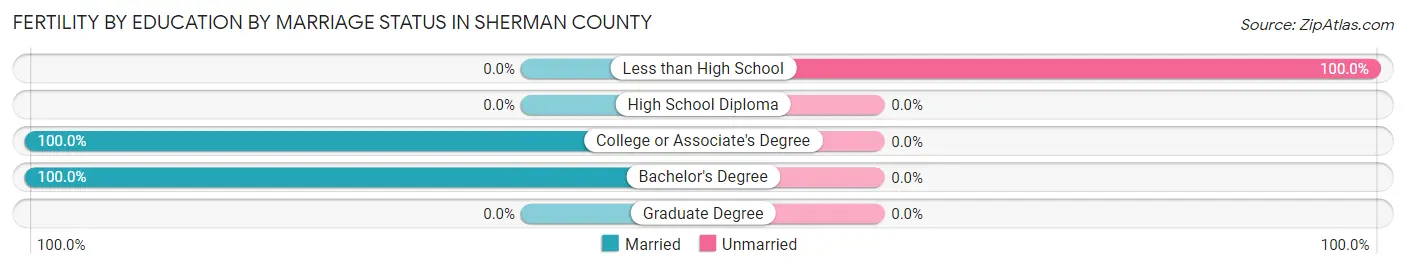
Fertility by Education by Marriage Status in Sherman County
6.7% of women with births in Sherman County are unmarried. Women with the educational attainment of college or associate's degree are most likely to be married with 100.0% of them married at childbirth, while women with the educational attainment of less than high school are least likely to be married with 100.0% of them unmarried at childbirth.
| Educational Attainment | Married | Unmarried |
| Less than High School | 0 (0.0%) | 1 (100.0%) |
| High School Diploma | 0 (0.0%) | 0 (0.0%) |
| College or Associate's Degree | 6 (100.0%) | 0 (0.0%) |
| Bachelor's Degree | 8 (100.0%) | 0 (0.0%) |
| Graduate Degree | 0 (0.0%) | 0 (0.0%) |
| Total | 14 (93.3%) | 1 (6.7%) |
Income in Sherman County
Income Overview in Sherman County
Per Capita Income in Sherman County is $33,206, while median incomes of families and households are $74,063 and $57,171 respectively.
| Characteristic | Number | Measure |
| Per Capita Income | 1,900 | $33,206 |
| Median Family Income | 455 | $74,063 |
| Mean Family Income | 455 | $85,449 |
| Median Household Income | 770 | $57,171 |
| Mean Household Income | 770 | $74,112 |
| Income Deficit | 455 | $0 |
| Wage / Income Gap (%) | 1,900 | 44.55% |
| Wage / Income Gap ($) | 1,900 | 55.45¢ per $1 |
| Gini / Inequality Index | 1,900 | 0.44 |
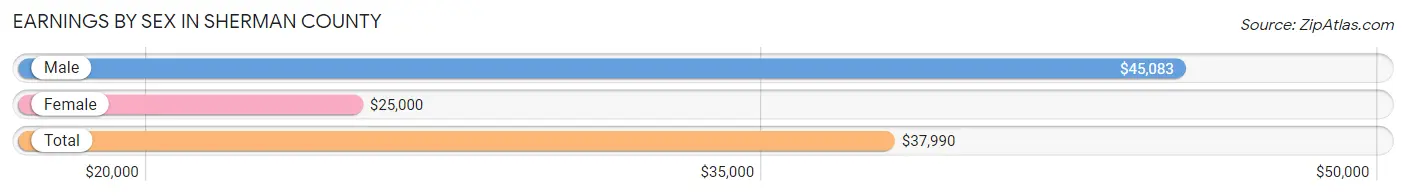
Earnings by Sex in Sherman County
Average Earnings in Sherman County are $37,990, $45,083 for men and $25,000 for women, a difference of 44.6%.
| Sex | Number | Average Earnings |
| Male | 542 (57.9%) | $45,083 |
| Female | 394 (42.1%) | $25,000 |
| Total | 936 (100.0%) | $37,990 |
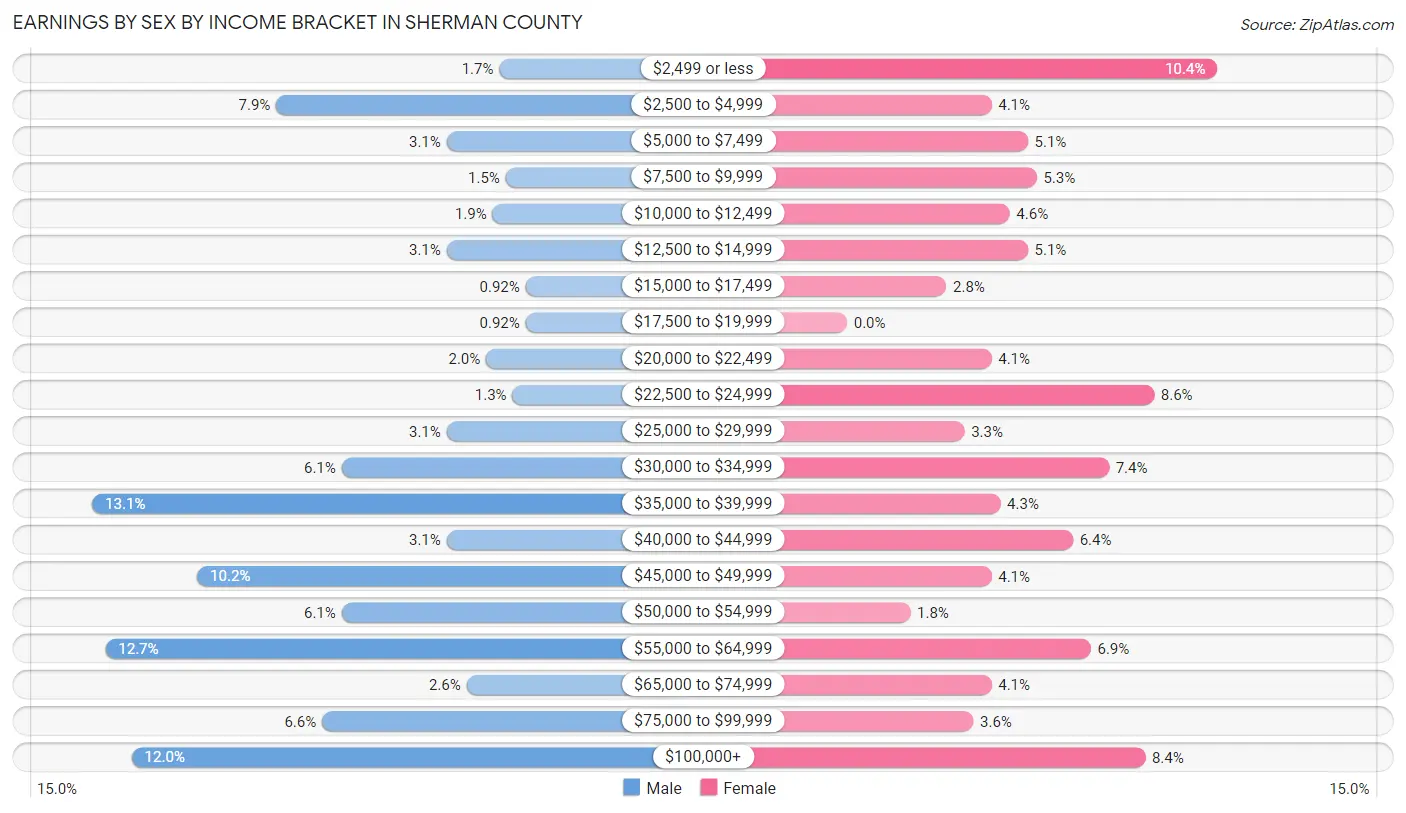
Earnings by Sex by Income Bracket in Sherman County
The most common earnings brackets in Sherman County are $35,000 to $39,999 for men (71 | 13.1%) and $2,499 or less for women (41 | 10.4%).
| Income | Male | Female |
| $2,499 or less | 9 (1.7%) | 41 (10.4%) |
| $2,500 to $4,999 | 43 (7.9%) | 16 (4.1%) |
| $5,000 to $7,499 | 17 (3.1%) | 20 (5.1%) |
| $7,500 to $9,999 | 8 (1.5%) | 21 (5.3%) |
| $10,000 to $12,499 | 10 (1.8%) | 18 (4.6%) |
| $12,500 to $14,999 | 17 (3.1%) | 20 (5.1%) |
| $15,000 to $17,499 | 5 (0.9%) | 11 (2.8%) |
| $17,500 to $19,999 | 5 (0.9%) | 0 (0.0%) |
| $20,000 to $22,499 | 11 (2.0%) | 16 (4.1%) |
| $22,500 to $24,999 | 7 (1.3%) | 34 (8.6%) |
| $25,000 to $29,999 | 17 (3.1%) | 13 (3.3%) |
| $30,000 to $34,999 | 33 (6.1%) | 29 (7.4%) |
| $35,000 to $39,999 | 71 (13.1%) | 17 (4.3%) |
| $40,000 to $44,999 | 17 (3.1%) | 25 (6.4%) |
| $45,000 to $49,999 | 55 (10.2%) | 16 (4.1%) |
| $50,000 to $54,999 | 33 (6.1%) | 7 (1.8%) |
| $55,000 to $64,999 | 69 (12.7%) | 27 (6.9%) |
| $65,000 to $74,999 | 14 (2.6%) | 16 (4.1%) |
| $75,000 to $99,999 | 36 (6.6%) | 14 (3.5%) |
| $100,000+ | 65 (12.0%) | 33 (8.4%) |
| Total | 542 (100.0%) | 394 (100.0%) |
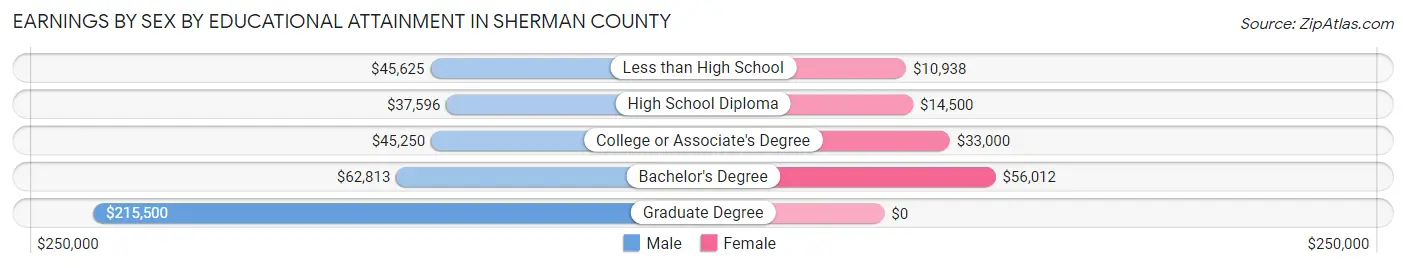
Earnings by Sex by Educational Attainment in Sherman County
Average earnings in Sherman County are $46,833 for men and $29,063 for women, a difference of 37.9%. Men with an educational attainment of graduate degree enjoy the highest average annual earnings of $215,500, while those with high school diploma education earn the least with $37,596. Women with an educational attainment of bachelor's degree earn the most with the average annual earnings of $56,012, while those with less than high school education have the smallest earnings of $10,938.
| Educational Attainment | Male Income | Female Income |
| Less than High School | $45,625 | $10,938 |
| High School Diploma | $37,596 | $14,500 |
| College or Associate's Degree | $45,250 | $33,000 |
| Bachelor's Degree | $62,813 | $56,012 |
| Graduate Degree | $215,500 | $0 |
| Total | $46,833 | $29,063 |
Family Income in Sherman County
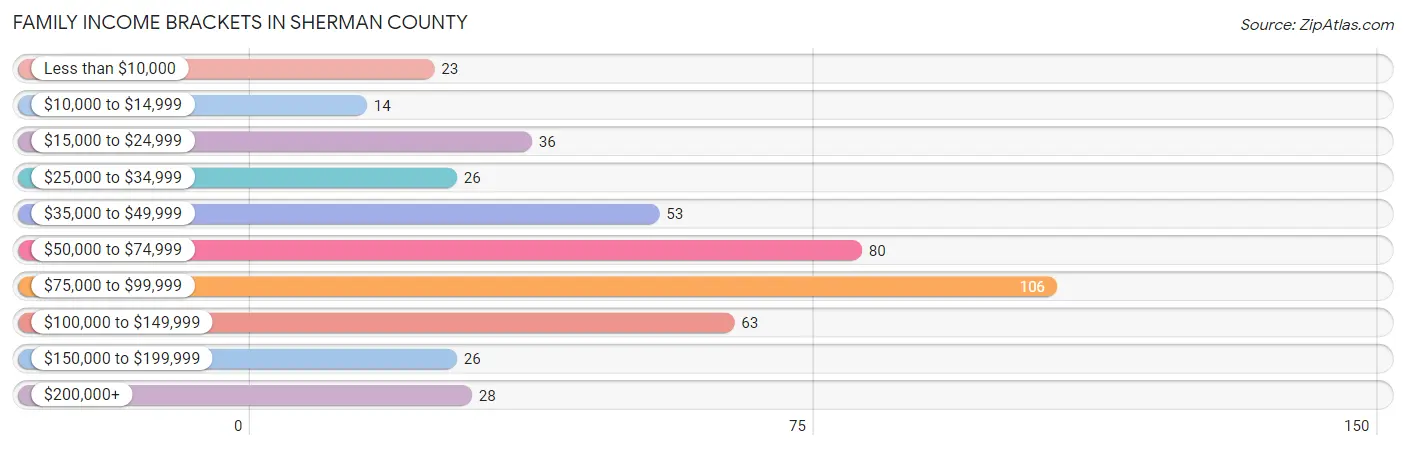
Family Income Brackets in Sherman County
According to the Sherman County family income data, there are 106 families falling into the $75,000 to $99,999 income range, which is the most common income bracket and makes up 23.3% of all families. Conversely, the $10,000 to $14,999 income bracket is the least frequent group with only 14 families (3.1%) belonging to this category.
| Income Bracket | # Families | % Families |
| Less than $10,000 | 23 | 5.1% |
| $10,000 to $14,999 | 14 | 3.1% |
| $15,000 to $24,999 | 36 | 7.9% |
| $25,000 to $34,999 | 26 | 5.7% |
| $35,000 to $49,999 | 53 | 11.6% |
| $50,000 to $74,999 | 80 | 17.6% |
| $75,000 to $99,999 | 106 | 23.3% |
| $100,000 to $149,999 | 63 | 13.8% |
| $150,000 to $199,999 | 26 | 5.7% |
| $200,000+ | 28 | 6.2% |
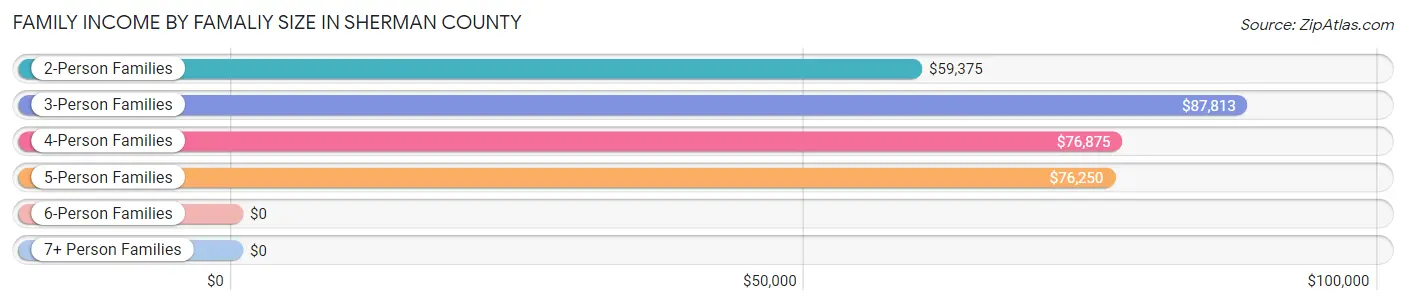
Family Income by Famaliy Size in Sherman County
3-person families (81 | 17.8%) account for the highest median family income in Sherman County with $87,813 per family, while 2-person families (274 | 60.2%) have the highest median income of $29,688 per family member.
| Income Bracket | # Families | Median Income |
| 2-Person Families | 274 (60.2%) | $59,375 |
| 3-Person Families | 81 (17.8%) | $87,813 |
| 4-Person Families | 59 (13.0%) | $76,875 |
| 5-Person Families | 34 (7.5%) | $76,250 |
| 6-Person Families | 4 (0.9%) | $0 |
| 7+ Person Families | 3 (0.7%) | $0 |
| Total | 455 (100.0%) | $74,063 |
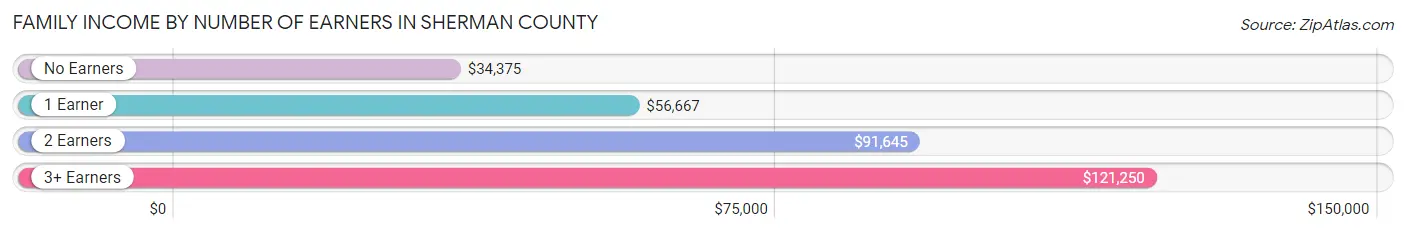
Family Income by Number of Earners in Sherman County
The median family income in Sherman County is $74,063, with families comprising 3+ earners (24) having the highest median family income of $121,250, while families with no earners (108) have the lowest median family income of $34,375, accounting for 5.3% and 23.7% of families, respectively.
| Number of Earners | # Families | Median Income |
| No Earners | 108 (23.7%) | $34,375 |
| 1 Earner | 146 (32.1%) | $56,667 |
| 2 Earners | 177 (38.9%) | $91,645 |
| 3+ Earners | 24 (5.3%) | $121,250 |
| Total | 455 (100.0%) | $74,063 |
Household Income in Sherman County
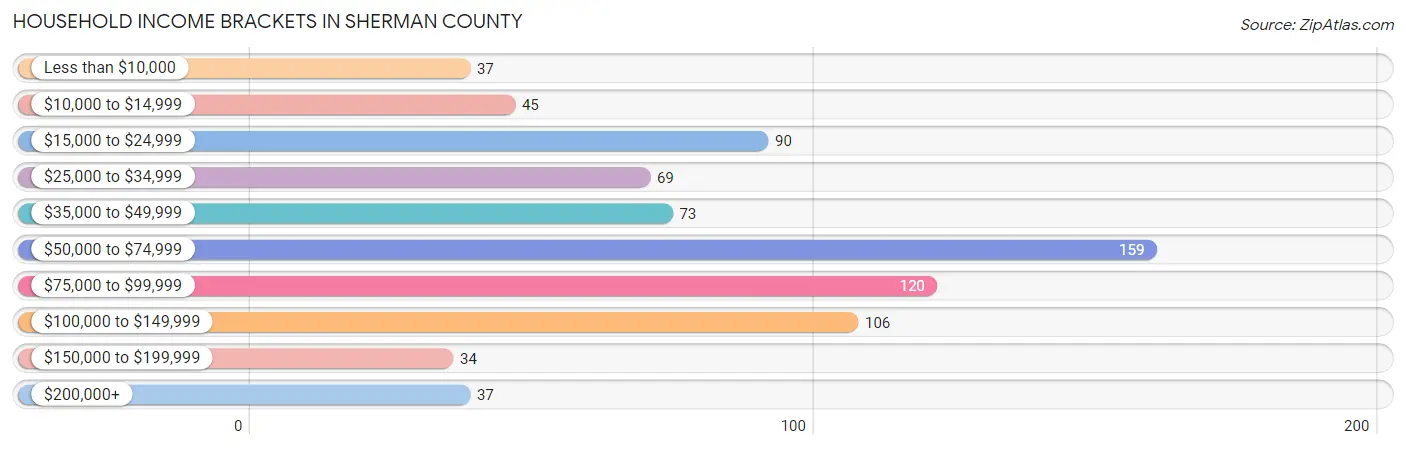
Household Income Brackets in Sherman County
With 159 households falling in the category, the $50,000 to $74,999 income range is the most frequent in Sherman County, accounting for 20.6% of all households. In contrast, only 34 households (4.4%) fall into the $150,000 to $199,999 income bracket, making it the least populous group.
| Income Bracket | # Households | % Households |
| Less than $10,000 | 37 | 4.8% |
| $10,000 to $14,999 | 45 | 5.8% |
| $15,000 to $24,999 | 90 | 11.7% |
| $25,000 to $34,999 | 69 | 9.0% |
| $35,000 to $49,999 | 73 | 9.5% |
| $50,000 to $74,999 | 159 | 20.6% |
| $75,000 to $99,999 | 120 | 15.6% |
| $100,000 to $149,999 | 106 | 13.8% |
| $150,000 to $199,999 | 34 | 4.4% |
| $200,000+ | 37 | 4.8% |
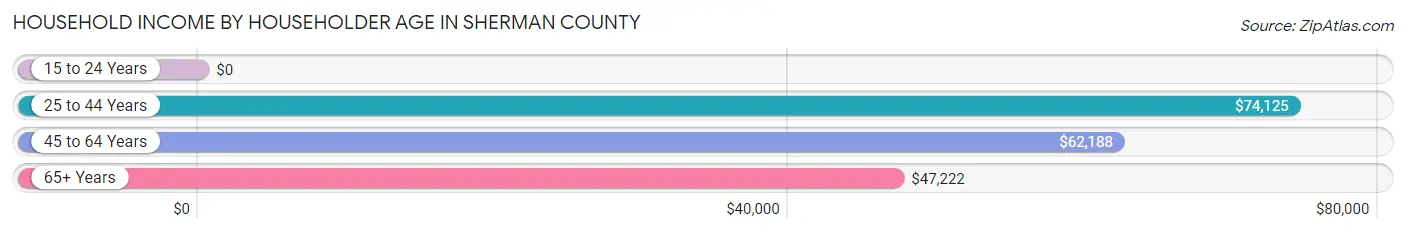
Household Income by Householder Age in Sherman County
The median household income in Sherman County is $57,171, with the highest median household income of $74,125 found in the 25 to 44 years age bracket for the primary householder. A total of 189 households (24.5%) fall into this category. Meanwhile, the 15 to 24 years age bracket for the primary householder has the lowest median household income of $0, with 24 households (3.1%) in this group.
| Income Bracket | # Households | Median Income |
| 15 to 24 Years | 24 (3.1%) | $0 |
| 25 to 44 Years | 189 (24.5%) | $74,125 |
| 45 to 64 Years | 271 (35.2%) | $62,188 |
| 65+ Years | 286 (37.1%) | $47,222 |
| Total | 770 (100.0%) | $57,171 |
Poverty in Sherman County
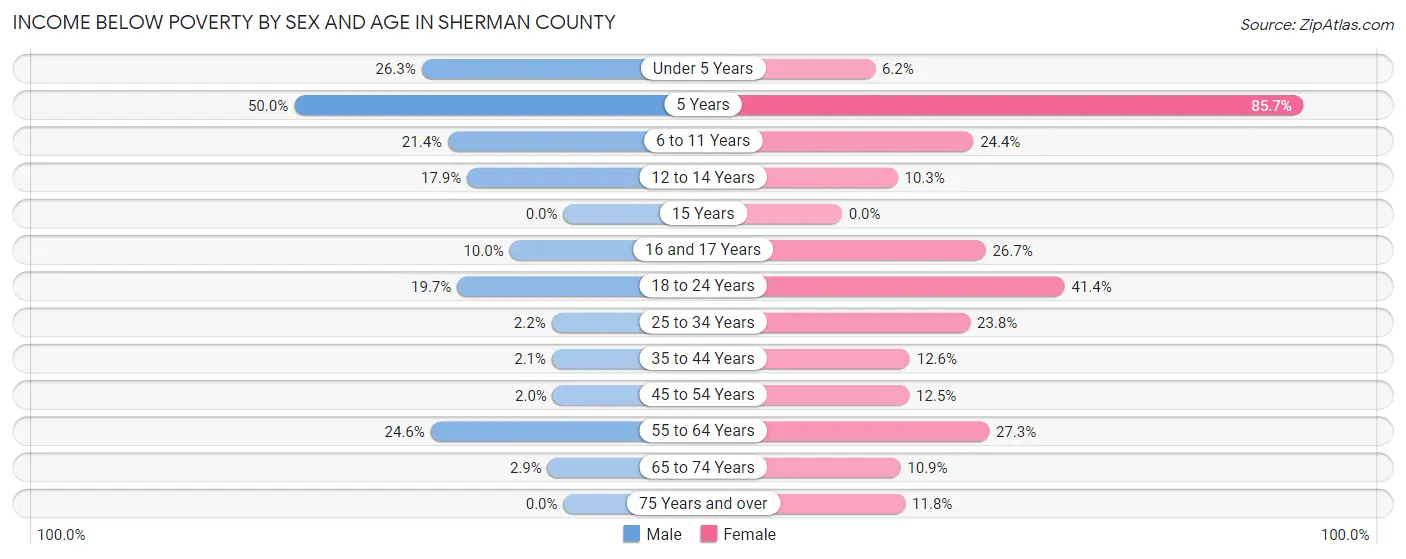
Income Below Poverty by Sex and Age in Sherman County
With 11.5% poverty level for males and 19.5% for females among the residents of Sherman County, 5 year old males and 5 year old females are the most vulnerable to poverty, with 1 males (50.0%) and 6 females (85.7%) in their respective age groups living below the poverty level.
| Age Bracket | Male | Female |
| Under 5 Years | 10 (26.3%) | 4 (6.1%) |
| 5 Years | 1 (50.0%) | 6 (85.7%) |
| 6 to 11 Years | 9 (21.4%) | 10 (24.4%) |
| 12 to 14 Years | 10 (17.9%) | 6 (10.3%) |
| 15 Years | 0 (0.0%) | 0 (0.0%) |
| 16 and 17 Years | 2 (10.0%) | 4 (26.7%) |
| 18 to 24 Years | 14 (19.7%) | 43 (41.3%) |
| 25 to 34 Years | 2 (2.2%) | 25 (23.8%) |
| 35 to 44 Years | 2 (2.1%) | 12 (12.6%) |
| 45 to 54 Years | 2 (2.0%) | 10 (12.5%) |
| 55 to 64 Years | 52 (24.6%) | 41 (27.3%) |
| 65 to 74 Years | 3 (2.9%) | 15 (10.9%) |
| 75 Years and over | 0 (0.0%) | 12 (11.8%) |
| Total | 107 (11.5%) | 188 (19.5%) |
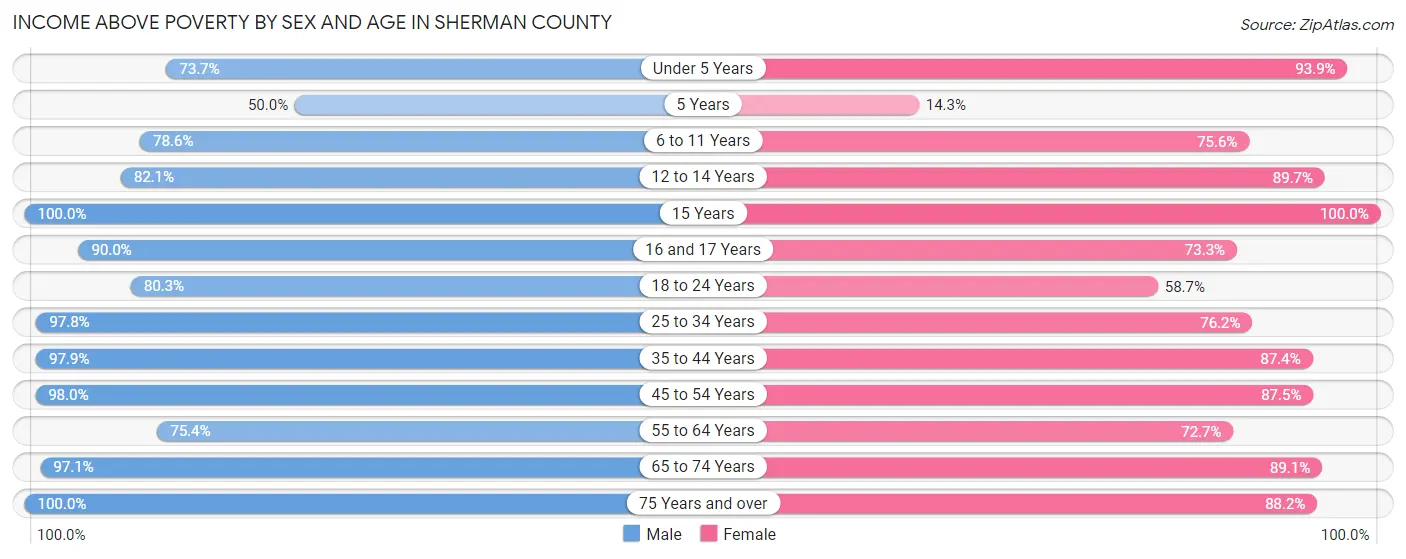
Income Above Poverty by Sex and Age in Sherman County
According to the poverty statistics in Sherman County, males aged 15 years and females aged 15 years are the age groups that are most secure financially, with 100.0% of males and 100.0% of females in these age groups living above the poverty line.
| Age Bracket | Male | Female |
| Under 5 Years | 28 (73.7%) | 61 (93.9%) |
| 5 Years | 1 (50.0%) | 1 (14.3%) |
| 6 to 11 Years | 33 (78.6%) | 31 (75.6%) |
| 12 to 14 Years | 46 (82.1%) | 52 (89.7%) |
| 15 Years | 5 (100.0%) | 6 (100.0%) |
| 16 and 17 Years | 18 (90.0%) | 11 (73.3%) |
| 18 to 24 Years | 57 (80.3%) | 61 (58.7%) |
| 25 to 34 Years | 89 (97.8%) | 80 (76.2%) |
| 35 to 44 Years | 92 (97.9%) | 83 (87.4%) |
| 45 to 54 Years | 99 (98.0%) | 70 (87.5%) |
| 55 to 64 Years | 159 (75.4%) | 109 (72.7%) |
| 65 to 74 Years | 99 (97.1%) | 123 (89.1%) |
| 75 Years and over | 99 (100.0%) | 90 (88.2%) |
| Total | 825 (88.5%) | 778 (80.5%) |
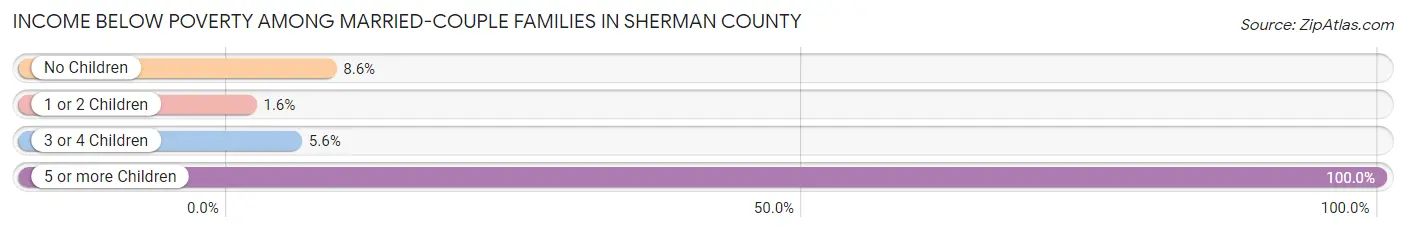
Income Below Poverty Among Married-Couple Families in Sherman County
The poverty statistics for married-couple families in Sherman County show that 7.3% or 26 of the total 356 families live below the poverty line. Families with 5 or more children have the highest poverty rate of 100.0%, comprising of 1 families. On the other hand, families with 1 or 2 children have the lowest poverty rate of 1.6%, which includes 1 families.
| Children | Above Poverty | Below Poverty |
| No Children | 235 (91.4%) | 22 (8.6%) |
| 1 or 2 Children | 61 (98.4%) | 1 (1.6%) |
| 3 or 4 Children | 34 (94.4%) | 2 (5.6%) |
| 5 or more Children | 0 (0.0%) | 1 (100.0%) |
| Total | 330 (92.7%) | 26 (7.3%) |
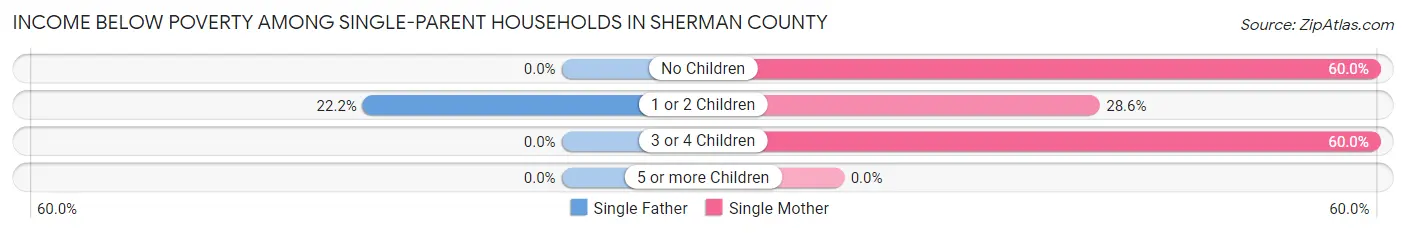
Income Below Poverty Among Single-Parent Households in Sherman County
According to the poverty data in Sherman County, 10.0% or 2 single-father households and 40.5% or 32 single-mother households are living below the poverty line. Among single-father households, those with 1 or 2 children have the highest poverty rate, with 2 households (22.2%) experiencing poverty. Likewise, among single-mother households, those with no children have the highest poverty rate, with 12 households (60.0%) falling below the poverty line.
| Children | Single Father | Single Mother |
| No Children | 0 (0.0%) | 12 (60.0%) |
| 1 or 2 Children | 2 (22.2%) | 14 (28.6%) |
| 3 or 4 Children | 0 (0.0%) | 6 (60.0%) |
| 5 or more Children | 0 (0.0%) | 0 (0.0%) |
| Total | 2 (10.0%) | 32 (40.5%) |
Income Below Poverty Among Married-Couple vs Single-Parent Households in Sherman County
The poverty data for Sherman County shows that 26 of the married-couple family households (7.3%) and 34 of the single-parent households (34.3%) are living below the poverty level. Within the married-couple family households, those with 5 or more children have the highest poverty rate, with 1 households (100.0%) falling below the poverty line. Among the single-parent households, those with no children have the highest poverty rate, with 12 household (44.4%) living below poverty.
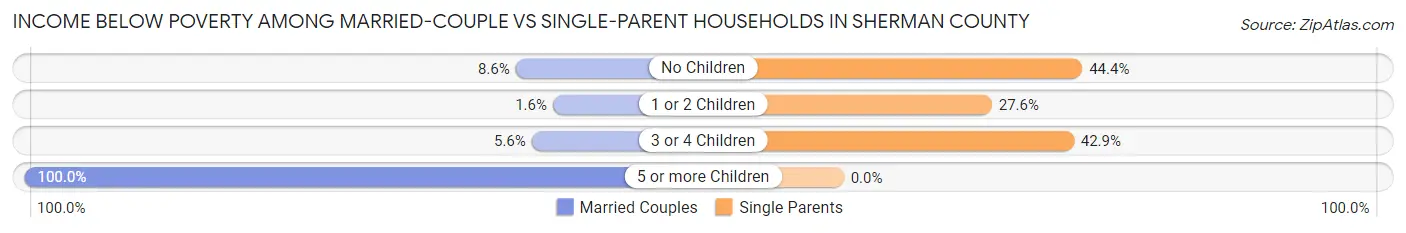
| Children | Married-Couple Families | Single-Parent Households |
| No Children | 22 (8.6%) | 12 (44.4%) |
| 1 or 2 Children | 1 (1.6%) | 16 (27.6%) |
| 3 or 4 Children | 2 (5.6%) | 6 (42.9%) |
| 5 or more Children | 1 (100.0%) | 0 (0.0%) |
| Total | 26 (7.3%) | 34 (34.3%) |
Employment Characteristics in Sherman County
Employment by Class of Employer in Sherman County
Among the 789 employed individuals in Sherman County, private company employees (421 | 53.4%), local government employees (156 | 19.8%), and self-employed (not incorporated) (76 | 9.6%) make up the most common classes of employment.
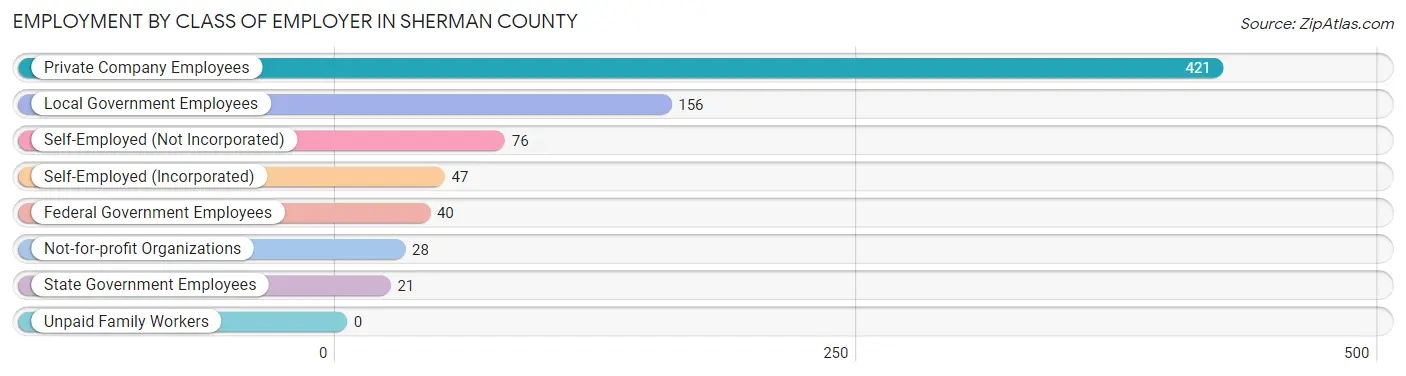
| Employer Class | # Employees | % Employees |
| Private Company Employees | 421 | 53.4% |
| Self-Employed (Incorporated) | 47 | 6.0% |
| Self-Employed (Not Incorporated) | 76 | 9.6% |
| Not-for-profit Organizations | 28 | 3.5% |
| Local Government Employees | 156 | 19.8% |
| State Government Employees | 21 | 2.7% |
| Federal Government Employees | 40 | 5.1% |
| Unpaid Family Workers | 0 | 0.0% |
| Total | 789 | 100.0% |
Employment Status by Age in Sherman County
According to the labor force statistics for Sherman County, out of the total population over 16 years of age (1,578), 52.5% or 828 individuals are in the labor force, with 2.2% or 18 of them unemployed. The age group with the highest labor force participation rate is 25 to 29 years, with 92.7% or 51 individuals in the labor force. Within the labor force, the 25 to 29 years age range has the highest percentage of unemployed individuals, with 3.9% or 2 of them being unemployed.
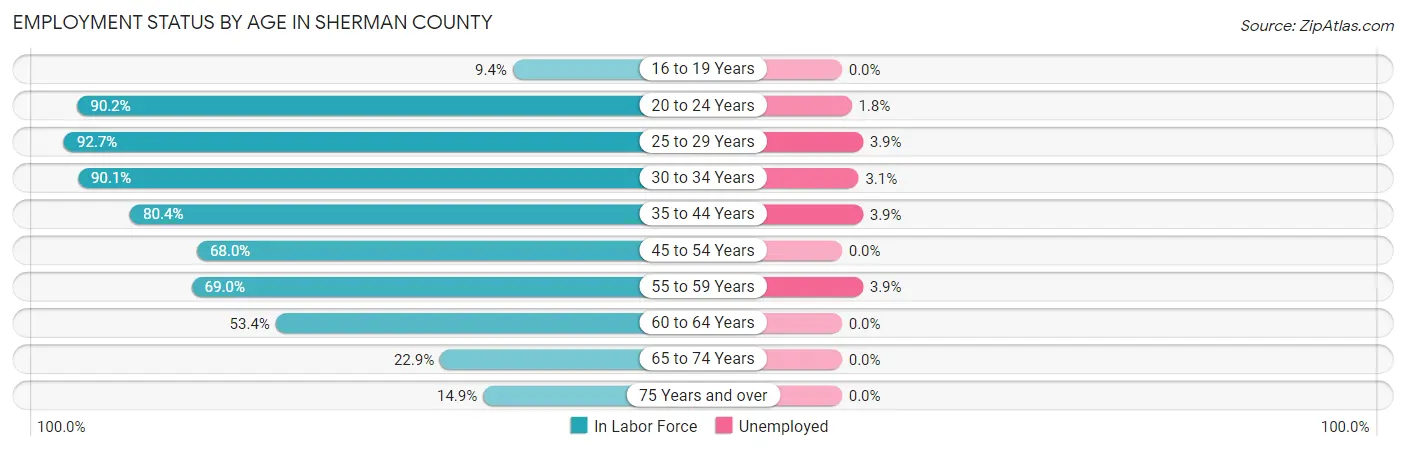
| Age Bracket | In Labor Force | Unemployed |
| 16 to 19 Years | 14 (9.4%) | 0 (0.0%) |
| 20 to 24 Years | 55 (90.2%) | 1 (1.8%) |
| 25 to 29 Years | 51 (92.7%) | 2 (3.9%) |
| 30 to 34 Years | 127 (90.1%) | 4 (3.1%) |
| 35 to 44 Years | 152 (80.4%) | 6 (3.9%) |
| 45 to 54 Years | 123 (68.0%) | 0 (0.0%) |
| 55 to 59 Years | 129 (69.0%) | 5 (3.9%) |
| 60 to 64 Years | 93 (53.4%) | 0 (0.0%) |
| 65 to 74 Years | 55 (22.9%) | 0 (0.0%) |
| 75 Years and over | 30 (14.9%) | 0 (0.0%) |
| Total | 828 (52.5%) | 18 (2.2%) |
Employment Status by Educational Attainment in Sherman County
According to labor force statistics for Sherman County, 72.8% of individuals (675) out of the total population between 25 and 64 years of age (927) are in the labor force, with 2.5% or 17 of them being unemployed. The group with the highest labor force participation rate are those with the educational attainment of bachelor's degree or higher, with 87.0% or 160 individuals in the labor force. Within the labor force, individuals with less than high school education have the highest percentage of unemployment, with 6.6% or 5 of them being unemployed.
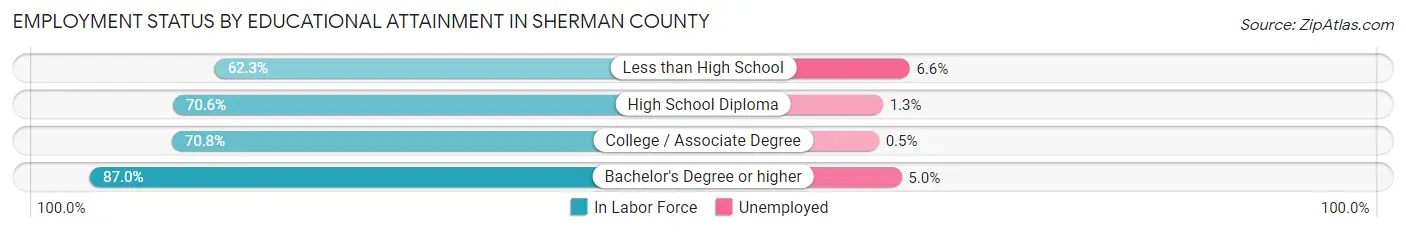
| Educational Attainment | In Labor Force | Unemployed |
| Less than High School | 76 (62.3%) | 8 (6.6%) |
| High School Diploma | 223 (70.6%) | 4 (1.3%) |
| College / Associate Degree | 216 (70.8%) | 2 (0.5%) |
| Bachelor's Degree or higher | 160 (87.0%) | 9 (5.0%) |
| Total | 675 (72.8%) | 23 (2.5%) |
Employment Occupations by Sex in Sherman County
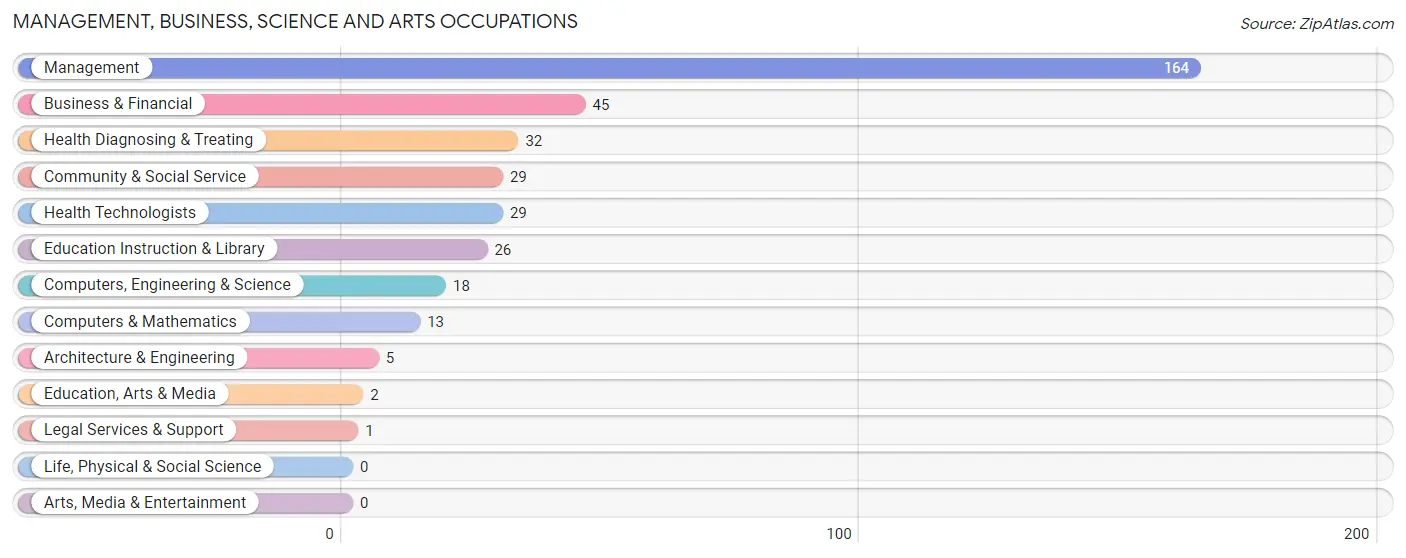
Management, Business, Science and Arts Occupations
The most common Management, Business, Science and Arts occupations in Sherman County are Management (164 | 20.2%), Business & Financial (45 | 5.6%), Health Diagnosing & Treating (32 | 4.0%), Community & Social Service (29 | 3.6%), and Health Technologists (29 | 3.6%).
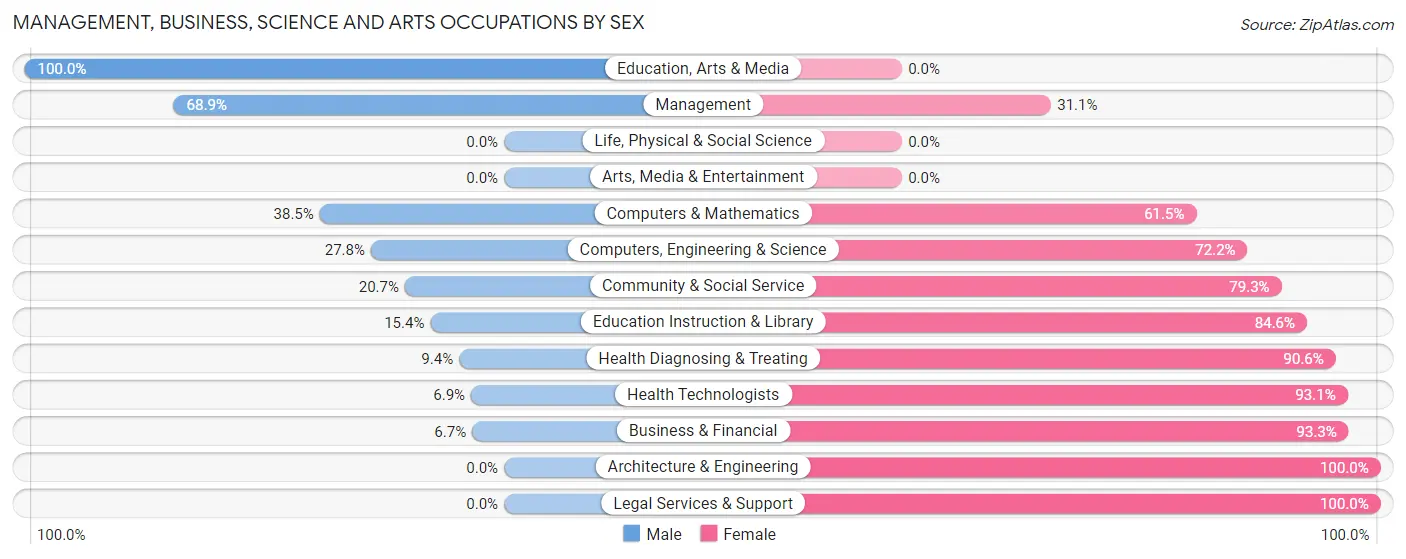
Management, Business, Science and Arts Occupations by Sex
Within the Management, Business, Science and Arts occupations in Sherman County, the most male-oriented occupations are Education, Arts & Media (100.0%), Management (68.9%), and Computers & Mathematics (38.5%), while the most female-oriented occupations are Architecture & Engineering (100.0%), Legal Services & Support (100.0%), and Business & Financial (93.3%).
| Occupation | Male | Female |
| Management | 113 (68.9%) | 51 (31.1%) |
| Business & Financial | 3 (6.7%) | 42 (93.3%) |
| Computers, Engineering & Science | 5 (27.8%) | 13 (72.2%) |
| Computers & Mathematics | 5 (38.5%) | 8 (61.5%) |
| Architecture & Engineering | 0 (0.0%) | 5 (100.0%) |
| Life, Physical & Social Science | 0 (0.0%) | 0 (0.0%) |
| Community & Social Service | 6 (20.7%) | 23 (79.3%) |
| Education, Arts & Media | 2 (100.0%) | 0 (0.0%) |
| Legal Services & Support | 0 (0.0%) | 1 (100.0%) |
| Education Instruction & Library | 4 (15.4%) | 22 (84.6%) |
| Arts, Media & Entertainment | 0 (0.0%) | 0 (0.0%) |
| Health Diagnosing & Treating | 3 (9.4%) | 29 (90.6%) |
| Health Technologists | 2 (6.9%) | 27 (93.1%) |
| Total (Category) | 130 (45.1%) | 158 (54.9%) |
| Total (Overall) | 489 (60.3%) | 322 (39.7%) |
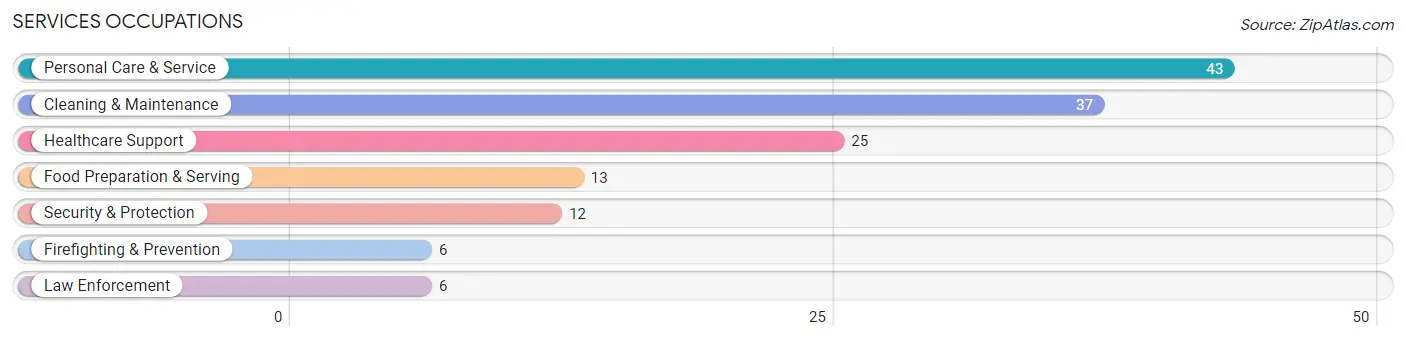
Services Occupations
The most common Services occupations in Sherman County are Personal Care & Service (43 | 5.3%), Cleaning & Maintenance (37 | 4.6%), Healthcare Support (25 | 3.1%), Food Preparation & Serving (13 | 1.6%), and Security & Protection (12 | 1.5%).
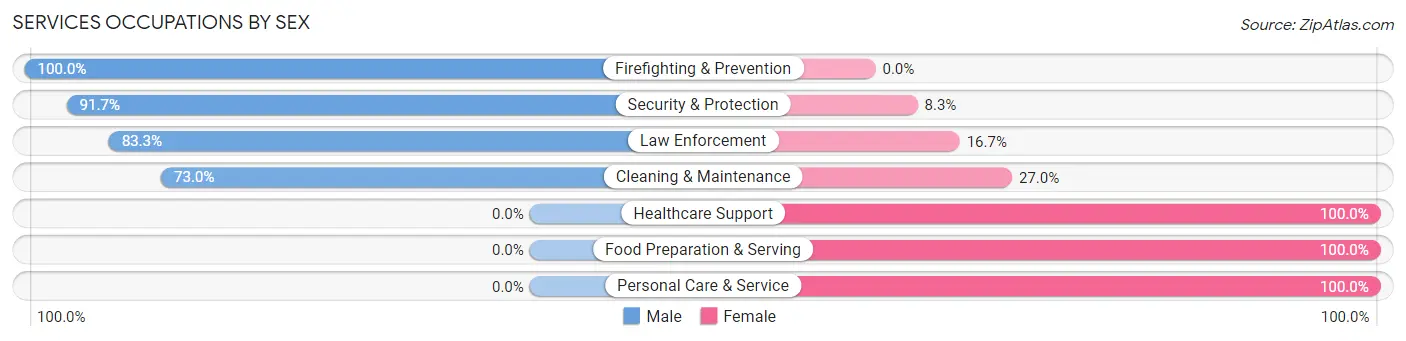
Services Occupations by Sex
Within the Services occupations in Sherman County, the most male-oriented occupations are Firefighting & Prevention (100.0%), Security & Protection (91.7%), and Law Enforcement (83.3%), while the most female-oriented occupations are Healthcare Support (100.0%), Food Preparation & Serving (100.0%), and Personal Care & Service (100.0%).
| Occupation | Male | Female |
| Healthcare Support | 0 (0.0%) | 25 (100.0%) |
| Security & Protection | 11 (91.7%) | 1 (8.3%) |
| Firefighting & Prevention | 6 (100.0%) | 0 (0.0%) |
| Law Enforcement | 5 (83.3%) | 1 (16.7%) |
| Food Preparation & Serving | 0 (0.0%) | 13 (100.0%) |
| Cleaning & Maintenance | 27 (73.0%) | 10 (27.0%) |
| Personal Care & Service | 0 (0.0%) | 43 (100.0%) |
| Total (Category) | 38 (29.2%) | 92 (70.8%) |
| Total (Overall) | 489 (60.3%) | 322 (39.7%) |
Sales and Office Occupations
The most common Sales and Office occupations in Sherman County are Sales & Related (57 | 7.0%), and Office & Administration (50 | 6.2%).

Sales and Office Occupations by Sex
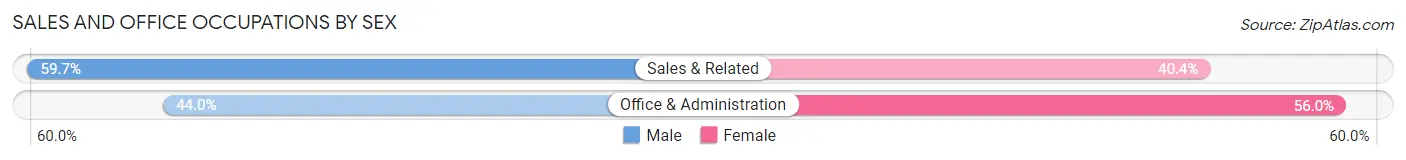
| Occupation | Male | Female |
| Sales & Related | 34 (59.7%) | 23 (40.4%) |
| Office & Administration | 22 (44.0%) | 28 (56.0%) |
| Total (Category) | 56 (52.3%) | 51 (47.7%) |
| Total (Overall) | 489 (60.3%) | 322 (39.7%) |
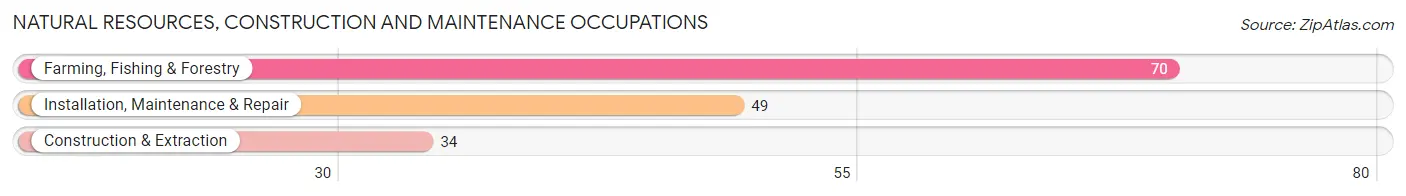
Natural Resources, Construction and Maintenance Occupations
The most common Natural Resources, Construction and Maintenance occupations in Sherman County are Farming, Fishing & Forestry (70 | 8.6%), Installation, Maintenance & Repair (49 | 6.0%), and Construction & Extraction (34 | 4.2%).
Natural Resources, Construction and Maintenance Occupations by Sex
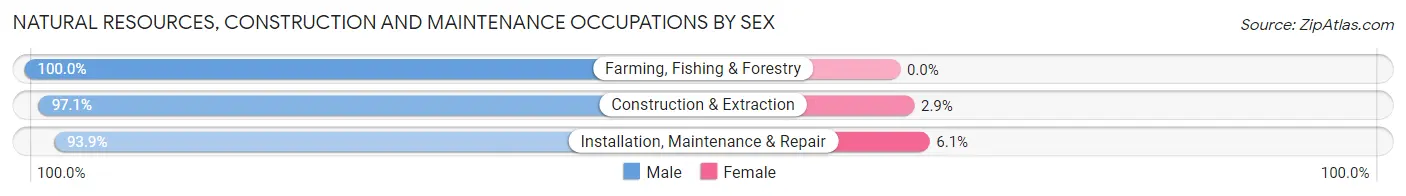
| Occupation | Male | Female |
| Farming, Fishing & Forestry | 70 (100.0%) | 0 (0.0%) |
| Construction & Extraction | 33 (97.1%) | 1 (2.9%) |
| Installation, Maintenance & Repair | 46 (93.9%) | 3 (6.1%) |
| Total (Category) | 149 (97.4%) | 4 (2.6%) |
| Total (Overall) | 489 (60.3%) | 322 (39.7%) |
Production, Transportation and Moving Occupations
The most common Production, Transportation and Moving occupations in Sherman County are Material Moving (56 | 6.9%), Transportation (49 | 6.0%), and Production (28 | 3.5%).
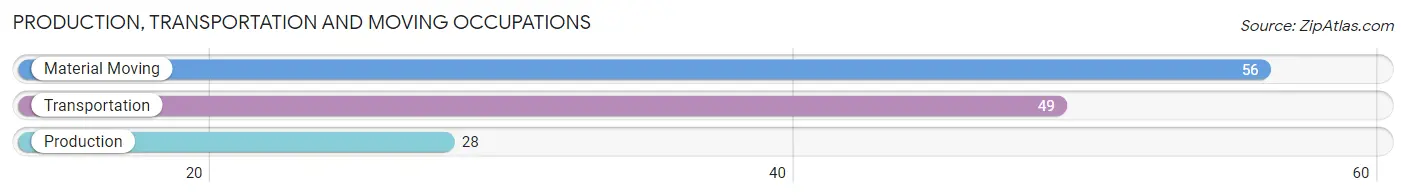
Production, Transportation and Moving Occupations by Sex
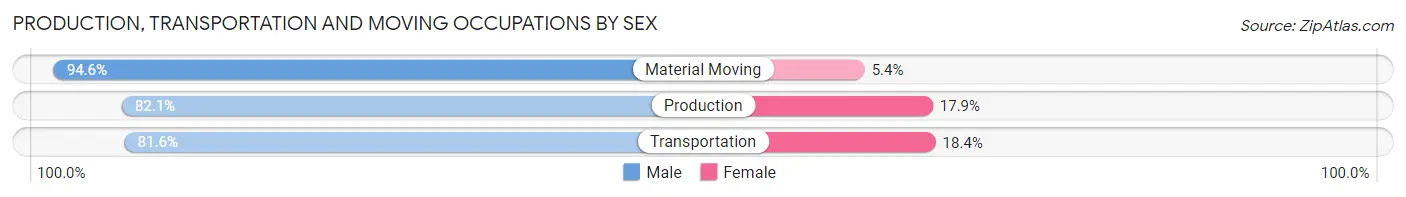
| Occupation | Male | Female |
| Production | 23 (82.1%) | 5 (17.9%) |
| Transportation | 40 (81.6%) | 9 (18.4%) |
| Material Moving | 53 (94.6%) | 3 (5.4%) |
| Total (Category) | 116 (87.2%) | 17 (12.8%) |
| Total (Overall) | 489 (60.3%) | 322 (39.7%) |
Employment Industries by Sex in Sherman County
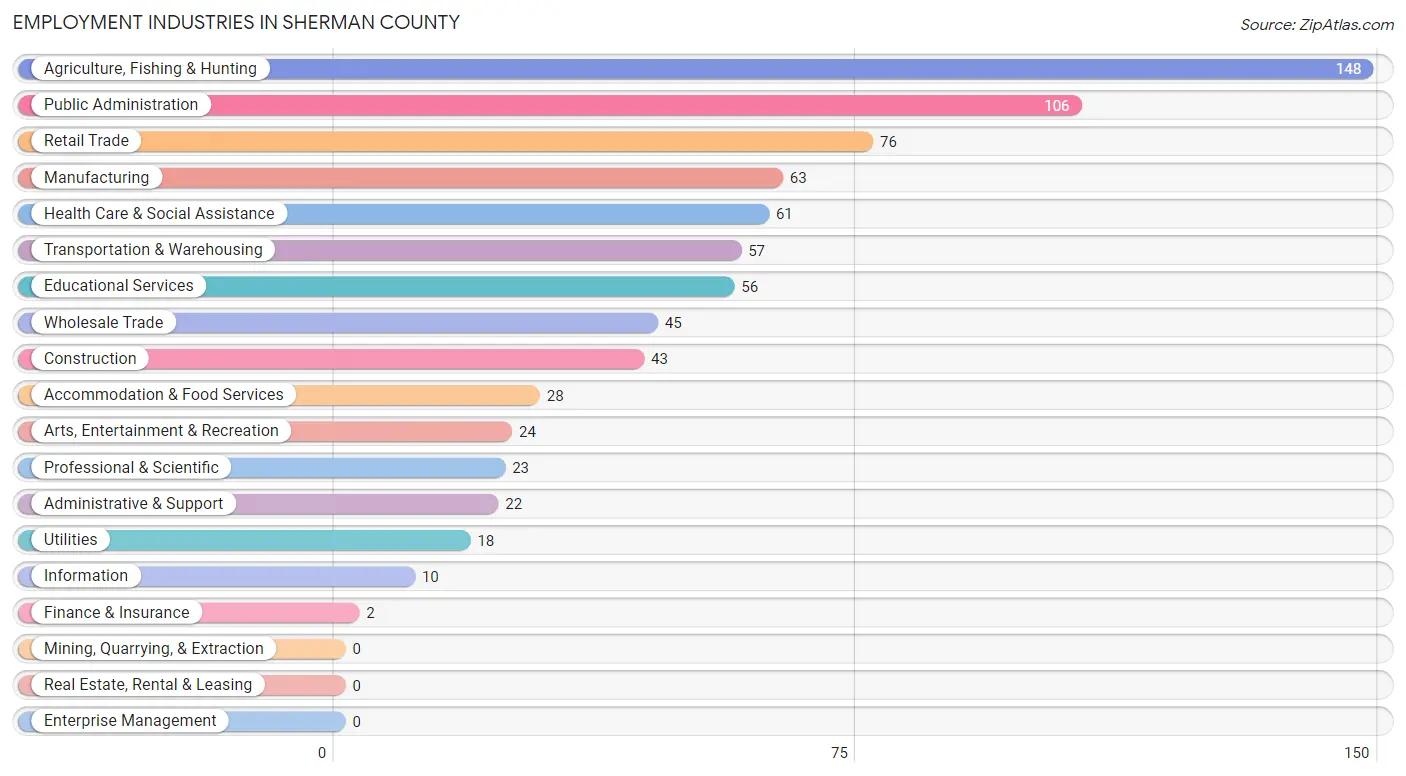
Employment Industries in Sherman County
The major employment industries in Sherman County include Agriculture, Fishing & Hunting (148 | 18.2%), Public Administration (106 | 13.1%), Retail Trade (76 | 9.4%), Manufacturing (63 | 7.8%), and Health Care & Social Assistance (61 | 7.5%).
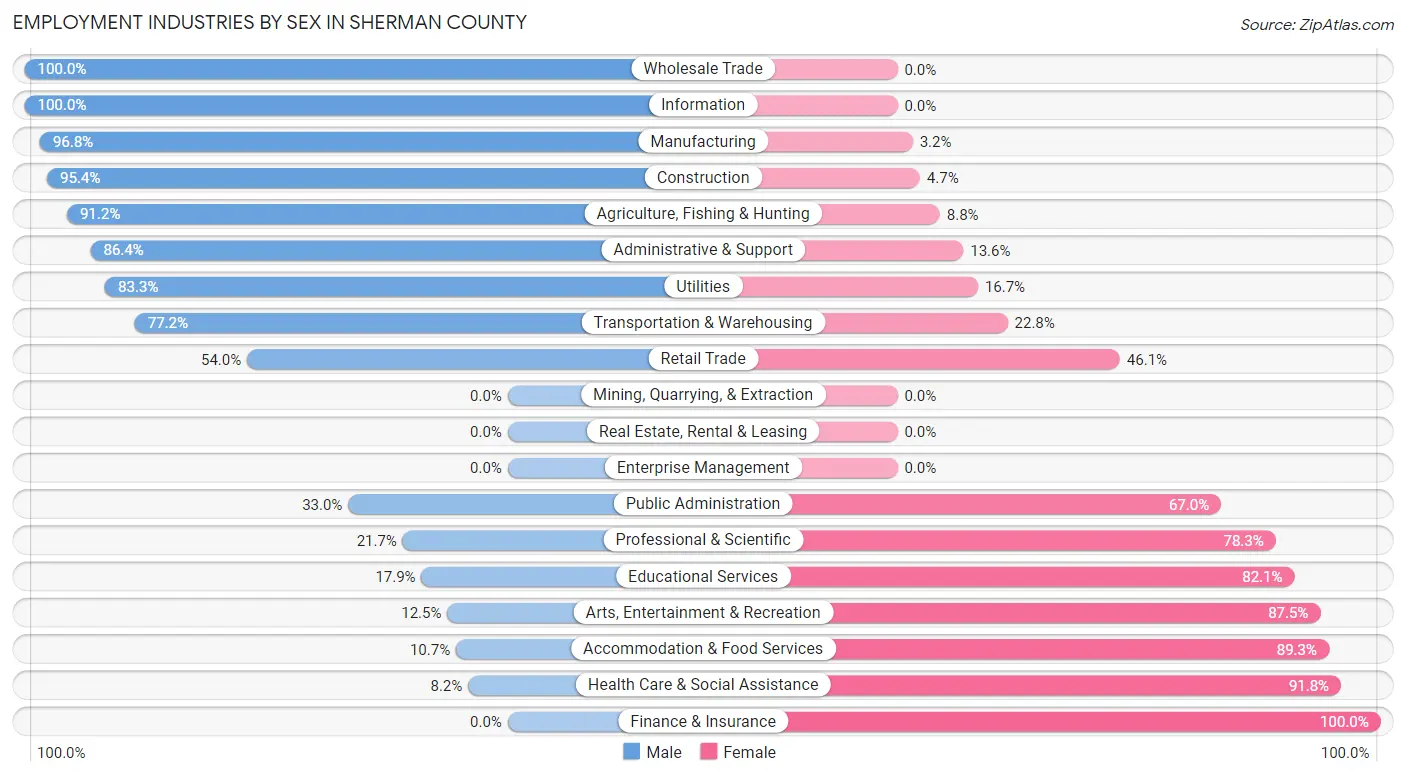
Employment Industries by Sex in Sherman County
The Sherman County industries that see more men than women are Wholesale Trade (100.0%), Information (100.0%), and Manufacturing (96.8%), whereas the industries that tend to have a higher number of women are Finance & Insurance (100.0%), Health Care & Social Assistance (91.8%), and Accommodation & Food Services (89.3%).
| Industry | Male | Female |
| Agriculture, Fishing & Hunting | 135 (91.2%) | 13 (8.8%) |
| Mining, Quarrying, & Extraction | 0 (0.0%) | 0 (0.0%) |
| Construction | 41 (95.4%) | 2 (4.6%) |
| Manufacturing | 61 (96.8%) | 2 (3.2%) |
| Wholesale Trade | 45 (100.0%) | 0 (0.0%) |
| Retail Trade | 41 (53.9%) | 35 (46.1%) |
| Transportation & Warehousing | 44 (77.2%) | 13 (22.8%) |
| Utilities | 15 (83.3%) | 3 (16.7%) |
| Information | 10 (100.0%) | 0 (0.0%) |
| Finance & Insurance | 0 (0.0%) | 2 (100.0%) |
| Real Estate, Rental & Leasing | 0 (0.0%) | 0 (0.0%) |
| Professional & Scientific | 5 (21.7%) | 18 (78.3%) |
| Enterprise Management | 0 (0.0%) | 0 (0.0%) |
| Administrative & Support | 19 (86.4%) | 3 (13.6%) |
| Educational Services | 10 (17.9%) | 46 (82.1%) |
| Health Care & Social Assistance | 5 (8.2%) | 56 (91.8%) |
| Arts, Entertainment & Recreation | 3 (12.5%) | 21 (87.5%) |
| Accommodation & Food Services | 3 (10.7%) | 25 (89.3%) |
| Public Administration | 35 (33.0%) | 71 (67.0%) |
| Total | 489 (60.3%) | 322 (39.7%) |
Education in Sherman County
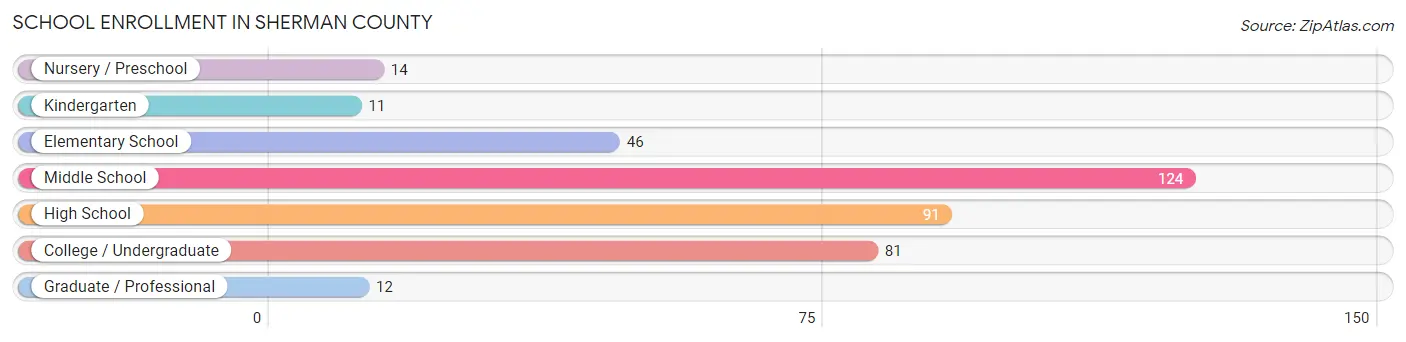
School Enrollment in Sherman County
The most common levels of schooling among the 379 students in Sherman County are middle school (124 | 32.7%), high school (91 | 24.0%), and college / undergraduate (81 | 21.4%).
| School Level | # Students | % Students |
| Nursery / Preschool | 14 | 3.7% |
| Kindergarten | 11 | 2.9% |
| Elementary School | 46 | 12.1% |
| Middle School | 124 | 32.7% |
| High School | 91 | 24.0% |
| College / Undergraduate | 81 | 21.4% |
| Graduate / Professional | 12 | 3.2% |
| Total | 379 | 100.0% |
School Enrollment by Age by Funding Source in Sherman County
Out of a total of 379 students who are enrolled in schools in Sherman County, 65 (17.2%) attend a private institution, while the remaining 314 (82.8%) are enrolled in public schools. The age group of 3 to 4 year olds has the highest likelihood of being enrolled in private schools, with 8 (72.7% in the age bracket) enrolled. Conversely, the age group of 25 to 34 year olds has the lowest likelihood of being enrolled in a private school, with 4 (100.0% in the age bracket) attending a public institution.
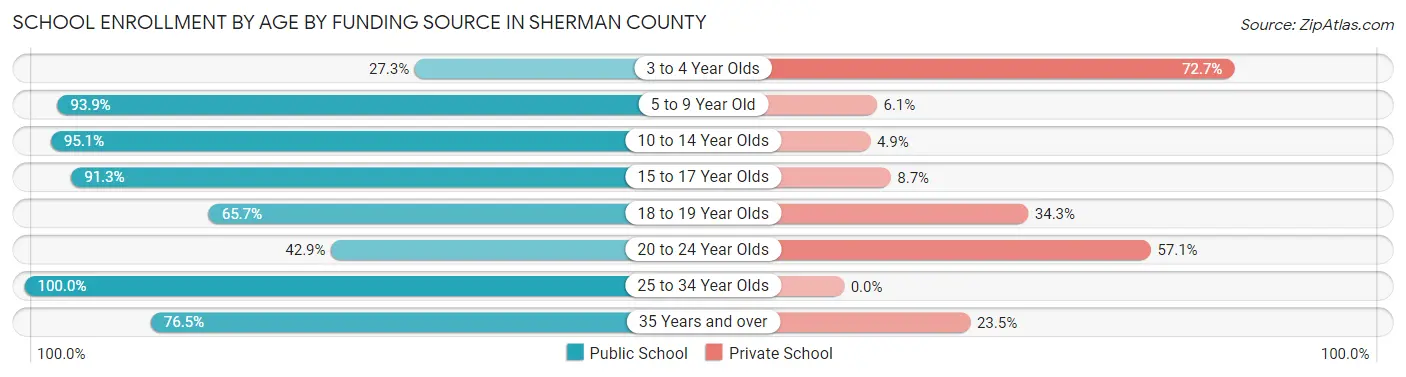
| Age Bracket | Public School | Private School |
| 3 to 4 Year Olds | 3 (27.3%) | 8 (72.7%) |
| 5 to 9 Year Old | 46 (93.9%) | 3 (6.1%) |
| 10 to 14 Year Olds | 136 (95.1%) | 7 (4.9%) |
| 15 to 17 Year Olds | 42 (91.3%) | 4 (8.7%) |
| 18 to 19 Year Olds | 67 (65.7%) | 35 (34.3%) |
| 20 to 24 Year Olds | 3 (42.9%) | 4 (57.1%) |
| 25 to 34 Year Olds | 4 (100.0%) | 0 (0.0%) |
| 35 Years and over | 13 (76.5%) | 4 (23.5%) |
| Total | 314 (82.8%) | 65 (17.2%) |
Educational Attainment by Field of Study in Sherman County
Business (62 | 26.4%), bio, nature & agricultural (48 | 20.4%), education (38 | 16.2%), communications (13 | 5.5%), and physical & health sciences (12 | 5.1%) are the most common fields of study among 235 individuals in Sherman County who have obtained a bachelor's degree or higher.
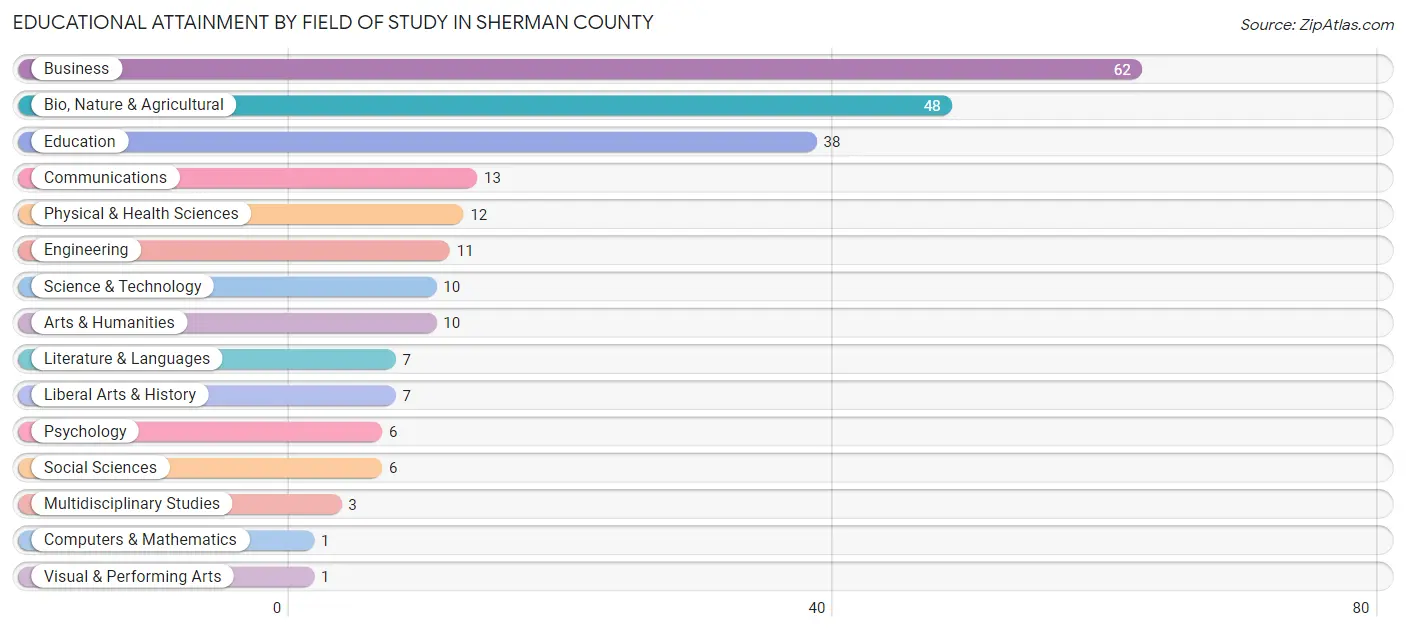
| Field of Study | # Graduates | % Graduates |
| Computers & Mathematics | 1 | 0.4% |
| Bio, Nature & Agricultural | 48 | 20.4% |
| Physical & Health Sciences | 12 | 5.1% |
| Psychology | 6 | 2.5% |
| Social Sciences | 6 | 2.5% |
| Engineering | 11 | 4.7% |
| Multidisciplinary Studies | 3 | 1.3% |
| Science & Technology | 10 | 4.3% |
| Business | 62 | 26.4% |
| Education | 38 | 16.2% |
| Literature & Languages | 7 | 3.0% |
| Liberal Arts & History | 7 | 3.0% |
| Visual & Performing Arts | 1 | 0.4% |
| Communications | 13 | 5.5% |
| Arts & Humanities | 10 | 4.3% |
| Total | 235 | 100.0% |
Transportation & Commute in Sherman County
Vehicle Availability by Sex in Sherman County
The most prevalent vehicle ownership categories in Sherman County are males with 3 vehicles (161, accounting for 34.7%) and females with 3 vehicles (111, making up 50.9%).
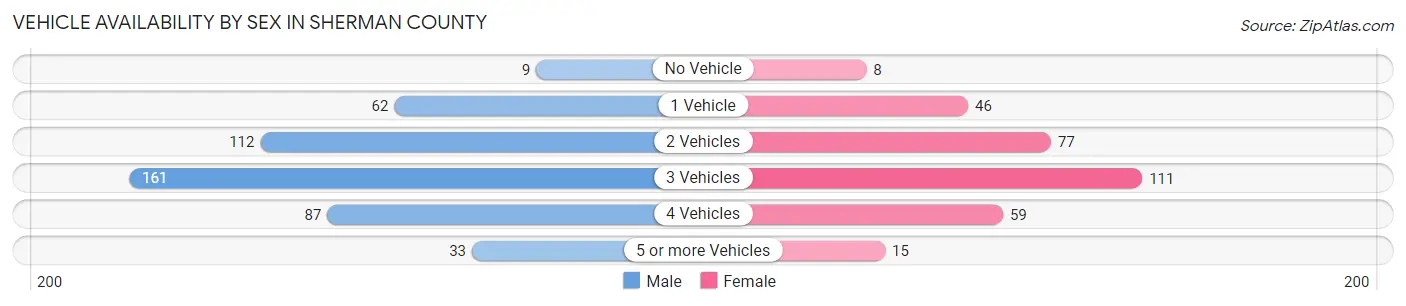
| Vehicles Available | Male | Female |
| No Vehicle | 9 (1.9%) | 8 (2.5%) |
| 1 Vehicle | 62 (13.4%) | 46 (14.6%) |
| 2 Vehicles | 112 (24.1%) | 77 (24.4%) |
| 3 Vehicles | 161 (34.7%) | 111 (35.1%) |
| 4 Vehicles | 87 (18.8%) | 59 (18.7%) |
| 5 or more Vehicles | 33 (7.1%) | 15 (4.8%) |
| Total | 464 (100.0%) | 316 (100.0%) |
Commute Time in Sherman County
The most frequently occuring commute durations in Sherman County are 5 to 9 minutes (155 commuters, 21.9%), 20 to 24 minutes (121 commuters, 17.1%), and 15 to 19 minutes (91 commuters, 12.8%).
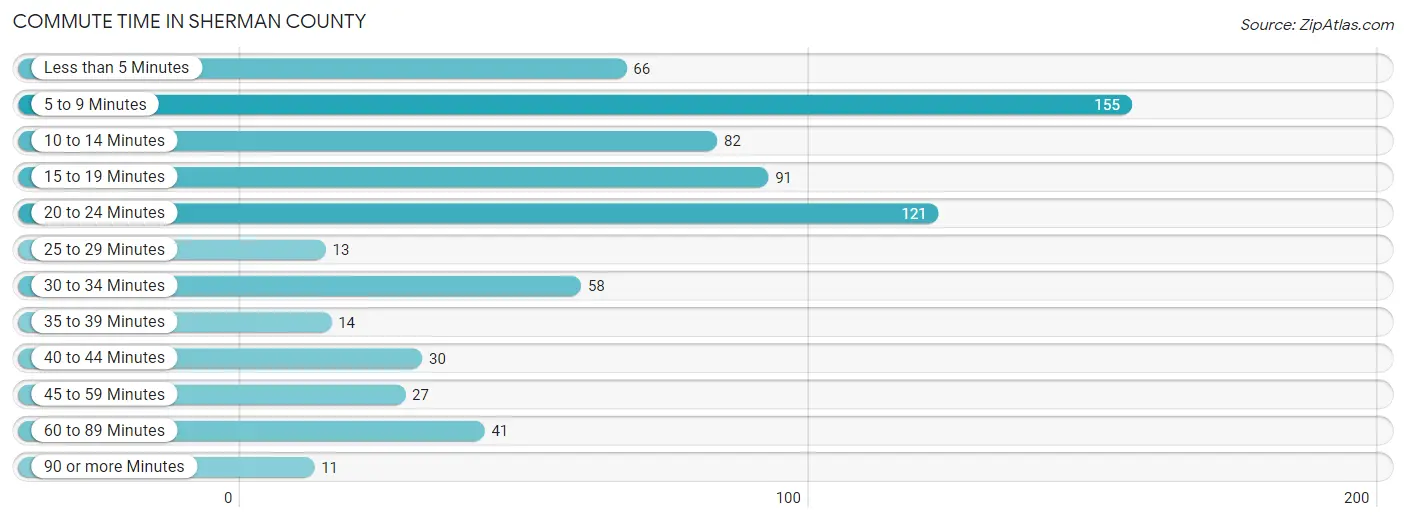
| Commute Time | # Commuters | % Commuters |
| Less than 5 Minutes | 66 | 9.3% |
| 5 to 9 Minutes | 155 | 21.9% |
| 10 to 14 Minutes | 82 | 11.6% |
| 15 to 19 Minutes | 91 | 12.8% |
| 20 to 24 Minutes | 121 | 17.1% |
| 25 to 29 Minutes | 13 | 1.8% |
| 30 to 34 Minutes | 58 | 8.2% |
| 35 to 39 Minutes | 14 | 2.0% |
| 40 to 44 Minutes | 30 | 4.2% |
| 45 to 59 Minutes | 27 | 3.8% |
| 60 to 89 Minutes | 41 | 5.8% |
| 90 or more Minutes | 11 | 1.5% |
Commute Time by Sex in Sherman County
The most common commute times in Sherman County are 5 to 9 minutes (124 commuters, 27.6%) for males and 10 to 14 minutes (48 commuters, 18.5%) for females.
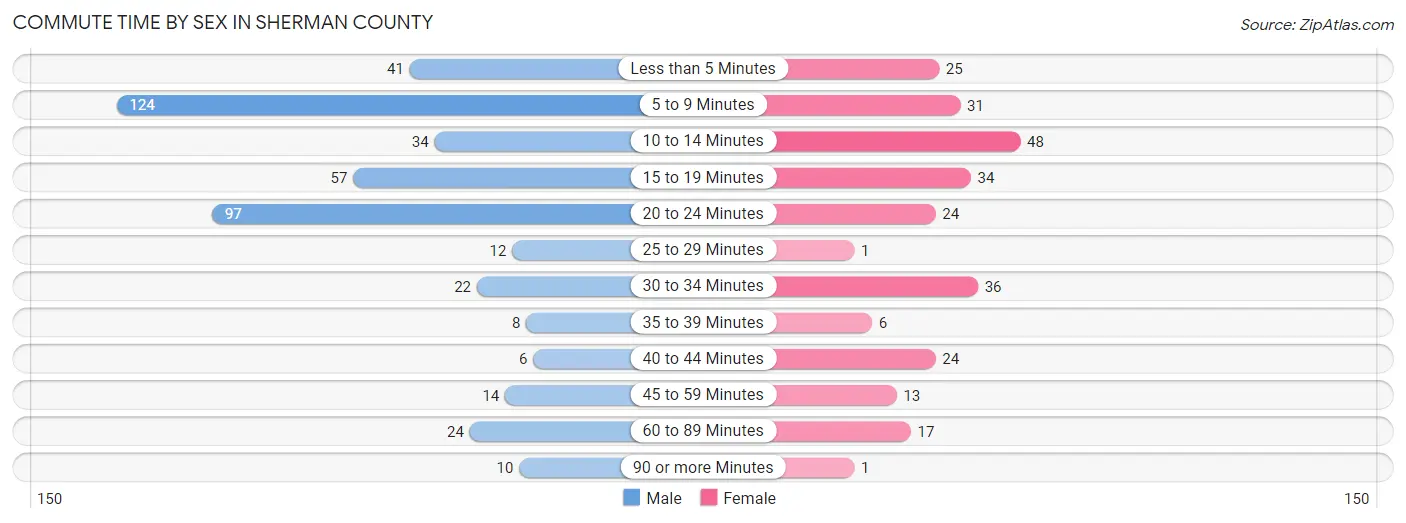
| Commute Time | Male | Female |
| Less than 5 Minutes | 41 (9.1%) | 25 (9.6%) |
| 5 to 9 Minutes | 124 (27.6%) | 31 (11.9%) |
| 10 to 14 Minutes | 34 (7.6%) | 48 (18.5%) |
| 15 to 19 Minutes | 57 (12.7%) | 34 (13.1%) |
| 20 to 24 Minutes | 97 (21.6%) | 24 (9.2%) |
| 25 to 29 Minutes | 12 (2.7%) | 1 (0.4%) |
| 30 to 34 Minutes | 22 (4.9%) | 36 (13.9%) |
| 35 to 39 Minutes | 8 (1.8%) | 6 (2.3%) |
| 40 to 44 Minutes | 6 (1.3%) | 24 (9.2%) |
| 45 to 59 Minutes | 14 (3.1%) | 13 (5.0%) |
| 60 to 89 Minutes | 24 (5.3%) | 17 (6.5%) |
| 90 or more Minutes | 10 (2.2%) | 1 (0.4%) |
Time of Departure to Work by Sex in Sherman County
The most frequent times of departure to work in Sherman County are 7:30 AM to 7:59 AM (74, 16.5%) for males and 7:30 AM to 7:59 AM (48, 18.5%) for females.
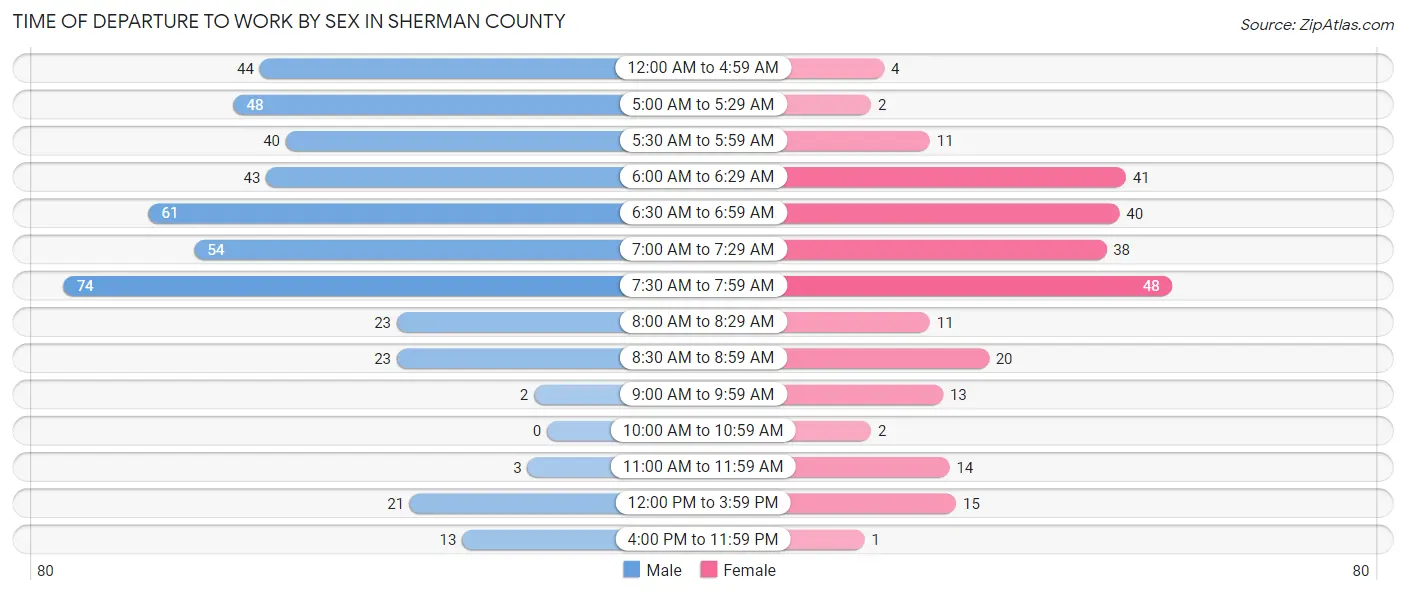
| Time of Departure | Male | Female |
| 12:00 AM to 4:59 AM | 44 (9.8%) | 4 (1.5%) |
| 5:00 AM to 5:29 AM | 48 (10.7%) | 2 (0.8%) |
| 5:30 AM to 5:59 AM | 40 (8.9%) | 11 (4.2%) |
| 6:00 AM to 6:29 AM | 43 (9.6%) | 41 (15.8%) |
| 6:30 AM to 6:59 AM | 61 (13.6%) | 40 (15.4%) |
| 7:00 AM to 7:29 AM | 54 (12.0%) | 38 (14.6%) |
| 7:30 AM to 7:59 AM | 74 (16.5%) | 48 (18.5%) |
| 8:00 AM to 8:29 AM | 23 (5.1%) | 11 (4.2%) |
| 8:30 AM to 8:59 AM | 23 (5.1%) | 20 (7.7%) |
| 9:00 AM to 9:59 AM | 2 (0.4%) | 13 (5.0%) |
| 10:00 AM to 10:59 AM | 0 (0.0%) | 2 (0.8%) |
| 11:00 AM to 11:59 AM | 3 (0.7%) | 14 (5.4%) |
| 12:00 PM to 3:59 PM | 21 (4.7%) | 15 (5.8%) |
| 4:00 PM to 11:59 PM | 13 (2.9%) | 1 (0.4%) |
| Total | 449 (100.0%) | 260 (100.0%) |
Housing Occupancy in Sherman County
Occupancy by Ownership in Sherman County
Of the total 770 dwellings in Sherman County, owner-occupied units account for 539 (70.0%), while renter-occupied units make up 231 (30.0%).
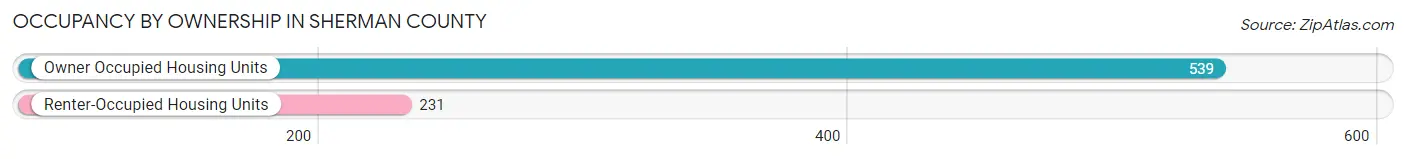
| Occupancy | # Housing Units | % Housing Units |
| Owner Occupied Housing Units | 539 | 70.0% |
| Renter-Occupied Housing Units | 231 | 30.0% |
| Total Occupied Housing Units | 770 | 100.0% |
Occupancy by Household Size in Sherman County
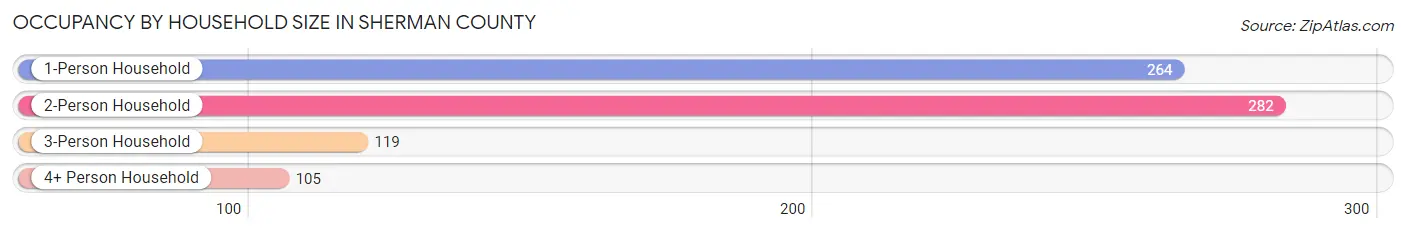
| Household Size | # Housing Units | % Housing Units |
| 1-Person Household | 264 | 34.3% |
| 2-Person Household | 282 | 36.6% |
| 3-Person Household | 119 | 15.4% |
| 4+ Person Household | 105 | 13.6% |
| Total Housing Units | 770 | 100.0% |
Occupancy by Ownership by Household Size in Sherman County
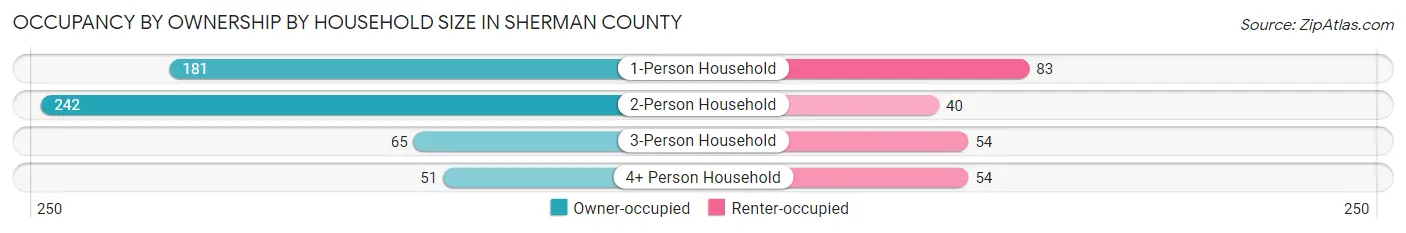
| Household Size | Owner-occupied | Renter-occupied |
| 1-Person Household | 181 (68.6%) | 83 (31.4%) |
| 2-Person Household | 242 (85.8%) | 40 (14.2%) |
| 3-Person Household | 65 (54.6%) | 54 (45.4%) |
| 4+ Person Household | 51 (48.6%) | 54 (51.4%) |
| Total Housing Units | 539 (70.0%) | 231 (30.0%) |
Occupancy by Educational Attainment in Sherman County
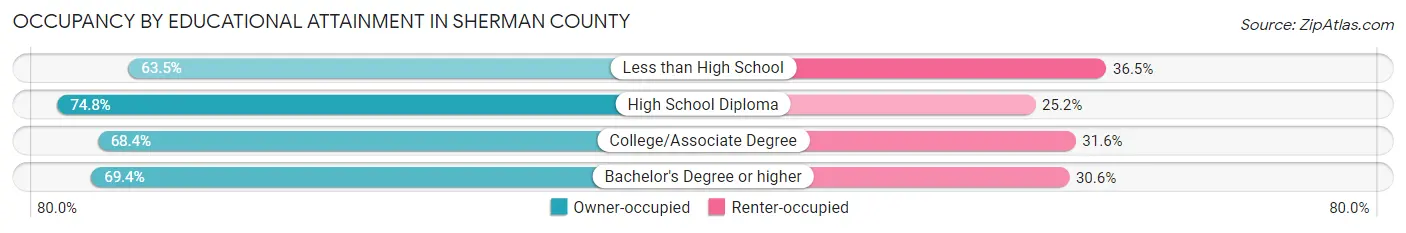
| Household Size | Owner-occupied | Renter-occupied |
| Less than High School | 54 (63.5%) | 31 (36.5%) |
| High School Diploma | 178 (74.8%) | 60 (25.2%) |
| College/Associate Degree | 223 (68.4%) | 103 (31.6%) |
| Bachelor's Degree or higher | 84 (69.4%) | 37 (30.6%) |
Occupancy by Age of Householder in Sherman County
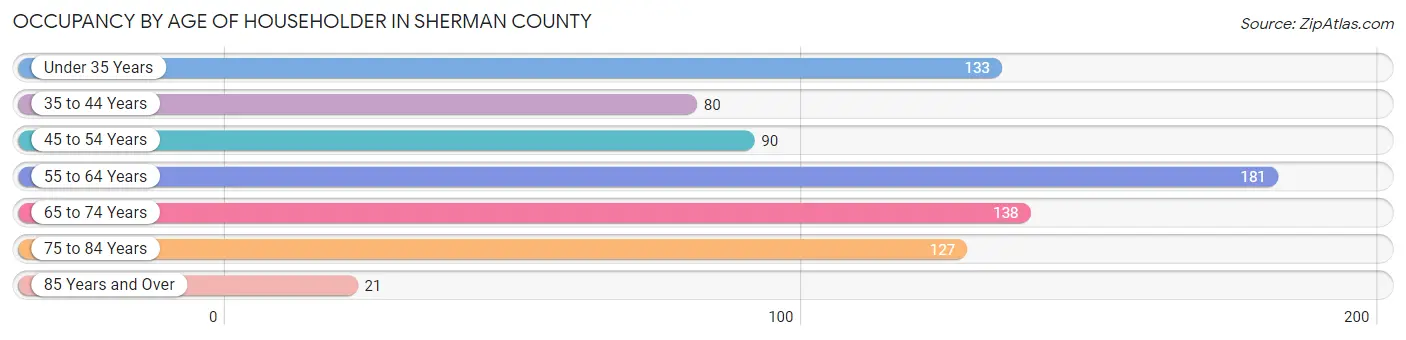
| Age Bracket | # Households | % Households |
| Under 35 Years | 133 | 17.3% |
| 35 to 44 Years | 80 | 10.4% |
| 45 to 54 Years | 90 | 11.7% |
| 55 to 64 Years | 181 | 23.5% |
| 65 to 74 Years | 138 | 17.9% |
| 75 to 84 Years | 127 | 16.5% |
| 85 Years and Over | 21 | 2.7% |
| Total | 770 | 100.0% |
Housing Finances in Sherman County
Median Income by Occupancy in Sherman County
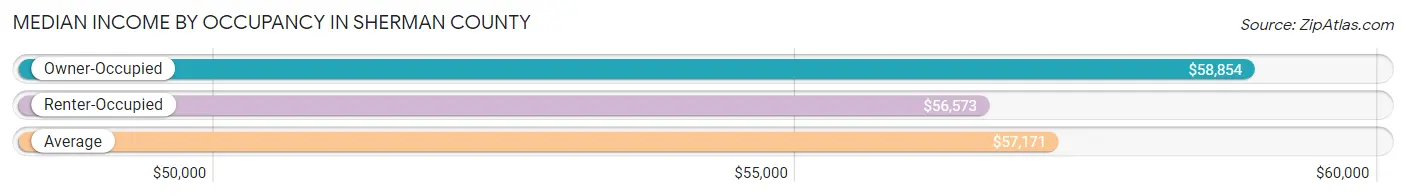
| Occupancy Type | # Households | Median Income |
| Owner-Occupied | 539 (70.0%) | $58,854 |
| Renter-Occupied | 231 (30.0%) | $56,573 |
| Average | 770 (100.0%) | $57,171 |
Occupancy by Householder Income Bracket in Sherman County
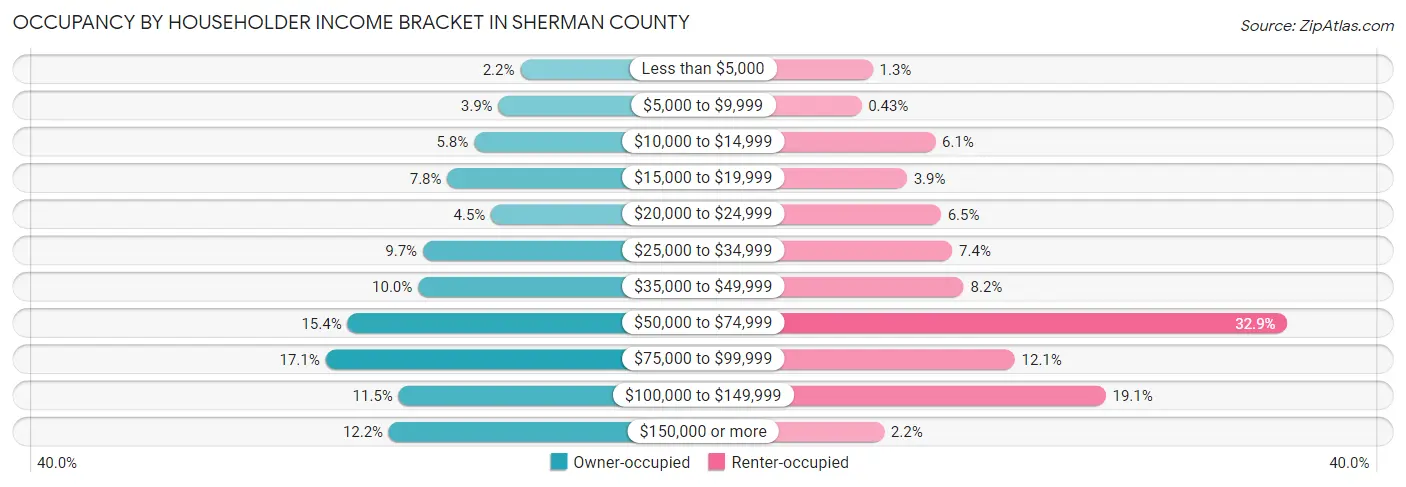
| Income Bracket | Owner-occupied | Renter-occupied |
| Less than $5,000 | 12 (2.2%) | 3 (1.3%) |
| $5,000 to $9,999 | 21 (3.9%) | 1 (0.4%) |
| $10,000 to $14,999 | 31 (5.8%) | 14 (6.1%) |
| $15,000 to $19,999 | 42 (7.8%) | 9 (3.9%) |
| $20,000 to $24,999 | 24 (4.4%) | 15 (6.5%) |
| $25,000 to $34,999 | 52 (9.7%) | 17 (7.4%) |
| $35,000 to $49,999 | 54 (10.0%) | 19 (8.2%) |
| $50,000 to $74,999 | 83 (15.4%) | 76 (32.9%) |
| $75,000 to $99,999 | 92 (17.1%) | 28 (12.1%) |
| $100,000 to $149,999 | 62 (11.5%) | 44 (19.1%) |
| $150,000 or more | 66 (12.2%) | 5 (2.2%) |
| Total | 539 (100.0%) | 231 (100.0%) |
Monthly Housing Cost Tiers in Sherman County
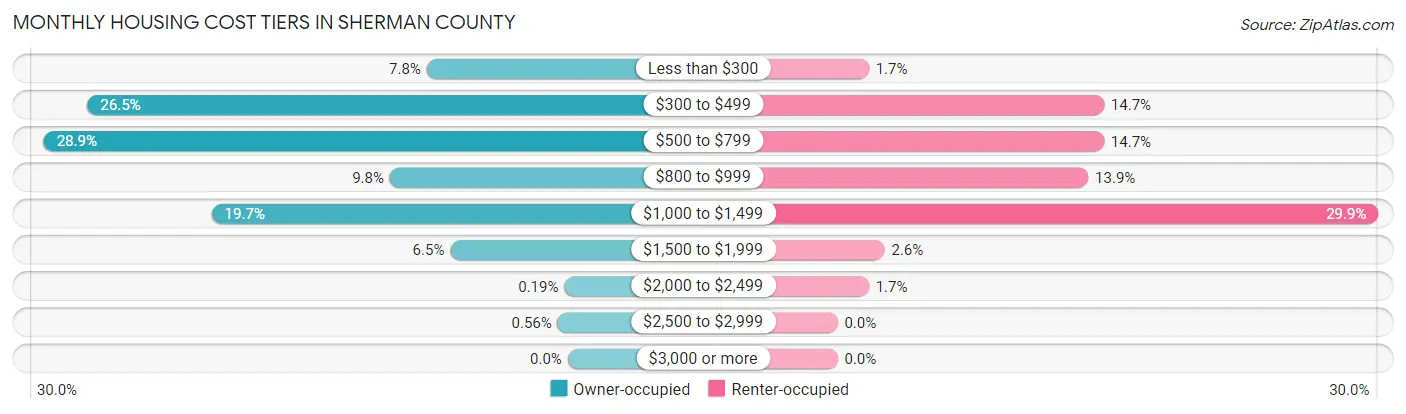
| Monthly Cost | Owner-occupied | Renter-occupied |
| Less than $300 | 42 (7.8%) | 4 (1.7%) |
| $300 to $499 | 143 (26.5%) | 34 (14.7%) |
| $500 to $799 | 156 (28.9%) | 34 (14.7%) |
| $800 to $999 | 53 (9.8%) | 32 (13.9%) |
| $1,000 to $1,499 | 106 (19.7%) | 69 (29.9%) |
| $1,500 to $1,999 | 35 (6.5%) | 6 (2.6%) |
| $2,000 to $2,499 | 1 (0.2%) | 4 (1.7%) |
| $2,500 to $2,999 | 3 (0.6%) | 0 (0.0%) |
| $3,000 or more | 0 (0.0%) | 0 (0.0%) |
| Total | 539 (100.0%) | 231 (100.0%) |
Physical Housing Characteristics in Sherman County
Housing Structures in Sherman County
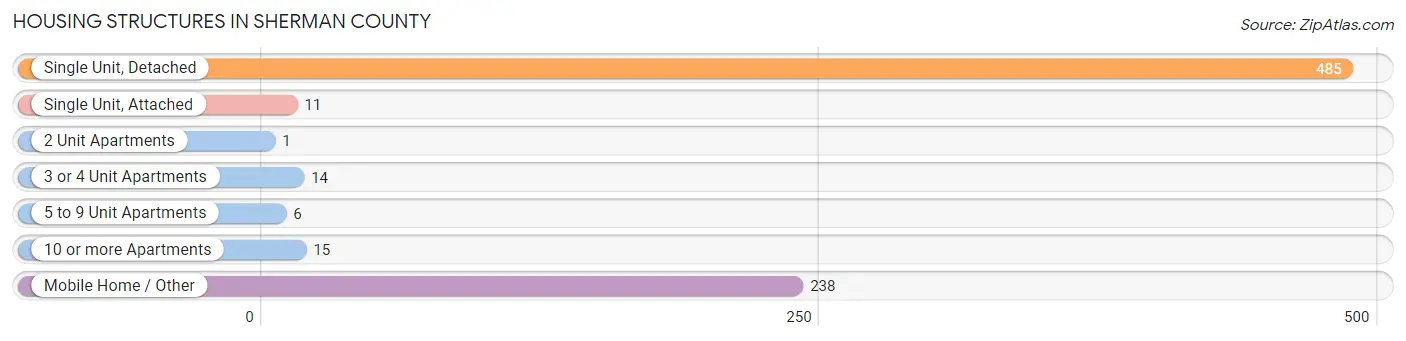
| Structure Type | # Housing Units | % Housing Units |
| Single Unit, Detached | 485 | 63.0% |
| Single Unit, Attached | 11 | 1.4% |
| 2 Unit Apartments | 1 | 0.1% |
| 3 or 4 Unit Apartments | 14 | 1.8% |
| 5 to 9 Unit Apartments | 6 | 0.8% |
| 10 or more Apartments | 15 | 1.9% |
| Mobile Home / Other | 238 | 30.9% |
| Total | 770 | 100.0% |
Housing Structures by Occupancy in Sherman County
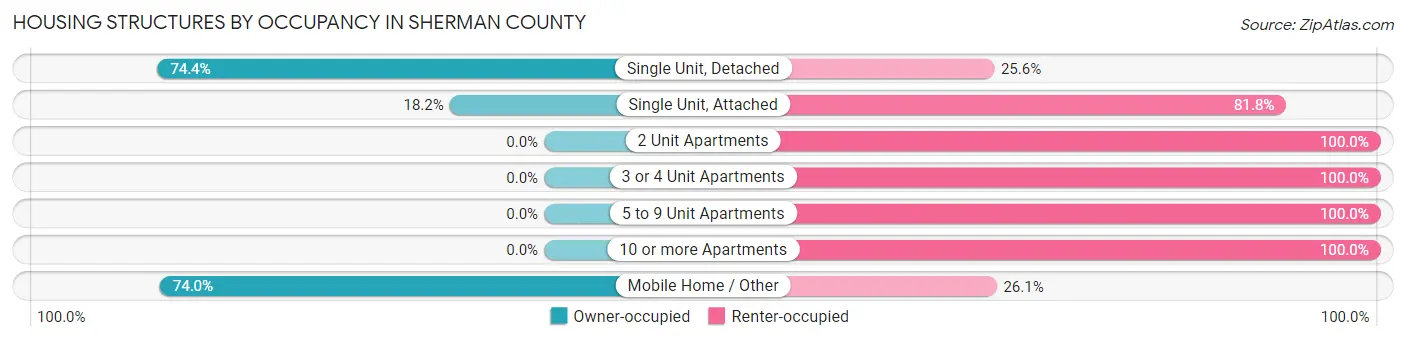
| Structure Type | Owner-occupied | Renter-occupied |
| Single Unit, Detached | 361 (74.4%) | 124 (25.6%) |
| Single Unit, Attached | 2 (18.2%) | 9 (81.8%) |
| 2 Unit Apartments | 0 (0.0%) | 1 (100.0%) |
| 3 or 4 Unit Apartments | 0 (0.0%) | 14 (100.0%) |
| 5 to 9 Unit Apartments | 0 (0.0%) | 6 (100.0%) |
| 10 or more Apartments | 0 (0.0%) | 15 (100.0%) |
| Mobile Home / Other | 176 (74.0%) | 62 (26.1%) |
| Total | 539 (70.0%) | 231 (30.0%) |
Housing Structures by Number of Rooms in Sherman County
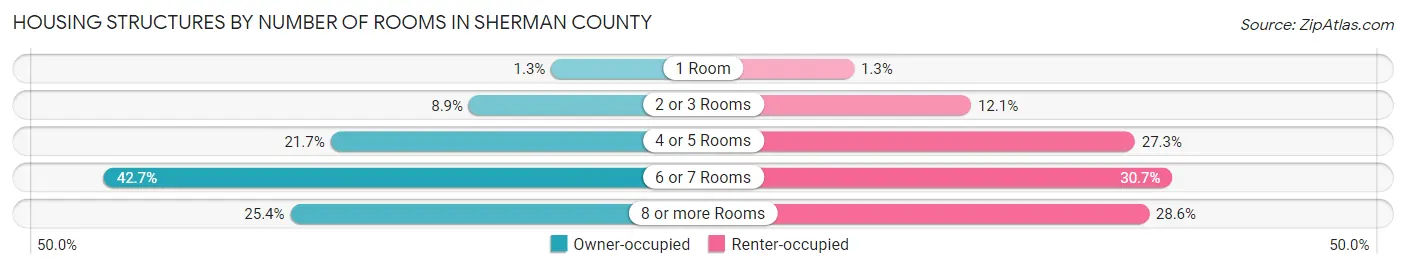
| Number of Rooms | Owner-occupied | Renter-occupied |
| 1 Room | 7 (1.3%) | 3 (1.3%) |
| 2 or 3 Rooms | 48 (8.9%) | 28 (12.1%) |
| 4 or 5 Rooms | 117 (21.7%) | 63 (27.3%) |
| 6 or 7 Rooms | 230 (42.7%) | 71 (30.7%) |
| 8 or more Rooms | 137 (25.4%) | 66 (28.6%) |
| Total | 539 (100.0%) | 231 (100.0%) |
Housing Structure by Heating Type in Sherman County
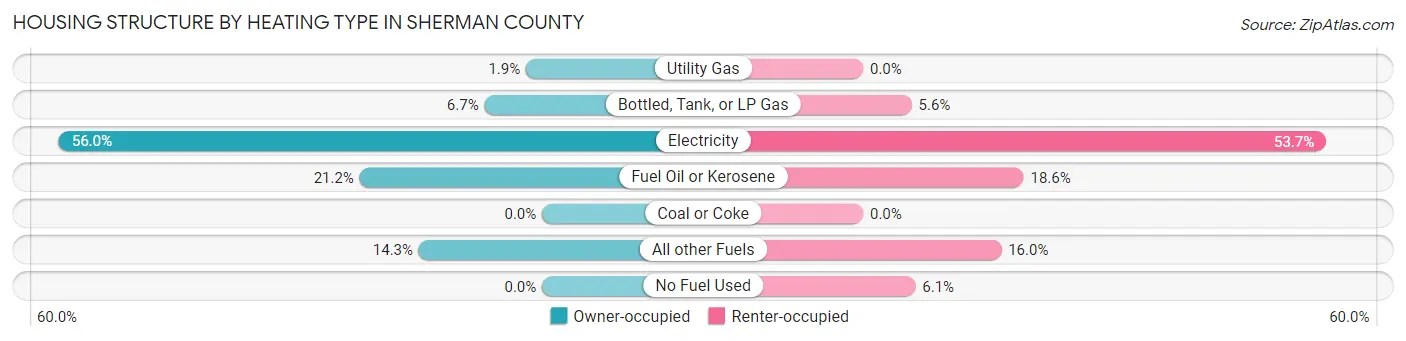
| Heating Type | Owner-occupied | Renter-occupied |
| Utility Gas | 10 (1.9%) | 0 (0.0%) |
| Bottled, Tank, or LP Gas | 36 (6.7%) | 13 (5.6%) |
| Electricity | 302 (56.0%) | 124 (53.7%) |
| Fuel Oil or Kerosene | 114 (21.1%) | 43 (18.6%) |
| Coal or Coke | 0 (0.0%) | 0 (0.0%) |
| All other Fuels | 77 (14.3%) | 37 (16.0%) |
| No Fuel Used | 0 (0.0%) | 14 (6.1%) |
| Total | 539 (100.0%) | 231 (100.0%) |
Household Vehicle Usage in Sherman County
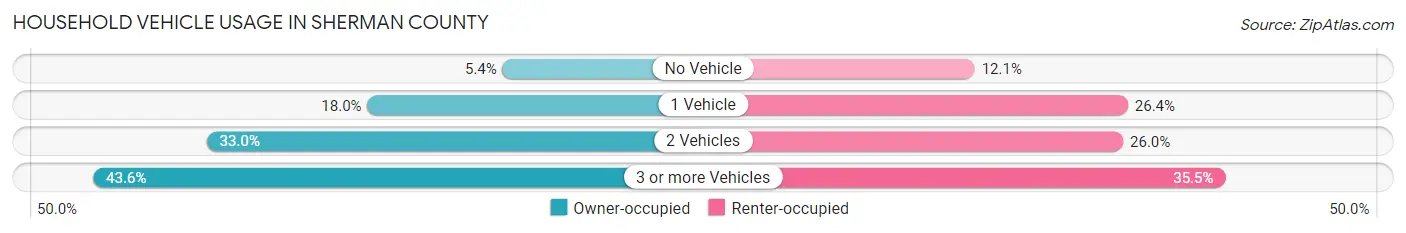
| Vehicles per Household | Owner-occupied | Renter-occupied |
| No Vehicle | 29 (5.4%) | 28 (12.1%) |
| 1 Vehicle | 97 (18.0%) | 61 (26.4%) |
| 2 Vehicles | 178 (33.0%) | 60 (26.0%) |
| 3 or more Vehicles | 235 (43.6%) | 82 (35.5%) |
| Total | 539 (100.0%) | 231 (100.0%) |
Real Estate & Mortgages in Sherman County
Real Estate and Mortgage Overview in Sherman County
| Characteristic | Without Mortgage | With Mortgage |
| Housing Units | 380 | 159 |
| Median Property Value | $169,400 | $207,700 |
| Median Household Income | $53,571 | $19 |
| Monthly Housing Costs | $509 | $0 |
| Real Estate Taxes | $1,404 | $1 |
Property Value by Mortgage Status in Sherman County
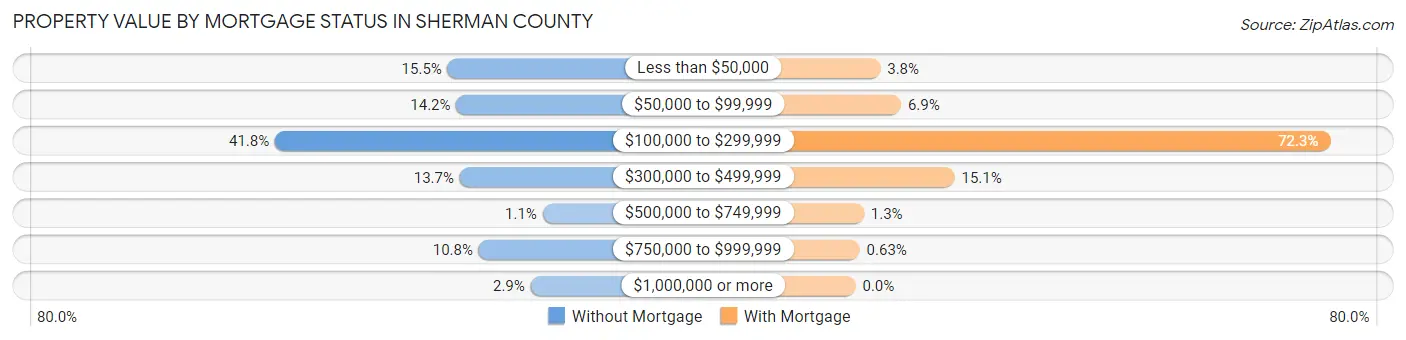
| Property Value | Without Mortgage | With Mortgage |
| Less than $50,000 | 59 (15.5%) | 6 (3.8%) |
| $50,000 to $99,999 | 54 (14.2%) | 11 (6.9%) |
| $100,000 to $299,999 | 159 (41.8%) | 115 (72.3%) |
| $300,000 to $499,999 | 52 (13.7%) | 24 (15.1%) |
| $500,000 to $749,999 | 4 (1.1%) | 2 (1.3%) |
| $750,000 to $999,999 | 41 (10.8%) | 1 (0.6%) |
| $1,000,000 or more | 11 (2.9%) | 0 (0.0%) |
| Total | 380 (100.0%) | 159 (100.0%) |
Household Income by Mortgage Status in Sherman County
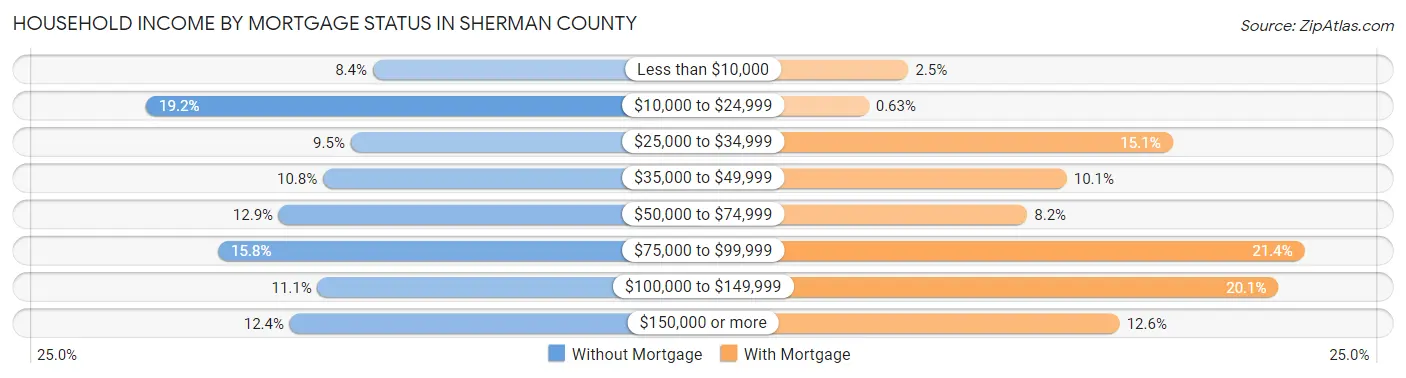
| Household Income | Without Mortgage | With Mortgage |
| Less than $10,000 | 32 (8.4%) | 4 (2.5%) |
| $10,000 to $24,999 | 73 (19.2%) | 1 (0.6%) |
| $25,000 to $34,999 | 36 (9.5%) | 24 (15.1%) |
| $35,000 to $49,999 | 41 (10.8%) | 16 (10.1%) |
| $50,000 to $74,999 | 49 (12.9%) | 13 (8.2%) |
| $75,000 to $99,999 | 60 (15.8%) | 34 (21.4%) |
| $100,000 to $149,999 | 42 (11.1%) | 32 (20.1%) |
| $150,000 or more | 47 (12.4%) | 20 (12.6%) |
| Total | 380 (100.0%) | 159 (100.0%) |
Property Value to Household Income Ratio in Sherman County
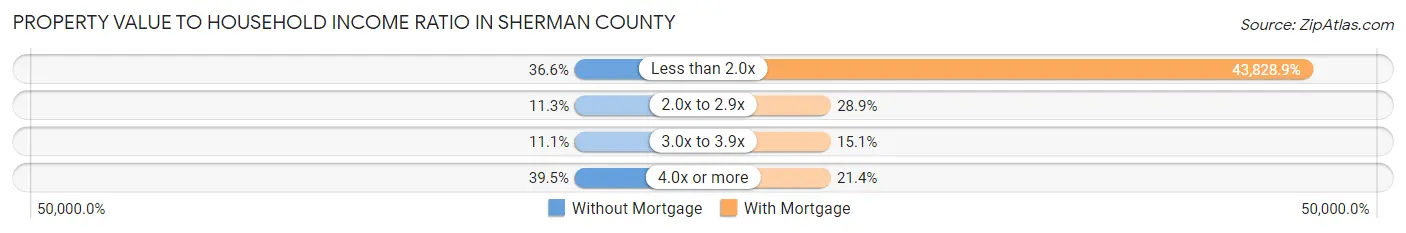
| Value-to-Income Ratio | Without Mortgage | With Mortgage |
| Less than 2.0x | 139 (36.6%) | 69,688 (43,828.9%) |
| 2.0x to 2.9x | 43 (11.3%) | 46 (28.9%) |
| 3.0x to 3.9x | 42 (11.1%) | 24 (15.1%) |
| 4.0x or more | 150 (39.5%) | 34 (21.4%) |
| Total | 380 (100.0%) | 159 (100.0%) |
Real Estate Taxes by Mortgage Status in Sherman County
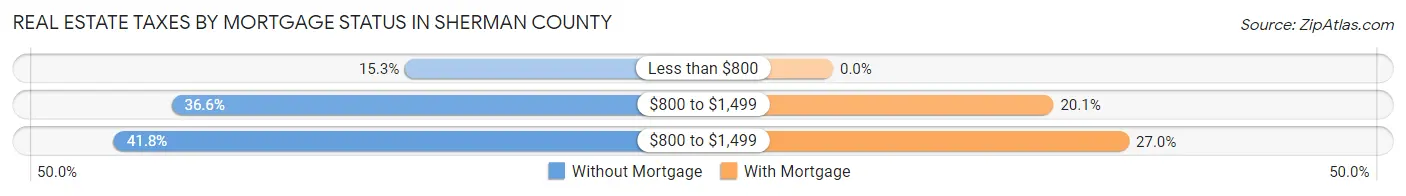
| Property Taxes | Without Mortgage | With Mortgage |
| Less than $800 | 58 (15.3%) | 0 (0.0%) |
| $800 to $1,499 | 139 (36.6%) | 32 (20.1%) |
| $800 to $1,499 | 159 (41.8%) | 43 (27.0%) |
| Total | 380 (100.0%) | 159 (100.0%) |
Health & Disability in Sherman County
Health Insurance Coverage by Age in Sherman County
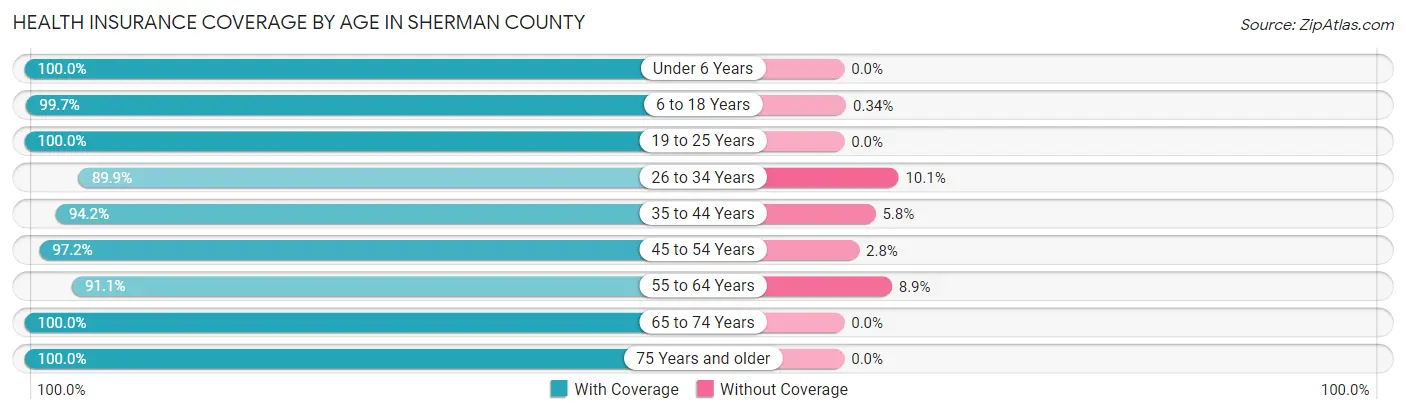
| Age Bracket | With Coverage | Without Coverage |
| Under 6 Years | 112 (100.0%) | 0 (0.0%) |
| 6 to 18 Years | 297 (99.7%) | 1 (0.3%) |
| 19 to 25 Years | 130 (100.0%) | 0 (0.0%) |
| 26 to 34 Years | 169 (89.9%) | 19 (10.1%) |
| 35 to 44 Years | 178 (94.2%) | 11 (5.8%) |
| 45 to 54 Years | 176 (97.2%) | 5 (2.8%) |
| 55 to 64 Years | 329 (91.1%) | 32 (8.9%) |
| 65 to 74 Years | 240 (100.0%) | 0 (0.0%) |
| 75 Years and older | 201 (100.0%) | 0 (0.0%) |
| Total | 1,832 (96.4%) | 68 (3.6%) |
Health Insurance Coverage by Citizenship Status in Sherman County
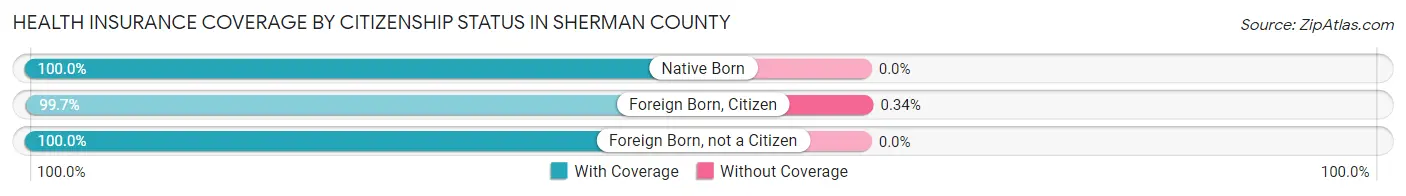
| Citizenship Status | With Coverage | Without Coverage |
| Native Born | 112 (100.0%) | 0 (0.0%) |
| Foreign Born, Citizen | 297 (99.7%) | 1 (0.3%) |
| Foreign Born, not a Citizen | 130 (100.0%) | 0 (0.0%) |
Health Insurance Coverage by Household Income in Sherman County
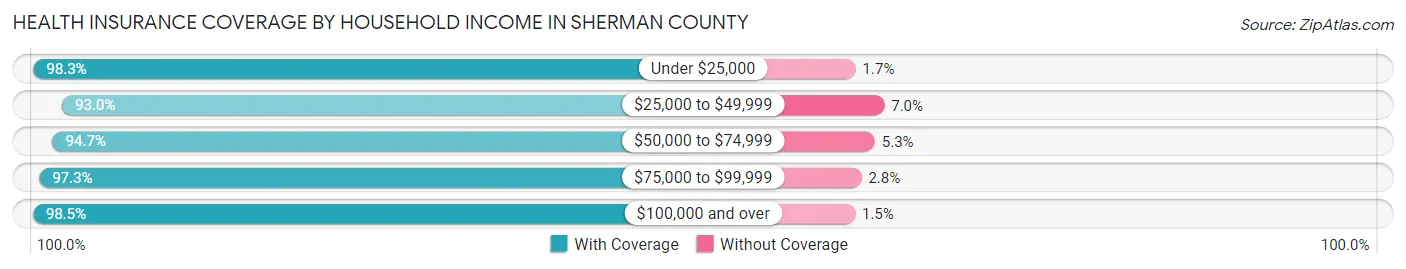
| Household Income | With Coverage | Without Coverage |
| Under $25,000 | 297 (98.3%) | 5 (1.7%) |
| $25,000 to $49,999 | 265 (93.0%) | 20 (7.0%) |
| $50,000 to $74,999 | 396 (94.7%) | 22 (5.3%) |
| $75,000 to $99,999 | 353 (97.3%) | 10 (2.8%) |
| $100,000 and over | 513 (98.5%) | 8 (1.5%) |
Public vs Private Health Insurance Coverage by Age in Sherman County
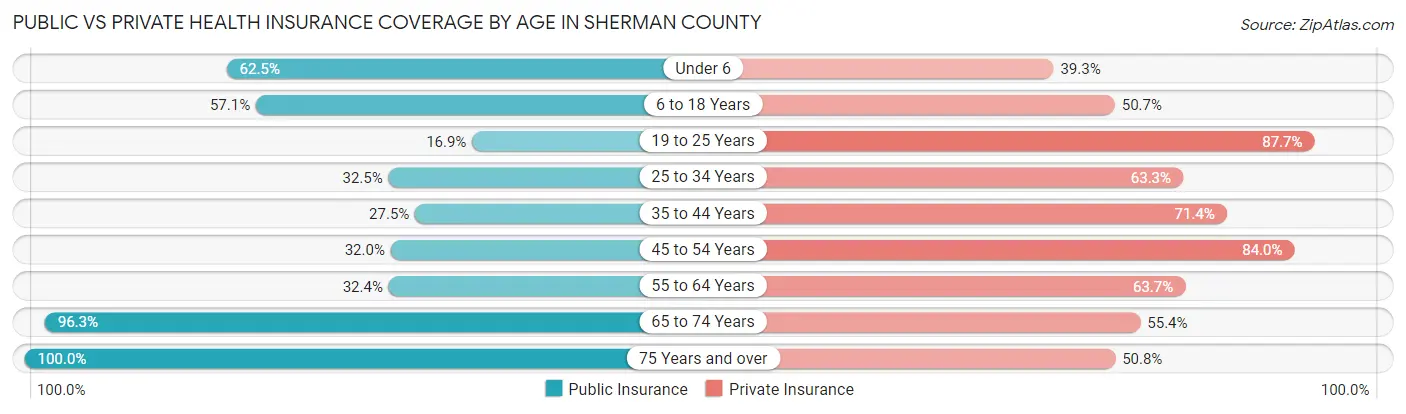
| Age Bracket | Public Insurance | Private Insurance |
| Under 6 | 70 (62.5%) | 44 (39.3%) |
| 6 to 18 Years | 170 (57.1%) | 151 (50.7%) |
| 19 to 25 Years | 22 (16.9%) | 114 (87.7%) |
| 25 to 34 Years | 61 (32.5%) | 119 (63.3%) |
| 35 to 44 Years | 52 (27.5%) | 135 (71.4%) |
| 45 to 54 Years | 58 (32.0%) | 152 (84.0%) |
| 55 to 64 Years | 117 (32.4%) | 230 (63.7%) |
| 65 to 74 Years | 231 (96.3%) | 133 (55.4%) |
| 75 Years and over | 201 (100.0%) | 102 (50.7%) |
| Total | 982 (51.7%) | 1,180 (62.1%) |
Disability Status by Sex by Age in Sherman County
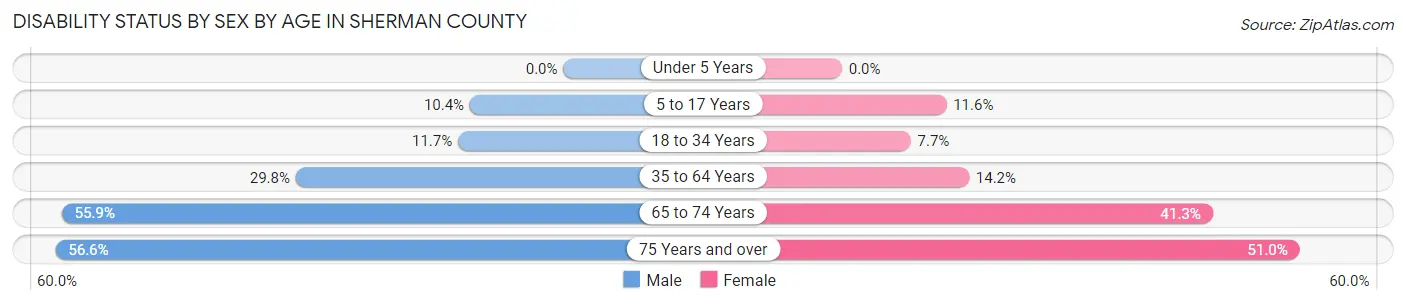
| Age Bracket | Male | Female |
| Under 5 Years | 0 (0.0%) | 0 (0.0%) |
| 5 to 17 Years | 13 (10.4%) | 15 (11.6%) |
| 18 to 34 Years | 19 (11.7%) | 16 (7.7%) |
| 35 to 64 Years | 121 (29.8%) | 46 (14.1%) |
| 65 to 74 Years | 57 (55.9%) | 57 (41.3%) |
| 75 Years and over | 56 (56.6%) | 52 (51.0%) |
Disability Class by Sex by Age in Sherman County
Disability Class: Hearing Difficulty
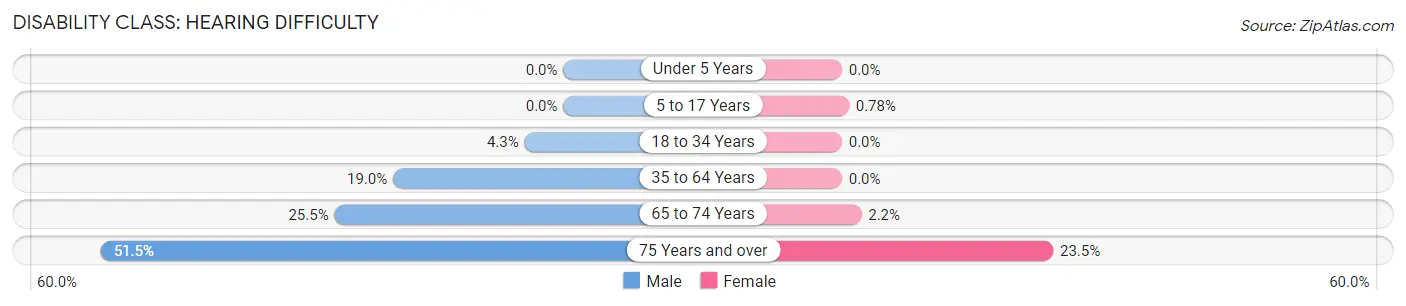
| Age Bracket | Male | Female |
| Under 5 Years | 0 (0.0%) | 0 (0.0%) |
| 5 to 17 Years | 0 (0.0%) | 1 (0.8%) |
| 18 to 34 Years | 7 (4.3%) | 0 (0.0%) |
| 35 to 64 Years | 77 (19.0%) | 0 (0.0%) |
| 65 to 74 Years | 26 (25.5%) | 3 (2.2%) |
| 75 Years and over | 51 (51.5%) | 24 (23.5%) |
Disability Class: Vision Difficulty
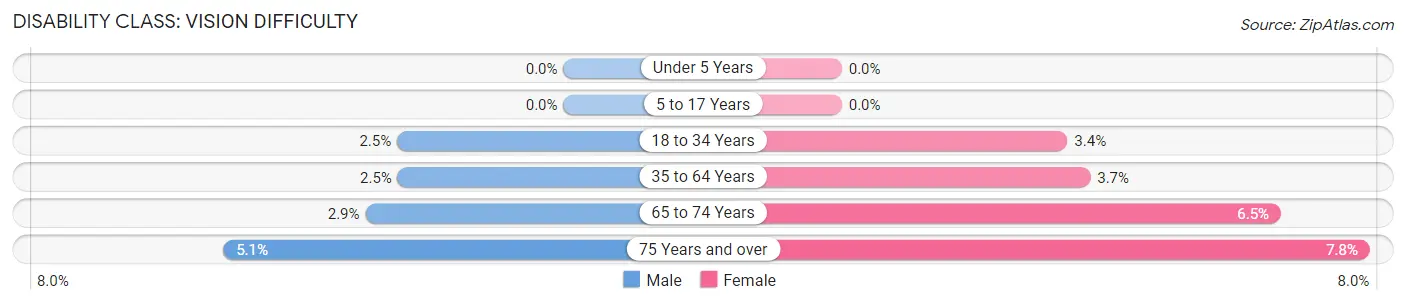
| Age Bracket | Male | Female |
| Under 5 Years | 0 (0.0%) | 0 (0.0%) |
| 5 to 17 Years | 0 (0.0%) | 0 (0.0%) |
| 18 to 34 Years | 4 (2.5%) | 7 (3.4%) |
| 35 to 64 Years | 10 (2.5%) | 12 (3.7%) |
| 65 to 74 Years | 3 (2.9%) | 9 (6.5%) |
| 75 Years and over | 5 (5.1%) | 8 (7.8%) |
Disability Class: Cognitive Difficulty
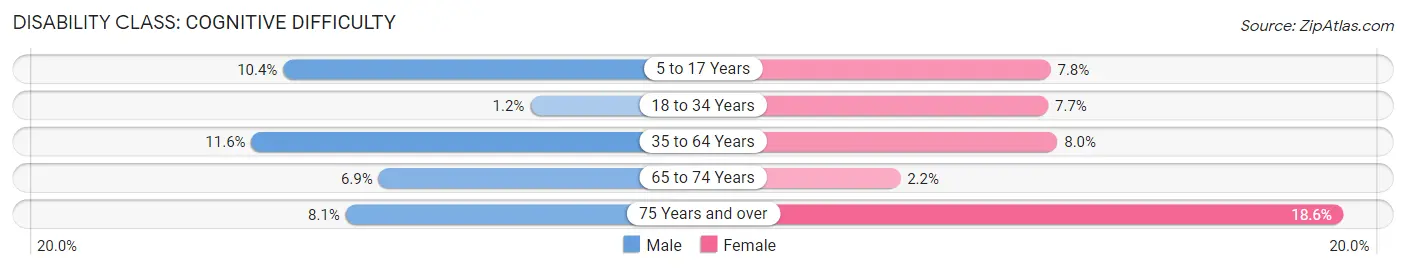
| Age Bracket | Male | Female |
| 5 to 17 Years | 13 (10.4%) | 10 (7.7%) |
| 18 to 34 Years | 2 (1.2%) | 16 (7.7%) |
| 35 to 64 Years | 47 (11.6%) | 26 (8.0%) |
| 65 to 74 Years | 7 (6.9%) | 3 (2.2%) |
| 75 Years and over | 8 (8.1%) | 19 (18.6%) |
Disability Class: Ambulatory Difficulty
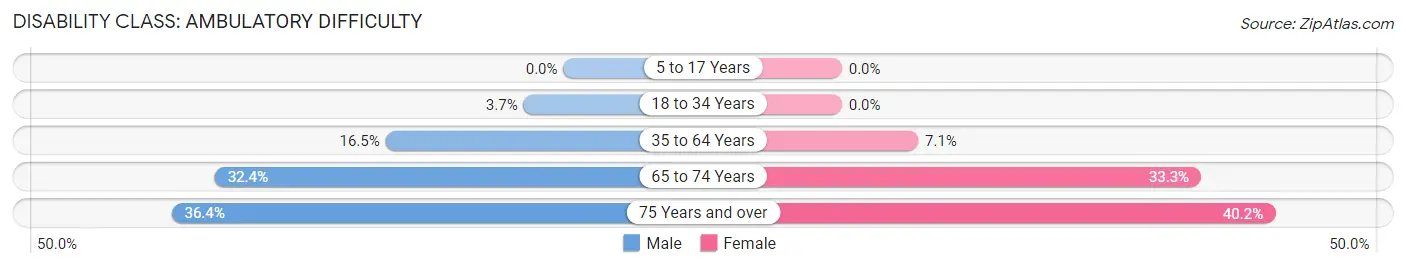
| Age Bracket | Male | Female |
| 5 to 17 Years | 0 (0.0%) | 0 (0.0%) |
| 18 to 34 Years | 6 (3.7%) | 0 (0.0%) |
| 35 to 64 Years | 67 (16.5%) | 23 (7.1%) |
| 65 to 74 Years | 33 (32.4%) | 46 (33.3%) |
| 75 Years and over | 36 (36.4%) | 41 (40.2%) |
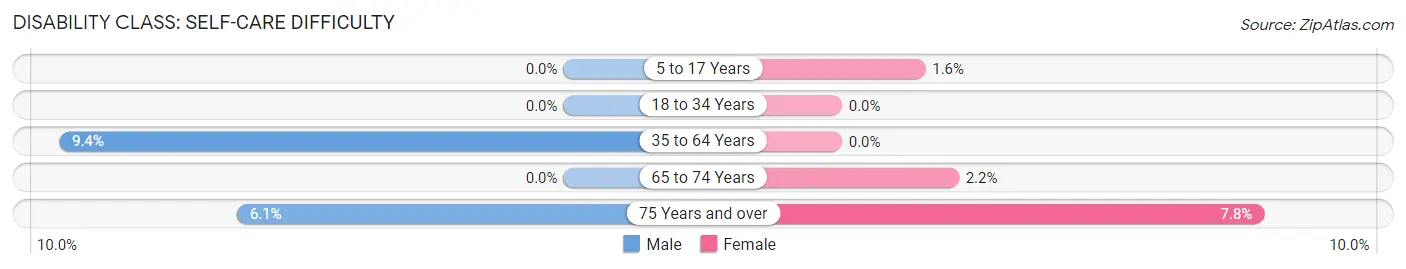
Disability Class: Self-Care Difficulty
| Age Bracket | Male | Female |
| 5 to 17 Years | 0 (0.0%) | 2 (1.5%) |
| 18 to 34 Years | 0 (0.0%) | 0 (0.0%) |
| 35 to 64 Years | 38 (9.4%) | 0 (0.0%) |
| 65 to 74 Years | 0 (0.0%) | 3 (2.2%) |
| 75 Years and over | 6 (6.1%) | 8 (7.8%) |
Technology Access in Sherman County
Computing Device Access in Sherman County
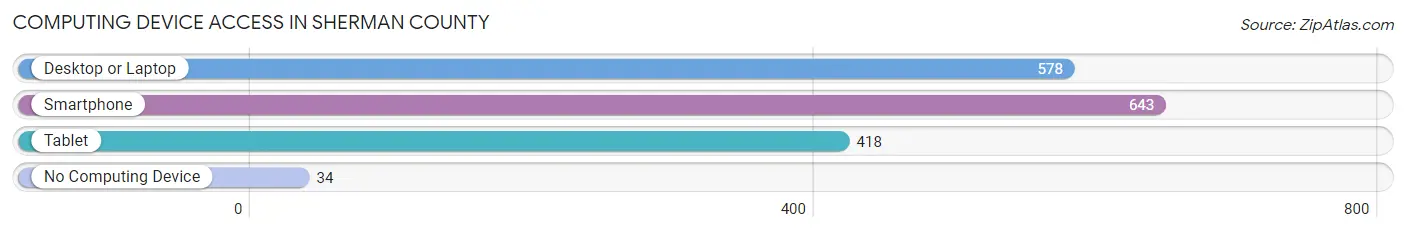
| Device Type | # Households | % Households |
| Desktop or Laptop | 578 | 75.1% |
| Smartphone | 643 | 83.5% |
| Tablet | 418 | 54.3% |
| No Computing Device | 34 | 4.4% |
| Total | 770 | 100.0% |
Internet Access in Sherman County
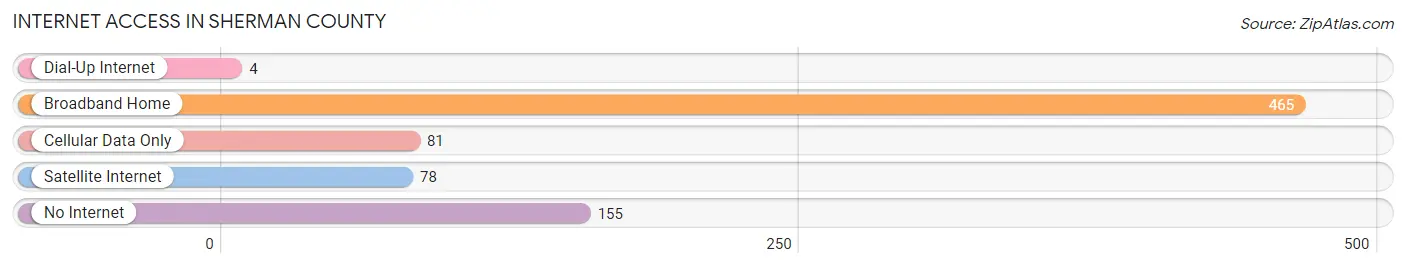
| Internet Type | # Households | % Households |
| Dial-Up Internet | 4 | 0.5% |
| Broadband Home | 465 | 60.4% |
| Cellular Data Only | 81 | 10.5% |
| Satellite Internet | 78 | 10.1% |
| No Internet | 155 | 20.1% |
| Total | 770 | 100.0% |
Sherman County Summary
Sherman County is a county located in the U.S. state of Oregon. As of the 2010 census, the population was 1,765, making it the least populous county in Oregon. The county seat is Moro. The county is named for General William Tecumseh Sherman, an American Civil War general.
Geography
Sherman County is located in the north-central part of Oregon, along the Columbia River. It is bordered by Wasco County to the north, Gilliam County to the east, Wheeler County to the south, and Klickitat County, Washington to the west. The county has a total area of 1,072 square miles, of which 1,068 square miles is land and 4.2 square miles (0.4%) is water.
The terrain of Sherman County is generally flat, with some rolling hills in the western part of the county. The Columbia River forms the western border of the county, and the John Day River forms the eastern border. The county is mostly covered in grasslands, with some areas of sagebrush and juniper.
History
Sherman County was created in 1889 from parts of Wasco and Gilliam counties. It was named for General William Tecumseh Sherman, an American Civil War general. The county seat was originally located in Wasco, but was moved to Moro in 1890.
The first settlers in the area were ranchers, who began arriving in the late 1870s. The first town in the county was Wasco, which was established in 1882. The town of Moro was established in 1884, and the town of Grass Valley was established in 1887.
Economy
Agriculture is the main economic activity in Sherman County. The county is home to a number of large farms and ranches, which produce a variety of crops, including wheat, barley, hay, and potatoes. Cattle and sheep are also raised in the county.
The county is also home to a number of small businesses, including restaurants, stores, and service providers. Tourism is also an important part of the local economy, with visitors coming to the area to enjoy the natural beauty of the Columbia River Gorge and the John Day River.
Demographics
As of the 2010 census, there were 1,765 people, 717 households, and 486 families living in the county. The population density was 1.7 people per square mile. There were 845 housing units at an average density of 0.8 per square mile. The racial makeup of the county was 94.2% White, 0.2% Black or African American, 0.7% Native American, 0.2% Asian, 0.1% Pacific Islander, 2.3% from other races, and 2.4% from two or more races. 4.7% of the population were Hispanic or Latino of any race.
There were 717 households, out of which 24.2% had children under the age of 18 living with them, 54.2% were married couples living together, 7.2% had a female householder with no husband present, and 33.7% were non-families. 28.7% of all households were made up of individuals, and 14.2% had someone living alone who was 65 years of age or older. The average household size was 2.44 and the average family size was 2.97.
The median income for a household in the county was $35,938, and the median income for a family was $41,250. Males had a median income of $31,250 versus $22,500 for females. The per capita income for the county was $17,845. About 10.2% of families and 13.2% of the population were below the poverty line, including 16.2% of those under age 18 and 8.2% of those age 65 or over.
Conclusion
Sherman County is a rural county located in the north-central part of Oregon. It is bordered by Wasco County to the north, Gilliam County to the east, Wheeler County to the south, and Klickitat County, Washington to the west. The county has a total area of 1,072 square miles, of which 1,068 square miles is land and 4.2 square miles (0.4%) is water. The county was named for General William Tecumseh Sherman, an American Civil War general.
Agriculture is the main economic activity in Sherman County, with a number of large farms and ranches producing a variety of crops, including wheat, barley, hay, and potatoes. Cattle and sheep are also raised in the county. Tourism is also an important part of the local economy, with visitors coming to the area to enjoy the natural beauty of the Columbia River Gorge and the John Day River.
As of the 2010 census, there were 1,765 people, 717 households, and 486 families living in the county. The median income for a household in the county was $35,938, and the median income for a family was $41,250. About 10.2% of families and 13.2% of the population were below the poverty line.
Common Questions
What is the Total Population of Sherman County?
Total Population of Sherman County is 1,900.
What is the Total Male Population of Sherman County?
Total Male Population of Sherman County is 932.
What is the Total Female Population of Sherman County?
Total Female Population of Sherman County is 968.
What is the Ratio of Males per 100 Females in Sherman County?
There are 96.28 Males per 100 Females in Sherman County.
What is the Ratio of Females per 100 Males in Sherman County?
There are 103.86 Females per 100 Males in Sherman County.
What is the Median Population Age in Sherman County?
Median Population Age in Sherman County is 45.7 Years.
What is the Average Family Size in Sherman County
Average Family Size in Sherman County is 3.1 People.
What is the Average Household Size in Sherman County
Average Household Size in Sherman County is 2.5 People.
What is Per Capita Income in Sherman County?
Per Capita income in Sherman County is $33,206.
What is the Median Family Income in Sherman County?
Median Family Income in Sherman County is $74,063.
What is the Median Household income in Sherman County?
Median Household Income in Sherman County is $57,171.
What is Income or Wage Gap in Sherman County?
Income or Wage Gap in Sherman County is 44.5%.
Women in Sherman County earn 55.5 cents for every dollar earned by a man.
What is Inequality or Gini Index in Sherman County?
Inequality or Gini Index in Sherman County is 0.44.
How Large is the Labor Force in Sherman County?
There are 828 People in the Labor Forcein in Sherman County.
What is the Percentage of People in the Labor Force in Sherman County?
52.5% of People are in the Labor Force in Sherman County.
What is the Unemployment Rate in Sherman County?
Unemployment Rate in Sherman County is 2.2%.