Multnomah County, OR
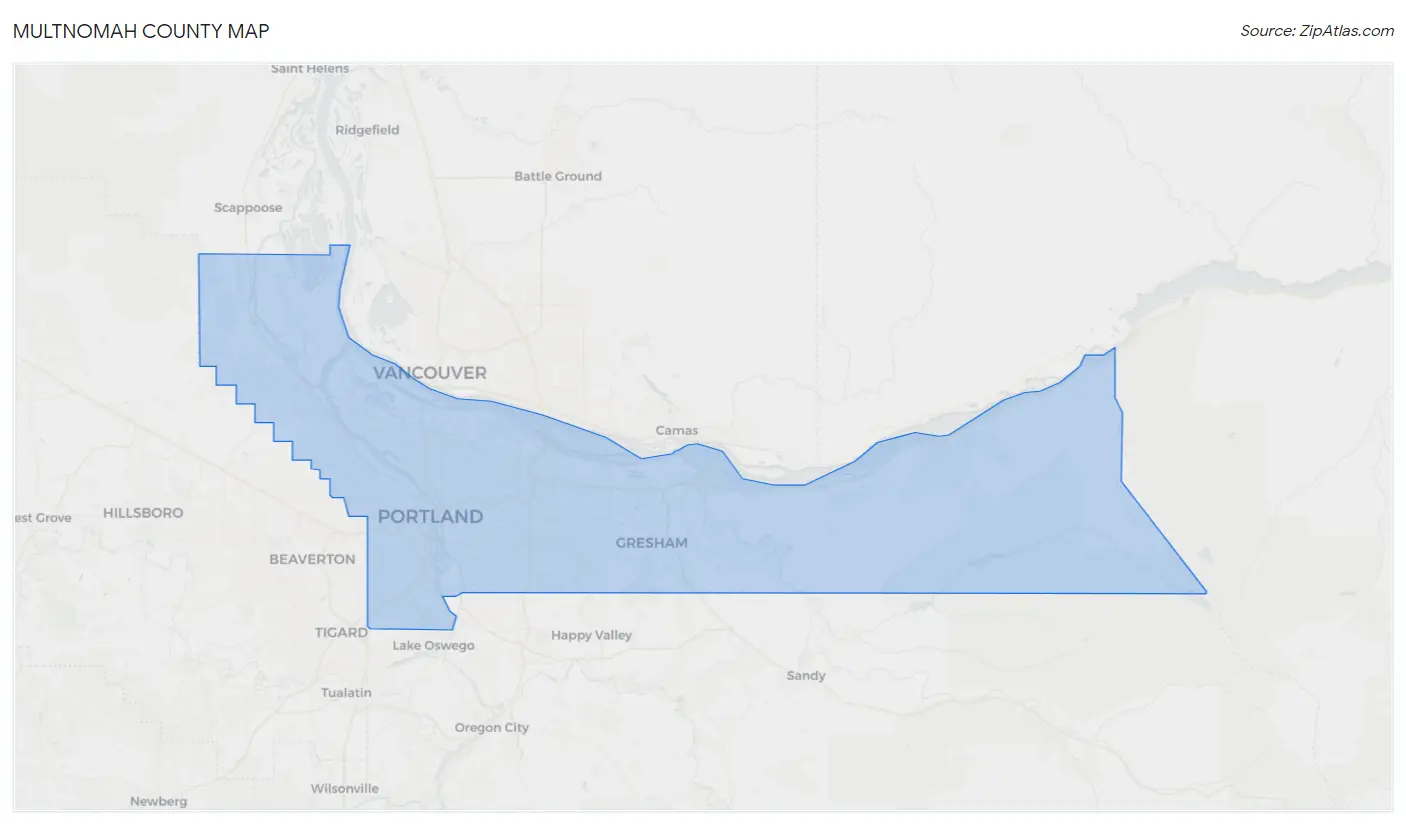
Multnomah County Map
Multnomah County Overview
808,098
TOTAL POPULATION
403,380
MALE POPULATION
404,718
FEMALE POPULATION
99.67
MALES / 100 FEMALES
100.33
FEMALES / 100 MALES
38.2
MEDIAN AGE
3.0
AVG FAMILY SIZE
2.3
AVG HOUSEHOLD SIZE
$49,713
PER CAPITA INCOME
$109,513
AVG FAMILY INCOME
$83,668
AVG HOUSEHOLD INCOME
18.1%
WAGE / INCOME GAP [ % ]
81.9¢/ $1
WAGE / INCOME GAP [ $ ]
$10,819
FAMILY INCOME DEFICIT
0.47
INEQUALITY / GINI INDEX
474,895
LABOR FORCE [ PEOPLE ]
70.0%
PERCENT IN LABOR FORCE
5.5%
UNEMPLOYMENT RATE
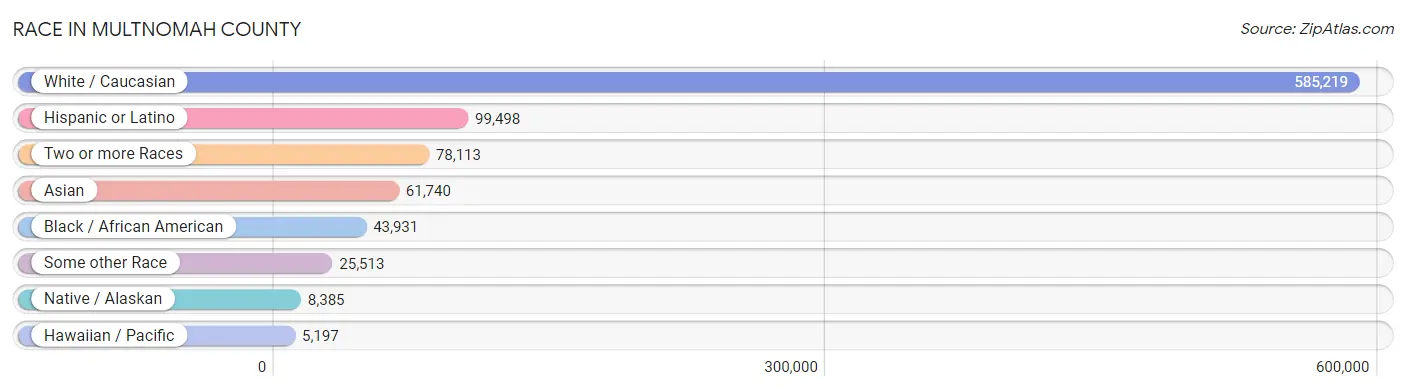
Race in Multnomah County
The most populous races in Multnomah County are White / Caucasian (585,219 | 72.4%), Hispanic or Latino (99,498 | 12.3%), and Two or more Races (78,113 | 9.7%).
| Race | # Population | % Population |
| Asian | 61,740 | 7.6% |
| Black / African American | 43,931 | 5.4% |
| Hawaiian / Pacific | 5,197 | 0.6% |
| Hispanic or Latino | 99,498 | 12.3% |
| Native / Alaskan | 8,385 | 1.0% |
| White / Caucasian | 585,219 | 72.4% |
| Two or more Races | 78,113 | 9.7% |
| Some other Race | 25,513 | 3.2% |
| Total | 808,098 | 100.0% |
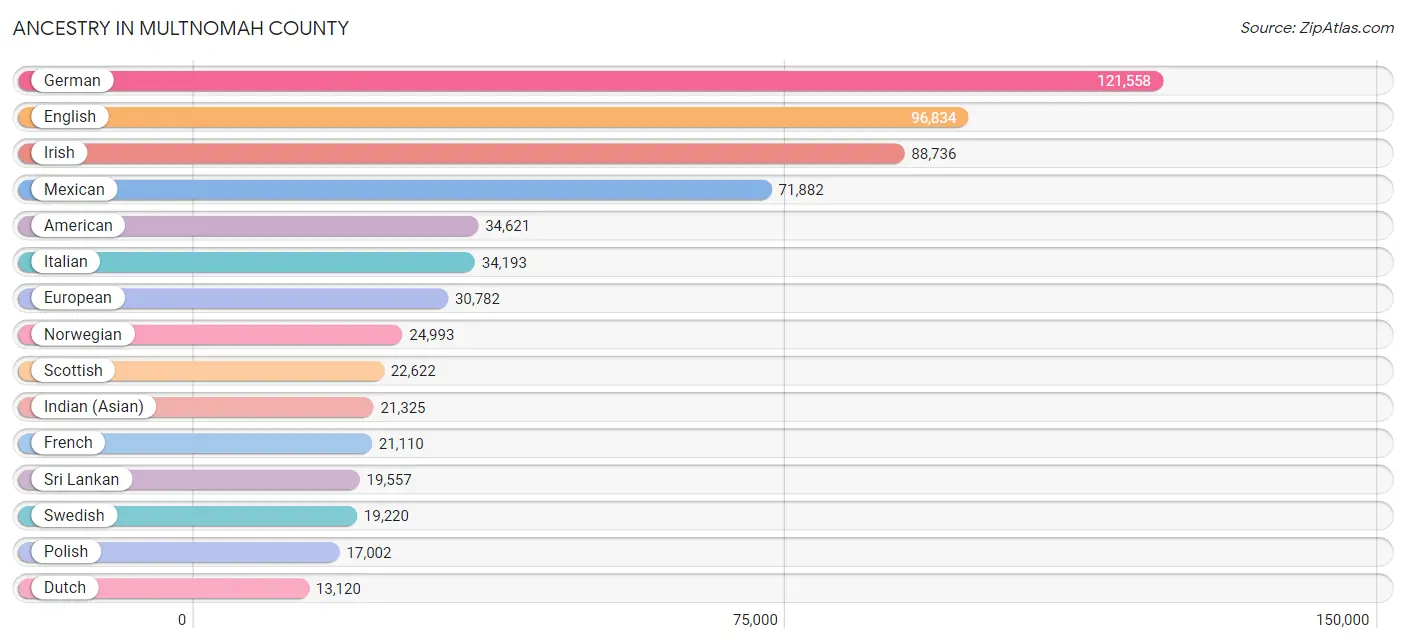
Ancestry in Multnomah County
The most populous ancestries reported in Multnomah County are German (121,558 | 15.0%), English (96,834 | 12.0%), Irish (88,736 | 11.0%), Mexican (71,882 | 8.9%), and American (34,621 | 4.3%), together accounting for 51.2% of all Multnomah County residents.
| Ancestry | # Population | % Population |
| Afghan | 322 | 0.0% |
| African | 3,084 | 0.4% |
| Alaska Native | 58 | 0.0% |
| Alaskan Athabascan | 126 | 0.0% |
| Albanian | 25 | 0.0% |
| Aleut | 76 | 0.0% |
| Alsatian | 34 | 0.0% |
| American | 34,621 | 4.3% |
| Apache | 719 | 0.1% |
| Arab | 6,878 | 0.9% |
| Argentinean | 690 | 0.1% |
| Armenian | 696 | 0.1% |
| Assyrian / Chaldean / Syriac | 80 | 0.0% |
| Australian | 448 | 0.1% |
| Austrian | 2,627 | 0.3% |
| Bahamian | 25 | 0.0% |
| Bangladeshi | 1,580 | 0.2% |
| Basque | 381 | 0.1% |
| Belgian | 1,229 | 0.2% |
| Belizean | 280 | 0.0% |
| Bermudan | 9 | 0.0% |
| Bhutanese | 9,185 | 1.1% |
| Blackfeet | 1,247 | 0.2% |
| Bolivian | 241 | 0.0% |
| Brazilian | 756 | 0.1% |
| British | 9,064 | 1.1% |
| British West Indian | 22 | 0.0% |
| Bulgarian | 323 | 0.0% |
| Burmese | 4,375 | 0.5% |
| Cajun | 120 | 0.0% |
| Cambodian | 5 | 0.0% |
| Canadian | 2,712 | 0.3% |
| Cape Verdean | 23 | 0.0% |
| Carpatho Rusyn | 6 | 0.0% |
| Celtic | 337 | 0.0% |
| Central American | 7,038 | 0.9% |
| Central American Indian | 892 | 0.1% |
| Cherokee | 3,358 | 0.4% |
| Cheyenne | 117 | 0.0% |
| Chickasaw | 67 | 0.0% |
| Chilean | 388 | 0.1% |
| Chinese | 258 | 0.0% |
| Chippewa | 1,051 | 0.1% |
| Choctaw | 585 | 0.1% |
| Colombian | 1,313 | 0.2% |
| Colville | 108 | 0.0% |
| Comanche | 127 | 0.0% |
| Costa Rican | 334 | 0.0% |
| Cree | 91 | 0.0% |
| Creek | 207 | 0.0% |
| Croatian | 2,036 | 0.3% |
| Cuban | 3,068 | 0.4% |
| Cypriot | 10 | 0.0% |
| Czech | 4,274 | 0.5% |
| Czechoslovakian | 696 | 0.1% |
| Danish | 7,649 | 0.9% |
| Delaware | 23 | 0.0% |
| Dominican | 402 | 0.1% |
| Dutch | 13,120 | 1.6% |
| Dutch West Indian | 17 | 0.0% |
| Eastern European | 4,071 | 0.5% |
| Ecuadorian | 650 | 0.1% |
| Egyptian | 1,138 | 0.1% |
| English | 96,834 | 12.0% |
| Estonian | 524 | 0.1% |
| Ethiopian | 2,888 | 0.4% |
| European | 30,782 | 3.8% |
| Fijian | 49 | 0.0% |
| Filipino | 947 | 0.1% |
| Finnish | 4,258 | 0.5% |
| French | 21,110 | 2.6% |
| French American Indian | 44 | 0.0% |
| French Canadian | 4,165 | 0.5% |
| German | 121,558 | 15.0% |
| German Russian | 122 | 0.0% |
| Ghanaian | 487 | 0.1% |
| Greek | 3,091 | 0.4% |
| Guamanian / Chamorro | 972 | 0.1% |
| Guatemalan | 2,503 | 0.3% |
| Guyanese | 285 | 0.0% |
| Haitian | 472 | 0.1% |
| Honduran | 717 | 0.1% |
| Hopi | 179 | 0.0% |
| Hungarian | 3,508 | 0.4% |
| Icelander | 540 | 0.1% |
| Indian (Asian) | 21,325 | 2.6% |
| Indonesian | 1,021 | 0.1% |
| Inupiat | 250 | 0.0% |
| Iranian | 1,290 | 0.2% |
| Iraqi | 271 | 0.0% |
| Irish | 88,736 | 11.0% |
| Iroquois | 101 | 0.0% |
| Israeli | 347 | 0.0% |
| Italian | 34,193 | 4.2% |
| Jamaican | 979 | 0.1% |
| Japanese | 1,604 | 0.2% |
| Jordanian | 89 | 0.0% |
| Kenyan | 450 | 0.1% |
| Korean | 12,258 | 1.5% |
| Laotian | 582 | 0.1% |
| Latvian | 735 | 0.1% |
| Lebanese | 1,474 | 0.2% |
| Liberian | 162 | 0.0% |
| Lithuanian | 1,764 | 0.2% |
| Lumbee | 24 | 0.0% |
| Luxembourger | 208 | 0.0% |
| Macedonian | 141 | 0.0% |
| Malaysian | 3,179 | 0.4% |
| Maltese | 125 | 0.0% |
| Marshallese | 417 | 0.1% |
| Mexican | 71,882 | 8.9% |
| Mexican American Indian | 1,982 | 0.3% |
| Mongolian | 66 | 0.0% |
| Moroccan | 156 | 0.0% |
| Native Hawaiian | 2,597 | 0.3% |
| Navajo | 393 | 0.1% |
| Nepalese | 787 | 0.1% |
| New Zealander | 106 | 0.0% |
| Nicaraguan | 532 | 0.1% |
| Nigerian | 709 | 0.1% |
| Northern European | 4,573 | 0.6% |
| Norwegian | 24,993 | 3.1% |
| Okinawan | 27 | 0.0% |
| Osage | 72 | 0.0% |
| Paiute | 321 | 0.0% |
| Pakistani | 1,463 | 0.2% |
| Palestinian | 316 | 0.0% |
| Panamanian | 388 | 0.1% |
| Paraguayan | 34 | 0.0% |
| Pennsylvania German | 234 | 0.0% |
| Peruvian | 1,142 | 0.1% |
| Pima | 131 | 0.0% |
| Polish | 17,002 | 2.1% |
| Portuguese | 3,031 | 0.4% |
| Potawatomi | 85 | 0.0% |
| Pueblo | 109 | 0.0% |
| Puerto Rican | 3,937 | 0.5% |
| Puget Sound Salish | 65 | 0.0% |
| Romanian | 3,441 | 0.4% |
| Russian | 12,297 | 1.5% |
| Salvadoran | 2,336 | 0.3% |
| Samoan | 934 | 0.1% |
| Scandinavian | 6,530 | 0.8% |
| Scotch-Irish | 8,417 | 1.0% |
| Scottish | 22,622 | 2.8% |
| Seminole | 21 | 0.0% |
| Senegalese | 294 | 0.0% |
| Serbian | 311 | 0.0% |
| Shoshone | 318 | 0.0% |
| Sierra Leonean | 20 | 0.0% |
| Sioux | 1,339 | 0.2% |
| Slavic | 616 | 0.1% |
| Slovak | 817 | 0.1% |
| Slovene | 374 | 0.1% |
| Somali | 1,159 | 0.1% |
| South African | 268 | 0.0% |
| South American | 4,962 | 0.6% |
| South American Indian | 40 | 0.0% |
| Soviet Union | 18 | 0.0% |
| Spaniard | 2,594 | 0.3% |
| Spanish | 2,119 | 0.3% |
| Spanish American | 162 | 0.0% |
| Spanish American Indian | 54 | 0.0% |
| Sri Lankan | 19,557 | 2.4% |
| Subsaharan African | 10,105 | 1.3% |
| Swedish | 19,220 | 2.4% |
| Swiss | 4,889 | 0.6% |
| Syrian | 1,133 | 0.1% |
| Thai | 6,027 | 0.7% |
| Tlingit-Haida | 548 | 0.1% |
| Tongan | 655 | 0.1% |
| Trinidadian and Tobagonian | 466 | 0.1% |
| Tsimshian | 37 | 0.0% |
| Turkish | 984 | 0.1% |
| Ugandan | 89 | 0.0% |
| Ukrainian | 8,927 | 1.1% |
| Uruguayan | 45 | 0.0% |
| Ute | 42 | 0.0% |
| Venezuelan | 409 | 0.1% |
| Vietnamese | 14 | 0.0% |
| Welsh | 7,580 | 0.9% |
| West Indian | 157 | 0.0% |
| Yakama | 116 | 0.0% |
| Yaqui | 96 | 0.0% |
| Yugoslavian | 1,347 | 0.2% |
| Yup'ik | 304 | 0.0% | View All 186 Rows |
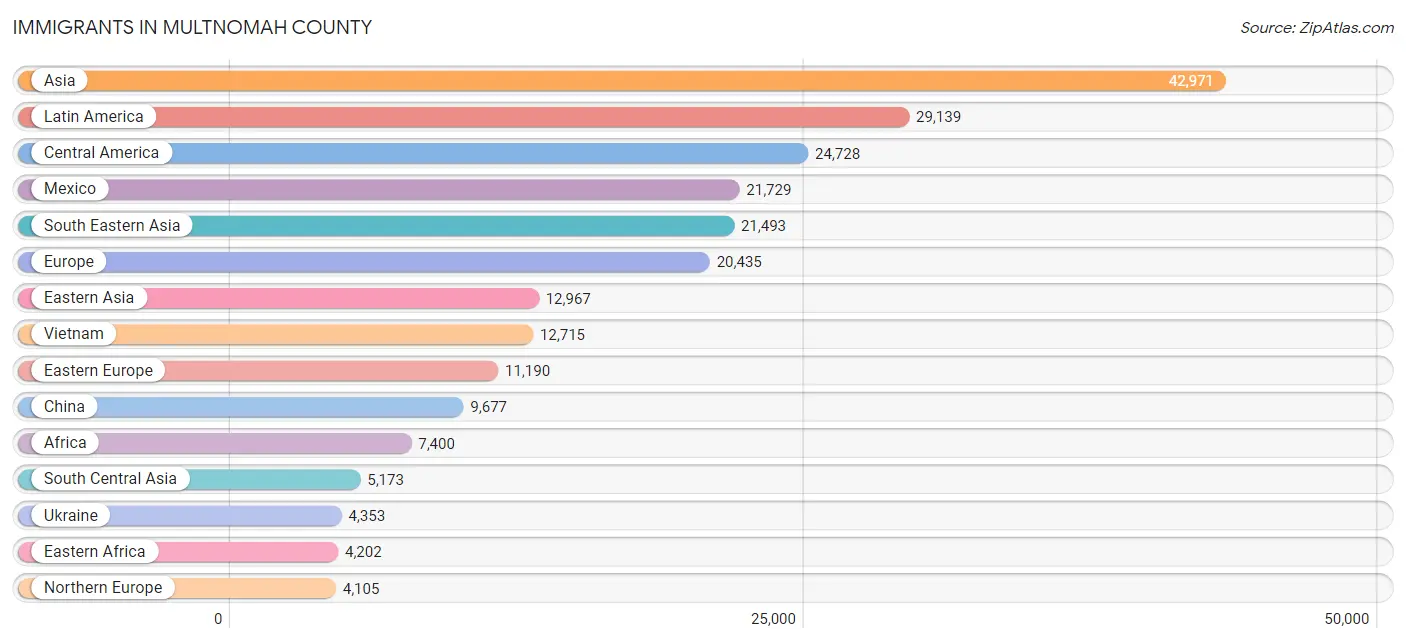
Immigrants in Multnomah County
The most numerous immigrant groups reported in Multnomah County came from Asia (42,971 | 5.3%), Latin America (29,139 | 3.6%), Central America (24,728 | 3.1%), Mexico (21,729 | 2.7%), and South Eastern Asia (21,493 | 2.7%), together accounting for 17.3% of all Multnomah County residents.
| Immigration Origin | # Population | % Population |
| Afghanistan | 366 | 0.1% |
| Africa | 7,400 | 0.9% |
| Argentina | 219 | 0.0% |
| Armenia | 8 | 0.0% |
| Asia | 42,971 | 5.3% |
| Australia | 571 | 0.1% |
| Austria | 158 | 0.0% |
| Azores | 9 | 0.0% |
| Bahamas | 13 | 0.0% |
| Bangladesh | 14 | 0.0% |
| Barbados | 28 | 0.0% |
| Belarus | 360 | 0.0% |
| Belgium | 184 | 0.0% |
| Belize | 99 | 0.0% |
| Bolivia | 62 | 0.0% |
| Bosnia and Herzegovina | 474 | 0.1% |
| Brazil | 665 | 0.1% |
| Bulgaria | 89 | 0.0% |
| Cambodia | 636 | 0.1% |
| Cameroon | 110 | 0.0% |
| Canada | 3,352 | 0.4% |
| Caribbean | 1,876 | 0.2% |
| Central America | 24,728 | 3.1% |
| Chile | 184 | 0.0% |
| China | 9,677 | 1.2% |
| Colombia | 525 | 0.1% |
| Congo | 140 | 0.0% |
| Costa Rica | 145 | 0.0% |
| Croatia | 62 | 0.0% |
| Cuba | 1,253 | 0.2% |
| Czechoslovakia | 143 | 0.0% |
| Denmark | 181 | 0.0% |
| Dominica | 15 | 0.0% |
| Dominican Republic | 48 | 0.0% |
| Eastern Africa | 4,202 | 0.5% |
| Eastern Asia | 12,967 | 1.6% |
| Eastern Europe | 11,190 | 1.4% |
| Ecuador | 14 | 0.0% |
| Egypt | 850 | 0.1% |
| El Salvador | 958 | 0.1% |
| England | 1,407 | 0.2% |
| Eritrea | 411 | 0.1% |
| Ethiopia | 2,253 | 0.3% |
| Europe | 20,435 | 2.5% |
| Fiji | 855 | 0.1% |
| France | 932 | 0.1% |
| Germany | 1,834 | 0.2% |
| Ghana | 549 | 0.1% |
| Greece | 316 | 0.0% |
| Guatemala | 1,145 | 0.1% |
| Guyana | 54 | 0.0% |
| Haiti | 158 | 0.0% |
| Honduras | 491 | 0.1% |
| Hong Kong | 1,018 | 0.1% |
| Hungary | 196 | 0.0% |
| India | 2,364 | 0.3% |
| Indonesia | 237 | 0.0% |
| Iran | 781 | 0.1% |
| Iraq | 897 | 0.1% |
| Ireland | 310 | 0.0% |
| Israel | 255 | 0.0% |
| Italy | 470 | 0.1% |
| Jamaica | 156 | 0.0% |
| Japan | 1,447 | 0.2% |
| Jordan | 48 | 0.0% |
| Kazakhstan | 381 | 0.1% |
| Kenya | 909 | 0.1% |
| Korea | 1,843 | 0.2% |
| Kuwait | 245 | 0.0% |
| Laos | 1,826 | 0.2% |
| Latin America | 29,139 | 3.6% |
| Latvia | 34 | 0.0% |
| Lebanon | 75 | 0.0% |
| Liberia | 241 | 0.0% |
| Lithuania | 93 | 0.0% |
| Malaysia | 348 | 0.0% |
| Mexico | 21,729 | 2.7% |
| Micronesia | 938 | 0.1% |
| Middle Africa | 267 | 0.0% |
| Moldova | 908 | 0.1% |
| Morocco | 110 | 0.0% |
| Nepal | 262 | 0.0% |
| Netherlands | 392 | 0.1% |
| Nicaragua | 89 | 0.0% |
| Nigeria | 304 | 0.0% |
| North Macedonia | 76 | 0.0% |
| Northern Africa | 1,038 | 0.1% |
| Northern Europe | 4,105 | 0.5% |
| Norway | 126 | 0.0% |
| Oceania | 3,362 | 0.4% |
| Pakistan | 272 | 0.0% |
| Panama | 31 | 0.0% |
| Peru | 470 | 0.1% |
| Philippines | 3,611 | 0.4% |
| Poland | 381 | 0.1% |
| Portugal | 165 | 0.0% |
| Romania | 1,432 | 0.2% |
| Russia | 1,966 | 0.2% |
| Saudi Arabia | 149 | 0.0% |
| Scotland | 205 | 0.0% |
| Senegal | 91 | 0.0% |
| Serbia | 101 | 0.0% |
| Sierra Leone | 65 | 0.0% |
| Singapore | 200 | 0.0% |
| Somalia | 380 | 0.1% |
| South Africa | 320 | 0.0% |
| South America | 2,535 | 0.3% |
| South Central Asia | 5,173 | 0.6% |
| South Eastern Asia | 21,493 | 2.7% |
| Southern Europe | 1,253 | 0.2% |
| Spain | 302 | 0.0% |
| Sri Lanka | 13 | 0.0% |
| Sudan | 16 | 0.0% |
| Sweden | 299 | 0.0% |
| Switzerland | 189 | 0.0% |
| Syria | 579 | 0.1% |
| Taiwan | 639 | 0.1% |
| Thailand | 1,276 | 0.2% |
| Trinidad and Tobago | 108 | 0.0% |
| Turkey | 570 | 0.1% |
| Uganda | 40 | 0.0% |
| Ukraine | 4,353 | 0.5% |
| Uruguay | 18 | 0.0% |
| Uzbekistan | 335 | 0.0% |
| Venezuela | 324 | 0.0% |
| Vietnam | 12,715 | 1.6% |
| Western Africa | 1,405 | 0.2% |
| Western Asia | 3,168 | 0.4% |
| Western Europe | 3,689 | 0.5% |
| Yemen | 6 | 0.0% |
| Zaire | 17 | 0.0% |
| Zimbabwe | 81 | 0.0% | View All 132 Rows |
Sex and Age in Multnomah County
Sex and Age in Multnomah County
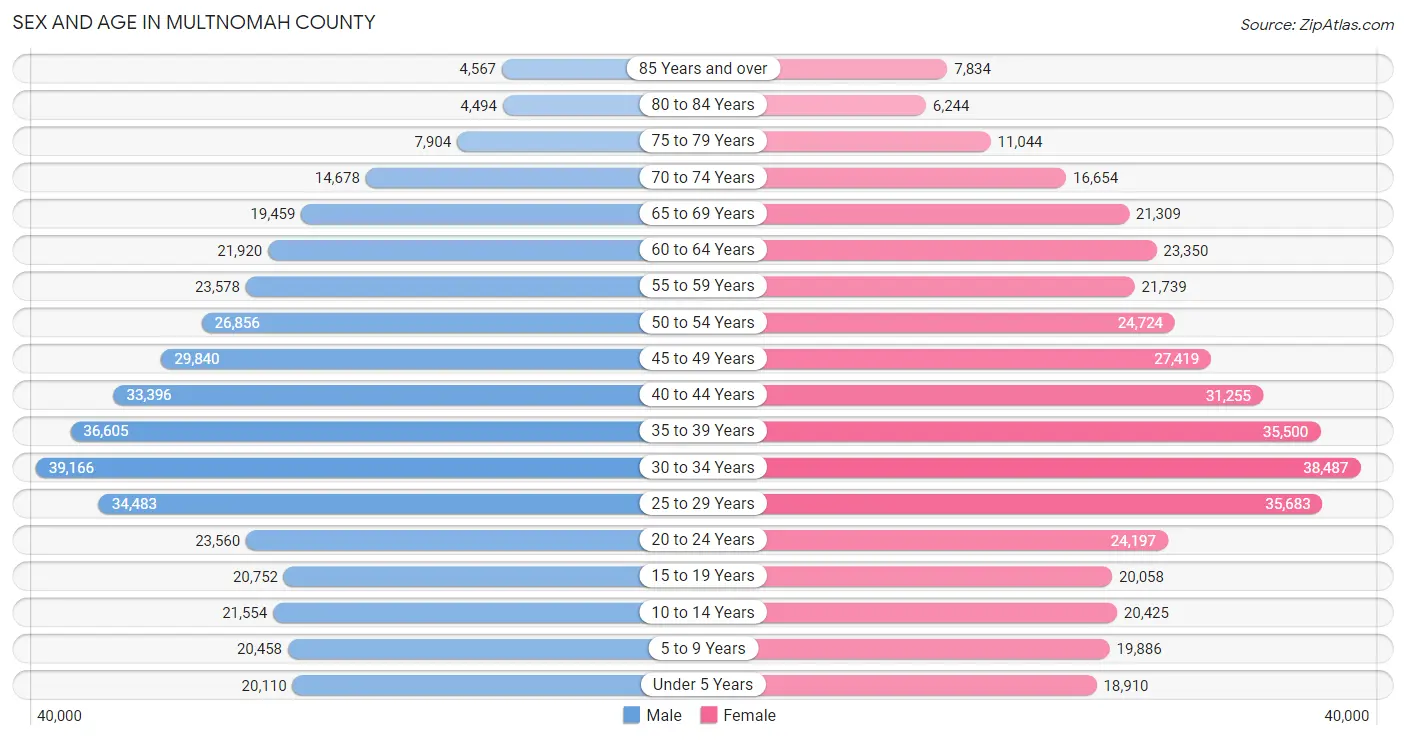
The most populous age groups in Multnomah County are 30 to 34 Years (39,166 | 9.7%) for men and 30 to 34 Years (38,487 | 9.5%) for women.
| Age Bracket | Male | Female |
| Under 5 Years | 20,110 (5.0%) | 18,910 (4.7%) |
| 5 to 9 Years | 20,458 (5.1%) | 19,886 (4.9%) |
| 10 to 14 Years | 21,554 (5.3%) | 20,425 (5.1%) |
| 15 to 19 Years | 20,752 (5.1%) | 20,058 (5.0%) |
| 20 to 24 Years | 23,560 (5.8%) | 24,197 (6.0%) |
| 25 to 29 Years | 34,483 (8.6%) | 35,683 (8.8%) |
| 30 to 34 Years | 39,166 (9.7%) | 38,487 (9.5%) |
| 35 to 39 Years | 36,605 (9.1%) | 35,500 (8.8%) |
| 40 to 44 Years | 33,396 (8.3%) | 31,255 (7.7%) |
| 45 to 49 Years | 29,840 (7.4%) | 27,419 (6.8%) |
| 50 to 54 Years | 26,856 (6.7%) | 24,724 (6.1%) |
| 55 to 59 Years | 23,578 (5.9%) | 21,739 (5.4%) |
| 60 to 64 Years | 21,920 (5.4%) | 23,350 (5.8%) |
| 65 to 69 Years | 19,459 (4.8%) | 21,309 (5.3%) |
| 70 to 74 Years | 14,678 (3.6%) | 16,654 (4.1%) |
| 75 to 79 Years | 7,904 (2.0%) | 11,044 (2.7%) |
| 80 to 84 Years | 4,494 (1.1%) | 6,244 (1.5%) |
| 85 Years and over | 4,567 (1.1%) | 7,834 (1.9%) |
| Total | 403,380 (100.0%) | 404,718 (100.0%) |
Families and Households in Multnomah County
Median Family Size in Multnomah County
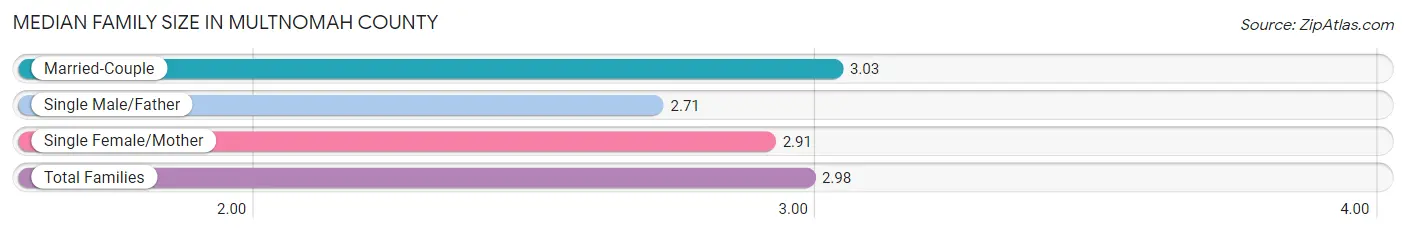
The median family size in Multnomah County is 2.98 persons per family, with married-couple families (133,467 | 74.8%) accounting for the largest median family size of 3.03 persons per family. On the other hand, single male/father families (14,310 | 8.0%) represent the smallest median family size with 2.71 persons per family.
| Family Type | # Families | Family Size |
| Married-Couple | 133,467 (74.8%) | 3.03 |
| Single Male/Father | 14,310 (8.0%) | 2.71 |
| Single Female/Mother | 30,658 (17.2%) | 2.91 |
| Total Families | 178,435 (100.0%) | 2.98 |
Median Household Size in Multnomah County
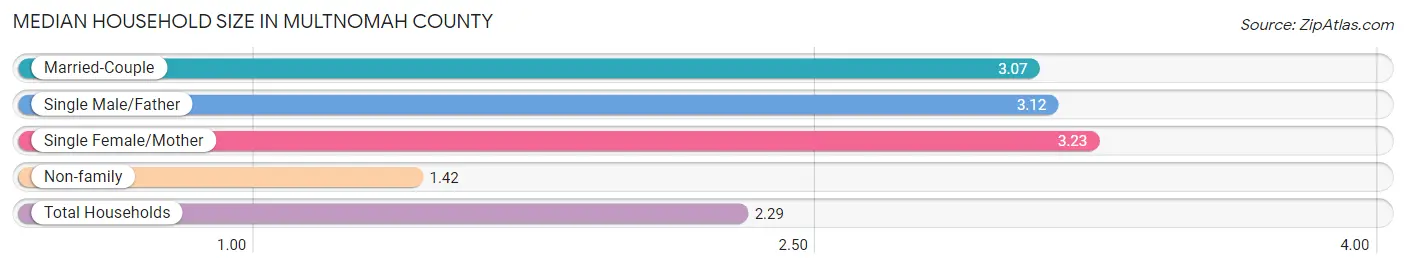
The median household size in Multnomah County is 2.29 persons per household, with single female/mother households (30,658 | 8.9%) accounting for the largest median household size of 3.23 persons per household. non-family households (164,935 | 48.0%) represent the smallest median household size with 1.42 persons per household.
| Household Type | # Households | Household Size |
| Married-Couple | 133,467 (38.9%) | 3.07 |
| Single Male/Father | 14,310 (4.2%) | 3.12 |
| Single Female/Mother | 30,658 (8.9%) | 3.23 |
| Non-family | 164,935 (48.0%) | 1.42 |
| Total Households | 343,370 (100.0%) | 2.29 |
Household Size by Marriage Status in Multnomah County
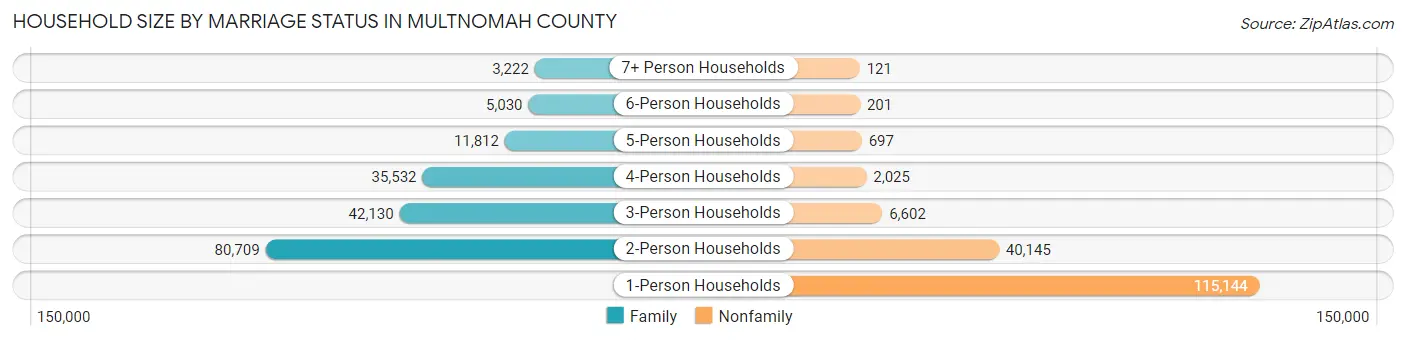
Out of a total of 343,370 households in Multnomah County, 178,435 (52.0%) are family households, while 164,935 (48.0%) are nonfamily households. The most numerous type of family households are 2-person households, comprising 80,709, and the most common type of nonfamily households are 1-person households, comprising 115,144.
| Household Size | Family Households | Nonfamily Households |
| 1-Person Households | - | 115,144 (33.5%) |
| 2-Person Households | 80,709 (23.5%) | 40,145 (11.7%) |
| 3-Person Households | 42,130 (12.3%) | 6,602 (1.9%) |
| 4-Person Households | 35,532 (10.3%) | 2,025 (0.6%) |
| 5-Person Households | 11,812 (3.4%) | 697 (0.2%) |
| 6-Person Households | 5,030 (1.5%) | 201 (0.1%) |
| 7+ Person Households | 3,222 (0.9%) | 121 (0.0%) |
| Total | 178,435 (52.0%) | 164,935 (48.0%) |
Female Fertility in Multnomah County
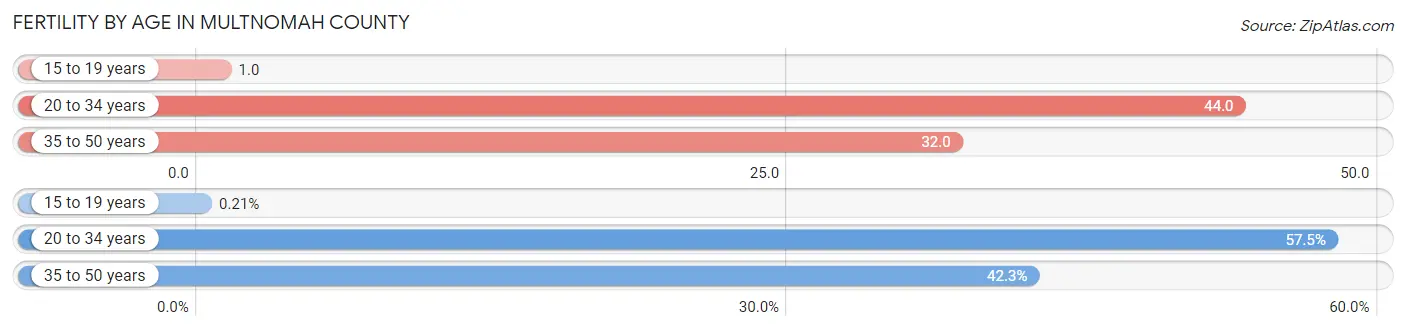
Fertility by Age in Multnomah County
Average fertility rate in Multnomah County is 35.0 births per 1,000 women. Women in the age bracket of 20 to 34 years have the highest fertility rate with 44.0 births per 1,000 women. Women in the age bracket of 20 to 34 years acount for 57.5% of all women with births.
| Age Bracket | Women with Births | Births / 1,000 Women |
| 15 to 19 years | 16 (0.2%) | 1.0 |
| 20 to 34 years | 4,341 (57.5%) | 44.0 |
| 35 to 50 years | 3,194 (42.3%) | 32.0 |
| Total | 7,551 (100.0%) | 35.0 |
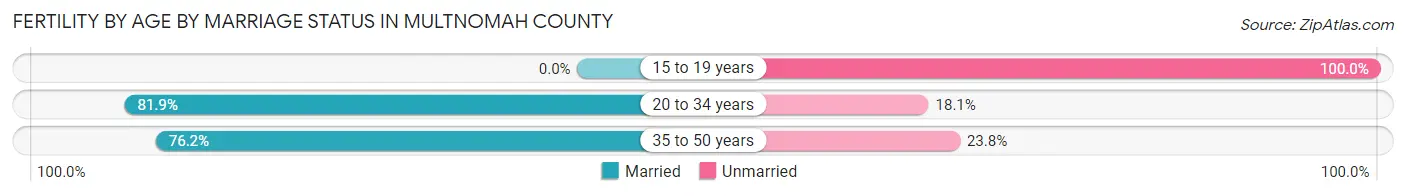
Fertility by Age by Marriage Status in Multnomah County
79.3% of women with births (7,551) in Multnomah County are married. The highest percentage of unmarried women with births falls into 15 to 19 years age bracket with 100.0% of them unmarried at the time of birth, while the lowest percentage of unmarried women with births belong to 20 to 34 years age bracket with 18.1% of them unmarried.
| Age Bracket | Married | Unmarried |
| 15 to 19 years | 0 (0.0%) | 16 (100.0%) |
| 20 to 34 years | 3,555 (81.9%) | 786 (18.1%) |
| 35 to 50 years | 2,434 (76.2%) | 760 (23.8%) |
| Total | 5,988 (79.3%) | 1,563 (20.7%) |
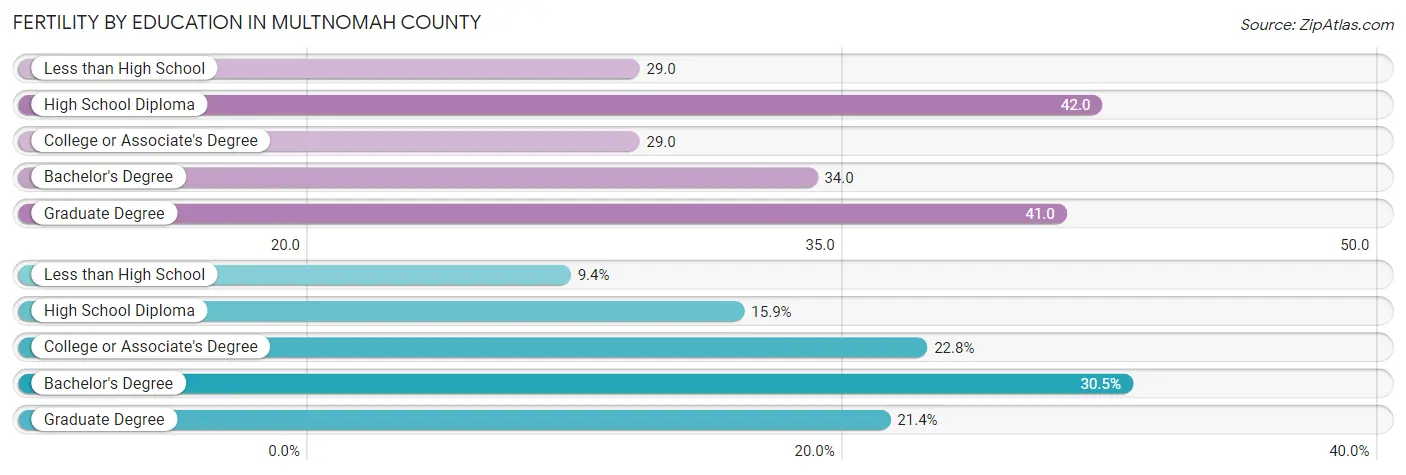
Fertility by Education in Multnomah County
Average fertility rate in Multnomah County is 35.0 births per 1,000 women. Women with the education attainment of high school diploma have the highest fertility rate of 42.0 births per 1,000 women, while women with the education attainment of less than high school have the lowest fertility at 29.0 births per 1,000 women. Women with the education attainment of bachelor's degree represent 30.5% of all women with births.
| Educational Attainment | Women with Births | Births / 1,000 Women |
| Less than High School | 711 (9.4%) | 29.0 |
| High School Diploma | 1,203 (15.9%) | 42.0 |
| College or Associate's Degree | 1,720 (22.8%) | 29.0 |
| Bachelor's Degree | 2,301 (30.5%) | 34.0 |
| Graduate Degree | 1,616 (21.4%) | 41.0 |
| Total | 7,551 (100.0%) | 35.0 |
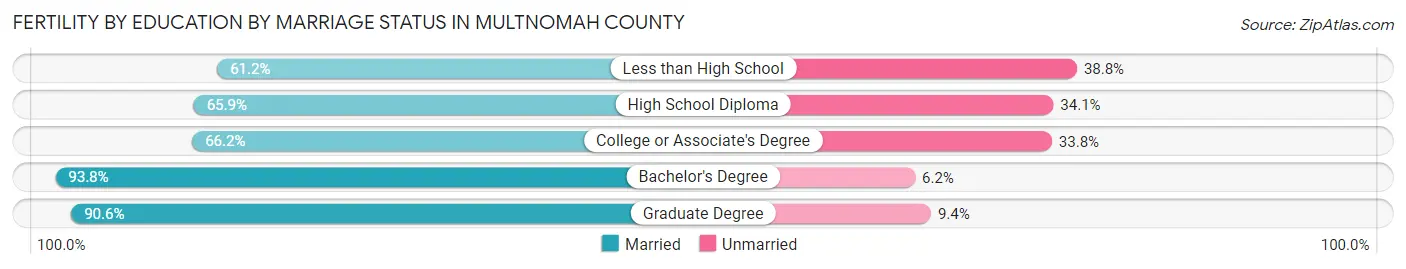
Fertility by Education by Marriage Status in Multnomah County
20.7% of women with births in Multnomah County are unmarried. Women with the educational attainment of bachelor's degree are most likely to be married with 93.8% of them married at childbirth, while women with the educational attainment of less than high school are least likely to be married with 38.8% of them unmarried at childbirth.
| Educational Attainment | Married | Unmarried |
| Less than High School | 435 (61.2%) | 276 (38.8%) |
| High School Diploma | 793 (65.9%) | 410 (34.1%) |
| College or Associate's Degree | 1,139 (66.2%) | 581 (33.8%) |
| Bachelor's Degree | 2,158 (93.8%) | 143 (6.2%) |
| Graduate Degree | 1,464 (90.6%) | 152 (9.4%) |
| Total | 5,988 (79.3%) | 1,563 (20.7%) |
Income in Multnomah County
Income Overview in Multnomah County
Per Capita Income in Multnomah County is $49,713, while median incomes of families and households are $109,513 and $83,668 respectively.
| Characteristic | Number | Measure |
| Per Capita Income | 808,098 | $49,713 |
| Median Family Income | 178,435 | $109,513 |
| Mean Family Income | 178,435 | $143,006 |
| Median Household Income | 343,370 | $83,668 |
| Mean Household Income | 343,370 | $115,049 |
| Income Deficit | 178,435 | $10,819 |
| Wage / Income Gap (%) | 808,098 | 18.15% |
| Wage / Income Gap ($) | 808,098 | 81.85¢ per $1 |
| Gini / Inequality Index | 808,098 | 0.47 |
Earnings by Sex in Multnomah County
Average Earnings in Multnomah County are $46,396, $51,196 for men and $41,905 for women, a difference of 18.1%.
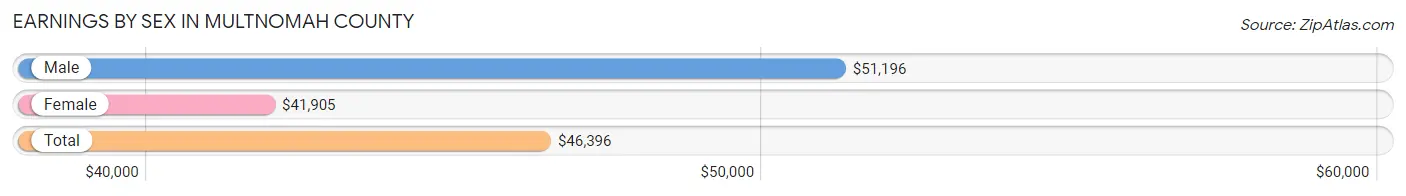
| Sex | Number | Average Earnings |
| Male | 254,398 (51.6%) | $51,196 |
| Female | 238,419 (48.4%) | $41,905 |
| Total | 492,817 (100.0%) | $46,396 |
Earnings by Sex by Income Bracket in Multnomah County
The most common earnings brackets in Multnomah County are $100,000+ for men (55,904 | 22.0%) and $100,000+ for women (35,365 | 14.8%).
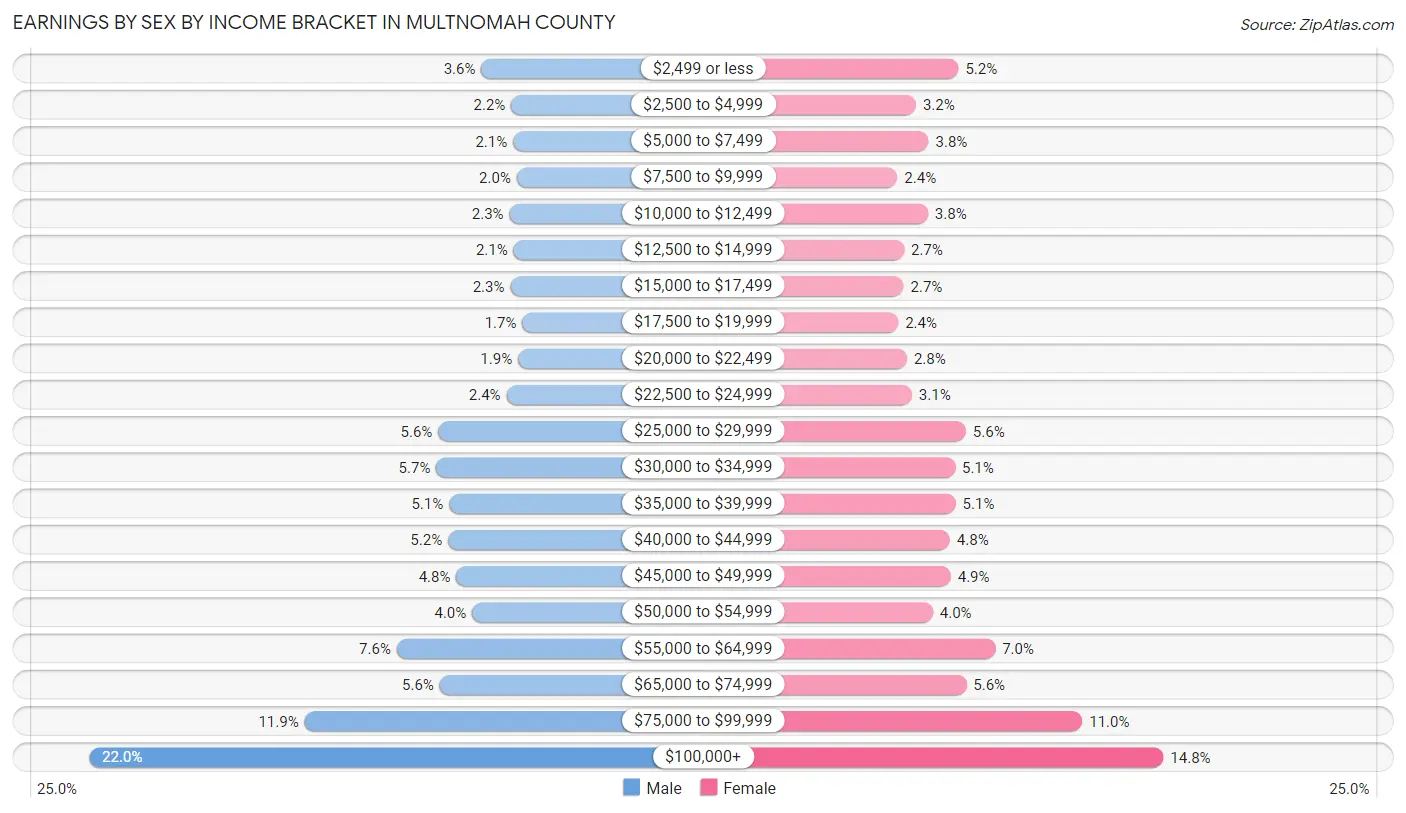
| Income | Male | Female |
| $2,499 or less | 9,183 (3.6%) | 12,475 (5.2%) |
| $2,500 to $4,999 | 5,624 (2.2%) | 7,719 (3.2%) |
| $5,000 to $7,499 | 5,392 (2.1%) | 9,138 (3.8%) |
| $7,500 to $9,999 | 4,972 (1.9%) | 5,653 (2.4%) |
| $10,000 to $12,499 | 5,824 (2.3%) | 9,069 (3.8%) |
| $12,500 to $14,999 | 5,333 (2.1%) | 6,396 (2.7%) |
| $15,000 to $17,499 | 5,721 (2.2%) | 6,334 (2.7%) |
| $17,500 to $19,999 | 4,298 (1.7%) | 5,757 (2.4%) |
| $20,000 to $22,499 | 4,815 (1.9%) | 6,712 (2.8%) |
| $22,500 to $24,999 | 6,183 (2.4%) | 7,280 (3.0%) |
| $25,000 to $29,999 | 14,325 (5.6%) | 13,299 (5.6%) |
| $30,000 to $34,999 | 14,543 (5.7%) | 12,099 (5.1%) |
| $35,000 to $39,999 | 13,034 (5.1%) | 12,169 (5.1%) |
| $40,000 to $44,999 | 13,155 (5.2%) | 11,526 (4.8%) |
| $45,000 to $49,999 | 12,153 (4.8%) | 11,621 (4.9%) |
| $50,000 to $54,999 | 10,281 (4.0%) | 9,605 (4.0%) |
| $55,000 to $64,999 | 19,260 (7.6%) | 16,572 (7.0%) |
| $65,000 to $74,999 | 14,150 (5.6%) | 13,342 (5.6%) |
| $75,000 to $99,999 | 30,248 (11.9%) | 26,288 (11.0%) |
| $100,000+ | 55,904 (22.0%) | 35,365 (14.8%) |
| Total | 254,398 (100.0%) | 238,419 (100.0%) |
Earnings by Sex by Educational Attainment in Multnomah County
Average earnings in Multnomah County are $56,671 for men and $47,268 for women, a difference of 16.6%. Men with an educational attainment of graduate degree enjoy the highest average annual earnings of $97,759, while those with less than high school education earn the least with $33,562. Women with an educational attainment of graduate degree earn the most with the average annual earnings of $76,626, while those with less than high school education have the smallest earnings of $23,762.
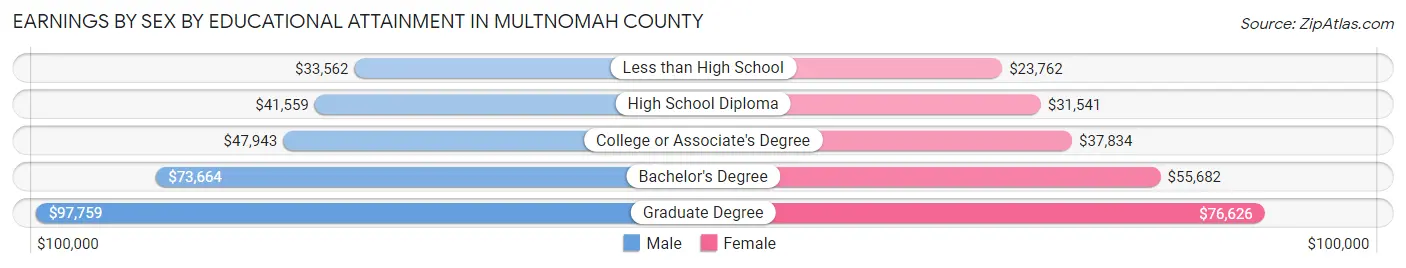
| Educational Attainment | Male Income | Female Income |
| Less than High School | $33,562 | $23,762 |
| High School Diploma | $41,559 | $31,541 |
| College or Associate's Degree | $47,943 | $37,834 |
| Bachelor's Degree | $73,664 | $55,682 |
| Graduate Degree | $97,759 | $76,626 |
| Total | $56,671 | $47,268 |
Family Income in Multnomah County
Family Income Brackets in Multnomah County
According to the Multnomah County family income data, there are 37,114 families falling into the $100,000 to $149,999 income range, which is the most common income bracket and makes up 20.8% of all families. Conversely, the $10,000 to $14,999 income bracket is the least frequent group with only 2,498 families (1.4%) belonging to this category.
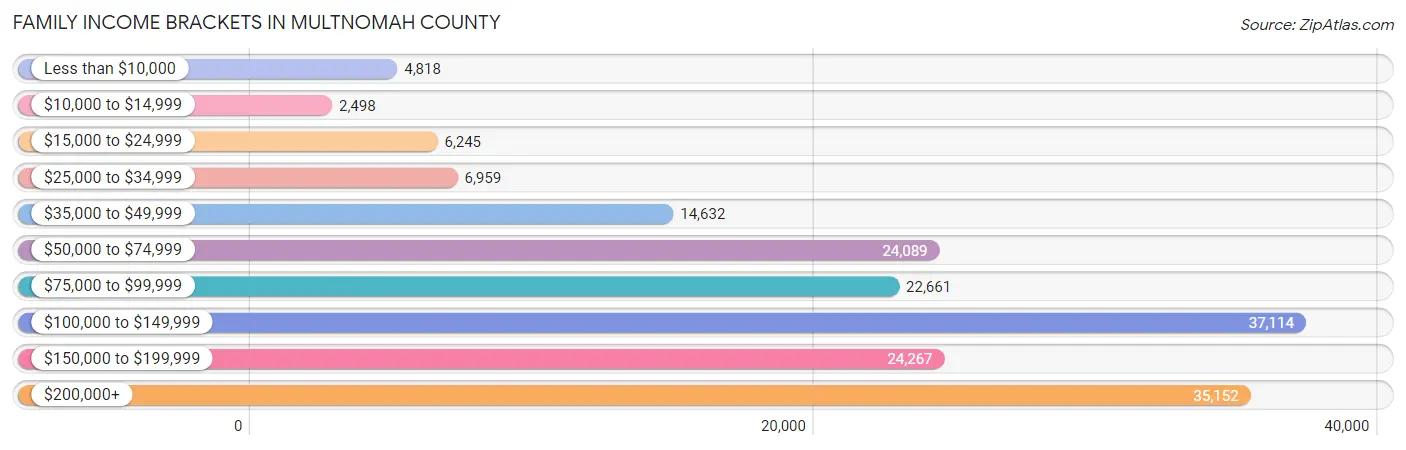
| Income Bracket | # Families | % Families |
| Less than $10,000 | 4,818 | 2.7% |
| $10,000 to $14,999 | 2,498 | 1.4% |
| $15,000 to $24,999 | 6,245 | 3.5% |
| $25,000 to $34,999 | 6,959 | 3.9% |
| $35,000 to $49,999 | 14,632 | 8.2% |
| $50,000 to $74,999 | 24,089 | 13.5% |
| $75,000 to $99,999 | 22,661 | 12.7% |
| $100,000 to $149,999 | 37,114 | 20.8% |
| $150,000 to $199,999 | 24,267 | 13.6% |
| $200,000+ | 35,152 | 19.7% |
Family Income by Famaliy Size in Multnomah County
4-person families (32,321 | 18.1%) account for the highest median family income in Multnomah County with $136,838 per family, while 2-person families (88,163 | 49.4%) have the highest median income of $48,556 per family member.
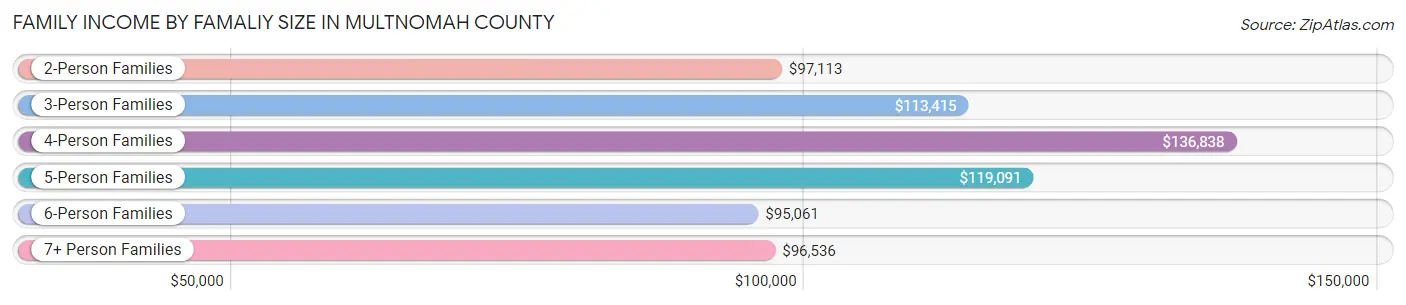
| Income Bracket | # Families | Median Income |
| 2-Person Families | 88,163 (49.4%) | $97,113 |
| 3-Person Families | 40,557 (22.7%) | $113,415 |
| 4-Person Families | 32,321 (18.1%) | $136,838 |
| 5-Person Families | 10,573 (5.9%) | $119,091 |
| 6-Person Families | 4,146 (2.3%) | $95,061 |
| 7+ Person Families | 2,675 (1.5%) | $96,536 |
| Total | 178,435 (100.0%) | $109,513 |
Family Income by Number of Earners in Multnomah County
The median family income in Multnomah County is $109,513, with families comprising 3+ earners (19,587) having the highest median family income of $149,425, while families with no earners (21,878) have the lowest median family income of $63,901, accounting for 11.0% and 12.3% of families, respectively.
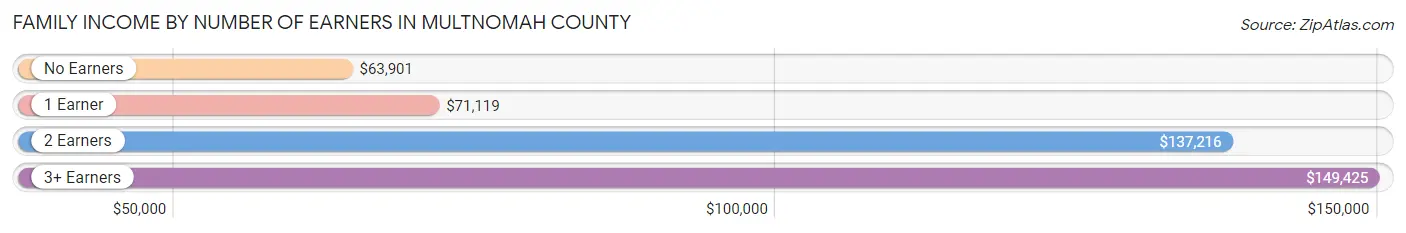
| Number of Earners | # Families | Median Income |
| No Earners | 21,878 (12.3%) | $63,901 |
| 1 Earner | 52,077 (29.2%) | $71,119 |
| 2 Earners | 84,893 (47.6%) | $137,216 |
| 3+ Earners | 19,587 (11.0%) | $149,425 |
| Total | 178,435 (100.0%) | $109,513 |
Household Income in Multnomah County
Household Income Brackets in Multnomah County
With 62,837 households falling in the category, the $100,000 to $149,999 income range is the most frequent in Multnomah County, accounting for 18.3% of all households. In contrast, only 13,391 households (3.9%) fall into the $10,000 to $14,999 income bracket, making it the least populous group.
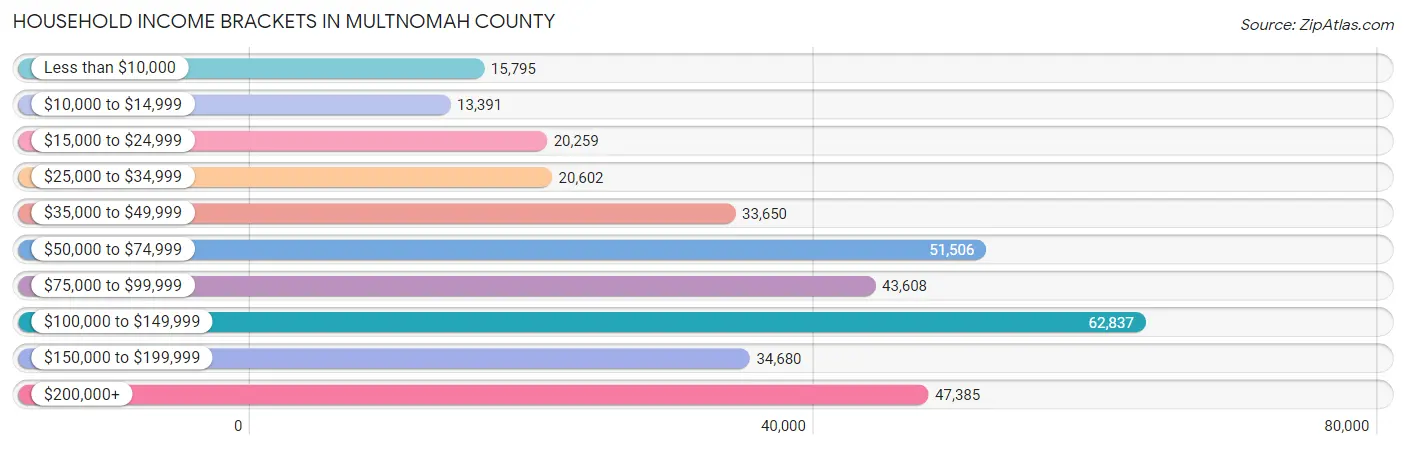
| Income Bracket | # Households | % Households |
| Less than $10,000 | 15,795 | 4.6% |
| $10,000 to $14,999 | 13,391 | 3.9% |
| $15,000 to $24,999 | 20,259 | 5.9% |
| $25,000 to $34,999 | 20,602 | 6.0% |
| $35,000 to $49,999 | 33,650 | 9.8% |
| $50,000 to $74,999 | 51,506 | 15.0% |
| $75,000 to $99,999 | 43,608 | 12.7% |
| $100,000 to $149,999 | 62,837 | 18.3% |
| $150,000 to $199,999 | 34,680 | 10.1% |
| $200,000+ | 47,385 | 13.8% |
Household Income by Householder Age in Multnomah County
The median household income in Multnomah County is $83,668, with the highest median household income of $94,492 found in the 45 to 64 years age bracket for the primary householder. A total of 115,292 households (33.6%) fall into this category. Meanwhile, the 15 to 24 years age bracket for the primary householder has the lowest median household income of $43,140, with 12,694 households (3.7%) in this group.
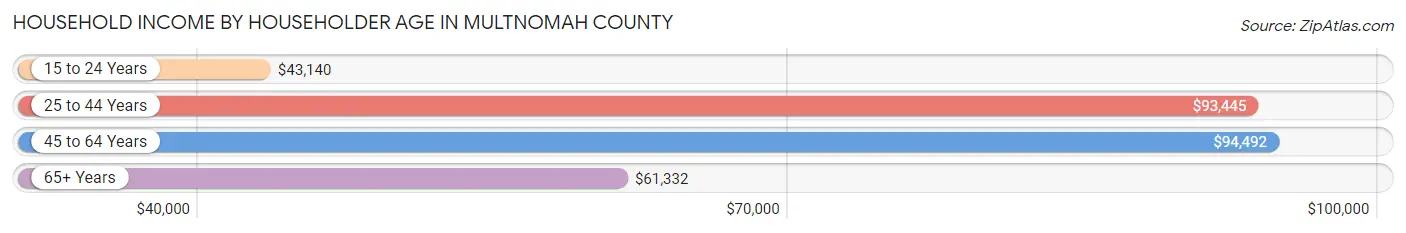
| Income Bracket | # Households | Median Income |
| 15 to 24 Years | 12,694 (3.7%) | $43,140 |
| 25 to 44 Years | 143,011 (41.6%) | $93,445 |
| 45 to 64 Years | 115,292 (33.6%) | $94,492 |
| 65+ Years | 72,373 (21.1%) | $61,332 |
| Total | 343,370 (100.0%) | $83,668 |
Poverty in Multnomah County
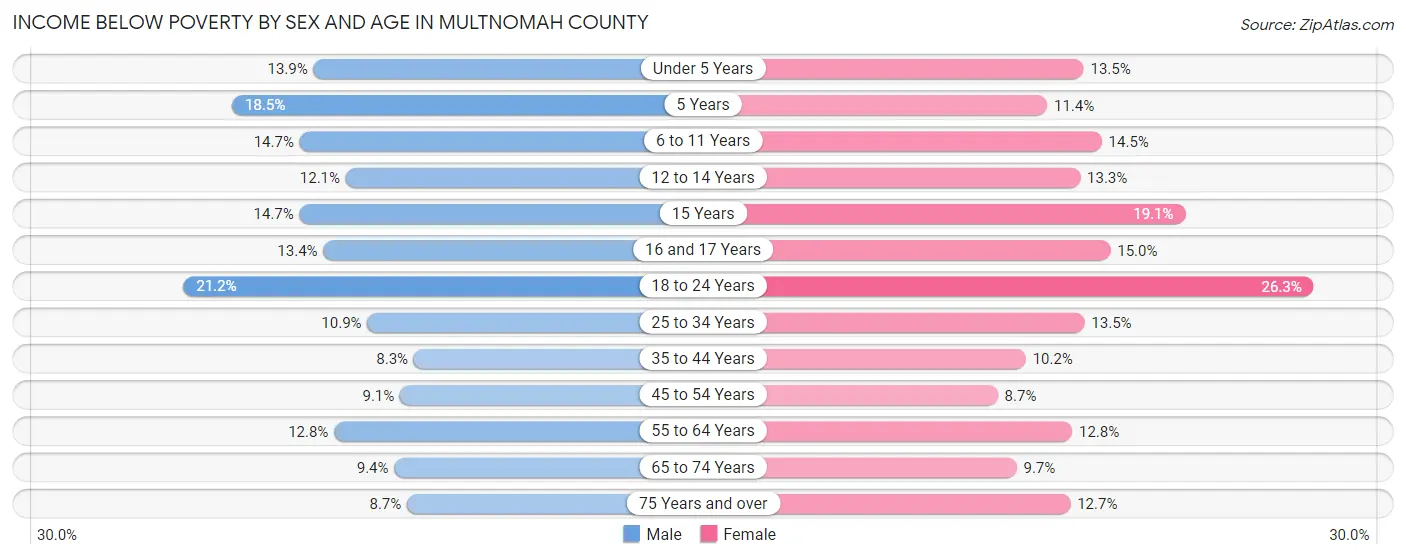
Income Below Poverty by Sex and Age in Multnomah County
With 11.6% poverty level for males and 12.9% for females among the residents of Multnomah County, 18 to 24 year old males and 18 to 24 year old females are the most vulnerable to poverty, with 6,274 males (21.2%) and 7,292 females (26.3%) in their respective age groups living below the poverty level.
| Age Bracket | Male | Female |
| Under 5 Years | 2,757 (13.9%) | 2,502 (13.5%) |
| 5 Years | 742 (18.4%) | 400 (11.4%) |
| 6 to 11 Years | 3,744 (14.7%) | 3,439 (14.5%) |
| 12 to 14 Years | 1,435 (12.1%) | 1,630 (13.3%) |
| 15 Years | 615 (14.7%) | 787 (19.1%) |
| 16 and 17 Years | 1,079 (13.4%) | 1,144 (14.9%) |
| 18 to 24 Years | 6,274 (21.2%) | 7,292 (26.3%) |
| 25 to 34 Years | 7,977 (10.9%) | 9,993 (13.5%) |
| 35 to 44 Years | 5,790 (8.3%) | 6,818 (10.2%) |
| 45 to 54 Years | 5,124 (9.1%) | 4,519 (8.7%) |
| 55 to 64 Years | 5,763 (12.8%) | 5,745 (12.8%) |
| 65 to 74 Years | 3,149 (9.4%) | 3,641 (9.7%) |
| 75 Years and over | 1,430 (8.7%) | 3,061 (12.7%) |
| Total | 45,879 (11.6%) | 50,971 (12.9%) |
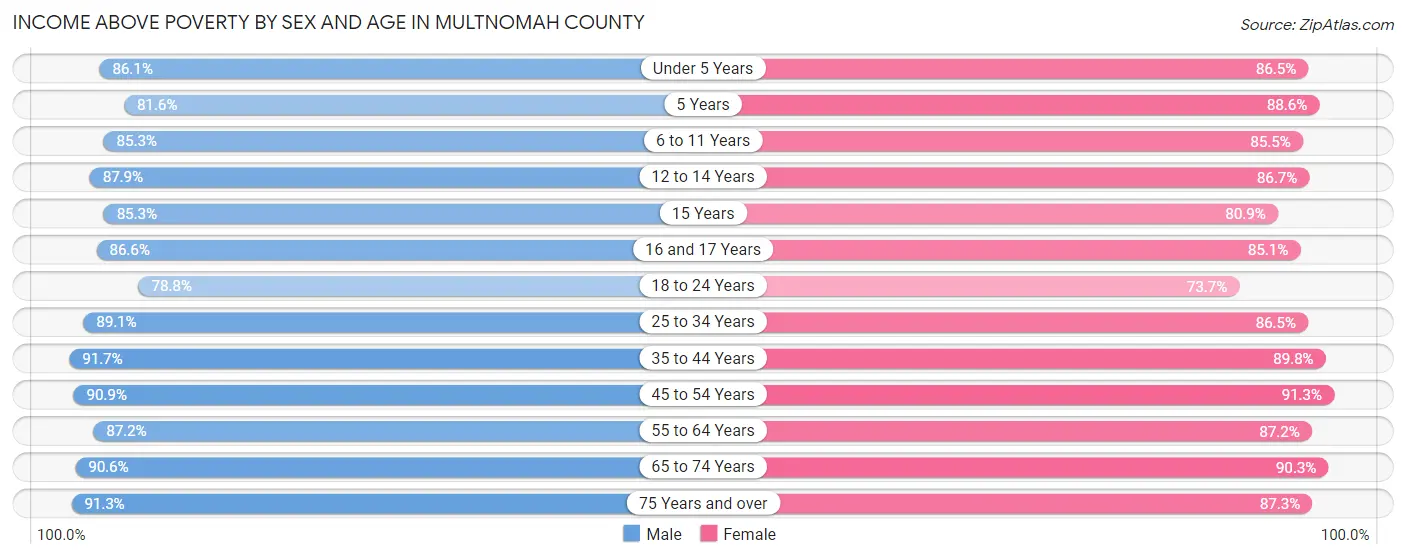
Income Above Poverty by Sex and Age in Multnomah County
According to the poverty statistics in Multnomah County, males aged 35 to 44 years and females aged 45 to 54 years are the age groups that are most secure financially, with 91.7% of males and 91.3% of females in these age groups living above the poverty line.
| Age Bracket | Male | Female |
| Under 5 Years | 17,064 (86.1%) | 16,084 (86.5%) |
| 5 Years | 3,280 (81.6%) | 3,100 (88.6%) |
| 6 to 11 Years | 21,753 (85.3%) | 20,330 (85.5%) |
| 12 to 14 Years | 10,410 (87.9%) | 10,652 (86.7%) |
| 15 Years | 3,571 (85.3%) | 3,327 (80.9%) |
| 16 and 17 Years | 6,995 (86.6%) | 6,510 (85.1%) |
| 18 to 24 Years | 23,378 (78.8%) | 20,466 (73.7%) |
| 25 to 34 Years | 65,119 (89.1%) | 64,000 (86.5%) |
| 35 to 44 Years | 63,824 (91.7%) | 59,780 (89.8%) |
| 45 to 54 Years | 51,224 (90.9%) | 47,531 (91.3%) |
| 55 to 64 Years | 39,415 (87.2%) | 39,067 (87.2%) |
| 65 to 74 Years | 30,306 (90.6%) | 33,795 (90.3%) |
| 75 Years and over | 15,007 (91.3%) | 21,009 (87.3%) |
| Total | 351,346 (88.4%) | 345,651 (87.2%) |
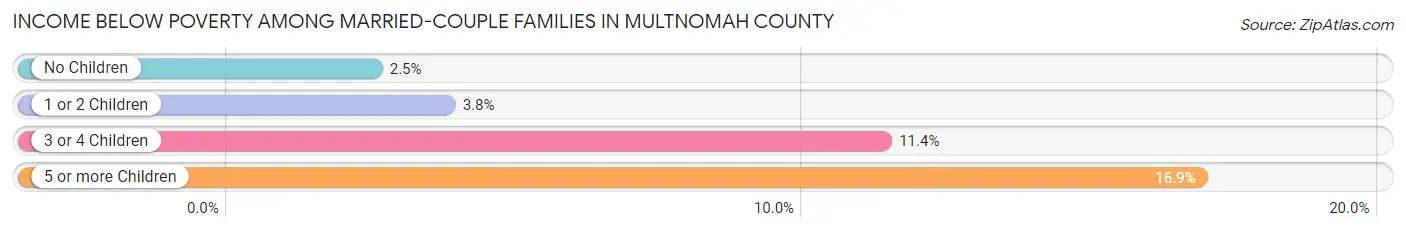
Income Below Poverty Among Married-Couple Families in Multnomah County
The poverty statistics for married-couple families in Multnomah County show that 3.5% or 4,729 of the total 133,467 families live below the poverty line. Families with 5 or more children have the highest poverty rate of 16.9%, comprising of 107 families. On the other hand, families with no children have the lowest poverty rate of 2.5%, which includes 1,959 families.
| Children | Above Poverty | Below Poverty |
| No Children | 75,664 (97.5%) | 1,959 (2.5%) |
| 1 or 2 Children | 45,886 (96.2%) | 1,807 (3.8%) |
| 3 or 4 Children | 6,661 (88.6%) | 856 (11.4%) |
| 5 or more Children | 527 (83.1%) | 107 (16.9%) |
| Total | 128,738 (96.5%) | 4,729 (3.5%) |
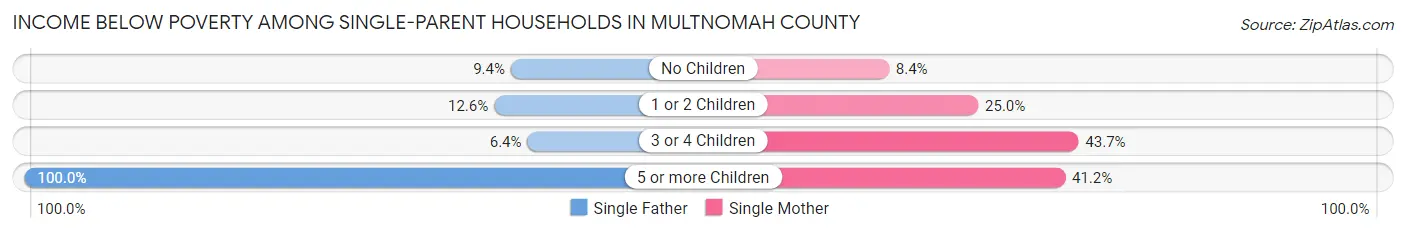
Income Below Poverty Among Single-Parent Households in Multnomah County
According to the poverty data in Multnomah County, 10.7% or 1,538 single-father households and 20.0% or 6,127 single-mother households are living below the poverty line. Among single-father households, those with 5 or more children have the highest poverty rate, with 13 households (100.0%) experiencing poverty. Likewise, among single-mother households, those with 3 or 4 children have the highest poverty rate, with 979 households (43.7%) falling below the poverty line.
| Children | Single Father | Single Mother |
| No Children | 611 (9.4%) | 1,022 (8.4%) |
| 1 or 2 Children | 844 (12.6%) | 3,992 (25.0%) |
| 3 or 4 Children | 70 (6.4%) | 979 (43.7%) |
| 5 or more Children | 13 (100.0%) | 134 (41.2%) |
| Total | 1,538 (10.7%) | 6,127 (20.0%) |
Income Below Poverty Among Married-Couple vs Single-Parent Households in Multnomah County
The poverty data for Multnomah County shows that 4,729 of the married-couple family households (3.5%) and 7,665 of the single-parent households (17.1%) are living below the poverty level. Within the married-couple family households, those with 5 or more children have the highest poverty rate, with 107 households (16.9%) falling below the poverty line. Among the single-parent households, those with 5 or more children have the highest poverty rate, with 147 household (43.5%) living below poverty.
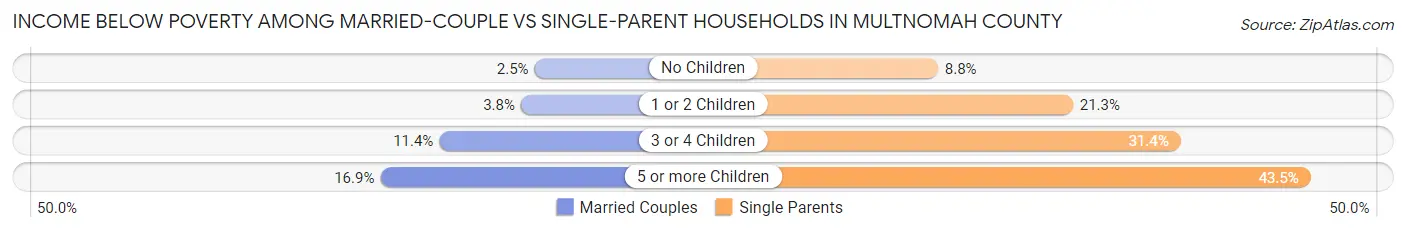
| Children | Married-Couple Families | Single-Parent Households |
| No Children | 1,959 (2.5%) | 1,633 (8.8%) |
| 1 or 2 Children | 1,807 (3.8%) | 4,836 (21.3%) |
| 3 or 4 Children | 856 (11.4%) | 1,049 (31.4%) |
| 5 or more Children | 107 (16.9%) | 147 (43.5%) |
| Total | 4,729 (3.5%) | 7,665 (17.1%) |
Employment Characteristics in Multnomah County
Employment by Class of Employer in Multnomah County
Among the 438,555 employed individuals in Multnomah County, private company employees (283,000 | 64.5%), not-for-profit organizations (53,526 | 12.2%), and self-employed (not incorporated) (30,229 | 6.9%) make up the most common classes of employment.
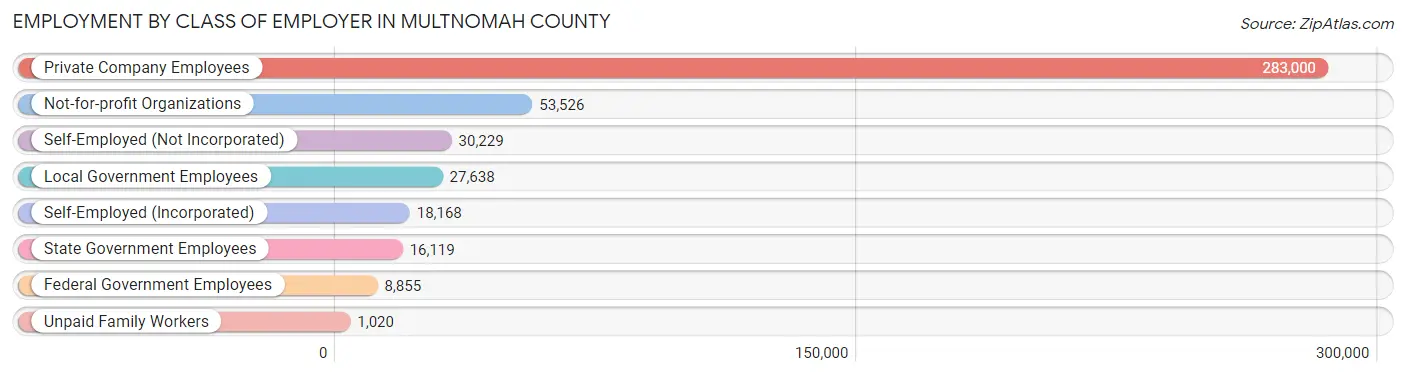
| Employer Class | # Employees | % Employees |
| Private Company Employees | 283,000 | 64.5% |
| Self-Employed (Incorporated) | 18,168 | 4.1% |
| Self-Employed (Not Incorporated) | 30,229 | 6.9% |
| Not-for-profit Organizations | 53,526 | 12.2% |
| Local Government Employees | 27,638 | 6.3% |
| State Government Employees | 16,119 | 3.7% |
| Federal Government Employees | 8,855 | 2.0% |
| Unpaid Family Workers | 1,020 | 0.2% |
| Total | 438,555 | 100.0% |
Employment Status by Age in Multnomah County
According to the labor force statistics for Multnomah County, out of the total population over 16 years of age (678,422), 70.0% or 474,895 individuals are in the labor force, with 5.5% or 26,119 of them unemployed. The age group with the highest labor force participation rate is 30 to 34 years, with 87.8% or 68,179 individuals in the labor force. Within the labor force, the 16 to 19 years age range has the highest percentage of unemployed individuals, with 18.0% or 2,280 of them being unemployed.
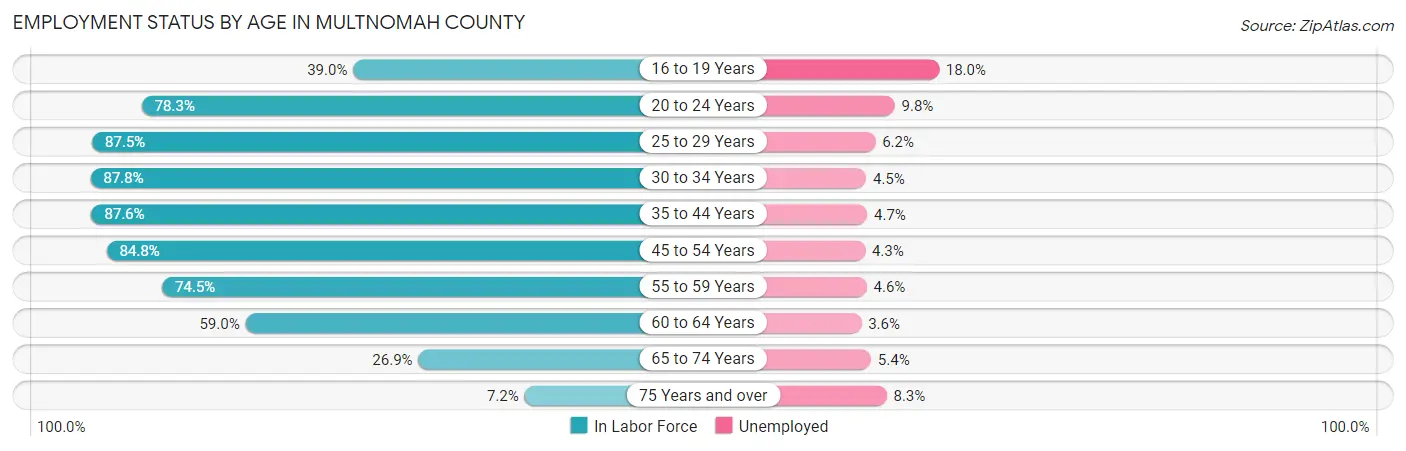
| Age Bracket | In Labor Force | Unemployed |
| 16 to 19 Years | 12,666 (39.0%) | 2,280 (18.0%) |
| 20 to 24 Years | 37,394 (78.3%) | 3,665 (9.8%) |
| 25 to 29 Years | 61,395 (87.5%) | 3,806 (6.2%) |
| 30 to 34 Years | 68,179 (87.8%) | 3,068 (4.5%) |
| 35 to 44 Years | 119,798 (87.6%) | 5,631 (4.7%) |
| 45 to 54 Years | 92,295 (84.8%) | 3,969 (4.3%) |
| 55 to 59 Years | 33,761 (74.5%) | 1,553 (4.6%) |
| 60 to 64 Years | 26,709 (59.0%) | 962 (3.6%) |
| 65 to 74 Years | 19,395 (26.9%) | 1,047 (5.4%) |
| 75 Years and over | 3,030 (7.2%) | 251 (8.3%) |
| Total | 474,895 (70.0%) | 26,119 (5.5%) |
Employment Status by Educational Attainment in Multnomah County
According to labor force statistics for Multnomah County, 83.1% of individuals (402,205) out of the total population between 25 and 64 years of age (484,001) are in the labor force, with 4.7% or 18,904 of them being unemployed. The group with the highest labor force participation rate are those with the educational attainment of bachelor's degree or higher, with 90.0% or 214,449 individuals in the labor force. Within the labor force, individuals with less than high school education have the highest percentage of unemployment, with 7.4% or 1,818 of them being unemployed.
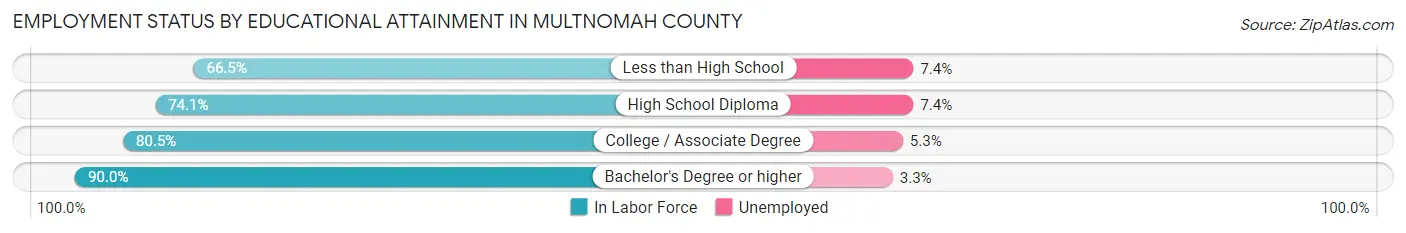
| Educational Attainment | In Labor Force | Unemployed |
| Less than High School | 24,564 (66.5%) | 2,733 (7.4%) |
| High School Diploma | 57,518 (74.1%) | 5,744 (7.4%) |
| College / Associate Degree | 105,587 (80.5%) | 6,952 (5.3%) |
| Bachelor's Degree or higher | 214,449 (90.0%) | 7,863 (3.3%) |
| Total | 402,205 (83.1%) | 22,748 (4.7%) |
Employment Occupations by Sex in Multnomah County
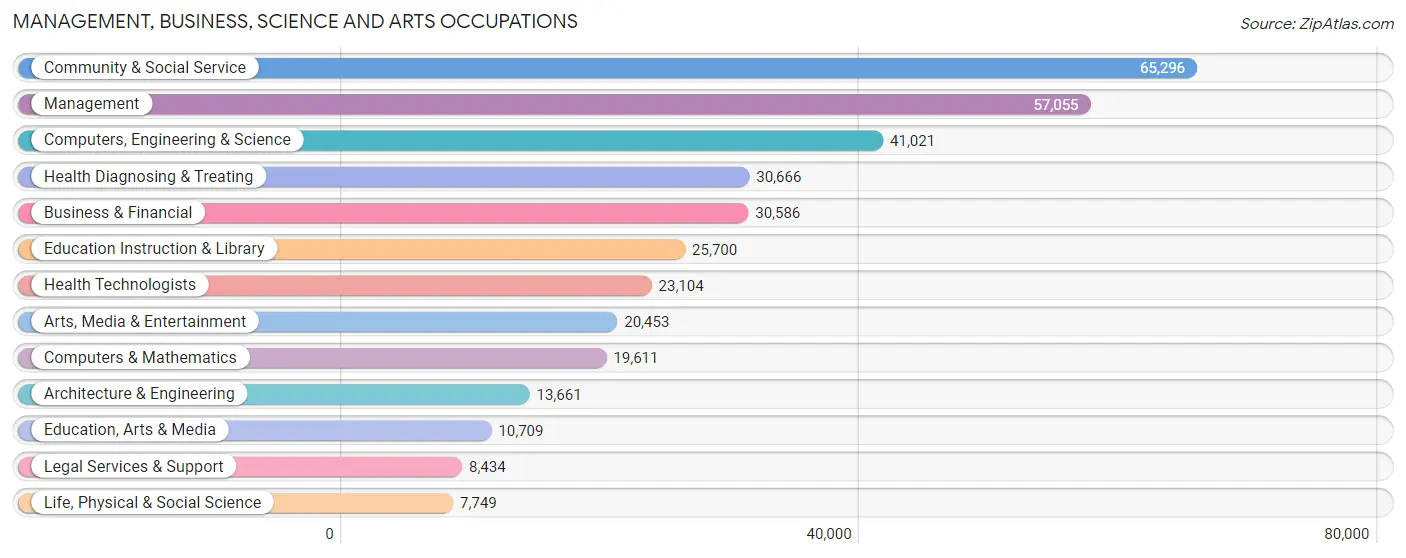
Management, Business, Science and Arts Occupations
The most common Management, Business, Science and Arts occupations in Multnomah County are Community & Social Service (65,296 | 14.6%), Management (57,055 | 12.7%), Computers, Engineering & Science (41,021 | 9.1%), Health Diagnosing & Treating (30,666 | 6.8%), and Business & Financial (30,586 | 6.8%).
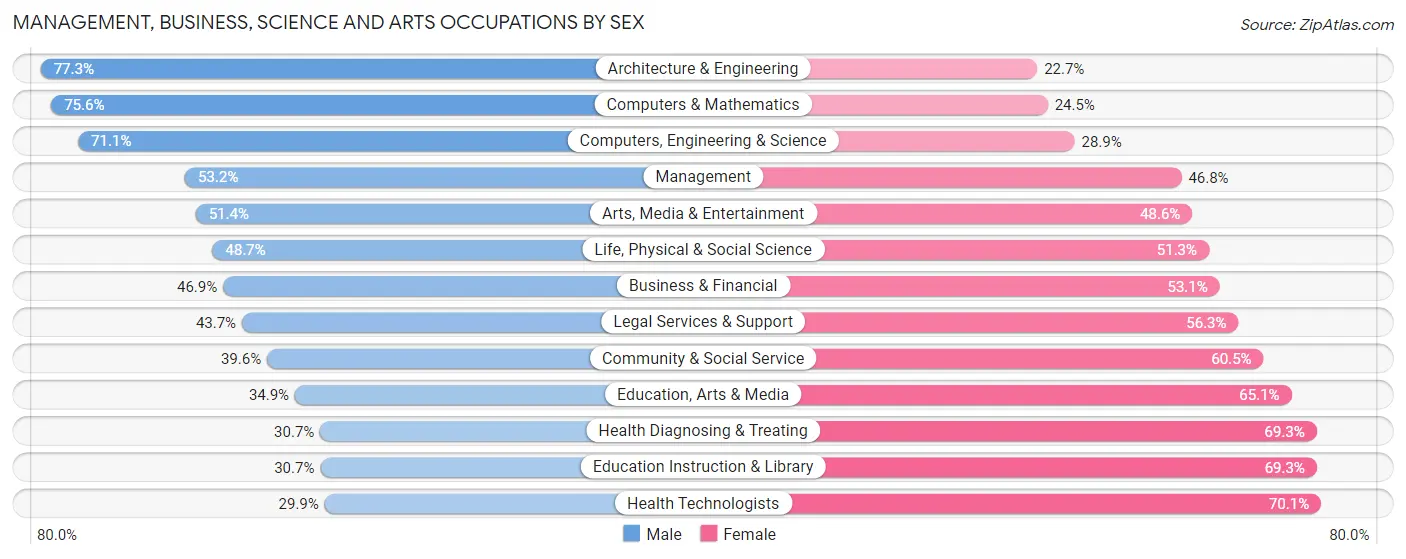
Management, Business, Science and Arts Occupations by Sex
Within the Management, Business, Science and Arts occupations in Multnomah County, the most male-oriented occupations are Architecture & Engineering (77.3%), Computers & Mathematics (75.5%), and Computers, Engineering & Science (71.1%), while the most female-oriented occupations are Health Technologists (70.1%), Education Instruction & Library (69.3%), and Health Diagnosing & Treating (69.3%).
| Occupation | Male | Female |
| Management | 30,372 (53.2%) | 26,683 (46.8%) |
| Business & Financial | 14,339 (46.9%) | 16,247 (53.1%) |
| Computers, Engineering & Science | 29,148 (71.1%) | 11,873 (28.9%) |
| Computers & Mathematics | 14,817 (75.5%) | 4,794 (24.4%) |
| Architecture & Engineering | 10,560 (77.3%) | 3,101 (22.7%) |
| Life, Physical & Social Science | 3,771 (48.7%) | 3,978 (51.3%) |
| Community & Social Service | 25,824 (39.6%) | 39,472 (60.5%) |
| Education, Arts & Media | 3,735 (34.9%) | 6,974 (65.1%) |
| Legal Services & Support | 3,688 (43.7%) | 4,746 (56.3%) |
| Education Instruction & Library | 7,880 (30.7%) | 17,820 (69.3%) |
| Arts, Media & Entertainment | 10,521 (51.4%) | 9,932 (48.6%) |
| Health Diagnosing & Treating | 9,408 (30.7%) | 21,258 (69.3%) |
| Health Technologists | 6,916 (29.9%) | 16,188 (70.1%) |
| Total (Category) | 109,091 (48.6%) | 115,533 (51.4%) |
| Total (Overall) | 231,423 (51.6%) | 216,833 (48.4%) |
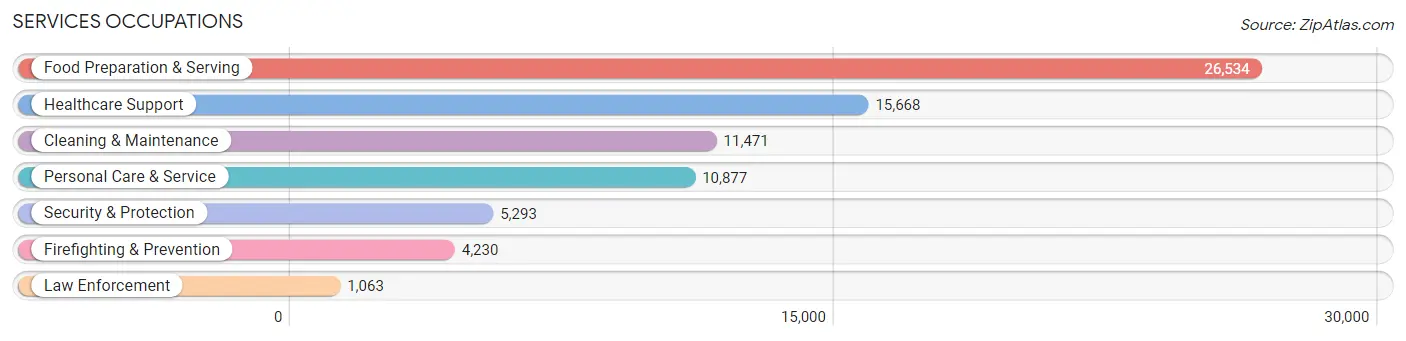
Services Occupations
The most common Services occupations in Multnomah County are Food Preparation & Serving (26,534 | 5.9%), Healthcare Support (15,668 | 3.5%), Cleaning & Maintenance (11,471 | 2.6%), Personal Care & Service (10,877 | 2.4%), and Security & Protection (5,293 | 1.2%).
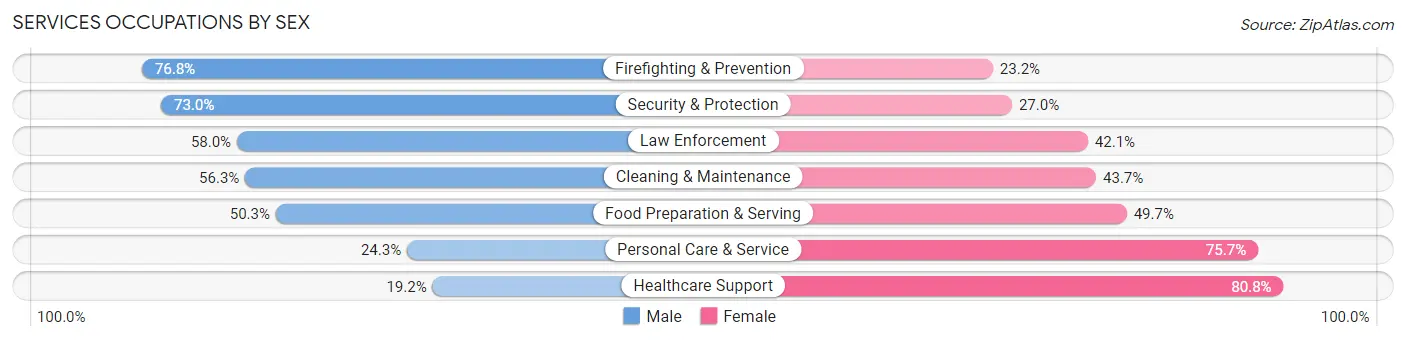
Services Occupations by Sex
Within the Services occupations in Multnomah County, the most male-oriented occupations are Firefighting & Prevention (76.8%), Security & Protection (73.0%), and Law Enforcement (58.0%), while the most female-oriented occupations are Healthcare Support (80.8%), Personal Care & Service (75.7%), and Food Preparation & Serving (49.7%).
| Occupation | Male | Female |
| Healthcare Support | 3,013 (19.2%) | 12,655 (80.8%) |
| Security & Protection | 3,863 (73.0%) | 1,430 (27.0%) |
| Firefighting & Prevention | 3,247 (76.8%) | 983 (23.2%) |
| Law Enforcement | 616 (58.0%) | 447 (42.0%) |
| Food Preparation & Serving | 13,335 (50.3%) | 13,199 (49.7%) |
| Cleaning & Maintenance | 6,461 (56.3%) | 5,010 (43.7%) |
| Personal Care & Service | 2,641 (24.3%) | 8,236 (75.7%) |
| Total (Category) | 29,313 (42.0%) | 40,530 (58.0%) |
| Total (Overall) | 231,423 (51.6%) | 216,833 (48.4%) |
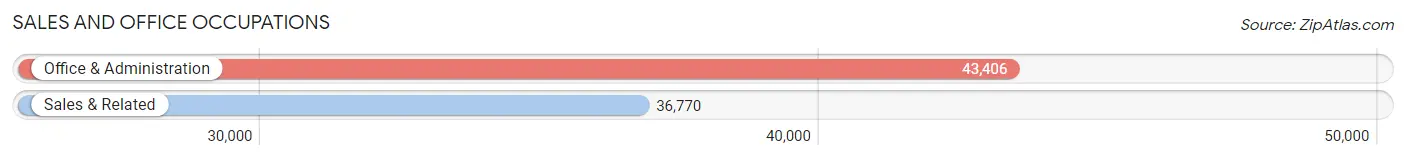
Sales and Office Occupations
The most common Sales and Office occupations in Multnomah County are Office & Administration (43,406 | 9.7%), and Sales & Related (36,770 | 8.2%).
Sales and Office Occupations by Sex
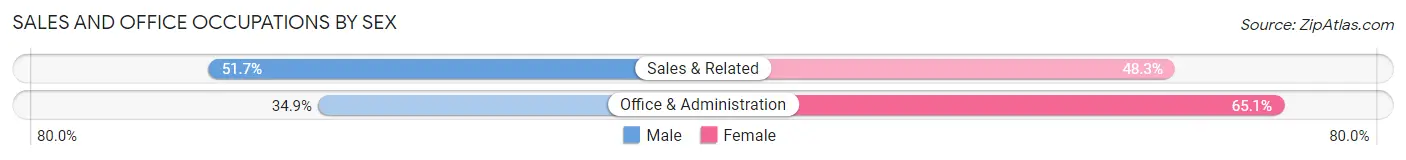
| Occupation | Male | Female |
| Sales & Related | 18,999 (51.7%) | 17,771 (48.3%) |
| Office & Administration | 15,140 (34.9%) | 28,266 (65.1%) |
| Total (Category) | 34,139 (42.6%) | 46,037 (57.4%) |
| Total (Overall) | 231,423 (51.6%) | 216,833 (48.4%) |
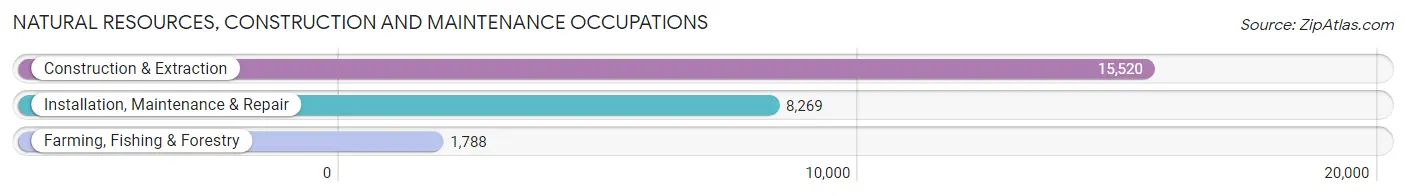
Natural Resources, Construction and Maintenance Occupations
The most common Natural Resources, Construction and Maintenance occupations in Multnomah County are Construction & Extraction (15,520 | 3.5%), Installation, Maintenance & Repair (8,269 | 1.8%), and Farming, Fishing & Forestry (1,788 | 0.4%).
Natural Resources, Construction and Maintenance Occupations by Sex
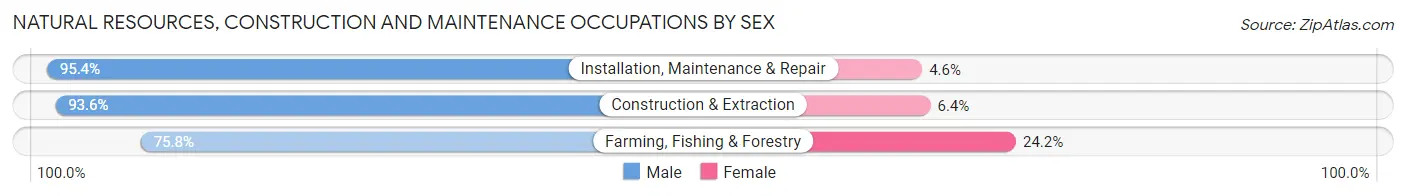
| Occupation | Male | Female |
| Farming, Fishing & Forestry | 1,356 (75.8%) | 432 (24.2%) |
| Construction & Extraction | 14,532 (93.6%) | 988 (6.4%) |
| Installation, Maintenance & Repair | 7,885 (95.4%) | 384 (4.6%) |
| Total (Category) | 23,773 (92.9%) | 1,804 (7.0%) |
| Total (Overall) | 231,423 (51.6%) | 216,833 (48.4%) |
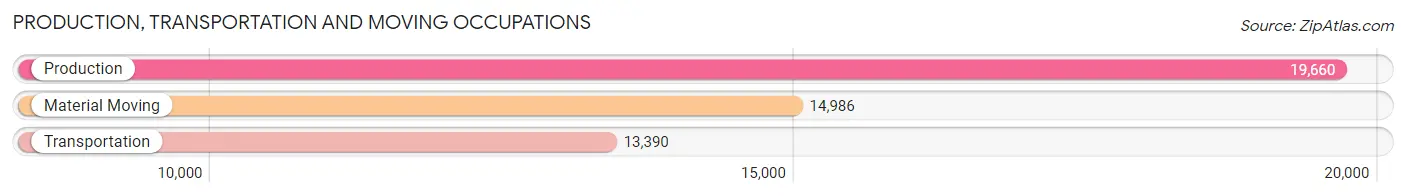
Production, Transportation and Moving Occupations
The most common Production, Transportation and Moving occupations in Multnomah County are Production (19,660 | 4.4%), Material Moving (14,986 | 3.3%), and Transportation (13,390 | 3.0%).
Production, Transportation and Moving Occupations by Sex
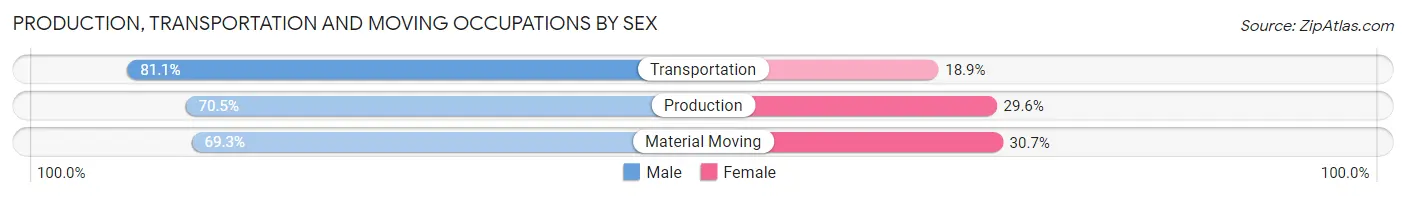
| Occupation | Male | Female |
| Production | 13,851 (70.5%) | 5,809 (29.5%) |
| Transportation | 10,864 (81.1%) | 2,526 (18.9%) |
| Material Moving | 10,392 (69.3%) | 4,594 (30.7%) |
| Total (Category) | 35,107 (73.1%) | 12,929 (26.9%) |
| Total (Overall) | 231,423 (51.6%) | 216,833 (48.4%) |
Employment Industries by Sex in Multnomah County
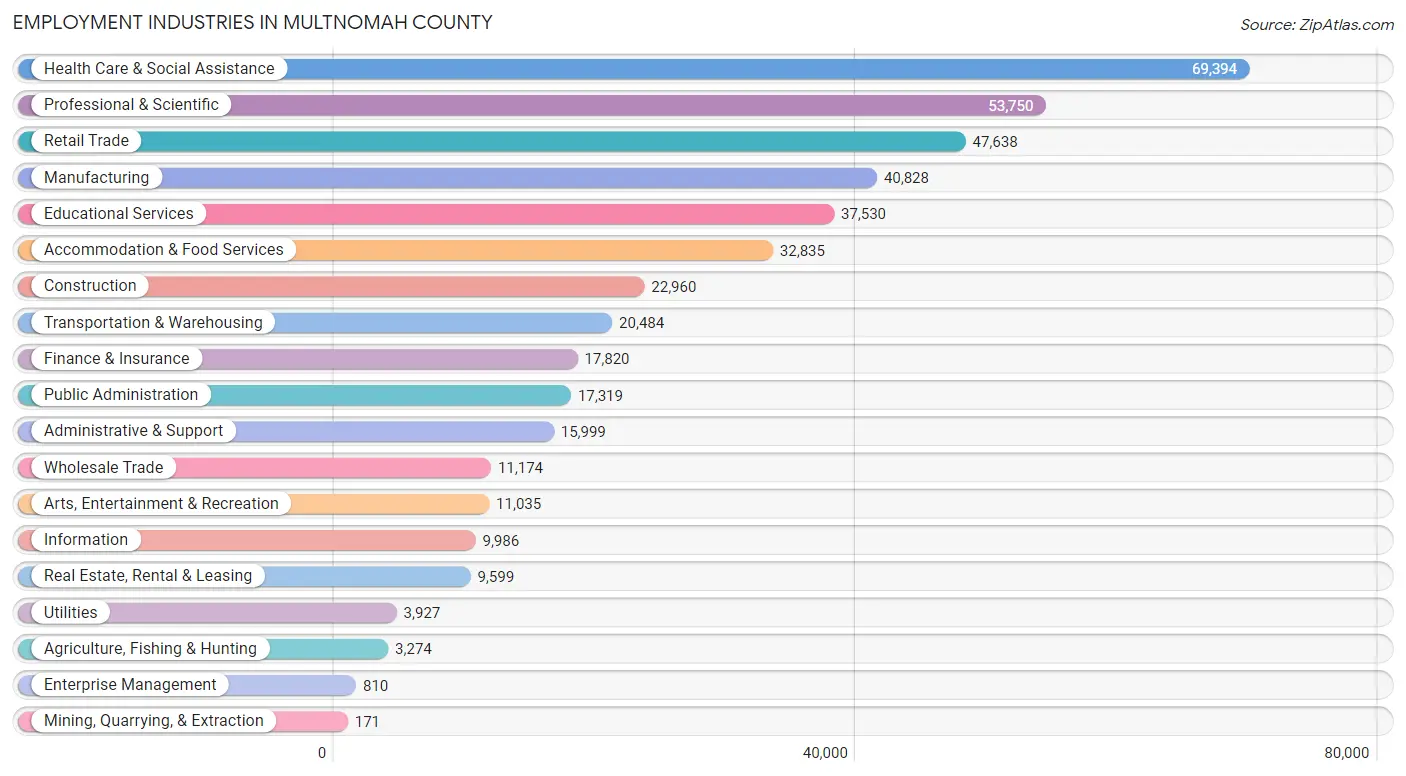
Employment Industries in Multnomah County
The major employment industries in Multnomah County include Health Care & Social Assistance (69,394 | 15.5%), Professional & Scientific (53,750 | 12.0%), Retail Trade (47,638 | 10.6%), Manufacturing (40,828 | 9.1%), and Educational Services (37,530 | 8.4%).
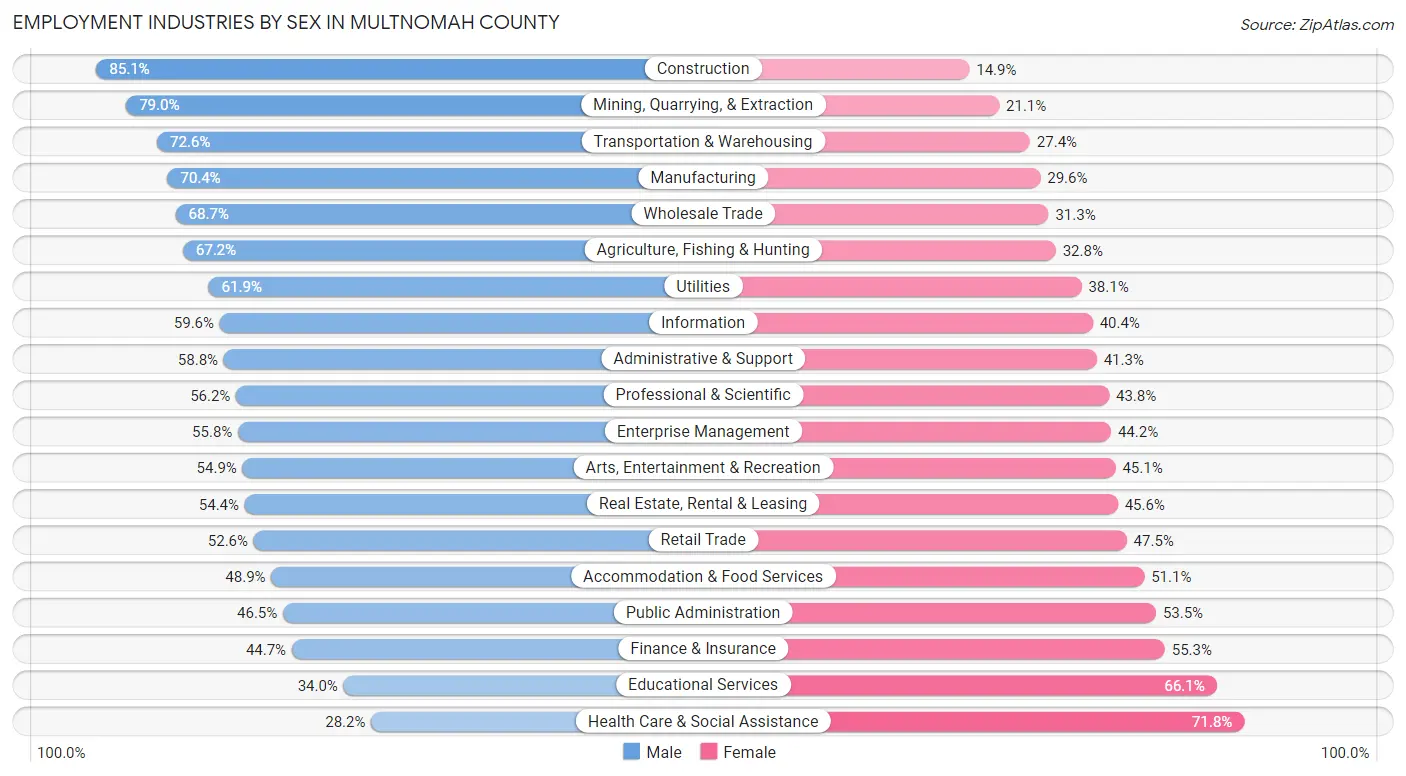
Employment Industries by Sex in Multnomah County
The Multnomah County industries that see more men than women are Construction (85.1%), Mining, Quarrying, & Extraction (78.9%), and Transportation & Warehousing (72.6%), whereas the industries that tend to have a higher number of women are Health Care & Social Assistance (71.8%), Educational Services (66.0%), and Finance & Insurance (55.3%).
| Industry | Male | Female |
| Agriculture, Fishing & Hunting | 2,201 (67.2%) | 1,073 (32.8%) |
| Mining, Quarrying, & Extraction | 135 (78.9%) | 36 (21.0%) |
| Construction | 19,545 (85.1%) | 3,415 (14.9%) |
| Manufacturing | 28,756 (70.4%) | 12,072 (29.6%) |
| Wholesale Trade | 7,680 (68.7%) | 3,494 (31.3%) |
| Retail Trade | 25,035 (52.5%) | 22,603 (47.4%) |
| Transportation & Warehousing | 14,867 (72.6%) | 5,617 (27.4%) |
| Utilities | 2,431 (61.9%) | 1,496 (38.1%) |
| Information | 5,950 (59.6%) | 4,036 (40.4%) |
| Finance & Insurance | 7,959 (44.7%) | 9,861 (55.3%) |
| Real Estate, Rental & Leasing | 5,223 (54.4%) | 4,376 (45.6%) |
| Professional & Scientific | 30,206 (56.2%) | 23,544 (43.8%) |
| Enterprise Management | 452 (55.8%) | 358 (44.2%) |
| Administrative & Support | 9,399 (58.8%) | 6,600 (41.2%) |
| Educational Services | 12,740 (34.0%) | 24,790 (66.0%) |
| Health Care & Social Assistance | 19,600 (28.2%) | 49,794 (71.8%) |
| Arts, Entertainment & Recreation | 6,054 (54.9%) | 4,981 (45.1%) |
| Accommodation & Food Services | 16,059 (48.9%) | 16,776 (51.1%) |
| Public Administration | 8,052 (46.5%) | 9,267 (53.5%) |
| Total | 231,423 (51.6%) | 216,833 (48.4%) |
Education in Multnomah County
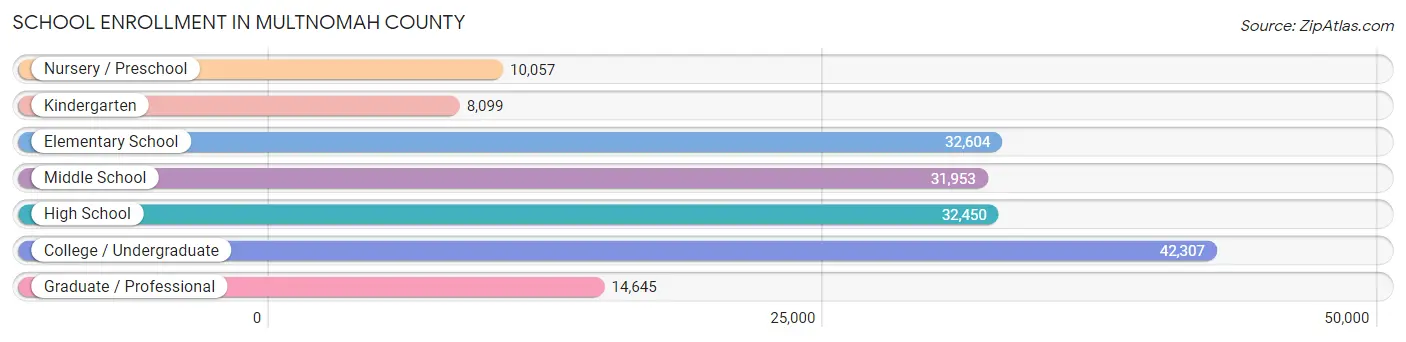
School Enrollment in Multnomah County
The most common levels of schooling among the 172,115 students in Multnomah County are college / undergraduate (42,307 | 24.6%), elementary school (32,604 | 18.9%), and high school (32,450 | 18.9%).
| School Level | # Students | % Students |
| Nursery / Preschool | 10,057 | 5.8% |
| Kindergarten | 8,099 | 4.7% |
| Elementary School | 32,604 | 18.9% |
| Middle School | 31,953 | 18.6% |
| High School | 32,450 | 18.9% |
| College / Undergraduate | 42,307 | 24.6% |
| Graduate / Professional | 14,645 | 8.5% |
| Total | 172,115 | 100.0% |
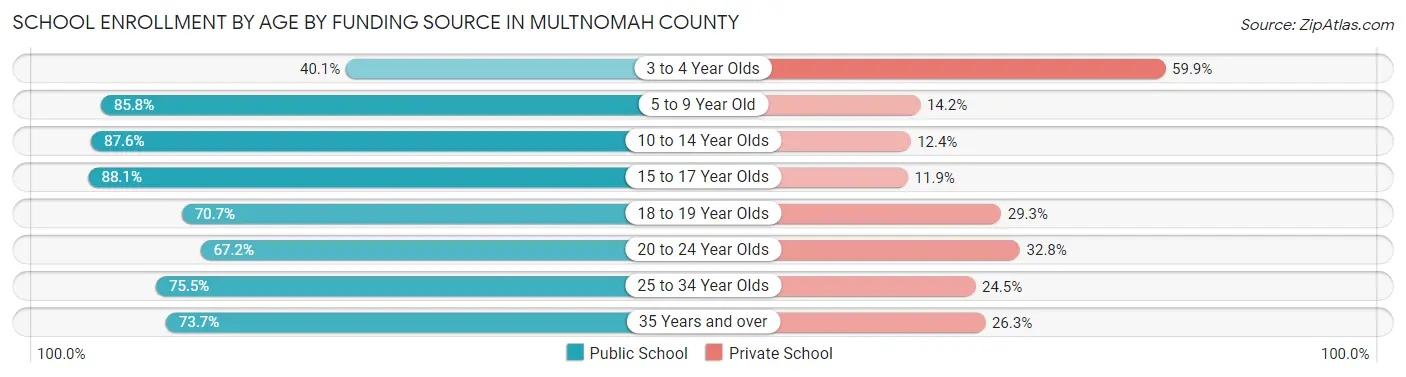
School Enrollment by Age by Funding Source in Multnomah County
Out of a total of 172,115 students who are enrolled in schools in Multnomah County, 35,628 (20.7%) attend a private institution, while the remaining 136,487 (79.3%) are enrolled in public schools. The age group of 3 to 4 year olds has the highest likelihood of being enrolled in private schools, with 4,894 (59.9% in the age bracket) enrolled. Conversely, the age group of 15 to 17 year olds has the lowest likelihood of being enrolled in a private school, with 20,695 (88.1% in the age bracket) attending a public institution.
| Age Bracket | Public School | Private School |
| 3 to 4 Year Olds | 3,280 (40.1%) | 4,894 (59.9%) |
| 5 to 9 Year Old | 32,275 (85.8%) | 5,347 (14.2%) |
| 10 to 14 Year Olds | 35,857 (87.6%) | 5,071 (12.4%) |
| 15 to 17 Year Olds | 20,695 (88.1%) | 2,802 (11.9%) |
| 18 to 19 Year Olds | 9,189 (70.7%) | 3,802 (29.3%) |
| 20 to 24 Year Olds | 12,590 (67.2%) | 6,137 (32.8%) |
| 25 to 34 Year Olds | 13,026 (75.5%) | 4,219 (24.5%) |
| 35 Years and over | 9,528 (73.7%) | 3,403 (26.3%) |
| Total | 136,487 (79.3%) | 35,628 (20.7%) |
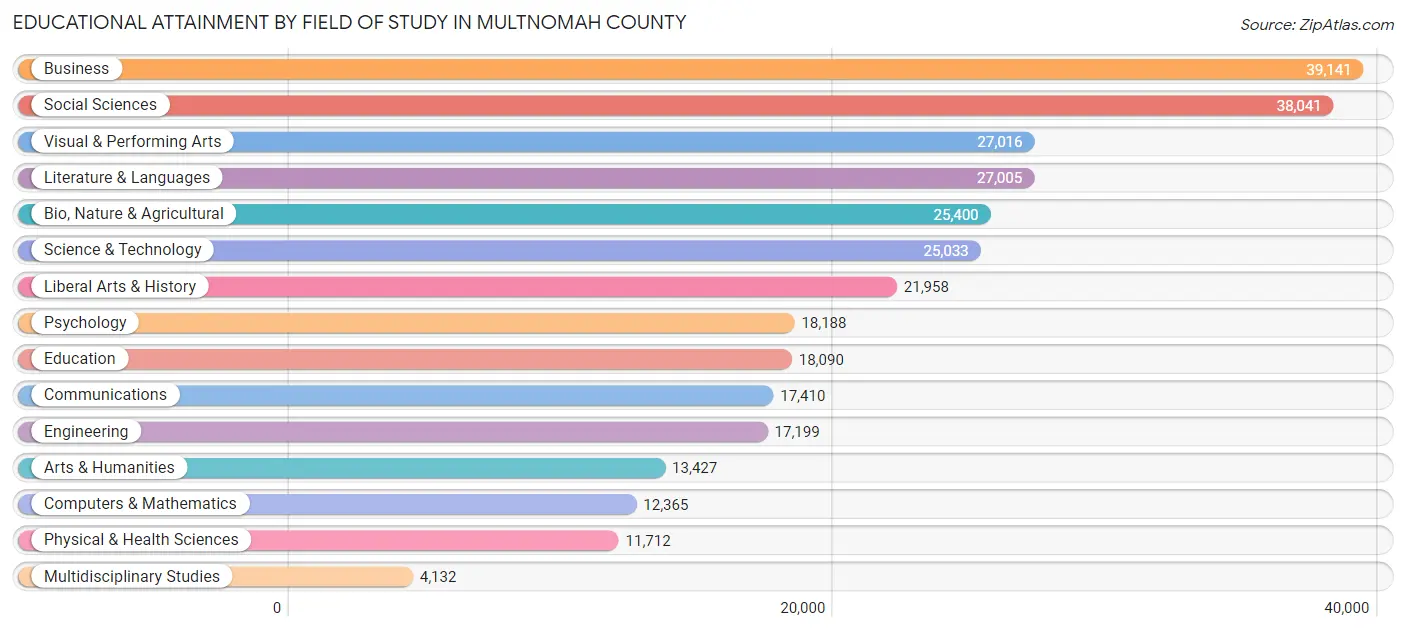
Educational Attainment by Field of Study in Multnomah County
Business (39,141 | 12.4%), social sciences (38,041 | 12.0%), visual & performing arts (27,016 | 8.6%), literature & languages (27,005 | 8.5%), and bio, nature & agricultural (25,400 | 8.0%) are the most common fields of study among 316,117 individuals in Multnomah County who have obtained a bachelor's degree or higher.
| Field of Study | # Graduates | % Graduates |
| Computers & Mathematics | 12,365 | 3.9% |
| Bio, Nature & Agricultural | 25,400 | 8.0% |
| Physical & Health Sciences | 11,712 | 3.7% |
| Psychology | 18,188 | 5.8% |
| Social Sciences | 38,041 | 12.0% |
| Engineering | 17,199 | 5.4% |
| Multidisciplinary Studies | 4,132 | 1.3% |
| Science & Technology | 25,033 | 7.9% |
| Business | 39,141 | 12.4% |
| Education | 18,090 | 5.7% |
| Literature & Languages | 27,005 | 8.5% |
| Liberal Arts & History | 21,958 | 7.0% |
| Visual & Performing Arts | 27,016 | 8.6% |
| Communications | 17,410 | 5.5% |
| Arts & Humanities | 13,427 | 4.3% |
| Total | 316,117 | 100.0% |
Transportation & Commute in Multnomah County
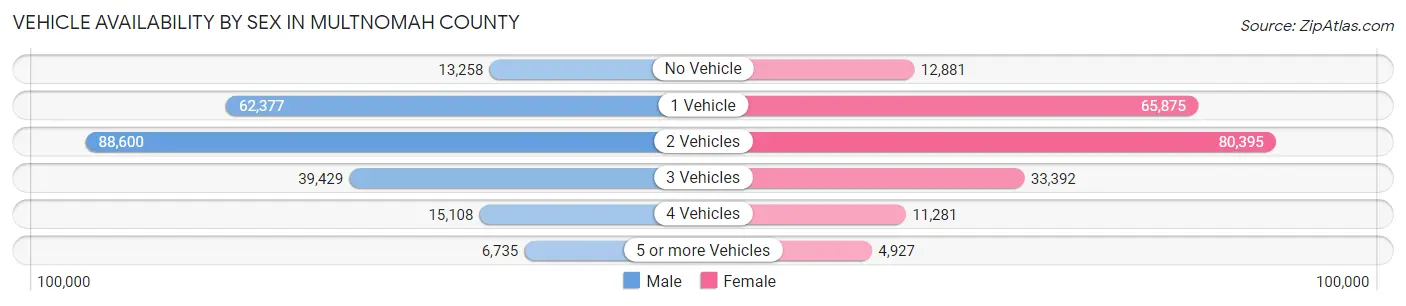
Vehicle Availability by Sex in Multnomah County
The most prevalent vehicle ownership categories in Multnomah County are males with 2 vehicles (88,600, accounting for 39.3%) and females with 2 vehicles (80,395, making up 42.4%).
| Vehicles Available | Male | Female |
| No Vehicle | 13,258 (5.9%) | 12,881 (6.2%) |
| 1 Vehicle | 62,377 (27.7%) | 65,875 (31.6%) |
| 2 Vehicles | 88,600 (39.3%) | 80,395 (38.5%) |
| 3 Vehicles | 39,429 (17.5%) | 33,392 (16.0%) |
| 4 Vehicles | 15,108 (6.7%) | 11,281 (5.4%) |
| 5 or more Vehicles | 6,735 (3.0%) | 4,927 (2.4%) |
| Total | 225,507 (100.0%) | 208,751 (100.0%) |
Commute Time in Multnomah County
The most frequently occuring commute durations in Multnomah County are 20 to 24 minutes (62,207 commuters, 17.8%), 15 to 19 minutes (59,972 commuters, 17.1%), and 30 to 34 minutes (57,498 commuters, 16.4%).
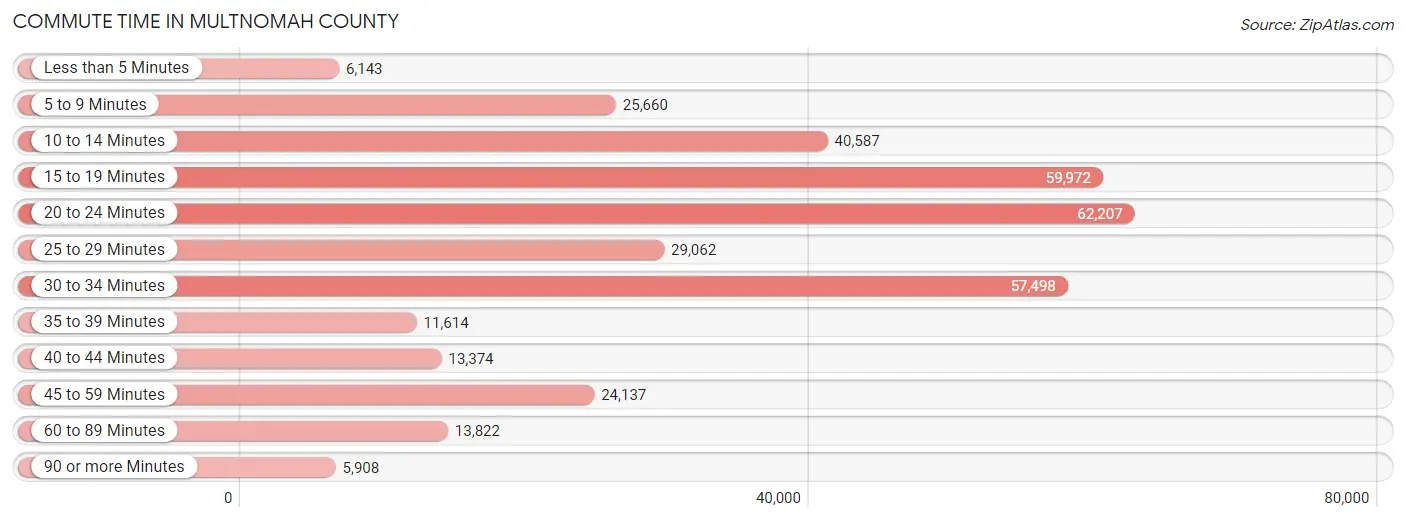
| Commute Time | # Commuters | % Commuters |
| Less than 5 Minutes | 6,143 | 1.8% |
| 5 to 9 Minutes | 25,660 | 7.3% |
| 10 to 14 Minutes | 40,587 | 11.6% |
| 15 to 19 Minutes | 59,972 | 17.1% |
| 20 to 24 Minutes | 62,207 | 17.8% |
| 25 to 29 Minutes | 29,062 | 8.3% |
| 30 to 34 Minutes | 57,498 | 16.4% |
| 35 to 39 Minutes | 11,614 | 3.3% |
| 40 to 44 Minutes | 13,374 | 3.8% |
| 45 to 59 Minutes | 24,137 | 6.9% |
| 60 to 89 Minutes | 13,822 | 4.0% |
| 90 or more Minutes | 5,908 | 1.7% |
Commute Time by Sex in Multnomah County
The most common commute times in Multnomah County are 20 to 24 minutes (33,324 commuters, 18.0%) for males and 20 to 24 minutes (28,883 commuters, 17.5%) for females.
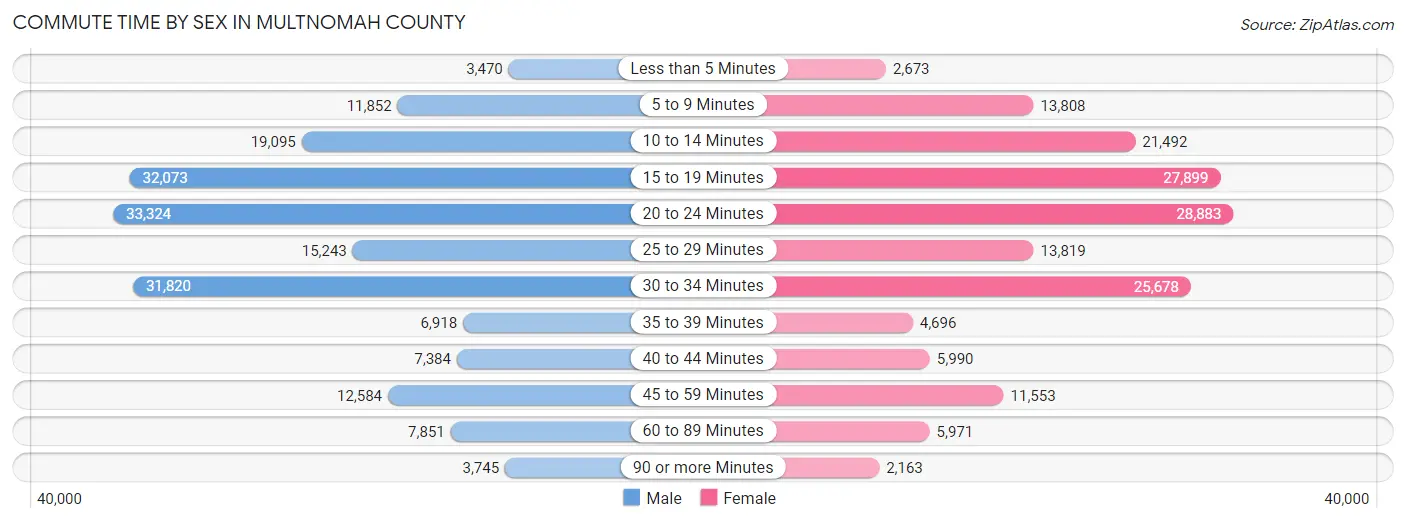
| Commute Time | Male | Female |
| Less than 5 Minutes | 3,470 (1.9%) | 2,673 (1.6%) |
| 5 to 9 Minutes | 11,852 (6.4%) | 13,808 (8.4%) |
| 10 to 14 Minutes | 19,095 (10.3%) | 21,492 (13.1%) |
| 15 to 19 Minutes | 32,073 (17.3%) | 27,899 (17.0%) |
| 20 to 24 Minutes | 33,324 (18.0%) | 28,883 (17.5%) |
| 25 to 29 Minutes | 15,243 (8.2%) | 13,819 (8.4%) |
| 30 to 34 Minutes | 31,820 (17.2%) | 25,678 (15.6%) |
| 35 to 39 Minutes | 6,918 (3.7%) | 4,696 (2.9%) |
| 40 to 44 Minutes | 7,384 (4.0%) | 5,990 (3.6%) |
| 45 to 59 Minutes | 12,584 (6.8%) | 11,553 (7.0%) |
| 60 to 89 Minutes | 7,851 (4.2%) | 5,971 (3.6%) |
| 90 or more Minutes | 3,745 (2.0%) | 2,163 (1.3%) |
Time of Departure to Work by Sex in Multnomah County
The most frequent times of departure to work in Multnomah County are 7:00 AM to 7:29 AM (22,407, 12.1%) for males and 7:30 AM to 7:59 AM (22,099, 13.4%) for females.
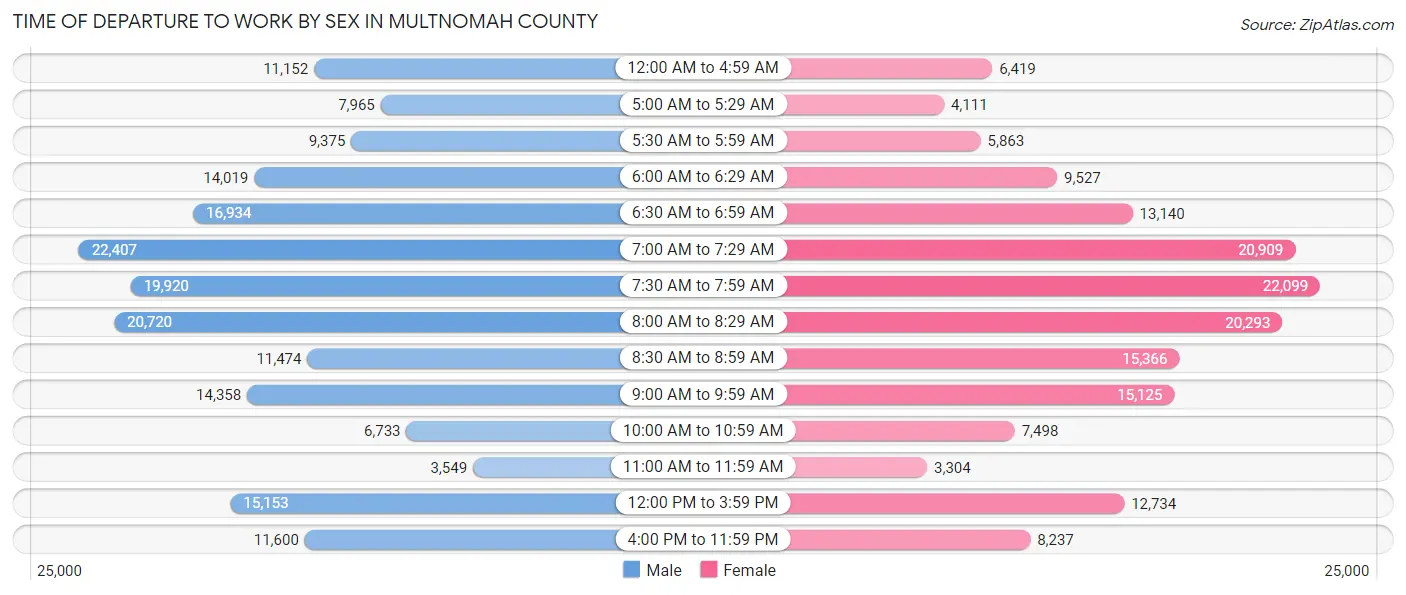
| Time of Departure | Male | Female |
| 12:00 AM to 4:59 AM | 11,152 (6.0%) | 6,419 (3.9%) |
| 5:00 AM to 5:29 AM | 7,965 (4.3%) | 4,111 (2.5%) |
| 5:30 AM to 5:59 AM | 9,375 (5.1%) | 5,863 (3.6%) |
| 6:00 AM to 6:29 AM | 14,019 (7.6%) | 9,527 (5.8%) |
| 6:30 AM to 6:59 AM | 16,934 (9.1%) | 13,140 (8.0%) |
| 7:00 AM to 7:29 AM | 22,407 (12.1%) | 20,909 (12.7%) |
| 7:30 AM to 7:59 AM | 19,920 (10.7%) | 22,099 (13.4%) |
| 8:00 AM to 8:29 AM | 20,720 (11.2%) | 20,293 (12.3%) |
| 8:30 AM to 8:59 AM | 11,474 (6.2%) | 15,366 (9.3%) |
| 9:00 AM to 9:59 AM | 14,358 (7.7%) | 15,125 (9.2%) |
| 10:00 AM to 10:59 AM | 6,733 (3.6%) | 7,498 (4.5%) |
| 11:00 AM to 11:59 AM | 3,549 (1.9%) | 3,304 (2.0%) |
| 12:00 PM to 3:59 PM | 15,153 (8.2%) | 12,734 (7.7%) |
| 4:00 PM to 11:59 PM | 11,600 (6.3%) | 8,237 (5.0%) |
| Total | 185,359 (100.0%) | 164,625 (100.0%) |
Housing Occupancy in Multnomah County
Occupancy by Ownership in Multnomah County
Of the total 343,370 dwellings in Multnomah County, owner-occupied units account for 187,084 (54.5%), while renter-occupied units make up 156,286 (45.5%).
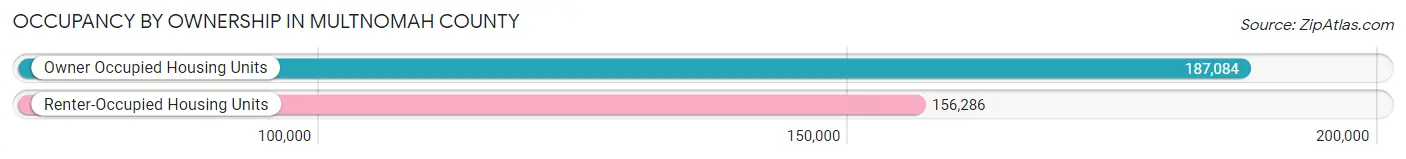
| Occupancy | # Housing Units | % Housing Units |
| Owner Occupied Housing Units | 187,084 | 54.5% |
| Renter-Occupied Housing Units | 156,286 | 45.5% |
| Total Occupied Housing Units | 343,370 | 100.0% |
Occupancy by Household Size in Multnomah County
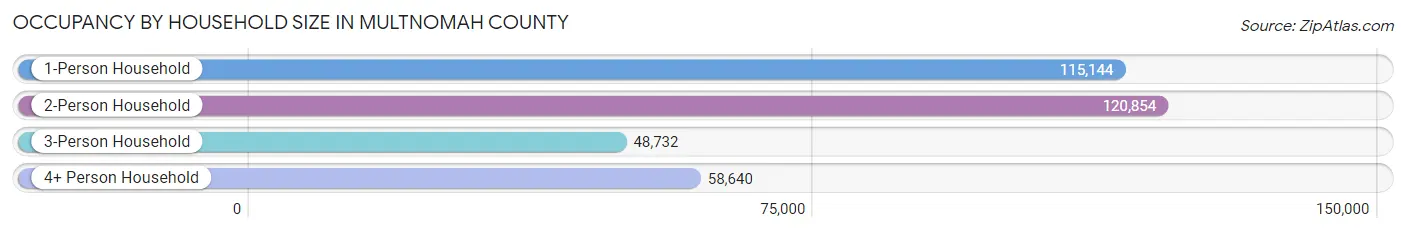
| Household Size | # Housing Units | % Housing Units |
| 1-Person Household | 115,144 | 33.5% |
| 2-Person Household | 120,854 | 35.2% |
| 3-Person Household | 48,732 | 14.2% |
| 4+ Person Household | 58,640 | 17.1% |
| Total Housing Units | 343,370 | 100.0% |
Occupancy by Ownership by Household Size in Multnomah County
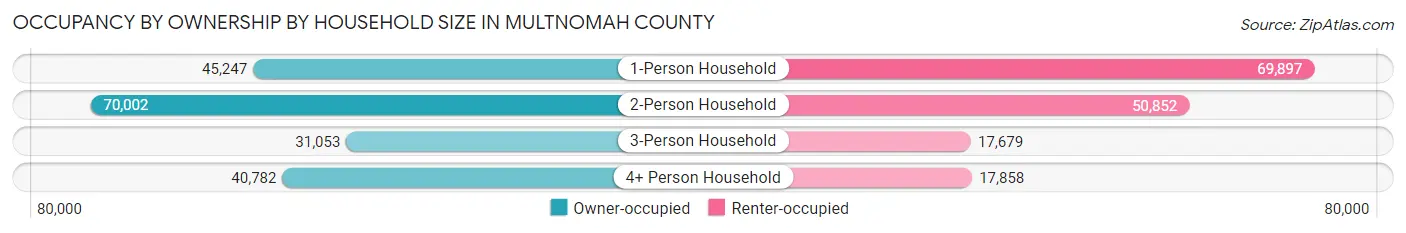
| Household Size | Owner-occupied | Renter-occupied |
| 1-Person Household | 45,247 (39.3%) | 69,897 (60.7%) |
| 2-Person Household | 70,002 (57.9%) | 50,852 (42.1%) |
| 3-Person Household | 31,053 (63.7%) | 17,679 (36.3%) |
| 4+ Person Household | 40,782 (69.6%) | 17,858 (30.4%) |
| Total Housing Units | 187,084 (54.5%) | 156,286 (45.5%) |
Occupancy by Educational Attainment in Multnomah County
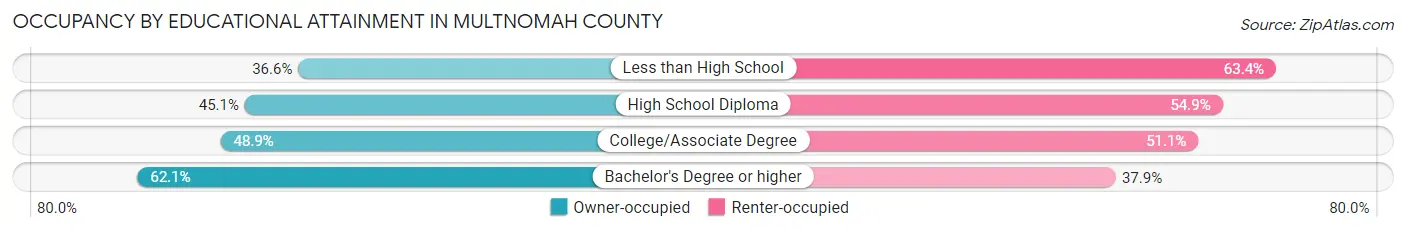
| Household Size | Owner-occupied | Renter-occupied |
| Less than High School | 7,218 (36.6%) | 12,502 (63.4%) |
| High School Diploma | 21,229 (45.1%) | 25,868 (54.9%) |
| College/Associate Degree | 48,826 (48.9%) | 50,965 (51.1%) |
| Bachelor's Degree or higher | 109,811 (62.1%) | 66,951 (37.9%) |
Occupancy by Age of Householder in Multnomah County
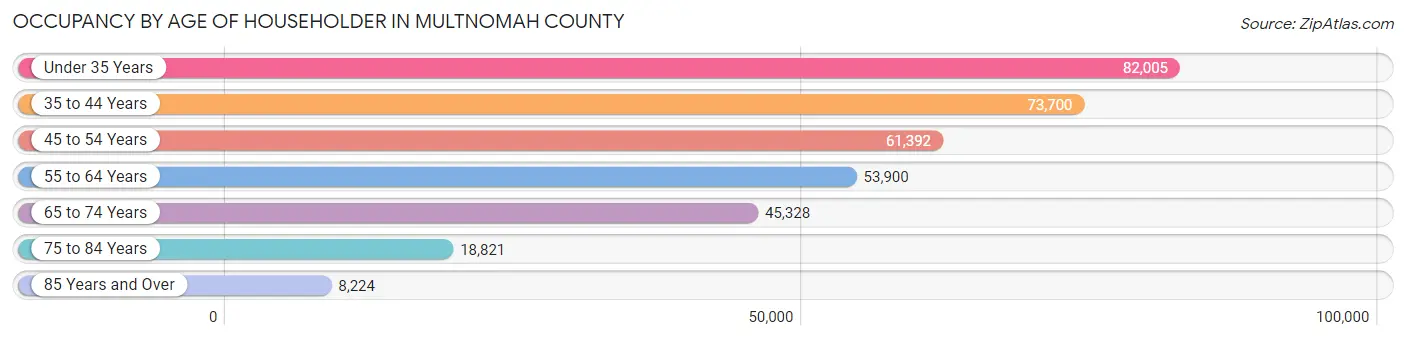
| Age Bracket | # Households | % Households |
| Under 35 Years | 82,005 | 23.9% |
| 35 to 44 Years | 73,700 | 21.5% |
| 45 to 54 Years | 61,392 | 17.9% |
| 55 to 64 Years | 53,900 | 15.7% |
| 65 to 74 Years | 45,328 | 13.2% |
| 75 to 84 Years | 18,821 | 5.5% |
| 85 Years and Over | 8,224 | 2.4% |
| Total | 343,370 | 100.0% |
Housing Finances in Multnomah County
Median Income by Occupancy in Multnomah County
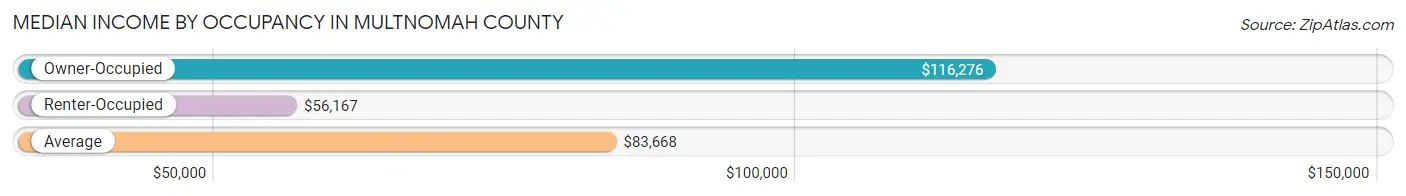
| Occupancy Type | # Households | Median Income |
| Owner-Occupied | 187,084 (54.5%) | $116,276 |
| Renter-Occupied | 156,286 (45.5%) | $56,167 |
| Average | 343,370 (100.0%) | $83,668 |
Occupancy by Householder Income Bracket in Multnomah County
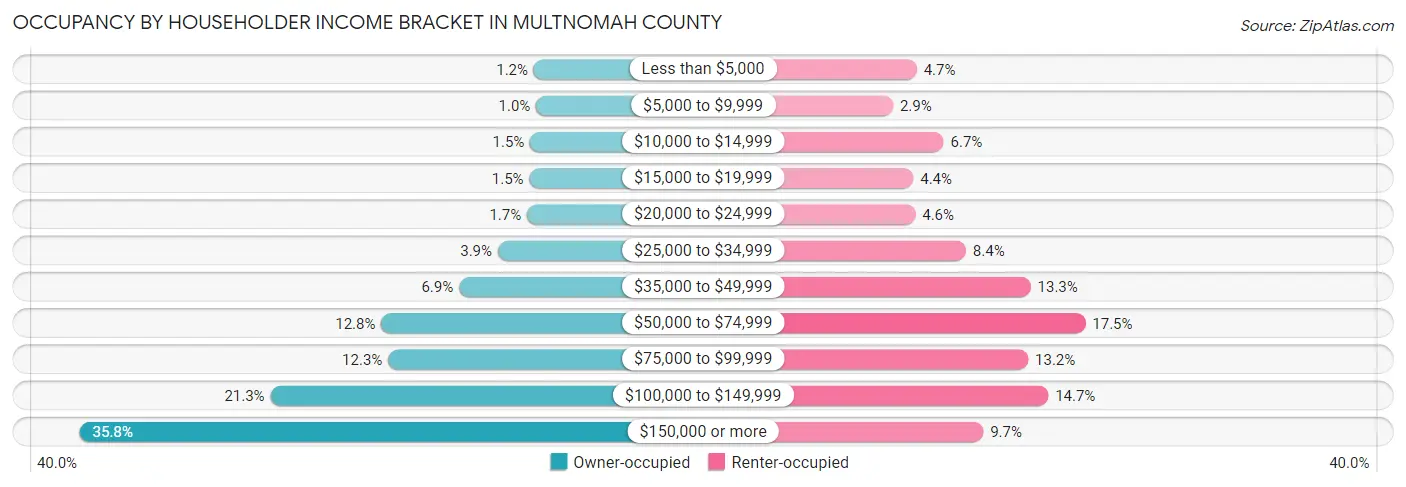
| Income Bracket | Owner-occupied | Renter-occupied |
| Less than $5,000 | 2,238 (1.2%) | 7,285 (4.7%) |
| $5,000 to $9,999 | 1,899 (1.0%) | 4,457 (2.9%) |
| $10,000 to $14,999 | 2,774 (1.5%) | 10,484 (6.7%) |
| $15,000 to $19,999 | 2,882 (1.5%) | 6,873 (4.4%) |
| $20,000 to $24,999 | 3,221 (1.7%) | 7,117 (4.5%) |
| $25,000 to $34,999 | 7,380 (3.9%) | 13,148 (8.4%) |
| $35,000 to $49,999 | 12,916 (6.9%) | 20,845 (13.3%) |
| $50,000 to $74,999 | 23,981 (12.8%) | 27,361 (17.5%) |
| $75,000 to $99,999 | 23,017 (12.3%) | 20,556 (13.2%) |
| $100,000 to $149,999 | 39,785 (21.3%) | 22,949 (14.7%) |
| $150,000 or more | 66,991 (35.8%) | 15,211 (9.7%) |
| Total | 187,084 (100.0%) | 156,286 (100.0%) |
Monthly Housing Cost Tiers in Multnomah County
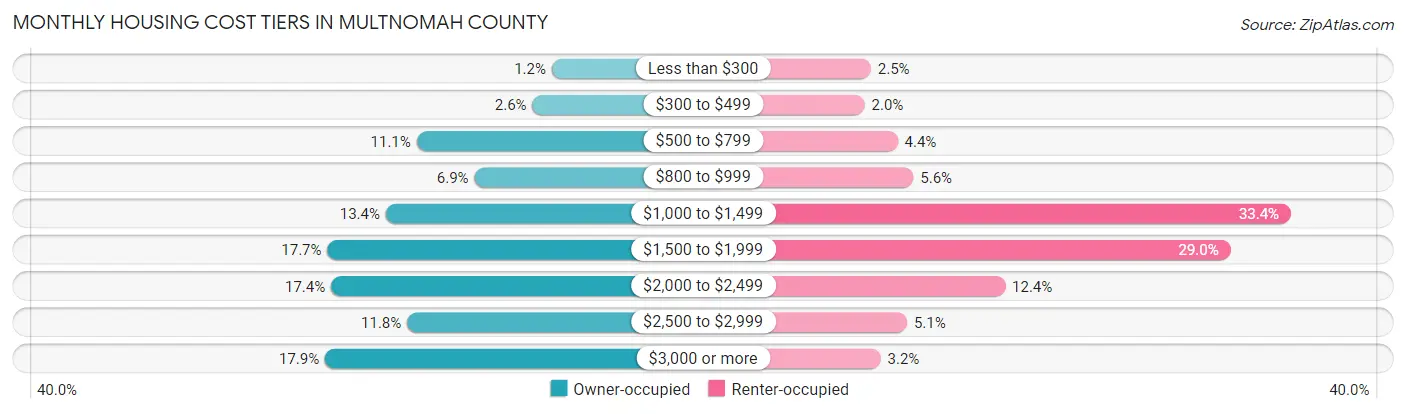
| Monthly Cost | Owner-occupied | Renter-occupied |
| Less than $300 | 2,183 (1.2%) | 3,840 (2.5%) |
| $300 to $499 | 4,865 (2.6%) | 3,132 (2.0%) |
| $500 to $799 | 20,820 (11.1%) | 6,923 (4.4%) |
| $800 to $999 | 12,852 (6.9%) | 8,741 (5.6%) |
| $1,000 to $1,499 | 25,074 (13.4%) | 52,200 (33.4%) |
| $1,500 to $1,999 | 33,105 (17.7%) | 45,239 (28.9%) |
| $2,000 to $2,499 | 32,617 (17.4%) | 19,309 (12.3%) |
| $2,500 to $2,999 | 22,141 (11.8%) | 8,004 (5.1%) |
| $3,000 or more | 33,427 (17.9%) | 4,963 (3.2%) |
| Total | 187,084 (100.0%) | 156,286 (100.0%) |
Physical Housing Characteristics in Multnomah County
Housing Structures in Multnomah County
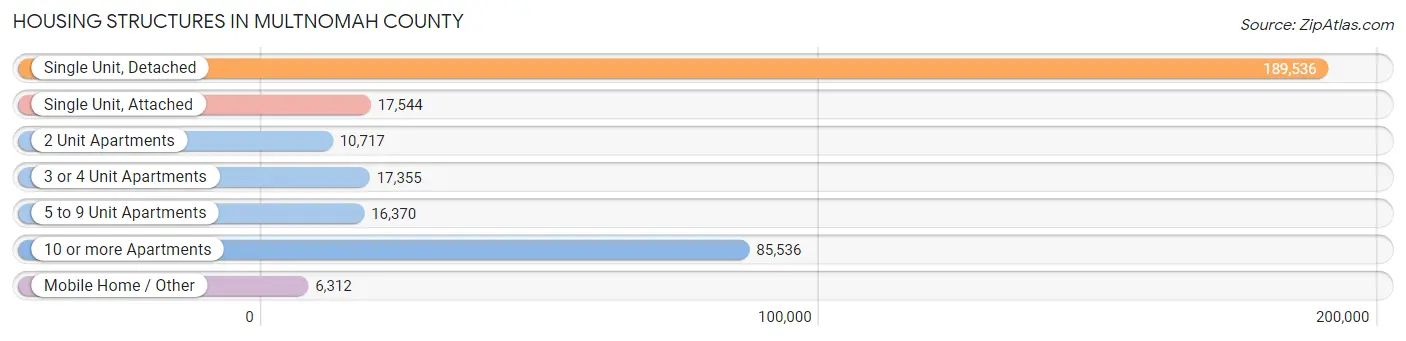
| Structure Type | # Housing Units | % Housing Units |
| Single Unit, Detached | 189,536 | 55.2% |
| Single Unit, Attached | 17,544 | 5.1% |
| 2 Unit Apartments | 10,717 | 3.1% |
| 3 or 4 Unit Apartments | 17,355 | 5.1% |
| 5 to 9 Unit Apartments | 16,370 | 4.8% |
| 10 or more Apartments | 85,536 | 24.9% |
| Mobile Home / Other | 6,312 | 1.8% |
| Total | 343,370 | 100.0% |
Housing Structures by Occupancy in Multnomah County
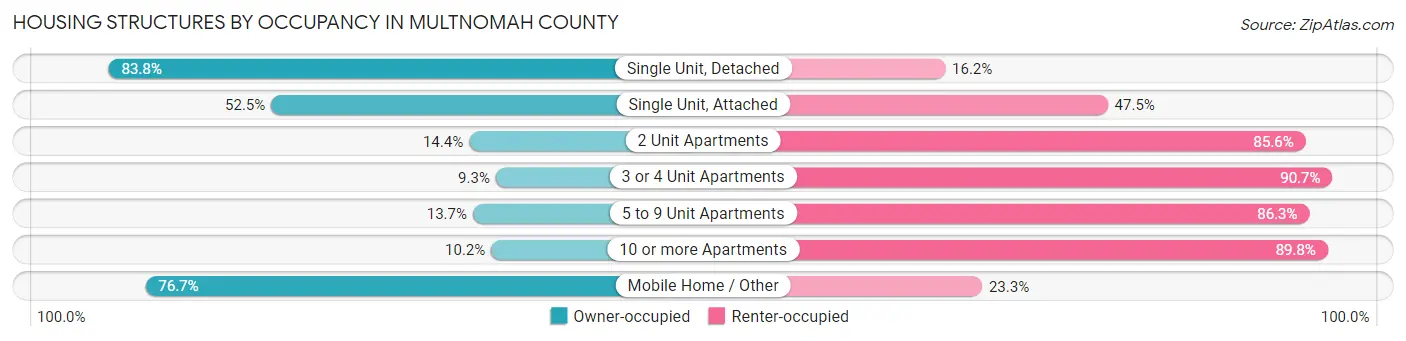
| Structure Type | Owner-occupied | Renter-occupied |
| Single Unit, Detached | 158,912 (83.8%) | 30,624 (16.2%) |
| Single Unit, Attached | 9,218 (52.5%) | 8,326 (47.5%) |
| 2 Unit Apartments | 1,548 (14.4%) | 9,169 (85.6%) |
| 3 or 4 Unit Apartments | 1,613 (9.3%) | 15,742 (90.7%) |
| 5 to 9 Unit Apartments | 2,245 (13.7%) | 14,125 (86.3%) |
| 10 or more Apartments | 8,704 (10.2%) | 76,832 (89.8%) |
| Mobile Home / Other | 4,844 (76.7%) | 1,468 (23.3%) |
| Total | 187,084 (54.5%) | 156,286 (45.5%) |
Housing Structures by Number of Rooms in Multnomah County
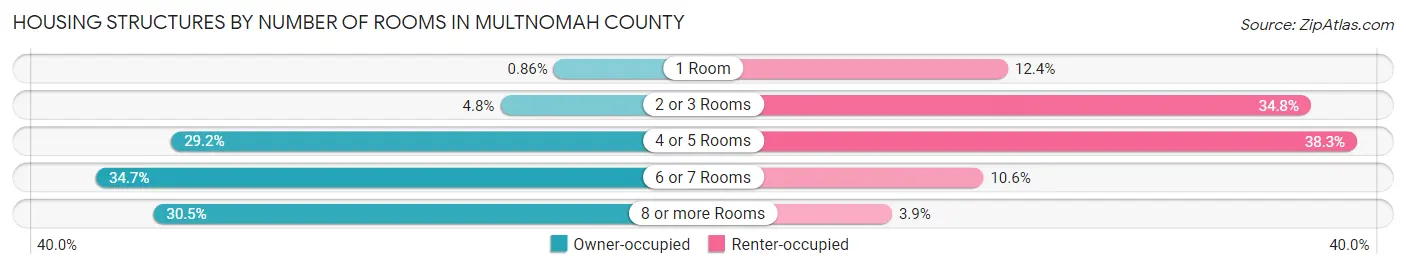
| Number of Rooms | Owner-occupied | Renter-occupied |
| 1 Room | 1,610 (0.9%) | 19,441 (12.4%) |
| 2 or 3 Rooms | 8,993 (4.8%) | 54,450 (34.8%) |
| 4 or 5 Rooms | 54,539 (29.1%) | 59,779 (38.3%) |
| 6 or 7 Rooms | 64,937 (34.7%) | 16,594 (10.6%) |
| 8 or more Rooms | 57,005 (30.5%) | 6,022 (3.8%) |
| Total | 187,084 (100.0%) | 156,286 (100.0%) |
Housing Structure by Heating Type in Multnomah County
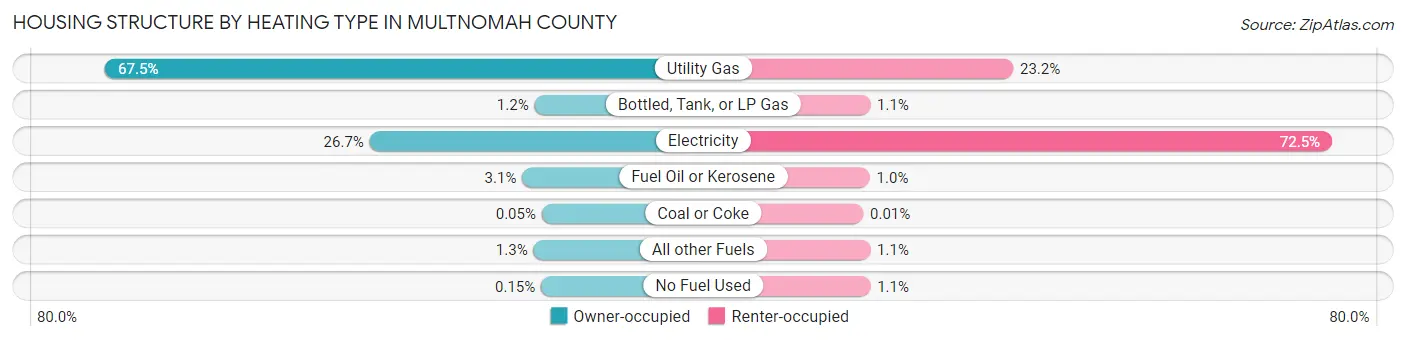
| Heating Type | Owner-occupied | Renter-occupied |
| Utility Gas | 126,354 (67.5%) | 36,245 (23.2%) |
| Bottled, Tank, or LP Gas | 2,216 (1.2%) | 1,708 (1.1%) |
| Electricity | 49,885 (26.7%) | 113,283 (72.5%) |
| Fuel Oil or Kerosene | 5,751 (3.1%) | 1,595 (1.0%) |
| Coal or Coke | 99 (0.1%) | 9 (0.0%) |
| All other Fuels | 2,497 (1.3%) | 1,715 (1.1%) |
| No Fuel Used | 282 (0.2%) | 1,731 (1.1%) |
| Total | 187,084 (100.0%) | 156,286 (100.0%) |
Household Vehicle Usage in Multnomah County
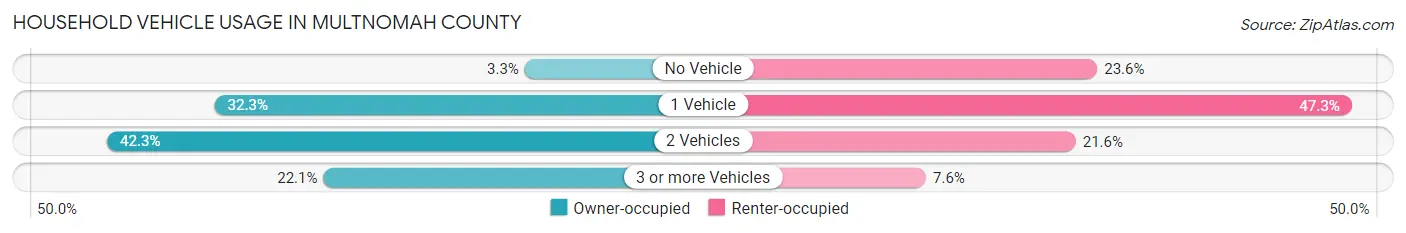
| Vehicles per Household | Owner-occupied | Renter-occupied |
| No Vehicle | 6,202 (3.3%) | 36,821 (23.6%) |
| 1 Vehicle | 60,350 (32.3%) | 73,931 (47.3%) |
| 2 Vehicles | 79,142 (42.3%) | 33,680 (21.5%) |
| 3 or more Vehicles | 41,390 (22.1%) | 11,854 (7.6%) |
| Total | 187,084 (100.0%) | 156,286 (100.0%) |
Real Estate & Mortgages in Multnomah County
Real Estate and Mortgage Overview in Multnomah County
| Characteristic | Without Mortgage | With Mortgage |
| Housing Units | 52,840 | 134,244 |
| Median Property Value | $477,100 | $497,700 |
| Median Household Income | $80,048 | $55,259 |
| Monthly Housing Costs | $800 | $32,818 |
| Real Estate Taxes | $5,045 | $1,352 |
Property Value by Mortgage Status in Multnomah County
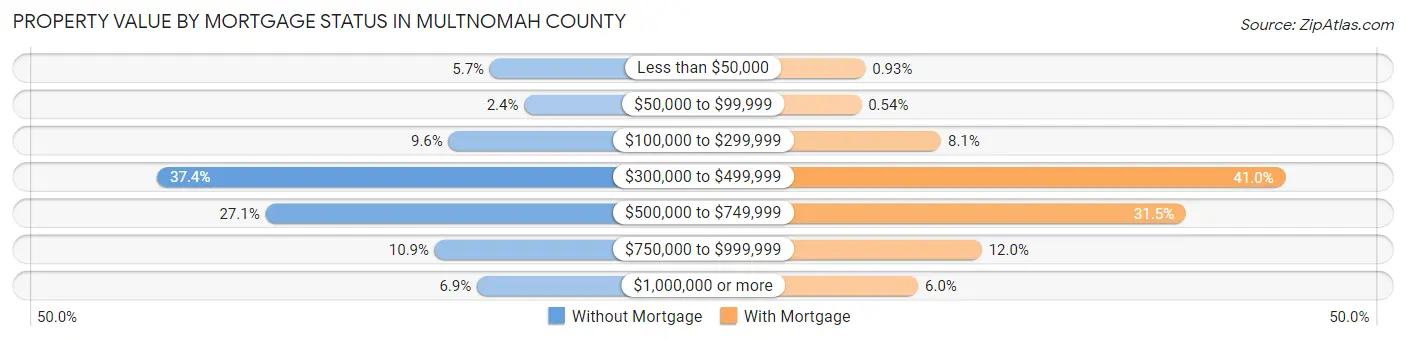
| Property Value | Without Mortgage | With Mortgage |
| Less than $50,000 | 3,001 (5.7%) | 1,243 (0.9%) |
| $50,000 to $99,999 | 1,276 (2.4%) | 719 (0.5%) |
| $100,000 to $299,999 | 5,083 (9.6%) | 10,930 (8.1%) |
| $300,000 to $499,999 | 19,752 (37.4%) | 54,967 (40.9%) |
| $500,000 to $749,999 | 14,298 (27.1%) | 42,244 (31.5%) |
| $750,000 to $999,999 | 5,778 (10.9%) | 16,141 (12.0%) |
| $1,000,000 or more | 3,652 (6.9%) | 8,000 (6.0%) |
| Total | 52,840 (100.0%) | 134,244 (100.0%) |
Household Income by Mortgage Status in Multnomah County
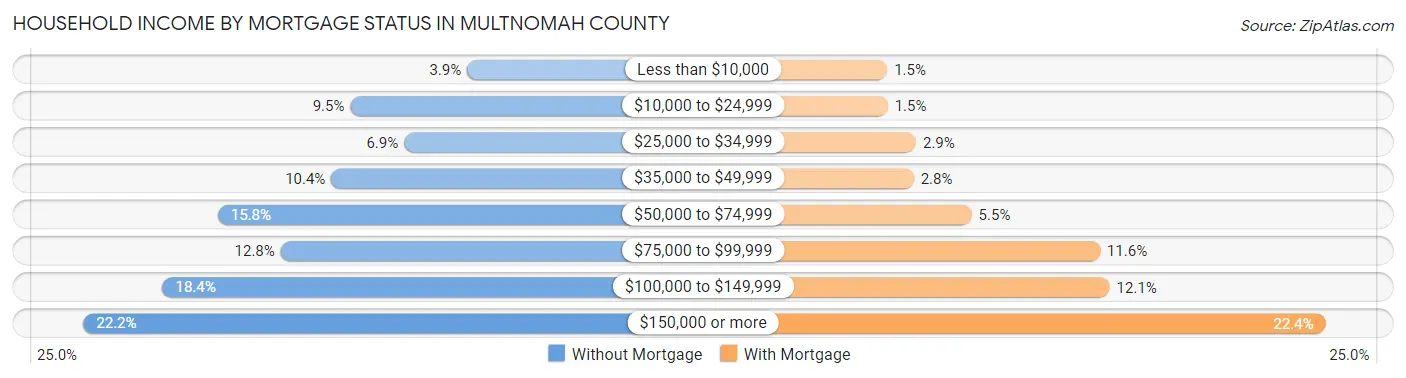
| Household Income | Without Mortgage | With Mortgage |
| Less than $10,000 | 2,077 (3.9%) | 2,027 (1.5%) |
| $10,000 to $24,999 | 5,015 (9.5%) | 2,060 (1.5%) |
| $25,000 to $34,999 | 3,662 (6.9%) | 3,862 (2.9%) |
| $35,000 to $49,999 | 5,495 (10.4%) | 3,718 (2.8%) |
| $50,000 to $74,999 | 8,349 (15.8%) | 7,421 (5.5%) |
| $75,000 to $99,999 | 6,771 (12.8%) | 15,632 (11.6%) |
| $100,000 to $149,999 | 9,739 (18.4%) | 16,246 (12.1%) |
| $150,000 or more | 11,732 (22.2%) | 30,046 (22.4%) |
| Total | 52,840 (100.0%) | 134,244 (100.0%) |
Property Value to Household Income Ratio in Multnomah County
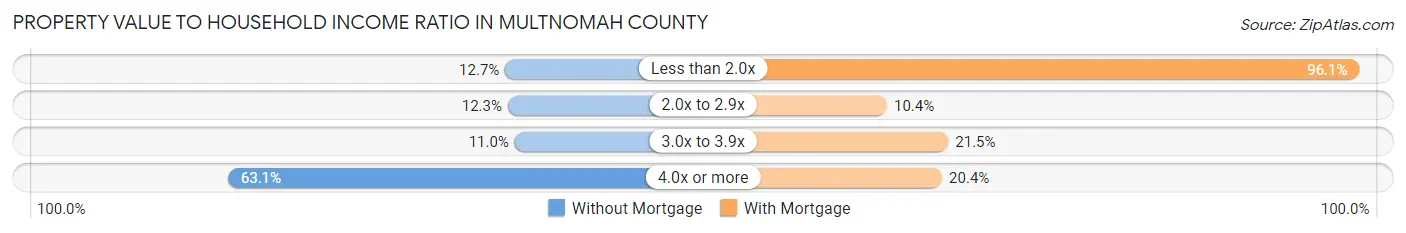
| Value-to-Income Ratio | Without Mortgage | With Mortgage |
| Less than 2.0x | 6,725 (12.7%) | 129,067 (96.1%) |
| 2.0x to 2.9x | 6,471 (12.2%) | 13,930 (10.4%) |
| 3.0x to 3.9x | 5,807 (11.0%) | 28,872 (21.5%) |
| 4.0x or more | 33,329 (63.1%) | 27,365 (20.4%) |
| Total | 52,840 (100.0%) | 134,244 (100.0%) |
Real Estate Taxes by Mortgage Status in Multnomah County
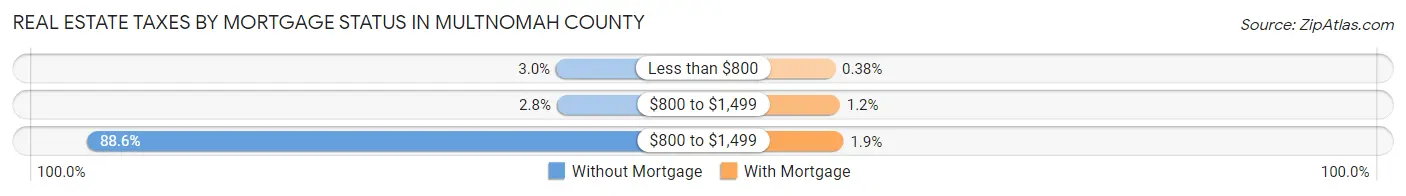
| Property Taxes | Without Mortgage | With Mortgage |
| Less than $800 | 1,565 (3.0%) | 507 (0.4%) |
| $800 to $1,499 | 1,483 (2.8%) | 1,651 (1.2%) |
| $800 to $1,499 | 46,816 (88.6%) | 2,553 (1.9%) |
| Total | 52,840 (100.0%) | 134,244 (100.0%) |
Health & Disability in Multnomah County
Health Insurance Coverage by Age in Multnomah County
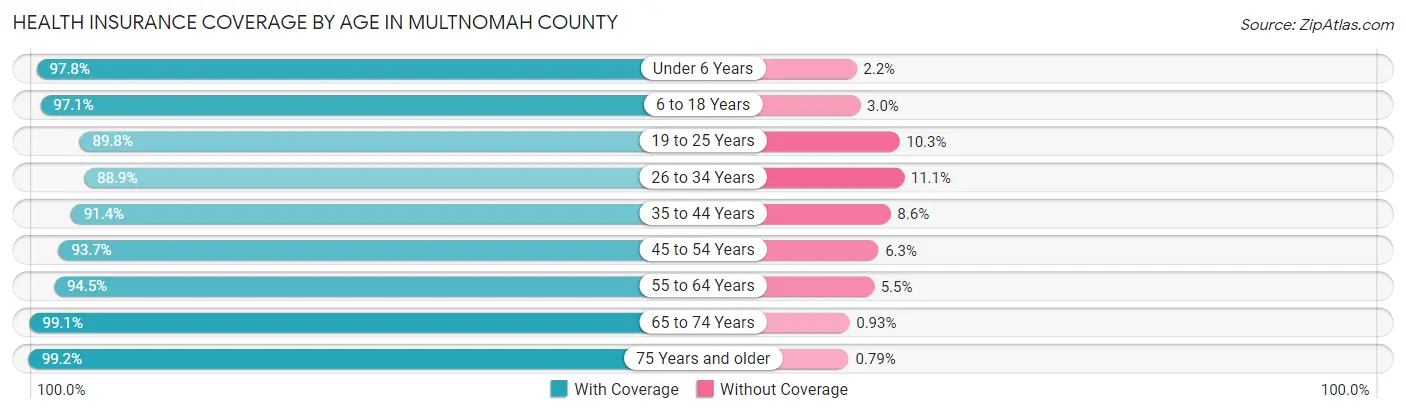
| Age Bracket | With Coverage | Without Coverage |
| Under 6 Years | 45,607 (97.8%) | 1,045 (2.2%) |
| 6 to 18 Years | 104,134 (97.1%) | 3,163 (2.9%) |
| 19 to 25 Years | 61,578 (89.7%) | 7,029 (10.2%) |
| 26 to 34 Years | 119,184 (88.9%) | 14,881 (11.1%) |
| 35 to 44 Years | 124,498 (91.4%) | 11,713 (8.6%) |
| 45 to 54 Years | 101,514 (93.7%) | 6,851 (6.3%) |
| 55 to 64 Years | 85,061 (94.5%) | 4,929 (5.5%) |
| 65 to 74 Years | 70,235 (99.1%) | 656 (0.9%) |
| 75 Years and older | 40,185 (99.2%) | 322 (0.8%) |
| Total | 751,996 (93.7%) | 50,589 (6.3%) |
Health Insurance Coverage by Citizenship Status in Multnomah County
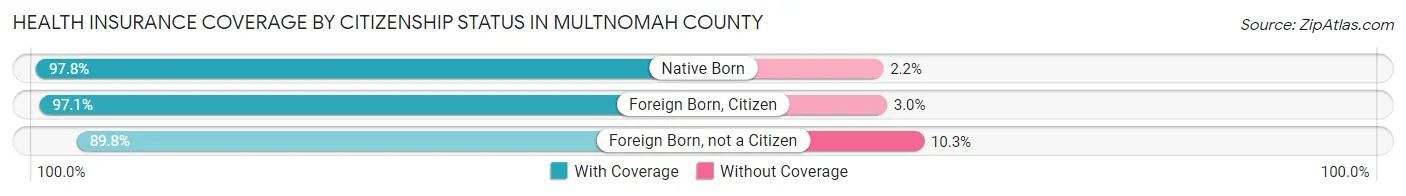
| Citizenship Status | With Coverage | Without Coverage |
| Native Born | 45,607 (97.8%) | 1,045 (2.2%) |
| Foreign Born, Citizen | 104,134 (97.1%) | 3,163 (2.9%) |
| Foreign Born, not a Citizen | 61,578 (89.7%) | 7,029 (10.2%) |
Health Insurance Coverage by Household Income in Multnomah County
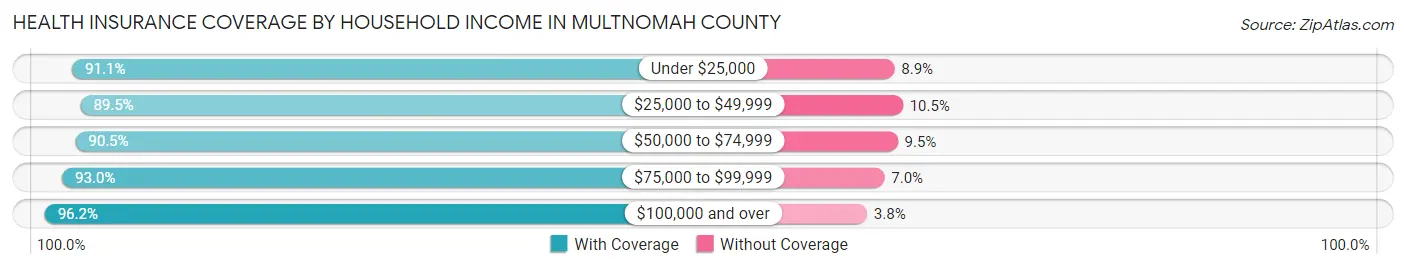
| Household Income | With Coverage | Without Coverage |
| Under $25,000 | 69,224 (91.1%) | 6,773 (8.9%) |
| $25,000 to $49,999 | 93,860 (89.5%) | 10,971 (10.5%) |
| $50,000 to $74,999 | 99,346 (90.5%) | 10,456 (9.5%) |
| $75,000 to $99,999 | 91,655 (93.0%) | 6,929 (7.0%) |
| $100,000 and over | 382,996 (96.2%) | 15,001 (3.8%) |
Public vs Private Health Insurance Coverage by Age in Multnomah County
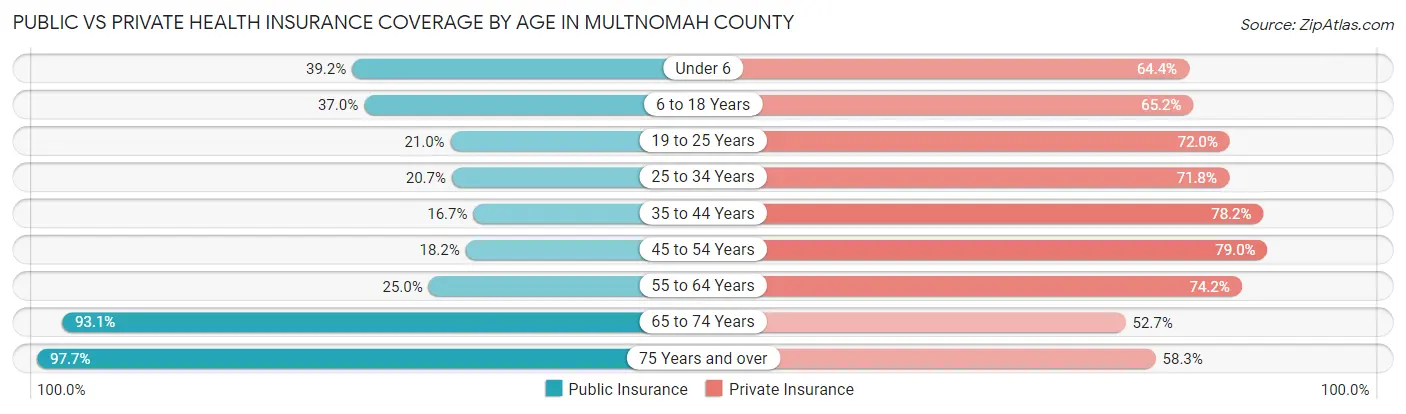
| Age Bracket | Public Insurance | Private Insurance |
| Under 6 | 18,299 (39.2%) | 30,056 (64.4%) |
| 6 to 18 Years | 39,706 (37.0%) | 70,000 (65.2%) |
| 19 to 25 Years | 14,381 (21.0%) | 49,405 (72.0%) |
| 25 to 34 Years | 27,767 (20.7%) | 96,305 (71.8%) |
| 35 to 44 Years | 22,778 (16.7%) | 106,569 (78.2%) |
| 45 to 54 Years | 19,677 (18.2%) | 85,594 (79.0%) |
| 55 to 64 Years | 22,511 (25.0%) | 66,771 (74.2%) |
| 65 to 74 Years | 65,968 (93.1%) | 37,341 (52.7%) |
| 75 Years and over | 39,564 (97.7%) | 23,597 (58.3%) |
| Total | 270,651 (33.7%) | 565,638 (70.5%) |
Disability Status by Sex by Age in Multnomah County
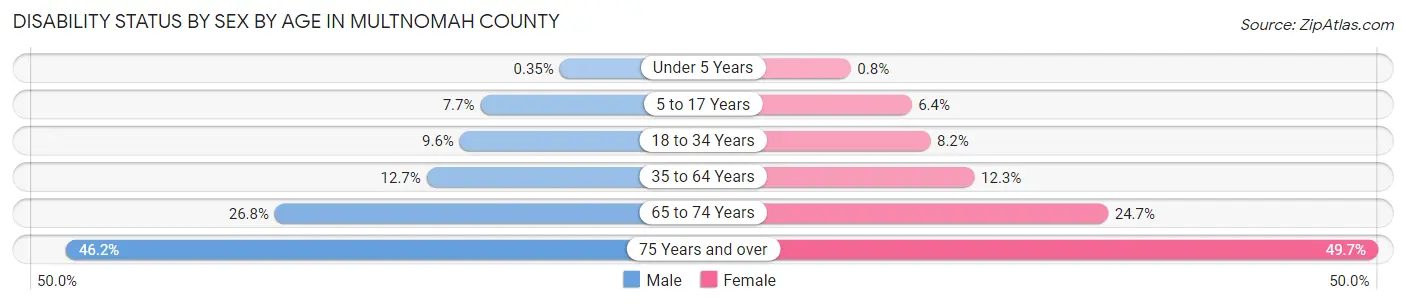
| Age Bracket | Male | Female |
| Under 5 Years | 71 (0.4%) | 152 (0.8%) |
| 5 to 17 Years | 4,186 (7.7%) | 3,357 (6.4%) |
| 18 to 34 Years | 10,086 (9.6%) | 8,713 (8.2%) |
| 35 to 64 Years | 21,699 (12.7%) | 20,076 (12.3%) |
| 65 to 74 Years | 8,958 (26.8%) | 9,244 (24.7%) |
| 75 Years and over | 7,587 (46.2%) | 11,972 (49.7%) |
Disability Class by Sex by Age in Multnomah County
Disability Class: Hearing Difficulty
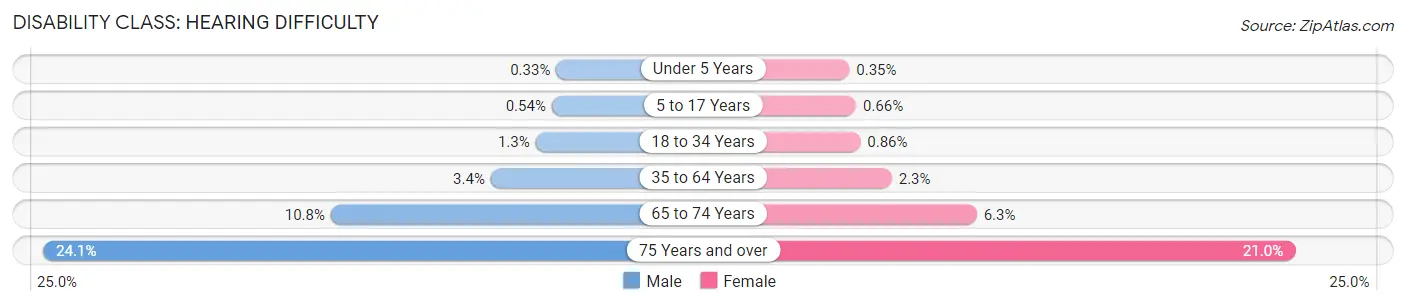
| Age Bracket | Male | Female |
| Under 5 Years | 66 (0.3%) | 67 (0.4%) |
| 5 to 17 Years | 295 (0.5%) | 345 (0.7%) |
| 18 to 34 Years | 1,350 (1.3%) | 918 (0.9%) |
| 35 to 64 Years | 5,767 (3.4%) | 3,793 (2.3%) |
| 65 to 74 Years | 3,610 (10.8%) | 2,343 (6.3%) |
| 75 Years and over | 3,968 (24.1%) | 5,062 (21.0%) |
Disability Class: Vision Difficulty
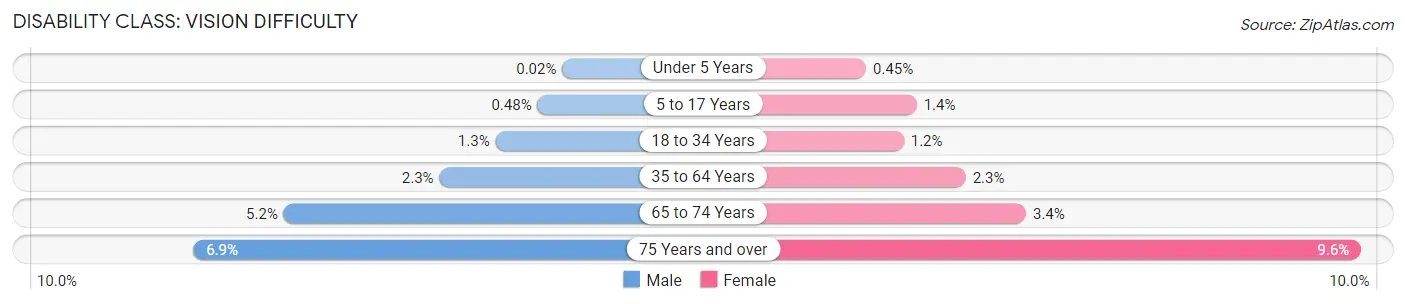
| Age Bracket | Male | Female |
| Under 5 Years | 5 (0.0%) | 85 (0.4%) |
| 5 to 17 Years | 260 (0.5%) | 726 (1.4%) |
| 18 to 34 Years | 1,324 (1.3%) | 1,227 (1.1%) |
| 35 to 64 Years | 3,931 (2.3%) | 3,764 (2.3%) |
| 65 to 74 Years | 1,737 (5.2%) | 1,281 (3.4%) |
| 75 Years and over | 1,130 (6.9%) | 2,321 (9.6%) |
Disability Class: Cognitive Difficulty
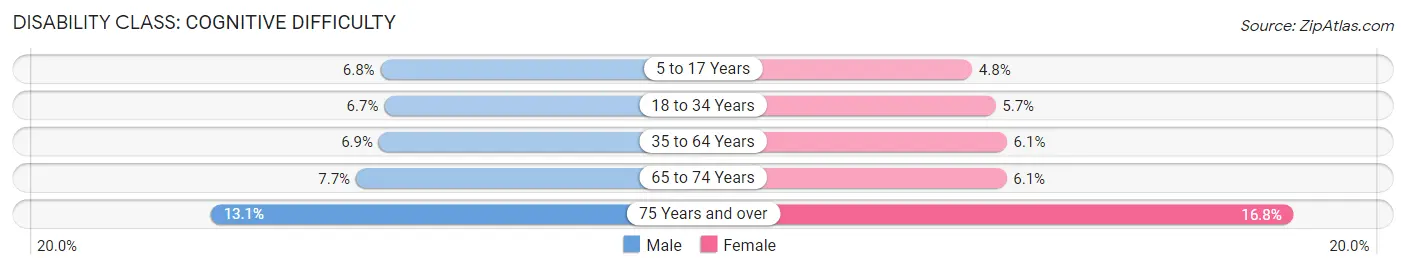
| Age Bracket | Male | Female |
| 5 to 17 Years | 3,683 (6.8%) | 2,514 (4.8%) |
| 18 to 34 Years | 6,972 (6.7%) | 6,067 (5.7%) |
| 35 to 64 Years | 11,722 (6.9%) | 10,009 (6.1%) |
| 65 to 74 Years | 2,575 (7.7%) | 2,289 (6.1%) |
| 75 Years and over | 2,151 (13.1%) | 4,037 (16.8%) |
Disability Class: Ambulatory Difficulty
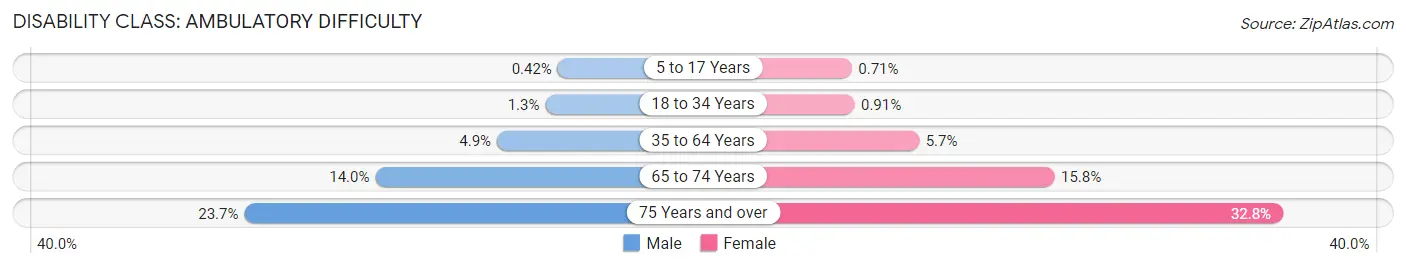
| Age Bracket | Male | Female |
| 5 to 17 Years | 228 (0.4%) | 369 (0.7%) |
| 18 to 34 Years | 1,400 (1.3%) | 966 (0.9%) |
| 35 to 64 Years | 8,430 (4.9%) | 9,334 (5.7%) |
| 65 to 74 Years | 4,669 (14.0%) | 5,901 (15.8%) |
| 75 Years and over | 3,894 (23.7%) | 7,883 (32.8%) |
Disability Class: Self-Care Difficulty
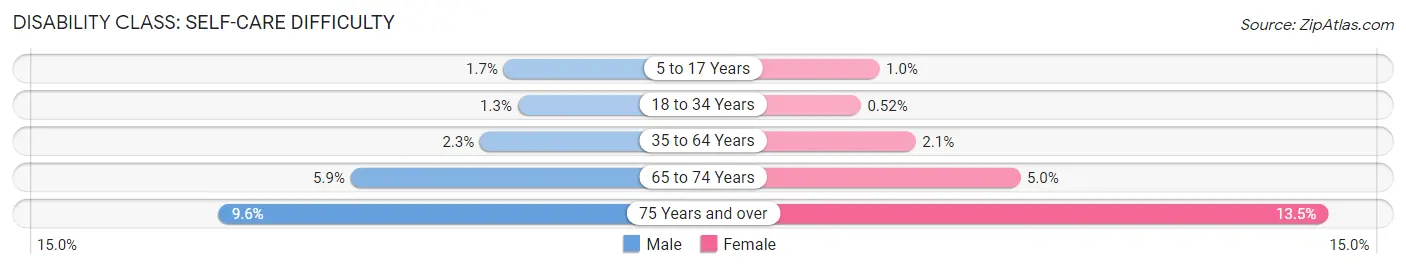
| Age Bracket | Male | Female |
| 5 to 17 Years | 902 (1.7%) | 543 (1.0%) |
| 18 to 34 Years | 1,327 (1.3%) | 548 (0.5%) |
| 35 to 64 Years | 3,967 (2.3%) | 3,349 (2.1%) |
| 65 to 74 Years | 1,981 (5.9%) | 1,855 (5.0%) |
| 75 Years and over | 1,576 (9.6%) | 3,259 (13.5%) |
Technology Access in Multnomah County
Computing Device Access in Multnomah County
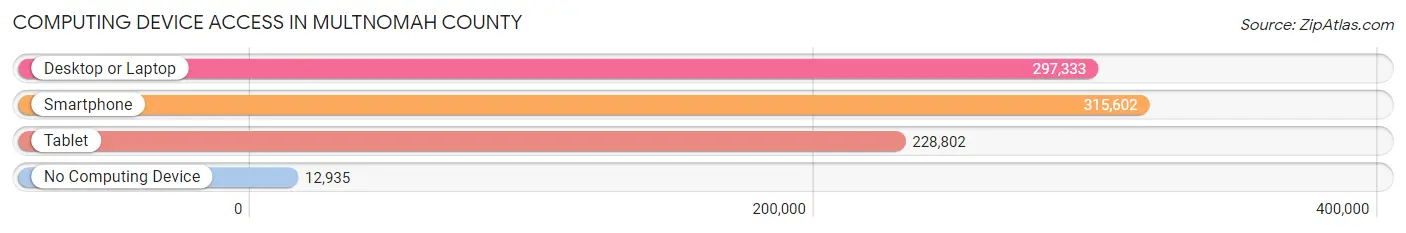
| Device Type | # Households | % Households |
| Desktop or Laptop | 297,333 | 86.6% |
| Smartphone | 315,602 | 91.9% |
| Tablet | 228,802 | 66.6% |
| No Computing Device | 12,935 | 3.8% |
| Total | 343,370 | 100.0% |
Internet Access in Multnomah County
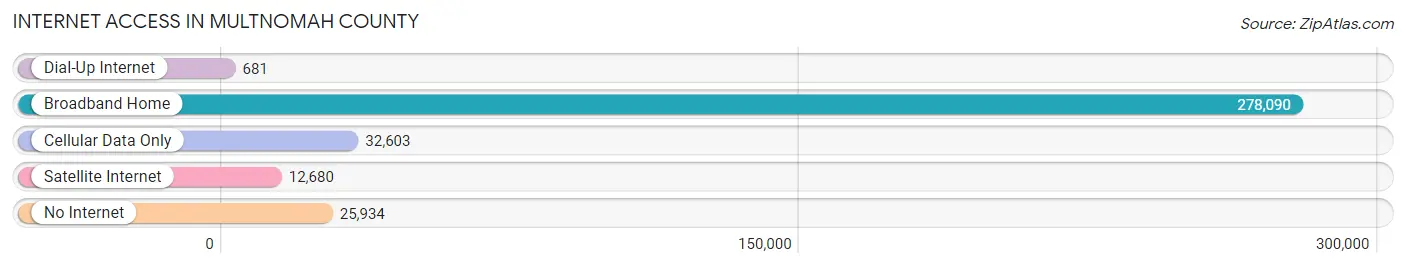
| Internet Type | # Households | % Households |
| Dial-Up Internet | 681 | 0.2% |
| Broadband Home | 278,090 | 81.0% |
| Cellular Data Only | 32,603 | 9.5% |
| Satellite Internet | 12,680 | 3.7% |
| No Internet | 25,934 | 7.5% |
| Total | 343,370 | 100.0% |
Multnomah County Summary
Multnomah County, Oregon is located in the northwestern corner of the state and is the most populous county in the state. It is bordered by Washington to the north, Clackamas County to the south, Columbia County to the east, and the Columbia River to the west. The county seat is Portland, the largest city in the state.
History
Multnomah County was created in 1854 from two other Oregon counties, Washington and Clackamas. It was named after the Multnomah tribe of Native Americans who lived in the area. The county was originally part of the Oregon Territory, which was established in 1848.
In the late 19th century, the county experienced a population boom due to the influx of settlers from the east coast and Europe. This led to the development of many of the cities and towns in the county, including Portland, Gresham, Troutdale, and Fairview.
In the early 20th century, the county experienced a period of rapid growth and development. This was due to the construction of the Columbia River Highway, which connected Portland to the rest of the state. The highway also allowed for the development of the county’s many bridges, including the iconic St. Johns Bridge.
Geography
Multnomah County covers an area of 466 square miles and is located in the Willamette Valley region of Oregon. The county is home to several mountain ranges, including the Cascade Range, the Coast Range, and the Columbia River Gorge. The county is also home to several rivers, including the Willamette River, the Columbia River, and the Sandy River.
The county is home to several parks and recreational areas, including the Columbia River Gorge National Scenic Area, the Mount Hood National Forest, and the Willamette National Forest.
Economy
Multnomah County’s economy is largely based on the service industry, with the largest employers being hospitals, universities, and government agencies. The county is also home to several major corporations, including Nike, Intel, and Columbia Sportswear.
The county is also home to several major ports, including the Port of Portland, the Port of Vancouver, and the Port of Astoria. These ports are important for the export of goods from the county, as well as for the import of goods from other countries.
Demographics
As of the 2020 census, Multnomah County had a population of 807,555. The population is largely white (71.3%), with smaller percentages of African Americans (7.2%), Asians (7.1%), and Hispanics (7.0%). The median household income in the county is $63,845, and the median home value is $420,000.
Conclusion
Multnomah County, Oregon is a vibrant and diverse county located in the northwestern corner of the state. It is home to several major cities and towns, as well as several mountain ranges, rivers, and parks. The county’s economy is largely based on the service industry, with the largest employers being hospitals, universities, and government agencies. The population of the county is largely white, with smaller percentages of African Americans, Asians, and Hispanics.
Common Questions
What is the Total Population of Multnomah County?
Total Population of Multnomah County is 808,098.
What is the Total Male Population of Multnomah County?
Total Male Population of Multnomah County is 403,380.
What is the Total Female Population of Multnomah County?
Total Female Population of Multnomah County is 404,718.
What is the Ratio of Males per 100 Females in Multnomah County?
There are 99.67 Males per 100 Females in Multnomah County.
What is the Ratio of Females per 100 Males in Multnomah County?
There are 100.33 Females per 100 Males in Multnomah County.
What is the Median Population Age in Multnomah County?
Median Population Age in Multnomah County is 38.2 Years.
What is the Average Family Size in Multnomah County
Average Family Size in Multnomah County is 3.0 People.
What is the Average Household Size in Multnomah County
Average Household Size in Multnomah County is 2.3 People.
What is Per Capita Income in Multnomah County?
Per Capita income in Multnomah County is $49,713.
What is the Median Family Income in Multnomah County?
Median Family Income in Multnomah County is $109,513.
What is the Median Household income in Multnomah County?
Median Household Income in Multnomah County is $83,668.
What is Income or Wage Gap in Multnomah County?
Income or Wage Gap in Multnomah County is 18.1%.
Women in Multnomah County earn 81.9 cents for every dollar earned by a man.
What is Family Income Deficit in Multnomah County?
Family Income Deficit in Multnomah County is $10,819.
Families that are below poverty line in Multnomah County earn $10,819 less on average than the poverty threshold level.
What is Inequality or Gini Index in Multnomah County?
Inequality or Gini Index in Multnomah County is 0.47.
How Large is the Labor Force in Multnomah County?
There are 474,895 People in the Labor Forcein in Multnomah County.
What is the Percentage of People in the Labor Force in Multnomah County?
70.0% of People are in the Labor Force in Multnomah County.
What is the Unemployment Rate in Multnomah County?
Unemployment Rate in Multnomah County is 5.5%.