Morrow County, OR
Morrow County Map
Morrow County Overview
12,140
TOTAL POPULATION
6,183
MALE POPULATION
5,957
FEMALE POPULATION
103.79
MALES / 100 FEMALES
96.34
FEMALES / 100 MALES
37.0
MEDIAN AGE
3.3
AVG FAMILY SIZE
2.9
AVG HOUSEHOLD SIZE
$29,975
PER CAPITA INCOME
$72,325
AVG FAMILY INCOME
$64,975
AVG HOUSEHOLD INCOME
29.9%
WAGE / INCOME GAP [ % ]
70.1¢/ $1
WAGE / INCOME GAP [ $ ]
$9,616
FAMILY INCOME DEFICIT
0.44
INEQUALITY / GINI INDEX
5,310
LABOR FORCE [ PEOPLE ]
57.4%
PERCENT IN LABOR FORCE
3.2%
UNEMPLOYMENT RATE
Morrow County Area Codes
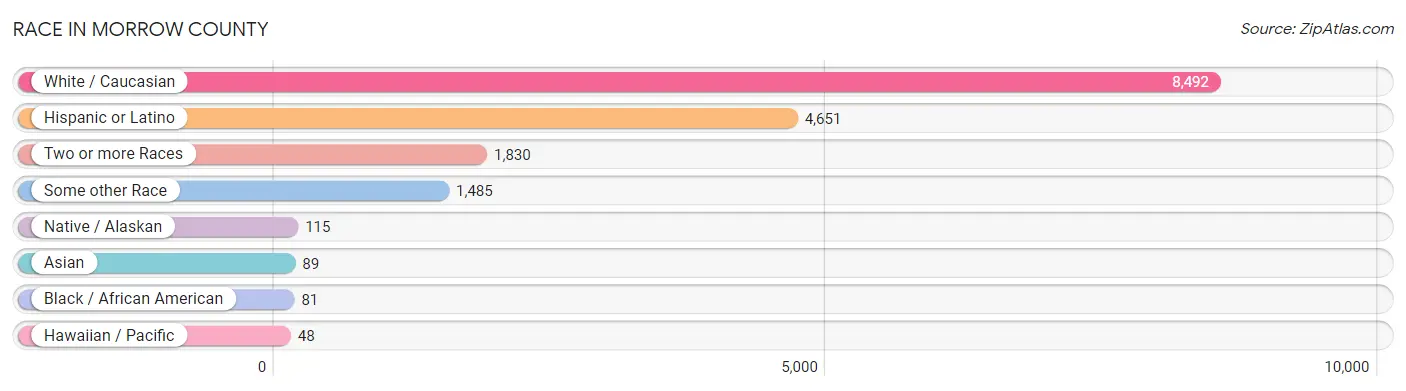
Race in Morrow County
The most populous races in Morrow County are White / Caucasian (8,492 | 70.0%), Hispanic or Latino (4,651 | 38.3%), and Two or more Races (1,830 | 15.1%).
| Race | # Population | % Population |
| Asian | 89 | 0.7% |
| Black / African American | 81 | 0.7% |
| Hawaiian / Pacific | 48 | 0.4% |
| Hispanic or Latino | 4,651 | 38.3% |
| Native / Alaskan | 115 | 0.9% |
| White / Caucasian | 8,492 | 70.0% |
| Two or more Races | 1,830 | 15.1% |
| Some other Race | 1,485 | 12.2% |
| Total | 12,140 | 100.0% |
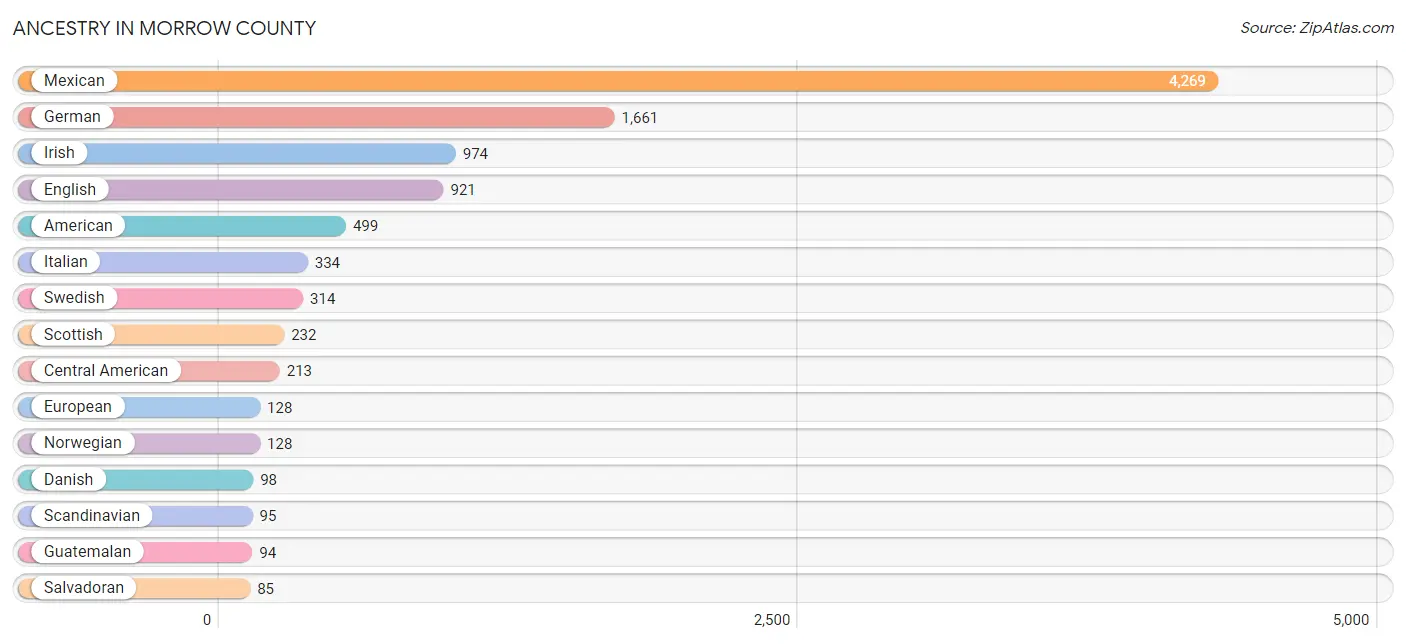
Ancestry in Morrow County
The most populous ancestries reported in Morrow County are Mexican (4,269 | 35.2%), German (1,661 | 13.7%), Irish (974 | 8.0%), English (921 | 7.6%), and American (499 | 4.1%), together accounting for 68.6% of all Morrow County residents.
| Ancestry | # Population | % Population |
| American | 499 | 4.1% |
| Austrian | 31 | 0.3% |
| Bhutanese | 15 | 0.1% |
| Blackfeet | 40 | 0.3% |
| British | 25 | 0.2% |
| Burmese | 4 | 0.0% |
| Canadian | 2 | 0.0% |
| Central American | 213 | 1.8% |
| Central American Indian | 43 | 0.4% |
| Cherokee | 71 | 0.6% |
| Croatian | 5 | 0.0% |
| Cuban | 2 | 0.0% |
| Czech | 36 | 0.3% |
| Danish | 98 | 0.8% |
| Dutch | 83 | 0.7% |
| English | 921 | 7.6% |
| Ethiopian | 38 | 0.3% |
| European | 128 | 1.1% |
| Finnish | 1 | 0.0% |
| French | 80 | 0.7% |
| French Canadian | 75 | 0.6% |
| German | 1,661 | 13.7% |
| Greek | 8 | 0.1% |
| Guamanian / Chamorro | 44 | 0.4% |
| Guatemalan | 94 | 0.8% |
| Hungarian | 11 | 0.1% |
| Indian (Asian) | 5 | 0.0% |
| Irish | 974 | 8.0% |
| Italian | 334 | 2.8% |
| Korean | 74 | 0.6% |
| Mexican | 4,269 | 35.2% |
| Mexican American Indian | 43 | 0.4% |
| Native Hawaiian | 3 | 0.0% |
| Navajo | 3 | 0.0% |
| Northern European | 28 | 0.2% |
| Norwegian | 128 | 1.1% |
| Panamanian | 34 | 0.3% |
| Peruvian | 3 | 0.0% |
| Polish | 24 | 0.2% |
| Portuguese | 36 | 0.3% |
| Puerto Rican | 35 | 0.3% |
| Russian | 41 | 0.3% |
| Salvadoran | 85 | 0.7% |
| Scandinavian | 95 | 0.8% |
| Scotch-Irish | 72 | 0.6% |
| Scottish | 232 | 1.9% |
| Sioux | 20 | 0.2% |
| South American | 3 | 0.0% |
| South American Indian | 3 | 0.0% |
| Spanish | 4 | 0.0% |
| Sri Lankan | 16 | 0.1% |
| Subsaharan African | 38 | 0.3% |
| Swedish | 314 | 2.6% |
| Swiss | 17 | 0.1% |
| Thai | 3 | 0.0% |
| Ukrainian | 16 | 0.1% |
| Welsh | 29 | 0.2% |
| Yugoslavian | 20 | 0.2% | View All 58 Rows |
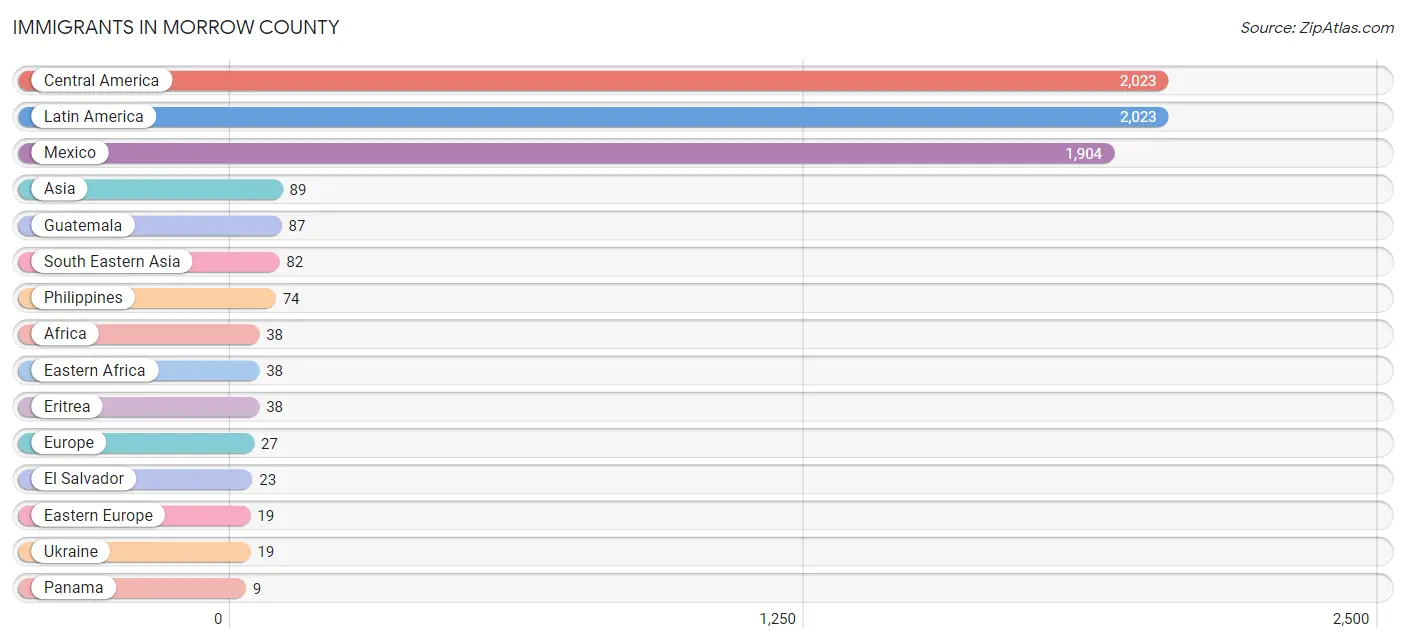
Immigrants in Morrow County
The most numerous immigrant groups reported in Morrow County came from Central America (2,023 | 16.7%), Latin America (2,023 | 16.7%), Mexico (1,904 | 15.7%), Asia (89 | 0.7%), and Guatemala (87 | 0.7%), together accounting for 50.4% of all Morrow County residents.
| Immigration Origin | # Population | % Population |
| Africa | 38 | 0.3% |
| Asia | 89 | 0.7% |
| Central America | 2,023 | 16.7% |
| Eastern Africa | 38 | 0.3% |
| Eastern Asia | 4 | 0.0% |
| Eastern Europe | 19 | 0.2% |
| El Salvador | 23 | 0.2% |
| Eritrea | 38 | 0.3% |
| Europe | 27 | 0.2% |
| Germany | 8 | 0.1% |
| Guatemala | 87 | 0.7% |
| India | 3 | 0.0% |
| Korea | 4 | 0.0% |
| Latin America | 2,023 | 16.7% |
| Mexico | 1,904 | 15.7% |
| Panama | 9 | 0.1% |
| Philippines | 74 | 0.6% |
| South Central Asia | 3 | 0.0% |
| South Eastern Asia | 82 | 0.7% |
| Ukraine | 19 | 0.2% |
| Vietnam | 8 | 0.1% |
| Western Europe | 8 | 0.1% | View All 22 Rows |
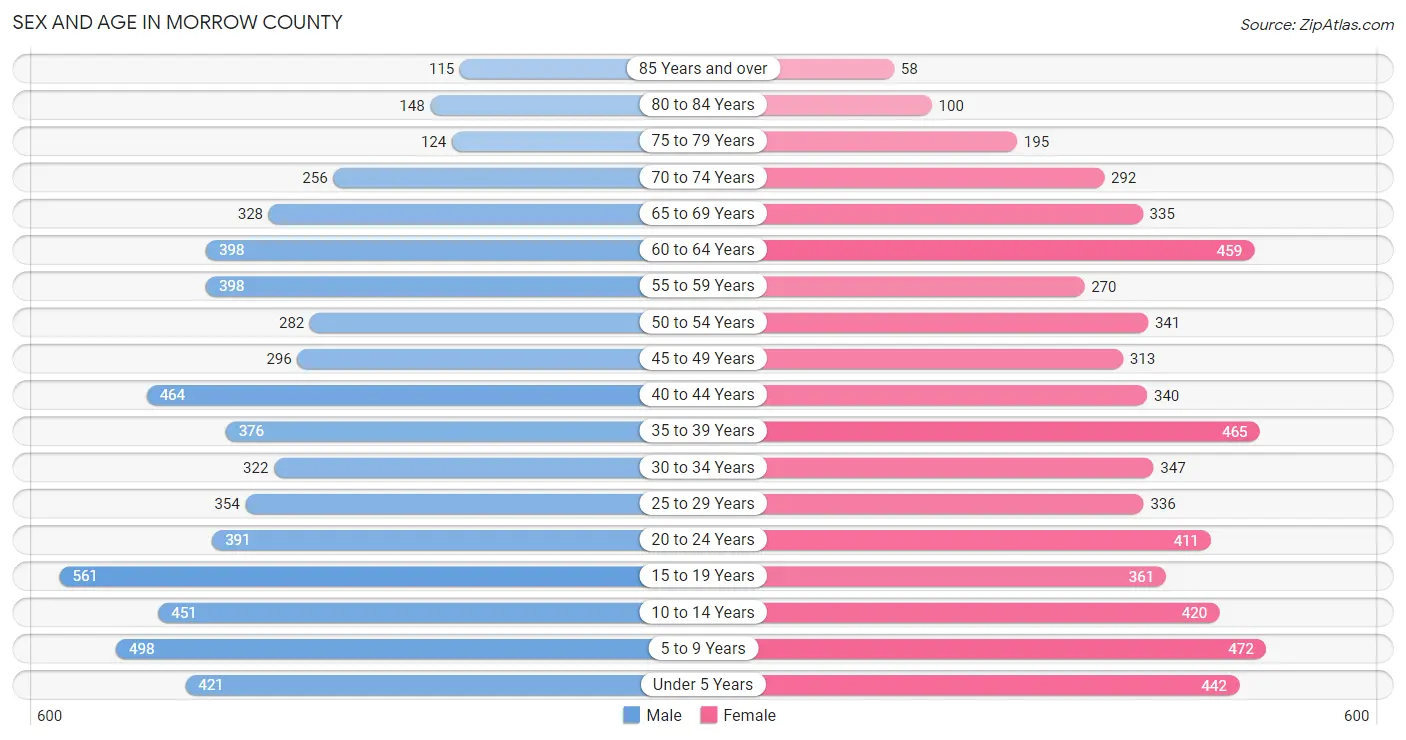
Sex and Age in Morrow County
Sex and Age in Morrow County
The most populous age groups in Morrow County are 15 to 19 Years (561 | 9.1%) for men and 5 to 9 Years (472 | 7.9%) for women.
| Age Bracket | Male | Female |
| Under 5 Years | 421 (6.8%) | 442 (7.4%) |
| 5 to 9 Years | 498 (8.1%) | 472 (7.9%) |
| 10 to 14 Years | 451 (7.3%) | 420 (7.0%) |
| 15 to 19 Years | 561 (9.1%) | 361 (6.1%) |
| 20 to 24 Years | 391 (6.3%) | 411 (6.9%) |
| 25 to 29 Years | 354 (5.7%) | 336 (5.6%) |
| 30 to 34 Years | 322 (5.2%) | 347 (5.8%) |
| 35 to 39 Years | 376 (6.1%) | 465 (7.8%) |
| 40 to 44 Years | 464 (7.5%) | 340 (5.7%) |
| 45 to 49 Years | 296 (4.8%) | 313 (5.2%) |
| 50 to 54 Years | 282 (4.6%) | 341 (5.7%) |
| 55 to 59 Years | 398 (6.4%) | 270 (4.5%) |
| 60 to 64 Years | 398 (6.4%) | 459 (7.7%) |
| 65 to 69 Years | 328 (5.3%) | 335 (5.6%) |
| 70 to 74 Years | 256 (4.1%) | 292 (4.9%) |
| 75 to 79 Years | 124 (2.0%) | 195 (3.3%) |
| 80 to 84 Years | 148 (2.4%) | 100 (1.7%) |
| 85 Years and over | 115 (1.9%) | 58 (1.0%) |
| Total | 6,183 (100.0%) | 5,957 (100.0%) |
Families and Households in Morrow County
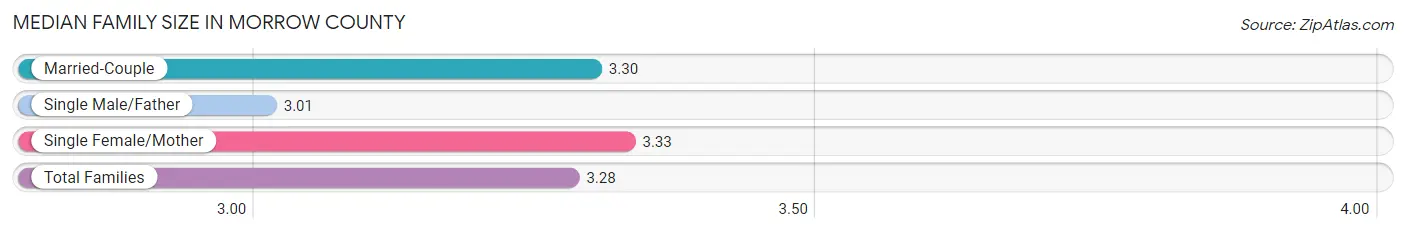
Median Family Size in Morrow County
The median family size in Morrow County is 3.28 persons per family, with single female/mother families (551 | 17.6%) accounting for the largest median family size of 3.33 persons per family. On the other hand, single male/father families (303 | 9.7%) represent the smallest median family size with 3.01 persons per family.
| Family Type | # Families | Family Size |
| Married-Couple | 2,276 (72.7%) | 3.30 |
| Single Male/Father | 303 (9.7%) | 3.01 |
| Single Female/Mother | 551 (17.6%) | 3.33 |
| Total Families | 3,130 (100.0%) | 3.28 |
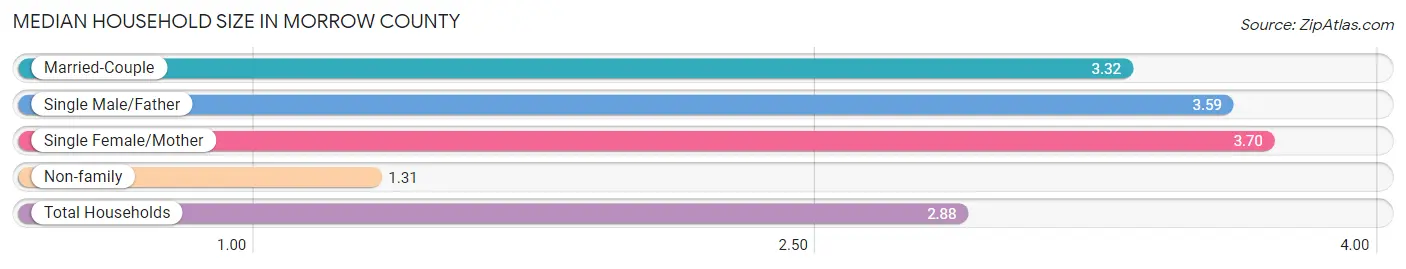
Median Household Size in Morrow County
The median household size in Morrow County is 2.88 persons per household, with single female/mother households (551 | 13.1%) accounting for the largest median household size of 3.7 persons per household. non-family households (1,071 | 25.5%) represent the smallest median household size with 1.31 persons per household.
| Household Type | # Households | Household Size |
| Married-Couple | 2,276 (54.2%) | 3.32 |
| Single Male/Father | 303 (7.2%) | 3.59 |
| Single Female/Mother | 551 (13.1%) | 3.70 |
| Non-family | 1,071 (25.5%) | 1.31 |
| Total Households | 4,201 (100.0%) | 2.88 |
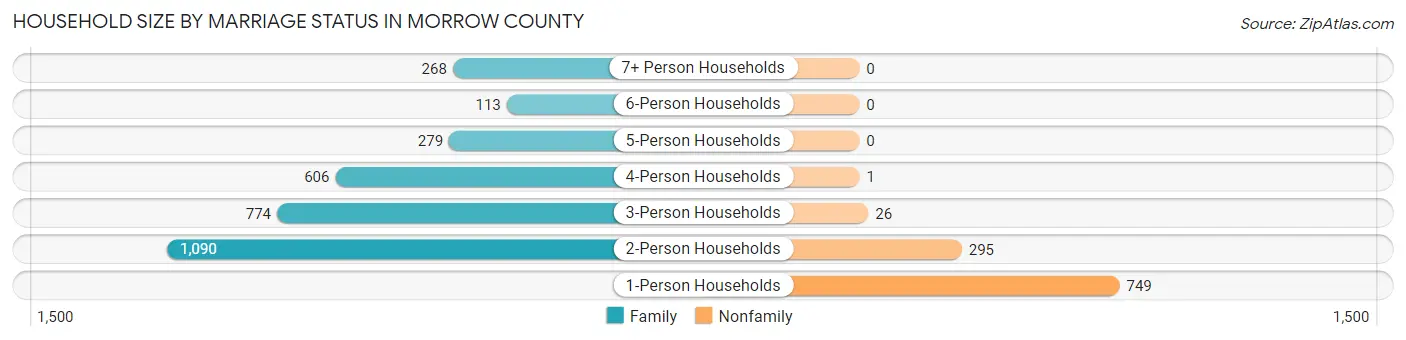
Household Size by Marriage Status in Morrow County
Out of a total of 4,201 households in Morrow County, 3,130 (74.5%) are family households, while 1,071 (25.5%) are nonfamily households. The most numerous type of family households are 2-person households, comprising 1,090, and the most common type of nonfamily households are 1-person households, comprising 749.
| Household Size | Family Households | Nonfamily Households |
| 1-Person Households | - | 749 (17.8%) |
| 2-Person Households | 1,090 (26.0%) | 295 (7.0%) |
| 3-Person Households | 774 (18.4%) | 26 (0.6%) |
| 4-Person Households | 606 (14.4%) | 1 (0.0%) |
| 5-Person Households | 279 (6.6%) | 0 (0.0%) |
| 6-Person Households | 113 (2.7%) | 0 (0.0%) |
| 7+ Person Households | 268 (6.4%) | 0 (0.0%) |
| Total | 3,130 (74.5%) | 1,071 (25.5%) |
Female Fertility in Morrow County
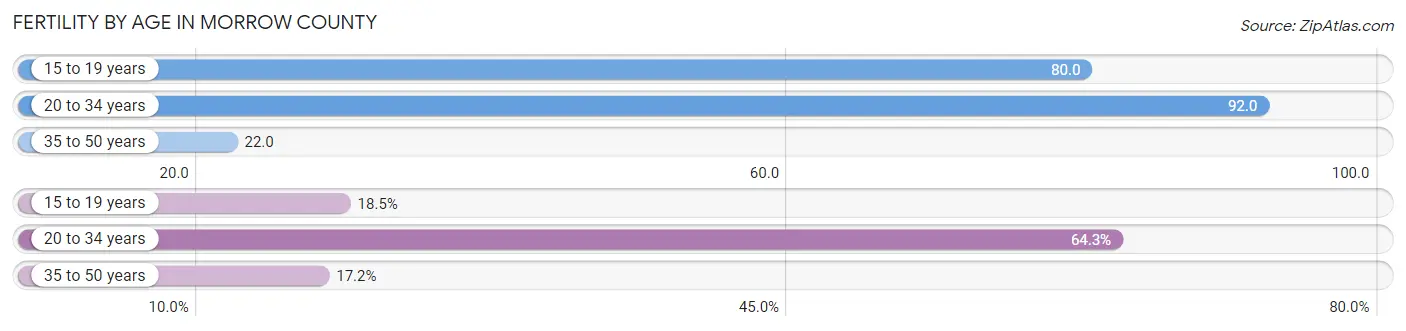
Fertility by Age in Morrow County
Average fertility rate in Morrow County is 58.0 births per 1,000 women. Women in the age bracket of 20 to 34 years have the highest fertility rate with 92.0 births per 1,000 women. Women in the age bracket of 20 to 34 years acount for 64.3% of all women with births.
| Age Bracket | Women with Births | Births / 1,000 Women |
| 15 to 19 years | 29 (18.5%) | 80.0 |
| 20 to 34 years | 101 (64.3%) | 92.0 |
| 35 to 50 years | 27 (17.2%) | 22.0 |
| Total | 157 (100.0%) | 58.0 |
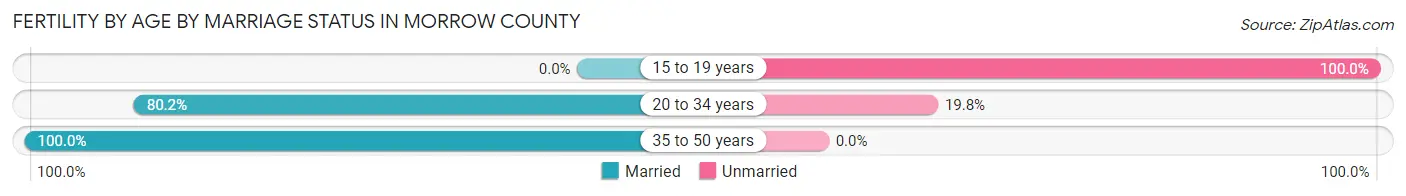
Fertility by Age by Marriage Status in Morrow County
68.8% of women with births (157) in Morrow County are married. The highest percentage of unmarried women with births falls into 15 to 19 years age bracket with 100.0% of them unmarried at the time of birth, while the lowest percentage of unmarried women with births belong to 35 to 50 years age bracket with 0.0% of them unmarried.
| Age Bracket | Married | Unmarried |
| 15 to 19 years | 0 (0.0%) | 29 (100.0%) |
| 20 to 34 years | 81 (80.2%) | 20 (19.8%) |
| 35 to 50 years | 27 (100.0%) | 0 (0.0%) |
| Total | 108 (68.8%) | 49 (31.2%) |
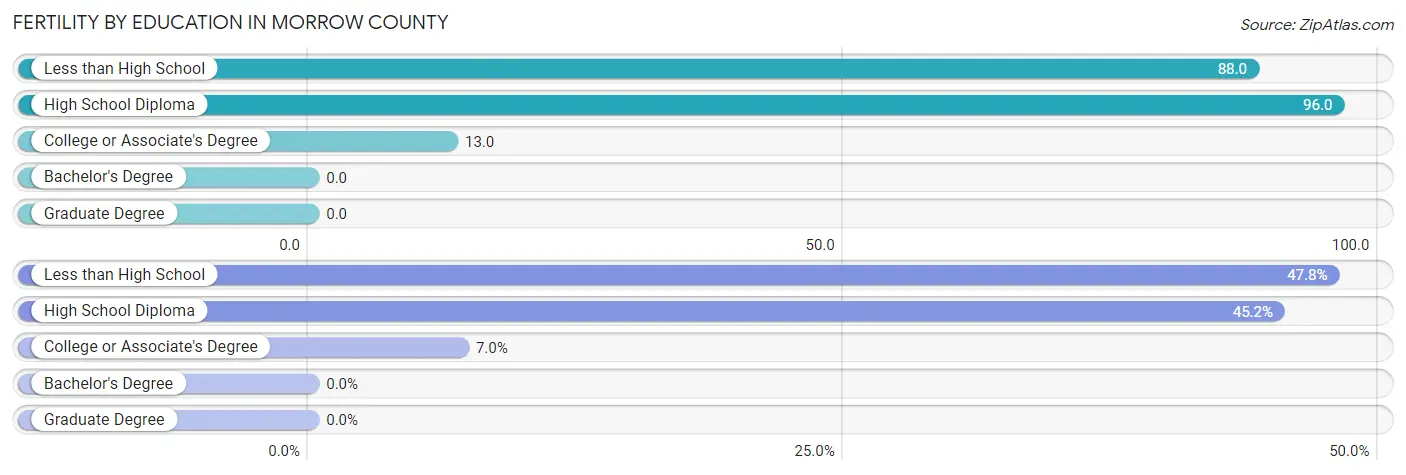
Fertility by Education in Morrow County
| Educational Attainment | Women with Births | Births / 1,000 Women |
| Less than High School | 75 (47.8%) | 88.0 |
| High School Diploma | 71 (45.2%) | 96.0 |
| College or Associate's Degree | 11 (7.0%) | 13.0 |
| Bachelor's Degree | 0 (0.0%) | 0.0 |
| Graduate Degree | 0 (0.0%) | 0.0 |
| Total | 157 (100.0%) | 58.0 |
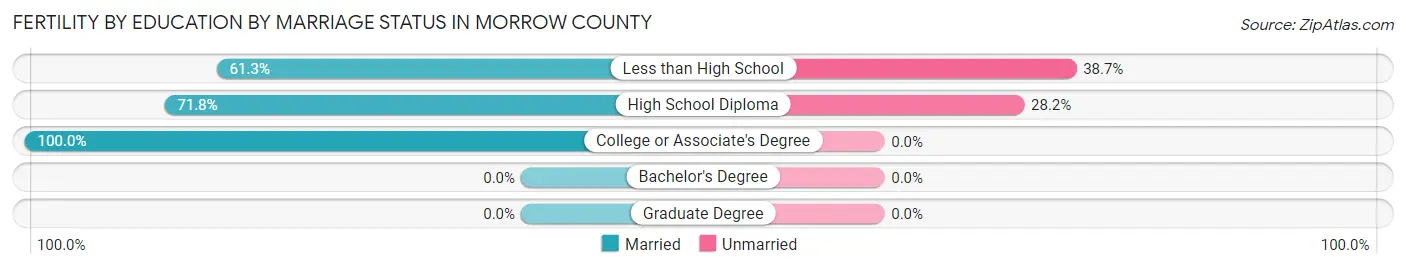
Fertility by Education by Marriage Status in Morrow County
31.2% of women with births in Morrow County are unmarried. Women with the educational attainment of college or associate's degree are most likely to be married with 100.0% of them married at childbirth, while women with the educational attainment of less than high school are least likely to be married with 38.7% of them unmarried at childbirth.
| Educational Attainment | Married | Unmarried |
| Less than High School | 46 (61.3%) | 29 (38.7%) |
| High School Diploma | 51 (71.8%) | 20 (28.2%) |
| College or Associate's Degree | 11 (100.0%) | 0 (0.0%) |
| Bachelor's Degree | 0 (0.0%) | 0 (0.0%) |
| Graduate Degree | 0 (0.0%) | 0 (0.0%) |
| Total | 108 (68.8%) | 49 (31.2%) |
Income in Morrow County
Income Overview in Morrow County
Per Capita Income in Morrow County is $29,975, while median incomes of families and households are $72,325 and $64,975 respectively.
| Characteristic | Number | Measure |
| Per Capita Income | 12,140 | $29,975 |
| Median Family Income | 3,130 | $72,325 |
| Mean Family Income | 3,130 | $95,671 |
| Median Household Income | 4,201 | $64,975 |
| Mean Household Income | 4,201 | $86,322 |
| Income Deficit | 3,130 | $9,616 |
| Wage / Income Gap (%) | 12,140 | 29.92% |
| Wage / Income Gap ($) | 12,140 | 70.08¢ per $1 |
| Gini / Inequality Index | 12,140 | 0.44 |
Earnings by Sex in Morrow County
Average Earnings in Morrow County are $35,398, $41,729 for men and $29,245 for women, a difference of 29.9%.
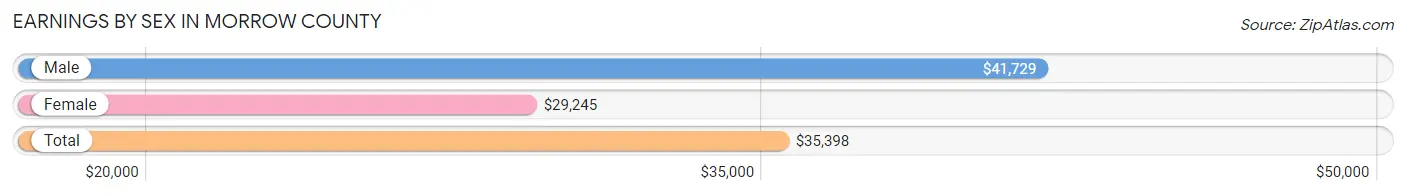
| Sex | Number | Average Earnings |
| Male | 3,304 (56.8%) | $41,729 |
| Female | 2,513 (43.2%) | $29,245 |
| Total | 5,817 (100.0%) | $35,398 |
Earnings by Sex by Income Bracket in Morrow County
The most common earnings brackets in Morrow County are $100,000+ for men (309 | 9.3%) and $25,000 to $29,999 for women (204 | 8.1%).
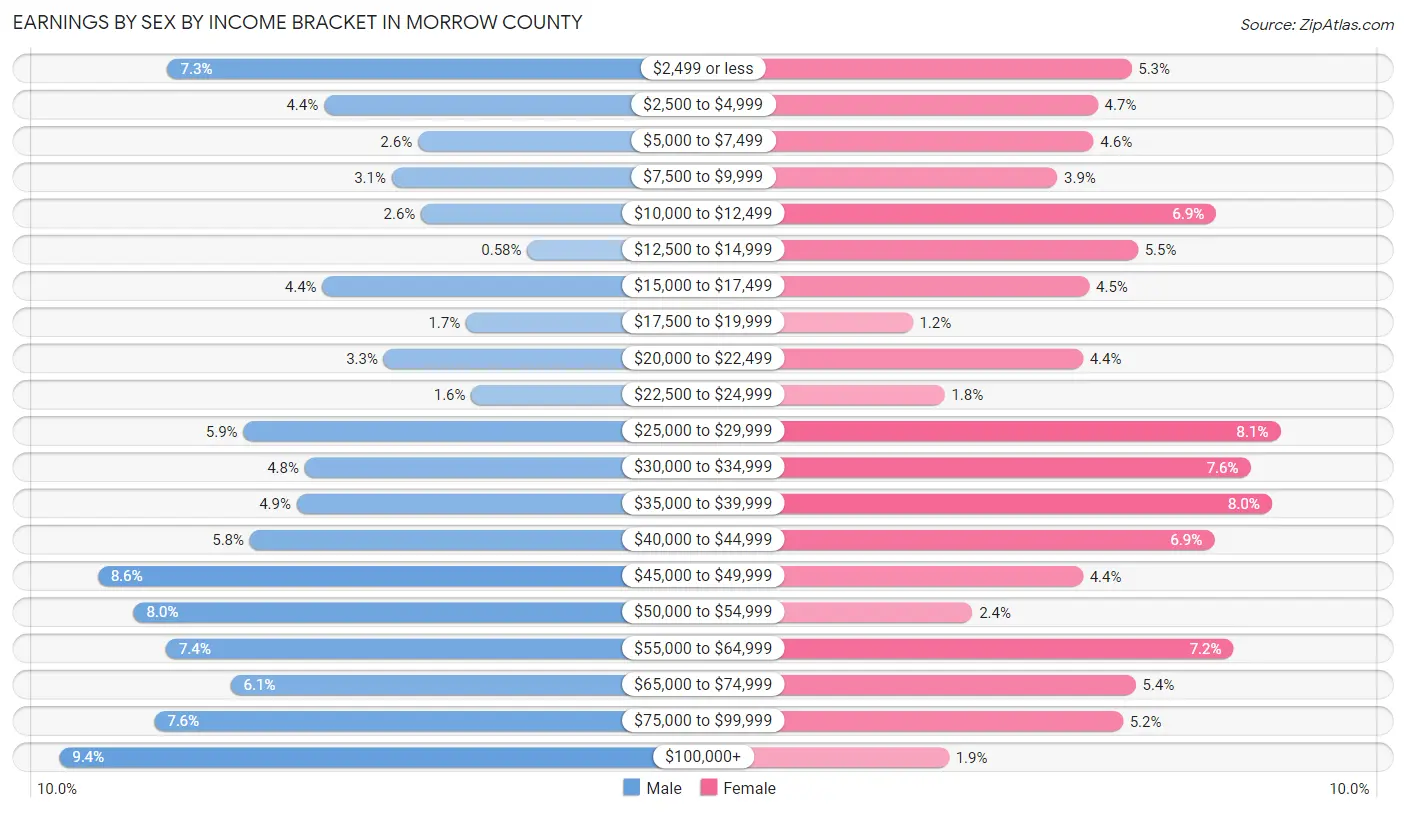
| Income | Male | Female |
| $2,499 or less | 242 (7.3%) | 134 (5.3%) |
| $2,500 to $4,999 | 145 (4.4%) | 118 (4.7%) |
| $5,000 to $7,499 | 87 (2.6%) | 116 (4.6%) |
| $7,500 to $9,999 | 103 (3.1%) | 99 (3.9%) |
| $10,000 to $12,499 | 85 (2.6%) | 174 (6.9%) |
| $12,500 to $14,999 | 19 (0.6%) | 137 (5.4%) |
| $15,000 to $17,499 | 146 (4.4%) | 114 (4.5%) |
| $17,500 to $19,999 | 57 (1.7%) | 31 (1.2%) |
| $20,000 to $22,499 | 108 (3.3%) | 111 (4.4%) |
| $22,500 to $24,999 | 54 (1.6%) | 46 (1.8%) |
| $25,000 to $29,999 | 195 (5.9%) | 204 (8.1%) |
| $30,000 to $34,999 | 157 (4.8%) | 190 (7.6%) |
| $35,000 to $39,999 | 162 (4.9%) | 200 (8.0%) |
| $40,000 to $44,999 | 191 (5.8%) | 173 (6.9%) |
| $45,000 to $49,999 | 285 (8.6%) | 111 (4.4%) |
| $50,000 to $54,999 | 263 (8.0%) | 59 (2.4%) |
| $55,000 to $64,999 | 243 (7.3%) | 182 (7.2%) |
| $65,000 to $74,999 | 203 (6.1%) | 136 (5.4%) |
| $75,000 to $99,999 | 250 (7.6%) | 130 (5.2%) |
| $100,000+ | 309 (9.3%) | 48 (1.9%) |
| Total | 3,304 (100.0%) | 2,513 (100.0%) |
Earnings by Sex by Educational Attainment in Morrow County
Average earnings in Morrow County are $46,906 for men and $32,640 for women, a difference of 30.4%. Men with an educational attainment of bachelor's degree enjoy the highest average annual earnings of $67,292, while those with less than high school education earn the least with $44,000. Women with an educational attainment of graduate degree earn the most with the average annual earnings of $54,375, while those with less than high school education have the smallest earnings of $26,702.
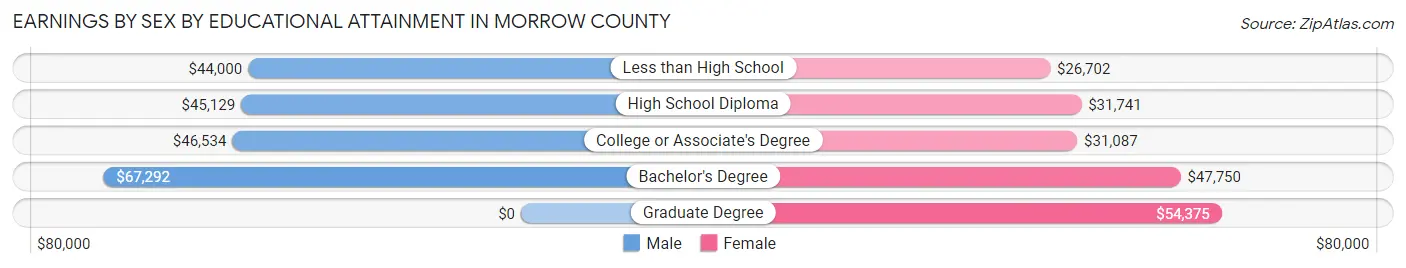
| Educational Attainment | Male Income | Female Income |
| Less than High School | $44,000 | $26,702 |
| High School Diploma | $45,129 | $31,741 |
| College or Associate's Degree | $46,534 | $31,087 |
| Bachelor's Degree | $67,292 | $47,750 |
| Graduate Degree | - | - |
| Total | $46,906 | $32,640 |
Family Income in Morrow County
Family Income Brackets in Morrow County
According to the Morrow County family income data, there are 613 families falling into the $100,000 to $149,999 income range, which is the most common income bracket and makes up 19.6% of all families. Conversely, the $10,000 to $14,999 income bracket is the least frequent group with only 41 families (1.3%) belonging to this category.
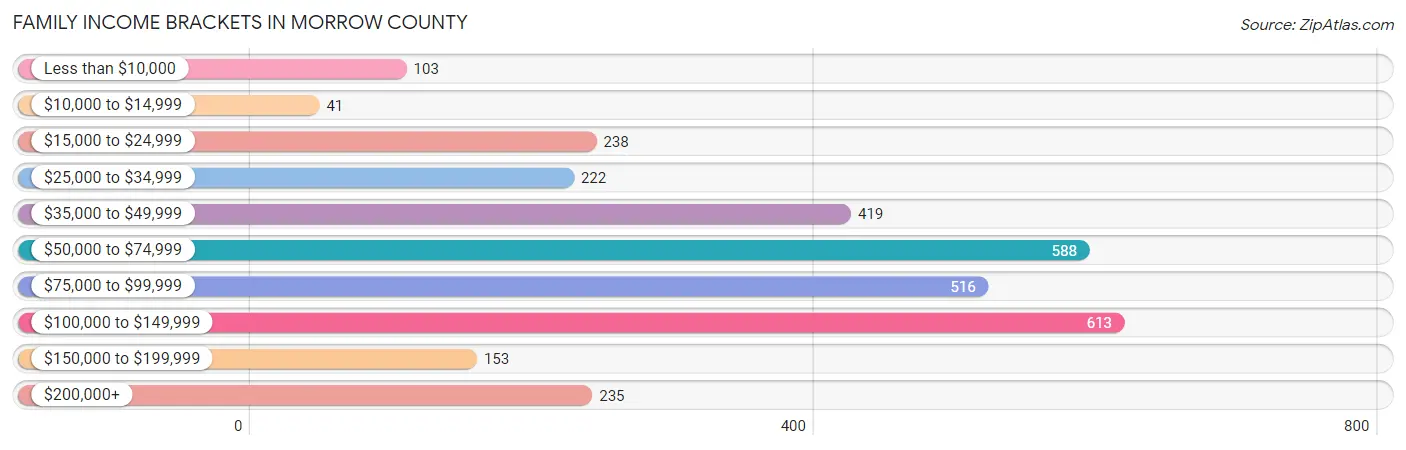
| Income Bracket | # Families | % Families |
| Less than $10,000 | 103 | 3.3% |
| $10,000 to $14,999 | 41 | 1.3% |
| $15,000 to $24,999 | 238 | 7.6% |
| $25,000 to $34,999 | 222 | 7.1% |
| $35,000 to $49,999 | 419 | 13.4% |
| $50,000 to $74,999 | 588 | 18.8% |
| $75,000 to $99,999 | 516 | 16.5% |
| $100,000 to $149,999 | 613 | 19.6% |
| $150,000 to $199,999 | 153 | 4.9% |
| $200,000+ | 235 | 7.5% |
Family Income by Famaliy Size in Morrow County
5-person families (228 | 7.3%) account for the highest median family income in Morrow County with $106,346 per family, while 2-person families (1,248 | 39.9%) have the highest median income of $35,652 per family member.
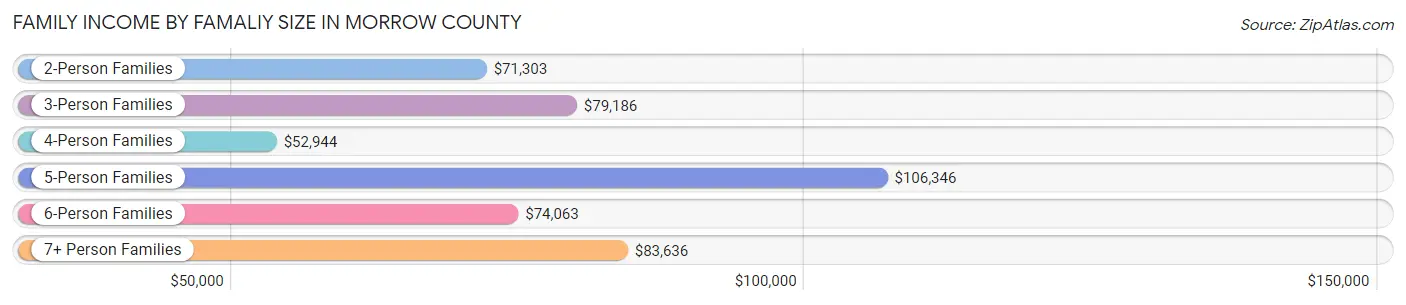
| Income Bracket | # Families | Median Income |
| 2-Person Families | 1,248 (39.9%) | $71,303 |
| 3-Person Families | 736 (23.5%) | $79,186 |
| 4-Person Families | 577 (18.4%) | $52,944 |
| 5-Person Families | 228 (7.3%) | $106,346 |
| 6-Person Families | 117 (3.7%) | $74,063 |
| 7+ Person Families | 224 (7.2%) | $83,636 |
| Total | 3,130 (100.0%) | $72,325 |
Family Income by Number of Earners in Morrow County
The median family income in Morrow County is $72,325, with families comprising 3+ earners (436) having the highest median family income of $111,250, while families with no earners (538) have the lowest median family income of $43,500, accounting for 13.9% and 17.2% of families, respectively.
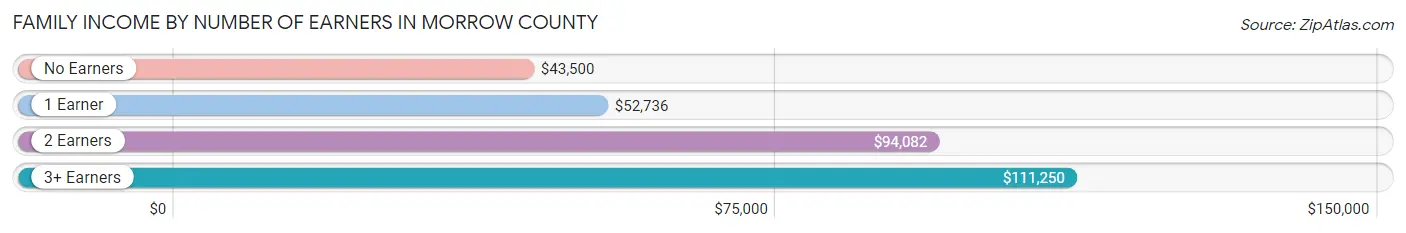
| Number of Earners | # Families | Median Income |
| No Earners | 538 (17.2%) | $43,500 |
| 1 Earner | 1,160 (37.1%) | $52,736 |
| 2 Earners | 996 (31.8%) | $94,082 |
| 3+ Earners | 436 (13.9%) | $111,250 |
| Total | 3,130 (100.0%) | $72,325 |
Household Income in Morrow County
Household Income Brackets in Morrow County
With 769 households falling in the category, the $50,000 to $74,999 income range is the most frequent in Morrow County, accounting for 18.3% of all households. In contrast, only 84 households (2.0%) fall into the $10,000 to $14,999 income bracket, making it the least populous group.
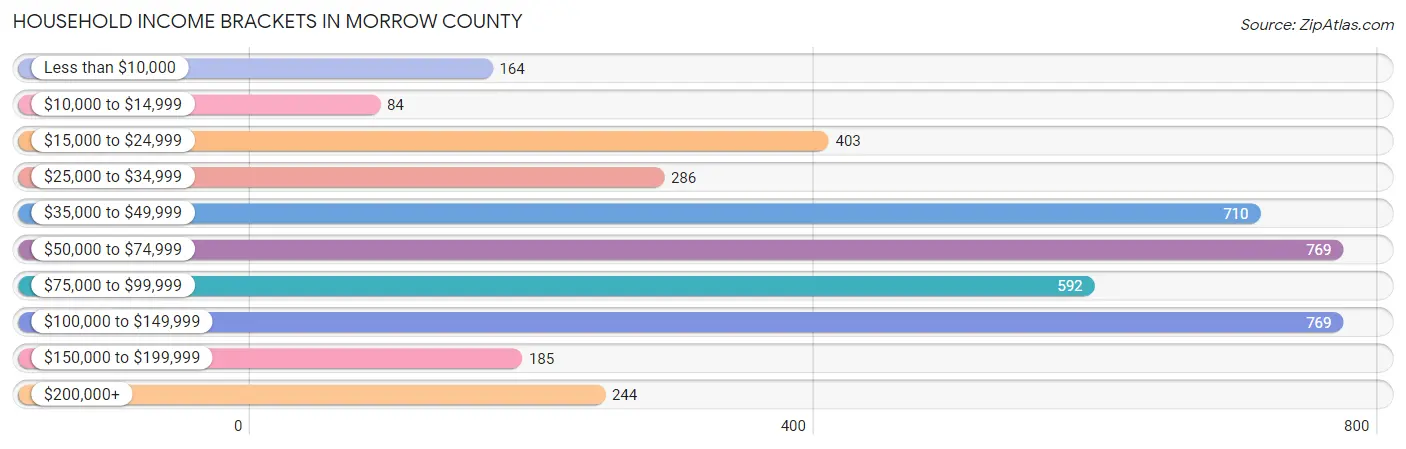
| Income Bracket | # Households | % Households |
| Less than $10,000 | 164 | 3.9% |
| $10,000 to $14,999 | 84 | 2.0% |
| $15,000 to $24,999 | 403 | 9.6% |
| $25,000 to $34,999 | 286 | 6.8% |
| $35,000 to $49,999 | 710 | 16.9% |
| $50,000 to $74,999 | 769 | 18.3% |
| $75,000 to $99,999 | 592 | 14.1% |
| $100,000 to $149,999 | 769 | 18.3% |
| $150,000 to $199,999 | 185 | 4.4% |
| $200,000+ | 244 | 5.8% |
Household Income by Householder Age in Morrow County
The median household income in Morrow County is $64,975, with the highest median household income of $72,271 found in the 25 to 44 years age bracket for the primary householder. A total of 1,391 households (33.1%) fall into this category. Meanwhile, the 15 to 24 years age bracket for the primary householder has the lowest median household income of $45,603, with 265 households (6.3%) in this group.
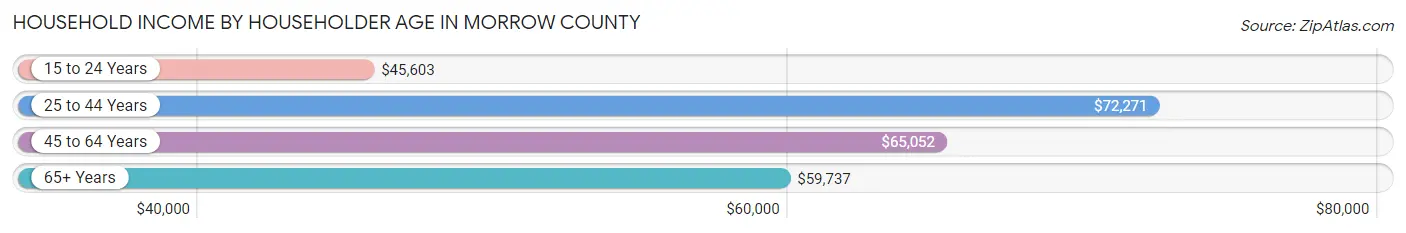
| Income Bracket | # Households | Median Income |
| 15 to 24 Years | 265 (6.3%) | $45,603 |
| 25 to 44 Years | 1,391 (33.1%) | $72,271 |
| 45 to 64 Years | 1,421 (33.8%) | $65,052 |
| 65+ Years | 1,124 (26.8%) | $59,737 |
| Total | 4,201 (100.0%) | $64,975 |
Poverty in Morrow County
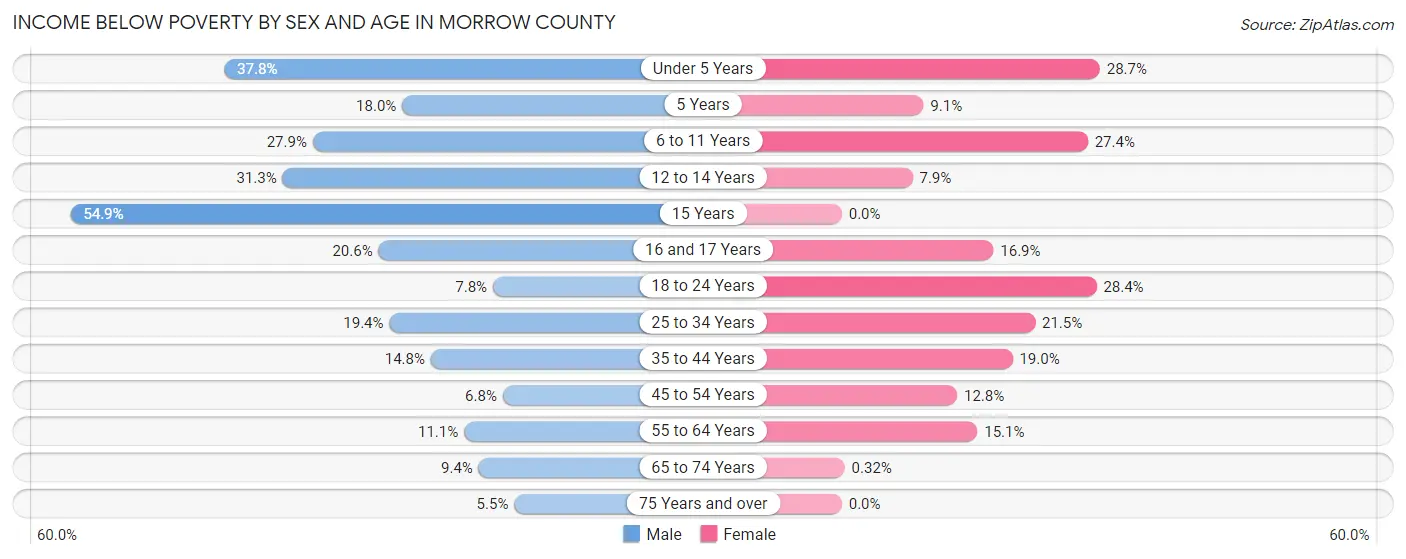
Income Below Poverty by Sex and Age in Morrow County
With 16.7% poverty level for males and 16.7% for females among the residents of Morrow County, 15 year old males and under 5 year old females are the most vulnerable to poverty, with 56 males (54.9%) and 127 females (28.7%) in their respective age groups living below the poverty level.
| Age Bracket | Male | Female |
| Under 5 Years | 159 (37.8%) | 127 (28.7%) |
| 5 Years | 21 (17.9%) | 4 (9.1%) |
| 6 to 11 Years | 144 (27.9%) | 169 (27.4%) |
| 12 to 14 Years | 96 (31.3%) | 16 (7.9%) |
| 15 Years | 56 (54.9%) | 0 (0.0%) |
| 16 and 17 Years | 49 (20.6%) | 27 (16.9%) |
| 18 to 24 Years | 48 (7.8%) | 150 (28.4%) |
| 25 to 34 Years | 131 (19.4%) | 147 (21.5%) |
| 35 to 44 Years | 124 (14.8%) | 153 (19.0%) |
| 45 to 54 Years | 39 (6.8%) | 84 (12.8%) |
| 55 to 64 Years | 88 (11.1%) | 110 (15.1%) |
| 65 to 74 Years | 55 (9.4%) | 2 (0.3%) |
| 75 Years and over | 21 (5.5%) | 0 (0.0%) |
| Total | 1,031 (16.7%) | 989 (16.7%) |
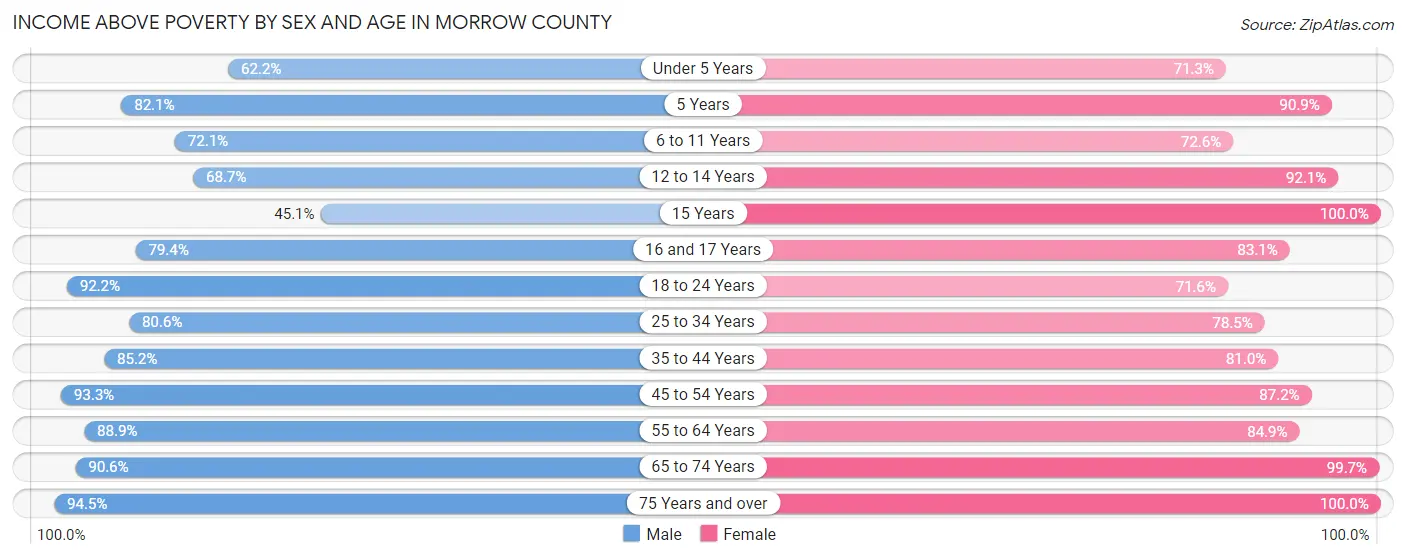
Income Above Poverty by Sex and Age in Morrow County
According to the poverty statistics in Morrow County, males aged 75 years and over and females aged 15 years are the age groups that are most secure financially, with 94.5% of males and 100.0% of females in these age groups living above the poverty line.
| Age Bracket | Male | Female |
| Under 5 Years | 262 (62.2%) | 315 (71.3%) |
| 5 Years | 96 (82.1%) | 40 (90.9%) |
| 6 to 11 Years | 372 (72.1%) | 448 (72.6%) |
| 12 to 14 Years | 211 (68.7%) | 187 (92.1%) |
| 15 Years | 46 (45.1%) | 83 (100.0%) |
| 16 and 17 Years | 189 (79.4%) | 133 (83.1%) |
| 18 to 24 Years | 564 (92.2%) | 379 (71.6%) |
| 25 to 34 Years | 545 (80.6%) | 536 (78.5%) |
| 35 to 44 Years | 716 (85.2%) | 652 (81.0%) |
| 45 to 54 Years | 539 (93.2%) | 570 (87.2%) |
| 55 to 64 Years | 708 (88.9%) | 619 (84.9%) |
| 65 to 74 Years | 528 (90.6%) | 624 (99.7%) |
| 75 Years and over | 363 (94.5%) | 350 (100.0%) |
| Total | 5,139 (83.3%) | 4,936 (83.3%) |
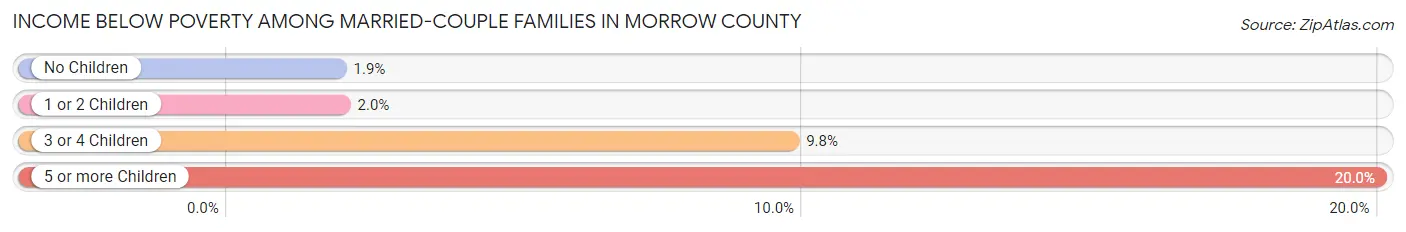
Income Below Poverty Among Married-Couple Families in Morrow County
The poverty statistics for married-couple families in Morrow County show that 3.7% or 84 of the total 2,276 families live below the poverty line. Families with 5 or more children have the highest poverty rate of 20.0%, comprising of 18 families. On the other hand, families with no children have the lowest poverty rate of 1.9%, which includes 23 families.
| Children | Above Poverty | Below Poverty |
| No Children | 1,193 (98.1%) | 23 (1.9%) |
| 1 or 2 Children | 650 (98.0%) | 13 (2.0%) |
| 3 or 4 Children | 277 (90.2%) | 30 (9.8%) |
| 5 or more Children | 72 (80.0%) | 18 (20.0%) |
| Total | 2,192 (96.3%) | 84 (3.7%) |
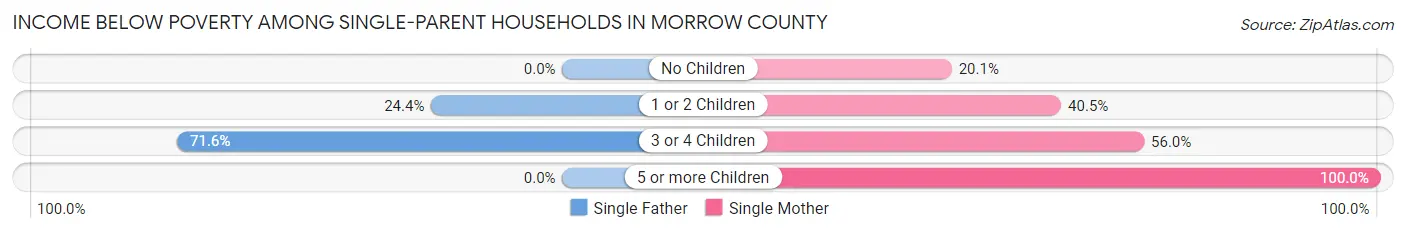
Income Below Poverty Among Single-Parent Households in Morrow County
According to the poverty data in Morrow County, 26.4% or 80 single-father households and 40.5% or 223 single-mother households are living below the poverty line. Among single-father households, those with 3 or 4 children have the highest poverty rate, with 58 households (71.6%) experiencing poverty. Likewise, among single-mother households, those with 5 or more children have the highest poverty rate, with 4 households (100.0%) falling below the poverty line.
| Children | Single Father | Single Mother |
| No Children | 0 (0.0%) | 32 (20.1%) |
| 1 or 2 Children | 22 (24.4%) | 79 (40.5%) |
| 3 or 4 Children | 58 (71.6%) | 108 (56.0%) |
| 5 or more Children | 0 (0.0%) | 4 (100.0%) |
| Total | 80 (26.4%) | 223 (40.5%) |
Income Below Poverty Among Married-Couple vs Single-Parent Households in Morrow County
The poverty data for Morrow County shows that 84 of the married-couple family households (3.7%) and 303 of the single-parent households (35.5%) are living below the poverty level. Within the married-couple family households, those with 5 or more children have the highest poverty rate, with 18 households (20.0%) falling below the poverty line. Among the single-parent households, those with 3 or 4 children have the highest poverty rate, with 166 household (60.6%) living below poverty.
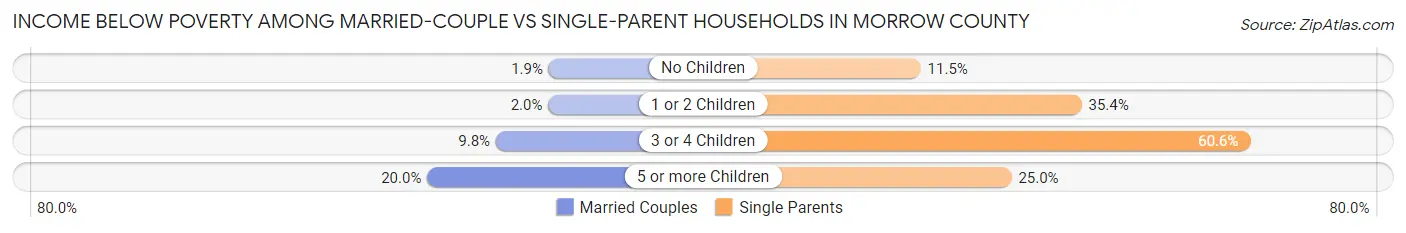
| Children | Married-Couple Families | Single-Parent Households |
| No Children | 23 (1.9%) | 32 (11.5%) |
| 1 or 2 Children | 13 (2.0%) | 101 (35.4%) |
| 3 or 4 Children | 30 (9.8%) | 166 (60.6%) |
| 5 or more Children | 18 (20.0%) | 4 (25.0%) |
| Total | 84 (3.7%) | 303 (35.5%) |
Employment Characteristics in Morrow County
Employment by Class of Employer in Morrow County
Among the 4,900 employed individuals in Morrow County, private company employees (3,384 | 69.1%), local government employees (510 | 10.4%), and self-employed (not incorporated) (398 | 8.1%) make up the most common classes of employment.
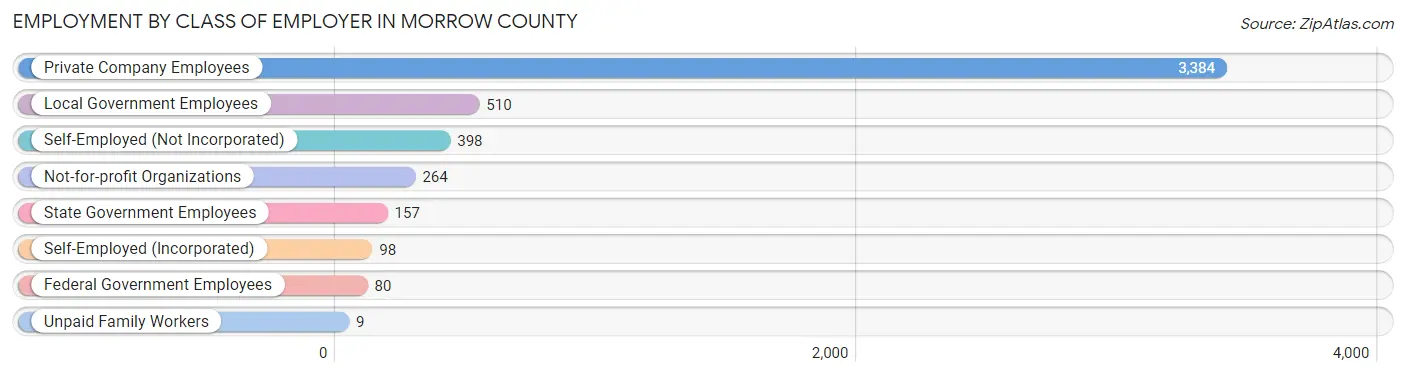
| Employer Class | # Employees | % Employees |
| Private Company Employees | 3,384 | 69.1% |
| Self-Employed (Incorporated) | 98 | 2.0% |
| Self-Employed (Not Incorporated) | 398 | 8.1% |
| Not-for-profit Organizations | 264 | 5.4% |
| Local Government Employees | 510 | 10.4% |
| State Government Employees | 157 | 3.2% |
| Federal Government Employees | 80 | 1.6% |
| Unpaid Family Workers | 9 | 0.2% |
| Total | 4,900 | 100.0% |
Employment Status by Age in Morrow County
According to the labor force statistics for Morrow County, out of the total population over 16 years of age (9,251), 57.4% or 5,310 individuals are in the labor force, with 3.2% or 170 of them unemployed. The age group with the highest labor force participation rate is 35 to 44 years, with 84.4% or 1,388 individuals in the labor force. Within the labor force, the 25 to 29 years age range has the highest percentage of unemployed individuals, with 7.7% or 37 of them being unemployed.
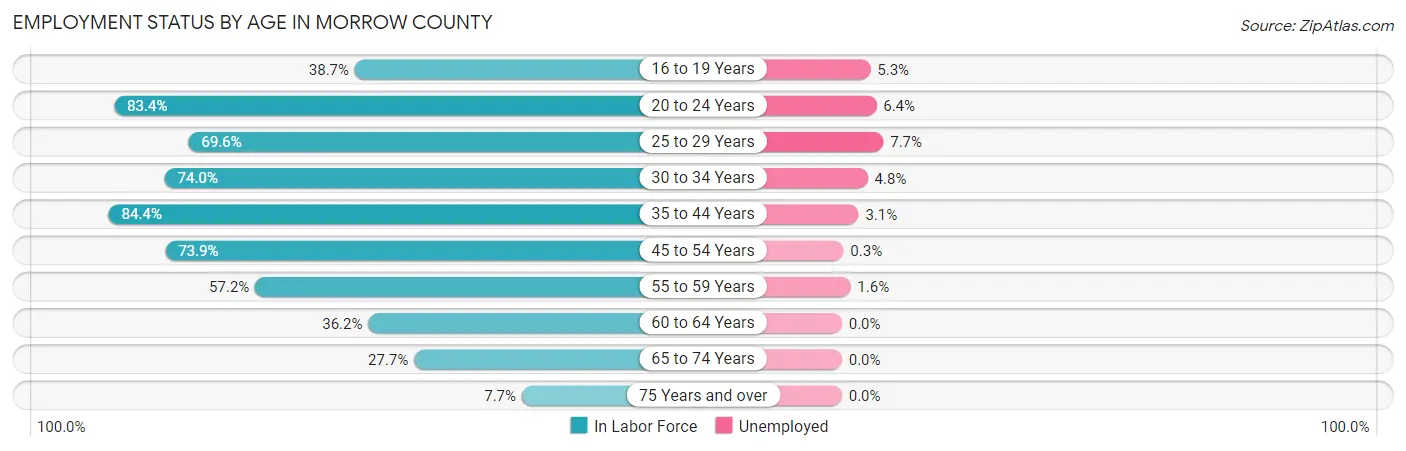
| Age Bracket | In Labor Force | Unemployed |
| 16 to 19 Years | 285 (38.7%) | 15 (5.3%) |
| 20 to 24 Years | 669 (83.4%) | 43 (6.4%) |
| 25 to 29 Years | 480 (69.6%) | 37 (7.7%) |
| 30 to 34 Years | 495 (74.0%) | 24 (4.8%) |
| 35 to 44 Years | 1,388 (84.4%) | 43 (3.1%) |
| 45 to 54 Years | 910 (73.9%) | 3 (0.3%) |
| 55 to 59 Years | 382 (57.2%) | 6 (1.6%) |
| 60 to 64 Years | 310 (36.2%) | 0 (0.0%) |
| 65 to 74 Years | 335 (27.7%) | 0 (0.0%) |
| 75 Years and over | 57 (7.7%) | 0 (0.0%) |
| Total | 5,310 (57.4%) | 170 (3.2%) |
Employment Status by Educational Attainment in Morrow County
According to labor force statistics for Morrow County, 68.8% of individuals (3,964) out of the total population between 25 and 64 years of age (5,761) are in the labor force, with 2.8% or 111 of them being unemployed. The group with the highest labor force participation rate are those with the educational attainment of less than high school, with 74.8% or 1,112 individuals in the labor force. Within the labor force, individuals with less than high school education have the highest percentage of unemployment, with 4.7% or 52 of them being unemployed.
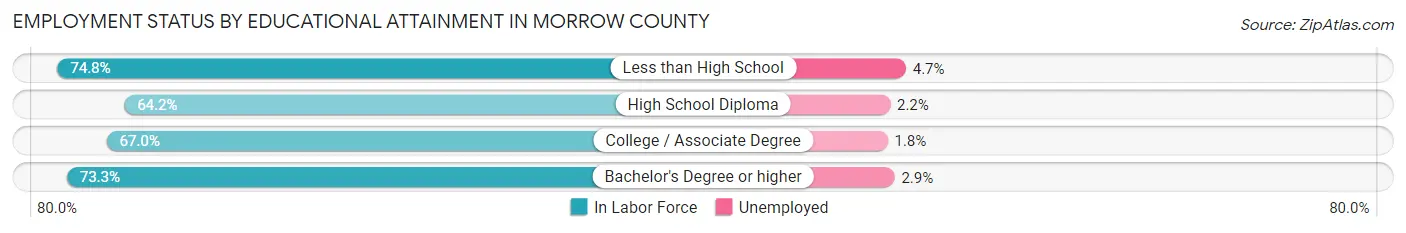
| Educational Attainment | In Labor Force | Unemployed |
| Less than High School | 1,112 (74.8%) | 70 (4.7%) |
| High School Diploma | 1,125 (64.2%) | 39 (2.2%) |
| College / Associate Degree | 1,255 (67.0%) | 34 (1.8%) |
| Bachelor's Degree or higher | 476 (73.3%) | 19 (2.9%) |
| Total | 3,964 (68.8%) | 161 (2.8%) |
Employment Occupations by Sex in Morrow County
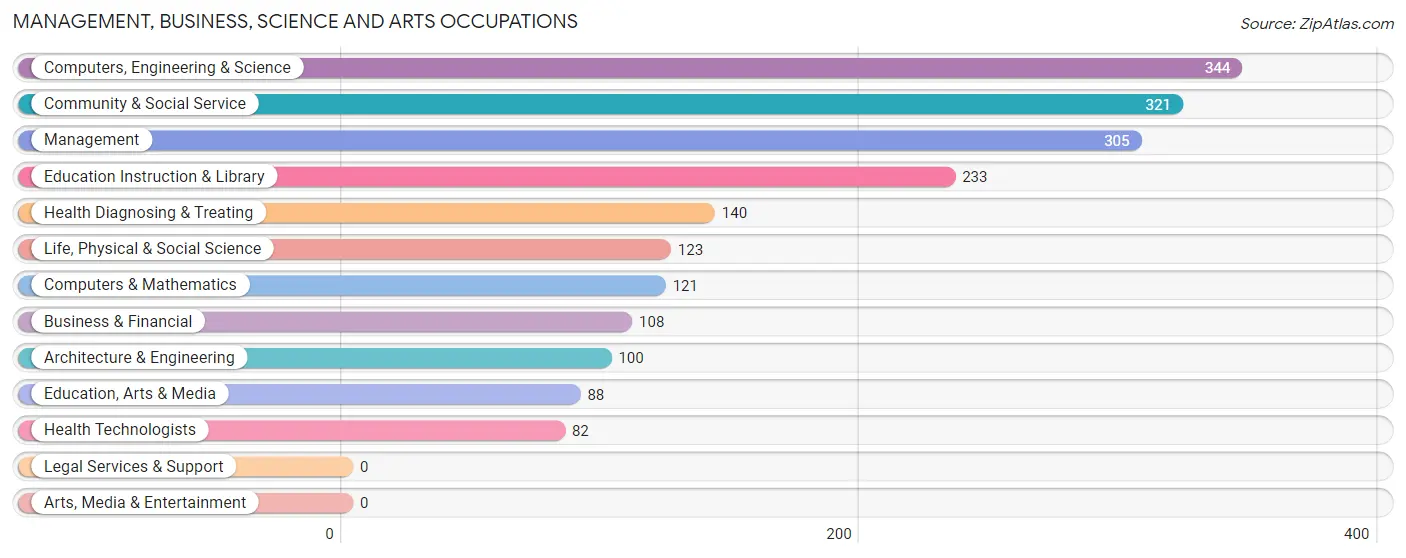
Management, Business, Science and Arts Occupations
The most common Management, Business, Science and Arts occupations in Morrow County are Computers, Engineering & Science (344 | 6.7%), Community & Social Service (321 | 6.2%), Management (305 | 5.9%), Education Instruction & Library (233 | 4.5%), and Health Diagnosing & Treating (140 | 2.7%).
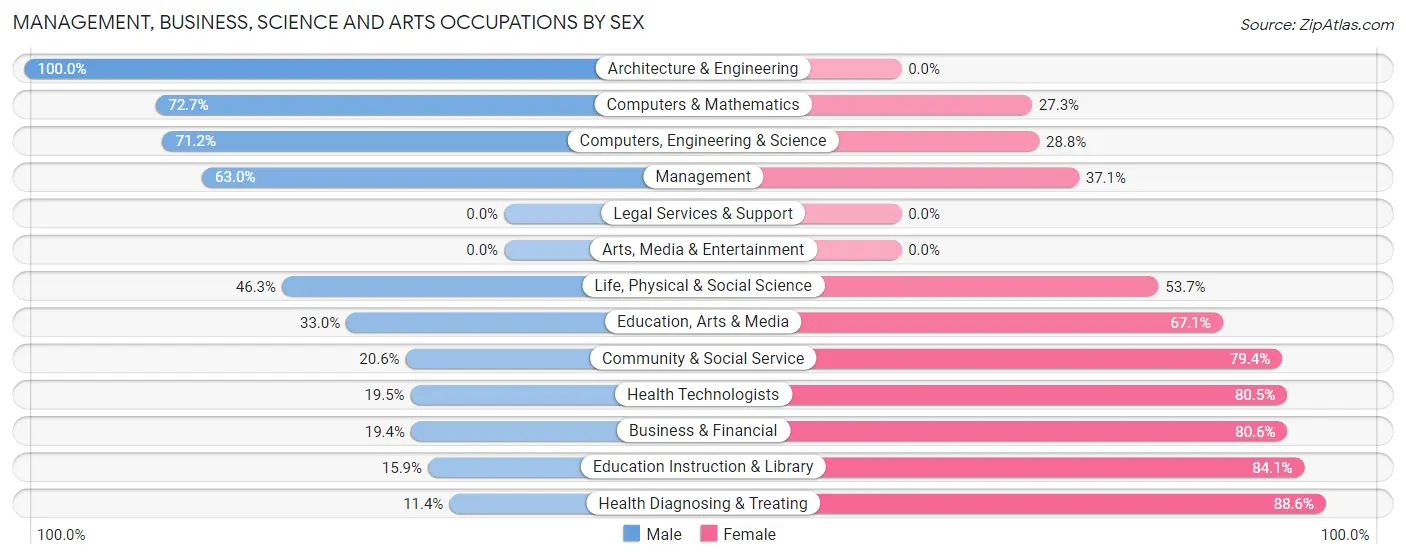
Management, Business, Science and Arts Occupations by Sex
Within the Management, Business, Science and Arts occupations in Morrow County, the most male-oriented occupations are Architecture & Engineering (100.0%), Computers & Mathematics (72.7%), and Computers, Engineering & Science (71.2%), while the most female-oriented occupations are Health Diagnosing & Treating (88.6%), Education Instruction & Library (84.1%), and Business & Financial (80.6%).
| Occupation | Male | Female |
| Management | 192 (62.9%) | 113 (37.0%) |
| Business & Financial | 21 (19.4%) | 87 (80.6%) |
| Computers, Engineering & Science | 245 (71.2%) | 99 (28.8%) |
| Computers & Mathematics | 88 (72.7%) | 33 (27.3%) |
| Architecture & Engineering | 100 (100.0%) | 0 (0.0%) |
| Life, Physical & Social Science | 57 (46.3%) | 66 (53.7%) |
| Community & Social Service | 66 (20.6%) | 255 (79.4%) |
| Education, Arts & Media | 29 (33.0%) | 59 (67.0%) |
| Legal Services & Support | 0 (0.0%) | 0 (0.0%) |
| Education Instruction & Library | 37 (15.9%) | 196 (84.1%) |
| Arts, Media & Entertainment | 0 (0.0%) | 0 (0.0%) |
| Health Diagnosing & Treating | 16 (11.4%) | 124 (88.6%) |
| Health Technologists | 16 (19.5%) | 66 (80.5%) |
| Total (Category) | 540 (44.3%) | 678 (55.7%) |
| Total (Overall) | 2,930 (57.0%) | 2,211 (43.0%) |
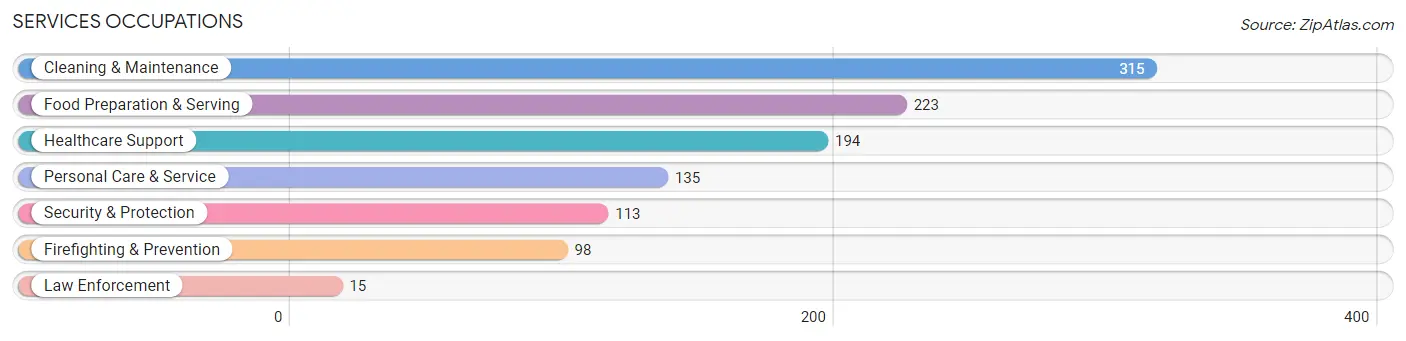
Services Occupations
The most common Services occupations in Morrow County are Cleaning & Maintenance (315 | 6.1%), Food Preparation & Serving (223 | 4.3%), Healthcare Support (194 | 3.8%), Personal Care & Service (135 | 2.6%), and Security & Protection (113 | 2.2%).
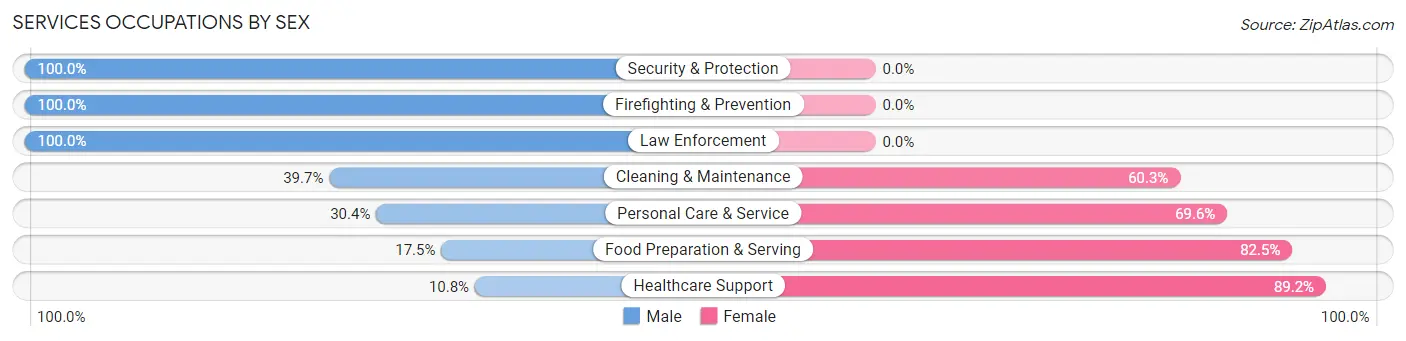
Services Occupations by Sex
Within the Services occupations in Morrow County, the most male-oriented occupations are Security & Protection (100.0%), Firefighting & Prevention (100.0%), and Law Enforcement (100.0%), while the most female-oriented occupations are Healthcare Support (89.2%), Food Preparation & Serving (82.5%), and Personal Care & Service (69.6%).
| Occupation | Male | Female |
| Healthcare Support | 21 (10.8%) | 173 (89.2%) |
| Security & Protection | 113 (100.0%) | 0 (0.0%) |
| Firefighting & Prevention | 98 (100.0%) | 0 (0.0%) |
| Law Enforcement | 15 (100.0%) | 0 (0.0%) |
| Food Preparation & Serving | 39 (17.5%) | 184 (82.5%) |
| Cleaning & Maintenance | 125 (39.7%) | 190 (60.3%) |
| Personal Care & Service | 41 (30.4%) | 94 (69.6%) |
| Total (Category) | 339 (34.6%) | 641 (65.4%) |
| Total (Overall) | 2,930 (57.0%) | 2,211 (43.0%) |
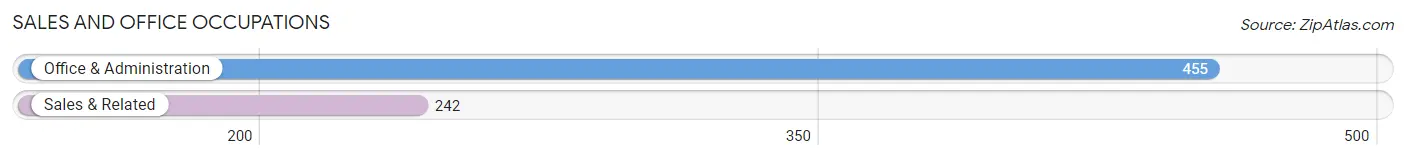
Sales and Office Occupations
The most common Sales and Office occupations in Morrow County are Office & Administration (455 | 8.8%), and Sales & Related (242 | 4.7%).
Sales and Office Occupations by Sex
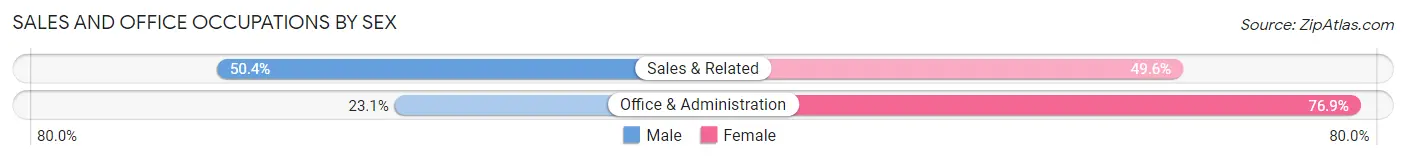
| Occupation | Male | Female |
| Sales & Related | 122 (50.4%) | 120 (49.6%) |
| Office & Administration | 105 (23.1%) | 350 (76.9%) |
| Total (Category) | 227 (32.6%) | 470 (67.4%) |
| Total (Overall) | 2,930 (57.0%) | 2,211 (43.0%) |
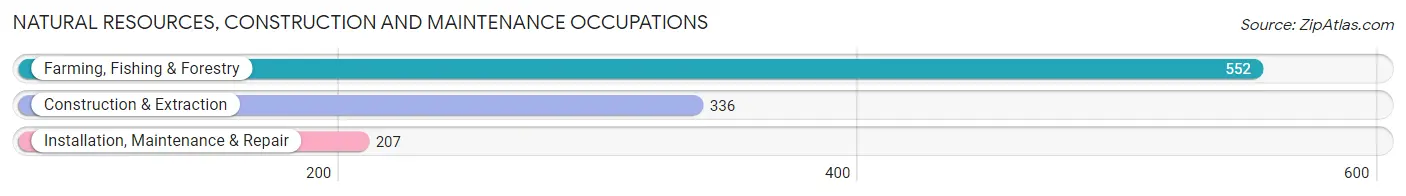
Natural Resources, Construction and Maintenance Occupations
The most common Natural Resources, Construction and Maintenance occupations in Morrow County are Farming, Fishing & Forestry (552 | 10.7%), Construction & Extraction (336 | 6.5%), and Installation, Maintenance & Repair (207 | 4.0%).
Natural Resources, Construction and Maintenance Occupations by Sex
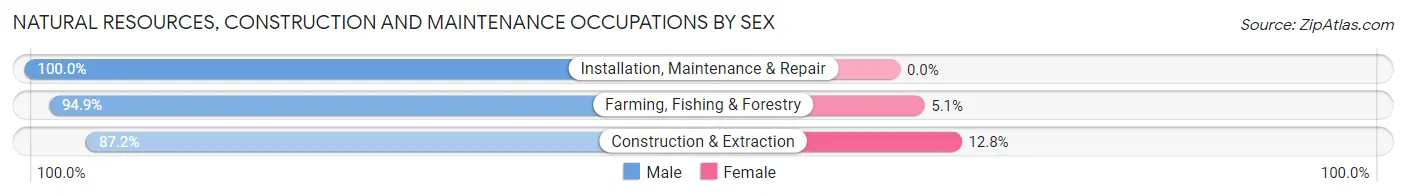
| Occupation | Male | Female |
| Farming, Fishing & Forestry | 524 (94.9%) | 28 (5.1%) |
| Construction & Extraction | 293 (87.2%) | 43 (12.8%) |
| Installation, Maintenance & Repair | 207 (100.0%) | 0 (0.0%) |
| Total (Category) | 1,024 (93.5%) | 71 (6.5%) |
| Total (Overall) | 2,930 (57.0%) | 2,211 (43.0%) |
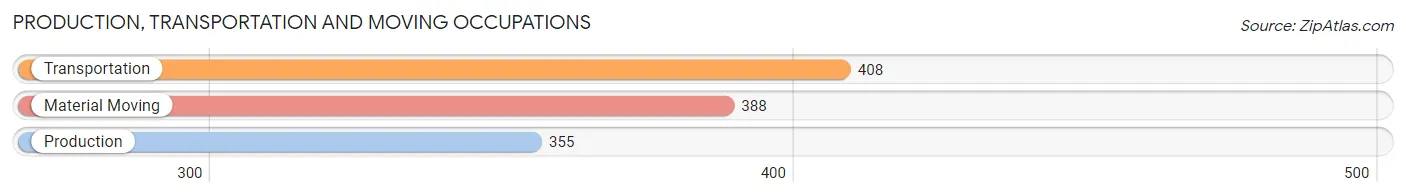
Production, Transportation and Moving Occupations
The most common Production, Transportation and Moving occupations in Morrow County are Transportation (408 | 7.9%), Material Moving (388 | 7.5%), and Production (355 | 6.9%).
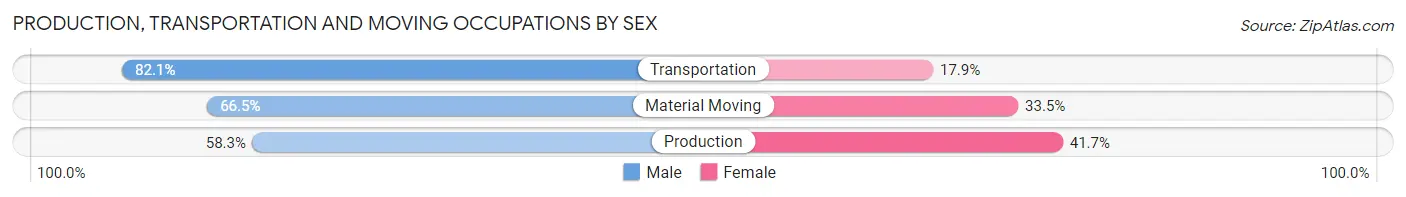
Production, Transportation and Moving Occupations by Sex
| Occupation | Male | Female |
| Production | 207 (58.3%) | 148 (41.7%) |
| Transportation | 335 (82.1%) | 73 (17.9%) |
| Material Moving | 258 (66.5%) | 130 (33.5%) |
| Total (Category) | 800 (69.5%) | 351 (30.5%) |
| Total (Overall) | 2,930 (57.0%) | 2,211 (43.0%) |
Employment Industries by Sex in Morrow County
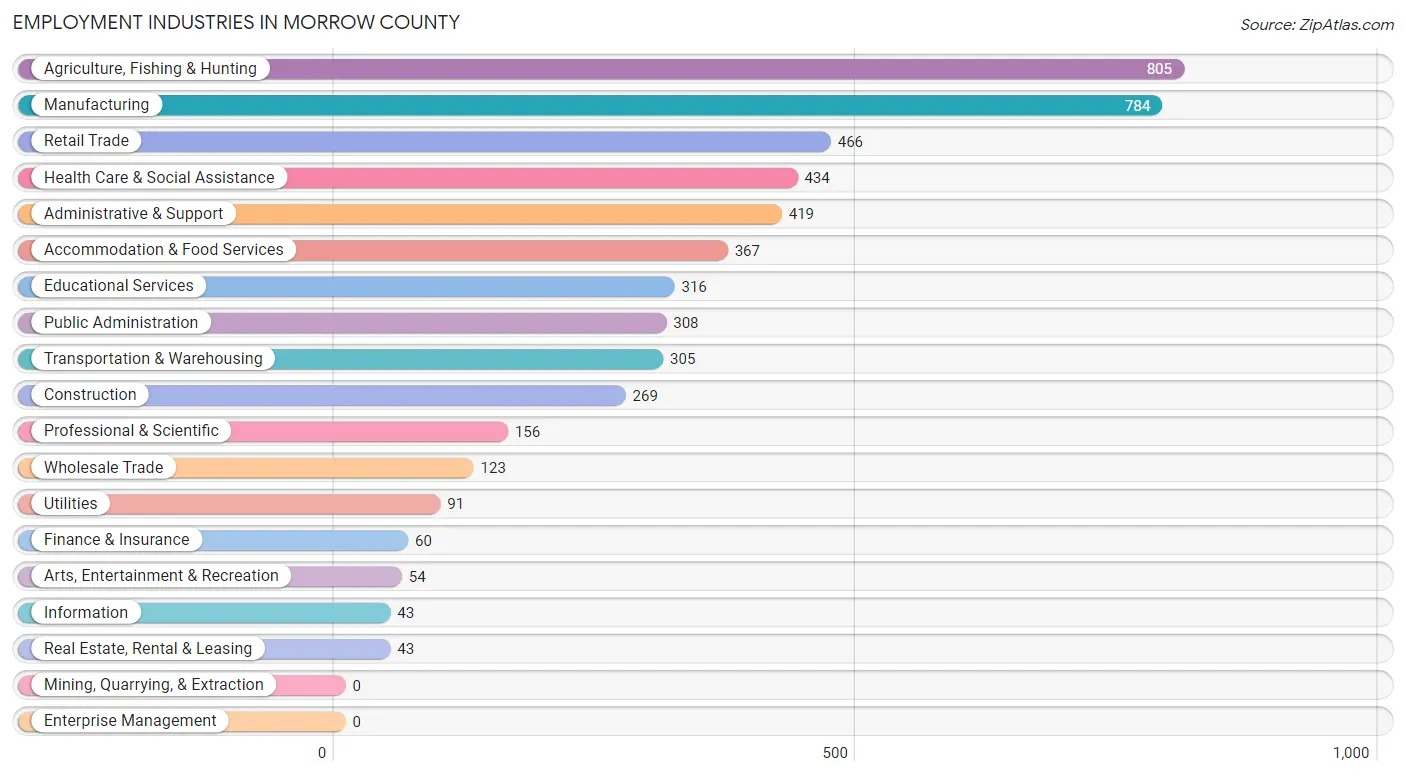
Employment Industries in Morrow County
The major employment industries in Morrow County include Agriculture, Fishing & Hunting (805 | 15.7%), Manufacturing (784 | 15.2%), Retail Trade (466 | 9.1%), Health Care & Social Assistance (434 | 8.4%), and Administrative & Support (419 | 8.2%).
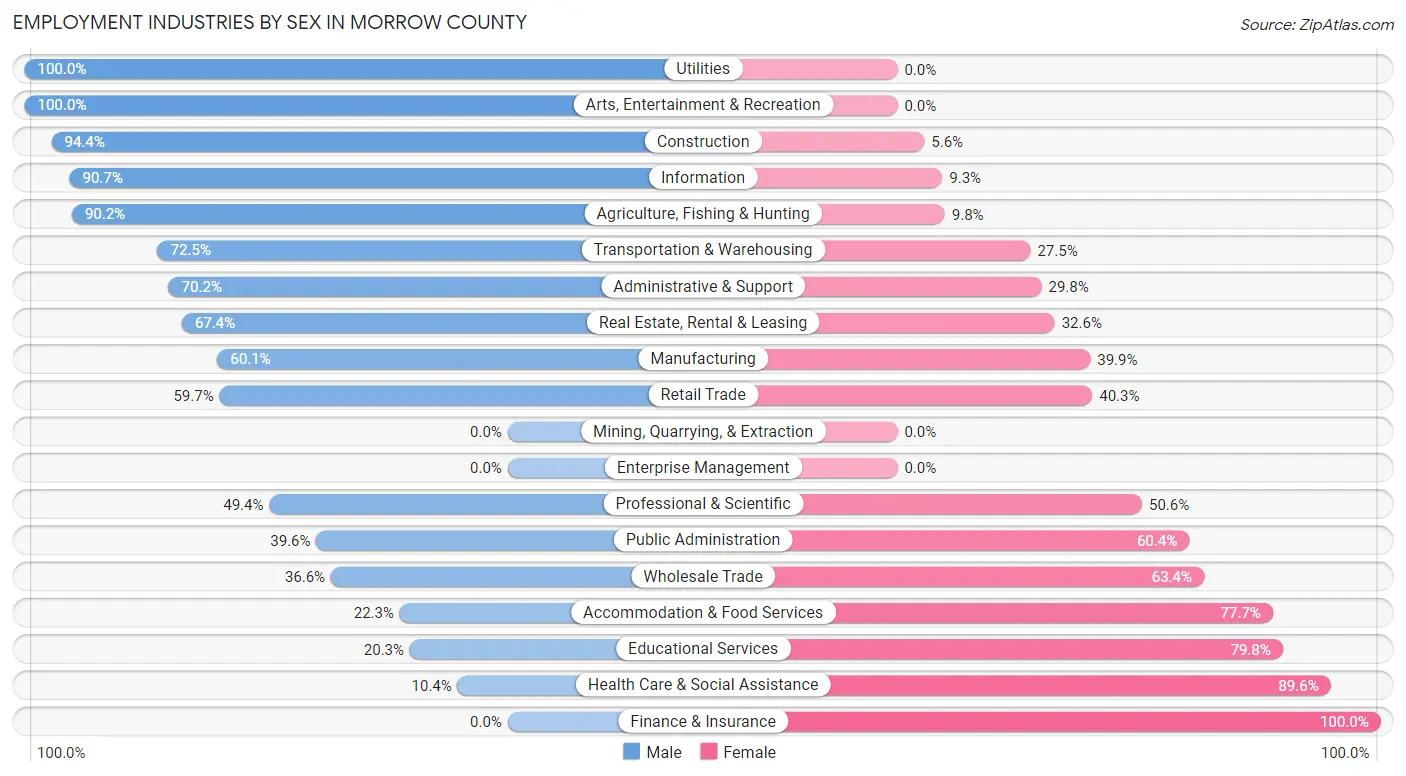
Employment Industries by Sex in Morrow County
The Morrow County industries that see more men than women are Utilities (100.0%), Arts, Entertainment & Recreation (100.0%), and Construction (94.4%), whereas the industries that tend to have a higher number of women are Finance & Insurance (100.0%), Health Care & Social Assistance (89.6%), and Educational Services (79.7%).
| Industry | Male | Female |
| Agriculture, Fishing & Hunting | 726 (90.2%) | 79 (9.8%) |
| Mining, Quarrying, & Extraction | 0 (0.0%) | 0 (0.0%) |
| Construction | 254 (94.4%) | 15 (5.6%) |
| Manufacturing | 471 (60.1%) | 313 (39.9%) |
| Wholesale Trade | 45 (36.6%) | 78 (63.4%) |
| Retail Trade | 278 (59.7%) | 188 (40.3%) |
| Transportation & Warehousing | 221 (72.5%) | 84 (27.5%) |
| Utilities | 91 (100.0%) | 0 (0.0%) |
| Information | 39 (90.7%) | 4 (9.3%) |
| Finance & Insurance | 0 (0.0%) | 60 (100.0%) |
| Real Estate, Rental & Leasing | 29 (67.4%) | 14 (32.6%) |
| Professional & Scientific | 77 (49.4%) | 79 (50.6%) |
| Enterprise Management | 0 (0.0%) | 0 (0.0%) |
| Administrative & Support | 294 (70.2%) | 125 (29.8%) |
| Educational Services | 64 (20.3%) | 252 (79.7%) |
| Health Care & Social Assistance | 45 (10.4%) | 389 (89.6%) |
| Arts, Entertainment & Recreation | 54 (100.0%) | 0 (0.0%) |
| Accommodation & Food Services | 82 (22.3%) | 285 (77.7%) |
| Public Administration | 122 (39.6%) | 186 (60.4%) |
| Total | 2,930 (57.0%) | 2,211 (43.0%) |
Education in Morrow County
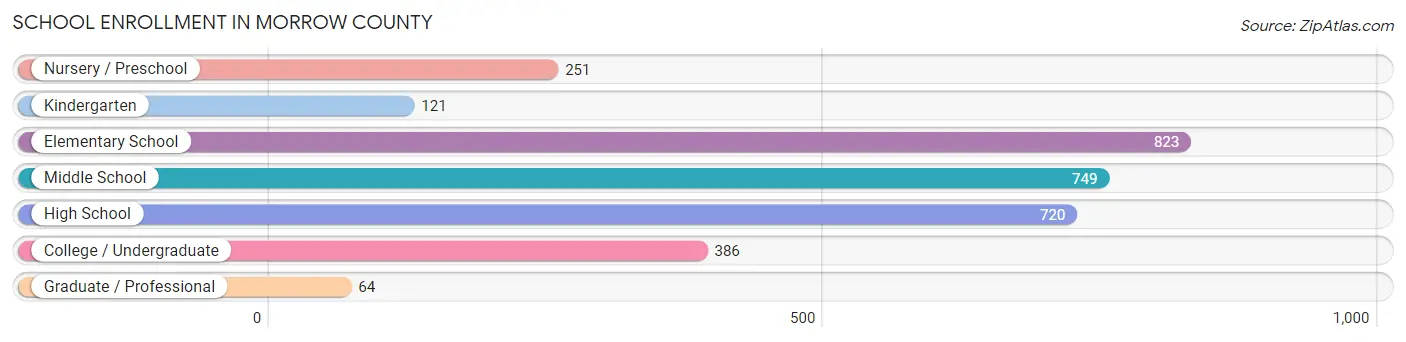
School Enrollment in Morrow County
The most common levels of schooling among the 3,114 students in Morrow County are elementary school (823 | 26.4%), middle school (749 | 24.0%), and high school (720 | 23.1%).
| School Level | # Students | % Students |
| Nursery / Preschool | 251 | 8.1% |
| Kindergarten | 121 | 3.9% |
| Elementary School | 823 | 26.4% |
| Middle School | 749 | 24.0% |
| High School | 720 | 23.1% |
| College / Undergraduate | 386 | 12.4% |
| Graduate / Professional | 64 | 2.1% |
| Total | 3,114 | 100.0% |
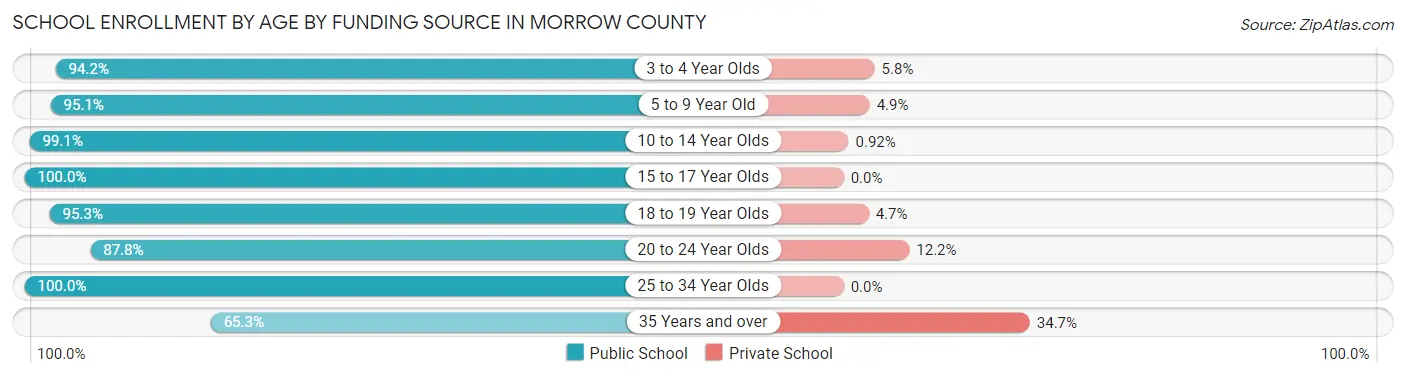
School Enrollment by Age by Funding Source in Morrow County
Out of a total of 3,114 students who are enrolled in schools in Morrow County, 140 (4.5%) attend a private institution, while the remaining 2,974 (95.5%) are enrolled in public schools. The age group of 35 years and over has the highest likelihood of being enrolled in private schools, with 43 (34.7% in the age bracket) enrolled. Conversely, the age group of 15 to 17 year olds has the lowest likelihood of being enrolled in a private school, with 576 (100.0% in the age bracket) attending a public institution.
| Age Bracket | Public School | Private School |
| 3 to 4 Year Olds | 147 (94.2%) | 9 (5.8%) |
| 5 to 9 Year Old | 901 (95.1%) | 46 (4.9%) |
| 10 to 14 Year Olds | 861 (99.1%) | 8 (0.9%) |
| 15 to 17 Year Olds | 576 (100.0%) | 0 (0.0%) |
| 18 to 19 Year Olds | 184 (95.3%) | 9 (4.7%) |
| 20 to 24 Year Olds | 172 (87.8%) | 24 (12.2%) |
| 25 to 34 Year Olds | 53 (100.0%) | 0 (0.0%) |
| 35 Years and over | 81 (65.3%) | 43 (34.7%) |
| Total | 2,974 (95.5%) | 140 (4.5%) |
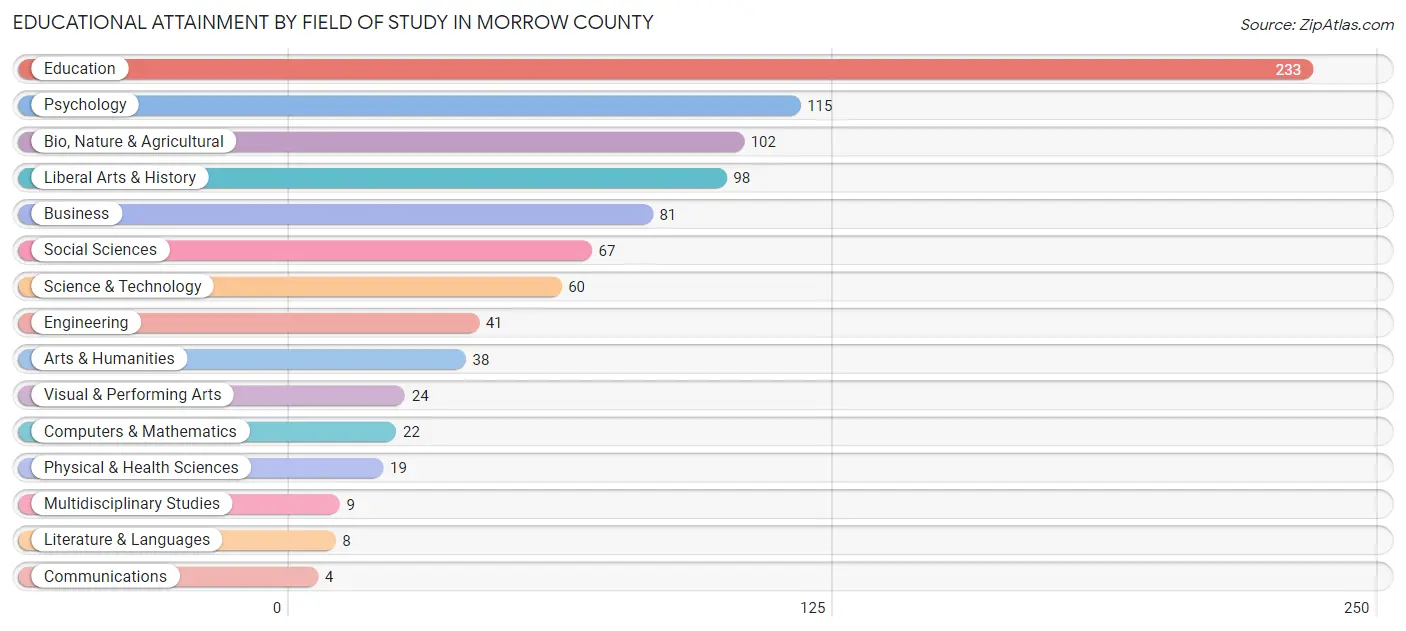
Educational Attainment by Field of Study in Morrow County
Education (233 | 25.3%), psychology (115 | 12.5%), bio, nature & agricultural (102 | 11.1%), liberal arts & history (98 | 10.6%), and business (81 | 8.8%) are the most common fields of study among 921 individuals in Morrow County who have obtained a bachelor's degree or higher.
| Field of Study | # Graduates | % Graduates |
| Computers & Mathematics | 22 | 2.4% |
| Bio, Nature & Agricultural | 102 | 11.1% |
| Physical & Health Sciences | 19 | 2.1% |
| Psychology | 115 | 12.5% |
| Social Sciences | 67 | 7.3% |
| Engineering | 41 | 4.4% |
| Multidisciplinary Studies | 9 | 1.0% |
| Science & Technology | 60 | 6.5% |
| Business | 81 | 8.8% |
| Education | 233 | 25.3% |
| Literature & Languages | 8 | 0.9% |
| Liberal Arts & History | 98 | 10.6% |
| Visual & Performing Arts | 24 | 2.6% |
| Communications | 4 | 0.4% |
| Arts & Humanities | 38 | 4.1% |
| Total | 921 | 100.0% |
Transportation & Commute in Morrow County
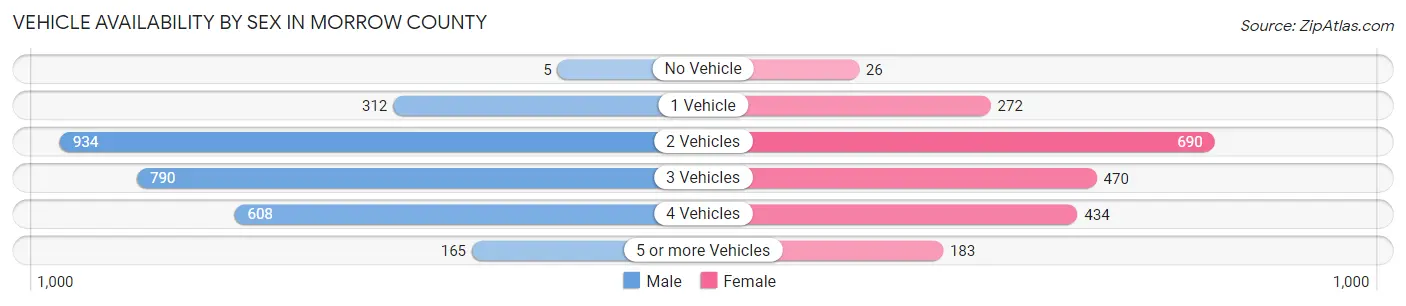
Vehicle Availability by Sex in Morrow County
The most prevalent vehicle ownership categories in Morrow County are males with 2 vehicles (934, accounting for 33.2%) and females with 2 vehicles (690, making up 45.0%).
| Vehicles Available | Male | Female |
| No Vehicle | 5 (0.2%) | 26 (1.3%) |
| 1 Vehicle | 312 (11.1%) | 272 (13.1%) |
| 2 Vehicles | 934 (33.2%) | 690 (33.3%) |
| 3 Vehicles | 790 (28.1%) | 470 (22.7%) |
| 4 Vehicles | 608 (21.6%) | 434 (20.9%) |
| 5 or more Vehicles | 165 (5.9%) | 183 (8.8%) |
| Total | 2,814 (100.0%) | 2,075 (100.0%) |
Commute Time in Morrow County
The most frequently occuring commute durations in Morrow County are 20 to 24 minutes (818 commuters, 17.6%), 5 to 9 minutes (691 commuters, 14.8%), and 30 to 34 minutes (650 commuters, 14.0%).
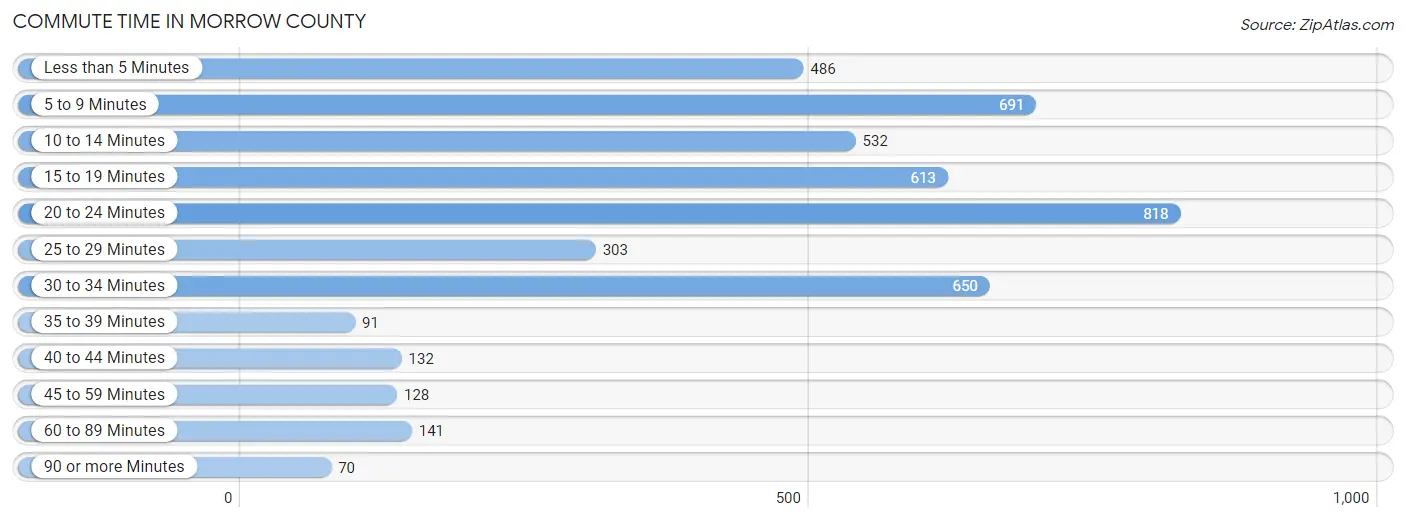
| Commute Time | # Commuters | % Commuters |
| Less than 5 Minutes | 486 | 10.4% |
| 5 to 9 Minutes | 691 | 14.8% |
| 10 to 14 Minutes | 532 | 11.4% |
| 15 to 19 Minutes | 613 | 13.2% |
| 20 to 24 Minutes | 818 | 17.6% |
| 25 to 29 Minutes | 303 | 6.5% |
| 30 to 34 Minutes | 650 | 14.0% |
| 35 to 39 Minutes | 91 | 1.9% |
| 40 to 44 Minutes | 132 | 2.8% |
| 45 to 59 Minutes | 128 | 2.8% |
| 60 to 89 Minutes | 141 | 3.0% |
| 90 or more Minutes | 70 | 1.5% |
Commute Time by Sex in Morrow County
The most common commute times in Morrow County are 20 to 24 minutes (540 commuters, 19.6%) for males and 5 to 9 minutes (333 commuters, 17.5%) for females.
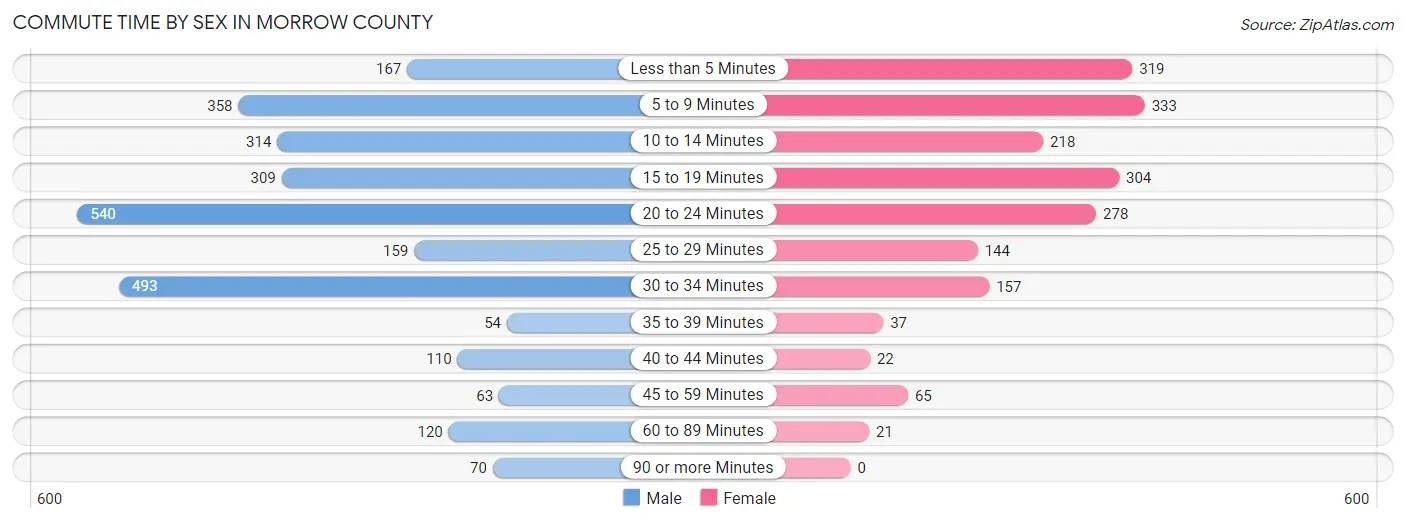
| Commute Time | Male | Female |
| Less than 5 Minutes | 167 (6.1%) | 319 (16.8%) |
| 5 to 9 Minutes | 358 (13.0%) | 333 (17.5%) |
| 10 to 14 Minutes | 314 (11.4%) | 218 (11.5%) |
| 15 to 19 Minutes | 309 (11.2%) | 304 (16.0%) |
| 20 to 24 Minutes | 540 (19.6%) | 278 (14.6%) |
| 25 to 29 Minutes | 159 (5.8%) | 144 (7.6%) |
| 30 to 34 Minutes | 493 (17.9%) | 157 (8.3%) |
| 35 to 39 Minutes | 54 (2.0%) | 37 (1.9%) |
| 40 to 44 Minutes | 110 (4.0%) | 22 (1.2%) |
| 45 to 59 Minutes | 63 (2.3%) | 65 (3.4%) |
| 60 to 89 Minutes | 120 (4.3%) | 21 (1.1%) |
| 90 or more Minutes | 70 (2.5%) | 0 (0.0%) |
Time of Departure to Work by Sex in Morrow County
The most frequent times of departure to work in Morrow County are 5:00 AM to 5:29 AM (617, 22.4%) for males and 7:00 AM to 7:29 AM (297, 15.7%) for females.
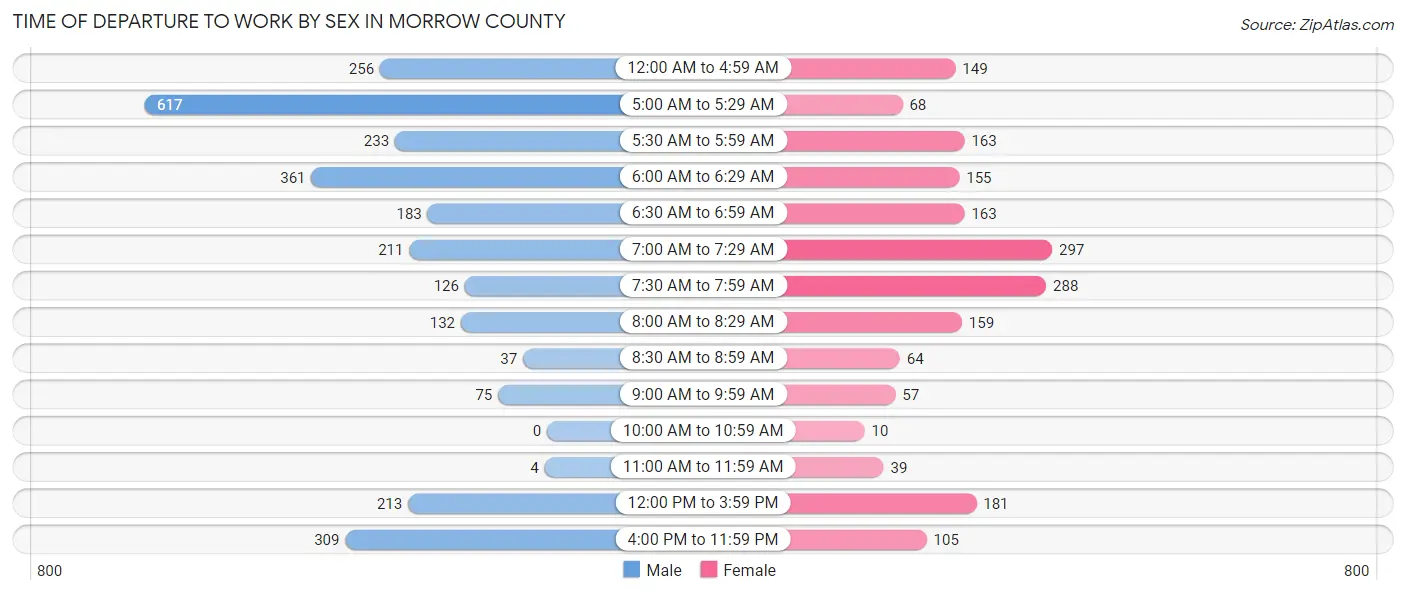
| Time of Departure | Male | Female |
| 12:00 AM to 4:59 AM | 256 (9.3%) | 149 (7.9%) |
| 5:00 AM to 5:29 AM | 617 (22.4%) | 68 (3.6%) |
| 5:30 AM to 5:59 AM | 233 (8.5%) | 163 (8.6%) |
| 6:00 AM to 6:29 AM | 361 (13.1%) | 155 (8.2%) |
| 6:30 AM to 6:59 AM | 183 (6.6%) | 163 (8.6%) |
| 7:00 AM to 7:29 AM | 211 (7.6%) | 297 (15.7%) |
| 7:30 AM to 7:59 AM | 126 (4.6%) | 288 (15.2%) |
| 8:00 AM to 8:29 AM | 132 (4.8%) | 159 (8.4%) |
| 8:30 AM to 8:59 AM | 37 (1.3%) | 64 (3.4%) |
| 9:00 AM to 9:59 AM | 75 (2.7%) | 57 (3.0%) |
| 10:00 AM to 10:59 AM | 0 (0.0%) | 10 (0.5%) |
| 11:00 AM to 11:59 AM | 4 (0.2%) | 39 (2.1%) |
| 12:00 PM to 3:59 PM | 213 (7.7%) | 181 (9.5%) |
| 4:00 PM to 11:59 PM | 309 (11.2%) | 105 (5.5%) |
| Total | 2,757 (100.0%) | 1,898 (100.0%) |
Housing Occupancy in Morrow County
Occupancy by Ownership in Morrow County
Of the total 4,201 dwellings in Morrow County, owner-occupied units account for 2,934 (69.8%), while renter-occupied units make up 1,267 (30.2%).
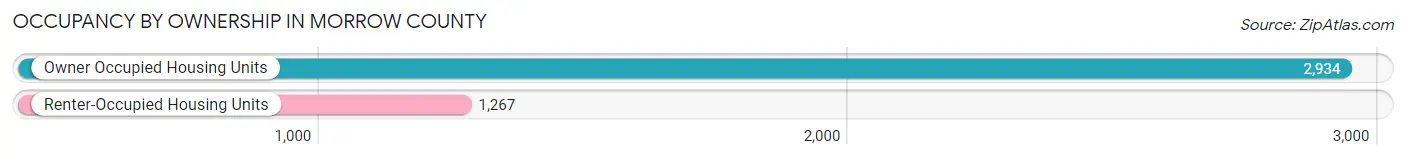
| Occupancy | # Housing Units | % Housing Units |
| Owner Occupied Housing Units | 2,934 | 69.8% |
| Renter-Occupied Housing Units | 1,267 | 30.2% |
| Total Occupied Housing Units | 4,201 | 100.0% |
Occupancy by Household Size in Morrow County
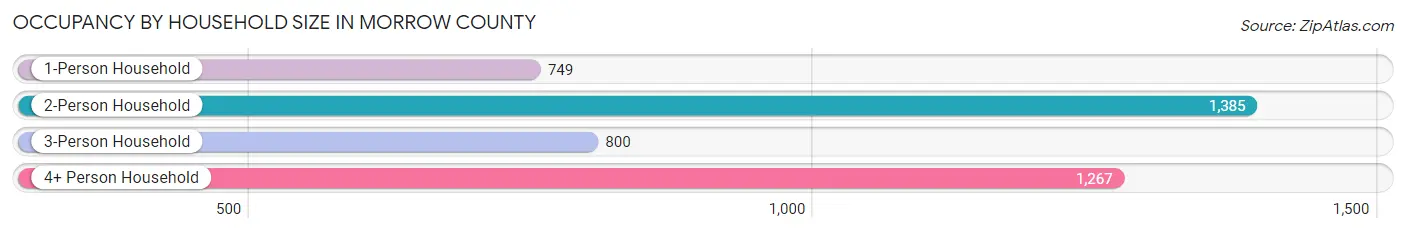
| Household Size | # Housing Units | % Housing Units |
| 1-Person Household | 749 | 17.8% |
| 2-Person Household | 1,385 | 33.0% |
| 3-Person Household | 800 | 19.0% |
| 4+ Person Household | 1,267 | 30.2% |
| Total Housing Units | 4,201 | 100.0% |
Occupancy by Ownership by Household Size in Morrow County
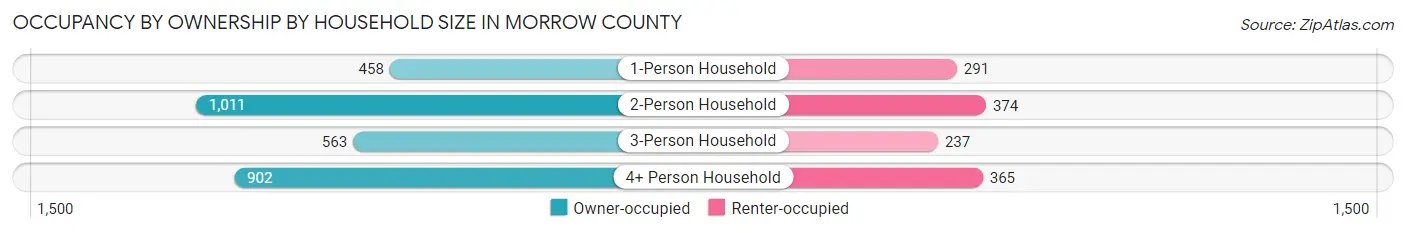
| Household Size | Owner-occupied | Renter-occupied |
| 1-Person Household | 458 (61.2%) | 291 (38.9%) |
| 2-Person Household | 1,011 (73.0%) | 374 (27.0%) |
| 3-Person Household | 563 (70.4%) | 237 (29.6%) |
| 4+ Person Household | 902 (71.2%) | 365 (28.8%) |
| Total Housing Units | 2,934 (69.8%) | 1,267 (30.2%) |
Occupancy by Educational Attainment in Morrow County
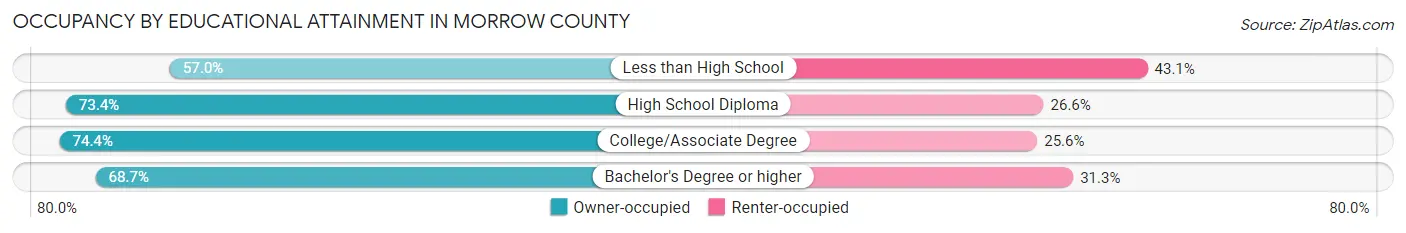
| Household Size | Owner-occupied | Renter-occupied |
| Less than High School | 496 (57.0%) | 375 (43.0%) |
| High School Diploma | 904 (73.4%) | 327 (26.6%) |
| College/Associate Degree | 1,191 (74.4%) | 409 (25.6%) |
| Bachelor's Degree or higher | 343 (68.7%) | 156 (31.3%) |
Occupancy by Age of Householder in Morrow County
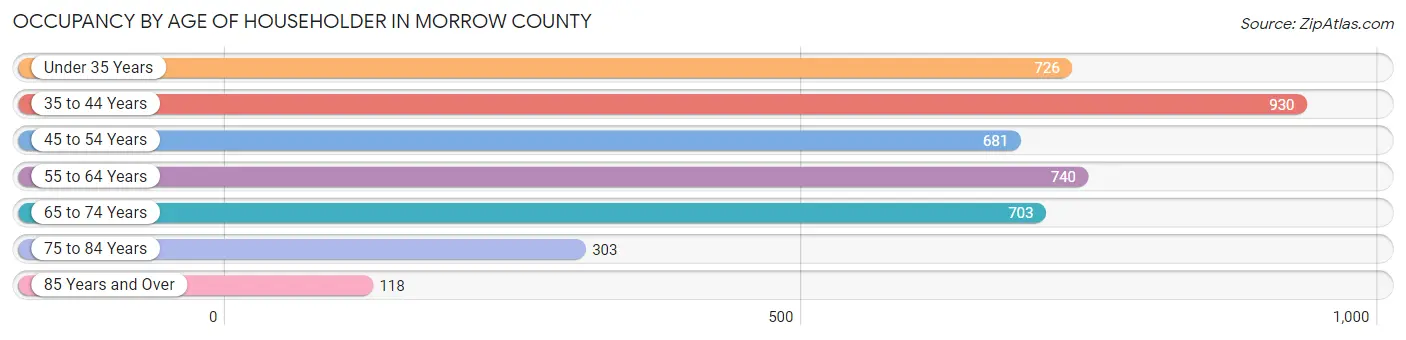
| Age Bracket | # Households | % Households |
| Under 35 Years | 726 | 17.3% |
| 35 to 44 Years | 930 | 22.1% |
| 45 to 54 Years | 681 | 16.2% |
| 55 to 64 Years | 740 | 17.6% |
| 65 to 74 Years | 703 | 16.7% |
| 75 to 84 Years | 303 | 7.2% |
| 85 Years and Over | 118 | 2.8% |
| Total | 4,201 | 100.0% |
Housing Finances in Morrow County
Median Income by Occupancy in Morrow County
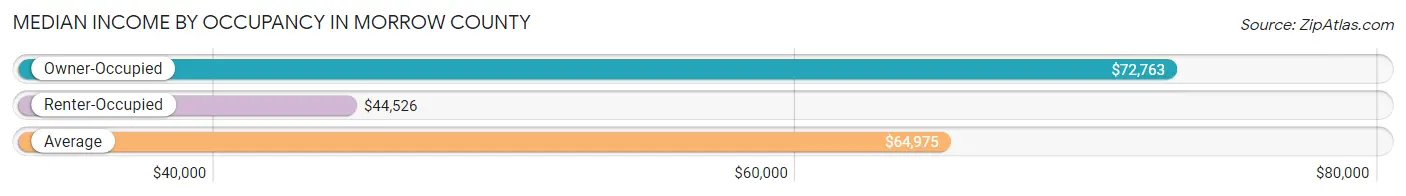
| Occupancy Type | # Households | Median Income |
| Owner-Occupied | 2,934 (69.8%) | $72,763 |
| Renter-Occupied | 1,267 (30.2%) | $44,526 |
| Average | 4,201 (100.0%) | $64,975 |
Occupancy by Householder Income Bracket in Morrow County
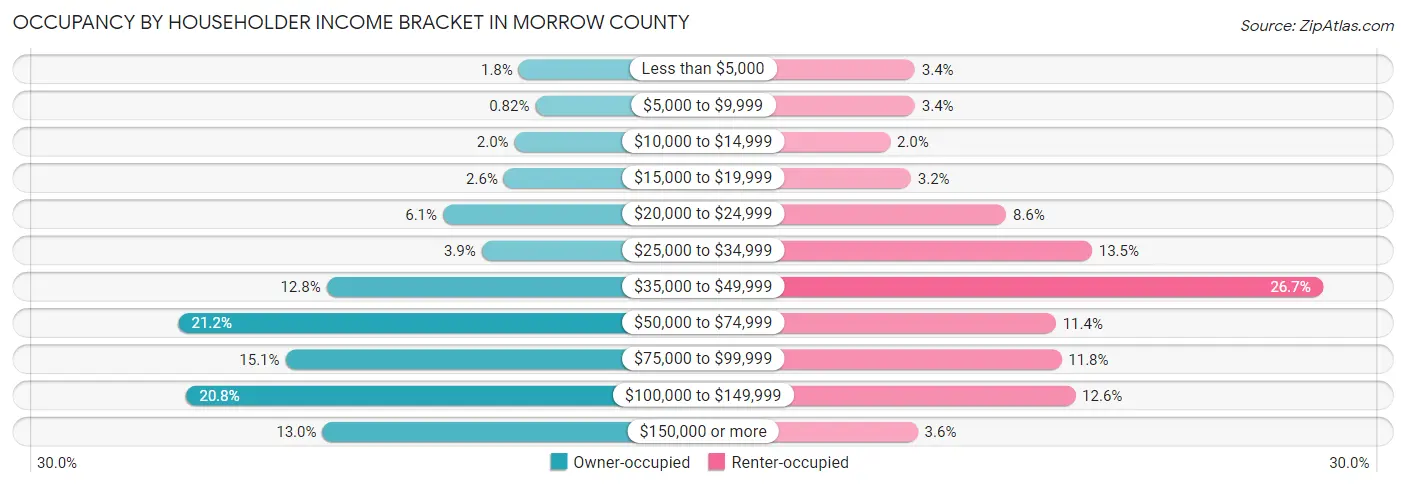
| Income Bracket | Owner-occupied | Renter-occupied |
| Less than $5,000 | 52 (1.8%) | 43 (3.4%) |
| $5,000 to $9,999 | 24 (0.8%) | 43 (3.4%) |
| $10,000 to $14,999 | 59 (2.0%) | 25 (2.0%) |
| $15,000 to $19,999 | 77 (2.6%) | 40 (3.2%) |
| $20,000 to $24,999 | 179 (6.1%) | 109 (8.6%) |
| $25,000 to $34,999 | 114 (3.9%) | 171 (13.5%) |
| $35,000 to $49,999 | 374 (12.8%) | 338 (26.7%) |
| $50,000 to $74,999 | 622 (21.2%) | 145 (11.4%) |
| $75,000 to $99,999 | 443 (15.1%) | 149 (11.8%) |
| $100,000 to $149,999 | 609 (20.8%) | 159 (12.6%) |
| $150,000 or more | 381 (13.0%) | 45 (3.5%) |
| Total | 2,934 (100.0%) | 1,267 (100.0%) |
Monthly Housing Cost Tiers in Morrow County
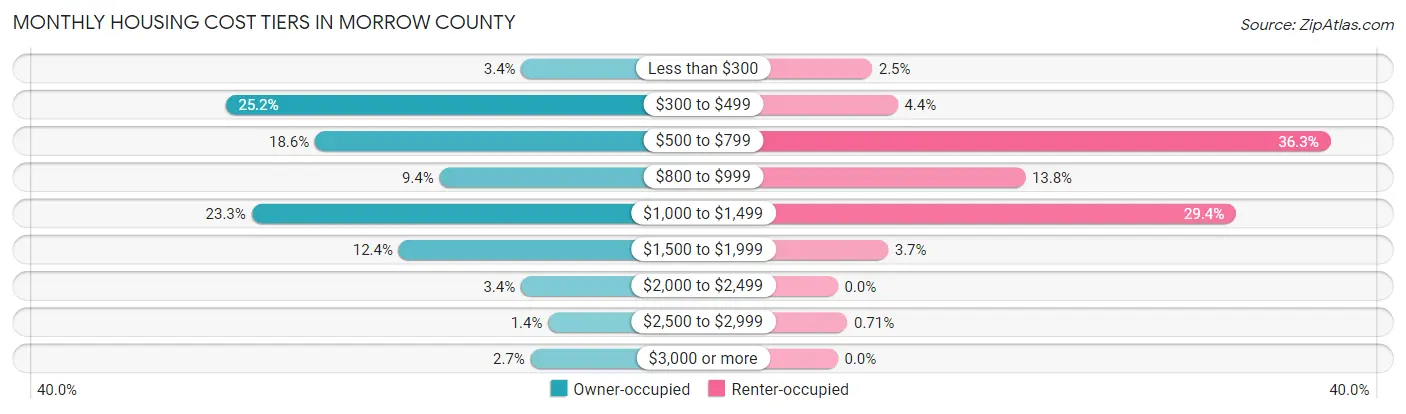
| Monthly Cost | Owner-occupied | Renter-occupied |
| Less than $300 | 100 (3.4%) | 32 (2.5%) |
| $300 to $499 | 740 (25.2%) | 56 (4.4%) |
| $500 to $799 | 546 (18.6%) | 460 (36.3%) |
| $800 to $999 | 277 (9.4%) | 175 (13.8%) |
| $1,000 to $1,499 | 683 (23.3%) | 372 (29.4%) |
| $1,500 to $1,999 | 365 (12.4%) | 47 (3.7%) |
| $2,000 to $2,499 | 101 (3.4%) | 0 (0.0%) |
| $2,500 to $2,999 | 42 (1.4%) | 9 (0.7%) |
| $3,000 or more | 80 (2.7%) | 0 (0.0%) |
| Total | 2,934 (100.0%) | 1,267 (100.0%) |
Physical Housing Characteristics in Morrow County
Housing Structures in Morrow County
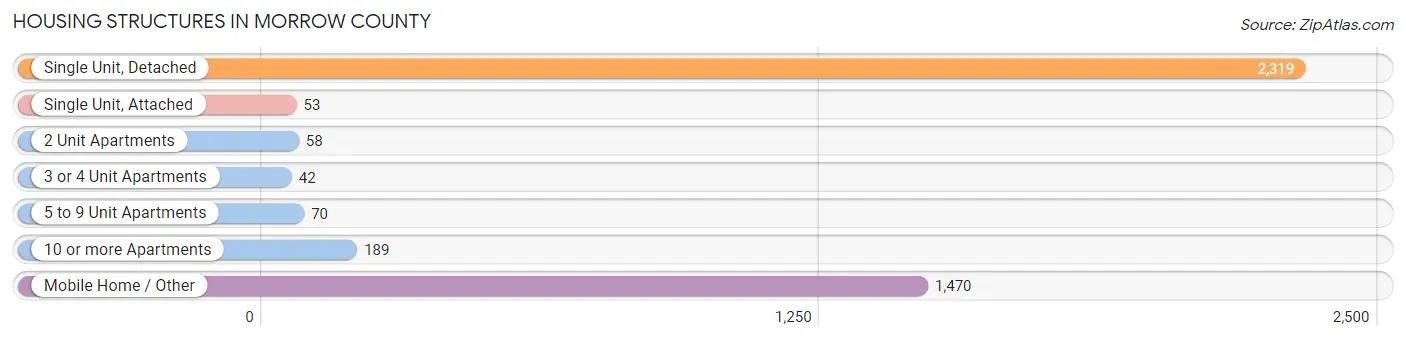
| Structure Type | # Housing Units | % Housing Units |
| Single Unit, Detached | 2,319 | 55.2% |
| Single Unit, Attached | 53 | 1.3% |
| 2 Unit Apartments | 58 | 1.4% |
| 3 or 4 Unit Apartments | 42 | 1.0% |
| 5 to 9 Unit Apartments | 70 | 1.7% |
| 10 or more Apartments | 189 | 4.5% |
| Mobile Home / Other | 1,470 | 35.0% |
| Total | 4,201 | 100.0% |
Housing Structures by Occupancy in Morrow County
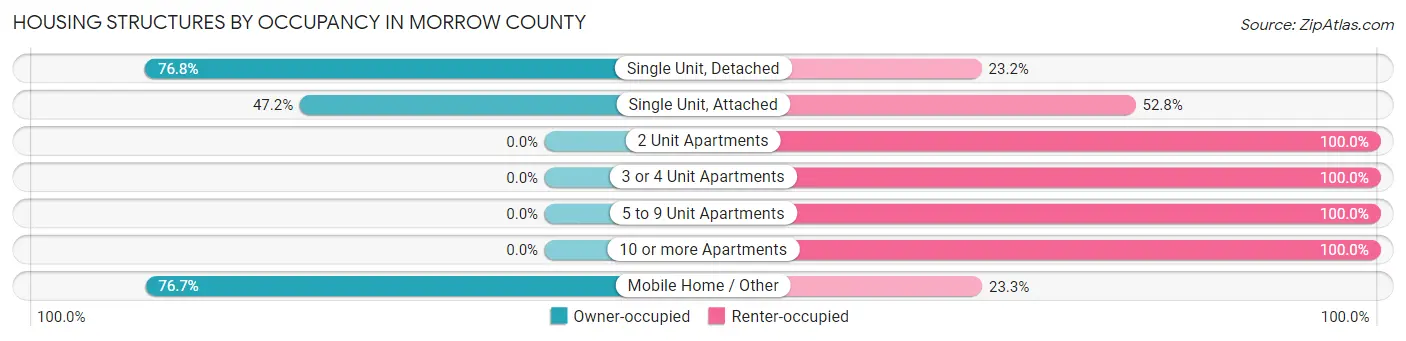
| Structure Type | Owner-occupied | Renter-occupied |
| Single Unit, Detached | 1,781 (76.8%) | 538 (23.2%) |
| Single Unit, Attached | 25 (47.2%) | 28 (52.8%) |
| 2 Unit Apartments | 0 (0.0%) | 58 (100.0%) |
| 3 or 4 Unit Apartments | 0 (0.0%) | 42 (100.0%) |
| 5 to 9 Unit Apartments | 0 (0.0%) | 70 (100.0%) |
| 10 or more Apartments | 0 (0.0%) | 189 (100.0%) |
| Mobile Home / Other | 1,128 (76.7%) | 342 (23.3%) |
| Total | 2,934 (69.8%) | 1,267 (30.2%) |
Housing Structures by Number of Rooms in Morrow County
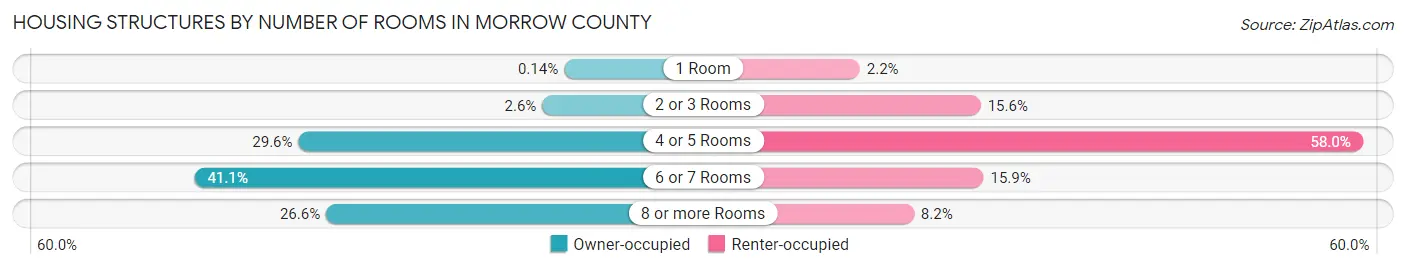
| Number of Rooms | Owner-occupied | Renter-occupied |
| 1 Room | 4 (0.1%) | 28 (2.2%) |
| 2 or 3 Rooms | 75 (2.6%) | 198 (15.6%) |
| 4 or 5 Rooms | 869 (29.6%) | 735 (58.0%) |
| 6 or 7 Rooms | 1,207 (41.1%) | 202 (15.9%) |
| 8 or more Rooms | 779 (26.6%) | 104 (8.2%) |
| Total | 2,934 (100.0%) | 1,267 (100.0%) |
Housing Structure by Heating Type in Morrow County
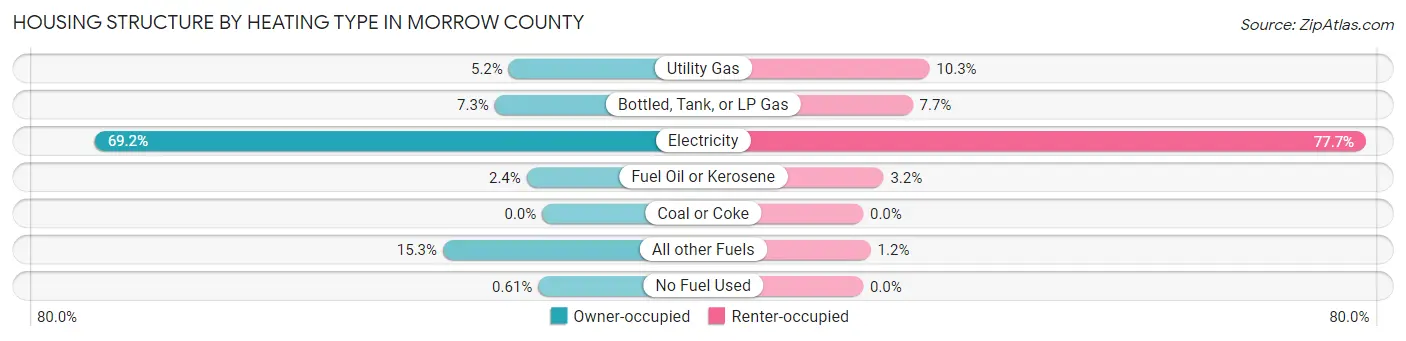
| Heating Type | Owner-occupied | Renter-occupied |
| Utility Gas | 152 (5.2%) | 130 (10.3%) |
| Bottled, Tank, or LP Gas | 215 (7.3%) | 97 (7.7%) |
| Electricity | 2,029 (69.2%) | 985 (77.7%) |
| Fuel Oil or Kerosene | 70 (2.4%) | 40 (3.2%) |
| Coal or Coke | 0 (0.0%) | 0 (0.0%) |
| All other Fuels | 450 (15.3%) | 15 (1.2%) |
| No Fuel Used | 18 (0.6%) | 0 (0.0%) |
| Total | 2,934 (100.0%) | 1,267 (100.0%) |
Household Vehicle Usage in Morrow County
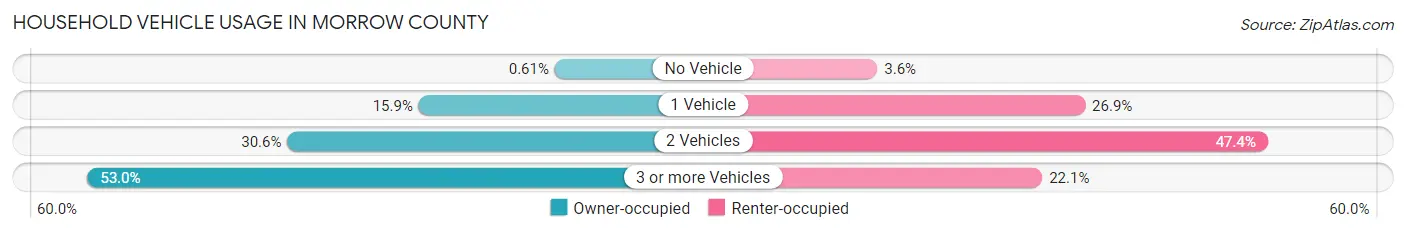
| Vehicles per Household | Owner-occupied | Renter-occupied |
| No Vehicle | 18 (0.6%) | 46 (3.6%) |
| 1 Vehicle | 465 (15.9%) | 341 (26.9%) |
| 2 Vehicles | 897 (30.6%) | 600 (47.4%) |
| 3 or more Vehicles | 1,554 (53.0%) | 280 (22.1%) |
| Total | 2,934 (100.0%) | 1,267 (100.0%) |
Real Estate & Mortgages in Morrow County
Real Estate and Mortgage Overview in Morrow County
| Characteristic | Without Mortgage | With Mortgage |
| Housing Units | 1,438 | 1,496 |
| Median Property Value | $198,000 | $225,100 |
| Median Household Income | $65,781 | $184 |
| Monthly Housing Costs | $465 | $43 |
| Real Estate Taxes | $1,721 | $3 |
Property Value by Mortgage Status in Morrow County
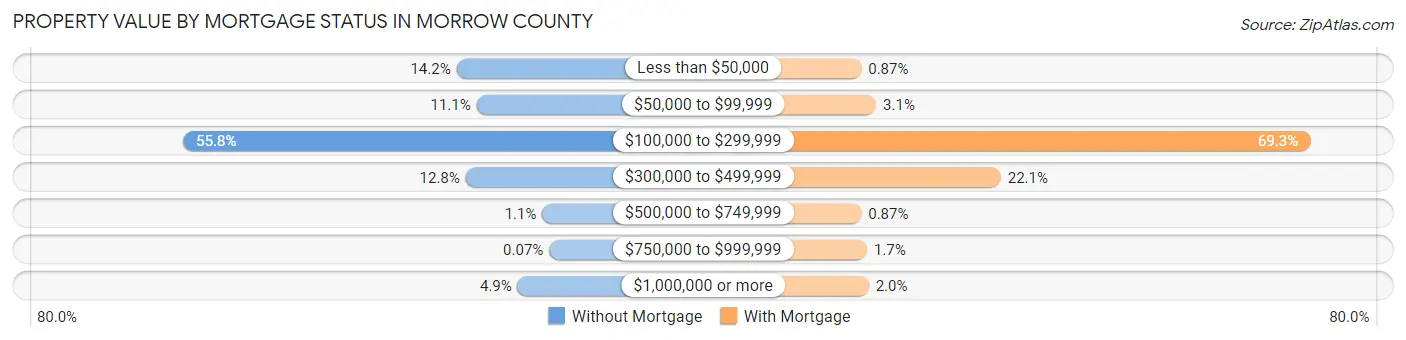
| Property Value | Without Mortgage | With Mortgage |
| Less than $50,000 | 204 (14.2%) | 13 (0.9%) |
| $50,000 to $99,999 | 160 (11.1%) | 47 (3.1%) |
| $100,000 to $299,999 | 803 (55.8%) | 1,036 (69.3%) |
| $300,000 to $499,999 | 184 (12.8%) | 331 (22.1%) |
| $500,000 to $749,999 | 16 (1.1%) | 13 (0.9%) |
| $750,000 to $999,999 | 1 (0.1%) | 26 (1.7%) |
| $1,000,000 or more | 70 (4.9%) | 30 (2.0%) |
| Total | 1,438 (100.0%) | 1,496 (100.0%) |
Household Income by Mortgage Status in Morrow County
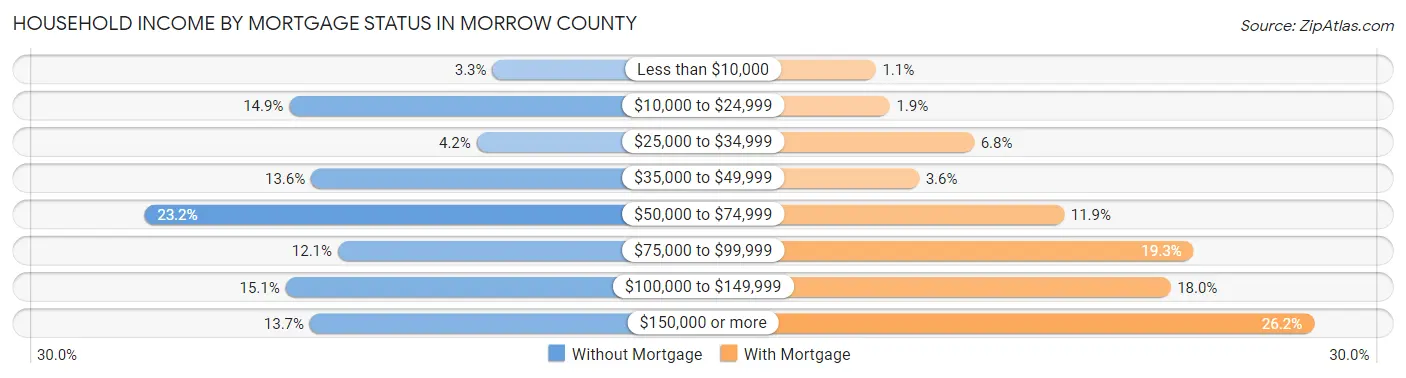
| Household Income | Without Mortgage | With Mortgage |
| Less than $10,000 | 47 (3.3%) | 17 (1.1%) |
| $10,000 to $24,999 | 214 (14.9%) | 29 (1.9%) |
| $25,000 to $34,999 | 60 (4.2%) | 101 (6.8%) |
| $35,000 to $49,999 | 196 (13.6%) | 54 (3.6%) |
| $50,000 to $74,999 | 333 (23.2%) | 178 (11.9%) |
| $75,000 to $99,999 | 174 (12.1%) | 289 (19.3%) |
| $100,000 to $149,999 | 217 (15.1%) | 269 (18.0%) |
| $150,000 or more | 197 (13.7%) | 392 (26.2%) |
| Total | 1,438 (100.0%) | 1,496 (100.0%) |
Property Value to Household Income Ratio in Morrow County
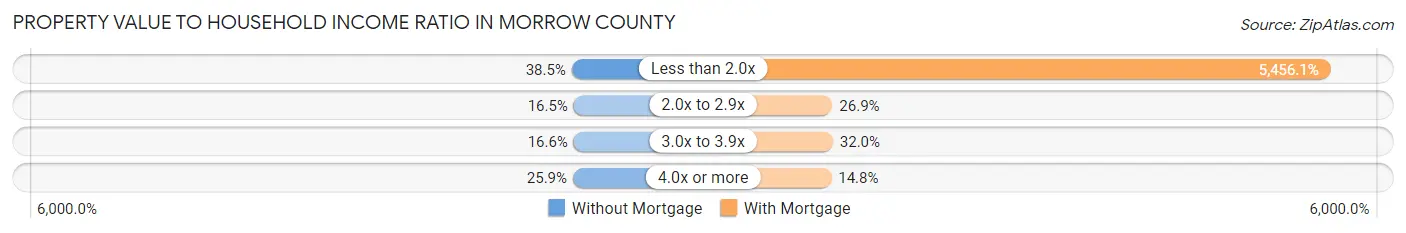
| Value-to-Income Ratio | Without Mortgage | With Mortgage |
| Less than 2.0x | 554 (38.5%) | 81,623 (5,456.1%) |
| 2.0x to 2.9x | 237 (16.5%) | 403 (26.9%) |
| 3.0x to 3.9x | 238 (16.6%) | 478 (32.0%) |
| 4.0x or more | 372 (25.9%) | 221 (14.8%) |
| Total | 1,438 (100.0%) | 1,496 (100.0%) |
Real Estate Taxes by Mortgage Status in Morrow County
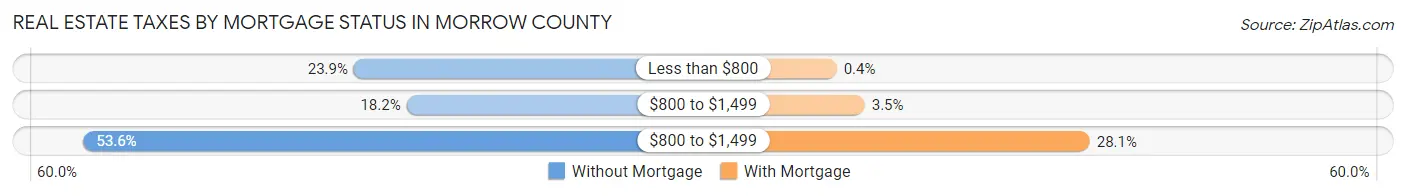
| Property Taxes | Without Mortgage | With Mortgage |
| Less than $800 | 344 (23.9%) | 6 (0.4%) |
| $800 to $1,499 | 261 (18.1%) | 52 (3.5%) |
| $800 to $1,499 | 770 (53.5%) | 421 (28.1%) |
| Total | 1,438 (100.0%) | 1,496 (100.0%) |
Health & Disability in Morrow County
Health Insurance Coverage by Age in Morrow County
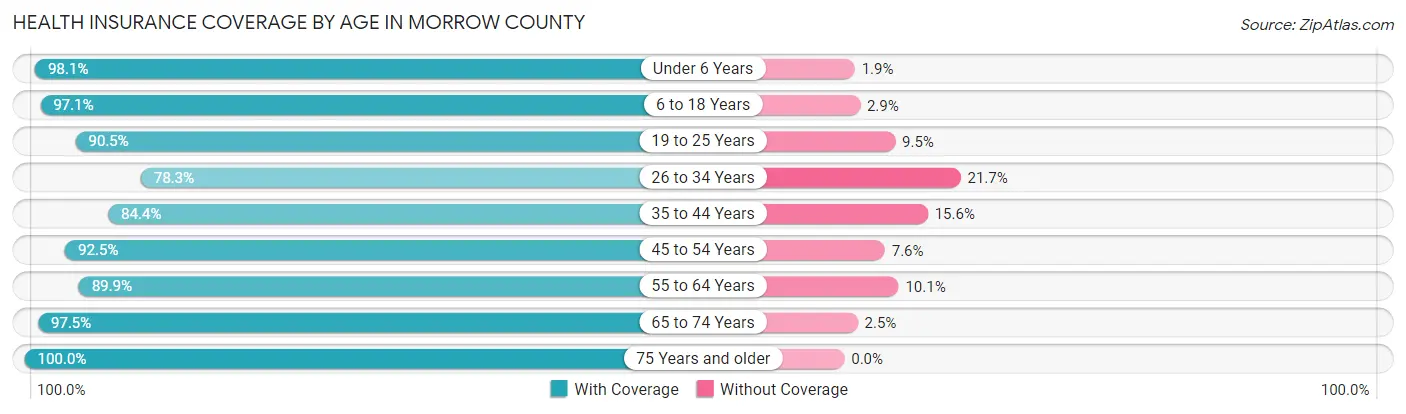
| Age Bracket | With Coverage | Without Coverage |
| Under 6 Years | 1,012 (98.1%) | 20 (1.9%) |
| 6 to 18 Years | 2,428 (97.1%) | 73 (2.9%) |
| 19 to 25 Years | 880 (90.5%) | 92 (9.5%) |
| 26 to 34 Years | 1,004 (78.3%) | 278 (21.7%) |
| 35 to 44 Years | 1,389 (84.4%) | 256 (15.6%) |
| 45 to 54 Years | 1,139 (92.4%) | 93 (7.5%) |
| 55 to 64 Years | 1,371 (89.9%) | 154 (10.1%) |
| 65 to 74 Years | 1,179 (97.5%) | 30 (2.5%) |
| 75 Years and older | 734 (100.0%) | 0 (0.0%) |
| Total | 11,136 (91.8%) | 996 (8.2%) |
Health Insurance Coverage by Citizenship Status in Morrow County
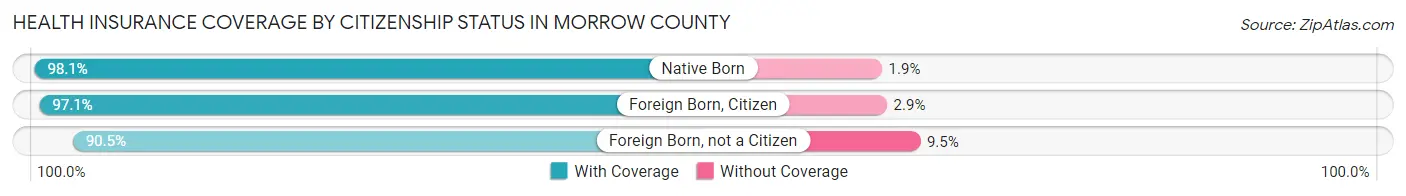
| Citizenship Status | With Coverage | Without Coverage |
| Native Born | 1,012 (98.1%) | 20 (1.9%) |
| Foreign Born, Citizen | 2,428 (97.1%) | 73 (2.9%) |
| Foreign Born, not a Citizen | 880 (90.5%) | 92 (9.5%) |
Health Insurance Coverage by Household Income in Morrow County
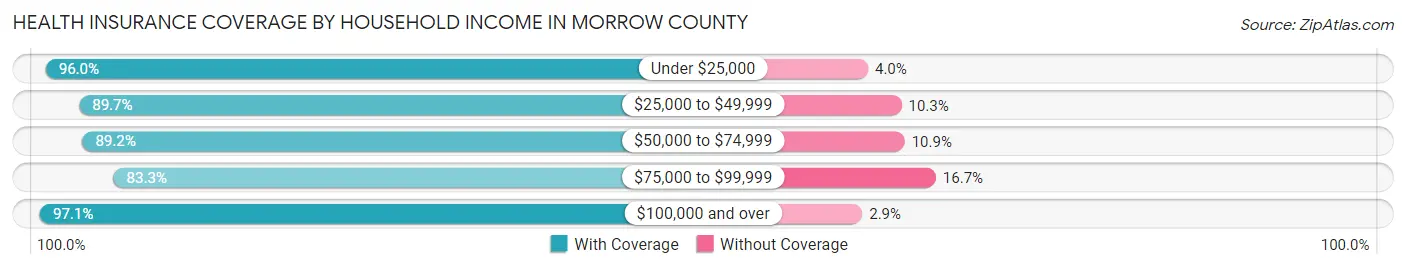
| Household Income | With Coverage | Without Coverage |
| Under $25,000 | 1,109 (96.0%) | 46 (4.0%) |
| $25,000 to $49,999 | 2,275 (89.7%) | 260 (10.3%) |
| $50,000 to $74,999 | 2,267 (89.1%) | 276 (10.8%) |
| $75,000 to $99,999 | 1,448 (83.3%) | 290 (16.7%) |
| $100,000 and over | 3,988 (97.1%) | 119 (2.9%) |
Public vs Private Health Insurance Coverage by Age in Morrow County
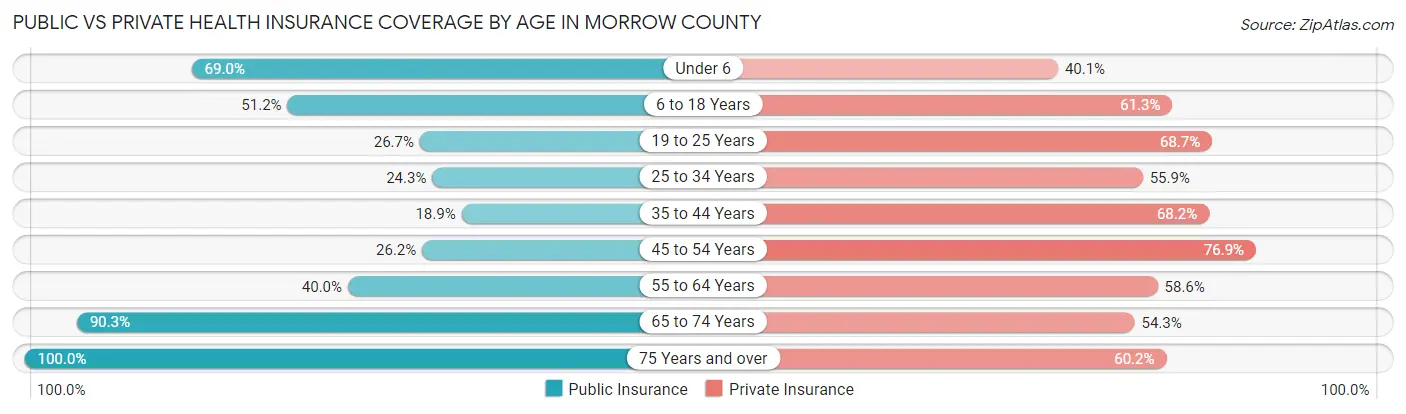
| Age Bracket | Public Insurance | Private Insurance |
| Under 6 | 712 (69.0%) | 414 (40.1%) |
| 6 to 18 Years | 1,281 (51.2%) | 1,534 (61.3%) |
| 19 to 25 Years | 259 (26.7%) | 668 (68.7%) |
| 25 to 34 Years | 312 (24.3%) | 716 (55.8%) |
| 35 to 44 Years | 311 (18.9%) | 1,121 (68.1%) |
| 45 to 54 Years | 323 (26.2%) | 947 (76.9%) |
| 55 to 64 Years | 610 (40.0%) | 894 (58.6%) |
| 65 to 74 Years | 1,092 (90.3%) | 657 (54.3%) |
| 75 Years and over | 734 (100.0%) | 442 (60.2%) |
| Total | 5,634 (46.4%) | 7,393 (60.9%) |
Disability Status by Sex by Age in Morrow County
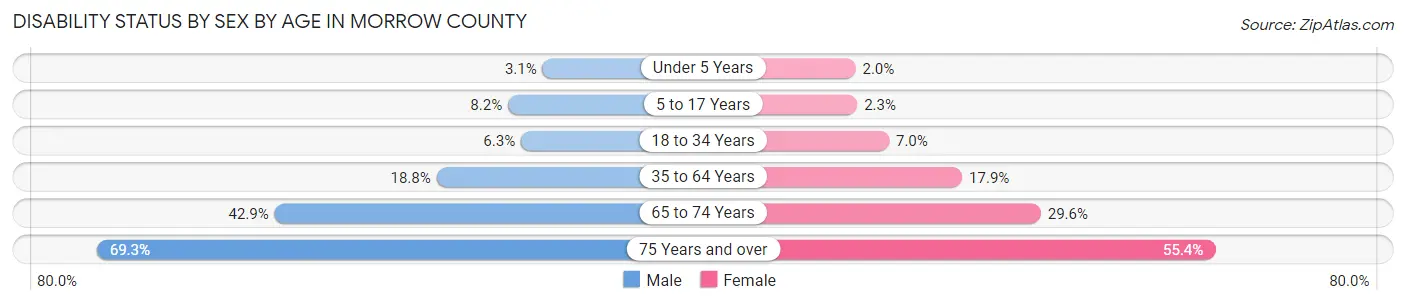
| Age Bracket | Male | Female |
| Under 5 Years | 13 (3.1%) | 9 (2.0%) |
| 5 to 17 Years | 106 (8.2%) | 26 (2.3%) |
| 18 to 34 Years | 81 (6.3%) | 85 (7.0%) |
| 35 to 64 Years | 417 (18.8%) | 391 (17.9%) |
| 65 to 74 Years | 250 (42.9%) | 185 (29.5%) |
| 75 Years and over | 266 (69.3%) | 194 (55.4%) |
Disability Class by Sex by Age in Morrow County
Disability Class: Hearing Difficulty
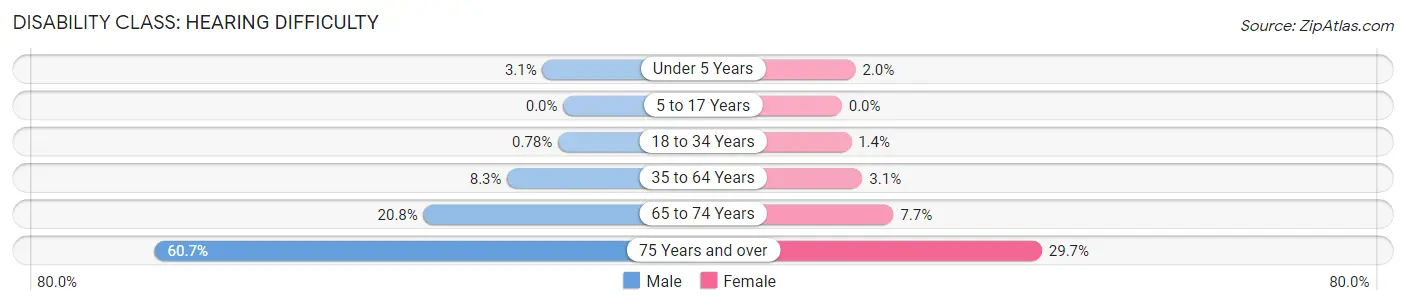
| Age Bracket | Male | Female |
| Under 5 Years | 13 (3.1%) | 9 (2.0%) |
| 5 to 17 Years | 0 (0.0%) | 0 (0.0%) |
| 18 to 34 Years | 10 (0.8%) | 17 (1.4%) |
| 35 to 64 Years | 184 (8.3%) | 67 (3.1%) |
| 65 to 74 Years | 121 (20.7%) | 48 (7.7%) |
| 75 Years and over | 233 (60.7%) | 104 (29.7%) |
Disability Class: Vision Difficulty
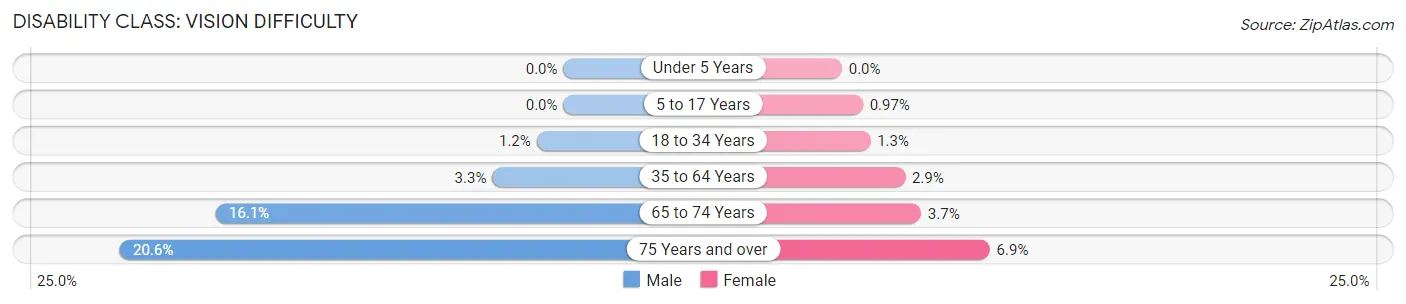
| Age Bracket | Male | Female |
| Under 5 Years | 0 (0.0%) | 0 (0.0%) |
| 5 to 17 Years | 0 (0.0%) | 11 (1.0%) |
| 18 to 34 Years | 16 (1.2%) | 16 (1.3%) |
| 35 to 64 Years | 73 (3.3%) | 64 (2.9%) |
| 65 to 74 Years | 94 (16.1%) | 23 (3.7%) |
| 75 Years and over | 79 (20.6%) | 24 (6.9%) |
Disability Class: Cognitive Difficulty
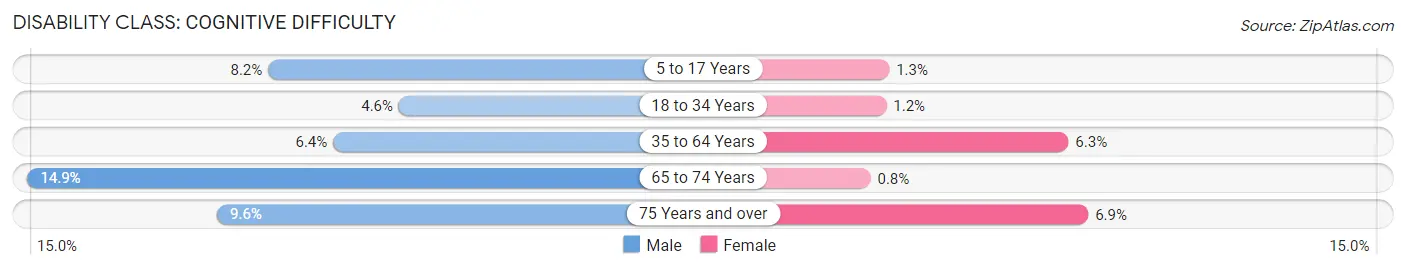
| Age Bracket | Male | Female |
| 5 to 17 Years | 106 (8.2%) | 15 (1.3%) |
| 18 to 34 Years | 59 (4.6%) | 15 (1.2%) |
| 35 to 64 Years | 142 (6.4%) | 138 (6.3%) |
| 65 to 74 Years | 87 (14.9%) | 5 (0.8%) |
| 75 Years and over | 37 (9.6%) | 24 (6.9%) |
Disability Class: Ambulatory Difficulty
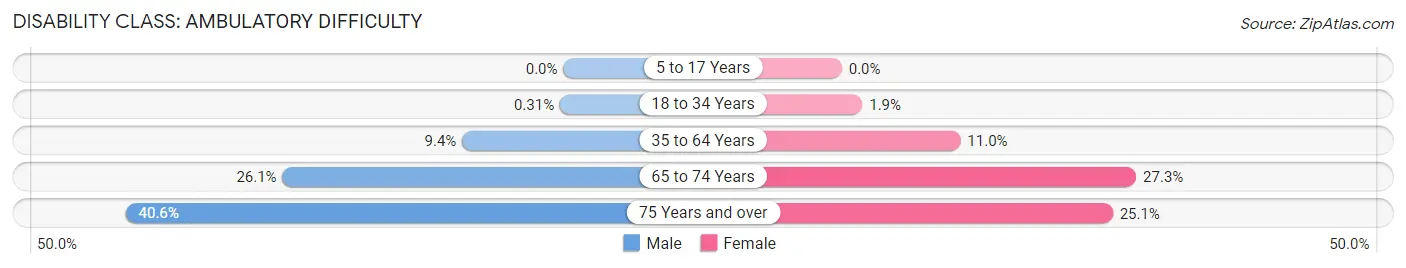
| Age Bracket | Male | Female |
| 5 to 17 Years | 0 (0.0%) | 0 (0.0%) |
| 18 to 34 Years | 4 (0.3%) | 23 (1.9%) |
| 35 to 64 Years | 208 (9.4%) | 241 (11.0%) |
| 65 to 74 Years | 152 (26.1%) | 171 (27.3%) |
| 75 Years and over | 156 (40.6%) | 88 (25.1%) |
Disability Class: Self-Care Difficulty
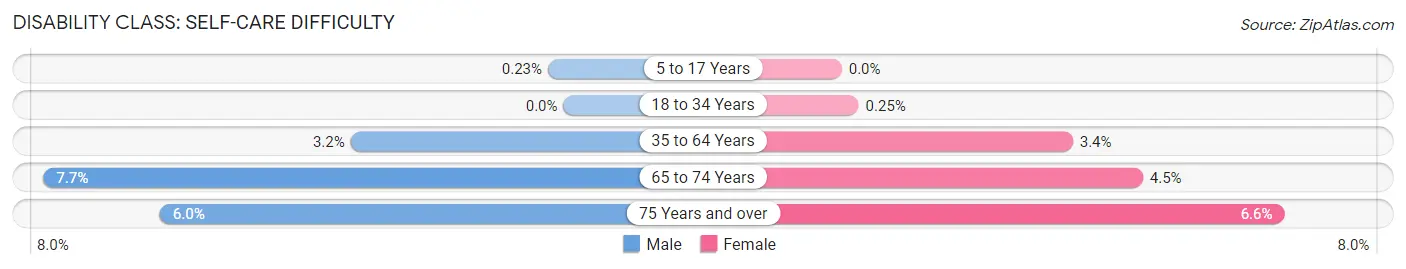
| Age Bracket | Male | Female |
| 5 to 17 Years | 3 (0.2%) | 0 (0.0%) |
| 18 to 34 Years | 0 (0.0%) | 3 (0.3%) |
| 35 to 64 Years | 70 (3.2%) | 75 (3.4%) |
| 65 to 74 Years | 45 (7.7%) | 28 (4.5%) |
| 75 Years and over | 23 (6.0%) | 23 (6.6%) |
Technology Access in Morrow County
Computing Device Access in Morrow County
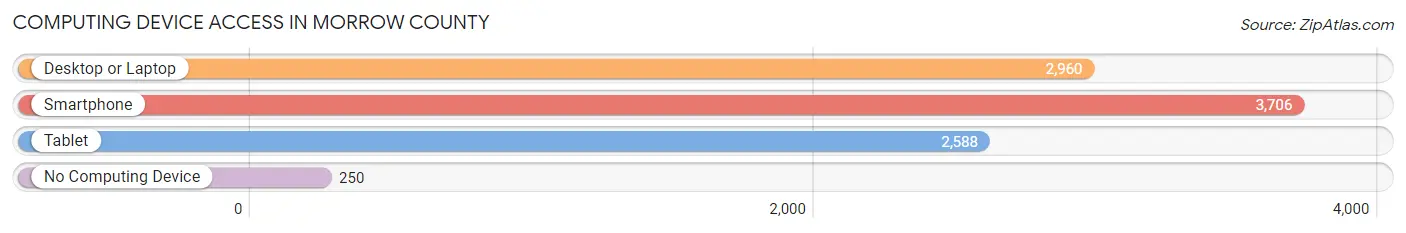
| Device Type | # Households | % Households |
| Desktop or Laptop | 2,960 | 70.5% |
| Smartphone | 3,706 | 88.2% |
| Tablet | 2,588 | 61.6% |
| No Computing Device | 250 | 5.9% |
| Total | 4,201 | 100.0% |
Internet Access in Morrow County
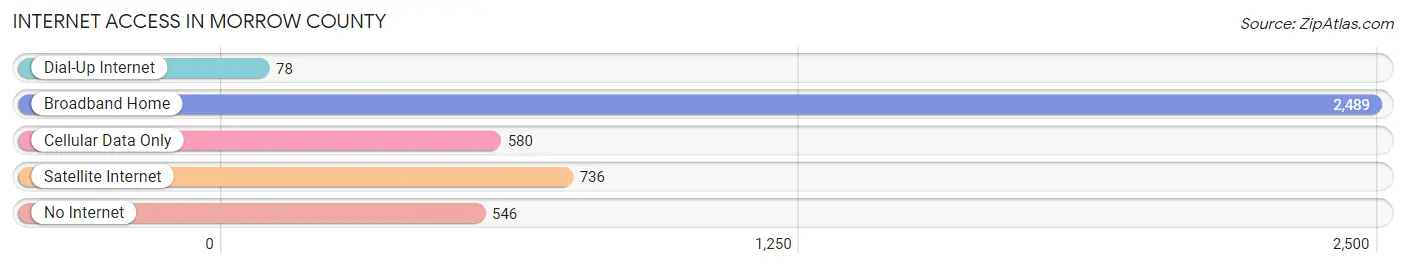
| Internet Type | # Households | % Households |
| Dial-Up Internet | 78 | 1.9% |
| Broadband Home | 2,489 | 59.3% |
| Cellular Data Only | 580 | 13.8% |
| Satellite Internet | 736 | 17.5% |
| No Internet | 546 | 13.0% |
| Total | 4,201 | 100.0% |
Morrow County Summary
Morrow County, Oregon is located in the north-central part of the state, and is bordered by Umatilla County to the north, Gilliam County to the east, Sherman County to the south, and Wasco County to the west. The county seat is Heppner, and the largest city is Boardman. The county has a total area of 1,841 square miles, of which 1,837 square miles is land and 4 square miles is water.
History
Morrow County was created in 1885 from the western portion of Umatilla County. It was named after one of the county’s first settlers, Jackson L. Morrow. The county was originally inhabited by the Cayuse and Umatilla tribes of Native Americans. The first white settlers arrived in the area in the early 1860s, and the county was officially established in 1885.
Geography
Morrow County is located in the north-central part of Oregon, and is bordered by Umatilla County to the north, Gilliam County to the east, Sherman County to the south, and Wasco County to the west. The county has a total area of 1,841 square miles, of which 1,837 square miles is land and 4 square miles is water. The county is mostly flat, with some rolling hills in the western part of the county. The highest point in the county is the summit of Lookout Mountain, which has an elevation of 4,902 feet.
The county is home to several rivers, including the Umatilla, John Day, and Deschutes Rivers. The Umatilla River is the largest river in the county, and is a tributary of the Columbia River. The John Day River is a tributary of the Columbia River, and is the second-longest free-flowing river in the contiguous United States. The Deschutes River is a tributary of the Columbia River, and is the largest river in Oregon.
Economy
Morrow County’s economy is largely based on agriculture and manufacturing. The county is home to several large agricultural operations, including wheat, barley, and hay farms. The county is also home to several large manufacturing companies, including a paper mill, a lumber mill, and a food processing plant.
The county is also home to several large wind farms, which generate electricity for the region. The county is also home to several large solar farms, which generate electricity for the region.
Demographics
As of the 2010 census, the population of Morrow County was 11,173. The population density was 6.1 people per square mile. The racial makeup of the county was 87.3% White, 0.7% African American, 1.2% Native American, 0.4% Asian, 0.1% Pacific Islander, 8.2% from other races, and 2.1% from two or more races. Hispanic or Latino of any race were 16.2% of the population.
The median income for a household in the county was $37,917, and the median income for a family was $45,938. The per capita income for the county was $17,945. About 13.2% of families and 17.2% of the population were below the poverty line, including 22.3% of those under age 18 and 8.2% of those age 65 or over.
Common Questions
What is the Total Population of Morrow County?
Total Population of Morrow County is 12,140.
What is the Total Male Population of Morrow County?
Total Male Population of Morrow County is 6,183.
What is the Total Female Population of Morrow County?
Total Female Population of Morrow County is 5,957.
What is the Ratio of Males per 100 Females in Morrow County?
There are 103.79 Males per 100 Females in Morrow County.
What is the Ratio of Females per 100 Males in Morrow County?
There are 96.34 Females per 100 Males in Morrow County.
What is the Median Population Age in Morrow County?
Median Population Age in Morrow County is 37.0 Years.
What is the Average Family Size in Morrow County
Average Family Size in Morrow County is 3.3 People.
What is the Average Household Size in Morrow County
Average Household Size in Morrow County is 2.9 People.
What is Per Capita Income in Morrow County?
Per Capita income in Morrow County is $29,975.
What is the Median Family Income in Morrow County?
Median Family Income in Morrow County is $72,325.
What is the Median Household income in Morrow County?
Median Household Income in Morrow County is $64,975.
What is Income or Wage Gap in Morrow County?
Income or Wage Gap in Morrow County is 29.9%.
Women in Morrow County earn 70.1 cents for every dollar earned by a man.
What is Family Income Deficit in Morrow County?
Family Income Deficit in Morrow County is $9,616.
Families that are below poverty line in Morrow County earn $9,616 less on average than the poverty threshold level.
What is Inequality or Gini Index in Morrow County?
Inequality or Gini Index in Morrow County is 0.44.
How Large is the Labor Force in Morrow County?
There are 5,310 People in the Labor Forcein in Morrow County.
What is the Percentage of People in the Labor Force in Morrow County?
57.4% of People are in the Labor Force in Morrow County.
What is the Unemployment Rate in Morrow County?
Unemployment Rate in Morrow County is 3.2%.