Marion County, OR
Marion County Map
Marion County Overview
345,815
TOTAL POPULATION
173,623
MALE POPULATION
172,192
FEMALE POPULATION
100.83
MALES / 100 FEMALES
99.18
FEMALES / 100 MALES
37.0
MEDIAN AGE
3.3
AVG FAMILY SIZE
2.7
AVG HOUSEHOLD SIZE
$33,545
PER CAPITA INCOME
$84,296
AVG FAMILY INCOME
$70,926
AVG HOUSEHOLD INCOME
22.5%
WAGE / INCOME GAP [ % ]
77.5¢/ $1
WAGE / INCOME GAP [ $ ]
$9,922
FAMILY INCOME DEFICIT
0.43
INEQUALITY / GINI INDEX
167,595
LABOR FORCE [ PEOPLE ]
61.5%
PERCENT IN LABOR FORCE
5.4%
UNEMPLOYMENT RATE
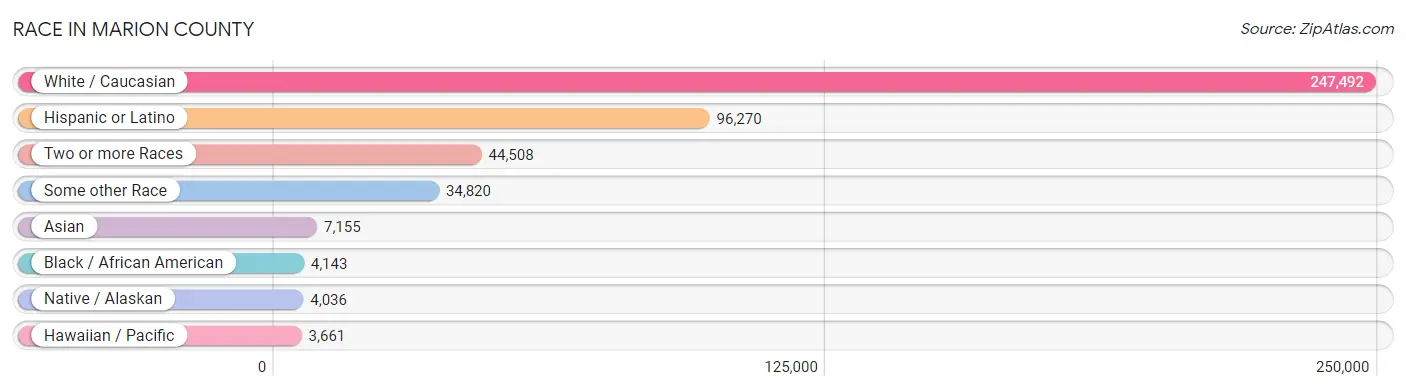
Race in Marion County
The most populous races in Marion County are White / Caucasian (247,492 | 71.6%), Hispanic or Latino (96,270 | 27.8%), and Two or more Races (44,508 | 12.9%).
| Race | # Population | % Population |
| Asian | 7,155 | 2.1% |
| Black / African American | 4,143 | 1.2% |
| Hawaiian / Pacific | 3,661 | 1.1% |
| Hispanic or Latino | 96,270 | 27.8% |
| Native / Alaskan | 4,036 | 1.2% |
| White / Caucasian | 247,492 | 71.6% |
| Two or more Races | 44,508 | 12.9% |
| Some other Race | 34,820 | 10.1% |
| Total | 345,815 | 100.0% |
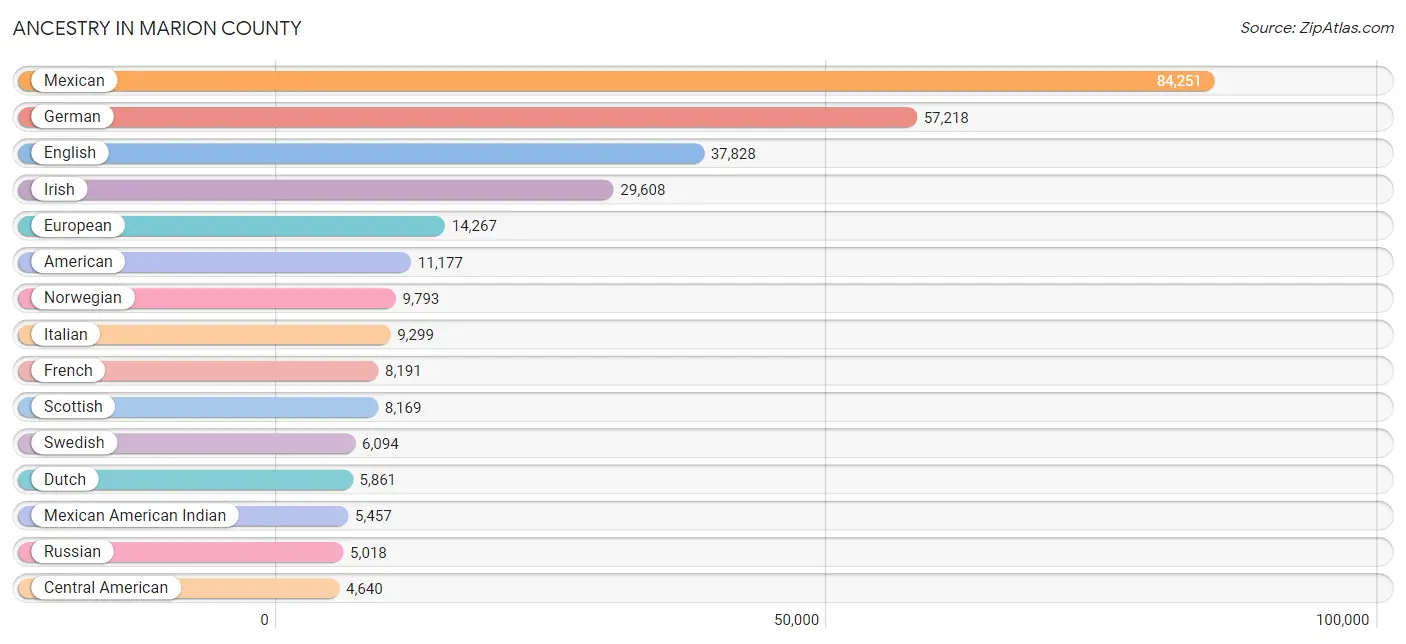
Ancestry in Marion County
The most populous ancestries reported in Marion County are Mexican (84,251 | 24.4%), German (57,218 | 16.6%), English (37,828 | 10.9%), Irish (29,608 | 8.6%), and European (14,267 | 4.1%), together accounting for 64.5% of all Marion County residents.
| Ancestry | # Population | % Population |
| African | 760 | 0.2% |
| Alaska Native | 49 | 0.0% |
| Alaskan Athabascan | 26 | 0.0% |
| Albanian | 13 | 0.0% |
| Aleut | 3 | 0.0% |
| Alsatian | 12 | 0.0% |
| American | 11,177 | 3.2% |
| Apache | 389 | 0.1% |
| Arab | 377 | 0.1% |
| Arapaho | 14 | 0.0% |
| Argentinean | 8 | 0.0% |
| Armenian | 105 | 0.0% |
| Assyrian / Chaldean / Syriac | 8 | 0.0% |
| Australian | 61 | 0.0% |
| Austrian | 917 | 0.3% |
| Bangladeshi | 276 | 0.1% |
| Basque | 164 | 0.1% |
| Belgian | 233 | 0.1% |
| Bhutanese | 1,430 | 0.4% |
| Blackfeet | 524 | 0.2% |
| Bolivian | 65 | 0.0% |
| Brazilian | 124 | 0.0% |
| British | 1,947 | 0.6% |
| Bulgarian | 96 | 0.0% |
| Burmese | 1,619 | 0.5% |
| Cajun | 14 | 0.0% |
| Canadian | 905 | 0.3% |
| Celtic | 100 | 0.0% |
| Central American | 4,640 | 1.3% |
| Central American Indian | 548 | 0.2% |
| Cherokee | 1,952 | 0.6% |
| Cheyenne | 9 | 0.0% |
| Chickasaw | 50 | 0.0% |
| Chilean | 131 | 0.0% |
| Chinese | 47 | 0.0% |
| Chippewa | 134 | 0.0% |
| Choctaw | 409 | 0.1% |
| Colombian | 292 | 0.1% |
| Colville | 52 | 0.0% |
| Comanche | 300 | 0.1% |
| Costa Rican | 16 | 0.0% |
| Cree | 5 | 0.0% |
| Creek | 81 | 0.0% |
| Croatian | 309 | 0.1% |
| Crow | 40 | 0.0% |
| Cuban | 482 | 0.1% |
| Czech | 828 | 0.2% |
| Czechoslovakian | 399 | 0.1% |
| Danish | 2,789 | 0.8% |
| Delaware | 60 | 0.0% |
| Dominican | 105 | 0.0% |
| Dutch | 5,861 | 1.7% |
| Dutch West Indian | 70 | 0.0% |
| Eastern European | 1,193 | 0.3% |
| Ecuadorian | 51 | 0.0% |
| Egyptian | 18 | 0.0% |
| English | 37,828 | 10.9% |
| Estonian | 37 | 0.0% |
| Ethiopian | 110 | 0.0% |
| European | 14,267 | 4.1% |
| Fijian | 1,710 | 0.5% |
| Filipino | 15 | 0.0% |
| Finnish | 967 | 0.3% |
| French | 8,191 | 2.4% |
| French American Indian | 161 | 0.1% |
| French Canadian | 1,990 | 0.6% |
| German | 57,218 | 16.6% |
| German Russian | 8 | 0.0% |
| Ghanaian | 30 | 0.0% |
| Greek | 1,067 | 0.3% |
| Guamanian / Chamorro | 317 | 0.1% |
| Guatemalan | 1,977 | 0.6% |
| Honduran | 345 | 0.1% |
| Hopi | 5 | 0.0% |
| Hungarian | 1,058 | 0.3% |
| Icelander | 93 | 0.0% |
| Indian (Asian) | 2,646 | 0.8% |
| Indonesian | 119 | 0.0% |
| Inupiat | 46 | 0.0% |
| Iranian | 134 | 0.0% |
| Iraqi | 1 | 0.0% |
| Irish | 29,608 | 8.6% |
| Iroquois | 28 | 0.0% |
| Israeli | 83 | 0.0% |
| Italian | 9,299 | 2.7% |
| Jamaican | 73 | 0.0% |
| Japanese | 335 | 0.1% |
| Jordanian | 17 | 0.0% |
| Kenyan | 23 | 0.0% |
| Kiowa | 9 | 0.0% |
| Korean | 3,013 | 0.9% |
| Laotian | 165 | 0.1% |
| Latvian | 109 | 0.0% |
| Lebanese | 58 | 0.0% |
| Liberian | 214 | 0.1% |
| Lithuanian | 282 | 0.1% |
| Malaysian | 224 | 0.1% |
| Maltese | 21 | 0.0% |
| Mexican | 84,251 | 24.4% |
| Mexican American Indian | 5,457 | 1.6% |
| Moroccan | 36 | 0.0% |
| Native Hawaiian | 1,291 | 0.4% |
| Navajo | 344 | 0.1% |
| Nepalese | 45 | 0.0% |
| New Zealander | 22 | 0.0% |
| Nicaraguan | 263 | 0.1% |
| Nigerian | 49 | 0.0% |
| Northern European | 1,170 | 0.3% |
| Norwegian | 9,793 | 2.8% |
| Osage | 53 | 0.0% |
| Paiute | 98 | 0.0% |
| Pakistani | 271 | 0.1% |
| Palestinian | 81 | 0.0% |
| Panamanian | 257 | 0.1% |
| Pennsylvania German | 63 | 0.0% |
| Peruvian | 346 | 0.1% |
| Polish | 4,168 | 1.2% |
| Portuguese | 1,332 | 0.4% |
| Potawatomi | 27 | 0.0% |
| Pueblo | 34 | 0.0% |
| Puerto Rican | 1,133 | 0.3% |
| Puget Sound Salish | 19 | 0.0% |
| Romanian | 521 | 0.2% |
| Russian | 5,018 | 1.5% |
| Salvadoran | 1,782 | 0.5% |
| Samoan | 178 | 0.1% |
| Scandinavian | 2,477 | 0.7% |
| Scotch-Irish | 3,212 | 0.9% |
| Scottish | 8,169 | 2.4% |
| Seminole | 6 | 0.0% |
| Serbian | 96 | 0.0% |
| Shoshone | 38 | 0.0% |
| Sierra Leonean | 1 | 0.0% |
| Sioux | 312 | 0.1% |
| Slavic | 87 | 0.0% |
| Slovak | 291 | 0.1% |
| Slovene | 32 | 0.0% |
| Somali | 326 | 0.1% |
| South African | 14 | 0.0% |
| South American | 1,025 | 0.3% |
| South American Indian | 138 | 0.0% |
| Spaniard | 987 | 0.3% |
| Spanish | 1,466 | 0.4% |
| Spanish American | 19 | 0.0% |
| Sri Lankan | 1,163 | 0.3% |
| Subsaharan African | 1,580 | 0.5% |
| Swedish | 6,094 | 1.8% |
| Swiss | 2,528 | 0.7% |
| Syrian | 11 | 0.0% |
| Thai | 884 | 0.3% |
| Tlingit-Haida | 36 | 0.0% |
| Tohono O'Odham | 32 | 0.0% |
| Trinidadian and Tobagonian | 59 | 0.0% |
| Tsimshian | 66 | 0.0% |
| Ugandan | 29 | 0.0% |
| Ukrainian | 1,206 | 0.4% |
| Ute | 67 | 0.0% |
| Venezuelan | 132 | 0.0% |
| Welsh | 2,504 | 0.7% |
| West Indian | 14 | 0.0% |
| Yakama | 16 | 0.0% |
| Yaqui | 129 | 0.0% |
| Yugoslavian | 74 | 0.0% |
| Yuman | 47 | 0.0% |
| Yup'ik | 19 | 0.0% | View All 165 Rows |
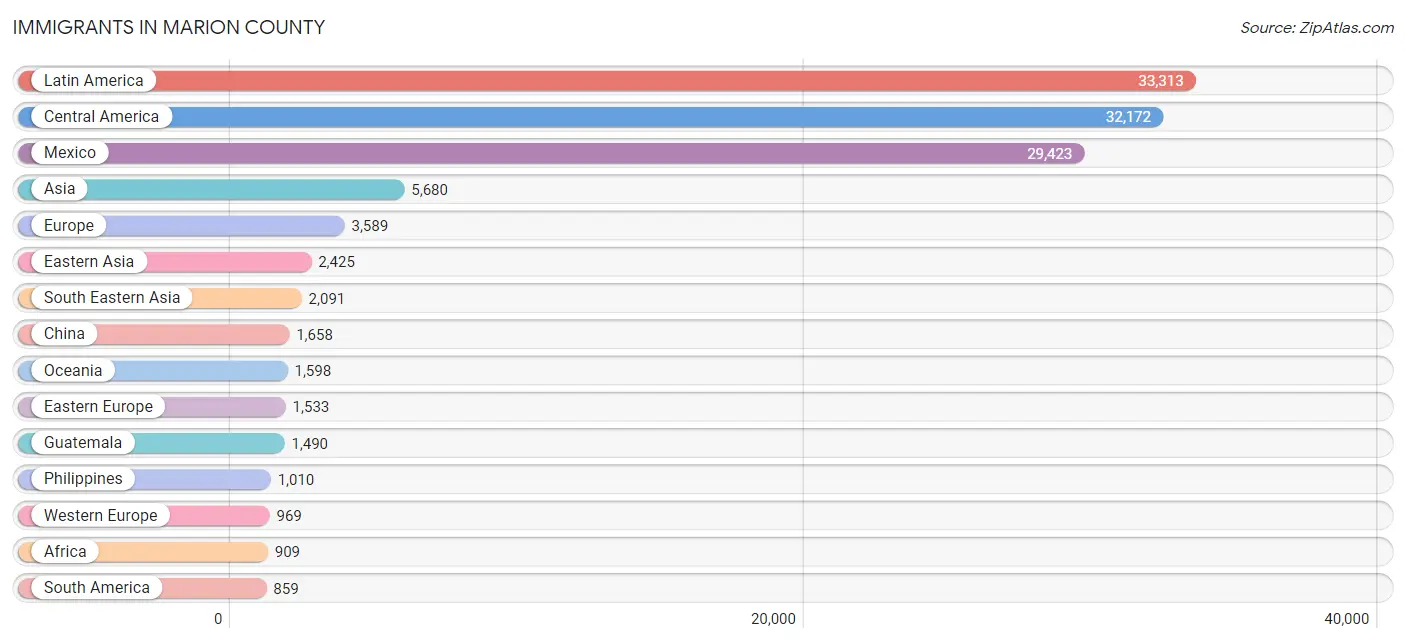
Immigrants in Marion County
The most numerous immigrant groups reported in Marion County came from Latin America (33,313 | 9.6%), Central America (32,172 | 9.3%), Mexico (29,423 | 8.5%), Asia (5,680 | 1.6%), and Europe (3,589 | 1.0%), together accounting for 30.1% of all Marion County residents.
| Immigration Origin | # Population | % Population |
| Africa | 909 | 0.3% |
| Argentina | 82 | 0.0% |
| Armenia | 16 | 0.0% |
| Asia | 5,680 | 1.6% |
| Australia | 87 | 0.0% |
| Austria | 202 | 0.1% |
| Belarus | 97 | 0.0% |
| Belgium | 30 | 0.0% |
| Bolivia | 65 | 0.0% |
| Brazil | 126 | 0.0% |
| Cambodia | 114 | 0.0% |
| Canada | 672 | 0.2% |
| Caribbean | 282 | 0.1% |
| Central America | 32,172 | 9.3% |
| Chile | 60 | 0.0% |
| China | 1,658 | 0.5% |
| Colombia | 57 | 0.0% |
| Congo | 86 | 0.0% |
| Cuba | 109 | 0.0% |
| Czechoslovakia | 50 | 0.0% |
| Dominican Republic | 63 | 0.0% |
| Eastern Africa | 208 | 0.1% |
| Eastern Asia | 2,425 | 0.7% |
| Eastern Europe | 1,533 | 0.4% |
| Ecuador | 13 | 0.0% |
| El Salvador | 697 | 0.2% |
| England | 520 | 0.2% |
| Ethiopia | 101 | 0.0% |
| Europe | 3,589 | 1.0% |
| Fiji | 15 | 0.0% |
| France | 107 | 0.0% |
| Germany | 341 | 0.1% |
| Ghana | 63 | 0.0% |
| Guatemala | 1,490 | 0.4% |
| Honduras | 212 | 0.1% |
| Hong Kong | 76 | 0.0% |
| Hungary | 206 | 0.1% |
| India | 617 | 0.2% |
| Indonesia | 27 | 0.0% |
| Iran | 76 | 0.0% |
| Iraq | 1 | 0.0% |
| Israel | 26 | 0.0% |
| Italy | 141 | 0.0% |
| Jamaica | 51 | 0.0% |
| Japan | 157 | 0.1% |
| Jordan | 9 | 0.0% |
| Kazakhstan | 33 | 0.0% |
| Korea | 610 | 0.2% |
| Laos | 173 | 0.1% |
| Latin America | 33,313 | 9.6% |
| Latvia | 29 | 0.0% |
| Lebanon | 8 | 0.0% |
| Liberia | 177 | 0.1% |
| Lithuania | 14 | 0.0% |
| Malaysia | 14 | 0.0% |
| Mexico | 29,423 | 8.5% |
| Micronesia | 358 | 0.1% |
| Middle Africa | 217 | 0.1% |
| Moldova | 87 | 0.0% |
| Morocco | 12 | 0.0% |
| Netherlands | 284 | 0.1% |
| Nicaragua | 155 | 0.0% |
| Nigeria | 52 | 0.0% |
| Northern Africa | 18 | 0.0% |
| Northern Europe | 835 | 0.2% |
| Norway | 26 | 0.0% |
| Oceania | 1,598 | 0.5% |
| Panama | 195 | 0.1% |
| Peru | 412 | 0.1% |
| Philippines | 1,010 | 0.3% |
| Portugal | 55 | 0.0% |
| Romania | 65 | 0.0% |
| Russia | 469 | 0.1% |
| Scotland | 48 | 0.0% |
| Senegal | 36 | 0.0% |
| Serbia | 5 | 0.0% |
| Sierra Leone | 1 | 0.0% |
| Somalia | 69 | 0.0% |
| South Africa | 73 | 0.0% |
| South America | 859 | 0.3% |
| South Central Asia | 818 | 0.2% |
| South Eastern Asia | 2,091 | 0.6% |
| Southern Europe | 196 | 0.1% |
| Sri Lanka | 11 | 0.0% |
| Sweden | 8 | 0.0% |
| Switzerland | 5 | 0.0% |
| Syria | 76 | 0.0% |
| Taiwan | 67 | 0.0% |
| Thailand | 135 | 0.0% |
| Trinidad and Tobago | 59 | 0.0% |
| Turkey | 68 | 0.0% |
| Uganda | 23 | 0.0% |
| Ukraine | 461 | 0.1% |
| Uruguay | 8 | 0.0% |
| Uzbekistan | 65 | 0.0% |
| Venezuela | 36 | 0.0% |
| Vietnam | 499 | 0.1% |
| Western Africa | 329 | 0.1% |
| Western Asia | 273 | 0.1% |
| Western Europe | 969 | 0.3% |
| Yemen | 1 | 0.0% | View All 101 Rows |
Sex and Age in Marion County
Sex and Age in Marion County
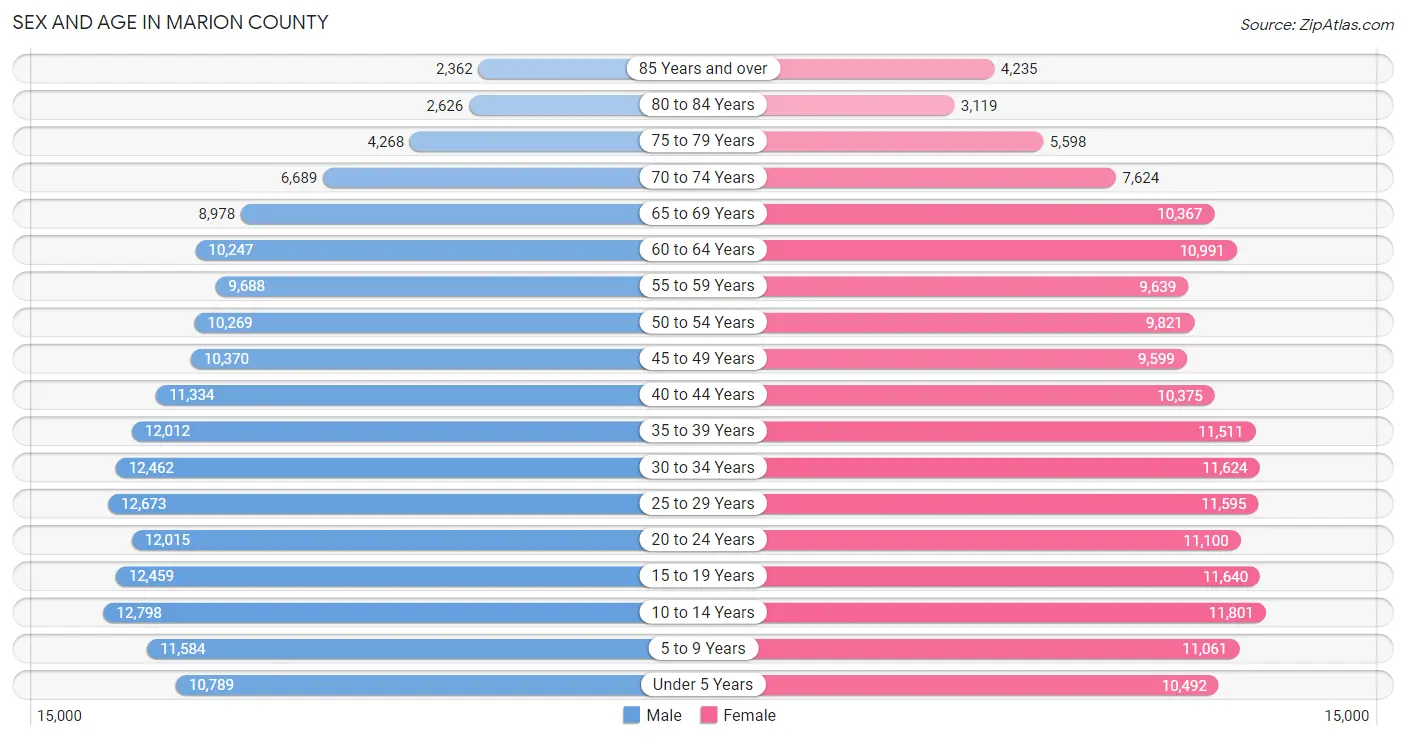
The most populous age groups in Marion County are 10 to 14 Years (12,798 | 7.4%) for men and 10 to 14 Years (11,801 | 6.9%) for women.
| Age Bracket | Male | Female |
| Under 5 Years | 10,789 (6.2%) | 10,492 (6.1%) |
| 5 to 9 Years | 11,584 (6.7%) | 11,061 (6.4%) |
| 10 to 14 Years | 12,798 (7.4%) | 11,801 (6.9%) |
| 15 to 19 Years | 12,459 (7.2%) | 11,640 (6.8%) |
| 20 to 24 Years | 12,015 (6.9%) | 11,100 (6.5%) |
| 25 to 29 Years | 12,673 (7.3%) | 11,595 (6.7%) |
| 30 to 34 Years | 12,462 (7.2%) | 11,624 (6.8%) |
| 35 to 39 Years | 12,012 (6.9%) | 11,511 (6.7%) |
| 40 to 44 Years | 11,334 (6.5%) | 10,375 (6.0%) |
| 45 to 49 Years | 10,370 (6.0%) | 9,599 (5.6%) |
| 50 to 54 Years | 10,269 (5.9%) | 9,821 (5.7%) |
| 55 to 59 Years | 9,688 (5.6%) | 9,639 (5.6%) |
| 60 to 64 Years | 10,247 (5.9%) | 10,991 (6.4%) |
| 65 to 69 Years | 8,978 (5.2%) | 10,367 (6.0%) |
| 70 to 74 Years | 6,689 (3.8%) | 7,624 (4.4%) |
| 75 to 79 Years | 4,268 (2.5%) | 5,598 (3.3%) |
| 80 to 84 Years | 2,626 (1.5%) | 3,119 (1.8%) |
| 85 Years and over | 2,362 (1.4%) | 4,235 (2.5%) |
| Total | 173,623 (100.0%) | 172,192 (100.0%) |
Families and Households in Marion County
Median Family Size in Marion County
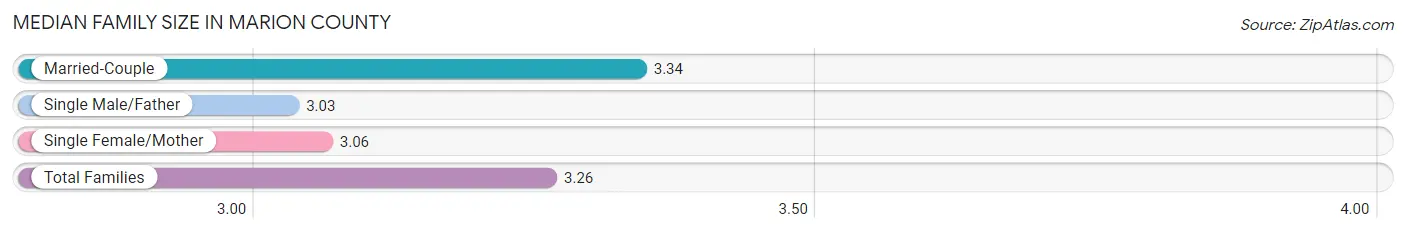
The median family size in Marion County is 3.26 persons per family, with married-couple families (59,285 | 71.9%) accounting for the largest median family size of 3.34 persons per family. On the other hand, single male/father families (7,524 | 9.1%) represent the smallest median family size with 3.03 persons per family.
| Family Type | # Families | Family Size |
| Married-Couple | 59,285 (71.9%) | 3.34 |
| Single Male/Father | 7,524 (9.1%) | 3.03 |
| Single Female/Mother | 15,615 (18.9%) | 3.06 |
| Total Families | 82,424 (100.0%) | 3.26 |
Median Household Size in Marion County
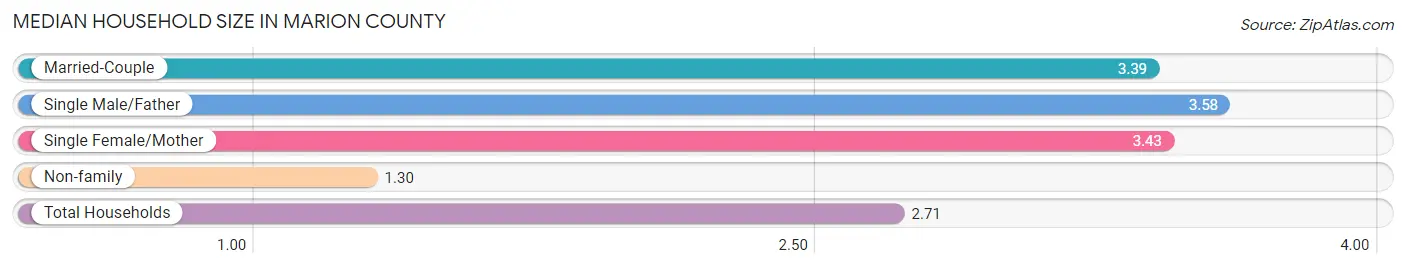
The median household size in Marion County is 2.71 persons per household, with single male/father households (7,524 | 6.1%) accounting for the largest median household size of 3.58 persons per household. non-family households (41,036 | 33.2%) represent the smallest median household size with 1.30 persons per household.
| Household Type | # Households | Household Size |
| Married-Couple | 59,285 (48.0%) | 3.39 |
| Single Male/Father | 7,524 (6.1%) | 3.58 |
| Single Female/Mother | 15,615 (12.7%) | 3.43 |
| Non-family | 41,036 (33.2%) | 1.30 |
| Total Households | 123,460 (100.0%) | 2.71 |
Household Size by Marriage Status in Marion County
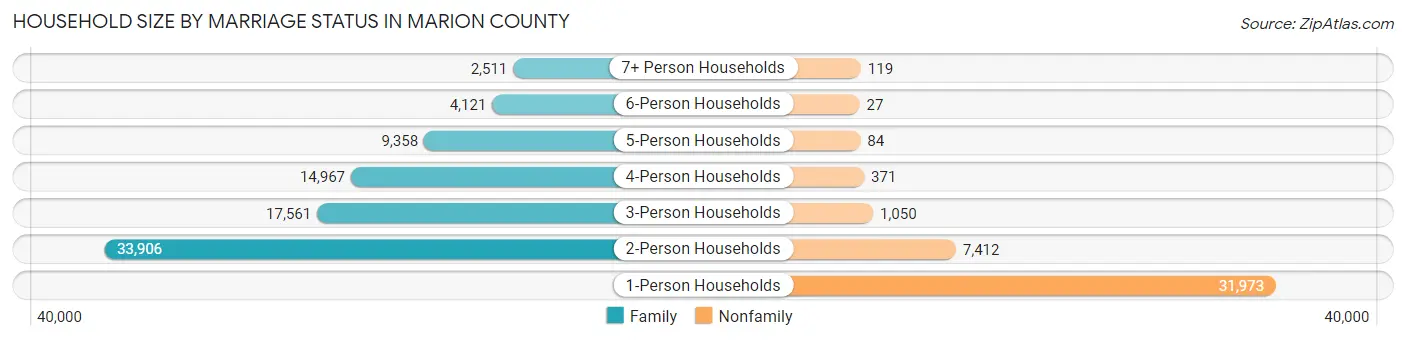
Out of a total of 123,460 households in Marion County, 82,424 (66.8%) are family households, while 41,036 (33.2%) are nonfamily households. The most numerous type of family households are 2-person households, comprising 33,906, and the most common type of nonfamily households are 1-person households, comprising 31,973.
| Household Size | Family Households | Nonfamily Households |
| 1-Person Households | - | 31,973 (25.9%) |
| 2-Person Households | 33,906 (27.5%) | 7,412 (6.0%) |
| 3-Person Households | 17,561 (14.2%) | 1,050 (0.9%) |
| 4-Person Households | 14,967 (12.1%) | 371 (0.3%) |
| 5-Person Households | 9,358 (7.6%) | 84 (0.1%) |
| 6-Person Households | 4,121 (3.3%) | 27 (0.0%) |
| 7+ Person Households | 2,511 (2.0%) | 119 (0.1%) |
| Total | 82,424 (66.8%) | 41,036 (33.2%) |
Female Fertility in Marion County
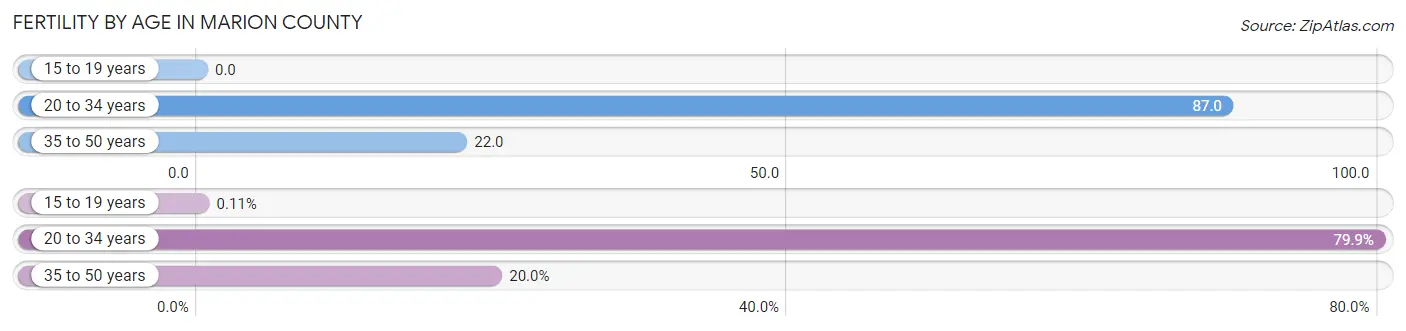
Fertility by Age in Marion County
Average fertility rate in Marion County is 47.0 births per 1,000 women. Women in the age bracket of 20 to 34 years have the highest fertility rate with 87.0 births per 1,000 women. Women in the age bracket of 20 to 34 years acount for 79.9% of all women with births.
| Age Bracket | Women with Births | Births / 1,000 Women |
| 15 to 19 years | 4 (0.1%) | 0.0 |
| 20 to 34 years | 2,989 (79.9%) | 87.0 |
| 35 to 50 years | 747 (20.0%) | 22.0 |
| Total | 3,740 (100.0%) | 47.0 |
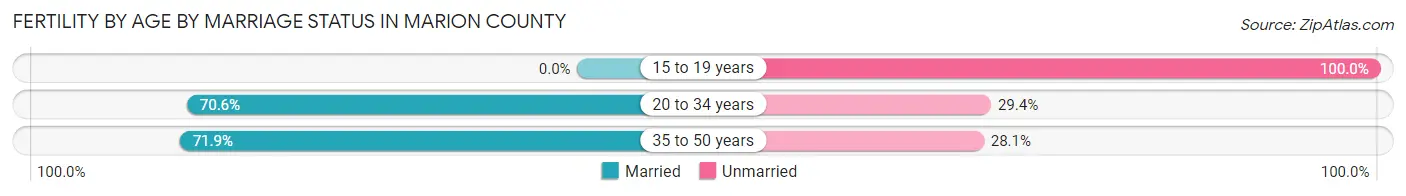
Fertility by Age by Marriage Status in Marion County
70.8% of women with births (3,740) in Marion County are married. The highest percentage of unmarried women with births falls into 15 to 19 years age bracket with 100.0% of them unmarried at the time of birth, while the lowest percentage of unmarried women with births belong to 35 to 50 years age bracket with 28.1% of them unmarried.
| Age Bracket | Married | Unmarried |
| 15 to 19 years | 0 (0.0%) | 4 (100.0%) |
| 20 to 34 years | 2,110 (70.6%) | 879 (29.4%) |
| 35 to 50 years | 537 (71.9%) | 210 (28.1%) |
| Total | 2,648 (70.8%) | 1,092 (29.2%) |
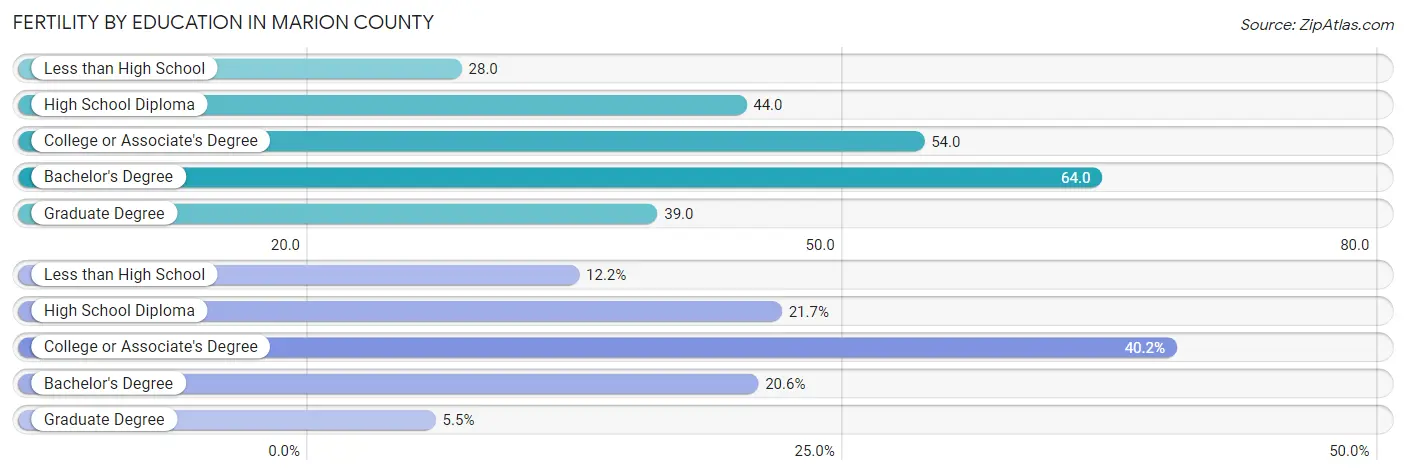
Fertility by Education in Marion County
Average fertility rate in Marion County is 47.0 births per 1,000 women. Women with the education attainment of bachelor's degree have the highest fertility rate of 64.0 births per 1,000 women, while women with the education attainment of less than high school have the lowest fertility at 28.0 births per 1,000 women. Women with the education attainment of college or associate's degree represent 40.2% of all women with births.
| Educational Attainment | Women with Births | Births / 1,000 Women |
| Less than High School | 455 (12.2%) | 28.0 |
| High School Diploma | 810 (21.7%) | 44.0 |
| College or Associate's Degree | 1,502 (40.2%) | 54.0 |
| Bachelor's Degree | 769 (20.6%) | 64.0 |
| Graduate Degree | 204 (5.4%) | 39.0 |
| Total | 3,740 (100.0%) | 47.0 |
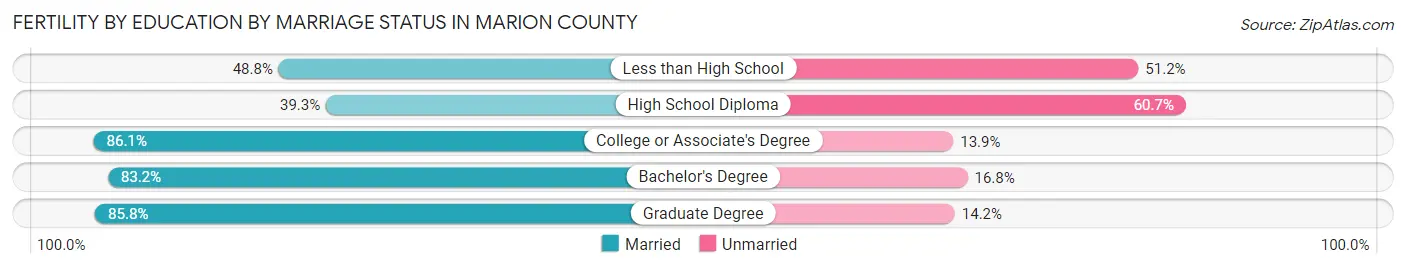
Fertility by Education by Marriage Status in Marion County
29.2% of women with births in Marion County are unmarried. Women with the educational attainment of college or associate's degree are most likely to be married with 86.1% of them married at childbirth, while women with the educational attainment of high school diploma are least likely to be married with 60.7% of them unmarried at childbirth.
| Educational Attainment | Married | Unmarried |
| Less than High School | 222 (48.8%) | 233 (51.2%) |
| High School Diploma | 318 (39.3%) | 492 (60.7%) |
| College or Associate's Degree | 1,293 (86.1%) | 209 (13.9%) |
| Bachelor's Degree | 640 (83.2%) | 129 (16.8%) |
| Graduate Degree | 175 (85.8%) | 29 (14.2%) |
| Total | 2,648 (70.8%) | 1,092 (29.2%) |
Income in Marion County
Income Overview in Marion County
Per Capita Income in Marion County is $33,545, while median incomes of families and households are $84,296 and $70,926 respectively.
| Characteristic | Number | Measure |
| Per Capita Income | 345,815 | $33,545 |
| Median Family Income | 82,424 | $84,296 |
| Mean Family Income | 82,424 | $104,513 |
| Median Household Income | 123,460 | $70,926 |
| Mean Household Income | 123,460 | $91,101 |
| Income Deficit | 82,424 | $9,922 |
| Wage / Income Gap (%) | 345,815 | 22.51% |
| Wage / Income Gap ($) | 345,815 | 77.49¢ per $1 |
| Gini / Inequality Index | 345,815 | 0.43 |
Earnings by Sex in Marion County
Average Earnings in Marion County are $37,076, $41,751 for men and $32,351 for women, a difference of 22.5%.
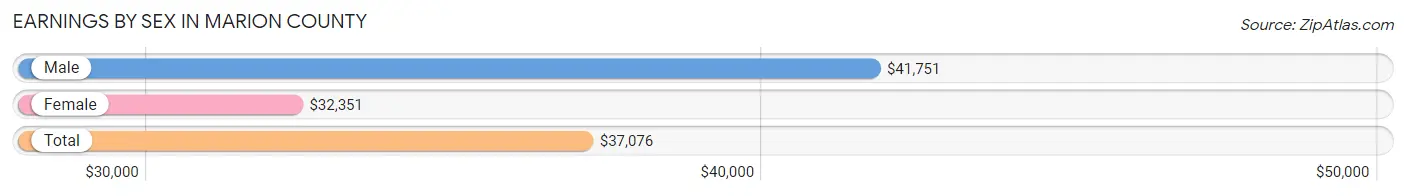
| Sex | Number | Average Earnings |
| Male | 94,712 (53.4%) | $41,751 |
| Female | 82,798 (46.6%) | $32,351 |
| Total | 177,510 (100.0%) | $37,076 |
Earnings by Sex by Income Bracket in Marion County
The most common earnings brackets in Marion County are $100,000+ for men (11,743 | 12.4%) and $25,000 to $29,999 for women (6,733 | 8.1%).
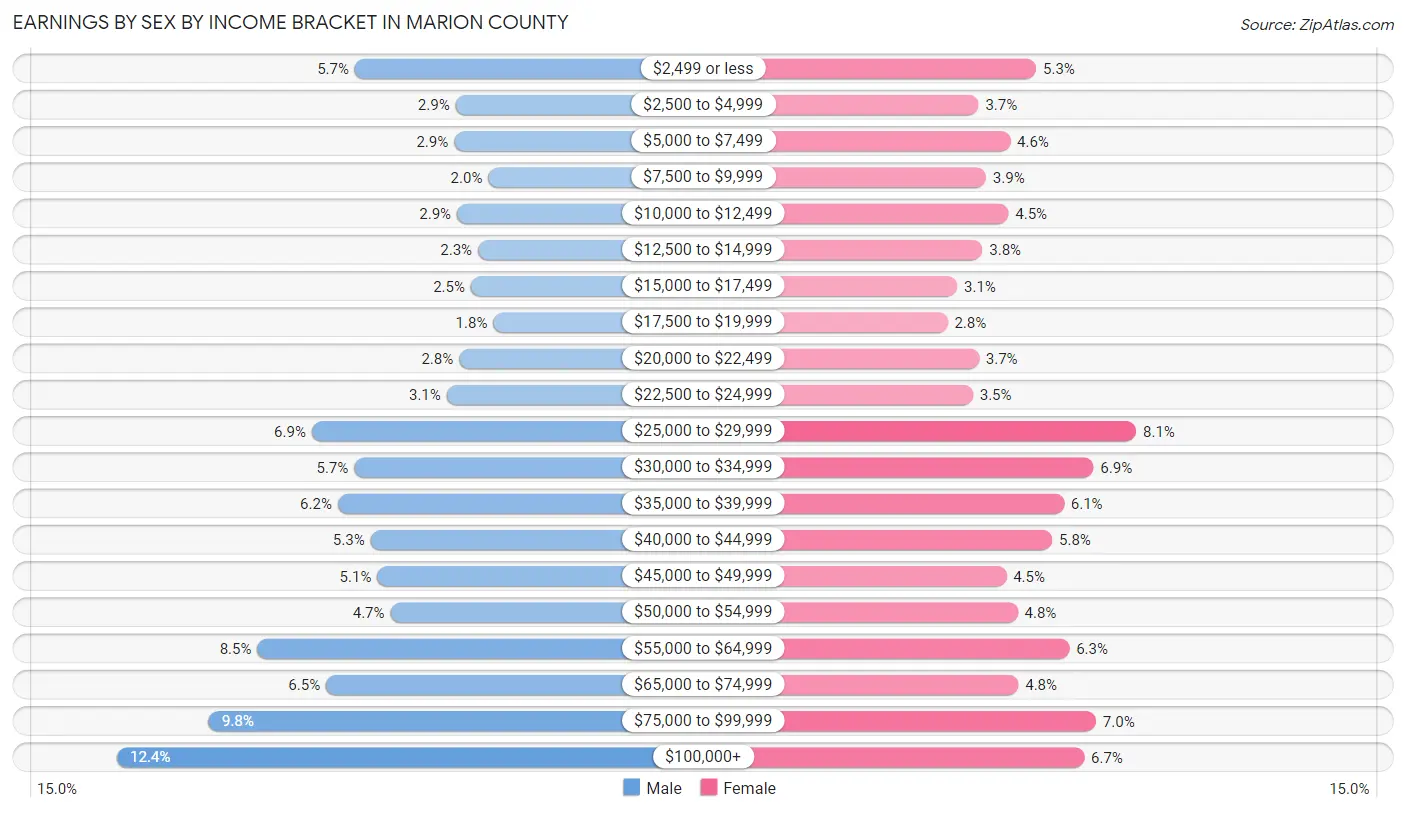
| Income | Male | Female |
| $2,499 or less | 5,413 (5.7%) | 4,408 (5.3%) |
| $2,500 to $4,999 | 2,736 (2.9%) | 3,063 (3.7%) |
| $5,000 to $7,499 | 2,771 (2.9%) | 3,803 (4.6%) |
| $7,500 to $9,999 | 1,864 (2.0%) | 3,235 (3.9%) |
| $10,000 to $12,499 | 2,701 (2.9%) | 3,760 (4.5%) |
| $12,500 to $14,999 | 2,143 (2.3%) | 3,154 (3.8%) |
| $15,000 to $17,499 | 2,331 (2.5%) | 2,563 (3.1%) |
| $17,500 to $19,999 | 1,729 (1.8%) | 2,347 (2.8%) |
| $20,000 to $22,499 | 2,642 (2.8%) | 3,068 (3.7%) |
| $22,500 to $24,999 | 2,972 (3.1%) | 2,927 (3.5%) |
| $25,000 to $29,999 | 6,568 (6.9%) | 6,733 (8.1%) |
| $30,000 to $34,999 | 5,439 (5.7%) | 5,742 (6.9%) |
| $35,000 to $39,999 | 5,875 (6.2%) | 5,050 (6.1%) |
| $40,000 to $44,999 | 4,999 (5.3%) | 4,775 (5.8%) |
| $45,000 to $49,999 | 4,821 (5.1%) | 3,712 (4.5%) |
| $50,000 to $54,999 | 4,472 (4.7%) | 3,972 (4.8%) |
| $55,000 to $64,999 | 8,011 (8.5%) | 5,175 (6.2%) |
| $65,000 to $74,999 | 6,181 (6.5%) | 3,989 (4.8%) |
| $75,000 to $99,999 | 9,301 (9.8%) | 5,797 (7.0%) |
| $100,000+ | 11,743 (12.4%) | 5,525 (6.7%) |
| Total | 94,712 (100.0%) | 82,798 (100.0%) |
Earnings by Sex by Educational Attainment in Marion County
Average earnings in Marion County are $47,983 for men and $37,454 for women, a difference of 21.9%. Men with an educational attainment of graduate degree enjoy the highest average annual earnings of $85,909, while those with less than high school education earn the least with $34,197. Women with an educational attainment of graduate degree earn the most with the average annual earnings of $68,820, while those with less than high school education have the smallest earnings of $25,757.
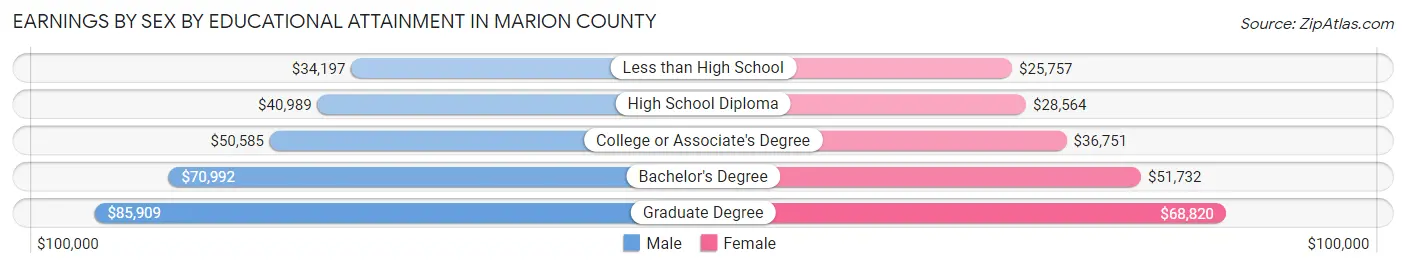
| Educational Attainment | Male Income | Female Income |
| Less than High School | $34,197 | $25,757 |
| High School Diploma | $40,989 | $28,564 |
| College or Associate's Degree | $50,585 | $36,751 |
| Bachelor's Degree | $70,992 | $51,732 |
| Graduate Degree | $85,909 | $68,820 |
| Total | $47,983 | $37,454 |
Family Income in Marion County
Family Income Brackets in Marion County
According to the Marion County family income data, there are 19,122 families falling into the $100,000 to $149,999 income range, which is the most common income bracket and makes up 23.2% of all families. Conversely, the $10,000 to $14,999 income bracket is the least frequent group with only 1,401 families (1.7%) belonging to this category.
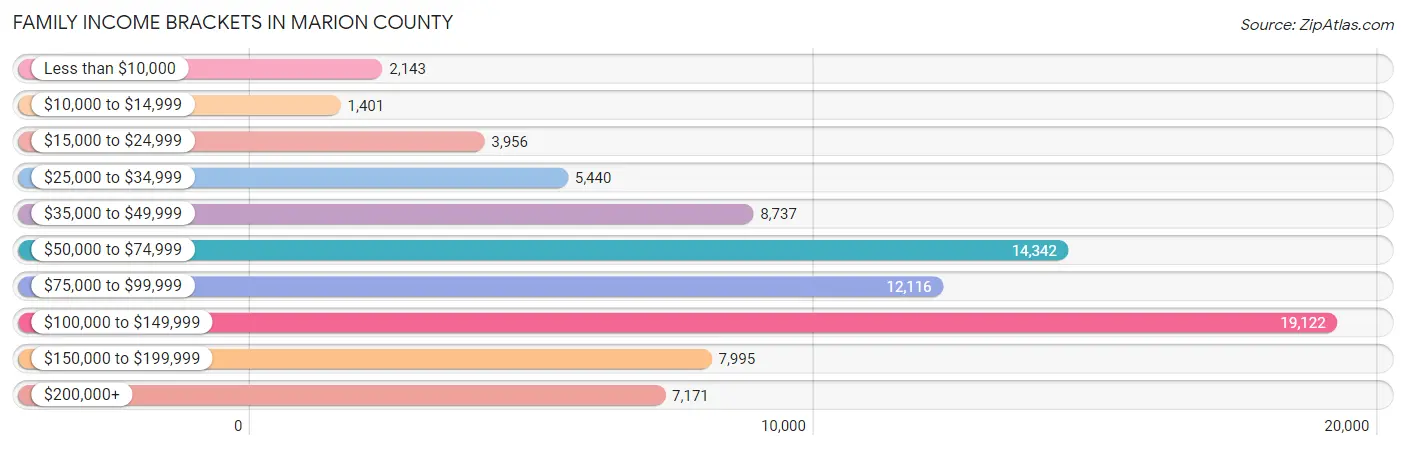
| Income Bracket | # Families | % Families |
| Less than $10,000 | 2,143 | 2.6% |
| $10,000 to $14,999 | 1,401 | 1.7% |
| $15,000 to $24,999 | 3,956 | 4.8% |
| $25,000 to $34,999 | 5,440 | 6.6% |
| $35,000 to $49,999 | 8,737 | 10.6% |
| $50,000 to $74,999 | 14,342 | 17.4% |
| $75,000 to $99,999 | 12,116 | 14.7% |
| $100,000 to $149,999 | 19,122 | 23.2% |
| $150,000 to $199,999 | 7,995 | 9.7% |
| $200,000+ | 7,171 | 8.7% |
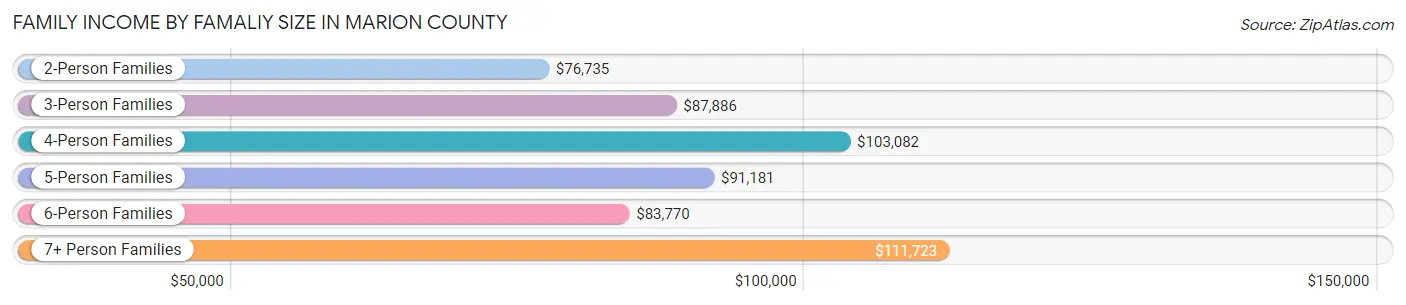
Family Income by Famaliy Size in Marion County
7+ person families (2,001 | 2.4%) account for the highest median family income in Marion County with $111,723 per family, while 2-person families (37,534 | 45.5%) have the highest median income of $38,368 per family member.
| Income Bracket | # Families | Median Income |
| 2-Person Families | 37,534 (45.5%) | $76,735 |
| 3-Person Families | 17,401 (21.1%) | $87,886 |
| 4-Person Families | 13,542 (16.4%) | $103,082 |
| 5-Person Families | 8,127 (9.9%) | $91,181 |
| 6-Person Families | 3,819 (4.6%) | $83,770 |
| 7+ Person Families | 2,001 (2.4%) | $111,723 |
| Total | 82,424 (100.0%) | $84,296 |
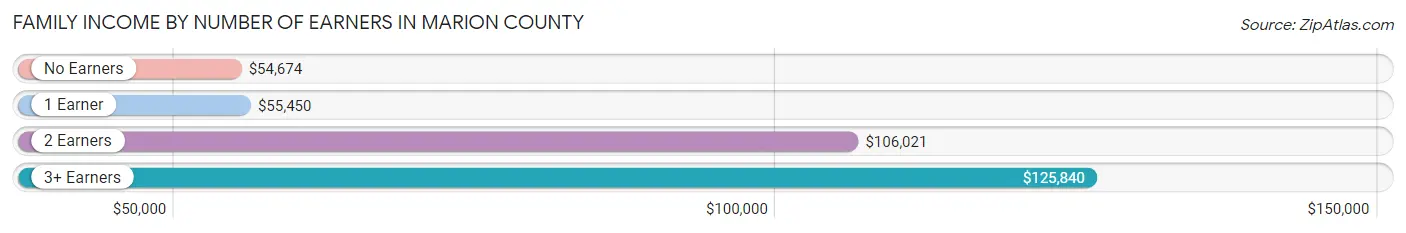
Family Income by Number of Earners in Marion County
The median family income in Marion County is $84,296, with families comprising 3+ earners (9,816) having the highest median family income of $125,840, while families with no earners (12,178) have the lowest median family income of $54,674, accounting for 11.9% and 14.8% of families, respectively.
| Number of Earners | # Families | Median Income |
| No Earners | 12,178 (14.8%) | $54,674 |
| 1 Earner | 26,768 (32.5%) | $55,450 |
| 2 Earners | 33,662 (40.8%) | $106,021 |
| 3+ Earners | 9,816 (11.9%) | $125,840 |
| Total | 82,424 (100.0%) | $84,296 |
Household Income in Marion County
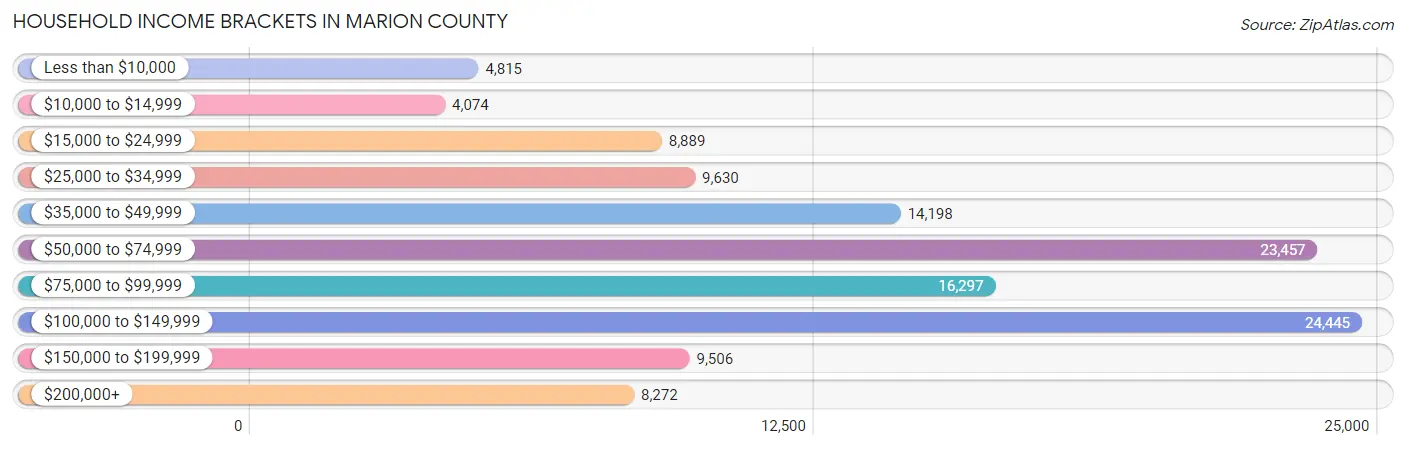
Household Income Brackets in Marion County
With 24,445 households falling in the category, the $100,000 to $149,999 income range is the most frequent in Marion County, accounting for 19.8% of all households. In contrast, only 4,074 households (3.3%) fall into the $10,000 to $14,999 income bracket, making it the least populous group.
| Income Bracket | # Households | % Households |
| Less than $10,000 | 4,815 | 3.9% |
| $10,000 to $14,999 | 4,074 | 3.3% |
| $15,000 to $24,999 | 8,889 | 7.2% |
| $25,000 to $34,999 | 9,630 | 7.8% |
| $35,000 to $49,999 | 14,198 | 11.5% |
| $50,000 to $74,999 | 23,457 | 19.0% |
| $75,000 to $99,999 | 16,297 | 13.2% |
| $100,000 to $149,999 | 24,445 | 19.8% |
| $150,000 to $199,999 | 9,506 | 7.7% |
| $200,000+ | 8,272 | 6.7% |
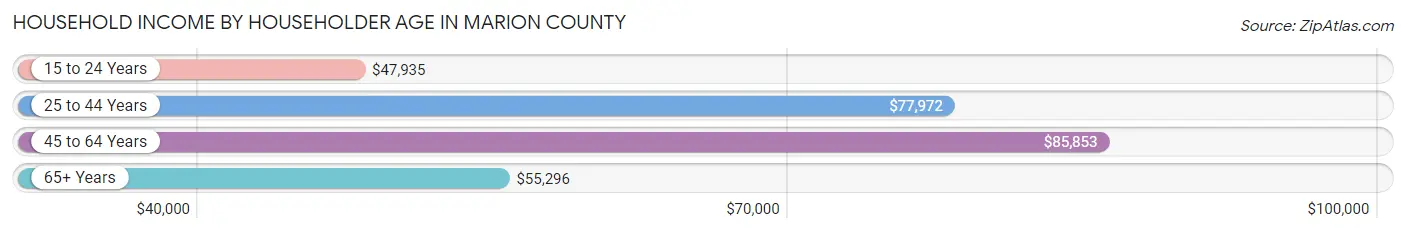
Household Income by Householder Age in Marion County
The median household income in Marion County is $70,926, with the highest median household income of $85,853 found in the 45 to 64 years age bracket for the primary householder. A total of 43,283 households (35.1%) fall into this category. Meanwhile, the 15 to 24 years age bracket for the primary householder has the lowest median household income of $47,935, with 5,238 households (4.2%) in this group.
| Income Bracket | # Households | Median Income |
| 15 to 24 Years | 5,238 (4.2%) | $47,935 |
| 25 to 44 Years | 40,941 (33.2%) | $77,972 |
| 45 to 64 Years | 43,283 (35.1%) | $85,853 |
| 65+ Years | 33,998 (27.5%) | $55,296 |
| Total | 123,460 (100.0%) | $70,926 |
Poverty in Marion County
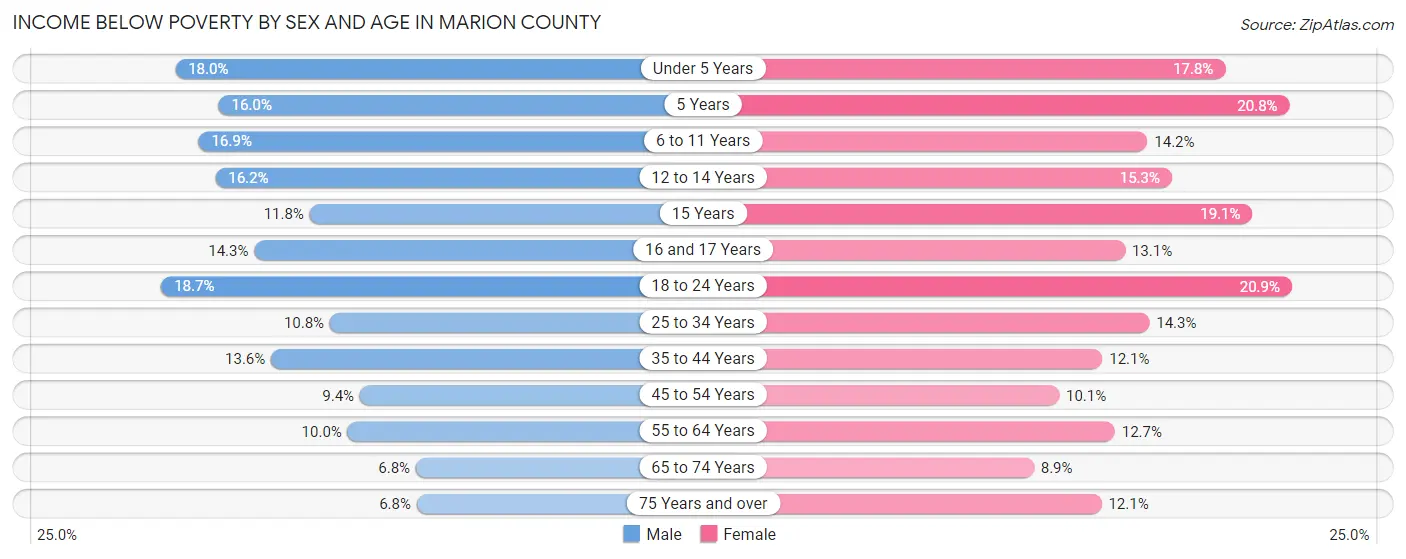
Income Below Poverty by Sex and Age in Marion County
With 12.5% poverty level for males and 13.5% for females among the residents of Marion County, 18 to 24 year old males and 18 to 24 year old females are the most vulnerable to poverty, with 2,915 males (18.7%) and 3,092 females (20.9%) in their respective age groups living below the poverty level.
| Age Bracket | Male | Female |
| Under 5 Years | 1,894 (18.0%) | 1,785 (17.8%) |
| 5 Years | 414 (16.0%) | 380 (20.8%) |
| 6 to 11 Years | 2,352 (16.9%) | 1,849 (14.2%) |
| 12 to 14 Years | 1,185 (16.2%) | 1,145 (15.3%) |
| 15 Years | 307 (11.8%) | 411 (19.1%) |
| 16 and 17 Years | 679 (14.3%) | 614 (13.1%) |
| 18 to 24 Years | 2,915 (18.7%) | 3,092 (20.9%) |
| 25 to 34 Years | 2,594 (10.8%) | 3,297 (14.3%) |
| 35 to 44 Years | 3,003 (13.6%) | 2,641 (12.1%) |
| 45 to 54 Years | 1,872 (9.4%) | 1,951 (10.1%) |
| 55 to 64 Years | 1,950 (10.0%) | 2,607 (12.7%) |
| 65 to 74 Years | 1,044 (6.8%) | 1,593 (8.9%) |
| 75 Years and over | 610 (6.8%) | 1,479 (12.0%) |
| Total | 20,819 (12.5%) | 22,844 (13.5%) |
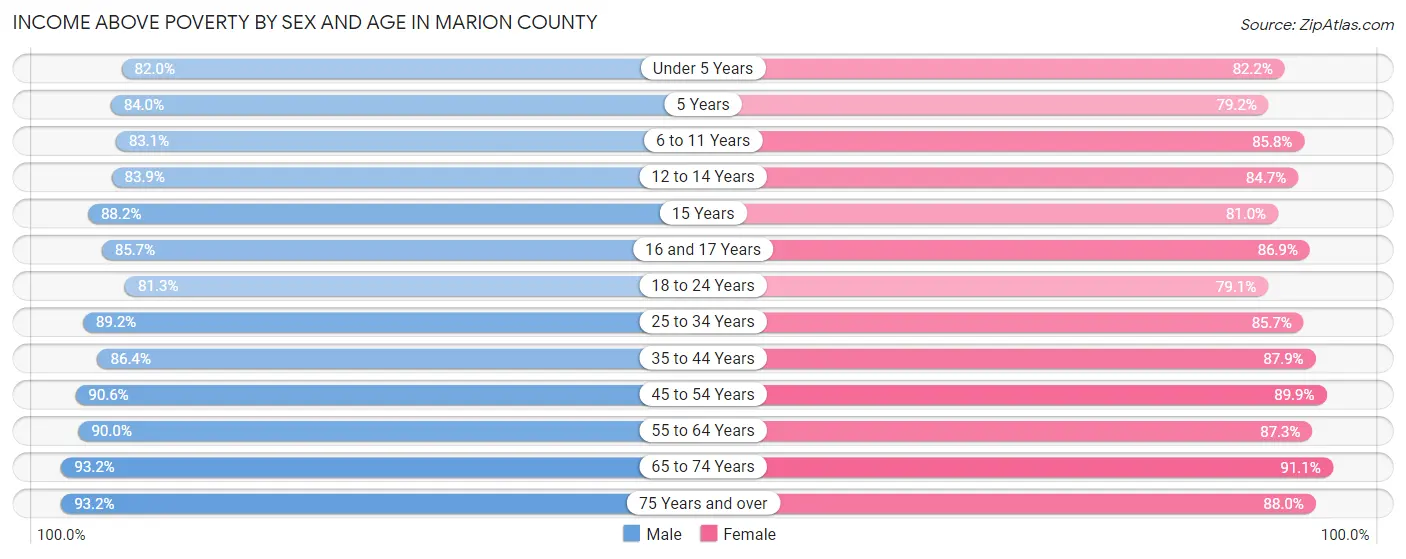
Income Above Poverty by Sex and Age in Marion County
According to the poverty statistics in Marion County, males aged 75 years and over and females aged 65 to 74 years are the age groups that are most secure financially, with 93.2% of males and 91.1% of females in these age groups living above the poverty line.
| Age Bracket | Male | Female |
| Under 5 Years | 8,625 (82.0%) | 8,250 (82.2%) |
| 5 Years | 2,173 (84.0%) | 1,450 (79.2%) |
| 6 to 11 Years | 11,538 (83.1%) | 11,192 (85.8%) |
| 12 to 14 Years | 6,154 (83.9%) | 6,332 (84.7%) |
| 15 Years | 2,302 (88.2%) | 1,747 (80.9%) |
| 16 and 17 Years | 4,057 (85.7%) | 4,057 (86.9%) |
| 18 to 24 Years | 12,708 (81.3%) | 11,715 (79.1%) |
| 25 to 34 Years | 21,353 (89.2%) | 19,800 (85.7%) |
| 35 to 44 Years | 19,142 (86.4%) | 19,200 (87.9%) |
| 45 to 54 Years | 17,967 (90.6%) | 17,404 (89.9%) |
| 55 to 64 Years | 17,532 (90.0%) | 17,970 (87.3%) |
| 65 to 74 Years | 14,227 (93.2%) | 16,281 (91.1%) |
| 75 Years and over | 8,366 (93.2%) | 10,798 (87.9%) |
| Total | 146,144 (87.5%) | 146,196 (86.5%) |
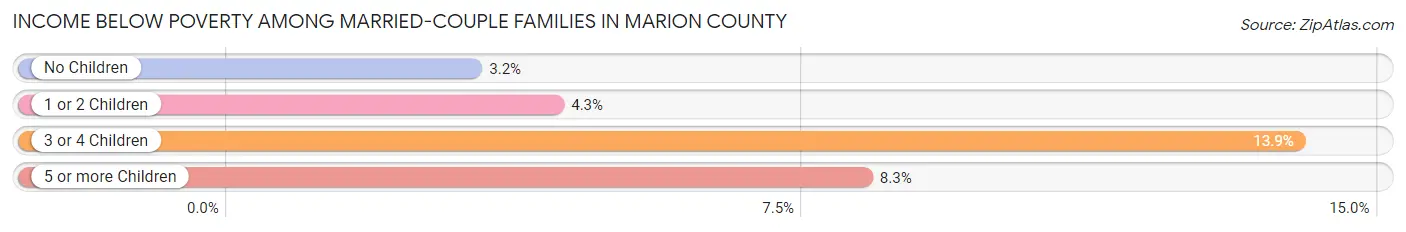
Income Below Poverty Among Married-Couple Families in Marion County
The poverty statistics for married-couple families in Marion County show that 4.8% or 2,848 of the total 59,285 families live below the poverty line. Families with 3 or 4 children have the highest poverty rate of 13.9%, comprising of 941 families. On the other hand, families with no children have the lowest poverty rate of 3.2%, which includes 1,069 families.
| Children | Above Poverty | Below Poverty |
| No Children | 32,459 (96.8%) | 1,069 (3.2%) |
| 1 or 2 Children | 17,517 (95.7%) | 779 (4.3%) |
| 3 or 4 Children | 5,808 (86.1%) | 941 (13.9%) |
| 5 or more Children | 653 (91.7%) | 59 (8.3%) |
| Total | 56,437 (95.2%) | 2,848 (4.8%) |
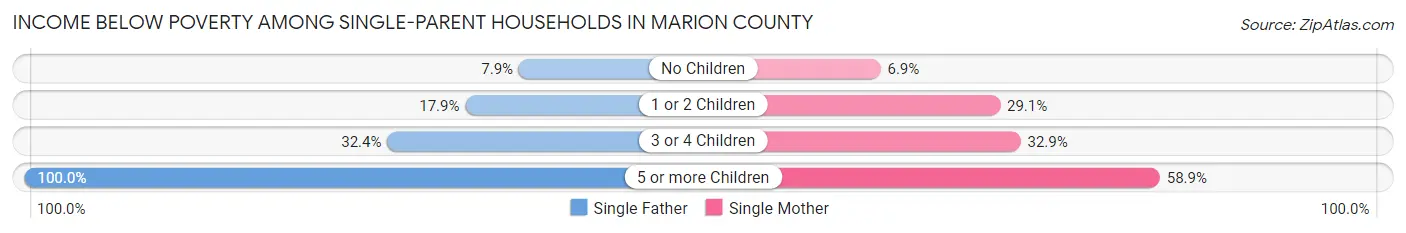
Income Below Poverty Among Single-Parent Households in Marion County
According to the poverty data in Marion County, 17.5% or 1,314 single-father households and 20.7% or 3,236 single-mother households are living below the poverty line. Among single-father households, those with 5 or more children have the highest poverty rate, with 80 households (100.0%) experiencing poverty. Likewise, among single-mother households, those with 5 or more children have the highest poverty rate, with 53 households (58.9%) falling below the poverty line.
| Children | Single Father | Single Mother |
| No Children | 212 (7.9%) | 430 (6.9%) |
| 1 or 2 Children | 648 (17.9%) | 2,277 (29.1%) |
| 3 or 4 Children | 374 (32.4%) | 476 (32.9%) |
| 5 or more Children | 80 (100.0%) | 53 (58.9%) |
| Total | 1,314 (17.5%) | 3,236 (20.7%) |
Income Below Poverty Among Married-Couple vs Single-Parent Households in Marion County
The poverty data for Marion County shows that 2,848 of the married-couple family households (4.8%) and 4,550 of the single-parent households (19.7%) are living below the poverty level. Within the married-couple family households, those with 3 or 4 children have the highest poverty rate, with 941 households (13.9%) falling below the poverty line. Among the single-parent households, those with 5 or more children have the highest poverty rate, with 133 household (78.2%) living below poverty.
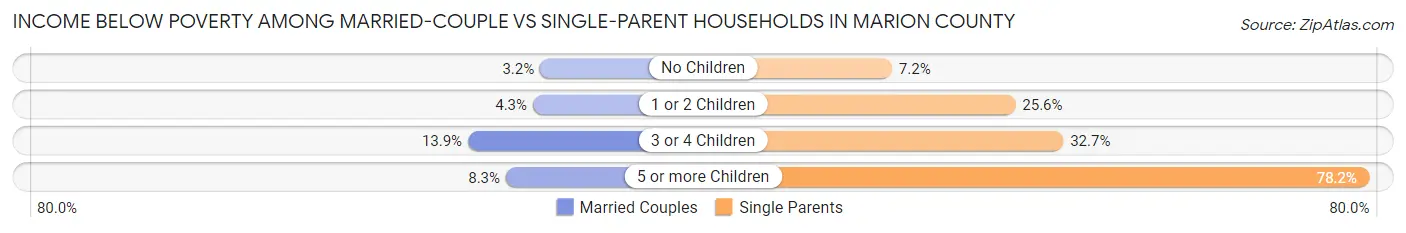
| Children | Married-Couple Families | Single-Parent Households |
| No Children | 1,069 (3.2%) | 642 (7.2%) |
| 1 or 2 Children | 779 (4.3%) | 2,925 (25.6%) |
| 3 or 4 Children | 941 (13.9%) | 850 (32.7%) |
| 5 or more Children | 59 (8.3%) | 133 (78.2%) |
| Total | 2,848 (4.8%) | 4,550 (19.7%) |
Employment Characteristics in Marion County
Employment by Class of Employer in Marion County
Among the 155,647 employed individuals in Marion County, private company employees (102,178 | 65.6%), state government employees (14,684 | 9.4%), and not-for-profit organizations (12,022 | 7.7%) make up the most common classes of employment.
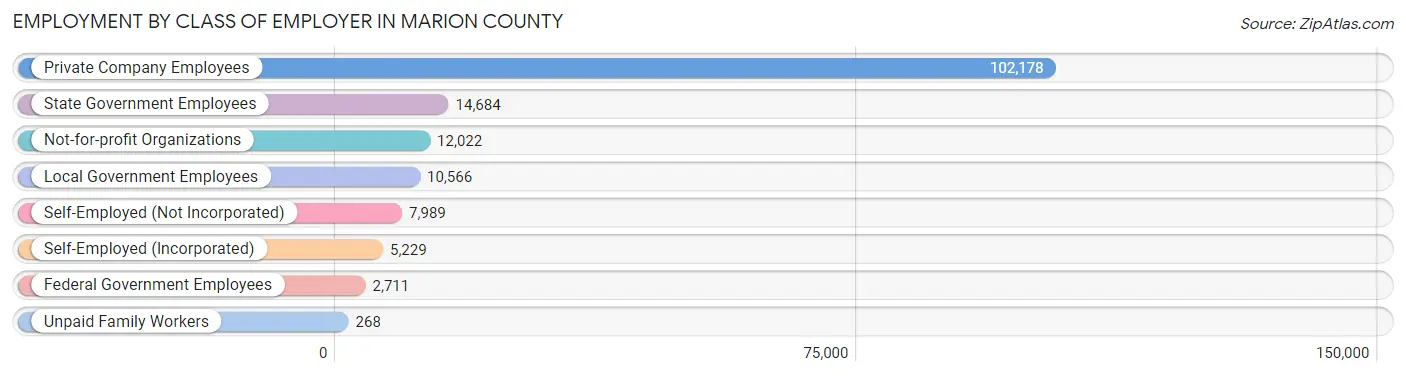
| Employer Class | # Employees | % Employees |
| Private Company Employees | 102,178 | 65.6% |
| Self-Employed (Incorporated) | 5,229 | 3.4% |
| Self-Employed (Not Incorporated) | 7,989 | 5.1% |
| Not-for-profit Organizations | 12,022 | 7.7% |
| Local Government Employees | 10,566 | 6.8% |
| State Government Employees | 14,684 | 9.4% |
| Federal Government Employees | 2,711 | 1.7% |
| Unpaid Family Workers | 268 | 0.2% |
| Total | 155,647 | 100.0% |
Employment Status by Age in Marion County
According to the labor force statistics for Marion County, out of the total population over 16 years of age (272,513), 61.5% or 167,595 individuals are in the labor force, with 5.4% or 9,050 of them unemployed. The age group with the highest labor force participation rate is 30 to 34 years, with 82.2% or 19,799 individuals in the labor force. Within the labor force, the 16 to 19 years age range has the highest percentage of unemployed individuals, with 16.9% or 1,293 of them being unemployed.
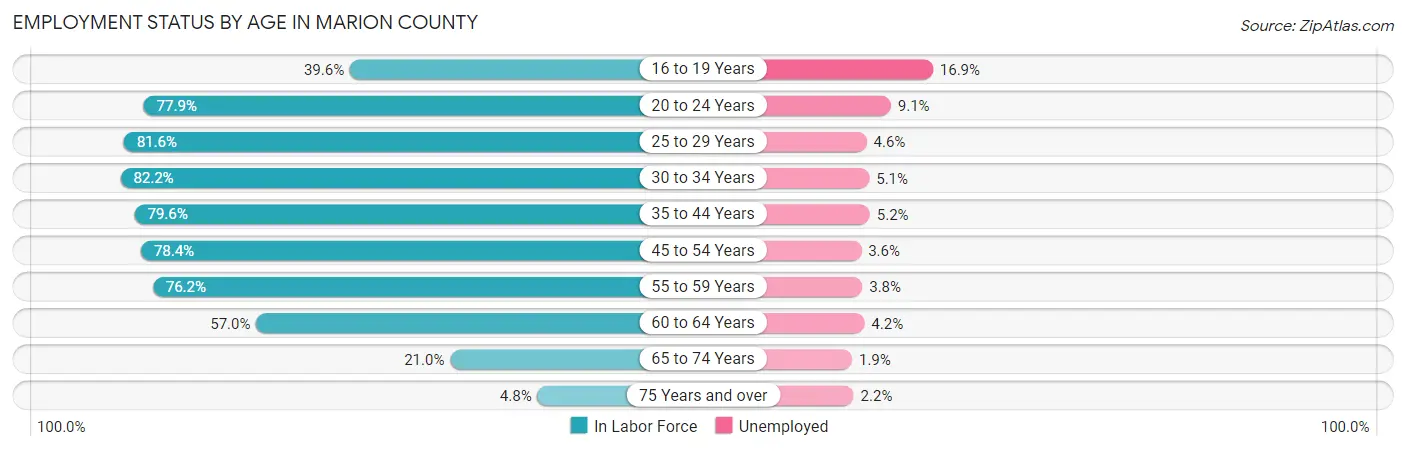
| Age Bracket | In Labor Force | Unemployed |
| 16 to 19 Years | 7,652 (39.6%) | 1,293 (16.9%) |
| 20 to 24 Years | 18,007 (77.9%) | 1,639 (9.1%) |
| 25 to 29 Years | 19,803 (81.6%) | 911 (4.6%) |
| 30 to 34 Years | 19,799 (82.2%) | 1,010 (5.1%) |
| 35 to 44 Years | 36,005 (79.6%) | 1,872 (5.2%) |
| 45 to 54 Years | 31,406 (78.4%) | 1,131 (3.6%) |
| 55 to 59 Years | 14,727 (76.2%) | 560 (3.8%) |
| 60 to 64 Years | 12,106 (57.0%) | 508 (4.2%) |
| 65 to 74 Years | 7,068 (21.0%) | 134 (1.9%) |
| 75 Years and over | 1,066 (4.8%) | 23 (2.2%) |
| Total | 167,595 (61.5%) | 9,050 (5.4%) |
Employment Status by Educational Attainment in Marion County
According to labor force statistics for Marion County, 76.8% of individuals (133,793) out of the total population between 25 and 64 years of age (174,210) are in the labor force, with 4.5% or 6,021 of them being unemployed. The group with the highest labor force participation rate are those with the educational attainment of bachelor's degree or higher, with 85.8% or 36,050 individuals in the labor force. Within the labor force, individuals with high school diploma education have the highest percentage of unemployment, with 6.0% or 1,944 of them being unemployed.
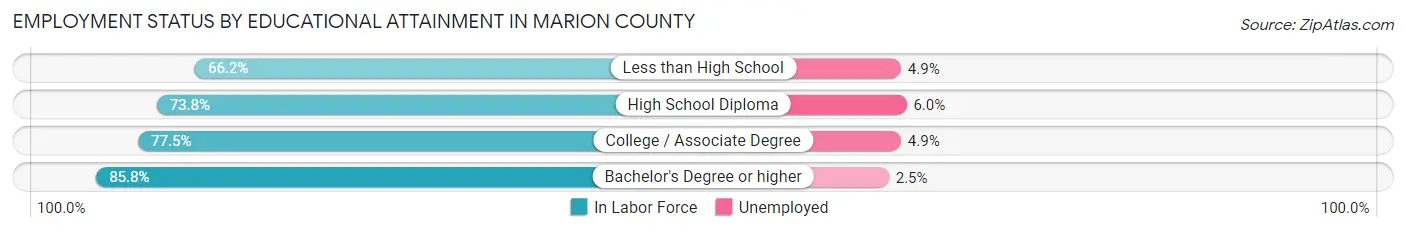
| Educational Attainment | In Labor Force | Unemployed |
| Less than High School | 17,862 (66.2%) | 1,322 (4.9%) |
| High School Diploma | 32,392 (73.8%) | 2,634 (6.0%) |
| College / Associate Degree | 47,523 (77.5%) | 3,005 (4.9%) |
| Bachelor's Degree or higher | 36,050 (85.8%) | 1,050 (2.5%) |
| Total | 133,793 (76.8%) | 7,839 (4.5%) |
Employment Occupations by Sex in Marion County
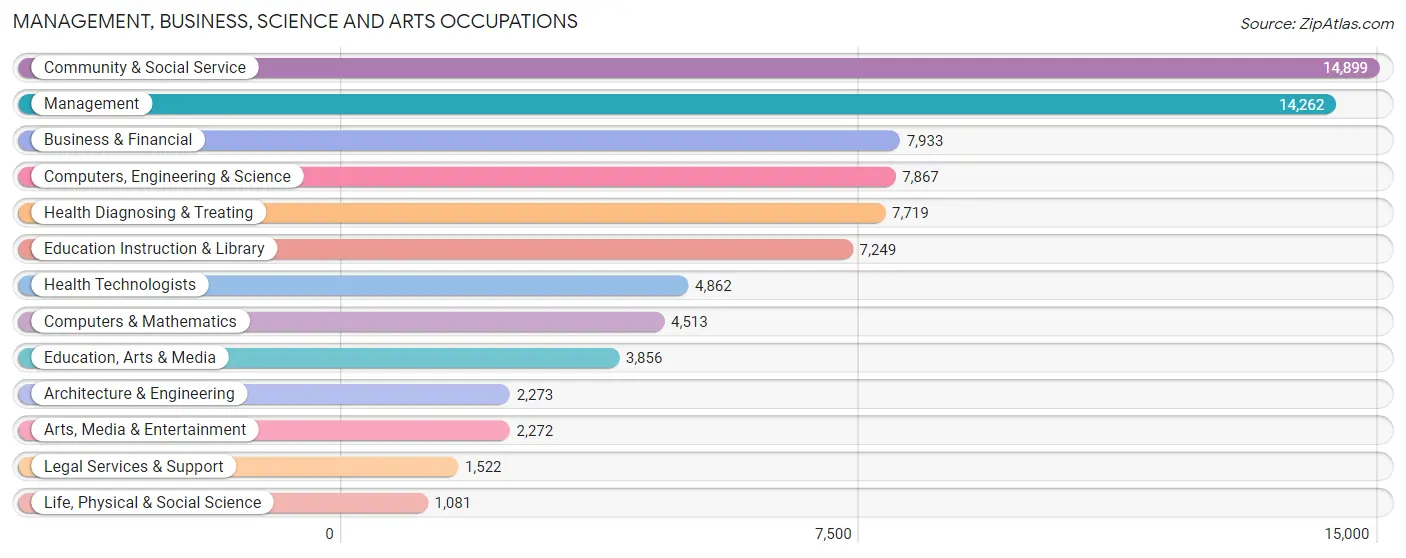
Management, Business, Science and Arts Occupations
The most common Management, Business, Science and Arts occupations in Marion County are Community & Social Service (14,899 | 9.4%), Management (14,262 | 9.0%), Business & Financial (7,933 | 5.0%), Computers, Engineering & Science (7,867 | 5.0%), and Health Diagnosing & Treating (7,719 | 4.9%).
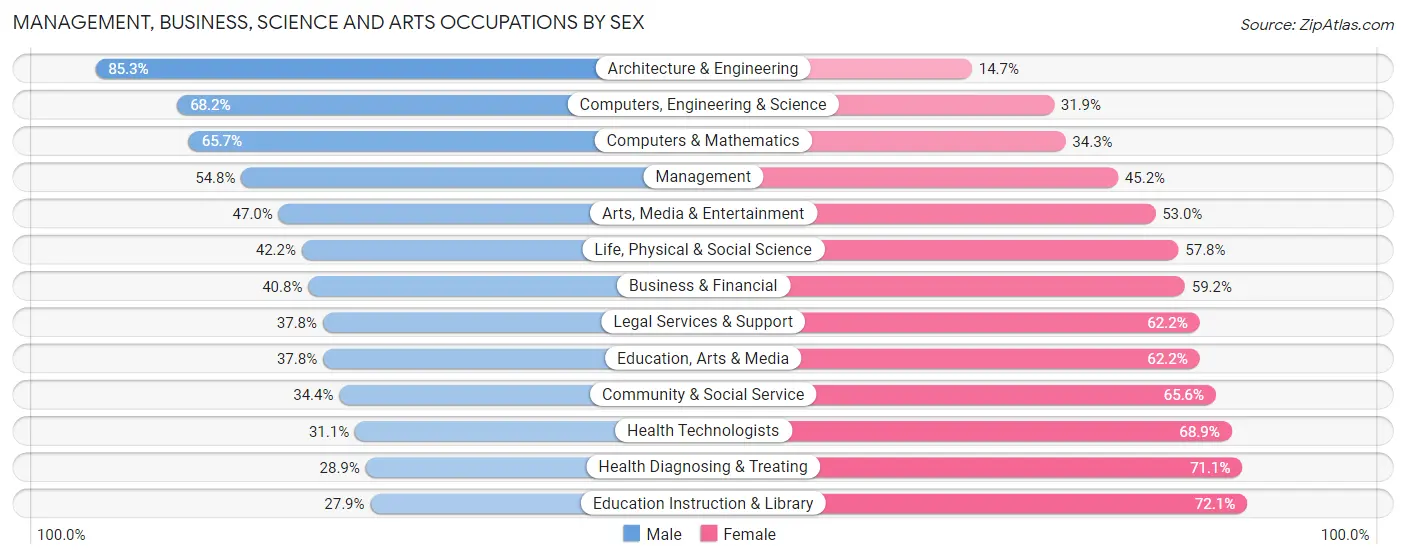
Management, Business, Science and Arts Occupations by Sex
Within the Management, Business, Science and Arts occupations in Marion County, the most male-oriented occupations are Architecture & Engineering (85.3%), Computers, Engineering & Science (68.1%), and Computers & Mathematics (65.7%), while the most female-oriented occupations are Education Instruction & Library (72.1%), Health Diagnosing & Treating (71.1%), and Health Technologists (68.9%).
| Occupation | Male | Female |
| Management | 7,814 (54.8%) | 6,448 (45.2%) |
| Business & Financial | 3,239 (40.8%) | 4,694 (59.2%) |
| Computers, Engineering & Science | 5,361 (68.1%) | 2,506 (31.9%) |
| Computers & Mathematics | 2,967 (65.7%) | 1,546 (34.3%) |
| Architecture & Engineering | 1,938 (85.3%) | 335 (14.7%) |
| Life, Physical & Social Science | 456 (42.2%) | 625 (57.8%) |
| Community & Social Service | 5,119 (34.4%) | 9,780 (65.6%) |
| Education, Arts & Media | 1,456 (37.8%) | 2,400 (62.2%) |
| Legal Services & Support | 575 (37.8%) | 947 (62.2%) |
| Education Instruction & Library | 2,020 (27.9%) | 5,229 (72.1%) |
| Arts, Media & Entertainment | 1,068 (47.0%) | 1,204 (53.0%) |
| Health Diagnosing & Treating | 2,228 (28.9%) | 5,491 (71.1%) |
| Health Technologists | 1,511 (31.1%) | 3,351 (68.9%) |
| Total (Category) | 23,761 (45.1%) | 28,919 (54.9%) |
| Total (Overall) | 84,063 (53.1%) | 74,102 (46.9%) |
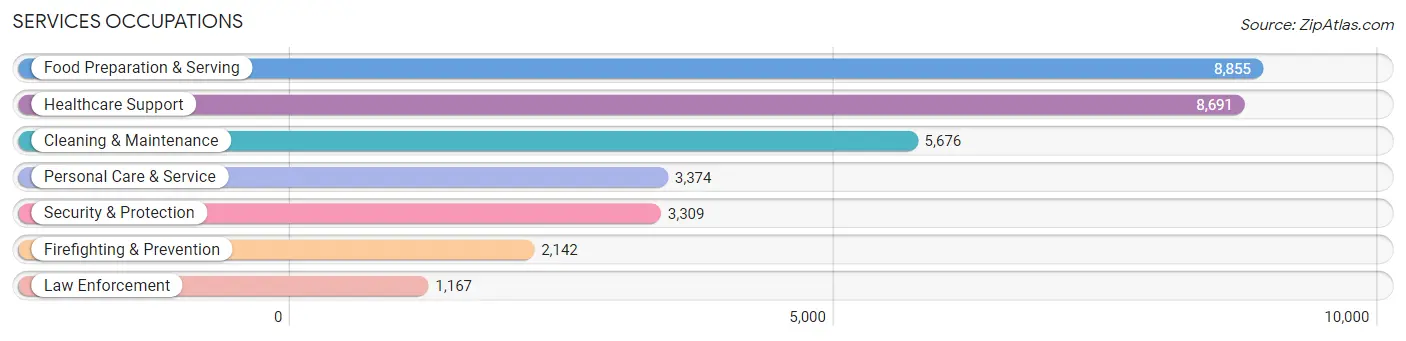
Services Occupations
The most common Services occupations in Marion County are Food Preparation & Serving (8,855 | 5.6%), Healthcare Support (8,691 | 5.5%), Cleaning & Maintenance (5,676 | 3.6%), Personal Care & Service (3,374 | 2.1%), and Security & Protection (3,309 | 2.1%).
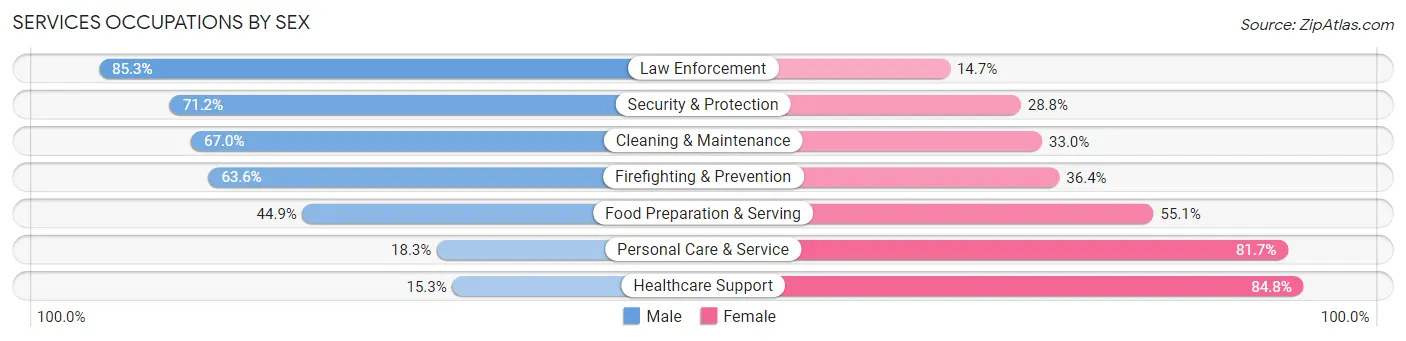
Services Occupations by Sex
Within the Services occupations in Marion County, the most male-oriented occupations are Law Enforcement (85.3%), Security & Protection (71.2%), and Cleaning & Maintenance (67.0%), while the most female-oriented occupations are Healthcare Support (84.8%), Personal Care & Service (81.7%), and Food Preparation & Serving (55.1%).
| Occupation | Male | Female |
| Healthcare Support | 1,325 (15.2%) | 7,366 (84.8%) |
| Security & Protection | 2,357 (71.2%) | 952 (28.8%) |
| Firefighting & Prevention | 1,362 (63.6%) | 780 (36.4%) |
| Law Enforcement | 995 (85.3%) | 172 (14.7%) |
| Food Preparation & Serving | 3,979 (44.9%) | 4,876 (55.1%) |
| Cleaning & Maintenance | 3,804 (67.0%) | 1,872 (33.0%) |
| Personal Care & Service | 618 (18.3%) | 2,756 (81.7%) |
| Total (Category) | 12,083 (40.4%) | 17,822 (59.6%) |
| Total (Overall) | 84,063 (53.1%) | 74,102 (46.9%) |
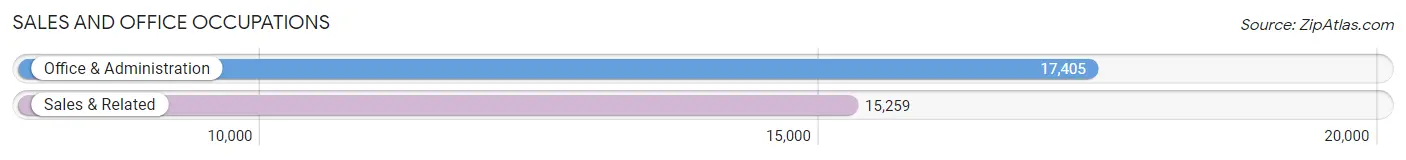
Sales and Office Occupations
The most common Sales and Office occupations in Marion County are Office & Administration (17,405 | 11.0%), and Sales & Related (15,259 | 9.7%).
Sales and Office Occupations by Sex
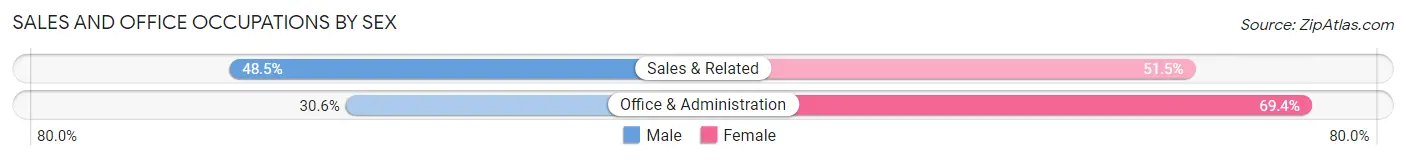
| Occupation | Male | Female |
| Sales & Related | 7,401 (48.5%) | 7,858 (51.5%) |
| Office & Administration | 5,328 (30.6%) | 12,077 (69.4%) |
| Total (Category) | 12,729 (39.0%) | 19,935 (61.0%) |
| Total (Overall) | 84,063 (53.1%) | 74,102 (46.9%) |
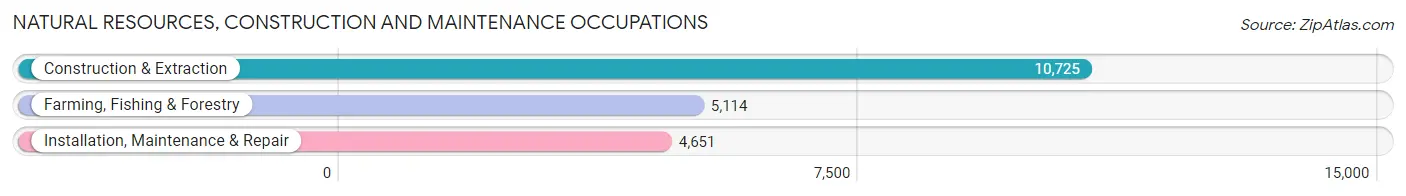
Natural Resources, Construction and Maintenance Occupations
The most common Natural Resources, Construction and Maintenance occupations in Marion County are Construction & Extraction (10,725 | 6.8%), Farming, Fishing & Forestry (5,114 | 3.2%), and Installation, Maintenance & Repair (4,651 | 2.9%).
Natural Resources, Construction and Maintenance Occupations by Sex
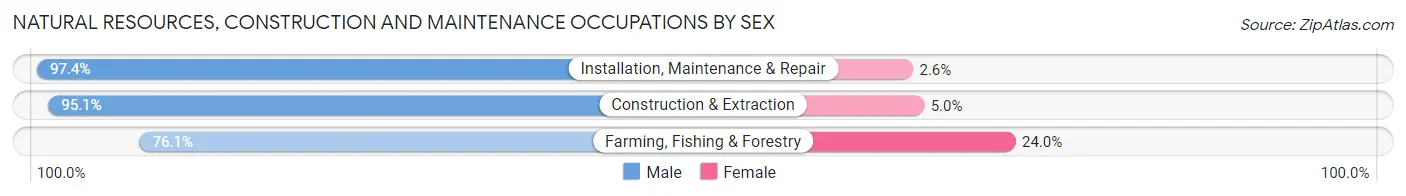
| Occupation | Male | Female |
| Farming, Fishing & Forestry | 3,889 (76.0%) | 1,225 (23.9%) |
| Construction & Extraction | 10,194 (95.1%) | 531 (5.0%) |
| Installation, Maintenance & Repair | 4,529 (97.4%) | 122 (2.6%) |
| Total (Category) | 18,612 (90.8%) | 1,878 (9.2%) |
| Total (Overall) | 84,063 (53.1%) | 74,102 (46.9%) |
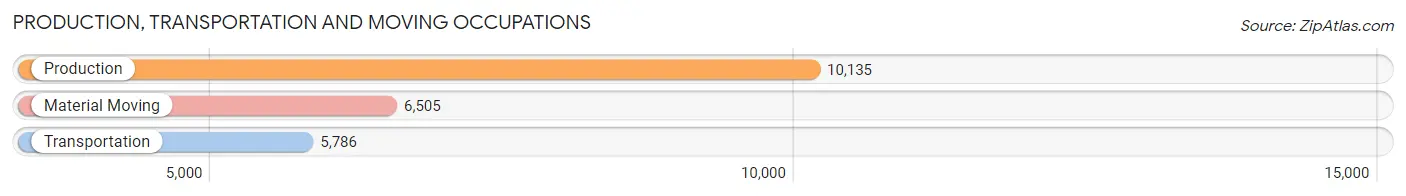
Production, Transportation and Moving Occupations
The most common Production, Transportation and Moving occupations in Marion County are Production (10,135 | 6.4%), Material Moving (6,505 | 4.1%), and Transportation (5,786 | 3.7%).
Production, Transportation and Moving Occupations by Sex
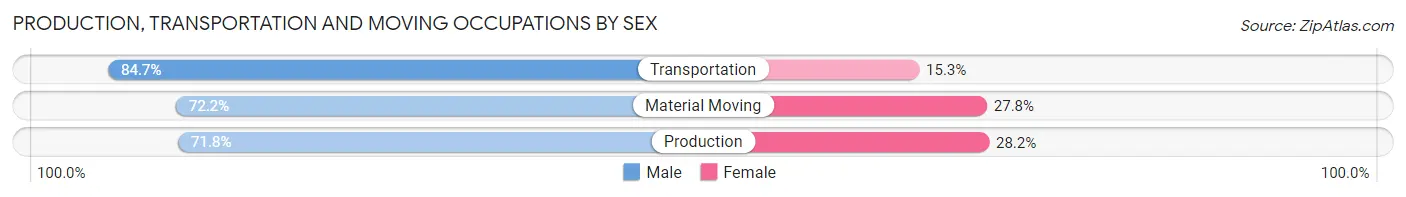
| Occupation | Male | Female |
| Production | 7,280 (71.8%) | 2,855 (28.2%) |
| Transportation | 4,899 (84.7%) | 887 (15.3%) |
| Material Moving | 4,699 (72.2%) | 1,806 (27.8%) |
| Total (Category) | 16,878 (75.3%) | 5,548 (24.7%) |
| Total (Overall) | 84,063 (53.1%) | 74,102 (46.9%) |
Employment Industries by Sex in Marion County
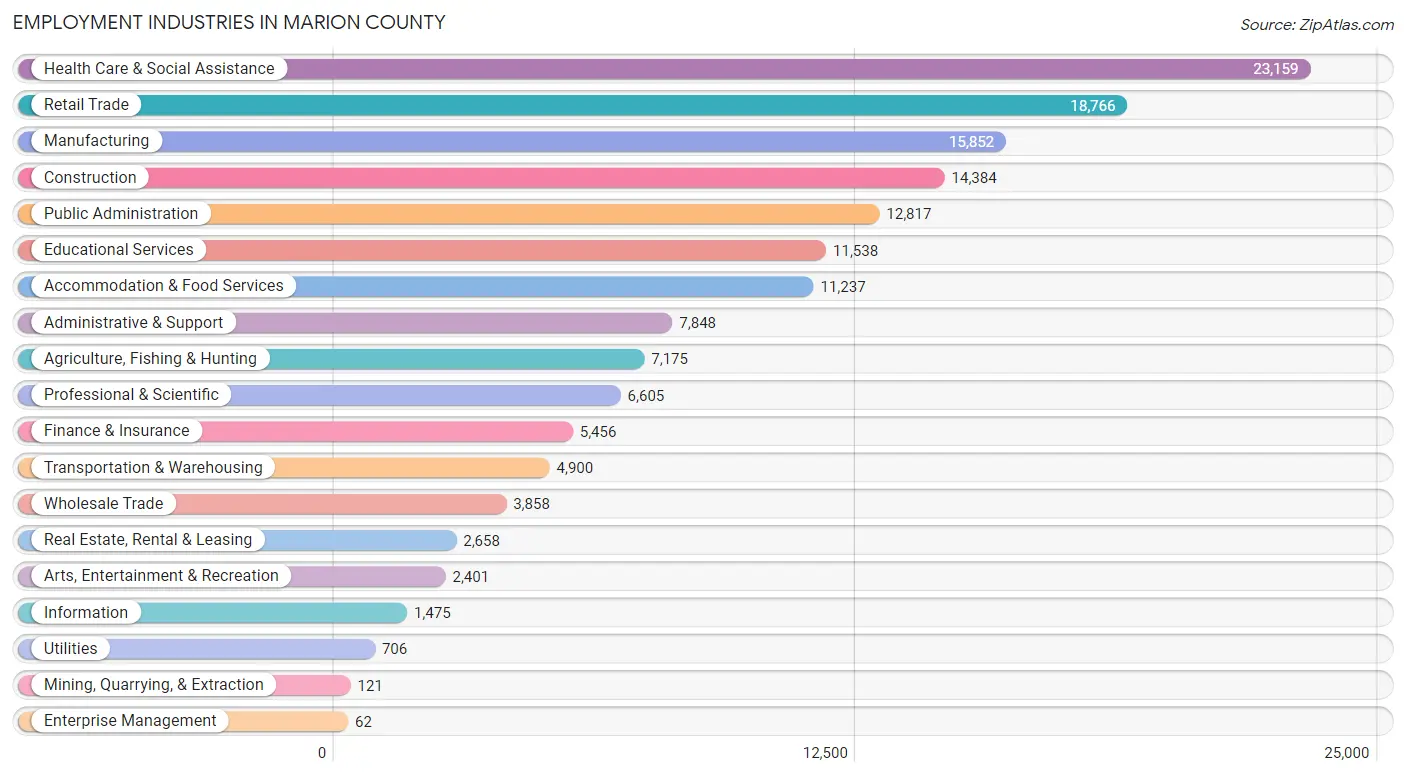
Employment Industries in Marion County
The major employment industries in Marion County include Health Care & Social Assistance (23,159 | 14.6%), Retail Trade (18,766 | 11.9%), Manufacturing (15,852 | 10.0%), Construction (14,384 | 9.1%), and Public Administration (12,817 | 8.1%).
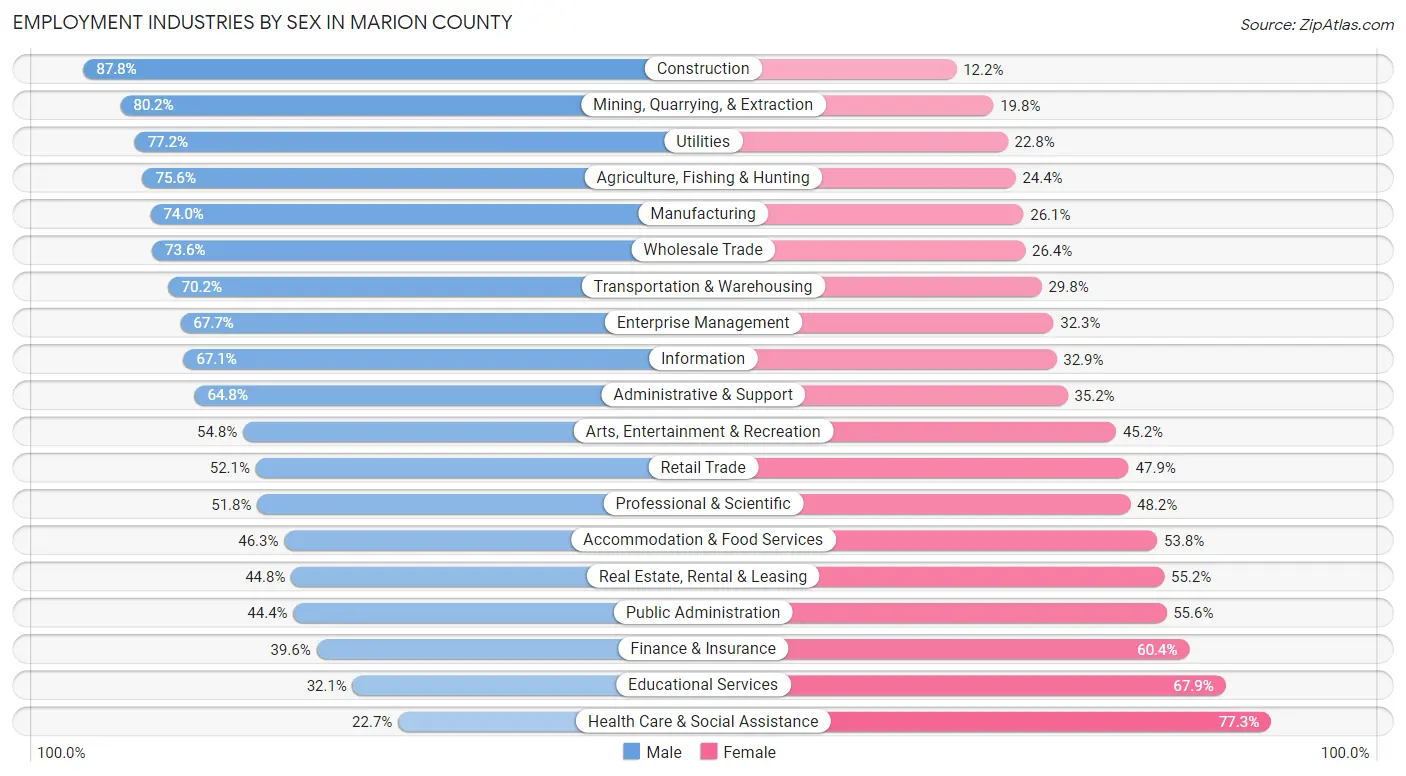
Employment Industries by Sex in Marion County
The Marion County industries that see more men than women are Construction (87.8%), Mining, Quarrying, & Extraction (80.2%), and Utilities (77.2%), whereas the industries that tend to have a higher number of women are Health Care & Social Assistance (77.3%), Educational Services (67.9%), and Finance & Insurance (60.4%).
| Industry | Male | Female |
| Agriculture, Fishing & Hunting | 5,422 (75.6%) | 1,753 (24.4%) |
| Mining, Quarrying, & Extraction | 97 (80.2%) | 24 (19.8%) |
| Construction | 12,634 (87.8%) | 1,750 (12.2%) |
| Manufacturing | 11,723 (74.0%) | 4,129 (26.1%) |
| Wholesale Trade | 2,839 (73.6%) | 1,019 (26.4%) |
| Retail Trade | 9,784 (52.1%) | 8,982 (47.9%) |
| Transportation & Warehousing | 3,439 (70.2%) | 1,461 (29.8%) |
| Utilities | 545 (77.2%) | 161 (22.8%) |
| Information | 990 (67.1%) | 485 (32.9%) |
| Finance & Insurance | 2,160 (39.6%) | 3,296 (60.4%) |
| Real Estate, Rental & Leasing | 1,191 (44.8%) | 1,467 (55.2%) |
| Professional & Scientific | 3,424 (51.8%) | 3,181 (48.2%) |
| Enterprise Management | 42 (67.7%) | 20 (32.3%) |
| Administrative & Support | 5,086 (64.8%) | 2,762 (35.2%) |
| Educational Services | 3,703 (32.1%) | 7,835 (67.9%) |
| Health Care & Social Assistance | 5,252 (22.7%) | 17,907 (77.3%) |
| Arts, Entertainment & Recreation | 1,315 (54.8%) | 1,086 (45.2%) |
| Accommodation & Food Services | 5,197 (46.3%) | 6,040 (53.7%) |
| Public Administration | 5,685 (44.4%) | 7,132 (55.6%) |
| Total | 84,063 (53.1%) | 74,102 (46.9%) |
Education in Marion County
School Enrollment in Marion County
The most common levels of schooling among the 80,364 students in Marion County are middle school (18,969 | 23.6%), high school (18,766 | 23.4%), and elementary school (18,019 | 22.4%).
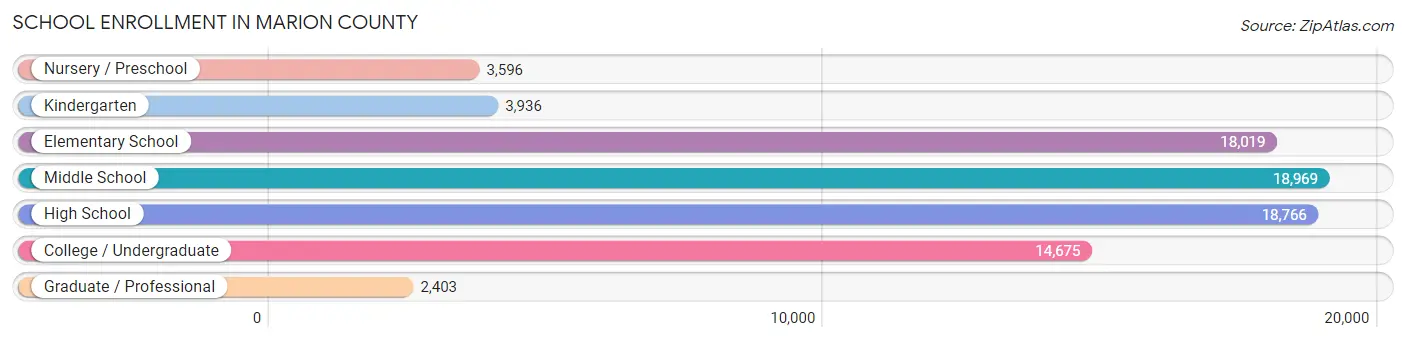
| School Level | # Students | % Students |
| Nursery / Preschool | 3,596 | 4.5% |
| Kindergarten | 3,936 | 4.9% |
| Elementary School | 18,019 | 22.4% |
| Middle School | 18,969 | 23.6% |
| High School | 18,766 | 23.4% |
| College / Undergraduate | 14,675 | 18.3% |
| Graduate / Professional | 2,403 | 3.0% |
| Total | 80,364 | 100.0% |
School Enrollment by Age by Funding Source in Marion County
Out of a total of 80,364 students who are enrolled in schools in Marion County, 11,894 (14.8%) attend a private institution, while the remaining 68,470 (85.2%) are enrolled in public schools. The age group of 3 to 4 year olds has the highest likelihood of being enrolled in private schools, with 1,036 (38.3% in the age bracket) enrolled. Conversely, the age group of 15 to 17 year olds has the lowest likelihood of being enrolled in a private school, with 12,844 (94.2% in the age bracket) attending a public institution.
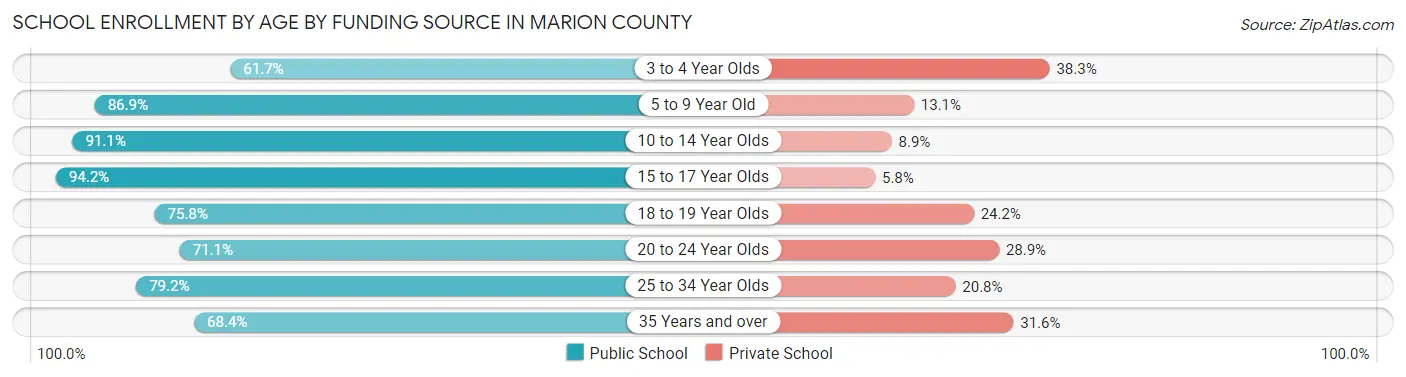
| Age Bracket | Public School | Private School |
| 3 to 4 Year Olds | 1,666 (61.7%) | 1,036 (38.3%) |
| 5 to 9 Year Old | 17,832 (86.9%) | 2,682 (13.1%) |
| 10 to 14 Year Olds | 21,537 (91.1%) | 2,112 (8.9%) |
| 15 to 17 Year Olds | 12,844 (94.2%) | 797 (5.8%) |
| 18 to 19 Year Olds | 4,225 (75.8%) | 1,350 (24.2%) |
| 20 to 24 Year Olds | 4,556 (71.1%) | 1,854 (28.9%) |
| 25 to 34 Year Olds | 3,062 (79.2%) | 804 (20.8%) |
| 35 Years and over | 2,741 (68.4%) | 1,266 (31.6%) |
| Total | 68,470 (85.2%) | 11,894 (14.8%) |
Educational Attainment by Field of Study in Marion County
Business (9,790 | 15.5%), education (7,675 | 12.2%), science & technology (6,216 | 9.9%), social sciences (5,808 | 9.2%), and bio, nature & agricultural (5,506 | 8.7%) are the most common fields of study among 62,981 individuals in Marion County who have obtained a bachelor's degree or higher.
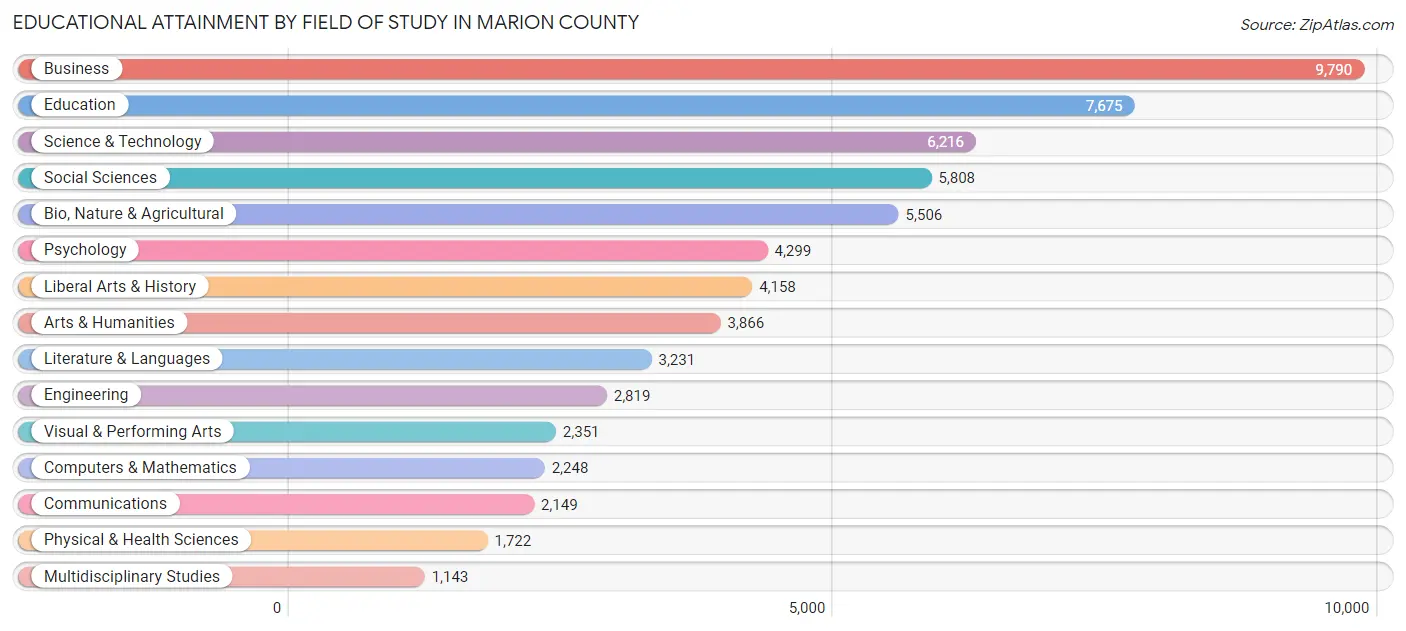
| Field of Study | # Graduates | % Graduates |
| Computers & Mathematics | 2,248 | 3.6% |
| Bio, Nature & Agricultural | 5,506 | 8.7% |
| Physical & Health Sciences | 1,722 | 2.7% |
| Psychology | 4,299 | 6.8% |
| Social Sciences | 5,808 | 9.2% |
| Engineering | 2,819 | 4.5% |
| Multidisciplinary Studies | 1,143 | 1.8% |
| Science & Technology | 6,216 | 9.9% |
| Business | 9,790 | 15.5% |
| Education | 7,675 | 12.2% |
| Literature & Languages | 3,231 | 5.1% |
| Liberal Arts & History | 4,158 | 6.6% |
| Visual & Performing Arts | 2,351 | 3.7% |
| Communications | 2,149 | 3.4% |
| Arts & Humanities | 3,866 | 6.1% |
| Total | 62,981 | 100.0% |
Transportation & Commute in Marion County
Vehicle Availability by Sex in Marion County
The most prevalent vehicle ownership categories in Marion County are males with 2 vehicles (32,961, accounting for 39.9%) and females with 2 vehicles (28,779, making up 45.9%).
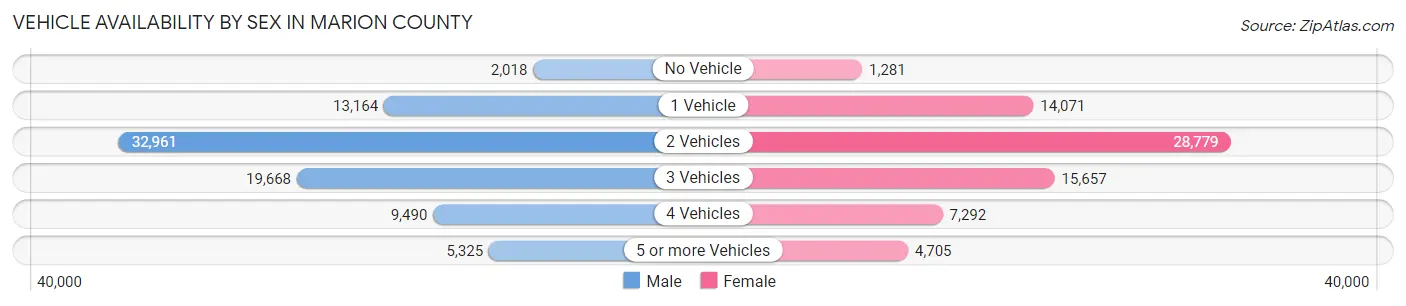
| Vehicles Available | Male | Female |
| No Vehicle | 2,018 (2.4%) | 1,281 (1.8%) |
| 1 Vehicle | 13,164 (15.9%) | 14,071 (19.6%) |
| 2 Vehicles | 32,961 (39.9%) | 28,779 (40.1%) |
| 3 Vehicles | 19,668 (23.8%) | 15,657 (21.8%) |
| 4 Vehicles | 9,490 (11.5%) | 7,292 (10.2%) |
| 5 or more Vehicles | 5,325 (6.4%) | 4,705 (6.6%) |
| Total | 82,626 (100.0%) | 71,785 (100.0%) |
Commute Time in Marion County
The most frequently occuring commute durations in Marion County are 15 to 19 minutes (25,704 commuters, 18.4%), 10 to 14 minutes (21,457 commuters, 15.4%), and 20 to 24 minutes (20,799 commuters, 14.9%).
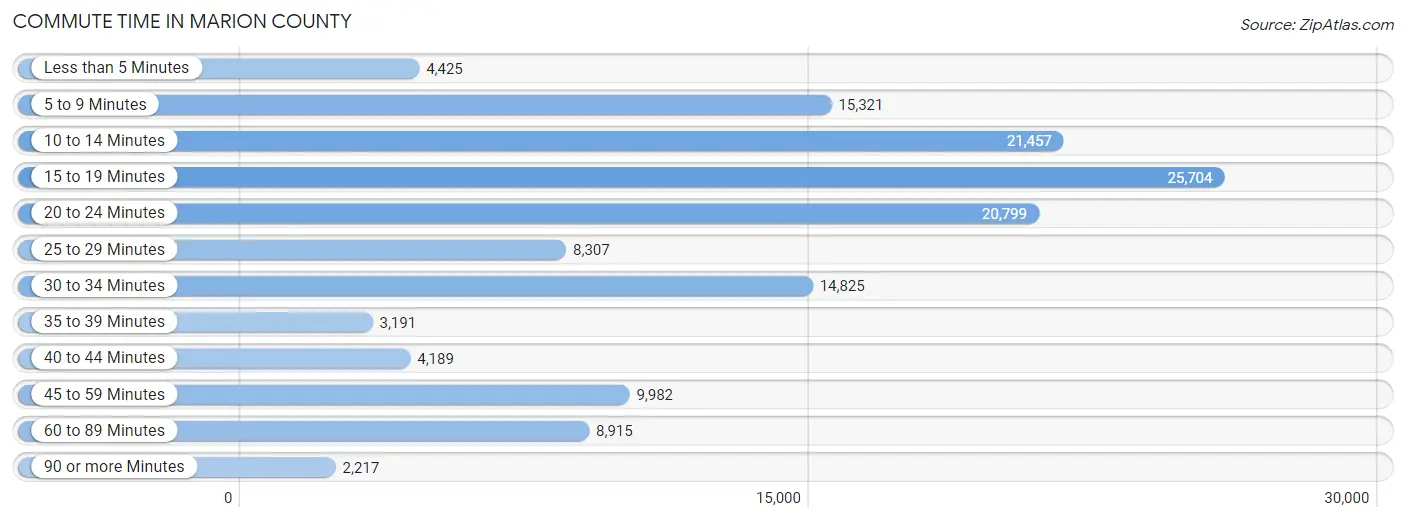
| Commute Time | # Commuters | % Commuters |
| Less than 5 Minutes | 4,425 | 3.2% |
| 5 to 9 Minutes | 15,321 | 11.0% |
| 10 to 14 Minutes | 21,457 | 15.4% |
| 15 to 19 Minutes | 25,704 | 18.4% |
| 20 to 24 Minutes | 20,799 | 14.9% |
| 25 to 29 Minutes | 8,307 | 6.0% |
| 30 to 34 Minutes | 14,825 | 10.6% |
| 35 to 39 Minutes | 3,191 | 2.3% |
| 40 to 44 Minutes | 4,189 | 3.0% |
| 45 to 59 Minutes | 9,982 | 7.2% |
| 60 to 89 Minutes | 8,915 | 6.4% |
| 90 or more Minutes | 2,217 | 1.6% |
Commute Time by Sex in Marion County
The most common commute times in Marion County are 15 to 19 minutes (13,448 commuters, 17.7%) for males and 15 to 19 minutes (12,256 commuters, 19.4%) for females.
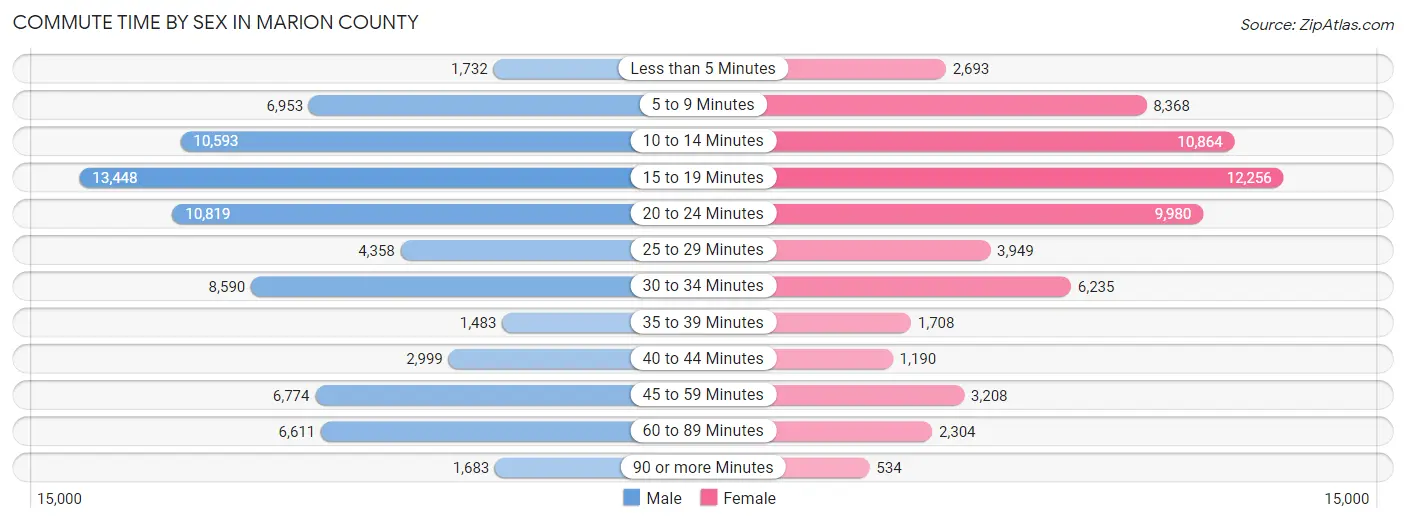
| Commute Time | Male | Female |
| Less than 5 Minutes | 1,732 (2.3%) | 2,693 (4.3%) |
| 5 to 9 Minutes | 6,953 (9.1%) | 8,368 (13.2%) |
| 10 to 14 Minutes | 10,593 (13.9%) | 10,864 (17.2%) |
| 15 to 19 Minutes | 13,448 (17.7%) | 12,256 (19.4%) |
| 20 to 24 Minutes | 10,819 (14.2%) | 9,980 (15.8%) |
| 25 to 29 Minutes | 4,358 (5.7%) | 3,949 (6.2%) |
| 30 to 34 Minutes | 8,590 (11.3%) | 6,235 (9.9%) |
| 35 to 39 Minutes | 1,483 (1.9%) | 1,708 (2.7%) |
| 40 to 44 Minutes | 2,999 (3.9%) | 1,190 (1.9%) |
| 45 to 59 Minutes | 6,774 (8.9%) | 3,208 (5.1%) |
| 60 to 89 Minutes | 6,611 (8.7%) | 2,304 (3.6%) |
| 90 or more Minutes | 1,683 (2.2%) | 534 (0.8%) |
Time of Departure to Work by Sex in Marion County
The most frequent times of departure to work in Marion County are 6:00 AM to 6:29 AM (9,827, 12.9%) for males and 7:00 AM to 7:29 AM (10,367, 16.4%) for females.
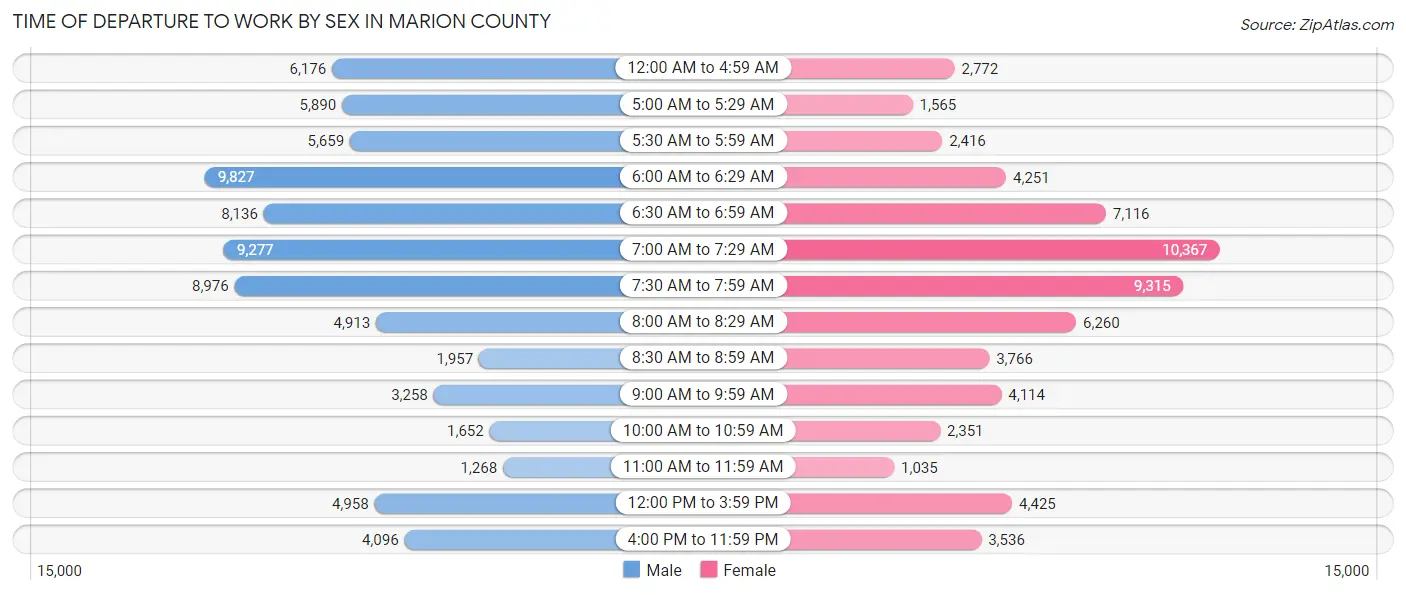
| Time of Departure | Male | Female |
| 12:00 AM to 4:59 AM | 6,176 (8.1%) | 2,772 (4.4%) |
| 5:00 AM to 5:29 AM | 5,890 (7.7%) | 1,565 (2.5%) |
| 5:30 AM to 5:59 AM | 5,659 (7.4%) | 2,416 (3.8%) |
| 6:00 AM to 6:29 AM | 9,827 (12.9%) | 4,251 (6.7%) |
| 6:30 AM to 6:59 AM | 8,136 (10.7%) | 7,116 (11.2%) |
| 7:00 AM to 7:29 AM | 9,277 (12.2%) | 10,367 (16.4%) |
| 7:30 AM to 7:59 AM | 8,976 (11.8%) | 9,315 (14.7%) |
| 8:00 AM to 8:29 AM | 4,913 (6.5%) | 6,260 (9.9%) |
| 8:30 AM to 8:59 AM | 1,957 (2.6%) | 3,766 (5.9%) |
| 9:00 AM to 9:59 AM | 3,258 (4.3%) | 4,114 (6.5%) |
| 10:00 AM to 10:59 AM | 1,652 (2.2%) | 2,351 (3.7%) |
| 11:00 AM to 11:59 AM | 1,268 (1.7%) | 1,035 (1.6%) |
| 12:00 PM to 3:59 PM | 4,958 (6.5%) | 4,425 (7.0%) |
| 4:00 PM to 11:59 PM | 4,096 (5.4%) | 3,536 (5.6%) |
| Total | 76,043 (100.0%) | 63,289 (100.0%) |
Housing Occupancy in Marion County
Occupancy by Ownership in Marion County
Of the total 123,460 dwellings in Marion County, owner-occupied units account for 76,274 (61.8%), while renter-occupied units make up 47,186 (38.2%).
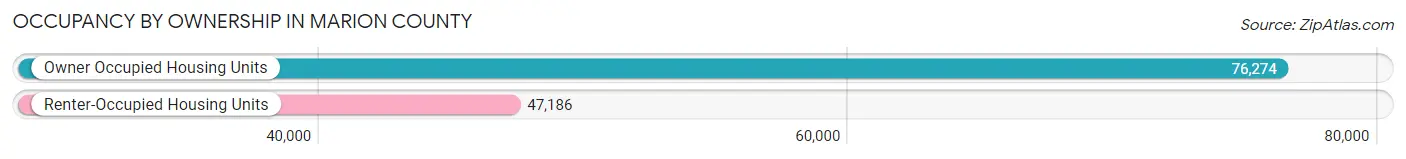
| Occupancy | # Housing Units | % Housing Units |
| Owner Occupied Housing Units | 76,274 | 61.8% |
| Renter-Occupied Housing Units | 47,186 | 38.2% |
| Total Occupied Housing Units | 123,460 | 100.0% |
Occupancy by Household Size in Marion County
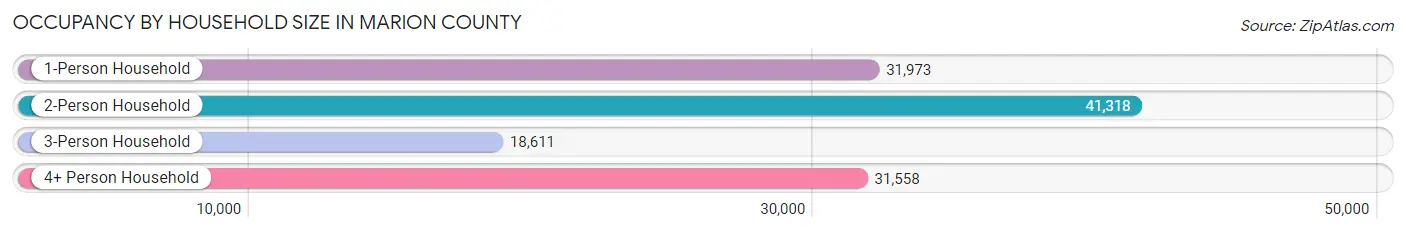
| Household Size | # Housing Units | % Housing Units |
| 1-Person Household | 31,973 | 25.9% |
| 2-Person Household | 41,318 | 33.5% |
| 3-Person Household | 18,611 | 15.1% |
| 4+ Person Household | 31,558 | 25.6% |
| Total Housing Units | 123,460 | 100.0% |
Occupancy by Ownership by Household Size in Marion County
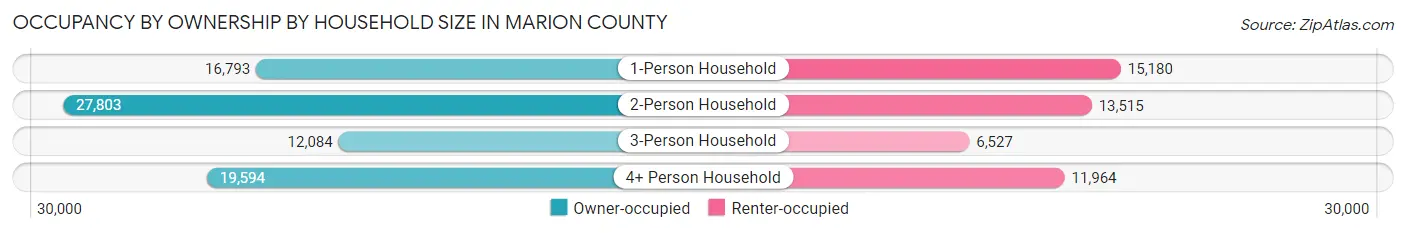
| Household Size | Owner-occupied | Renter-occupied |
| 1-Person Household | 16,793 (52.5%) | 15,180 (47.5%) |
| 2-Person Household | 27,803 (67.3%) | 13,515 (32.7%) |
| 3-Person Household | 12,084 (64.9%) | 6,527 (35.1%) |
| 4+ Person Household | 19,594 (62.1%) | 11,964 (37.9%) |
| Total Housing Units | 76,274 (61.8%) | 47,186 (38.2%) |
Occupancy by Educational Attainment in Marion County
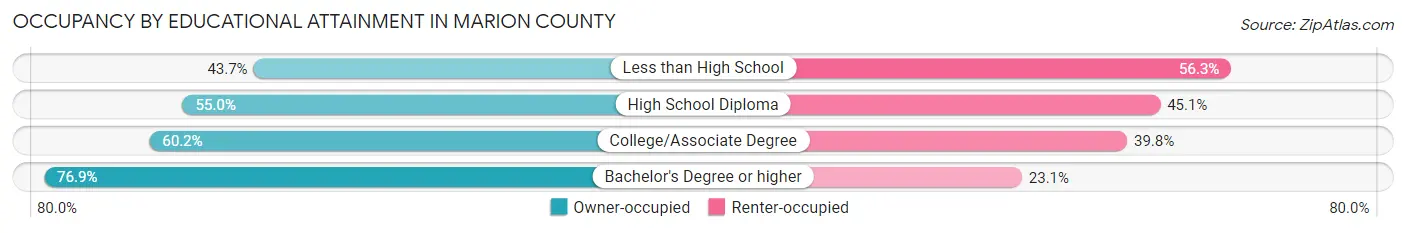
| Household Size | Owner-occupied | Renter-occupied |
| Less than High School | 6,145 (43.7%) | 7,917 (56.3%) |
| High School Diploma | 15,246 (54.9%) | 12,501 (45.1%) |
| College/Associate Degree | 28,518 (60.2%) | 18,844 (39.8%) |
| Bachelor's Degree or higher | 26,365 (76.9%) | 7,924 (23.1%) |
Occupancy by Age of Householder in Marion County
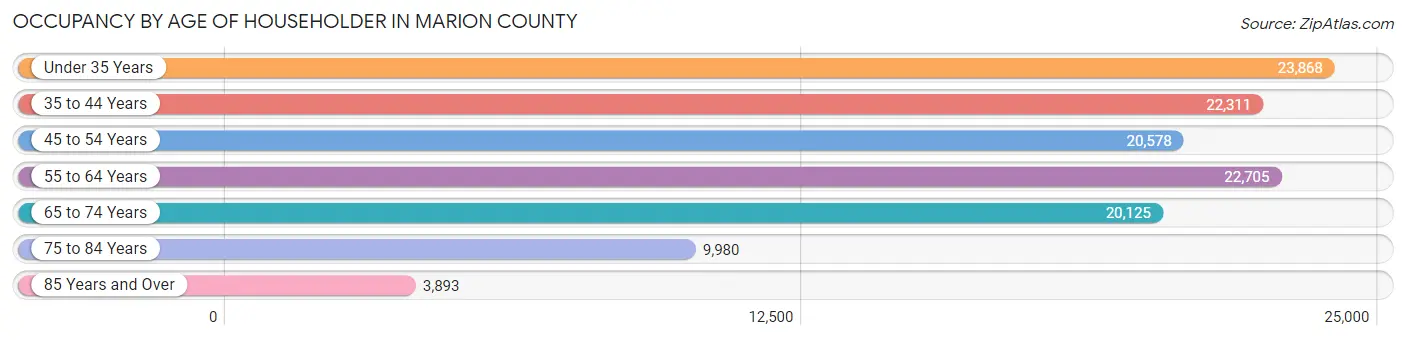
| Age Bracket | # Households | % Households |
| Under 35 Years | 23,868 | 19.3% |
| 35 to 44 Years | 22,311 | 18.1% |
| 45 to 54 Years | 20,578 | 16.7% |
| 55 to 64 Years | 22,705 | 18.4% |
| 65 to 74 Years | 20,125 | 16.3% |
| 75 to 84 Years | 9,980 | 8.1% |
| 85 Years and Over | 3,893 | 3.2% |
| Total | 123,460 | 100.0% |
Housing Finances in Marion County
Median Income by Occupancy in Marion County
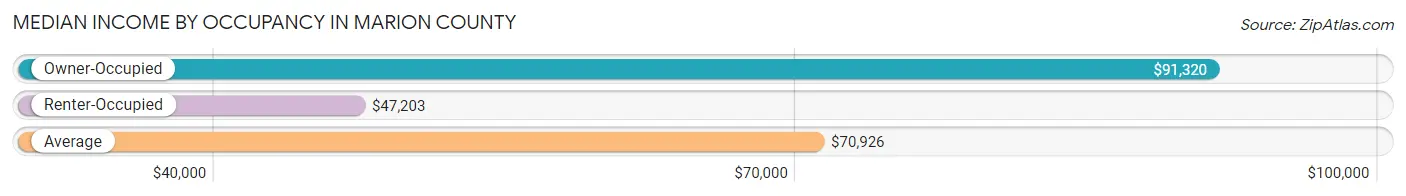
| Occupancy Type | # Households | Median Income |
| Owner-Occupied | 76,274 (61.8%) | $91,320 |
| Renter-Occupied | 47,186 (38.2%) | $47,203 |
| Average | 123,460 (100.0%) | $70,926 |
Occupancy by Householder Income Bracket in Marion County
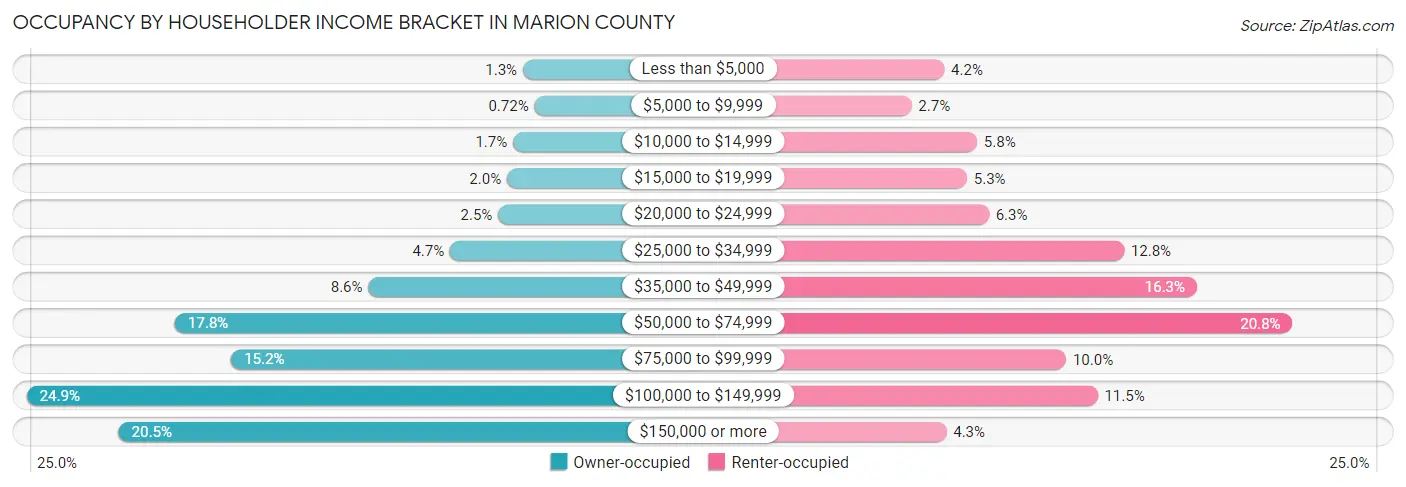
| Income Bracket | Owner-occupied | Renter-occupied |
| Less than $5,000 | 969 (1.3%) | 1,993 (4.2%) |
| $5,000 to $9,999 | 550 (0.7%) | 1,257 (2.7%) |
| $10,000 to $14,999 | 1,330 (1.7%) | 2,728 (5.8%) |
| $15,000 to $19,999 | 1,551 (2.0%) | 2,501 (5.3%) |
| $20,000 to $24,999 | 1,865 (2.5%) | 2,990 (6.3%) |
| $25,000 to $34,999 | 3,614 (4.7%) | 6,031 (12.8%) |
| $35,000 to $49,999 | 6,579 (8.6%) | 7,669 (16.3%) |
| $50,000 to $74,999 | 13,604 (17.8%) | 9,813 (20.8%) |
| $75,000 to $99,999 | 11,561 (15.2%) | 4,726 (10.0%) |
| $100,000 to $149,999 | 18,996 (24.9%) | 5,438 (11.5%) |
| $150,000 or more | 15,655 (20.5%) | 2,040 (4.3%) |
| Total | 76,274 (100.0%) | 47,186 (100.0%) |
Monthly Housing Cost Tiers in Marion County
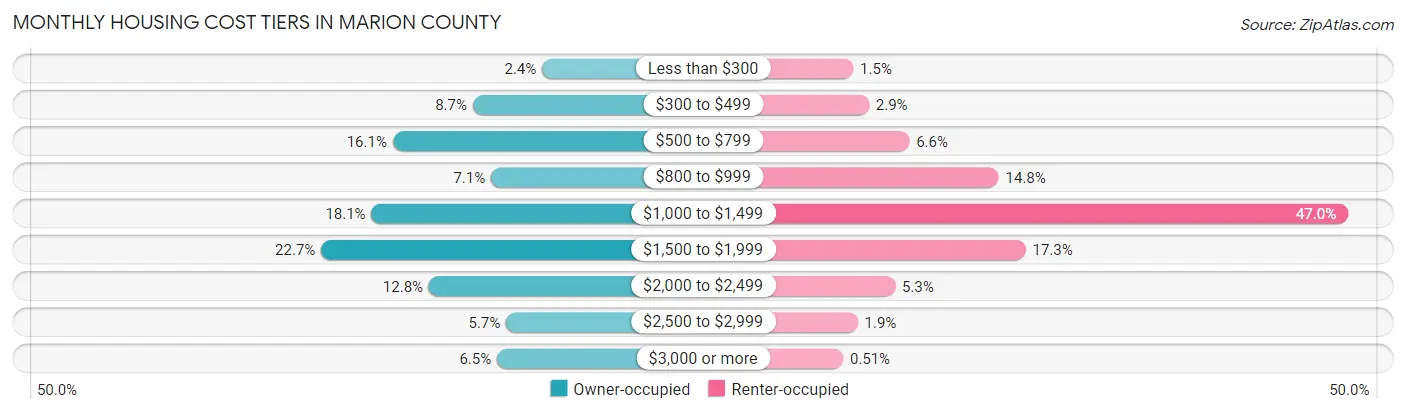
| Monthly Cost | Owner-occupied | Renter-occupied |
| Less than $300 | 1,800 (2.4%) | 686 (1.5%) |
| $300 to $499 | 6,668 (8.7%) | 1,364 (2.9%) |
| $500 to $799 | 12,291 (16.1%) | 3,117 (6.6%) |
| $800 to $999 | 5,384 (7.1%) | 7,003 (14.8%) |
| $1,000 to $1,499 | 13,781 (18.1%) | 22,177 (47.0%) |
| $1,500 to $1,999 | 17,318 (22.7%) | 8,174 (17.3%) |
| $2,000 to $2,499 | 9,746 (12.8%) | 2,501 (5.3%) |
| $2,500 to $2,999 | 4,324 (5.7%) | 876 (1.9%) |
| $3,000 or more | 4,962 (6.5%) | 241 (0.5%) |
| Total | 76,274 (100.0%) | 47,186 (100.0%) |
Physical Housing Characteristics in Marion County
Housing Structures in Marion County
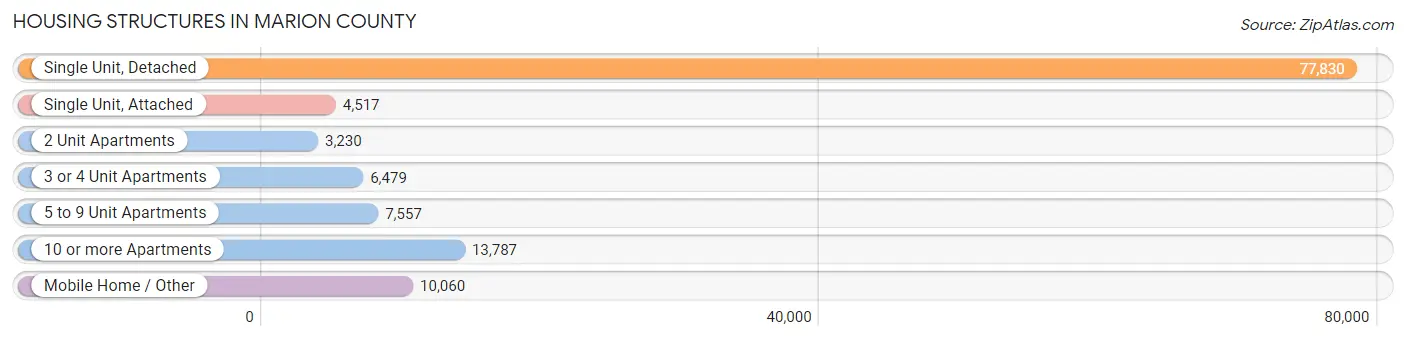
| Structure Type | # Housing Units | % Housing Units |
| Single Unit, Detached | 77,830 | 63.0% |
| Single Unit, Attached | 4,517 | 3.7% |
| 2 Unit Apartments | 3,230 | 2.6% |
| 3 or 4 Unit Apartments | 6,479 | 5.2% |
| 5 to 9 Unit Apartments | 7,557 | 6.1% |
| 10 or more Apartments | 13,787 | 11.2% |
| Mobile Home / Other | 10,060 | 8.2% |
| Total | 123,460 | 100.0% |
Housing Structures by Occupancy in Marion County
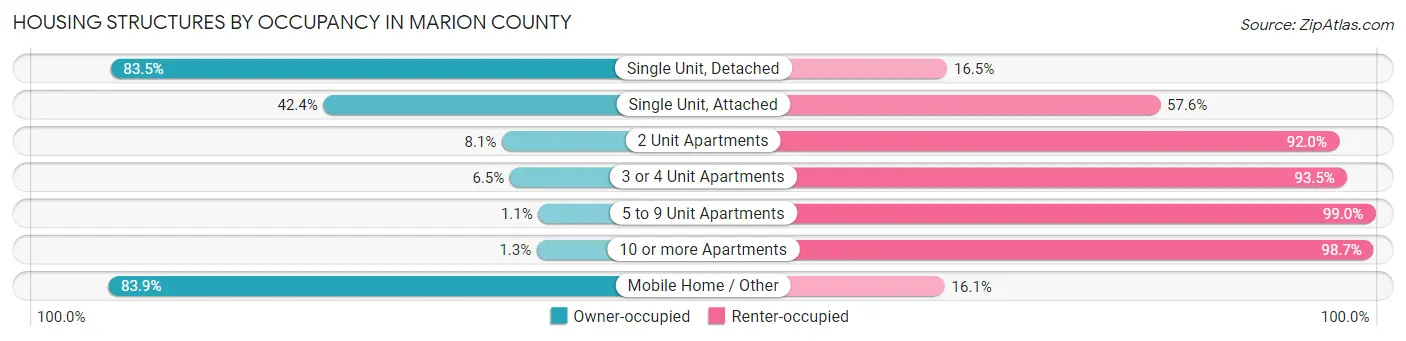
| Structure Type | Owner-occupied | Renter-occupied |
| Single Unit, Detached | 64,968 (83.5%) | 12,862 (16.5%) |
| Single Unit, Attached | 1,917 (42.4%) | 2,600 (57.6%) |
| 2 Unit Apartments | 260 (8.1%) | 2,970 (91.9%) |
| 3 or 4 Unit Apartments | 423 (6.5%) | 6,056 (93.5%) |
| 5 to 9 Unit Apartments | 79 (1.1%) | 7,478 (99.0%) |
| 10 or more Apartments | 184 (1.3%) | 13,603 (98.7%) |
| Mobile Home / Other | 8,443 (83.9%) | 1,617 (16.1%) |
| Total | 76,274 (61.8%) | 47,186 (38.2%) |
Housing Structures by Number of Rooms in Marion County
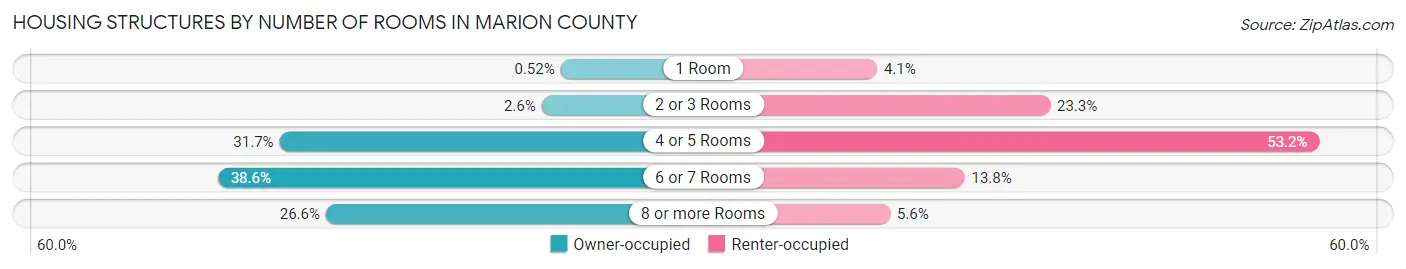
| Number of Rooms | Owner-occupied | Renter-occupied |
| 1 Room | 394 (0.5%) | 1,937 (4.1%) |
| 2 or 3 Rooms | 2,006 (2.6%) | 11,002 (23.3%) |
| 4 or 5 Rooms | 24,191 (31.7%) | 25,101 (53.2%) |
| 6 or 7 Rooms | 29,414 (38.6%) | 6,528 (13.8%) |
| 8 or more Rooms | 20,269 (26.6%) | 2,618 (5.6%) |
| Total | 76,274 (100.0%) | 47,186 (100.0%) |
Housing Structure by Heating Type in Marion County
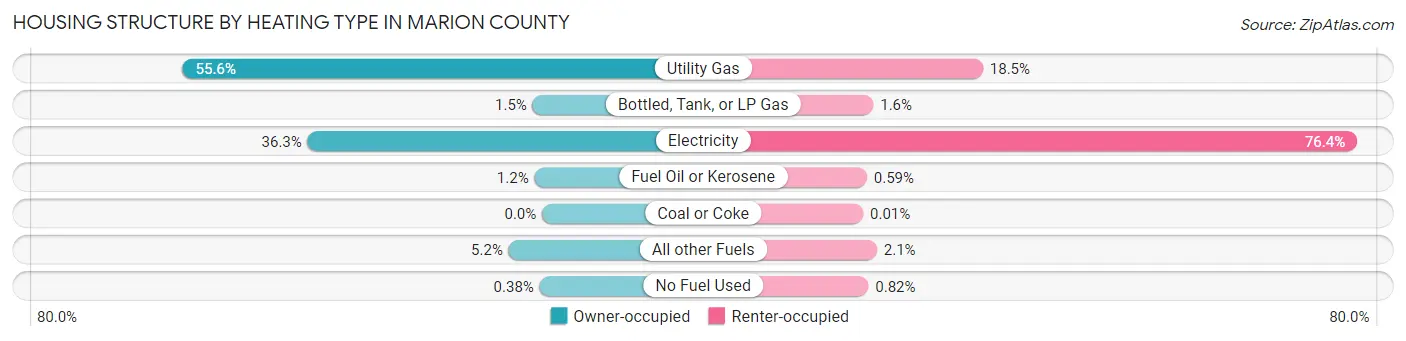
| Heating Type | Owner-occupied | Renter-occupied |
| Utility Gas | 42,383 (55.6%) | 8,739 (18.5%) |
| Bottled, Tank, or LP Gas | 1,115 (1.5%) | 745 (1.6%) |
| Electricity | 27,646 (36.2%) | 36,028 (76.3%) |
| Fuel Oil or Kerosene | 900 (1.2%) | 279 (0.6%) |
| Coal or Coke | 0 (0.0%) | 6 (0.0%) |
| All other Fuels | 3,937 (5.2%) | 1,004 (2.1%) |
| No Fuel Used | 293 (0.4%) | 385 (0.8%) |
| Total | 76,274 (100.0%) | 47,186 (100.0%) |
Household Vehicle Usage in Marion County
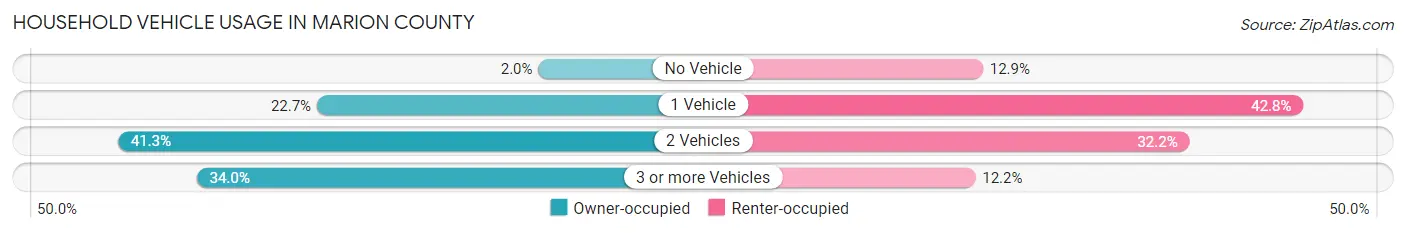
| Vehicles per Household | Owner-occupied | Renter-occupied |
| No Vehicle | 1,556 (2.0%) | 6,075 (12.9%) |
| 1 Vehicle | 17,319 (22.7%) | 20,192 (42.8%) |
| 2 Vehicles | 31,502 (41.3%) | 15,177 (32.2%) |
| 3 or more Vehicles | 25,897 (34.0%) | 5,742 (12.2%) |
| Total | 76,274 (100.0%) | 47,186 (100.0%) |
Real Estate & Mortgages in Marion County
Real Estate and Mortgage Overview in Marion County
| Characteristic | Without Mortgage | With Mortgage |
| Housing Units | 25,485 | 50,789 |
| Median Property Value | $336,200 | $358,200 |
| Median Household Income | $68,352 | $11,988 |
| Monthly Housing Costs | $614 | $4,935 |
| Real Estate Taxes | $3,061 | $804 |
Property Value by Mortgage Status in Marion County
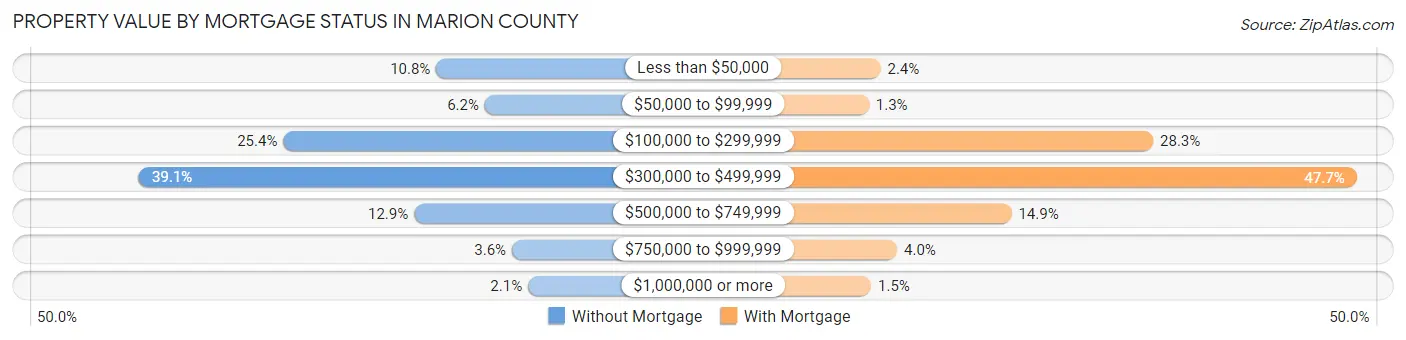
| Property Value | Without Mortgage | With Mortgage |
| Less than $50,000 | 2,752 (10.8%) | 1,211 (2.4%) |
| $50,000 to $99,999 | 1,572 (6.2%) | 647 (1.3%) |
| $100,000 to $299,999 | 6,466 (25.4%) | 14,392 (28.3%) |
| $300,000 to $499,999 | 9,968 (39.1%) | 24,234 (47.7%) |
| $500,000 to $749,999 | 3,289 (12.9%) | 7,542 (14.8%) |
| $750,000 to $999,999 | 914 (3.6%) | 2,009 (4.0%) |
| $1,000,000 or more | 524 (2.1%) | 754 (1.5%) |
| Total | 25,485 (100.0%) | 50,789 (100.0%) |
Household Income by Mortgage Status in Marion County
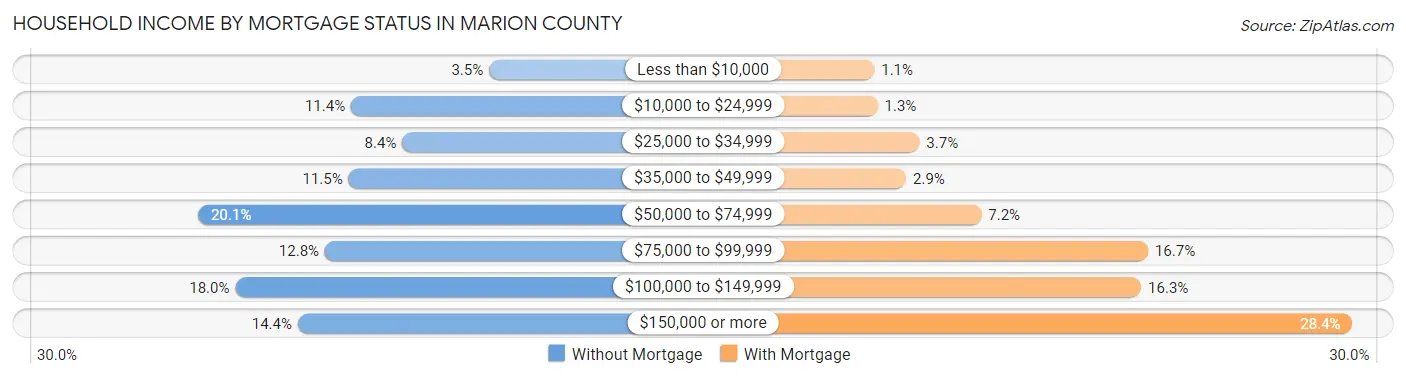
| Household Income | Without Mortgage | With Mortgage |
| Less than $10,000 | 881 (3.5%) | 541 (1.1%) |
| $10,000 to $24,999 | 2,893 (11.4%) | 638 (1.3%) |
| $25,000 to $34,999 | 2,147 (8.4%) | 1,853 (3.6%) |
| $35,000 to $49,999 | 2,929 (11.5%) | 1,467 (2.9%) |
| $50,000 to $74,999 | 5,119 (20.1%) | 3,650 (7.2%) |
| $75,000 to $99,999 | 3,272 (12.8%) | 8,485 (16.7%) |
| $100,000 to $149,999 | 4,577 (18.0%) | 8,289 (16.3%) |
| $150,000 or more | 3,667 (14.4%) | 14,419 (28.4%) |
| Total | 25,485 (100.0%) | 50,789 (100.0%) |
Property Value to Household Income Ratio in Marion County
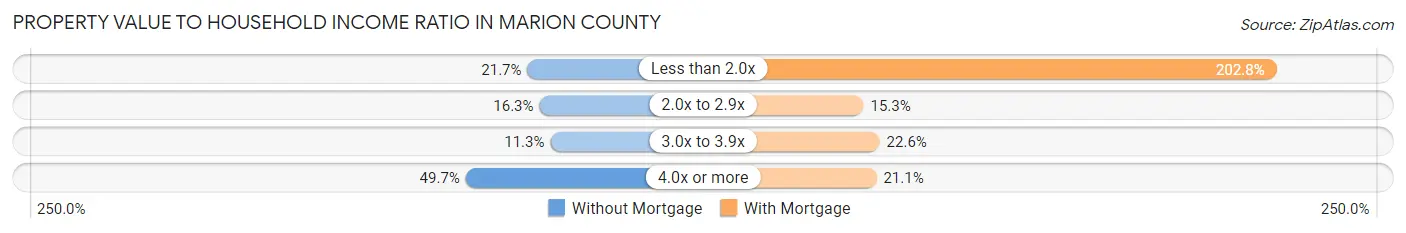
| Value-to-Income Ratio | Without Mortgage | With Mortgage |
| Less than 2.0x | 5,539 (21.7%) | 102,978 (202.8%) |
| 2.0x to 2.9x | 4,150 (16.3%) | 7,759 (15.3%) |
| 3.0x to 3.9x | 2,883 (11.3%) | 11,467 (22.6%) |
| 4.0x or more | 12,676 (49.7%) | 10,737 (21.1%) |
| Total | 25,485 (100.0%) | 50,789 (100.0%) |
Real Estate Taxes by Mortgage Status in Marion County
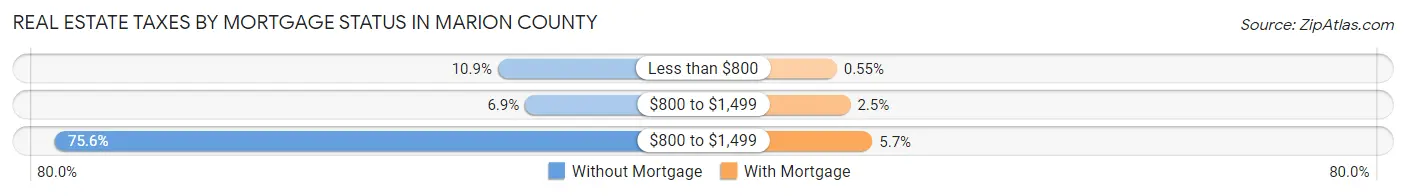
| Property Taxes | Without Mortgage | With Mortgage |
| Less than $800 | 2,770 (10.9%) | 281 (0.5%) |
| $800 to $1,499 | 1,751 (6.9%) | 1,289 (2.5%) |
| $800 to $1,499 | 19,254 (75.5%) | 2,916 (5.7%) |
| Total | 25,485 (100.0%) | 50,789 (100.0%) |
Health & Disability in Marion County
Health Insurance Coverage by Age in Marion County
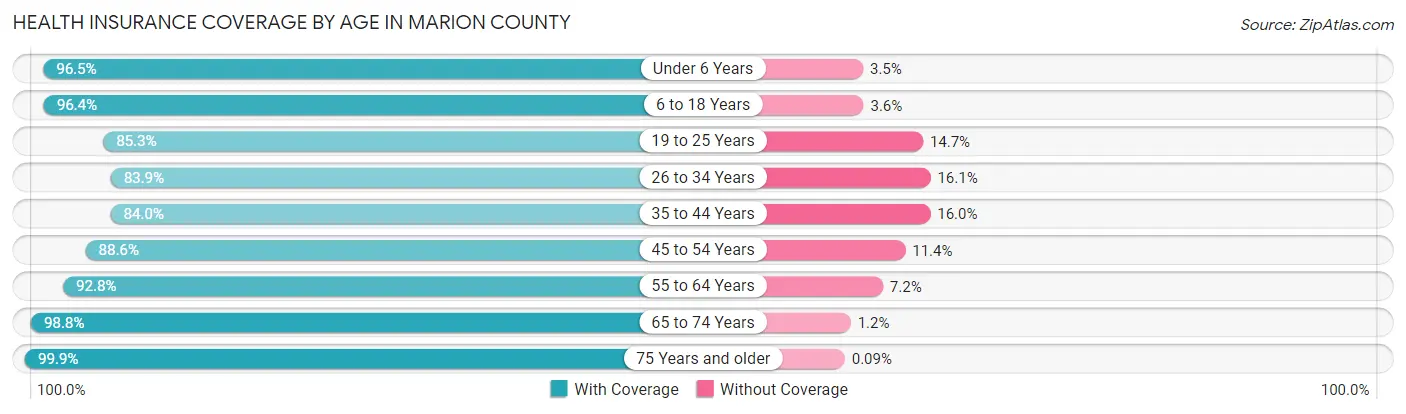
| Age Bracket | With Coverage | Without Coverage |
| Under 6 Years | 24,897 (96.5%) | 901 (3.5%) |
| 6 to 18 Years | 59,912 (96.4%) | 2,233 (3.6%) |
| 19 to 25 Years | 26,634 (85.3%) | 4,580 (14.7%) |
| 26 to 34 Years | 35,747 (83.9%) | 6,844 (16.1%) |
| 35 to 44 Years | 36,868 (84.0%) | 7,037 (16.0%) |
| 45 to 54 Years | 34,729 (88.6%) | 4,461 (11.4%) |
| 55 to 64 Years | 37,176 (92.8%) | 2,883 (7.2%) |
| 65 to 74 Years | 32,746 (98.8%) | 399 (1.2%) |
| 75 Years and older | 21,233 (99.9%) | 20 (0.1%) |
| Total | 309,942 (91.3%) | 29,358 (8.6%) |
Health Insurance Coverage by Citizenship Status in Marion County
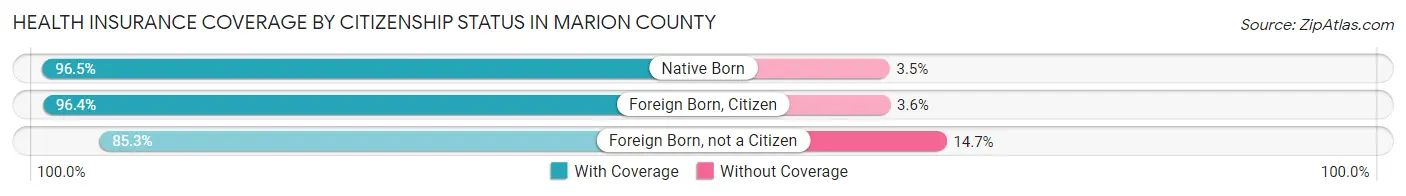
| Citizenship Status | With Coverage | Without Coverage |
| Native Born | 24,897 (96.5%) | 901 (3.5%) |
| Foreign Born, Citizen | 59,912 (96.4%) | 2,233 (3.6%) |
| Foreign Born, not a Citizen | 26,634 (85.3%) | 4,580 (14.7%) |
Health Insurance Coverage by Household Income in Marion County
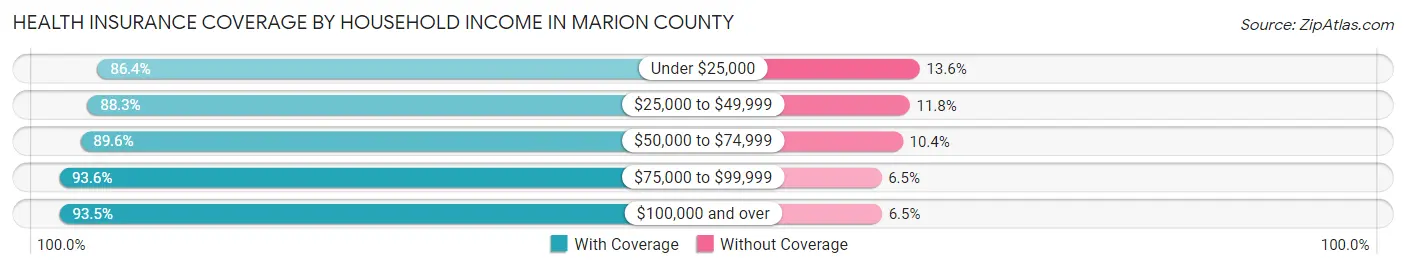
| Household Income | With Coverage | Without Coverage |
| Under $25,000 | 27,219 (86.4%) | 4,290 (13.6%) |
| $25,000 to $49,999 | 49,140 (88.2%) | 6,544 (11.7%) |
| $50,000 to $74,999 | 53,808 (89.6%) | 6,270 (10.4%) |
| $75,000 to $99,999 | 44,516 (93.5%) | 3,068 (6.5%) |
| $100,000 and over | 130,214 (93.5%) | 9,119 (6.5%) |
Public vs Private Health Insurance Coverage by Age in Marion County
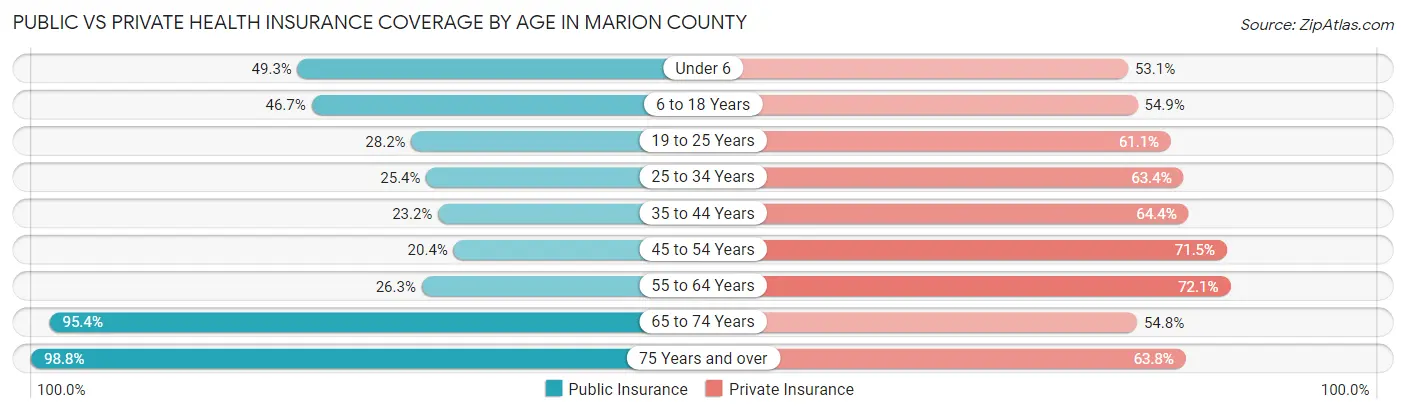
| Age Bracket | Public Insurance | Private Insurance |
| Under 6 | 12,723 (49.3%) | 13,703 (53.1%) |
| 6 to 18 Years | 29,049 (46.7%) | 34,114 (54.9%) |
| 19 to 25 Years | 8,801 (28.2%) | 19,068 (61.1%) |
| 25 to 34 Years | 10,832 (25.4%) | 27,011 (63.4%) |
| 35 to 44 Years | 10,199 (23.2%) | 28,259 (64.4%) |
| 45 to 54 Years | 7,978 (20.4%) | 28,011 (71.5%) |
| 55 to 64 Years | 10,530 (26.3%) | 28,878 (72.1%) |
| 65 to 74 Years | 31,606 (95.4%) | 18,159 (54.8%) |
| 75 Years and over | 20,997 (98.8%) | 13,566 (63.8%) |
| Total | 142,715 (42.1%) | 210,769 (62.1%) |
Disability Status by Sex by Age in Marion County
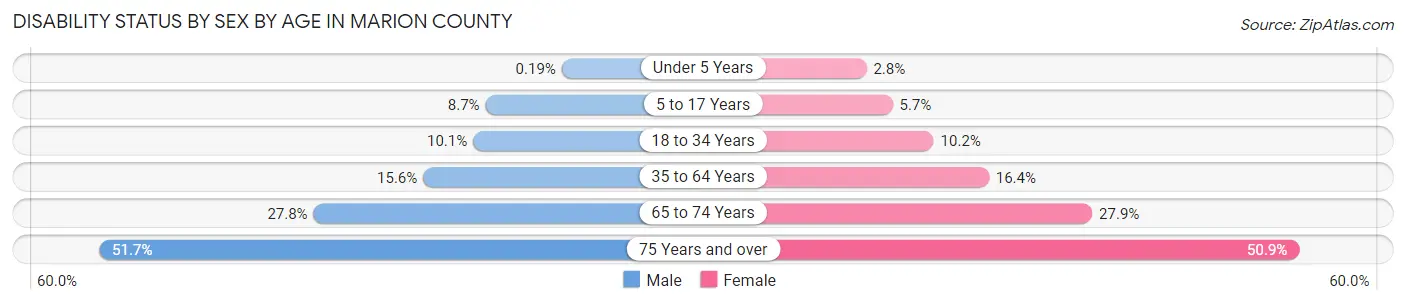
| Age Bracket | Male | Female |
| Under 5 Years | 21 (0.2%) | 289 (2.8%) |
| 5 to 17 Years | 2,751 (8.7%) | 1,677 (5.7%) |
| 18 to 34 Years | 4,028 (10.1%) | 3,996 (10.2%) |
| 35 to 64 Years | 9,590 (15.6%) | 10,114 (16.4%) |
| 65 to 74 Years | 4,250 (27.8%) | 4,983 (27.9%) |
| 75 Years and over | 4,641 (51.7%) | 6,253 (50.9%) |
Disability Class by Sex by Age in Marion County
Disability Class: Hearing Difficulty
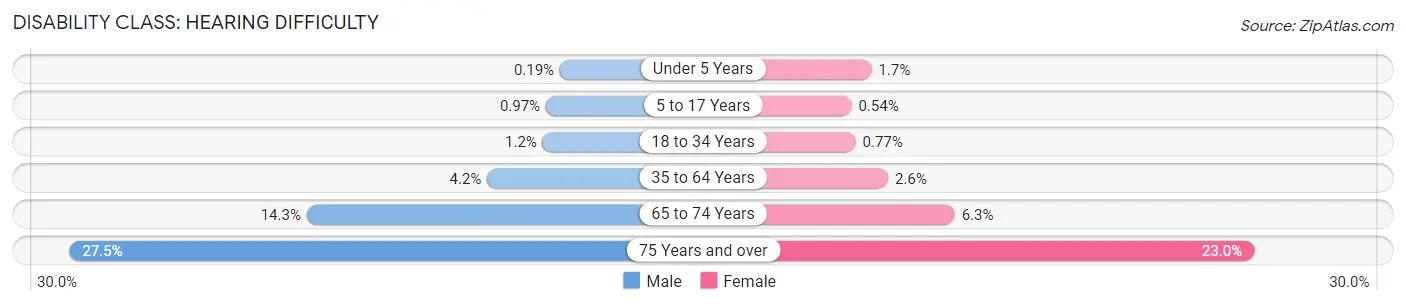
| Age Bracket | Male | Female |
| Under 5 Years | 21 (0.2%) | 173 (1.7%) |
| 5 to 17 Years | 306 (1.0%) | 160 (0.5%) |
| 18 to 34 Years | 460 (1.1%) | 299 (0.8%) |
| 35 to 64 Years | 2,604 (4.2%) | 1,588 (2.6%) |
| 65 to 74 Years | 2,182 (14.3%) | 1,125 (6.3%) |
| 75 Years and over | 2,469 (27.5%) | 2,818 (23.0%) |
Disability Class: Vision Difficulty
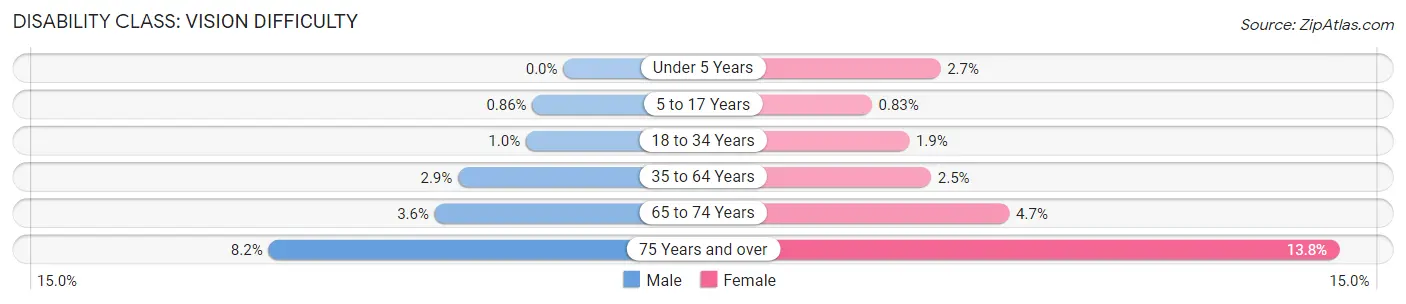
| Age Bracket | Male | Female |
| Under 5 Years | 0 (0.0%) | 288 (2.7%) |
| 5 to 17 Years | 271 (0.9%) | 247 (0.8%) |
| 18 to 34 Years | 415 (1.0%) | 731 (1.9%) |
| 35 to 64 Years | 1,799 (2.9%) | 1,535 (2.5%) |
| 65 to 74 Years | 546 (3.6%) | 833 (4.7%) |
| 75 Years and over | 737 (8.2%) | 1,699 (13.8%) |
Disability Class: Cognitive Difficulty
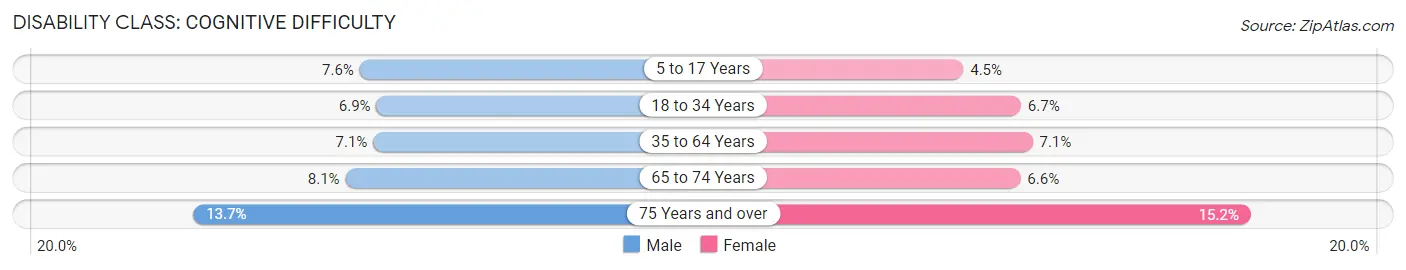
| Age Bracket | Male | Female |
| 5 to 17 Years | 2,395 (7.6%) | 1,338 (4.5%) |
| 18 to 34 Years | 2,776 (6.9%) | 2,598 (6.7%) |
| 35 to 64 Years | 4,331 (7.1%) | 4,373 (7.1%) |
| 65 to 74 Years | 1,235 (8.1%) | 1,185 (6.6%) |
| 75 Years and over | 1,233 (13.7%) | 1,864 (15.2%) |
Disability Class: Ambulatory Difficulty
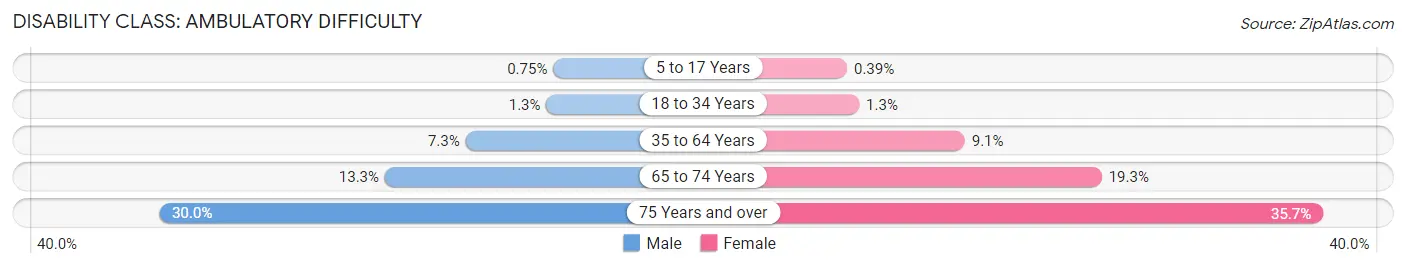
| Age Bracket | Male | Female |
| 5 to 17 Years | 238 (0.7%) | 115 (0.4%) |
| 18 to 34 Years | 503 (1.3%) | 504 (1.3%) |
| 35 to 64 Years | 4,459 (7.3%) | 5,639 (9.1%) |
| 65 to 74 Years | 2,024 (13.3%) | 3,449 (19.3%) |
| 75 Years and over | 2,695 (30.0%) | 4,386 (35.7%) |
Disability Class: Self-Care Difficulty
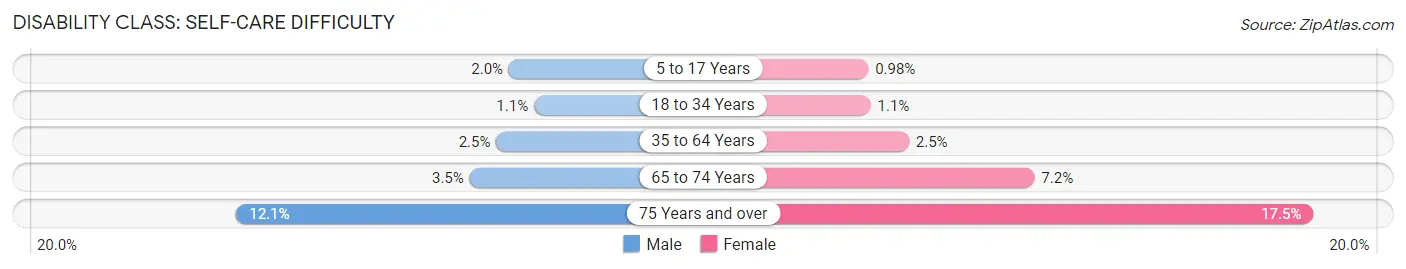
| Age Bracket | Male | Female |
| 5 to 17 Years | 640 (2.0%) | 291 (1.0%) |
| 18 to 34 Years | 437 (1.1%) | 417 (1.1%) |
| 35 to 64 Years | 1,526 (2.5%) | 1,541 (2.5%) |
| 65 to 74 Years | 531 (3.5%) | 1,278 (7.1%) |
| 75 Years and over | 1,090 (12.1%) | 2,148 (17.5%) |
Technology Access in Marion County
Computing Device Access in Marion County
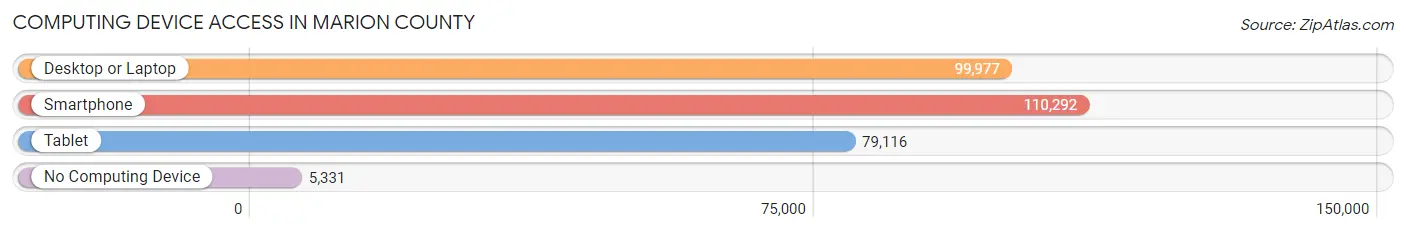
| Device Type | # Households | % Households |
| Desktop or Laptop | 99,977 | 81.0% |
| Smartphone | 110,292 | 89.3% |
| Tablet | 79,116 | 64.1% |
| No Computing Device | 5,331 | 4.3% |
| Total | 123,460 | 100.0% |
Internet Access in Marion County
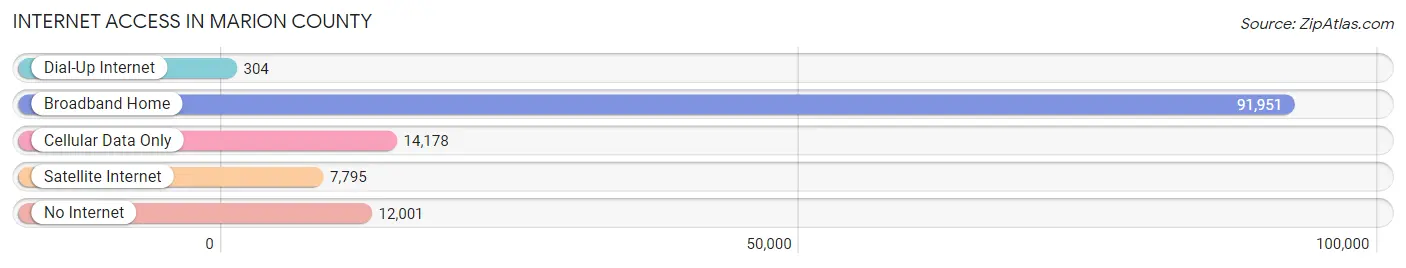
| Internet Type | # Households | % Households |
| Dial-Up Internet | 304 | 0.3% |
| Broadband Home | 91,951 | 74.5% |
| Cellular Data Only | 14,178 | 11.5% |
| Satellite Internet | 7,795 | 6.3% |
| No Internet | 12,001 | 9.7% |
| Total | 123,460 | 100.0% |
Marion County Summary
Marion County, Oregon is located in the Willamette Valley region of the state and is part of the Portland metropolitan area. It is the fifth most populous county in Oregon, with a population of approximately 315,335 as of 2019. The county seat is Salem, the state capital.
Geography
Marion County is located in the Willamette Valley region of Oregon, and is bordered by Polk County to the north, Yamhill County to the west, Linn County to the east, and Benton County to the south. The county covers an area of 1,193 square miles, of which 1,186 square miles is land and 7 square miles is water. The county is divided into two distinct regions: the Willamette Valley and the Cascade Mountains. The Willamette Valley is characterized by rolling hills, fertile soil, and a mild climate, while the Cascade Mountains are characterized by rugged terrain, dense forests, and higher elevations.
The county is home to several rivers, including the Santiam, Pudding, and Molalla. The Santiam River is the largest river in the county, and is a major tributary of the Willamette River. The county is also home to several lakes, including Detroit Lake, Green Peter Lake, and Foster Lake.
Economy
Marion County is home to a diverse economy, with a variety of industries providing employment opportunities. The county’s largest employers are the state government, the Salem-Keizer School District, and the Salem Health System. Other major employers include the Oregon Department of Corrections, the Oregon State University System, and the Oregon Department of Transportation.
Agriculture is an important part of the county’s economy, with the county’s fertile soil and mild climate providing ideal conditions for growing a variety of crops. The county is home to a number of wineries and vineyards, and is also a major producer of hazelnuts, grass seed, and Christmas trees.
The county is also home to a number of manufacturing companies, including Oregon Freeze Dry, Inc., which produces freeze-dried food products, and Cascade Steel Rolling Mills, which produces steel products.
Demographics
As of 2019, Marion County had a population of 315,335, making it the fifth most populous county in Oregon. The population is spread out across the county, with the largest cities being Salem (population of 167,419), Keizer (population of 37,478), and Woodburn (population of 24,080).
The county is racially and ethnically diverse, with the largest racial/ethnic groups being White (77.2%), Hispanic or Latino (13.2%), and Asian (4.2%). The median household income in the county is $54,845, and the median home value is $269,400.
Marion County is home to a number of higher education institutions, including Oregon State University, Corban University, and Chemeketa Community College. The county is also home to a number of museums, including the Oregon State Capitol Museum, the Hallie Ford Museum of Art, and the Willamette Heritage Center.
Conclusion
Marion County, Oregon is a diverse and vibrant county located in the Willamette Valley region of the state. The county is home to a variety of industries, including agriculture, manufacturing, and higher education. The county is also home to a number of cultural attractions, including museums, wineries, and historical sites. With its diverse population, strong economy, and rich cultural heritage, Marion County is an ideal place to live, work, and play.
Common Questions
What is the Total Population of Marion County?
Total Population of Marion County is 345,815.
What is the Total Male Population of Marion County?
Total Male Population of Marion County is 173,623.
What is the Total Female Population of Marion County?
Total Female Population of Marion County is 172,192.
What is the Ratio of Males per 100 Females in Marion County?
There are 100.83 Males per 100 Females in Marion County.
What is the Ratio of Females per 100 Males in Marion County?
There are 99.18 Females per 100 Males in Marion County.
What is the Median Population Age in Marion County?
Median Population Age in Marion County is 37.0 Years.
What is the Average Family Size in Marion County
Average Family Size in Marion County is 3.3 People.
What is the Average Household Size in Marion County
Average Household Size in Marion County is 2.7 People.
What is Per Capita Income in Marion County?
Per Capita income in Marion County is $33,545.
What is the Median Family Income in Marion County?
Median Family Income in Marion County is $84,296.
What is the Median Household income in Marion County?
Median Household Income in Marion County is $70,926.
What is Income or Wage Gap in Marion County?
Income or Wage Gap in Marion County is 22.5%.
Women in Marion County earn 77.5 cents for every dollar earned by a man.
What is Family Income Deficit in Marion County?
Family Income Deficit in Marion County is $9,922.
Families that are below poverty line in Marion County earn $9,922 less on average than the poverty threshold level.
What is Inequality or Gini Index in Marion County?
Inequality or Gini Index in Marion County is 0.43.
How Large is the Labor Force in Marion County?
There are 167,595 People in the Labor Forcein in Marion County.
What is the Percentage of People in the Labor Force in Marion County?
61.5% of People are in the Labor Force in Marion County.
What is the Unemployment Rate in Marion County?
Unemployment Rate in Marion County is 5.4%.