Malheur County, OR
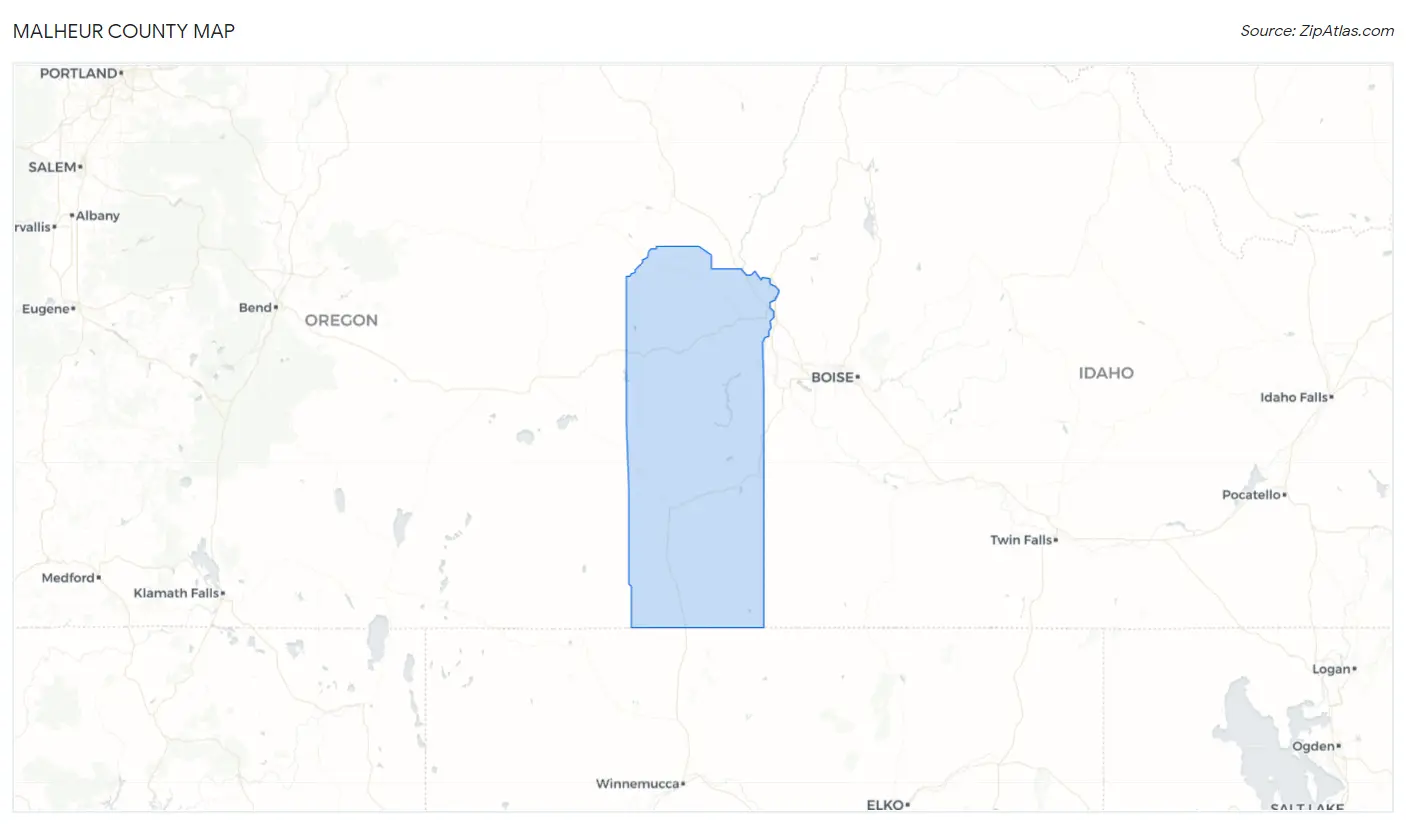
Malheur County Map
Malheur County Overview
31,538
TOTAL POPULATION
17,355
MALE POPULATION
14,183
FEMALE POPULATION
122.36
MALES / 100 FEMALES
81.72
FEMALES / 100 MALES
35.9
MEDIAN AGE
3.5
AVG FAMILY SIZE
2.8
AVG HOUSEHOLD SIZE
$22,145
PER CAPITA INCOME
$61,998
AVG FAMILY INCOME
$48,371
AVG HOUSEHOLD INCOME
9.7%
WAGE / INCOME GAP [ % ]
90.3¢/ $1
WAGE / INCOME GAP [ $ ]
$11,623
FAMILY INCOME DEFICIT
0.44
INEQUALITY / GINI INDEX
12,413
LABOR FORCE [ PEOPLE ]
50.8%
PERCENT IN LABOR FORCE
6.2%
UNEMPLOYMENT RATE
Malheur County Area Codes
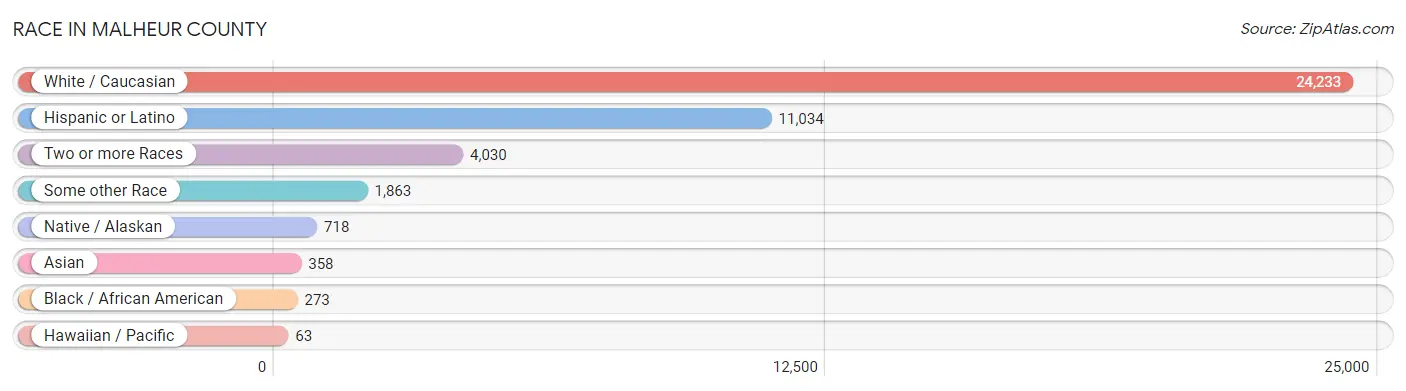
Race in Malheur County
The most populous races in Malheur County are White / Caucasian (24,233 | 76.8%), Hispanic or Latino (11,034 | 35.0%), and Two or more Races (4,030 | 12.8%).
| Race | # Population | % Population |
| Asian | 358 | 1.1% |
| Black / African American | 273 | 0.9% |
| Hawaiian / Pacific | 63 | 0.2% |
| Hispanic or Latino | 11,034 | 35.0% |
| Native / Alaskan | 718 | 2.3% |
| White / Caucasian | 24,233 | 76.8% |
| Two or more Races | 4,030 | 12.8% |
| Some other Race | 1,863 | 5.9% |
| Total | 31,538 | 100.0% |
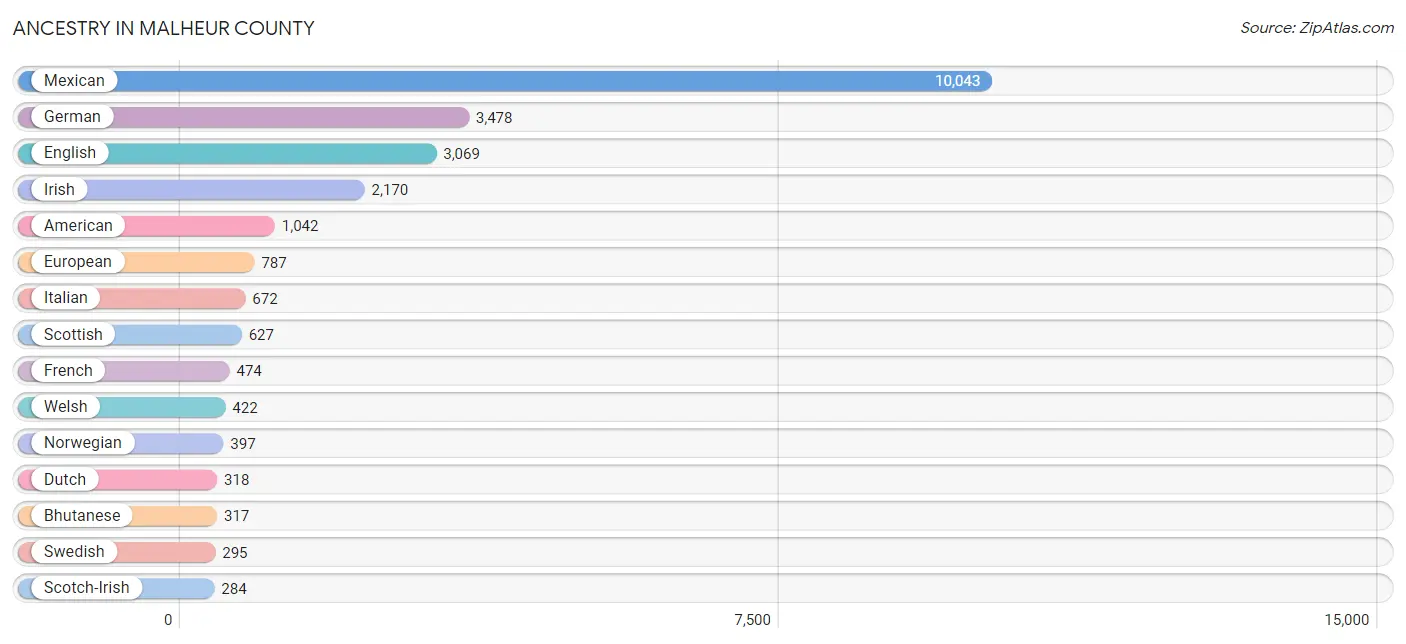
Ancestry in Malheur County
The most populous ancestries reported in Malheur County are Mexican (10,043 | 31.8%), German (3,478 | 11.0%), English (3,069 | 9.7%), Irish (2,170 | 6.9%), and American (1,042 | 3.3%), together accounting for 62.8% of all Malheur County residents.
| Ancestry | # Population | % Population |
| African | 26 | 0.1% |
| American | 1,042 | 3.3% |
| Apache | 70 | 0.2% |
| Arab | 47 | 0.2% |
| Argentinean | 3 | 0.0% |
| Australian | 23 | 0.1% |
| Austrian | 21 | 0.1% |
| Basque | 123 | 0.4% |
| Belgian | 21 | 0.1% |
| Belizean | 15 | 0.1% |
| Bhutanese | 317 | 1.0% |
| Blackfeet | 97 | 0.3% |
| British | 116 | 0.4% |
| Bulgarian | 9 | 0.0% |
| Burmese | 41 | 0.1% |
| Canadian | 24 | 0.1% |
| Celtic | 6 | 0.0% |
| Central American | 74 | 0.2% |
| Central American Indian | 9 | 0.0% |
| Cherokee | 197 | 0.6% |
| Chickasaw | 5 | 0.0% |
| Chippewa | 71 | 0.2% |
| Choctaw | 31 | 0.1% |
| Colville | 1 | 0.0% |
| Costa Rican | 1 | 0.0% |
| Creek | 8 | 0.0% |
| Croatian | 8 | 0.0% |
| Crow | 11 | 0.0% |
| Cuban | 40 | 0.1% |
| Czech | 36 | 0.1% |
| Czechoslovakian | 29 | 0.1% |
| Danish | 65 | 0.2% |
| Dutch | 318 | 1.0% |
| Eastern European | 78 | 0.3% |
| English | 3,069 | 9.7% |
| Ethiopian | 12 | 0.0% |
| European | 787 | 2.5% |
| Fijian | 9 | 0.0% |
| Filipino | 10 | 0.0% |
| Finnish | 41 | 0.1% |
| French | 474 | 1.5% |
| French Canadian | 74 | 0.2% |
| German | 3,478 | 11.0% |
| Greek | 65 | 0.2% |
| Guatemalan | 25 | 0.1% |
| Honduran | 15 | 0.1% |
| Hungarian | 2 | 0.0% |
| Icelander | 12 | 0.0% |
| Indian (Asian) | 24 | 0.1% |
| Irish | 2,170 | 6.9% |
| Iroquois | 12 | 0.0% |
| Italian | 672 | 2.1% |
| Japanese | 25 | 0.1% |
| Korean | 71 | 0.2% |
| Lebanese | 9 | 0.0% |
| Malaysian | 14 | 0.0% |
| Mexican | 10,043 | 31.8% |
| Mexican American Indian | 255 | 0.8% |
| Native Hawaiian | 20 | 0.1% |
| Navajo | 12 | 0.0% |
| New Zealander | 13 | 0.0% |
| Nigerian | 15 | 0.1% |
| Northern European | 18 | 0.1% |
| Norwegian | 397 | 1.3% |
| Paiute | 36 | 0.1% |
| Pakistani | 16 | 0.1% |
| Palestinian | 8 | 0.0% |
| Panamanian | 23 | 0.1% |
| Polish | 172 | 0.5% |
| Portuguese | 33 | 0.1% |
| Pueblo | 9 | 0.0% |
| Puerto Rican | 10 | 0.0% |
| Puget Sound Salish | 9 | 0.0% |
| Romanian | 10 | 0.0% |
| Russian | 87 | 0.3% |
| Salvadoran | 10 | 0.0% |
| Samoan | 24 | 0.1% |
| Scandinavian | 206 | 0.6% |
| Scotch-Irish | 284 | 0.9% |
| Scottish | 627 | 2.0% |
| Serbian | 11 | 0.0% |
| Sioux | 57 | 0.2% |
| Slavic | 8 | 0.0% |
| South American | 3 | 0.0% |
| Spaniard | 153 | 0.5% |
| Spanish | 276 | 0.9% |
| Sri Lankan | 14 | 0.0% |
| Subsaharan African | 71 | 0.2% |
| Swedish | 295 | 0.9% |
| Swiss | 125 | 0.4% |
| Thai | 44 | 0.1% |
| Ukrainian | 13 | 0.0% |
| Welsh | 422 | 1.3% |
| Yuman | 9 | 0.0% |
| Yup'ik | 7 | 0.0% | View All 95 Rows |
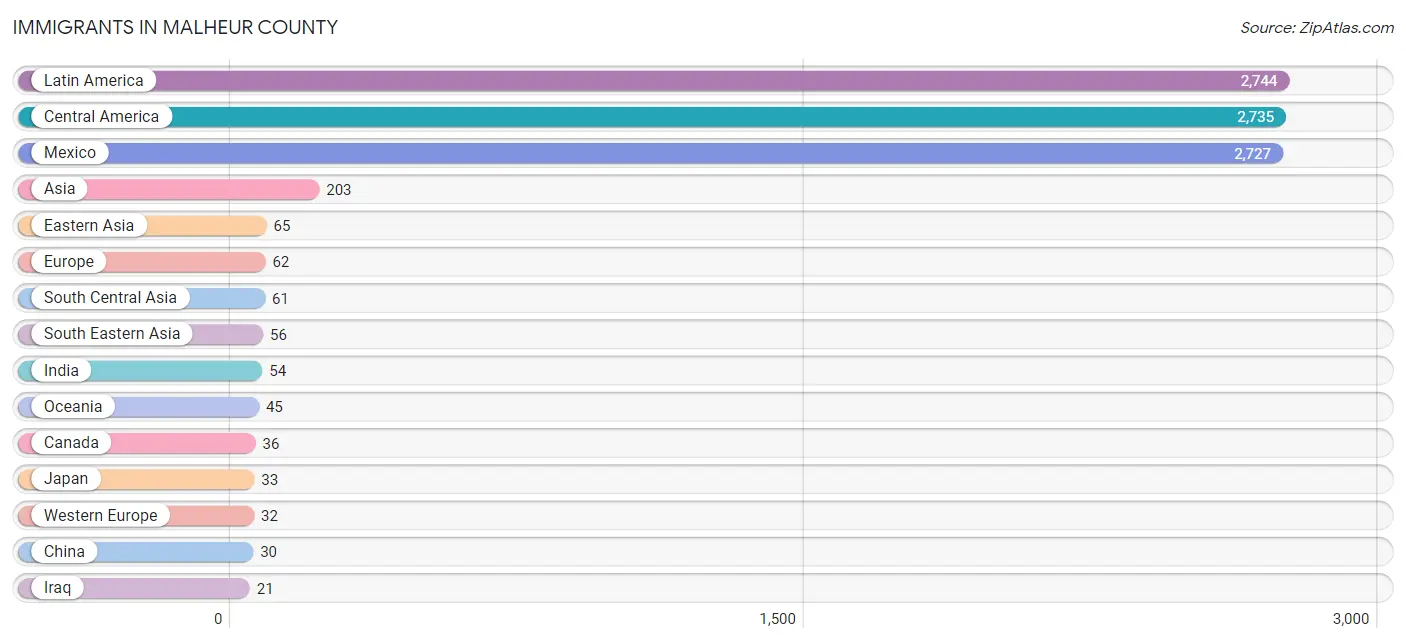
Immigrants in Malheur County
The most numerous immigrant groups reported in Malheur County came from Latin America (2,744 | 8.7%), Central America (2,735 | 8.7%), Mexico (2,727 | 8.6%), Asia (203 | 0.6%), and Eastern Asia (65 | 0.2%), together accounting for 26.9% of all Malheur County residents.
| Immigration Origin | # Population | % Population |
| Africa | 9 | 0.0% |
| Asia | 203 | 0.6% |
| Cambodia | 6 | 0.0% |
| Canada | 36 | 0.1% |
| Caribbean | 9 | 0.0% |
| Central America | 2,735 | 8.7% |
| China | 30 | 0.1% |
| Congo | 9 | 0.0% |
| Cuba | 9 | 0.0% |
| Eastern Asia | 65 | 0.2% |
| Eastern Europe | 11 | 0.0% |
| Europe | 62 | 0.2% |
| Germany | 15 | 0.1% |
| Honduras | 6 | 0.0% |
| India | 54 | 0.2% |
| Iraq | 21 | 0.1% |
| Japan | 33 | 0.1% |
| Korea | 2 | 0.0% |
| Laos | 14 | 0.0% |
| Latin America | 2,744 | 8.7% |
| Mexico | 2,727 | 8.6% |
| Micronesia | 9 | 0.0% |
| Middle Africa | 9 | 0.0% |
| Netherlands | 17 | 0.1% |
| Nicaragua | 2 | 0.0% |
| Northern Europe | 18 | 0.1% |
| Oceania | 45 | 0.1% |
| Philippines | 6 | 0.0% |
| South Central Asia | 61 | 0.2% |
| South Eastern Asia | 56 | 0.2% |
| Southern Europe | 1 | 0.0% |
| Spain | 1 | 0.0% |
| Sri Lanka | 4 | 0.0% |
| Sweden | 14 | 0.0% |
| Taiwan | 16 | 0.1% |
| Thailand | 16 | 0.1% |
| Ukraine | 2 | 0.0% |
| Vietnam | 14 | 0.0% |
| Western Asia | 21 | 0.1% |
| Western Europe | 32 | 0.1% | View All 40 Rows |
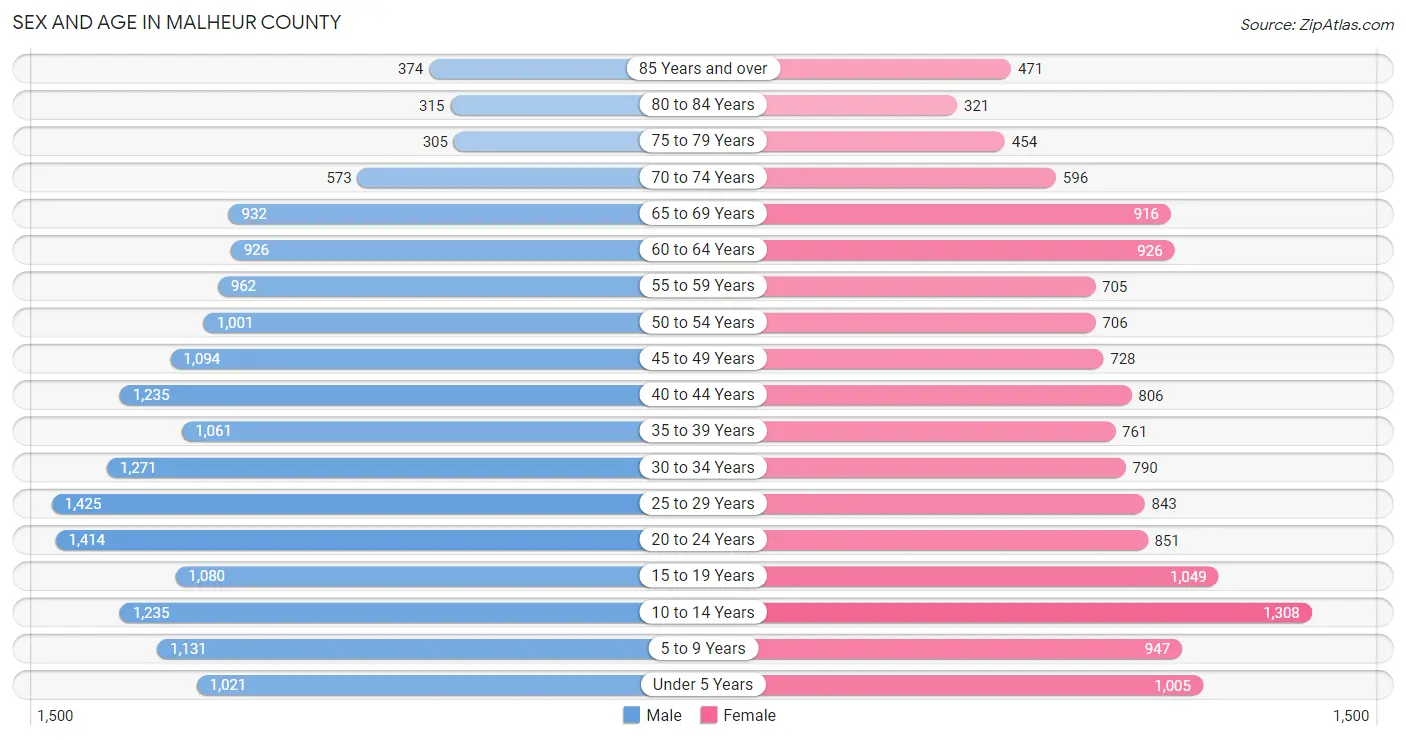
Sex and Age in Malheur County
Sex and Age in Malheur County
The most populous age groups in Malheur County are 25 to 29 Years (1,425 | 8.2%) for men and 10 to 14 Years (1,308 | 9.2%) for women.
| Age Bracket | Male | Female |
| Under 5 Years | 1,021 (5.9%) | 1,005 (7.1%) |
| 5 to 9 Years | 1,131 (6.5%) | 947 (6.7%) |
| 10 to 14 Years | 1,235 (7.1%) | 1,308 (9.2%) |
| 15 to 19 Years | 1,080 (6.2%) | 1,049 (7.4%) |
| 20 to 24 Years | 1,414 (8.2%) | 851 (6.0%) |
| 25 to 29 Years | 1,425 (8.2%) | 843 (5.9%) |
| 30 to 34 Years | 1,271 (7.3%) | 790 (5.6%) |
| 35 to 39 Years | 1,061 (6.1%) | 761 (5.4%) |
| 40 to 44 Years | 1,235 (7.1%) | 806 (5.7%) |
| 45 to 49 Years | 1,094 (6.3%) | 728 (5.1%) |
| 50 to 54 Years | 1,001 (5.8%) | 706 (5.0%) |
| 55 to 59 Years | 962 (5.5%) | 705 (5.0%) |
| 60 to 64 Years | 926 (5.3%) | 926 (6.5%) |
| 65 to 69 Years | 932 (5.4%) | 916 (6.5%) |
| 70 to 74 Years | 573 (3.3%) | 596 (4.2%) |
| 75 to 79 Years | 305 (1.8%) | 454 (3.2%) |
| 80 to 84 Years | 315 (1.8%) | 321 (2.3%) |
| 85 Years and over | 374 (2.1%) | 471 (3.3%) |
| Total | 17,355 (100.0%) | 14,183 (100.0%) |
Families and Households in Malheur County
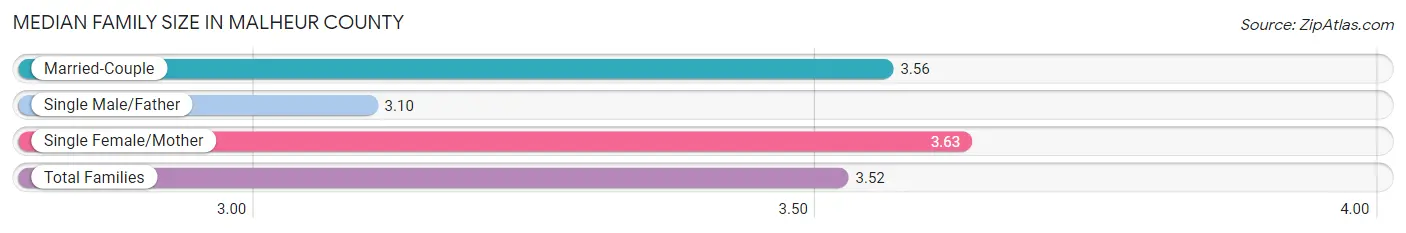
Median Family Size in Malheur County
The median family size in Malheur County is 3.52 persons per family, with single female/mother families (1,239 | 19.6%) accounting for the largest median family size of 3.63 persons per family. On the other hand, single male/father families (701 | 11.1%) represent the smallest median family size with 3.10 persons per family.
| Family Type | # Families | Family Size |
| Married-Couple | 4,377 (69.3%) | 3.56 |
| Single Male/Father | 701 (11.1%) | 3.10 |
| Single Female/Mother | 1,239 (19.6%) | 3.63 |
| Total Families | 6,317 (100.0%) | 3.52 |
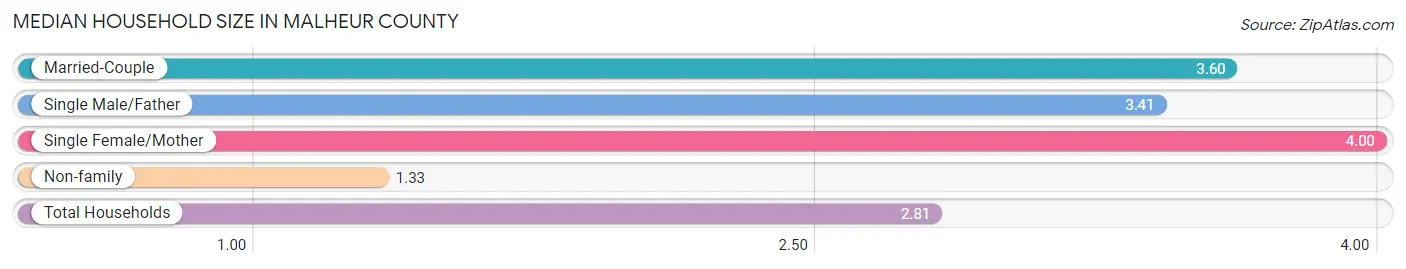
Median Household Size in Malheur County
The median household size in Malheur County is 2.81 persons per household, with single female/mother households (1,239 | 12.4%) accounting for the largest median household size of 4 persons per household. non-family households (3,635 | 36.5%) represent the smallest median household size with 1.33 persons per household.
| Household Type | # Households | Household Size |
| Married-Couple | 4,377 (44.0%) | 3.60 |
| Single Male/Father | 701 (7.0%) | 3.41 |
| Single Female/Mother | 1,239 (12.4%) | 4.00 |
| Non-family | 3,635 (36.5%) | 1.33 |
| Total Households | 9,952 (100.0%) | 2.81 |
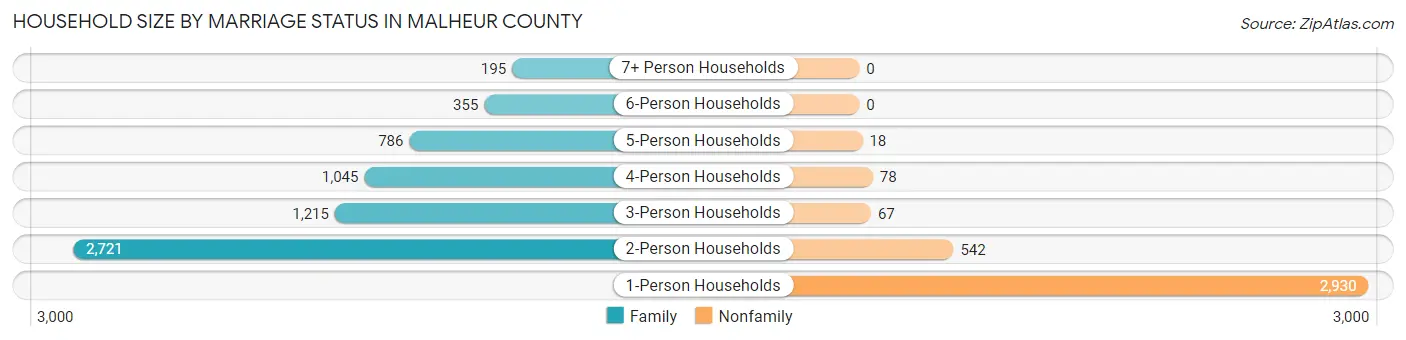
Household Size by Marriage Status in Malheur County
Out of a total of 9,952 households in Malheur County, 6,317 (63.5%) are family households, while 3,635 (36.5%) are nonfamily households. The most numerous type of family households are 2-person households, comprising 2,721, and the most common type of nonfamily households are 1-person households, comprising 2,930.
| Household Size | Family Households | Nonfamily Households |
| 1-Person Households | - | 2,930 (29.4%) |
| 2-Person Households | 2,721 (27.3%) | 542 (5.4%) |
| 3-Person Households | 1,215 (12.2%) | 67 (0.7%) |
| 4-Person Households | 1,045 (10.5%) | 78 (0.8%) |
| 5-Person Households | 786 (7.9%) | 18 (0.2%) |
| 6-Person Households | 355 (3.6%) | 0 (0.0%) |
| 7+ Person Households | 195 (2.0%) | 0 (0.0%) |
| Total | 6,317 (63.5%) | 3,635 (36.5%) |
Female Fertility in Malheur County
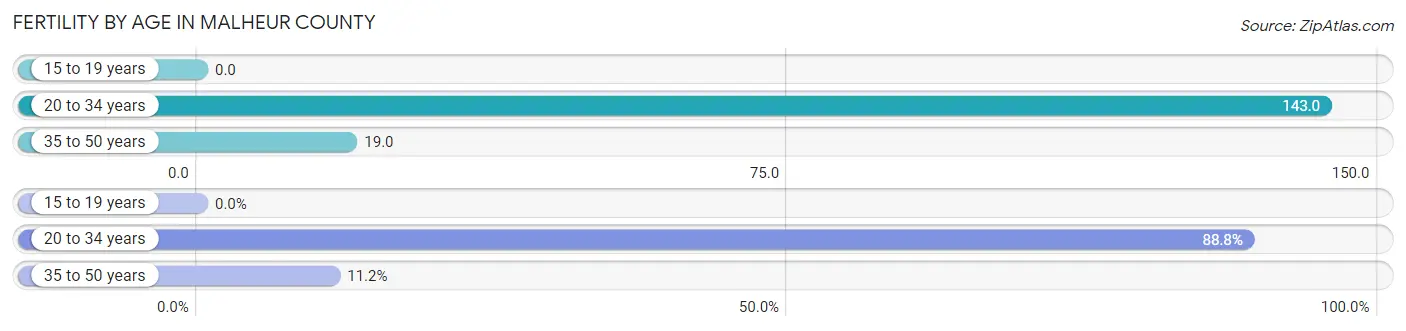
Fertility by Age in Malheur County
Average fertility rate in Malheur County is 67.0 births per 1,000 women. Women in the age bracket of 20 to 34 years have the highest fertility rate with 143.0 births per 1,000 women. Women in the age bracket of 20 to 34 years acount for 88.8% of all women with births.
| Age Bracket | Women with Births | Births / 1,000 Women |
| 15 to 19 years | 0 (0.0%) | 0.0 |
| 20 to 34 years | 356 (88.8%) | 143.0 |
| 35 to 50 years | 45 (11.2%) | 19.0 |
| Total | 401 (100.0%) | 67.0 |
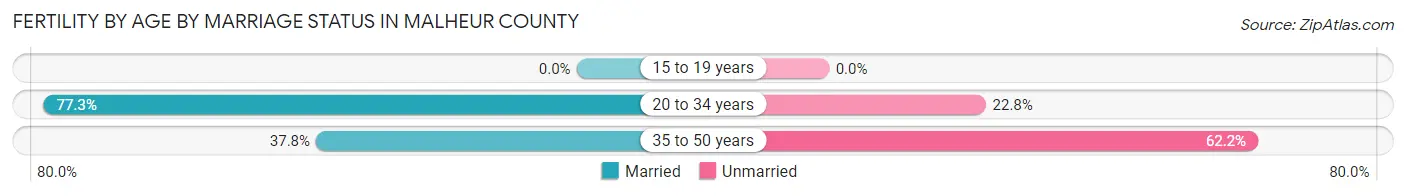
Fertility by Age by Marriage Status in Malheur County
72.8% of women with births (401) in Malheur County are married. The highest percentage of unmarried women with births falls into 35 to 50 years age bracket with 62.2% of them unmarried at the time of birth, while the lowest percentage of unmarried women with births belong to 20 to 34 years age bracket with 22.8% of them unmarried.
| Age Bracket | Married | Unmarried |
| 15 to 19 years | 0 (0.0%) | 0 (0.0%) |
| 20 to 34 years | 275 (77.2%) | 81 (22.8%) |
| 35 to 50 years | 17 (37.8%) | 28 (62.2%) |
| Total | 292 (72.8%) | 109 (27.2%) |
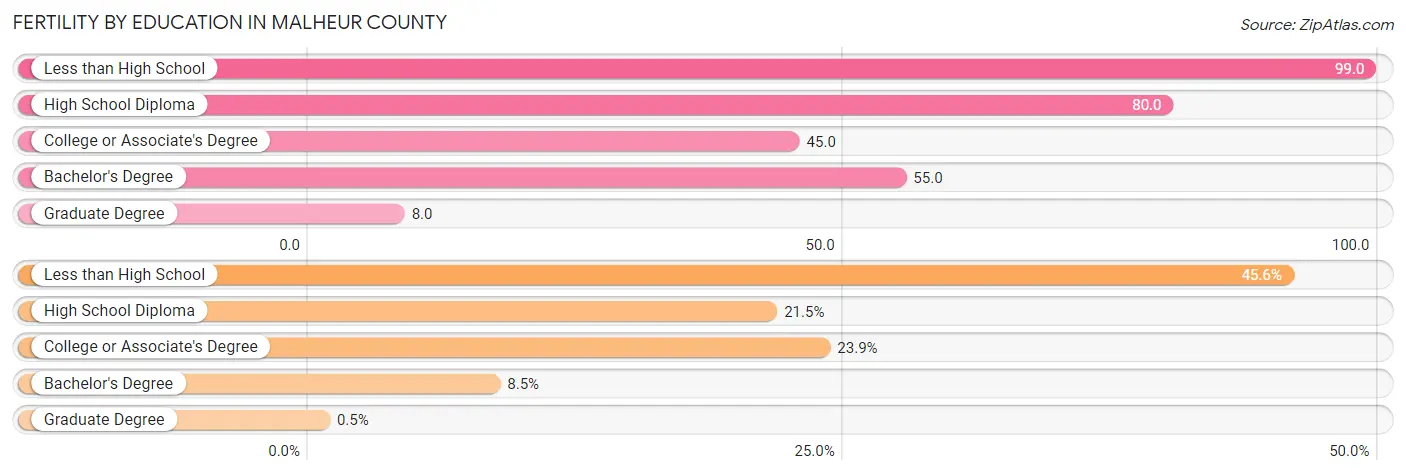
Fertility by Education in Malheur County
Average fertility rate in Malheur County is 67.0 births per 1,000 women. Women with the education attainment of less than high school have the highest fertility rate of 99.0 births per 1,000 women, while women with the education attainment of graduate degree have the lowest fertility at 8.0 births per 1,000 women. Women with the education attainment of less than high school represent 45.6% of all women with births.
| Educational Attainment | Women with Births | Births / 1,000 Women |
| Less than High School | 183 (45.6%) | 99.0 |
| High School Diploma | 86 (21.4%) | 80.0 |
| College or Associate's Degree | 96 (23.9%) | 45.0 |
| Bachelor's Degree | 34 (8.5%) | 55.0 |
| Graduate Degree | 2 (0.5%) | 8.0 |
| Total | 401 (100.0%) | 67.0 |
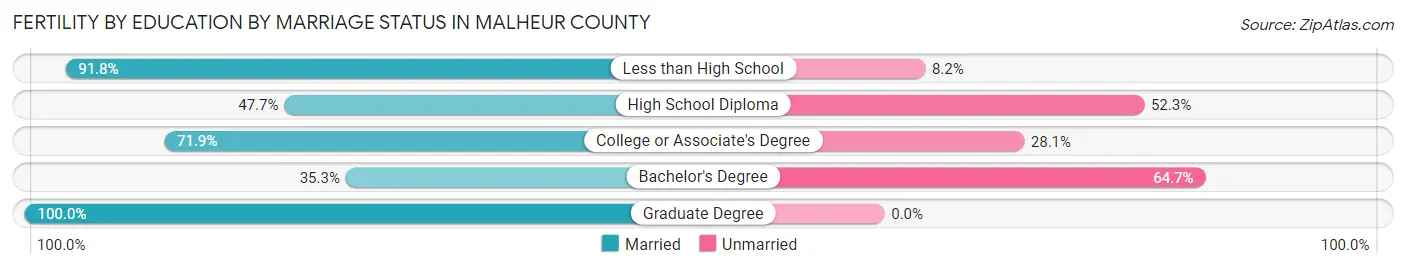
Fertility by Education by Marriage Status in Malheur County
27.2% of women with births in Malheur County are unmarried. Women with the educational attainment of graduate degree are most likely to be married with 100.0% of them married at childbirth, while women with the educational attainment of bachelor's degree are least likely to be married with 64.7% of them unmarried at childbirth.
| Educational Attainment | Married | Unmarried |
| Less than High School | 168 (91.8%) | 15 (8.2%) |
| High School Diploma | 41 (47.7%) | 45 (52.3%) |
| College or Associate's Degree | 69 (71.9%) | 27 (28.1%) |
| Bachelor's Degree | 12 (35.3%) | 22 (64.7%) |
| Graduate Degree | 2 (100.0%) | 0 (0.0%) |
| Total | 292 (72.8%) | 109 (27.2%) |
Income in Malheur County
Income Overview in Malheur County
Per Capita Income in Malheur County is $22,145, while median incomes of families and households are $61,998 and $48,371 respectively.
| Characteristic | Number | Measure |
| Per Capita Income | 31,538 | $22,145 |
| Median Family Income | 6,317 | $61,998 |
| Mean Family Income | 6,317 | $76,744 |
| Median Household Income | 9,952 | $48,371 |
| Mean Household Income | 9,952 | $63,740 |
| Income Deficit | 6,317 | $11,623 |
| Wage / Income Gap (%) | 31,538 | 9.69% |
| Wage / Income Gap ($) | 31,538 | 90.31¢ per $1 |
| Gini / Inequality Index | 31,538 | 0.44 |
Earnings by Sex in Malheur County
Average Earnings in Malheur County are $29,303, $30,155 for men and $27,234 for women, a difference of 9.7%.
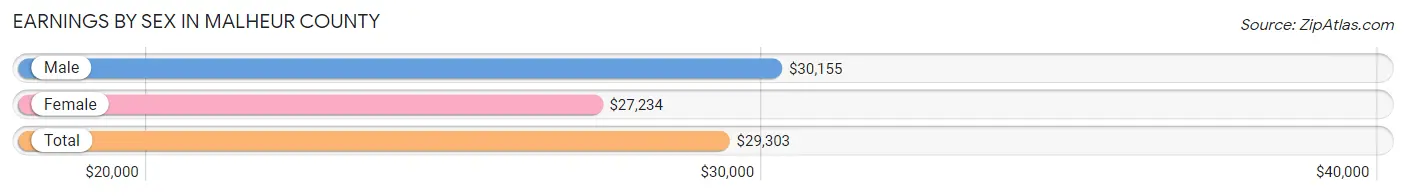
| Sex | Number | Average Earnings |
| Male | 8,122 (58.9%) | $30,155 |
| Female | 5,679 (41.1%) | $27,234 |
| Total | 13,801 (100.0%) | $29,303 |
Earnings by Sex by Income Bracket in Malheur County
The most common earnings brackets in Malheur County are $25,000 to $29,999 for men (797 | 9.8%) and $30,000 to $34,999 for women (597 | 10.5%).
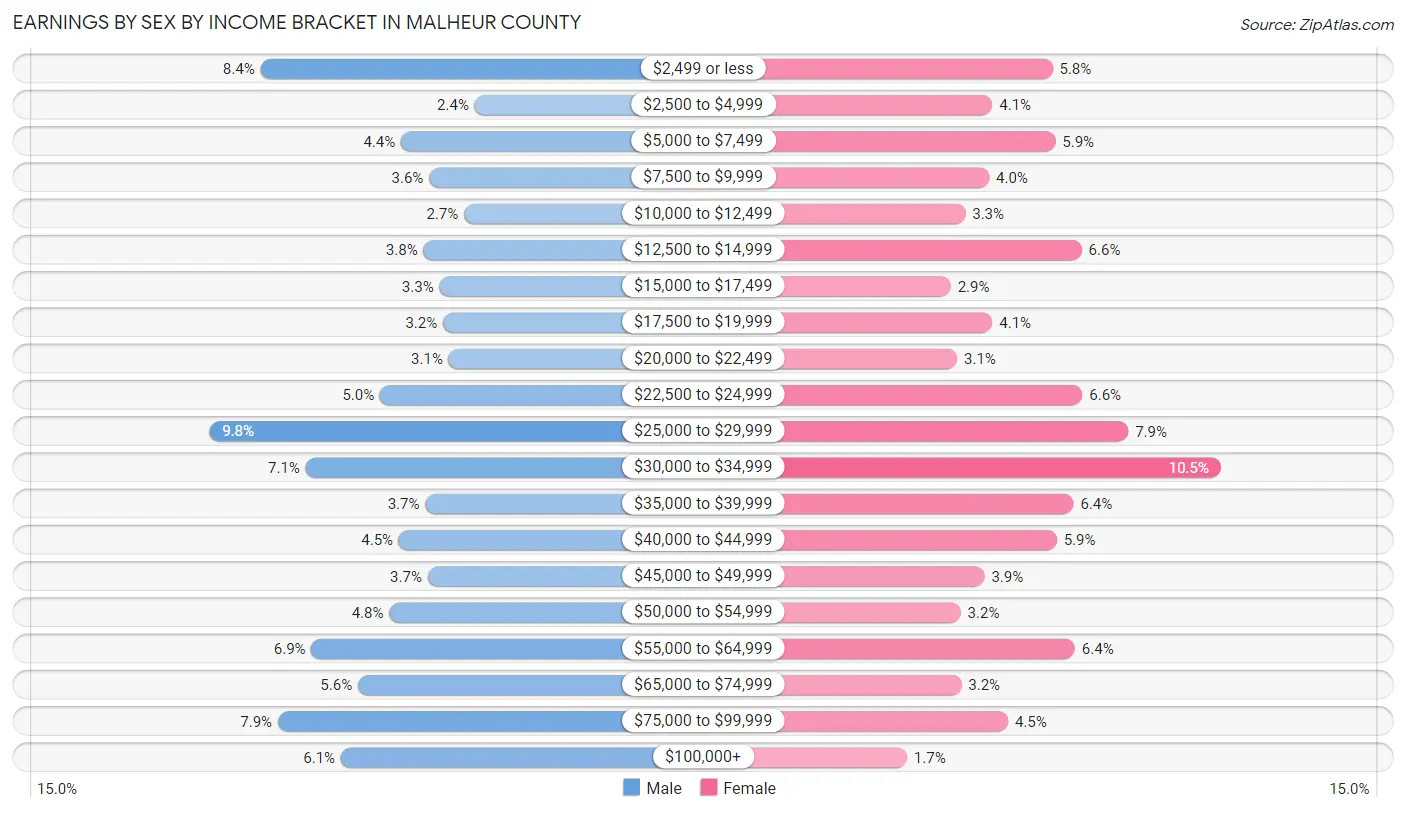
| Income | Male | Female |
| $2,499 or less | 680 (8.4%) | 328 (5.8%) |
| $2,500 to $4,999 | 191 (2.4%) | 232 (4.1%) |
| $5,000 to $7,499 | 359 (4.4%) | 333 (5.9%) |
| $7,500 to $9,999 | 295 (3.6%) | 227 (4.0%) |
| $10,000 to $12,499 | 215 (2.6%) | 189 (3.3%) |
| $12,500 to $14,999 | 308 (3.8%) | 375 (6.6%) |
| $15,000 to $17,499 | 271 (3.3%) | 166 (2.9%) |
| $17,500 to $19,999 | 263 (3.2%) | 232 (4.1%) |
| $20,000 to $22,499 | 250 (3.1%) | 176 (3.1%) |
| $22,500 to $24,999 | 407 (5.0%) | 376 (6.6%) |
| $25,000 to $29,999 | 797 (9.8%) | 449 (7.9%) |
| $30,000 to $34,999 | 577 (7.1%) | 597 (10.5%) |
| $35,000 to $39,999 | 304 (3.7%) | 362 (6.4%) |
| $40,000 to $44,999 | 364 (4.5%) | 335 (5.9%) |
| $45,000 to $49,999 | 298 (3.7%) | 220 (3.9%) |
| $50,000 to $54,999 | 386 (4.8%) | 182 (3.2%) |
| $55,000 to $64,999 | 564 (6.9%) | 364 (6.4%) |
| $65,000 to $74,999 | 457 (5.6%) | 183 (3.2%) |
| $75,000 to $99,999 | 640 (7.9%) | 257 (4.5%) |
| $100,000+ | 496 (6.1%) | 96 (1.7%) |
| Total | 8,122 (100.0%) | 5,679 (100.0%) |
Earnings by Sex by Educational Attainment in Malheur County
Average earnings in Malheur County are $36,580 for men and $30,907 for women, a difference of 15.5%. Men with an educational attainment of graduate degree enjoy the highest average annual earnings of $62,000, while those with less than high school education earn the least with $28,860. Women with an educational attainment of graduate degree earn the most with the average annual earnings of $59,141, while those with high school diploma education have the smallest earnings of $26,143.
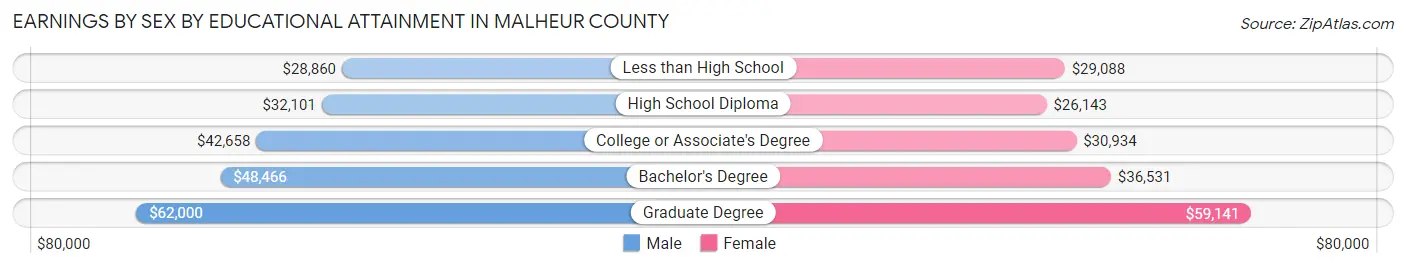
| Educational Attainment | Male Income | Female Income |
| Less than High School | $28,860 | $29,088 |
| High School Diploma | $32,101 | $26,143 |
| College or Associate's Degree | $42,658 | $30,934 |
| Bachelor's Degree | $48,466 | $36,531 |
| Graduate Degree | $62,000 | $59,141 |
| Total | $36,580 | $30,907 |
Family Income in Malheur County
Family Income Brackets in Malheur County
According to the Malheur County family income data, there are 1,390 families falling into the $50,000 to $74,999 income range, which is the most common income bracket and makes up 22.0% of all families. Conversely, the $10,000 to $14,999 income bracket is the least frequent group with only 215 families (3.4%) belonging to this category.
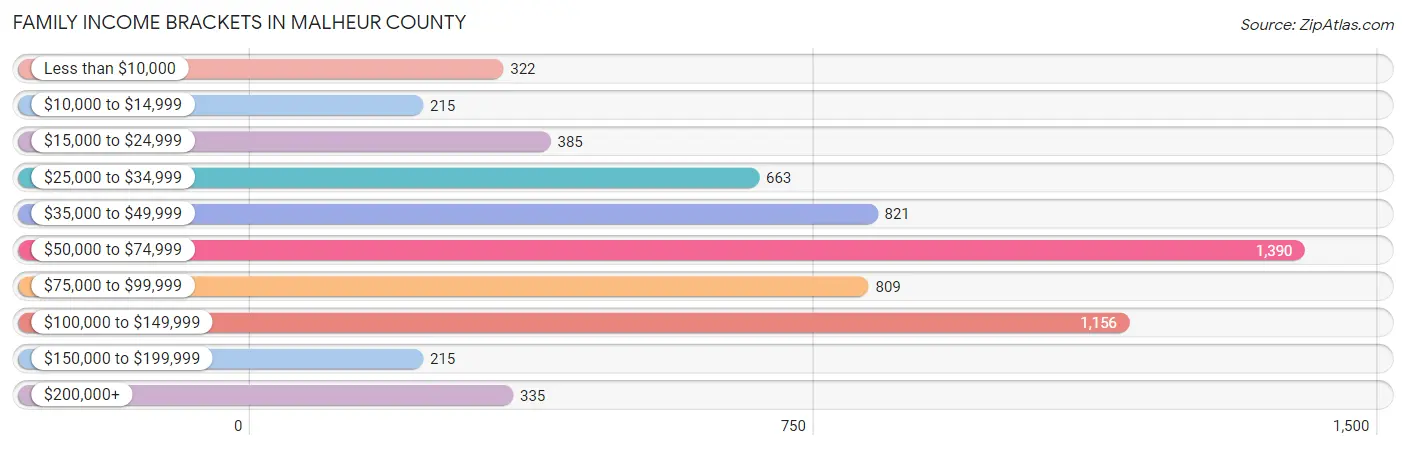
| Income Bracket | # Families | % Families |
| Less than $10,000 | 322 | 5.1% |
| $10,000 to $14,999 | 215 | 3.4% |
| $15,000 to $24,999 | 385 | 6.1% |
| $25,000 to $34,999 | 663 | 10.5% |
| $35,000 to $49,999 | 821 | 13.0% |
| $50,000 to $74,999 | 1,390 | 22.0% |
| $75,000 to $99,999 | 809 | 12.8% |
| $100,000 to $149,999 | 1,156 | 18.3% |
| $150,000 to $199,999 | 215 | 3.4% |
| $200,000+ | 335 | 5.3% |
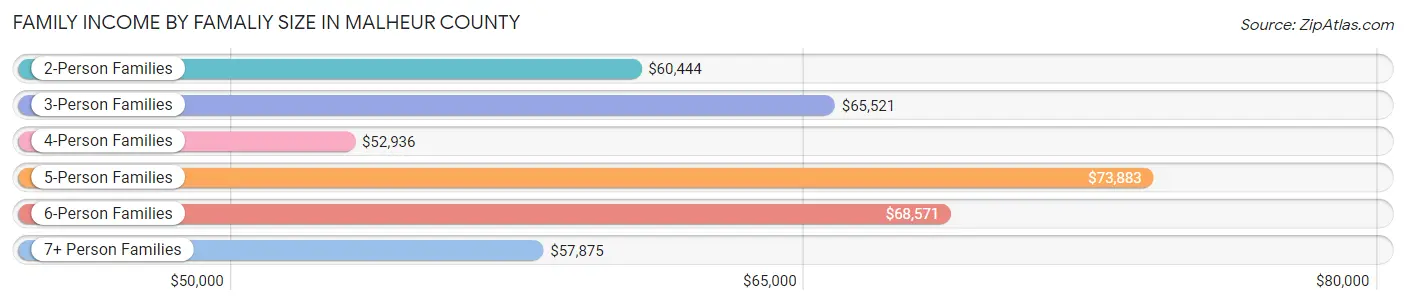
Family Income by Famaliy Size in Malheur County
5-person families (722 | 11.4%) account for the highest median family income in Malheur County with $73,883 per family, while 2-person families (2,927 | 46.3%) have the highest median income of $30,222 per family member.
| Income Bracket | # Families | Median Income |
| 2-Person Families | 2,927 (46.3%) | $60,444 |
| 3-Person Families | 1,254 (19.9%) | $65,521 |
| 4-Person Families | 947 (15.0%) | $52,936 |
| 5-Person Families | 722 (11.4%) | $73,883 |
| 6-Person Families | 304 (4.8%) | $68,571 |
| 7+ Person Families | 163 (2.6%) | $57,875 |
| Total | 6,317 (100.0%) | $61,998 |
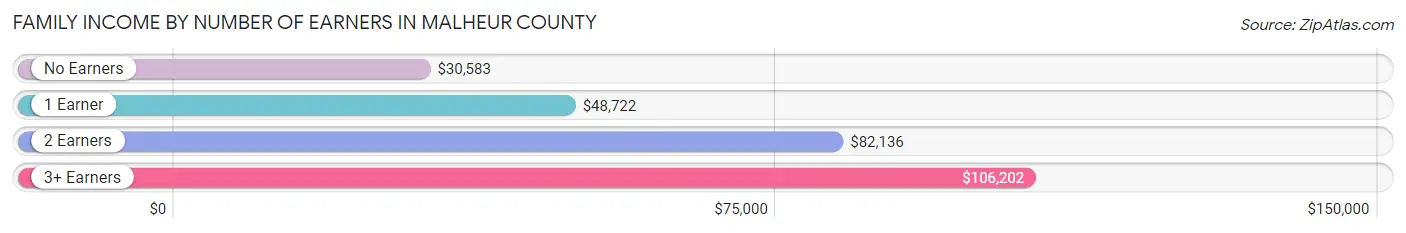
Family Income by Number of Earners in Malheur County
The median family income in Malheur County is $61,998, with families comprising 3+ earners (598) having the highest median family income of $106,202, while families with no earners (1,025) have the lowest median family income of $30,583, accounting for 9.5% and 16.2% of families, respectively.
| Number of Earners | # Families | Median Income |
| No Earners | 1,025 (16.2%) | $30,583 |
| 1 Earner | 2,420 (38.3%) | $48,722 |
| 2 Earners | 2,274 (36.0%) | $82,136 |
| 3+ Earners | 598 (9.5%) | $106,202 |
| Total | 6,317 (100.0%) | $61,998 |
Household Income in Malheur County
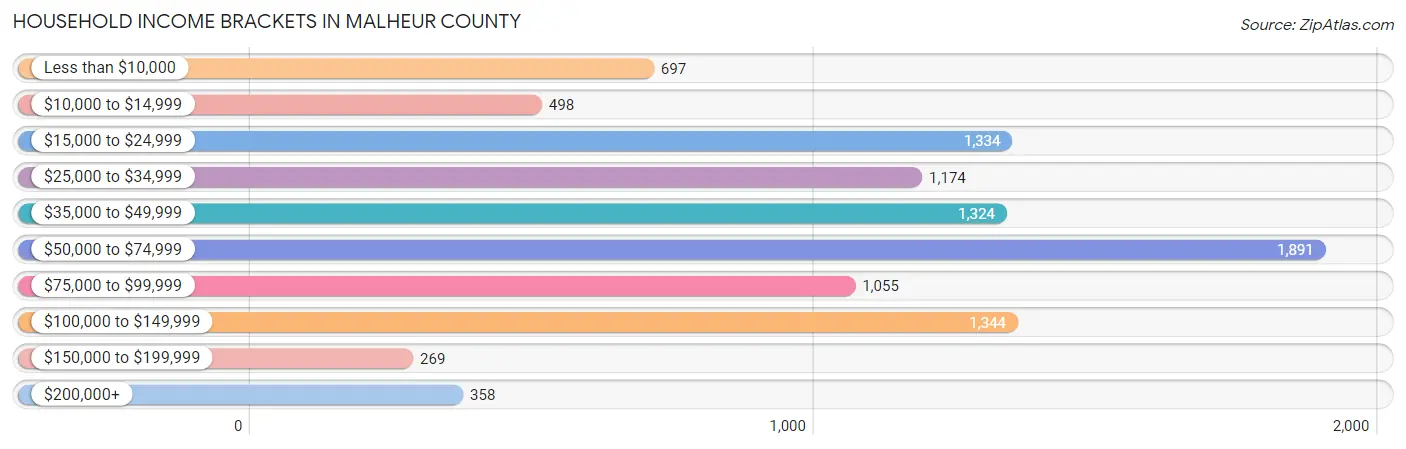
Household Income Brackets in Malheur County
With 1,891 households falling in the category, the $50,000 to $74,999 income range is the most frequent in Malheur County, accounting for 19.0% of all households. In contrast, only 269 households (2.7%) fall into the $150,000 to $199,999 income bracket, making it the least populous group.
| Income Bracket | # Households | % Households |
| Less than $10,000 | 697 | 7.0% |
| $10,000 to $14,999 | 498 | 5.0% |
| $15,000 to $24,999 | 1,334 | 13.4% |
| $25,000 to $34,999 | 1,174 | 11.8% |
| $35,000 to $49,999 | 1,324 | 13.3% |
| $50,000 to $74,999 | 1,891 | 19.0% |
| $75,000 to $99,999 | 1,055 | 10.6% |
| $100,000 to $149,999 | 1,344 | 13.5% |
| $150,000 to $199,999 | 269 | 2.7% |
| $200,000+ | 358 | 3.6% |
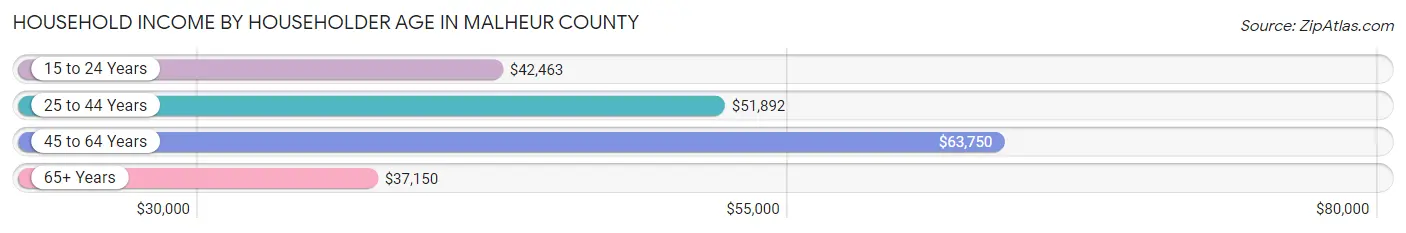
Household Income by Householder Age in Malheur County
The median household income in Malheur County is $48,371, with the highest median household income of $63,750 found in the 45 to 64 years age bracket for the primary householder. A total of 3,231 households (32.5%) fall into this category. Meanwhile, the 65+ years age bracket for the primary householder has the lowest median household income of $37,150, with 3,127 households (31.4%) in this group.
| Income Bracket | # Households | Median Income |
| 15 to 24 Years | 653 (6.6%) | $42,463 |
| 25 to 44 Years | 2,941 (29.5%) | $51,892 |
| 45 to 64 Years | 3,231 (32.5%) | $63,750 |
| 65+ Years | 3,127 (31.4%) | $37,150 |
| Total | 9,952 (100.0%) | $48,371 |
Poverty in Malheur County
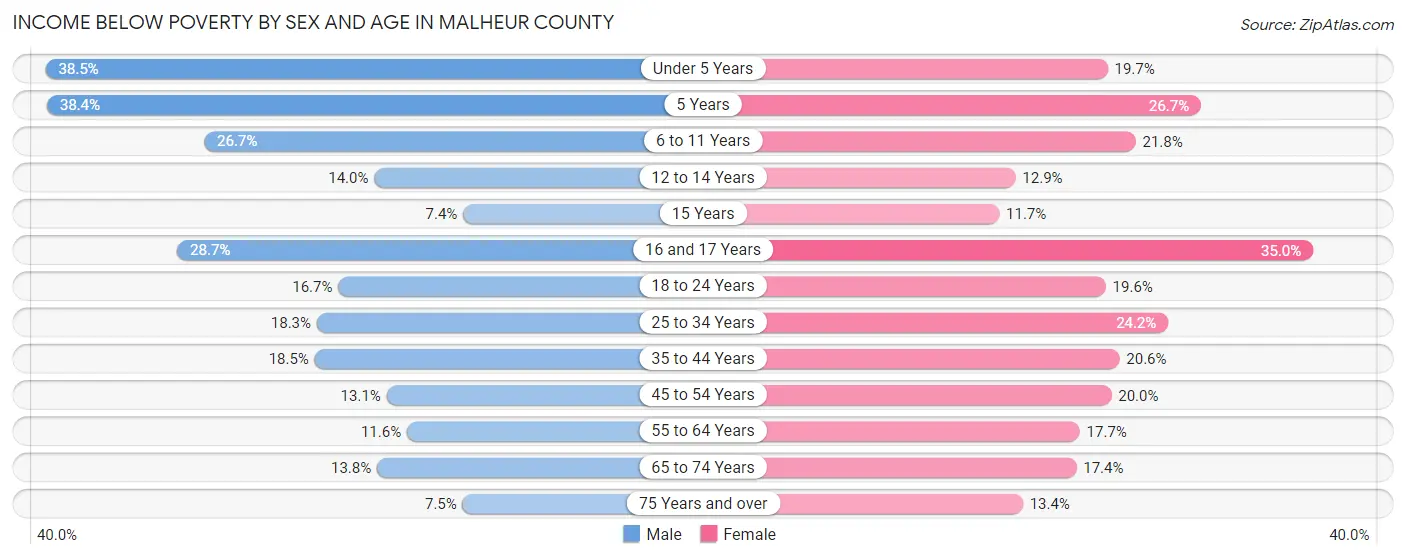
Income Below Poverty by Sex and Age in Malheur County
With 18.2% poverty level for males and 19.6% for females among the residents of Malheur County, under 5 year old males and 16 and 17 year old females are the most vulnerable to poverty, with 383 males (38.5%) and 148 females (35.0%) in their respective age groups living below the poverty level.
| Age Bracket | Male | Female |
| Under 5 Years | 383 (38.5%) | 191 (19.7%) |
| 5 Years | 79 (38.4%) | 40 (26.7%) |
| 6 to 11 Years | 359 (26.7%) | 294 (21.8%) |
| 12 to 14 Years | 108 (14.0%) | 86 (12.9%) |
| 15 Years | 18 (7.4%) | 25 (11.7%) |
| 16 and 17 Years | 123 (28.7%) | 148 (35.0%) |
| 18 to 24 Years | 261 (16.7%) | 232 (19.6%) |
| 25 to 34 Years | 328 (18.3%) | 393 (24.2%) |
| 35 to 44 Years | 270 (18.5%) | 323 (20.6%) |
| 45 to 54 Years | 197 (13.1%) | 287 (20.0%) |
| 55 to 64 Years | 176 (11.6%) | 288 (17.7%) |
| 65 to 74 Years | 179 (13.8%) | 259 (17.4%) |
| 75 Years and over | 68 (7.5%) | 161 (13.4%) |
| Total | 2,549 (18.2%) | 2,727 (19.6%) |
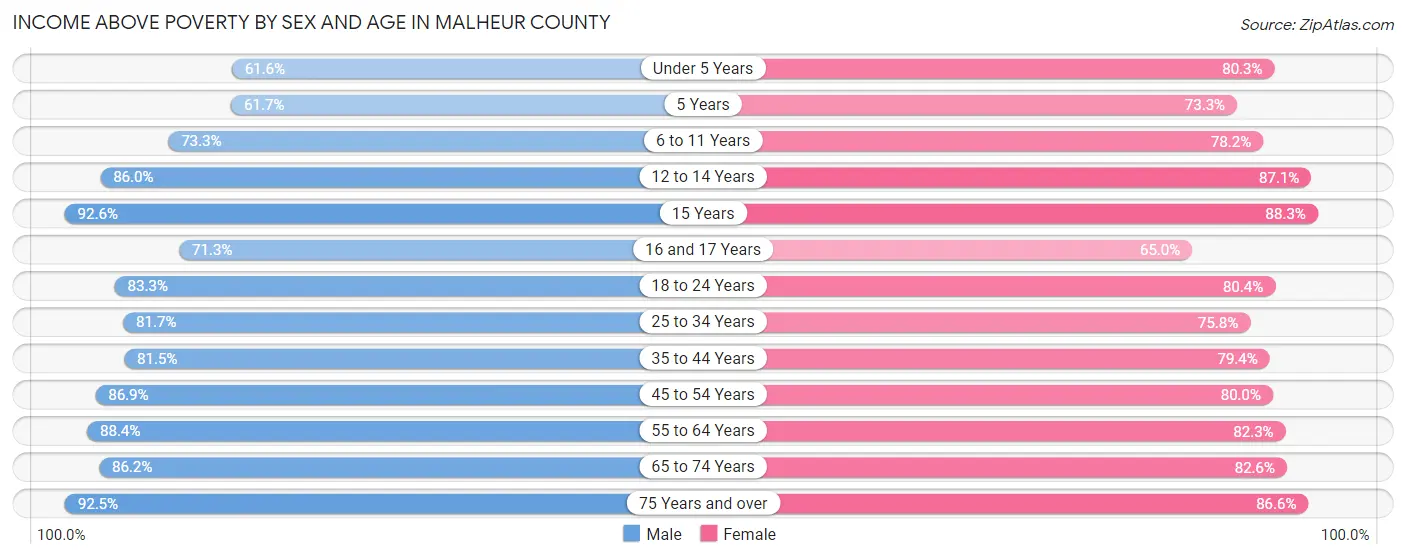
Income Above Poverty by Sex and Age in Malheur County
According to the poverty statistics in Malheur County, males aged 15 years and females aged 15 years are the age groups that are most secure financially, with 92.6% of males and 88.3% of females in these age groups living above the poverty line.
| Age Bracket | Male | Female |
| Under 5 Years | 613 (61.6%) | 777 (80.3%) |
| 5 Years | 127 (61.7%) | 110 (73.3%) |
| 6 to 11 Years | 987 (73.3%) | 1,054 (78.2%) |
| 12 to 14 Years | 661 (86.0%) | 581 (87.1%) |
| 15 Years | 224 (92.6%) | 189 (88.3%) |
| 16 and 17 Years | 306 (71.3%) | 275 (65.0%) |
| 18 to 24 Years | 1,301 (83.3%) | 952 (80.4%) |
| 25 to 34 Years | 1,464 (81.7%) | 1,229 (75.8%) |
| 35 to 44 Years | 1,193 (81.5%) | 1,244 (79.4%) |
| 45 to 54 Years | 1,304 (86.9%) | 1,147 (80.0%) |
| 55 to 64 Years | 1,340 (88.4%) | 1,343 (82.3%) |
| 65 to 74 Years | 1,115 (86.2%) | 1,229 (82.6%) |
| 75 Years and over | 841 (92.5%) | 1,038 (86.6%) |
| Total | 11,476 (81.8%) | 11,168 (80.4%) |
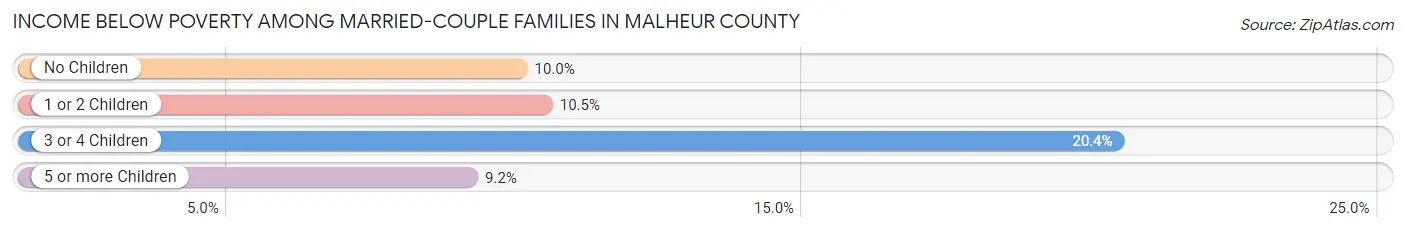
Income Below Poverty Among Married-Couple Families in Malheur County
The poverty statistics for married-couple families in Malheur County show that 11.6% or 507 of the total 4,377 families live below the poverty line. Families with 3 or 4 children have the highest poverty rate of 20.4%, comprising of 124 families. On the other hand, families with 5 or more children have the lowest poverty rate of 9.2%, which includes 9 families.
| Children | Above Poverty | Below Poverty |
| No Children | 2,222 (90.0%) | 248 (10.0%) |
| 1 or 2 Children | 1,076 (89.5%) | 126 (10.5%) |
| 3 or 4 Children | 483 (79.6%) | 124 (20.4%) |
| 5 or more Children | 89 (90.8%) | 9 (9.2%) |
| Total | 3,870 (88.4%) | 507 (11.6%) |
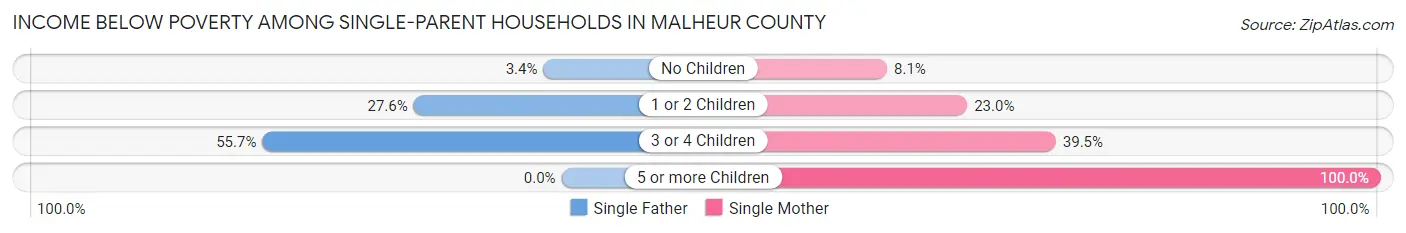
Income Below Poverty Among Single-Parent Households in Malheur County
According to the poverty data in Malheur County, 21.3% or 149 single-father households and 22.9% or 284 single-mother households are living below the poverty line. Among single-father households, those with 3 or 4 children have the highest poverty rate, with 68 households (55.7%) experiencing poverty. Likewise, among single-mother households, those with 5 or more children have the highest poverty rate, with 8 households (100.0%) falling below the poverty line.
| Children | Single Father | Single Mother |
| No Children | 11 (3.4%) | 30 (8.1%) |
| 1 or 2 Children | 70 (27.6%) | 131 (23.0%) |
| 3 or 4 Children | 68 (55.7%) | 115 (39.5%) |
| 5 or more Children | 0 (0.0%) | 8 (100.0%) |
| Total | 149 (21.3%) | 284 (22.9%) |
Income Below Poverty Among Married-Couple vs Single-Parent Households in Malheur County
The poverty data for Malheur County shows that 507 of the married-couple family households (11.6%) and 433 of the single-parent households (22.3%) are living below the poverty level. Within the married-couple family households, those with 3 or 4 children have the highest poverty rate, with 124 households (20.4%) falling below the poverty line. Among the single-parent households, those with 5 or more children have the highest poverty rate, with 8 household (100.0%) living below poverty.
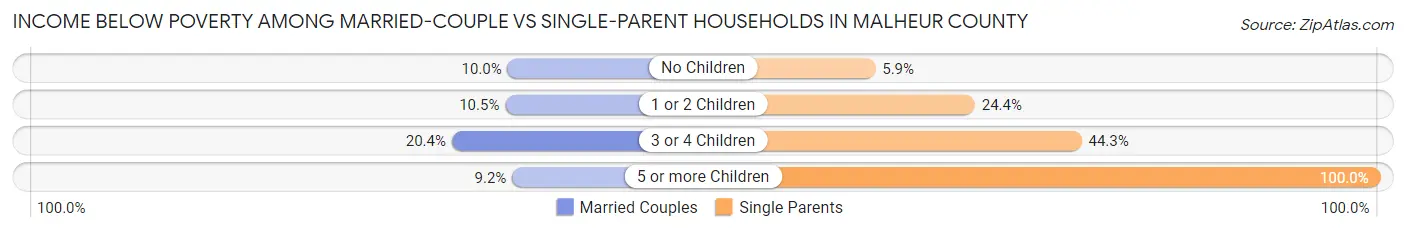
| Children | Married-Couple Families | Single-Parent Households |
| No Children | 248 (10.0%) | 41 (5.9%) |
| 1 or 2 Children | 126 (10.5%) | 201 (24.4%) |
| 3 or 4 Children | 124 (20.4%) | 183 (44.3%) |
| 5 or more Children | 9 (9.2%) | 8 (100.0%) |
| Total | 507 (11.6%) | 433 (22.3%) |
Employment Characteristics in Malheur County
Employment by Class of Employer in Malheur County
Among the 11,394 employed individuals in Malheur County, private company employees (7,517 | 66.0%), local government employees (935 | 8.2%), and state government employees (837 | 7.3%) make up the most common classes of employment.
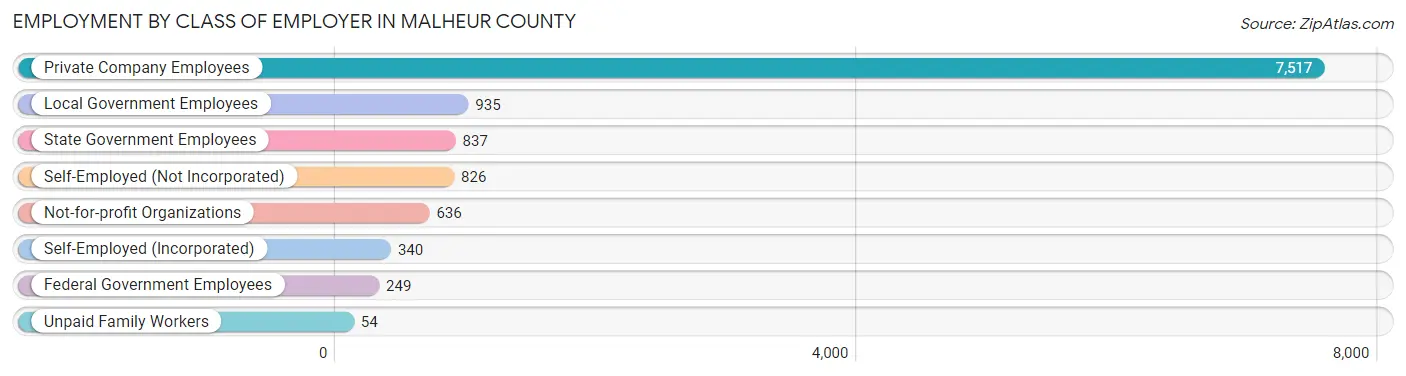
| Employer Class | # Employees | % Employees |
| Private Company Employees | 7,517 | 66.0% |
| Self-Employed (Incorporated) | 340 | 3.0% |
| Self-Employed (Not Incorporated) | 826 | 7.2% |
| Not-for-profit Organizations | 636 | 5.6% |
| Local Government Employees | 935 | 8.2% |
| State Government Employees | 837 | 7.3% |
| Federal Government Employees | 249 | 2.2% |
| Unpaid Family Workers | 54 | 0.5% |
| Total | 11,394 | 100.0% |
Employment Status by Age in Malheur County
According to the labor force statistics for Malheur County, out of the total population over 16 years of age (24,435), 50.8% or 12,413 individuals are in the labor force, with 6.2% or 770 of them unemployed. The age group with the highest labor force participation rate is 20 to 24 years, with 71.7% or 1,624 individuals in the labor force. Within the labor force, the 16 to 19 years age range has the highest percentage of unemployed individuals, with 31.0% or 261 of them being unemployed.
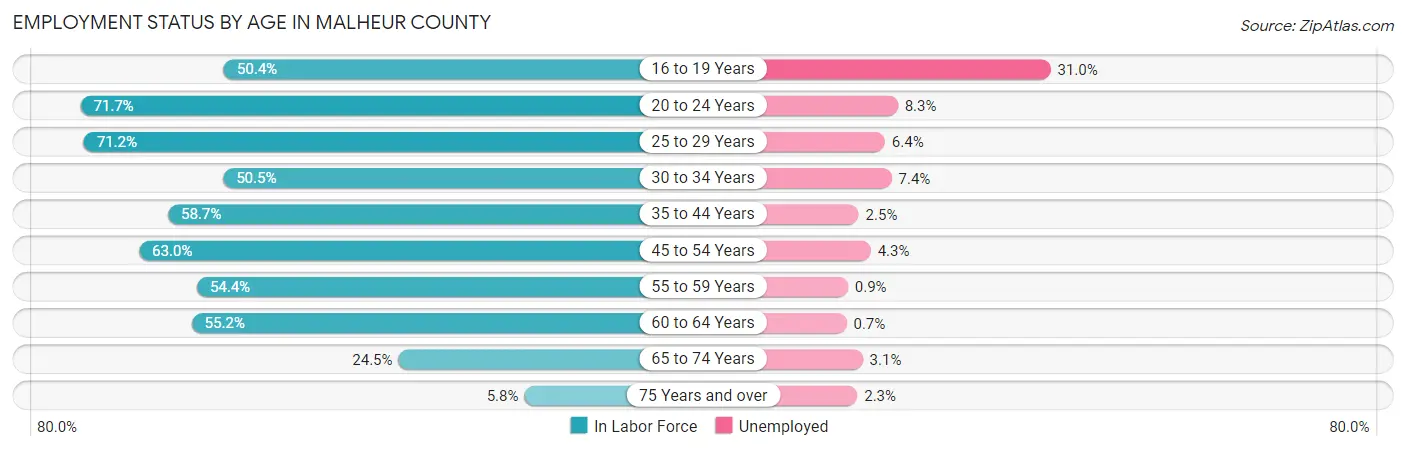
| Age Bracket | In Labor Force | Unemployed |
| 16 to 19 Years | 843 (50.4%) | 261 (31.0%) |
| 20 to 24 Years | 1,624 (71.7%) | 135 (8.3%) |
| 25 to 29 Years | 1,615 (71.2%) | 103 (6.4%) |
| 30 to 34 Years | 1,041 (50.5%) | 77 (7.4%) |
| 35 to 44 Years | 2,268 (58.7%) | 57 (2.5%) |
| 45 to 54 Years | 2,223 (63.0%) | 96 (4.3%) |
| 55 to 59 Years | 907 (54.4%) | 8 (0.9%) |
| 60 to 64 Years | 1,022 (55.2%) | 7 (0.7%) |
| 65 to 74 Years | 739 (24.5%) | 23 (3.1%) |
| 75 Years and over | 130 (5.8%) | 3 (2.3%) |
| Total | 12,413 (50.8%) | 770 (6.2%) |
Employment Status by Educational Attainment in Malheur County
According to labor force statistics for Malheur County, 59.6% of individuals (9,083) out of the total population between 25 and 64 years of age (15,240) are in the labor force, with 3.8% or 345 of them being unemployed. The group with the highest labor force participation rate are those with the educational attainment of bachelor's degree or higher, with 79.8% or 1,597 individuals in the labor force. Within the labor force, individuals with high school diploma education have the highest percentage of unemployment, with 5.9% or 143 of them being unemployed.
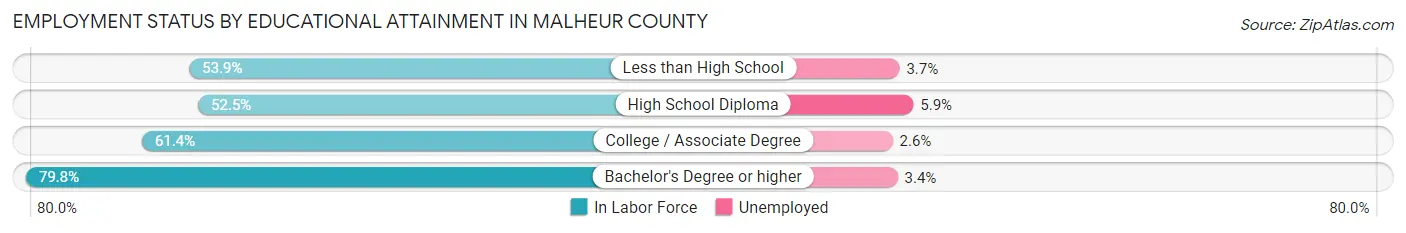
| Educational Attainment | In Labor Force | Unemployed |
| Less than High School | 1,689 (53.9%) | 116 (3.7%) |
| High School Diploma | 2,423 (52.5%) | 272 (5.9%) |
| College / Associate Degree | 3,370 (61.4%) | 143 (2.6%) |
| Bachelor's Degree or higher | 1,597 (79.8%) | 68 (3.4%) |
| Total | 9,083 (59.6%) | 579 (3.8%) |
Employment Occupations by Sex in Malheur County
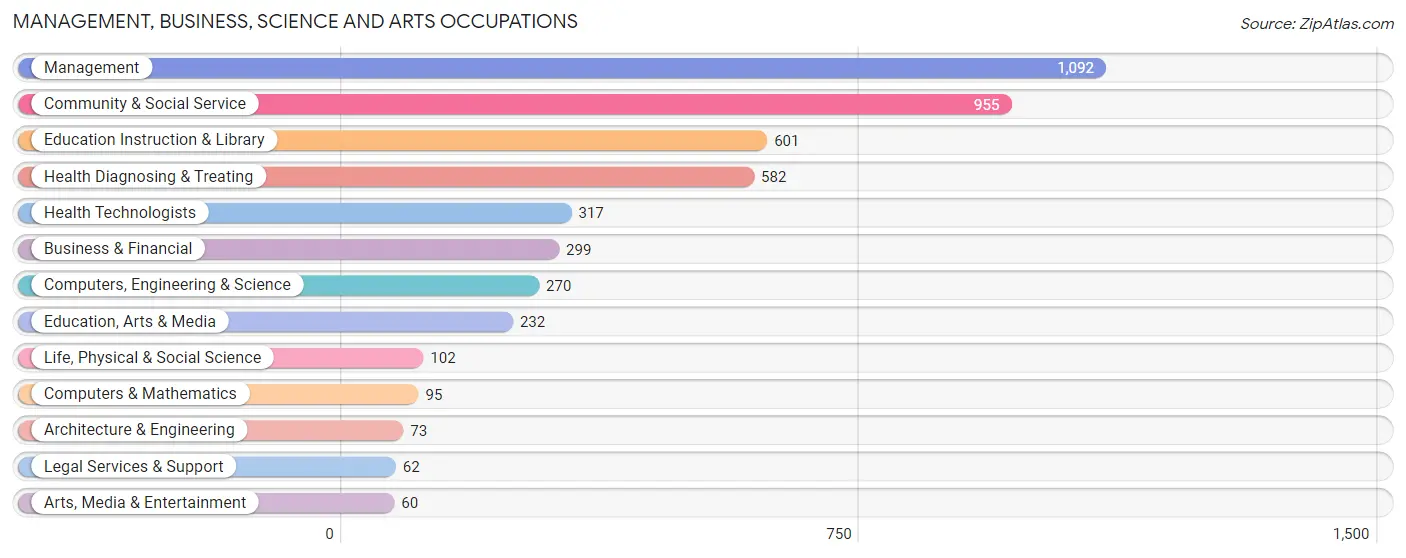
Management, Business, Science and Arts Occupations
The most common Management, Business, Science and Arts occupations in Malheur County are Management (1,092 | 9.4%), Community & Social Service (955 | 8.2%), Education Instruction & Library (601 | 5.2%), Health Diagnosing & Treating (582 | 5.0%), and Health Technologists (317 | 2.7%).
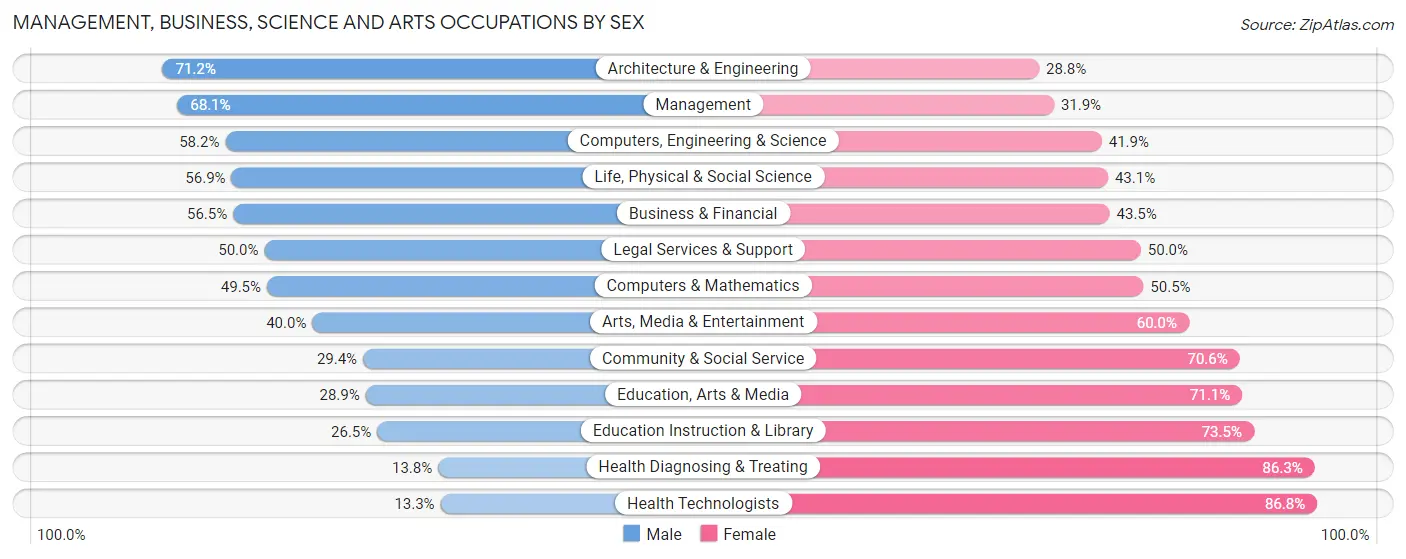
Management, Business, Science and Arts Occupations by Sex
Within the Management, Business, Science and Arts occupations in Malheur County, the most male-oriented occupations are Architecture & Engineering (71.2%), Management (68.1%), and Computers, Engineering & Science (58.2%), while the most female-oriented occupations are Health Technologists (86.8%), Health Diagnosing & Treating (86.3%), and Education Instruction & Library (73.5%).
| Occupation | Male | Female |
| Management | 744 (68.1%) | 348 (31.9%) |
| Business & Financial | 169 (56.5%) | 130 (43.5%) |
| Computers, Engineering & Science | 157 (58.2%) | 113 (41.8%) |
| Computers & Mathematics | 47 (49.5%) | 48 (50.5%) |
| Architecture & Engineering | 52 (71.2%) | 21 (28.8%) |
| Life, Physical & Social Science | 58 (56.9%) | 44 (43.1%) |
| Community & Social Service | 281 (29.4%) | 674 (70.6%) |
| Education, Arts & Media | 67 (28.9%) | 165 (71.1%) |
| Legal Services & Support | 31 (50.0%) | 31 (50.0%) |
| Education Instruction & Library | 159 (26.5%) | 442 (73.5%) |
| Arts, Media & Entertainment | 24 (40.0%) | 36 (60.0%) |
| Health Diagnosing & Treating | 80 (13.8%) | 502 (86.3%) |
| Health Technologists | 42 (13.3%) | 275 (86.8%) |
| Total (Category) | 1,431 (44.8%) | 1,767 (55.2%) |
| Total (Overall) | 6,613 (56.9%) | 5,011 (43.1%) |
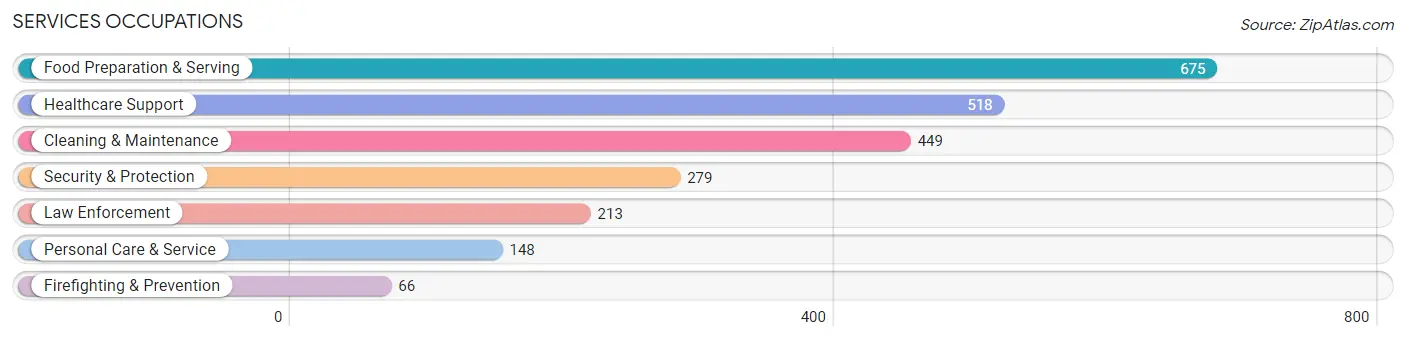
Services Occupations
The most common Services occupations in Malheur County are Food Preparation & Serving (675 | 5.8%), Healthcare Support (518 | 4.5%), Cleaning & Maintenance (449 | 3.9%), Security & Protection (279 | 2.4%), and Law Enforcement (213 | 1.8%).
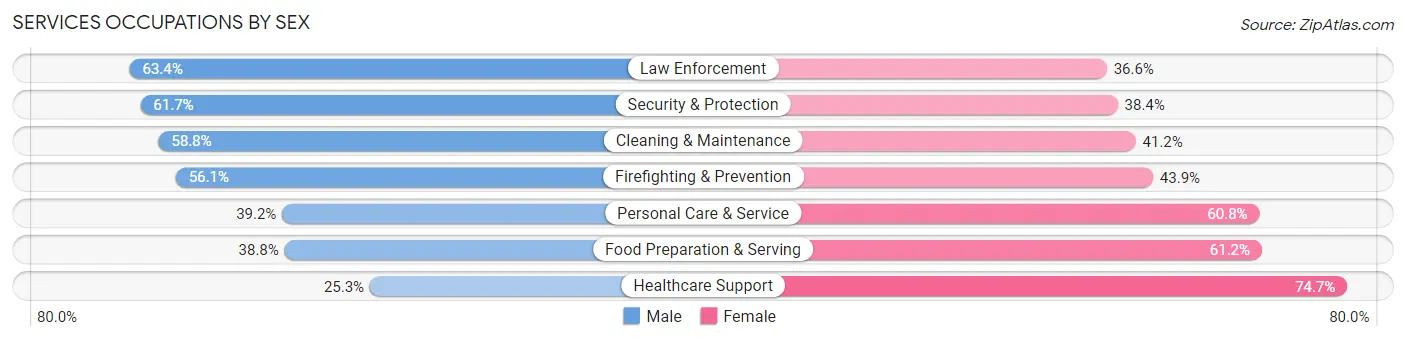
Services Occupations by Sex
Within the Services occupations in Malheur County, the most male-oriented occupations are Law Enforcement (63.4%), Security & Protection (61.7%), and Cleaning & Maintenance (58.8%), while the most female-oriented occupations are Healthcare Support (74.7%), Food Preparation & Serving (61.2%), and Personal Care & Service (60.8%).
| Occupation | Male | Female |
| Healthcare Support | 131 (25.3%) | 387 (74.7%) |
| Security & Protection | 172 (61.7%) | 107 (38.4%) |
| Firefighting & Prevention | 37 (56.1%) | 29 (43.9%) |
| Law Enforcement | 135 (63.4%) | 78 (36.6%) |
| Food Preparation & Serving | 262 (38.8%) | 413 (61.2%) |
| Cleaning & Maintenance | 264 (58.8%) | 185 (41.2%) |
| Personal Care & Service | 58 (39.2%) | 90 (60.8%) |
| Total (Category) | 887 (42.9%) | 1,182 (57.1%) |
| Total (Overall) | 6,613 (56.9%) | 5,011 (43.1%) |
Sales and Office Occupations
The most common Sales and Office occupations in Malheur County are Sales & Related (959 | 8.3%), and Office & Administration (893 | 7.7%).

Sales and Office Occupations by Sex
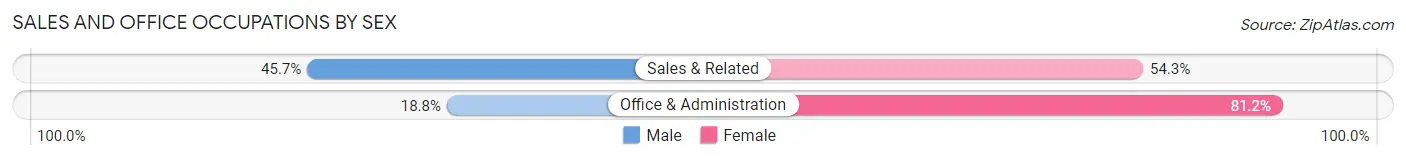
| Occupation | Male | Female |
| Sales & Related | 438 (45.7%) | 521 (54.3%) |
| Office & Administration | 168 (18.8%) | 725 (81.2%) |
| Total (Category) | 606 (32.7%) | 1,246 (67.3%) |
| Total (Overall) | 6,613 (56.9%) | 5,011 (43.1%) |
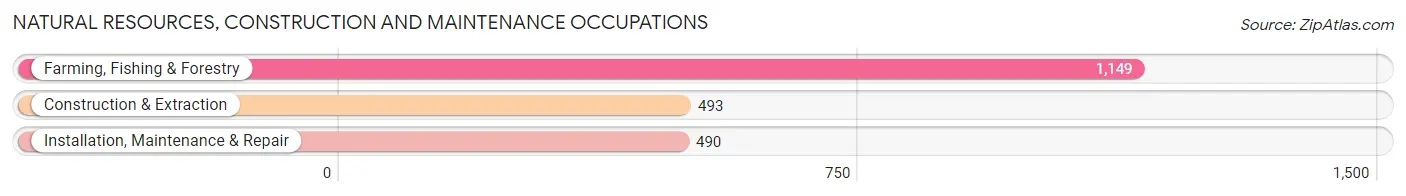
Natural Resources, Construction and Maintenance Occupations
The most common Natural Resources, Construction and Maintenance occupations in Malheur County are Farming, Fishing & Forestry (1,149 | 9.9%), Construction & Extraction (493 | 4.2%), and Installation, Maintenance & Repair (490 | 4.2%).
Natural Resources, Construction and Maintenance Occupations by Sex
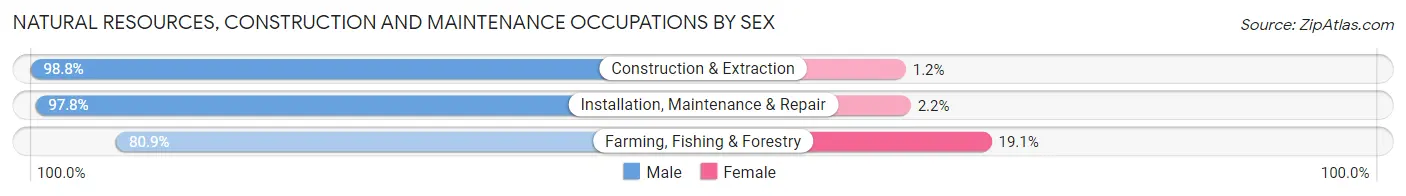
| Occupation | Male | Female |
| Farming, Fishing & Forestry | 930 (80.9%) | 219 (19.1%) |
| Construction & Extraction | 487 (98.8%) | 6 (1.2%) |
| Installation, Maintenance & Repair | 479 (97.8%) | 11 (2.2%) |
| Total (Category) | 1,896 (88.9%) | 236 (11.1%) |
| Total (Overall) | 6,613 (56.9%) | 5,011 (43.1%) |
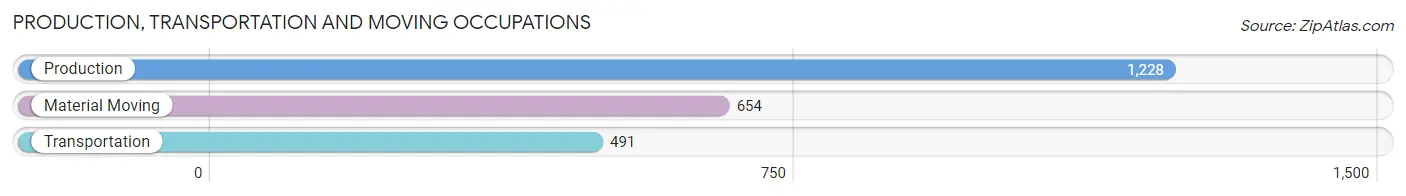
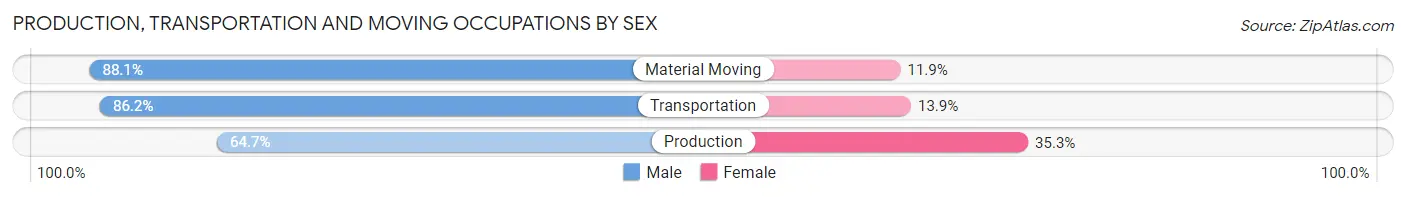
Production, Transportation and Moving Occupations
The most common Production, Transportation and Moving occupations in Malheur County are Production (1,228 | 10.6%), Material Moving (654 | 5.6%), and Transportation (491 | 4.2%).
Production, Transportation and Moving Occupations by Sex
| Occupation | Male | Female |
| Production | 794 (64.7%) | 434 (35.3%) |
| Transportation | 423 (86.2%) | 68 (13.9%) |
| Material Moving | 576 (88.1%) | 78 (11.9%) |
| Total (Category) | 1,793 (75.6%) | 580 (24.4%) |
| Total (Overall) | 6,613 (56.9%) | 5,011 (43.1%) |
Employment Industries by Sex in Malheur County
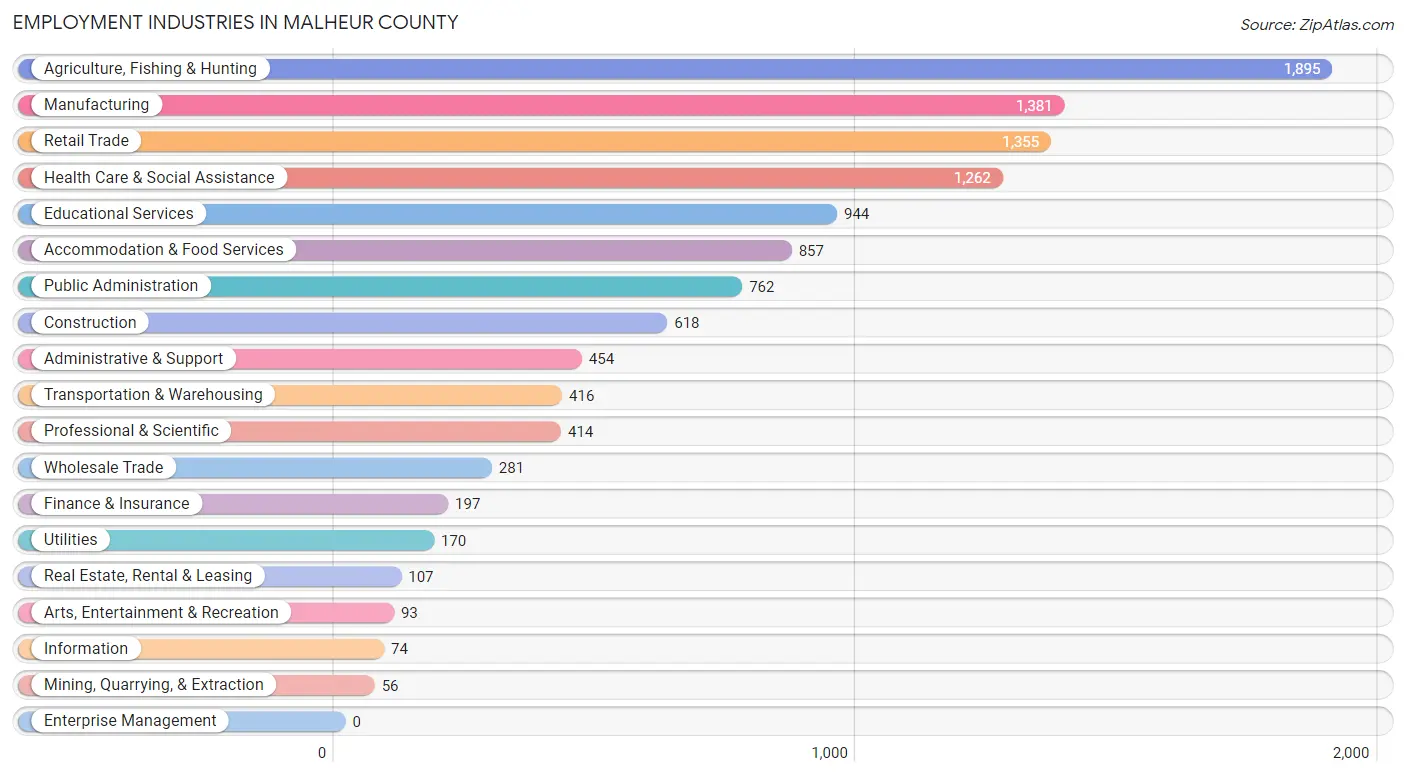
Employment Industries in Malheur County
The major employment industries in Malheur County include Agriculture, Fishing & Hunting (1,895 | 16.3%), Manufacturing (1,381 | 11.9%), Retail Trade (1,355 | 11.7%), Health Care & Social Assistance (1,262 | 10.9%), and Educational Services (944 | 8.1%).
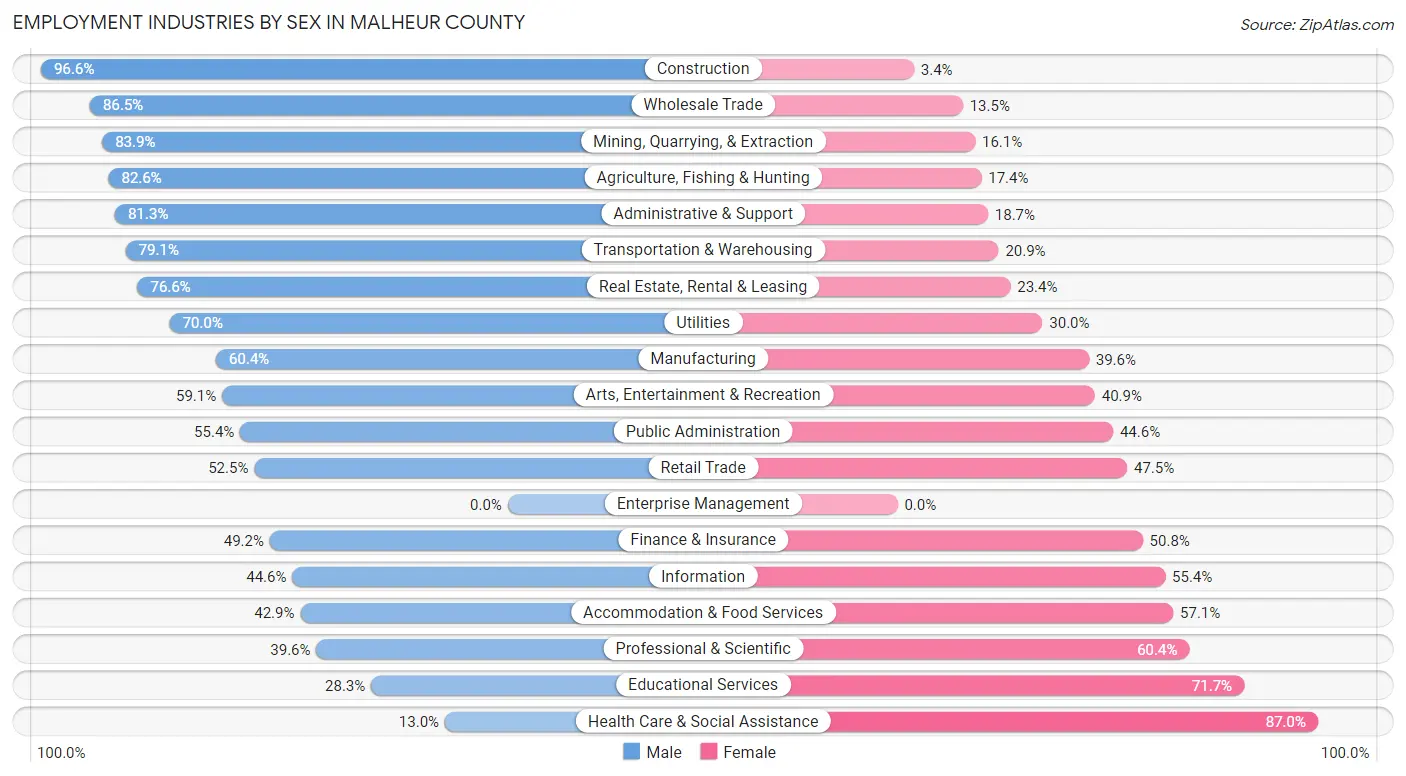
Employment Industries by Sex in Malheur County
The Malheur County industries that see more men than women are Construction (96.6%), Wholesale Trade (86.5%), and Mining, Quarrying, & Extraction (83.9%), whereas the industries that tend to have a higher number of women are Health Care & Social Assistance (87.0%), Educational Services (71.7%), and Professional & Scientific (60.4%).
| Industry | Male | Female |
| Agriculture, Fishing & Hunting | 1,566 (82.6%) | 329 (17.4%) |
| Mining, Quarrying, & Extraction | 47 (83.9%) | 9 (16.1%) |
| Construction | 597 (96.6%) | 21 (3.4%) |
| Manufacturing | 834 (60.4%) | 547 (39.6%) |
| Wholesale Trade | 243 (86.5%) | 38 (13.5%) |
| Retail Trade | 711 (52.5%) | 644 (47.5%) |
| Transportation & Warehousing | 329 (79.1%) | 87 (20.9%) |
| Utilities | 119 (70.0%) | 51 (30.0%) |
| Information | 33 (44.6%) | 41 (55.4%) |
| Finance & Insurance | 97 (49.2%) | 100 (50.8%) |
| Real Estate, Rental & Leasing | 82 (76.6%) | 25 (23.4%) |
| Professional & Scientific | 164 (39.6%) | 250 (60.4%) |
| Enterprise Management | 0 (0.0%) | 0 (0.0%) |
| Administrative & Support | 369 (81.3%) | 85 (18.7%) |
| Educational Services | 267 (28.3%) | 677 (71.7%) |
| Health Care & Social Assistance | 164 (13.0%) | 1,098 (87.0%) |
| Arts, Entertainment & Recreation | 55 (59.1%) | 38 (40.9%) |
| Accommodation & Food Services | 368 (42.9%) | 489 (57.1%) |
| Public Administration | 422 (55.4%) | 340 (44.6%) |
| Total | 6,613 (56.9%) | 5,011 (43.1%) |
Education in Malheur County
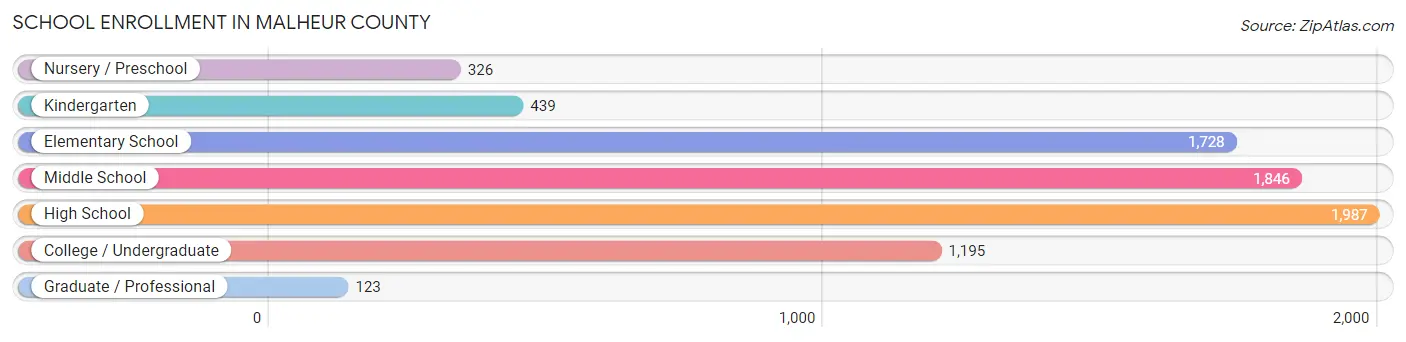
School Enrollment in Malheur County
The most common levels of schooling among the 7,644 students in Malheur County are high school (1,987 | 26.0%), middle school (1,846 | 24.1%), and elementary school (1,728 | 22.6%).
| School Level | # Students | % Students |
| Nursery / Preschool | 326 | 4.3% |
| Kindergarten | 439 | 5.7% |
| Elementary School | 1,728 | 22.6% |
| Middle School | 1,846 | 24.1% |
| High School | 1,987 | 26.0% |
| College / Undergraduate | 1,195 | 15.6% |
| Graduate / Professional | 123 | 1.6% |
| Total | 7,644 | 100.0% |
School Enrollment by Age by Funding Source in Malheur County
Out of a total of 7,644 students who are enrolled in schools in Malheur County, 795 (10.4%) attend a private institution, while the remaining 6,849 (89.6%) are enrolled in public schools. The age group of 20 to 24 year olds has the highest likelihood of being enrolled in private schools, with 111 (27.2% in the age bracket) enrolled. Conversely, the age group of 25 to 34 year olds has the lowest likelihood of being enrolled in a private school, with 374 (95.9% in the age bracket) attending a public institution.
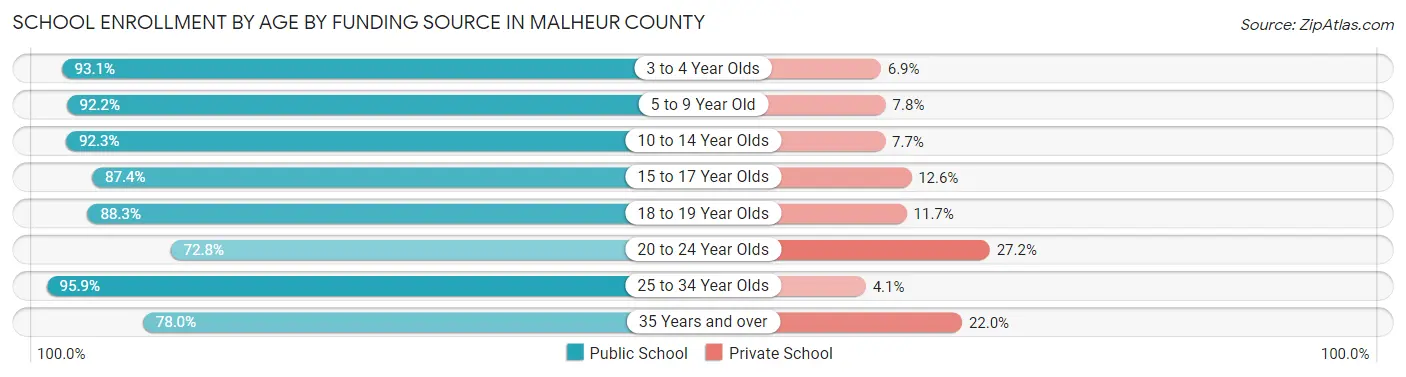
| Age Bracket | Public School | Private School |
| 3 to 4 Year Olds | 202 (93.1%) | 15 (6.9%) |
| 5 to 9 Year Old | 1,838 (92.2%) | 156 (7.8%) |
| 10 to 14 Year Olds | 2,318 (92.3%) | 194 (7.7%) |
| 15 to 17 Year Olds | 1,070 (87.4%) | 154 (12.6%) |
| 18 to 19 Year Olds | 437 (88.3%) | 58 (11.7%) |
| 20 to 24 Year Olds | 297 (72.8%) | 111 (27.2%) |
| 25 to 34 Year Olds | 374 (95.9%) | 16 (4.1%) |
| 35 Years and over | 315 (78.0%) | 89 (22.0%) |
| Total | 6,849 (89.6%) | 795 (10.4%) |
Educational Attainment by Field of Study in Malheur County
Education (618 | 19.7%), business (423 | 13.5%), bio, nature & agricultural (369 | 11.8%), arts & humanities (288 | 9.2%), and science & technology (237 | 7.5%) are the most common fields of study among 3,139 individuals in Malheur County who have obtained a bachelor's degree or higher.
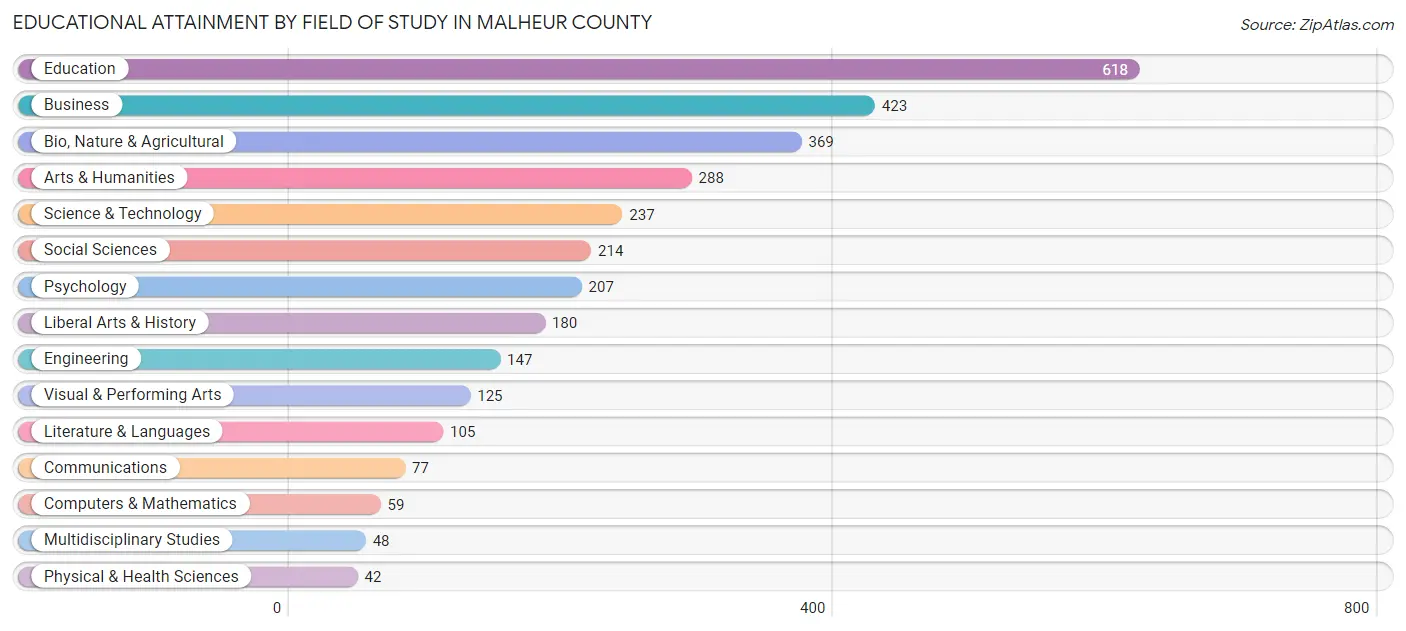
| Field of Study | # Graduates | % Graduates |
| Computers & Mathematics | 59 | 1.9% |
| Bio, Nature & Agricultural | 369 | 11.8% |
| Physical & Health Sciences | 42 | 1.3% |
| Psychology | 207 | 6.6% |
| Social Sciences | 214 | 6.8% |
| Engineering | 147 | 4.7% |
| Multidisciplinary Studies | 48 | 1.5% |
| Science & Technology | 237 | 7.5% |
| Business | 423 | 13.5% |
| Education | 618 | 19.7% |
| Literature & Languages | 105 | 3.4% |
| Liberal Arts & History | 180 | 5.7% |
| Visual & Performing Arts | 125 | 4.0% |
| Communications | 77 | 2.5% |
| Arts & Humanities | 288 | 9.2% |
| Total | 3,139 | 100.0% |
Transportation & Commute in Malheur County
Vehicle Availability by Sex in Malheur County
The most prevalent vehicle ownership categories in Malheur County are males with 3 vehicles (1,964, accounting for 30.4%) and females with 3 vehicles (1,321, making up 40.4%).
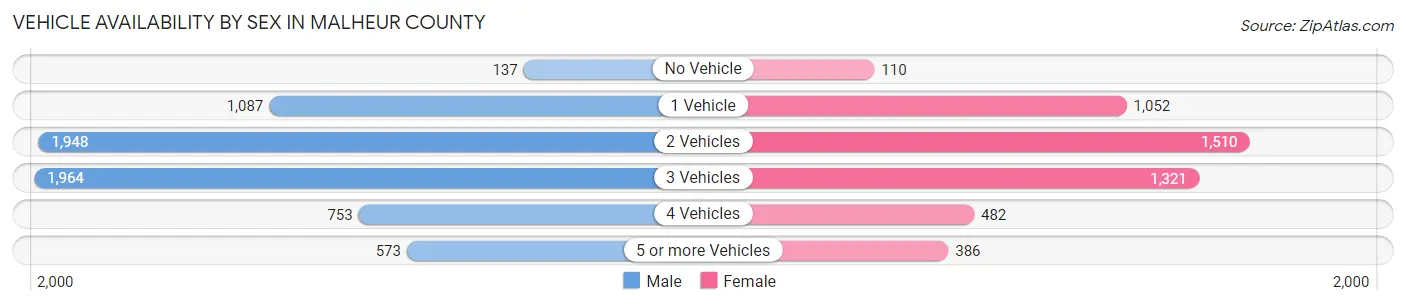
| Vehicles Available | Male | Female |
| No Vehicle | 137 (2.1%) | 110 (2.3%) |
| 1 Vehicle | 1,087 (16.8%) | 1,052 (21.6%) |
| 2 Vehicles | 1,948 (30.1%) | 1,510 (31.1%) |
| 3 Vehicles | 1,964 (30.4%) | 1,321 (27.2%) |
| 4 Vehicles | 753 (11.7%) | 482 (9.9%) |
| 5 or more Vehicles | 573 (8.9%) | 386 (7.9%) |
| Total | 6,462 (100.0%) | 4,861 (100.0%) |
Commute Time in Malheur County
The most frequently occuring commute durations in Malheur County are 5 to 9 minutes (2,521 commuters, 24.0%), 10 to 14 minutes (1,747 commuters, 16.6%), and 15 to 19 minutes (1,278 commuters, 12.1%).
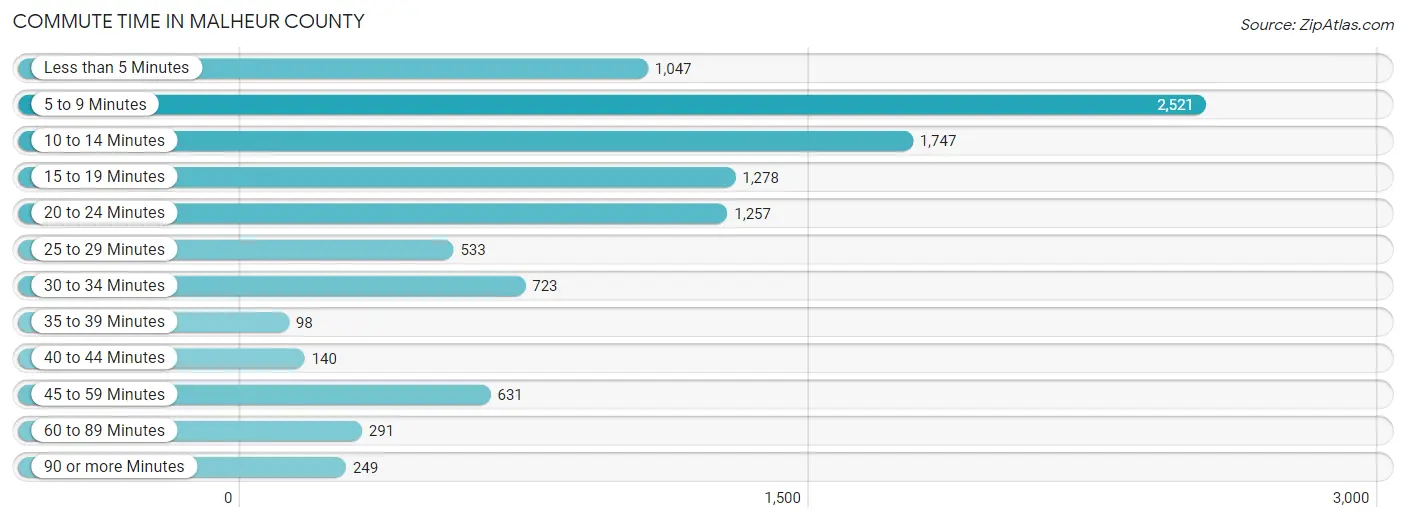
| Commute Time | # Commuters | % Commuters |
| Less than 5 Minutes | 1,047 | 10.0% |
| 5 to 9 Minutes | 2,521 | 24.0% |
| 10 to 14 Minutes | 1,747 | 16.6% |
| 15 to 19 Minutes | 1,278 | 12.1% |
| 20 to 24 Minutes | 1,257 | 11.9% |
| 25 to 29 Minutes | 533 | 5.1% |
| 30 to 34 Minutes | 723 | 6.9% |
| 35 to 39 Minutes | 98 | 0.9% |
| 40 to 44 Minutes | 140 | 1.3% |
| 45 to 59 Minutes | 631 | 6.0% |
| 60 to 89 Minutes | 291 | 2.8% |
| 90 or more Minutes | 249 | 2.4% |
Commute Time by Sex in Malheur County
The most common commute times in Malheur County are 5 to 9 minutes (1,284 commuters, 21.5%) for males and 5 to 9 minutes (1,237 commuters, 27.2%) for females.
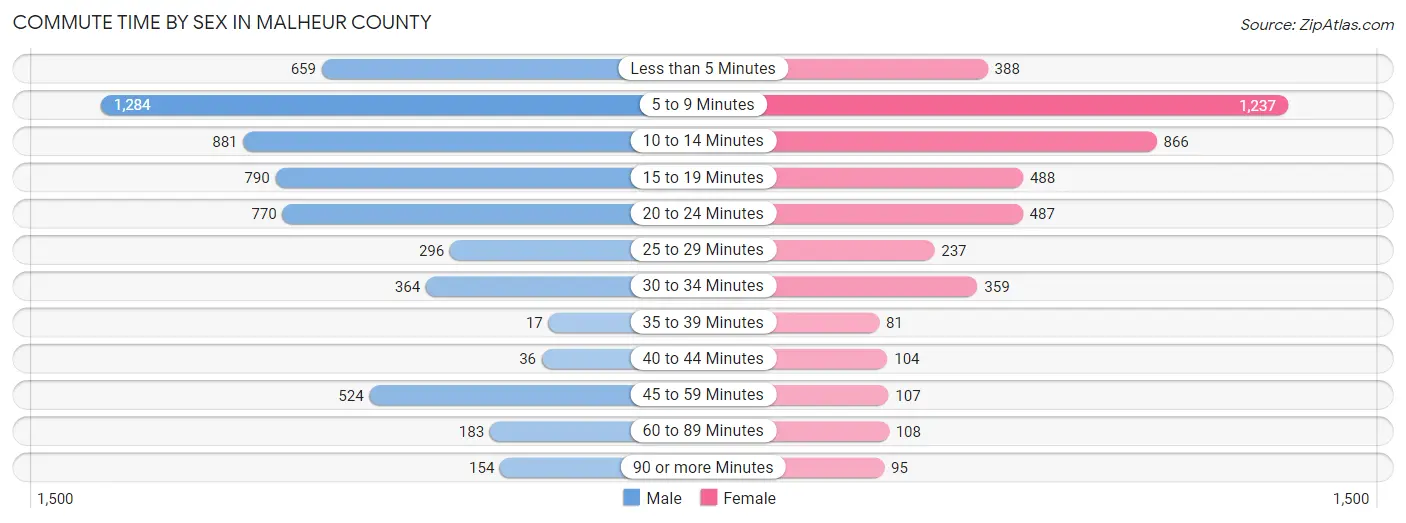
| Commute Time | Male | Female |
| Less than 5 Minutes | 659 (11.1%) | 388 (8.5%) |
| 5 to 9 Minutes | 1,284 (21.5%) | 1,237 (27.2%) |
| 10 to 14 Minutes | 881 (14.8%) | 866 (19.0%) |
| 15 to 19 Minutes | 790 (13.3%) | 488 (10.7%) |
| 20 to 24 Minutes | 770 (12.9%) | 487 (10.7%) |
| 25 to 29 Minutes | 296 (5.0%) | 237 (5.2%) |
| 30 to 34 Minutes | 364 (6.1%) | 359 (7.9%) |
| 35 to 39 Minutes | 17 (0.3%) | 81 (1.8%) |
| 40 to 44 Minutes | 36 (0.6%) | 104 (2.3%) |
| 45 to 59 Minutes | 524 (8.8%) | 107 (2.4%) |
| 60 to 89 Minutes | 183 (3.1%) | 108 (2.4%) |
| 90 or more Minutes | 154 (2.6%) | 95 (2.1%) |
Time of Departure to Work by Sex in Malheur County
The most frequent times of departure to work in Malheur County are 7:30 AM to 7:59 AM (981, 16.5%) for males and 7:30 AM to 7:59 AM (984, 21.6%) for females.
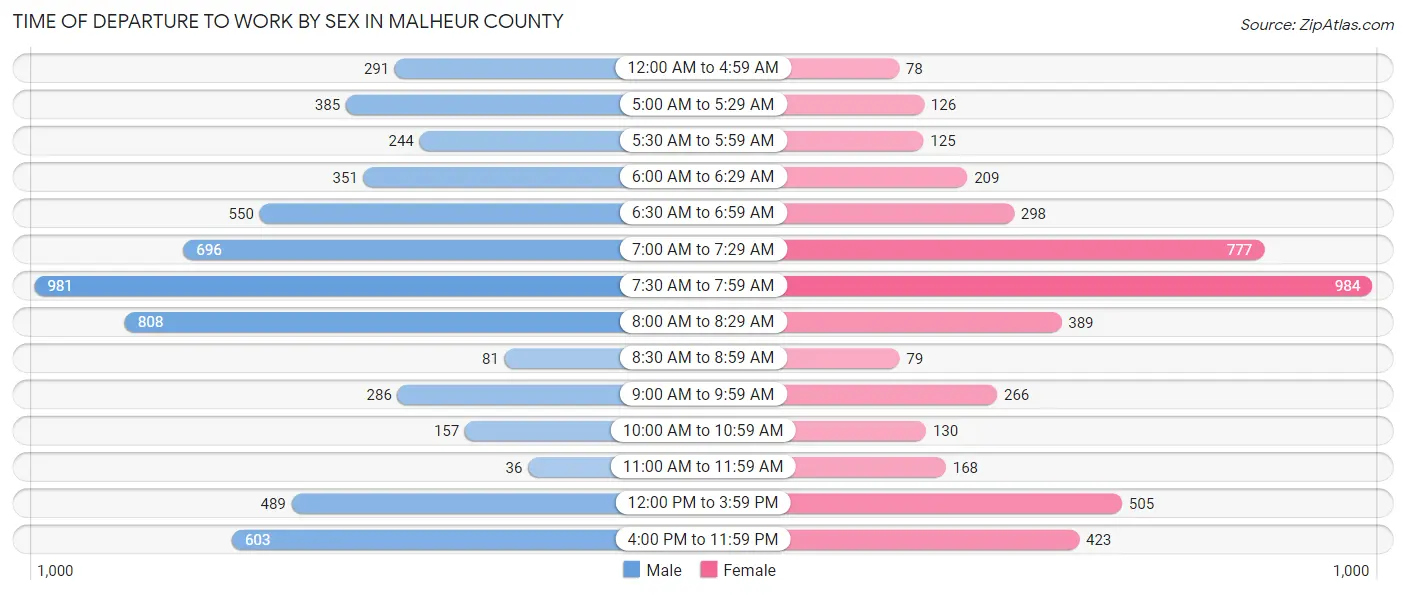
| Time of Departure | Male | Female |
| 12:00 AM to 4:59 AM | 291 (4.9%) | 78 (1.7%) |
| 5:00 AM to 5:29 AM | 385 (6.5%) | 126 (2.8%) |
| 5:30 AM to 5:59 AM | 244 (4.1%) | 125 (2.7%) |
| 6:00 AM to 6:29 AM | 351 (5.9%) | 209 (4.6%) |
| 6:30 AM to 6:59 AM | 550 (9.2%) | 298 (6.5%) |
| 7:00 AM to 7:29 AM | 696 (11.7%) | 777 (17.1%) |
| 7:30 AM to 7:59 AM | 981 (16.5%) | 984 (21.6%) |
| 8:00 AM to 8:29 AM | 808 (13.6%) | 389 (8.5%) |
| 8:30 AM to 8:59 AM | 81 (1.4%) | 79 (1.7%) |
| 9:00 AM to 9:59 AM | 286 (4.8%) | 266 (5.8%) |
| 10:00 AM to 10:59 AM | 157 (2.6%) | 130 (2.9%) |
| 11:00 AM to 11:59 AM | 36 (0.6%) | 168 (3.7%) |
| 12:00 PM to 3:59 PM | 489 (8.2%) | 505 (11.1%) |
| 4:00 PM to 11:59 PM | 603 (10.1%) | 423 (9.3%) |
| Total | 5,958 (100.0%) | 4,557 (100.0%) |
Housing Occupancy in Malheur County
Occupancy by Ownership in Malheur County
Of the total 9,952 dwellings in Malheur County, owner-occupied units account for 5,828 (58.6%), while renter-occupied units make up 4,124 (41.4%).
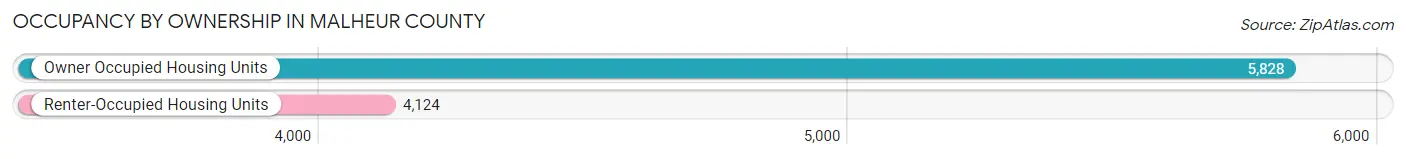
| Occupancy | # Housing Units | % Housing Units |
| Owner Occupied Housing Units | 5,828 | 58.6% |
| Renter-Occupied Housing Units | 4,124 | 41.4% |
| Total Occupied Housing Units | 9,952 | 100.0% |
Occupancy by Household Size in Malheur County
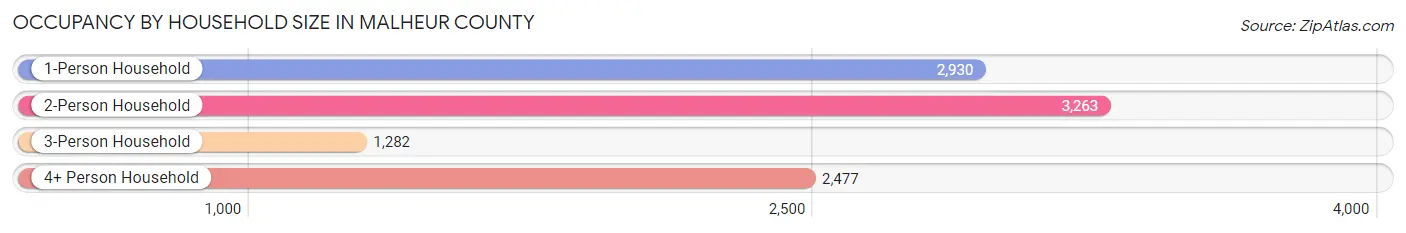
| Household Size | # Housing Units | % Housing Units |
| 1-Person Household | 2,930 | 29.4% |
| 2-Person Household | 3,263 | 32.8% |
| 3-Person Household | 1,282 | 12.9% |
| 4+ Person Household | 2,477 | 24.9% |
| Total Housing Units | 9,952 | 100.0% |
Occupancy by Ownership by Household Size in Malheur County
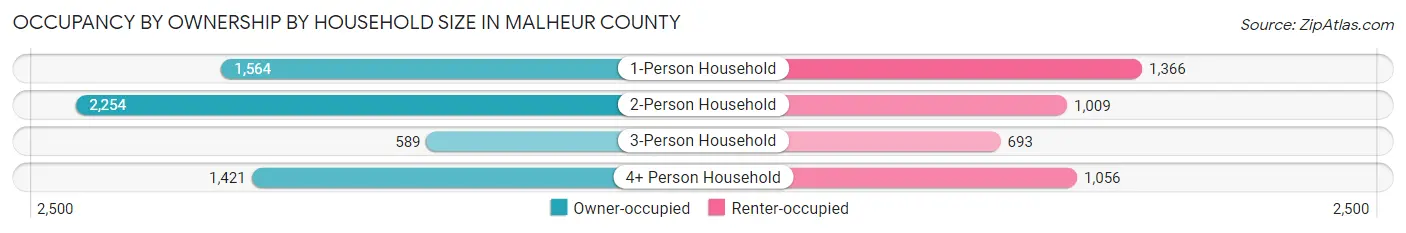
| Household Size | Owner-occupied | Renter-occupied |
| 1-Person Household | 1,564 (53.4%) | 1,366 (46.6%) |
| 2-Person Household | 2,254 (69.1%) | 1,009 (30.9%) |
| 3-Person Household | 589 (45.9%) | 693 (54.1%) |
| 4+ Person Household | 1,421 (57.4%) | 1,056 (42.6%) |
| Total Housing Units | 5,828 (58.6%) | 4,124 (41.4%) |
Occupancy by Educational Attainment in Malheur County
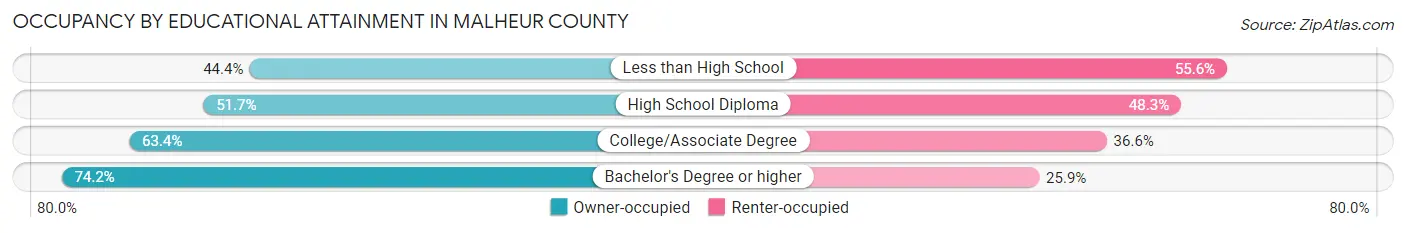
| Household Size | Owner-occupied | Renter-occupied |
| Less than High School | 792 (44.4%) | 993 (55.6%) |
| High School Diploma | 1,435 (51.7%) | 1,343 (48.3%) |
| College/Associate Degree | 2,339 (63.4%) | 1,348 (36.6%) |
| Bachelor's Degree or higher | 1,262 (74.2%) | 440 (25.9%) |
Occupancy by Age of Householder in Malheur County
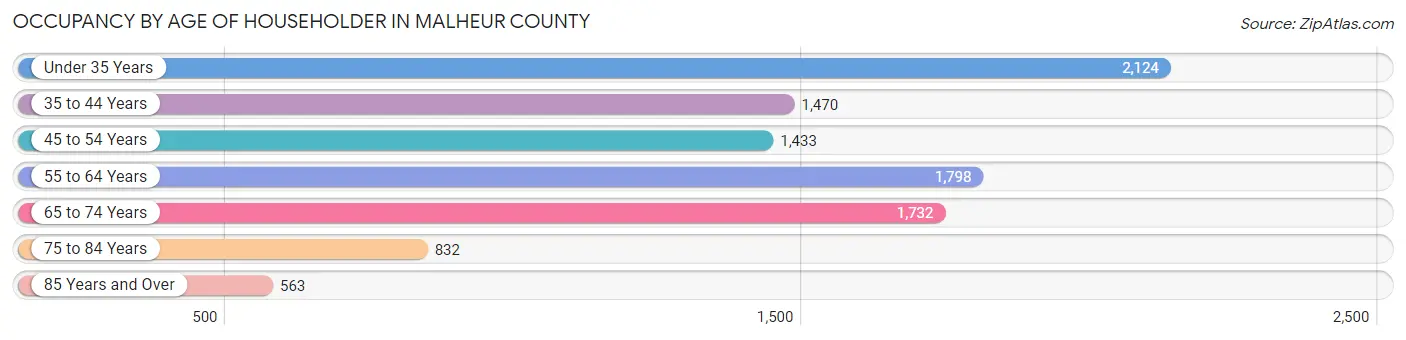
| Age Bracket | # Households | % Households |
| Under 35 Years | 2,124 | 21.3% |
| 35 to 44 Years | 1,470 | 14.8% |
| 45 to 54 Years | 1,433 | 14.4% |
| 55 to 64 Years | 1,798 | 18.1% |
| 65 to 74 Years | 1,732 | 17.4% |
| 75 to 84 Years | 832 | 8.4% |
| 85 Years and Over | 563 | 5.7% |
| Total | 9,952 | 100.0% |
Housing Finances in Malheur County
Median Income by Occupancy in Malheur County
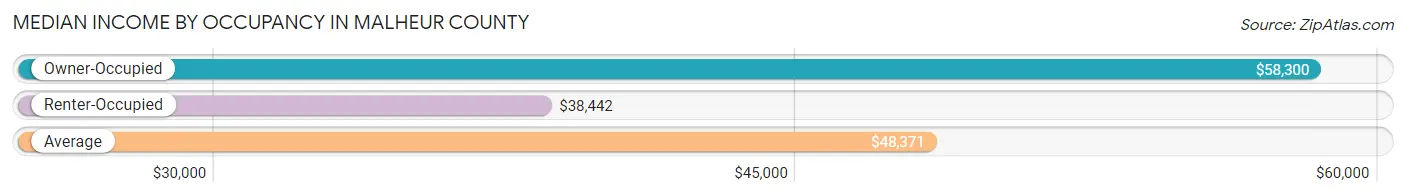
| Occupancy Type | # Households | Median Income |
| Owner-Occupied | 5,828 (58.6%) | $58,300 |
| Renter-Occupied | 4,124 (41.4%) | $38,442 |
| Average | 9,952 (100.0%) | $48,371 |
Occupancy by Householder Income Bracket in Malheur County
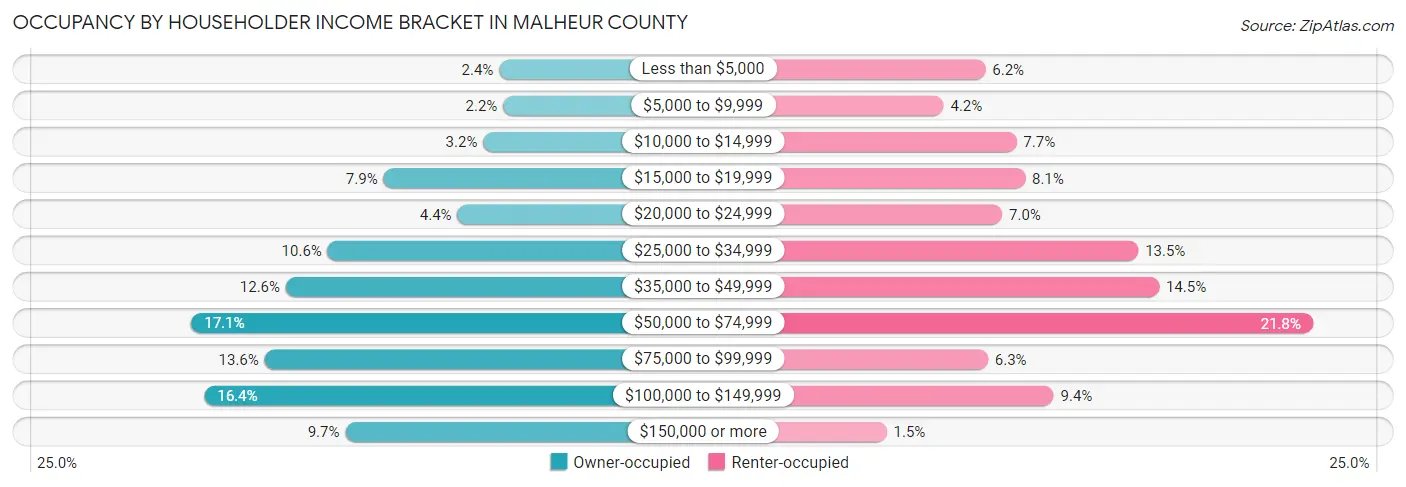
| Income Bracket | Owner-occupied | Renter-occupied |
| Less than $5,000 | 140 (2.4%) | 255 (6.2%) |
| $5,000 to $9,999 | 129 (2.2%) | 173 (4.2%) |
| $10,000 to $14,999 | 184 (3.2%) | 316 (7.7%) |
| $15,000 to $19,999 | 461 (7.9%) | 333 (8.1%) |
| $20,000 to $24,999 | 256 (4.4%) | 288 (7.0%) |
| $25,000 to $34,999 | 616 (10.6%) | 555 (13.5%) |
| $35,000 to $49,999 | 732 (12.6%) | 596 (14.4%) |
| $50,000 to $74,999 | 994 (17.1%) | 898 (21.8%) |
| $75,000 to $99,999 | 791 (13.6%) | 260 (6.3%) |
| $100,000 to $149,999 | 958 (16.4%) | 389 (9.4%) |
| $150,000 or more | 567 (9.7%) | 61 (1.5%) |
| Total | 5,828 (100.0%) | 4,124 (100.0%) |
Monthly Housing Cost Tiers in Malheur County
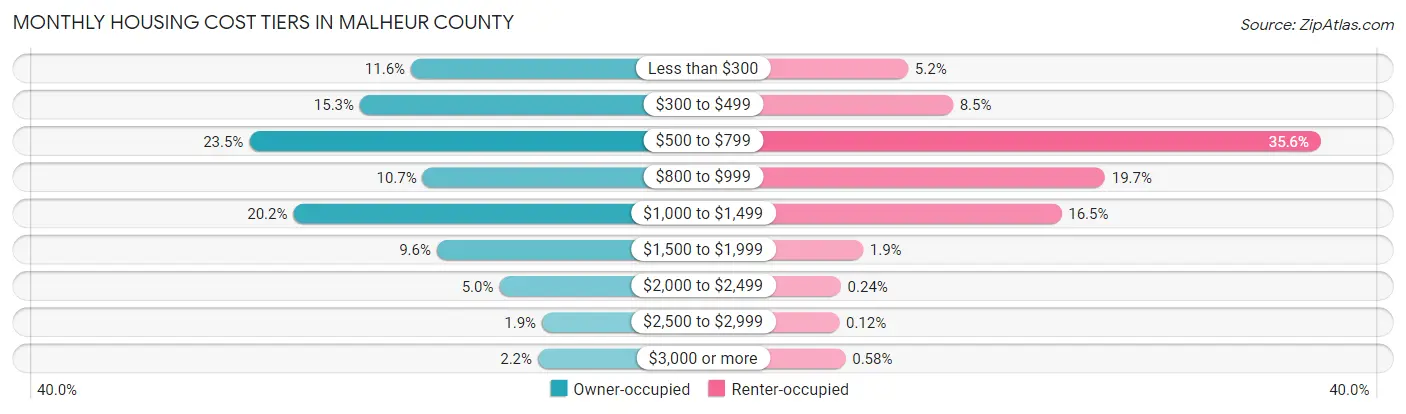
| Monthly Cost | Owner-occupied | Renter-occupied |
| Less than $300 | 673 (11.6%) | 214 (5.2%) |
| $300 to $499 | 892 (15.3%) | 350 (8.5%) |
| $500 to $799 | 1,367 (23.5%) | 1,468 (35.6%) |
| $800 to $999 | 623 (10.7%) | 812 (19.7%) |
| $1,000 to $1,499 | 1,178 (20.2%) | 680 (16.5%) |
| $1,500 to $1,999 | 562 (9.6%) | 77 (1.9%) |
| $2,000 to $2,499 | 294 (5.0%) | 10 (0.2%) |
| $2,500 to $2,999 | 111 (1.9%) | 5 (0.1%) |
| $3,000 or more | 128 (2.2%) | 24 (0.6%) |
| Total | 5,828 (100.0%) | 4,124 (100.0%) |
Physical Housing Characteristics in Malheur County
Housing Structures in Malheur County
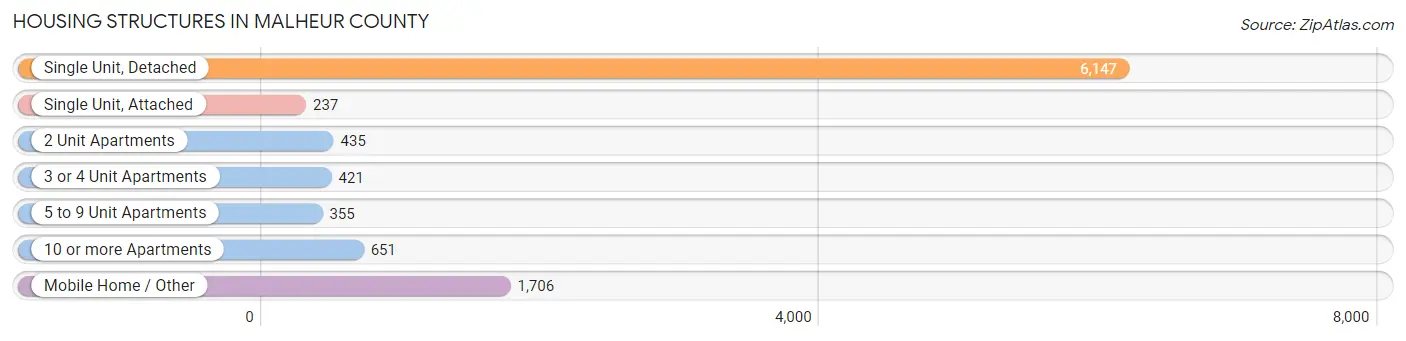
| Structure Type | # Housing Units | % Housing Units |
| Single Unit, Detached | 6,147 | 61.8% |
| Single Unit, Attached | 237 | 2.4% |
| 2 Unit Apartments | 435 | 4.4% |
| 3 or 4 Unit Apartments | 421 | 4.2% |
| 5 to 9 Unit Apartments | 355 | 3.6% |
| 10 or more Apartments | 651 | 6.5% |
| Mobile Home / Other | 1,706 | 17.1% |
| Total | 9,952 | 100.0% |
Housing Structures by Occupancy in Malheur County
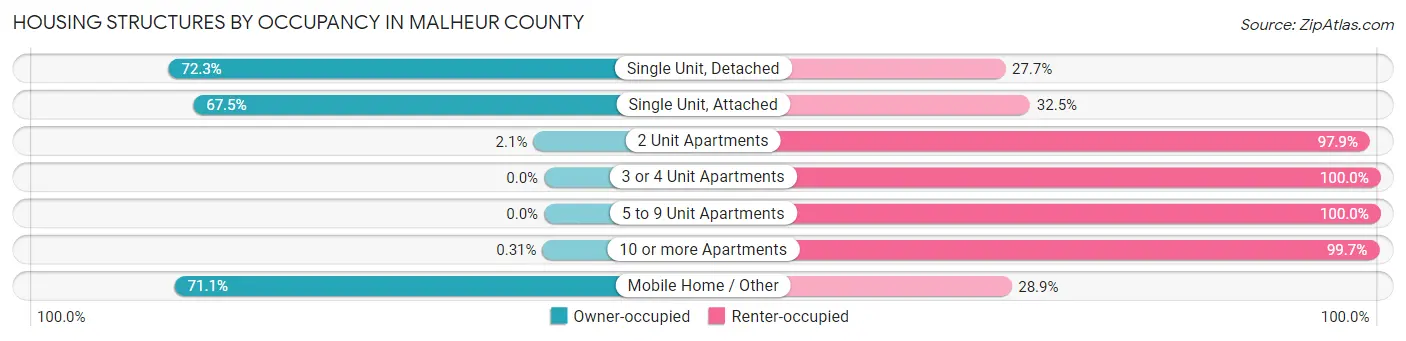
| Structure Type | Owner-occupied | Renter-occupied |
| Single Unit, Detached | 4,444 (72.3%) | 1,703 (27.7%) |
| Single Unit, Attached | 160 (67.5%) | 77 (32.5%) |
| 2 Unit Apartments | 9 (2.1%) | 426 (97.9%) |
| 3 or 4 Unit Apartments | 0 (0.0%) | 421 (100.0%) |
| 5 to 9 Unit Apartments | 0 (0.0%) | 355 (100.0%) |
| 10 or more Apartments | 2 (0.3%) | 649 (99.7%) |
| Mobile Home / Other | 1,213 (71.1%) | 493 (28.9%) |
| Total | 5,828 (58.6%) | 4,124 (41.4%) |
Housing Structures by Number of Rooms in Malheur County
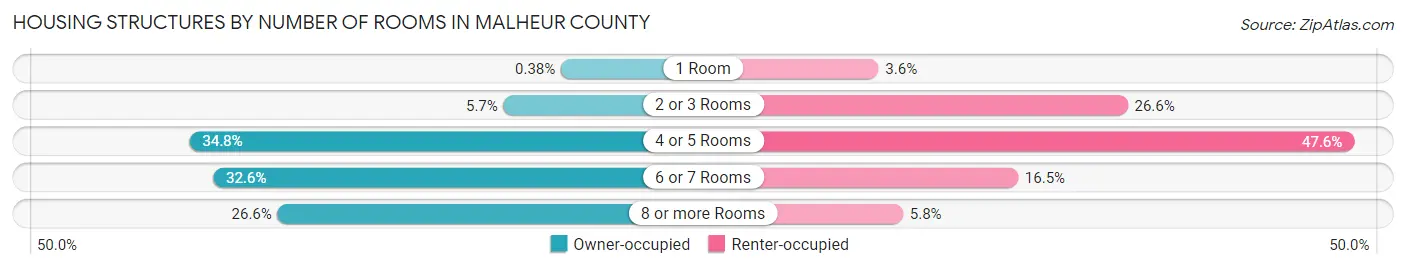
| Number of Rooms | Owner-occupied | Renter-occupied |
| 1 Room | 22 (0.4%) | 147 (3.6%) |
| 2 or 3 Rooms | 332 (5.7%) | 1,097 (26.6%) |
| 4 or 5 Rooms | 2,026 (34.8%) | 1,961 (47.5%) |
| 6 or 7 Rooms | 1,898 (32.6%) | 679 (16.5%) |
| 8 or more Rooms | 1,550 (26.6%) | 240 (5.8%) |
| Total | 5,828 (100.0%) | 4,124 (100.0%) |
Housing Structure by Heating Type in Malheur County
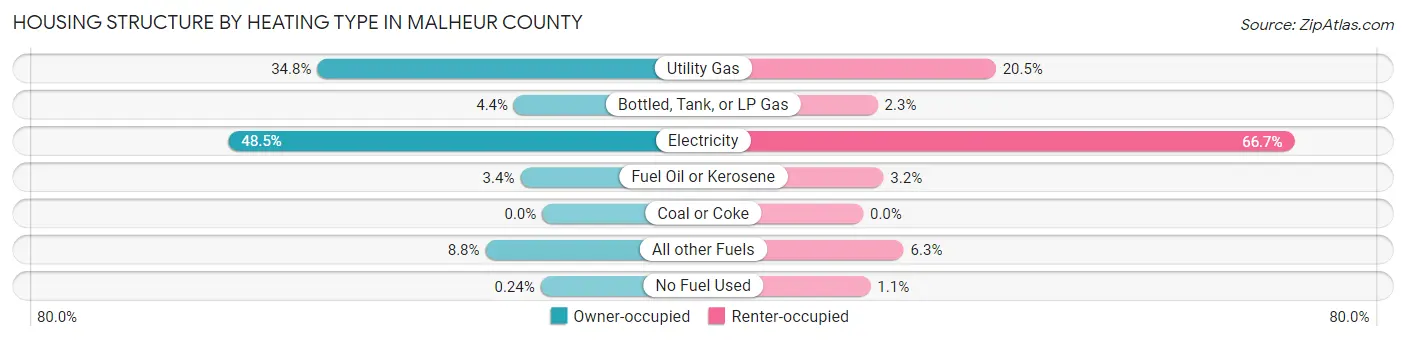
| Heating Type | Owner-occupied | Renter-occupied |
| Utility Gas | 2,026 (34.8%) | 846 (20.5%) |
| Bottled, Tank, or LP Gas | 254 (4.4%) | 93 (2.3%) |
| Electricity | 2,826 (48.5%) | 2,749 (66.7%) |
| Fuel Oil or Kerosene | 197 (3.4%) | 130 (3.2%) |
| Coal or Coke | 0 (0.0%) | 0 (0.0%) |
| All other Fuels | 511 (8.8%) | 259 (6.3%) |
| No Fuel Used | 14 (0.2%) | 47 (1.1%) |
| Total | 5,828 (100.0%) | 4,124 (100.0%) |
Household Vehicle Usage in Malheur County
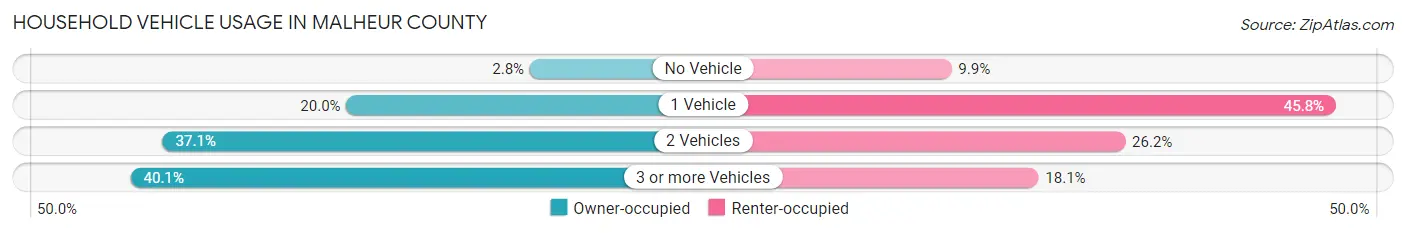
| Vehicles per Household | Owner-occupied | Renter-occupied |
| No Vehicle | 165 (2.8%) | 410 (9.9%) |
| 1 Vehicle | 1,163 (20.0%) | 1,890 (45.8%) |
| 2 Vehicles | 2,163 (37.1%) | 1,079 (26.2%) |
| 3 or more Vehicles | 2,337 (40.1%) | 745 (18.1%) |
| Total | 5,828 (100.0%) | 4,124 (100.0%) |
Real Estate & Mortgages in Malheur County
Real Estate and Mortgage Overview in Malheur County
| Characteristic | Without Mortgage | With Mortgage |
| Housing Units | 2,803 | 3,025 |
| Median Property Value | $172,200 | $204,900 |
| Median Household Income | $42,134 | $298 |
| Monthly Housing Costs | $471 | $106 |
| Real Estate Taxes | $1,376 | $32 |
Property Value by Mortgage Status in Malheur County
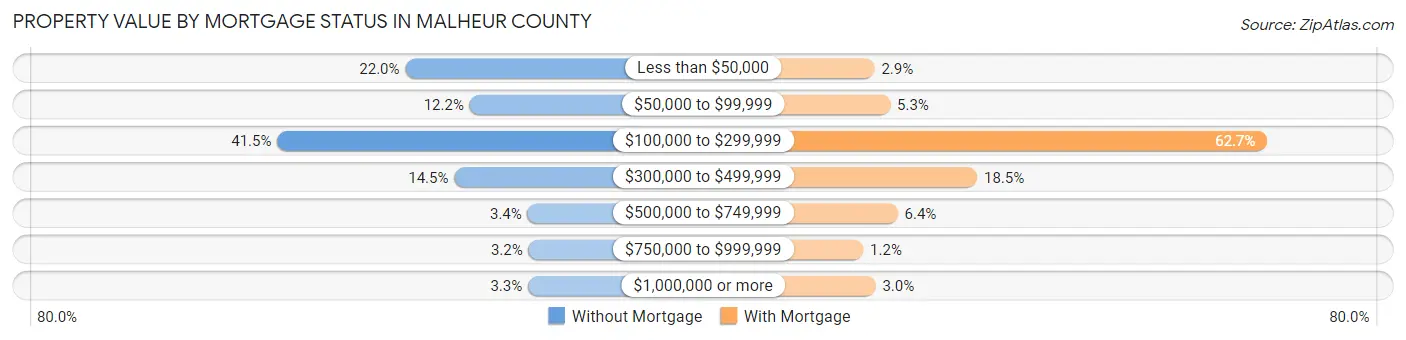
| Property Value | Without Mortgage | With Mortgage |
| Less than $50,000 | 616 (22.0%) | 87 (2.9%) |
| $50,000 to $99,999 | 341 (12.2%) | 159 (5.3%) |
| $100,000 to $299,999 | 1,163 (41.5%) | 1,898 (62.7%) |
| $300,000 to $499,999 | 407 (14.5%) | 560 (18.5%) |
| $500,000 to $749,999 | 94 (3.4%) | 194 (6.4%) |
| $750,000 to $999,999 | 90 (3.2%) | 35 (1.2%) |
| $1,000,000 or more | 92 (3.3%) | 92 (3.0%) |
| Total | 2,803 (100.0%) | 3,025 (100.0%) |
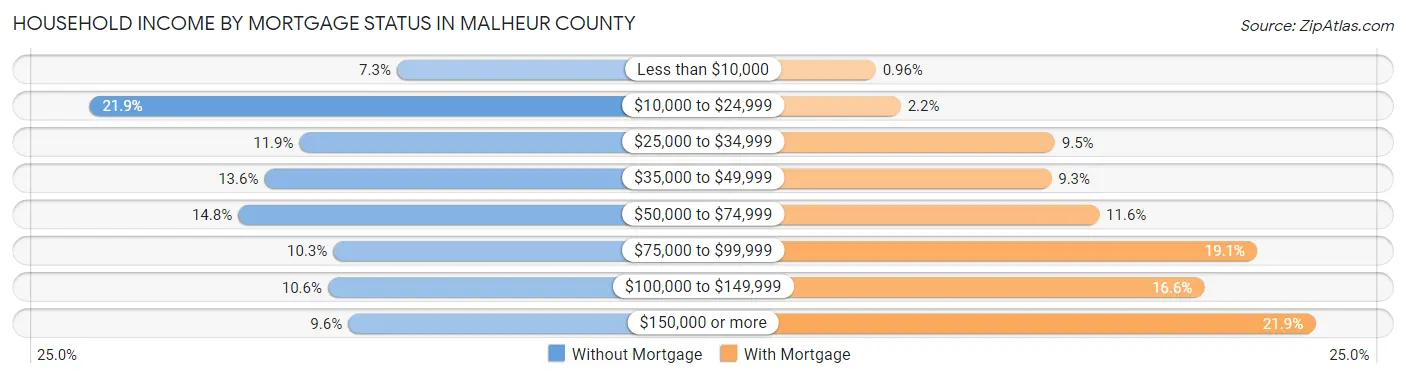
Household Income by Mortgage Status in Malheur County
| Household Income | Without Mortgage | With Mortgage |
| Less than $10,000 | 204 (7.3%) | 29 (1.0%) |
| $10,000 to $24,999 | 614 (21.9%) | 65 (2.1%) |
| $25,000 to $34,999 | 334 (11.9%) | 287 (9.5%) |
| $35,000 to $49,999 | 381 (13.6%) | 282 (9.3%) |
| $50,000 to $74,999 | 416 (14.8%) | 351 (11.6%) |
| $75,000 to $99,999 | 289 (10.3%) | 578 (19.1%) |
| $100,000 to $149,999 | 296 (10.6%) | 502 (16.6%) |
| $150,000 or more | 269 (9.6%) | 662 (21.9%) |
| Total | 2,803 (100.0%) | 3,025 (100.0%) |
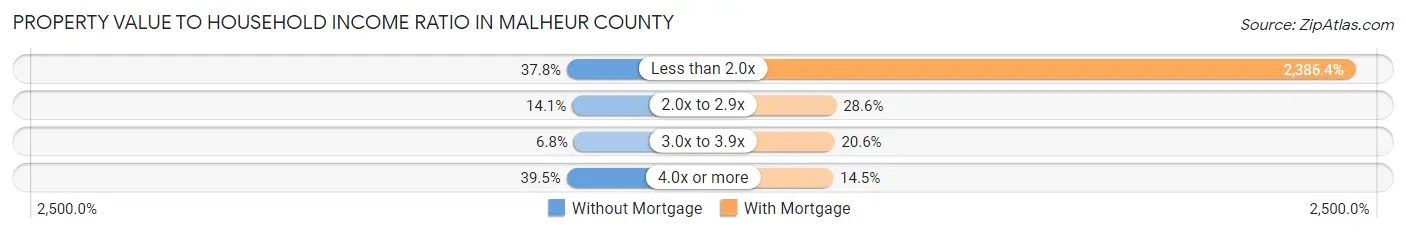
Property Value to Household Income Ratio in Malheur County
| Value-to-Income Ratio | Without Mortgage | With Mortgage |
| Less than 2.0x | 1,058 (37.8%) | 72,188 (2,386.4%) |
| 2.0x to 2.9x | 394 (14.1%) | 865 (28.6%) |
| 3.0x to 3.9x | 190 (6.8%) | 622 (20.6%) |
| 4.0x or more | 1,108 (39.5%) | 438 (14.5%) |
| Total | 2,803 (100.0%) | 3,025 (100.0%) |
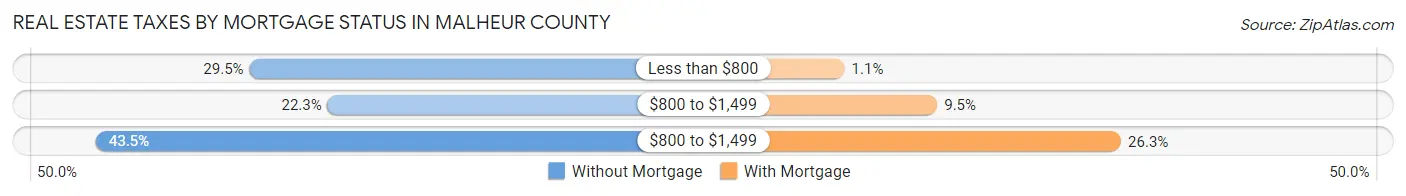
Real Estate Taxes by Mortgage Status in Malheur County
| Property Taxes | Without Mortgage | With Mortgage |
| Less than $800 | 826 (29.5%) | 32 (1.1%) |
| $800 to $1,499 | 626 (22.3%) | 288 (9.5%) |
| $800 to $1,499 | 1,219 (43.5%) | 796 (26.3%) |
| Total | 2,803 (100.0%) | 3,025 (100.0%) |
Health & Disability in Malheur County
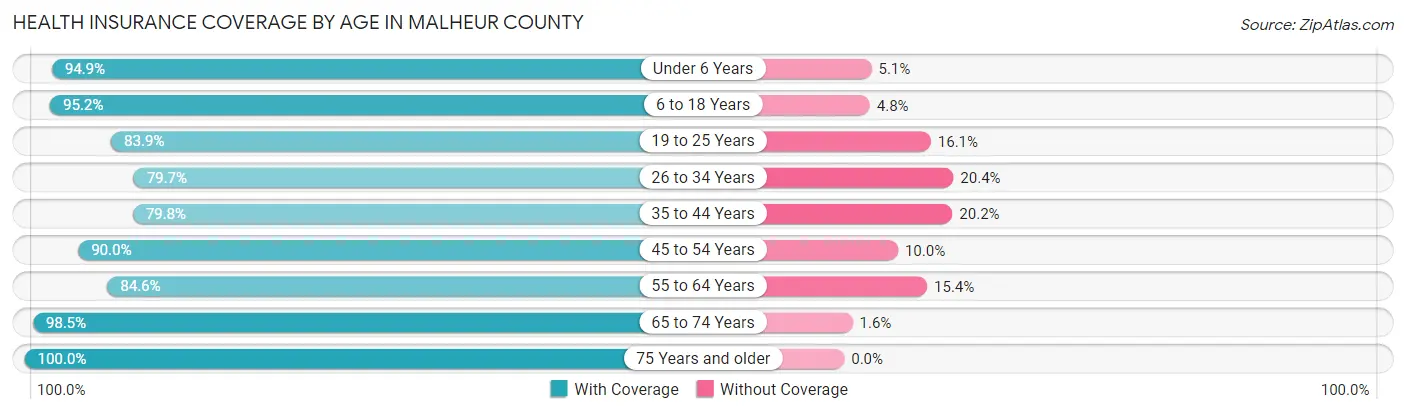
Health Insurance Coverage by Age in Malheur County
| Age Bracket | With Coverage | Without Coverage |
| Under 6 Years | 2,278 (94.9%) | 122 (5.1%) |
| 6 to 18 Years | 5,661 (95.2%) | 283 (4.8%) |
| 19 to 25 Years | 2,473 (83.9%) | 476 (16.1%) |
| 26 to 34 Years | 2,353 (79.6%) | 601 (20.3%) |
| 35 to 44 Years | 2,416 (79.8%) | 610 (20.2%) |
| 45 to 54 Years | 2,624 (90.0%) | 292 (10.0%) |
| 55 to 64 Years | 2,661 (84.6%) | 486 (15.4%) |
| 65 to 74 Years | 2,739 (98.5%) | 43 (1.5%) |
| 75 Years and older | 2,108 (100.0%) | 0 (0.0%) |
| Total | 25,313 (89.7%) | 2,913 (10.3%) |
Health Insurance Coverage by Citizenship Status in Malheur County
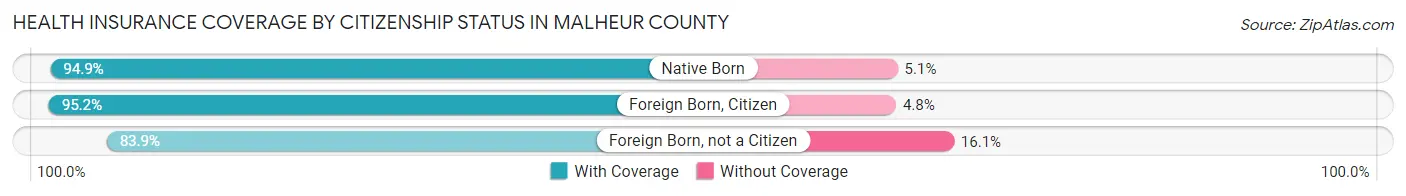
| Citizenship Status | With Coverage | Without Coverage |
| Native Born | 2,278 (94.9%) | 122 (5.1%) |
| Foreign Born, Citizen | 5,661 (95.2%) | 283 (4.8%) |
| Foreign Born, not a Citizen | 2,473 (83.9%) | 476 (16.1%) |
Health Insurance Coverage by Household Income in Malheur County
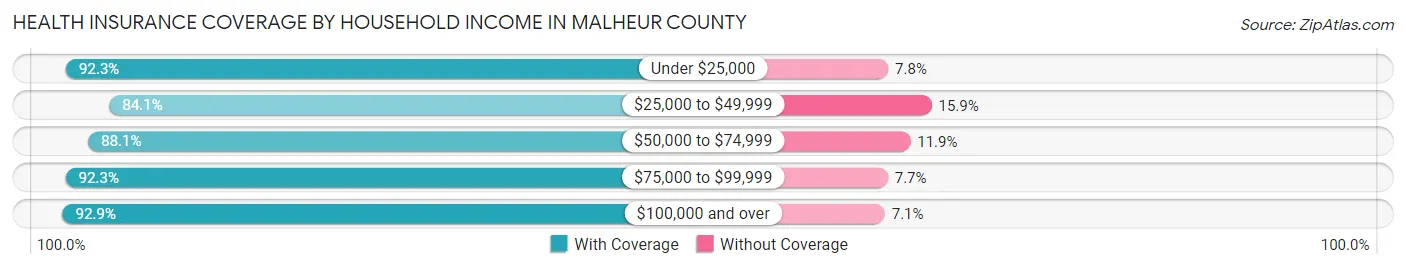
| Household Income | With Coverage | Without Coverage |
| Under $25,000 | 4,190 (92.2%) | 352 (7.7%) |
| $25,000 to $49,999 | 5,514 (84.1%) | 1,041 (15.9%) |
| $50,000 to $74,999 | 5,499 (88.1%) | 742 (11.9%) |
| $75,000 to $99,999 | 3,077 (92.3%) | 256 (7.7%) |
| $100,000 and over | 6,728 (92.9%) | 516 (7.1%) |
Public vs Private Health Insurance Coverage by Age in Malheur County
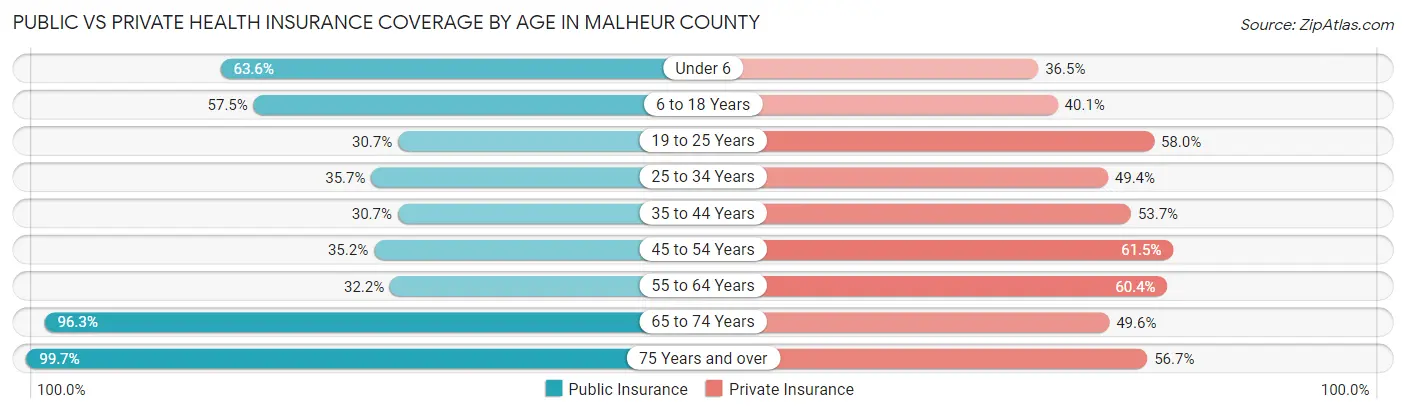
| Age Bracket | Public Insurance | Private Insurance |
| Under 6 | 1,527 (63.6%) | 875 (36.5%) |
| 6 to 18 Years | 3,417 (57.5%) | 2,382 (40.1%) |
| 19 to 25 Years | 905 (30.7%) | 1,709 (58.0%) |
| 25 to 34 Years | 1,053 (35.6%) | 1,459 (49.4%) |
| 35 to 44 Years | 930 (30.7%) | 1,624 (53.7%) |
| 45 to 54 Years | 1,025 (35.1%) | 1,794 (61.5%) |
| 55 to 64 Years | 1,012 (32.2%) | 1,902 (60.4%) |
| 65 to 74 Years | 2,679 (96.3%) | 1,381 (49.6%) |
| 75 Years and over | 2,101 (99.7%) | 1,195 (56.7%) |
| Total | 14,649 (51.9%) | 14,321 (50.7%) |
Disability Status by Sex by Age in Malheur County
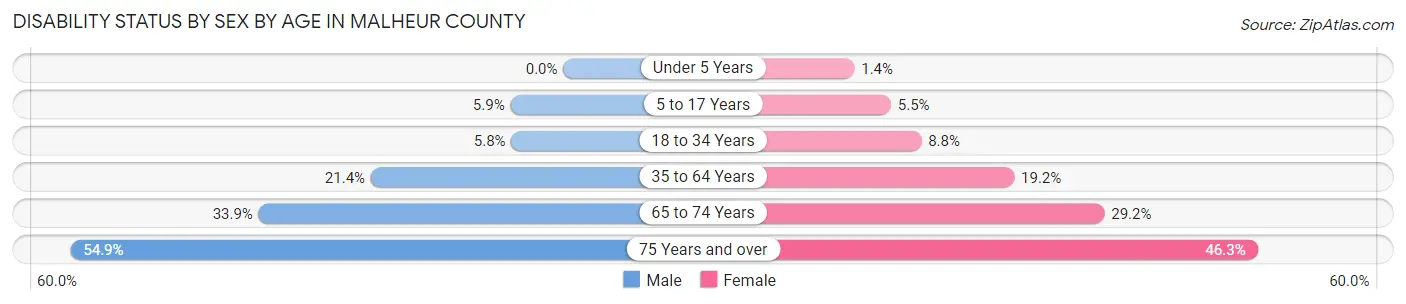
| Age Bracket | Male | Female |
| Under 5 Years | 0 (0.0%) | 14 (1.4%) |
| 5 to 17 Years | 179 (5.9%) | 158 (5.5%) |
| 18 to 34 Years | 197 (5.8%) | 255 (8.8%) |
| 35 to 64 Years | 955 (21.4%) | 889 (19.2%) |
| 65 to 74 Years | 439 (33.9%) | 435 (29.2%) |
| 75 Years and over | 499 (54.9%) | 555 (46.3%) |
Disability Class by Sex by Age in Malheur County
Disability Class: Hearing Difficulty
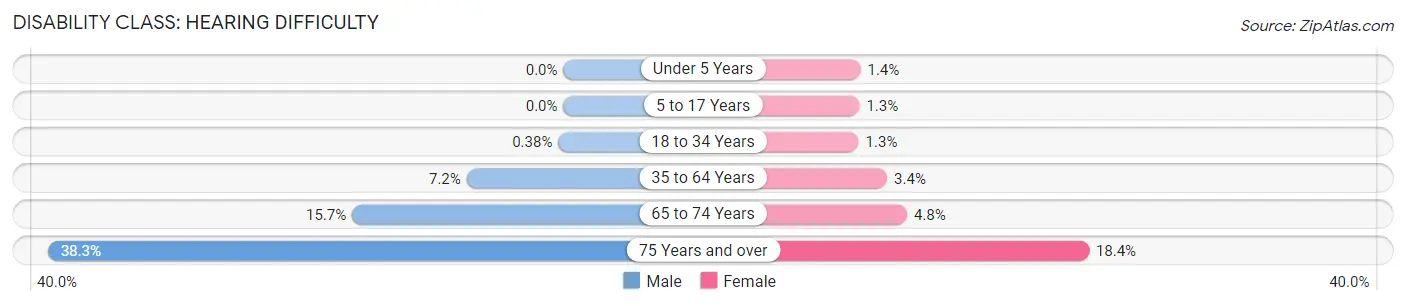
| Age Bracket | Male | Female |
| Under 5 Years | 0 (0.0%) | 14 (1.4%) |
| 5 to 17 Years | 0 (0.0%) | 38 (1.3%) |
| 18 to 34 Years | 13 (0.4%) | 36 (1.3%) |
| 35 to 64 Years | 320 (7.2%) | 156 (3.4%) |
| 65 to 74 Years | 203 (15.7%) | 72 (4.8%) |
| 75 Years and over | 348 (38.3%) | 220 (18.3%) |
Disability Class: Vision Difficulty
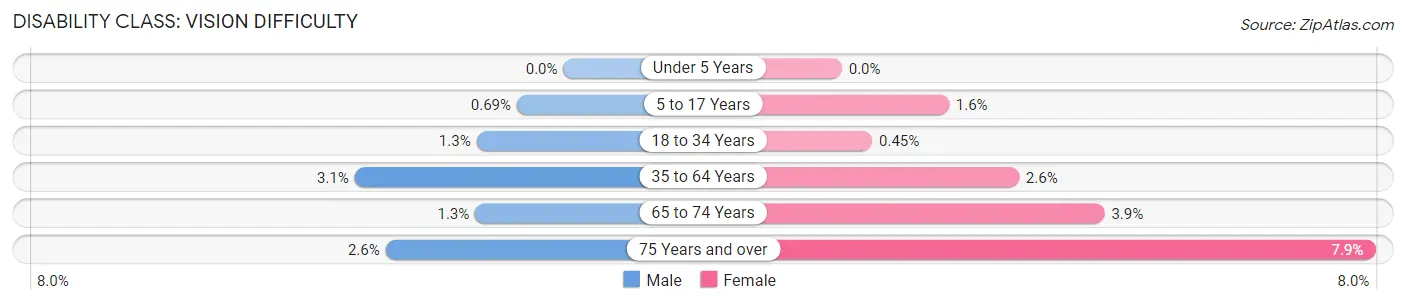
| Age Bracket | Male | Female |
| Under 5 Years | 0 (0.0%) | 0 (0.0%) |
| 5 to 17 Years | 21 (0.7%) | 46 (1.6%) |
| 18 to 34 Years | 44 (1.3%) | 13 (0.4%) |
| 35 to 64 Years | 138 (3.1%) | 122 (2.6%) |
| 65 to 74 Years | 17 (1.3%) | 58 (3.9%) |
| 75 Years and over | 24 (2.6%) | 95 (7.9%) |
Disability Class: Cognitive Difficulty
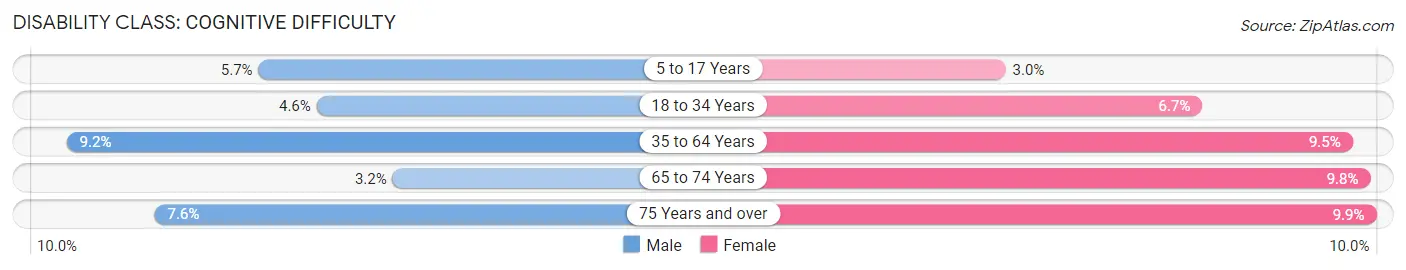
| Age Bracket | Male | Female |
| 5 to 17 Years | 172 (5.7%) | 88 (3.0%) |
| 18 to 34 Years | 156 (4.6%) | 193 (6.7%) |
| 35 to 64 Years | 411 (9.2%) | 439 (9.5%) |
| 65 to 74 Years | 41 (3.2%) | 146 (9.8%) |
| 75 Years and over | 69 (7.6%) | 119 (9.9%) |
Disability Class: Ambulatory Difficulty
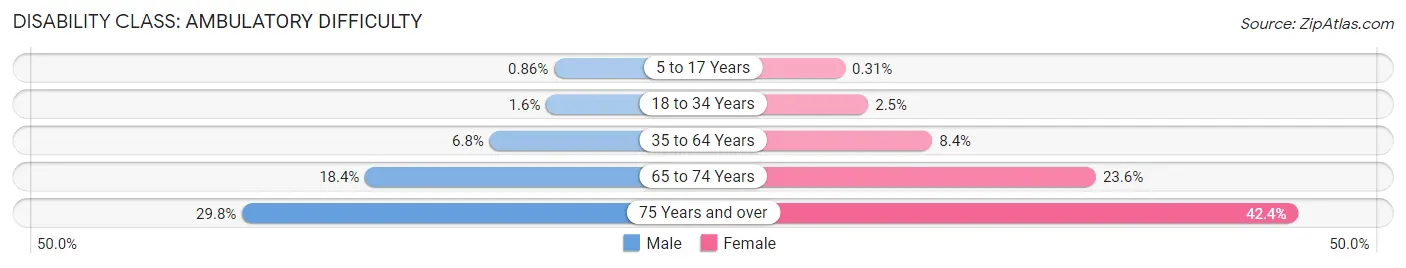
| Age Bracket | Male | Female |
| 5 to 17 Years | 26 (0.9%) | 9 (0.3%) |
| 18 to 34 Years | 54 (1.6%) | 71 (2.5%) |
| 35 to 64 Years | 305 (6.8%) | 389 (8.4%) |
| 65 to 74 Years | 238 (18.4%) | 351 (23.6%) |
| 75 Years and over | 271 (29.8%) | 508 (42.4%) |
Disability Class: Self-Care Difficulty
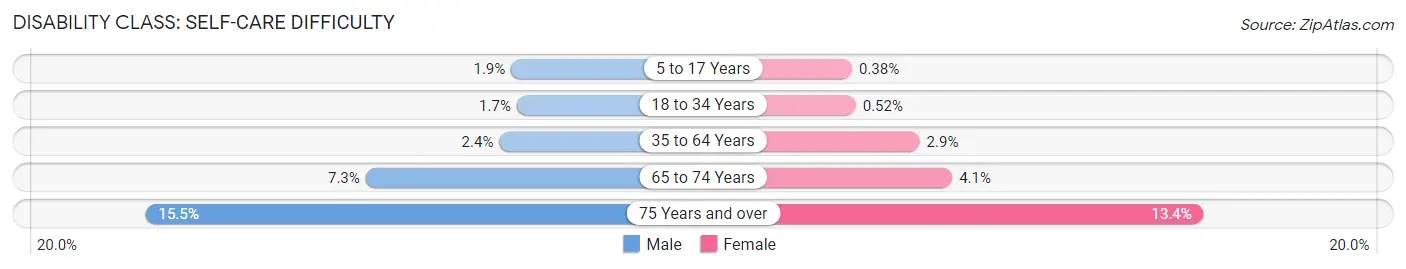
| Age Bracket | Male | Female |
| 5 to 17 Years | 59 (1.9%) | 11 (0.4%) |
| 18 to 34 Years | 59 (1.7%) | 15 (0.5%) |
| 35 to 64 Years | 106 (2.4%) | 134 (2.9%) |
| 65 to 74 Years | 95 (7.3%) | 61 (4.1%) |
| 75 Years and over | 141 (15.5%) | 161 (13.4%) |
Technology Access in Malheur County
Computing Device Access in Malheur County
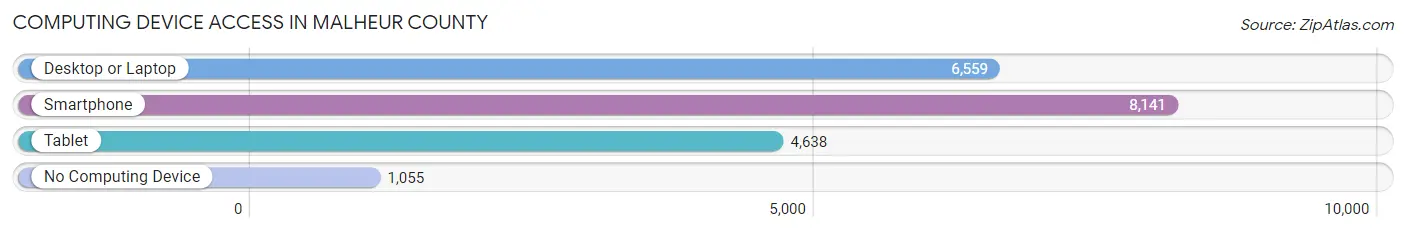
| Device Type | # Households | % Households |
| Desktop or Laptop | 6,559 | 65.9% |
| Smartphone | 8,141 | 81.8% |
| Tablet | 4,638 | 46.6% |
| No Computing Device | 1,055 | 10.6% |
| Total | 9,952 | 100.0% |
Internet Access in Malheur County
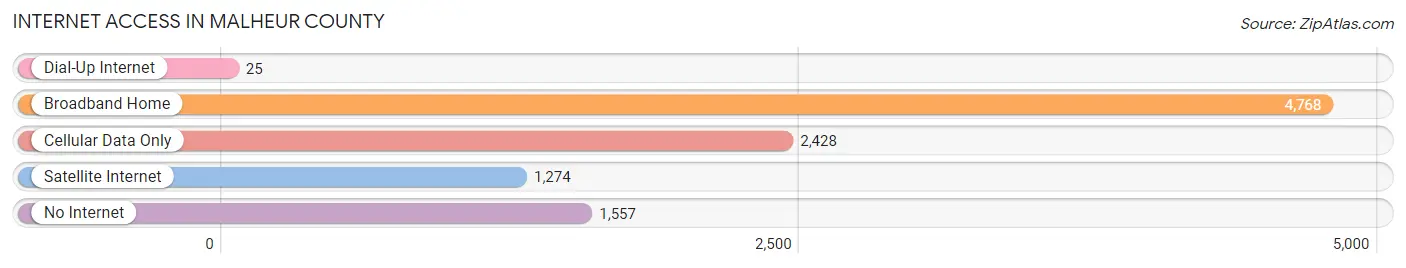
| Internet Type | # Households | % Households |
| Dial-Up Internet | 25 | 0.3% |
| Broadband Home | 4,768 | 47.9% |
| Cellular Data Only | 2,428 | 24.4% |
| Satellite Internet | 1,274 | 12.8% |
| No Internet | 1,557 | 15.7% |
| Total | 9,952 | 100.0% |
Malheur County Summary
Malheur County is located in the southeastern corner of Oregon, and is bordered by Idaho to the east, Harney County to the north, and the Snake River to the south. The county is part of the Treasure Valley region, which includes the cities of Ontario, Vale, Nyssa, and Jordan Valley. Malheur County is the second largest county in Oregon, with an area of 9,828 square miles.
History
Malheur County was created in 1887 from the eastern portion of Harney County. The county was named after the Malheur River, which was named by French-Canadian fur trappers in the early 1800s. The name Malheur is derived from the French phrase “malheur aux mauvais,” which translates to “woe to the wicked.”
The first settlers in Malheur County were ranchers and farmers who arrived in the late 1800s. The county was also home to several Native American tribes, including the Paiute, Shoshone, and Bannock. The tribes were relocated to the Malheur Indian Reservation in 1872.
The economy of Malheur County was largely based on agriculture and ranching until the early 1900s, when the Oregon Short Line Railroad was built through the county. This allowed for the development of several small towns, including Vale, Nyssa, and Jordan Valley.
Geography
Malheur County is located in the southeastern corner of Oregon, and is bordered by Idaho to the east, Harney County to the north, and the Snake River to the south. The county is part of the Treasure Valley region, which includes the cities of Ontario, Vale, Nyssa, and Jordan Valley.
The terrain of Malheur County is mostly flat, with some rolling hills in the northern part of the county. The county is home to several rivers, including the Malheur, Owyhee, and Snake Rivers. The county is also home to several lakes, including Malheur Lake, Owyhee Reservoir, and Lake Owyhee.
Economy
The economy of Malheur County is largely based on agriculture and ranching. The county is home to several large farms and ranches, which produce a variety of crops, including wheat, barley, hay, and potatoes. The county is also home to several large cattle ranches, which produce beef and dairy products.
The county is also home to several manufacturing and processing plants, which produce a variety of products, including food, paper, and wood products. The county is also home to several mining operations, which produce gold, silver, and other minerals.
Demographics
As of the 2010 census, the population of Malheur County was 31,313. The population is largely white (90.2%), with small percentages of Native American (2.2%), Hispanic (2.1%), and Asian (1.2%) populations. The median household income in the county is $41,945, and the median age is 38.7 years.
Conclusion
Malheur County is located in the southeastern corner of Oregon, and is bordered by Idaho to the east, Harney County to the north, and the Snake River to the south. The county was created in 1887, and was named after the Malheur River. The economy of Malheur County is largely based on agriculture and ranching, and the population is largely white. The county is home to several large farms and ranches, manufacturing and processing plants, and mining operations.
Common Questions
What is the Total Population of Malheur County?
Total Population of Malheur County is 31,538.
What is the Total Male Population of Malheur County?
Total Male Population of Malheur County is 17,355.
What is the Total Female Population of Malheur County?
Total Female Population of Malheur County is 14,183.
What is the Ratio of Males per 100 Females in Malheur County?
There are 122.36 Males per 100 Females in Malheur County.
What is the Ratio of Females per 100 Males in Malheur County?
There are 81.72 Females per 100 Males in Malheur County.
What is the Median Population Age in Malheur County?
Median Population Age in Malheur County is 35.9 Years.
What is the Average Family Size in Malheur County
Average Family Size in Malheur County is 3.5 People.
What is the Average Household Size in Malheur County
Average Household Size in Malheur County is 2.8 People.
What is Per Capita Income in Malheur County?
Per Capita income in Malheur County is $22,145.
What is the Median Family Income in Malheur County?
Median Family Income in Malheur County is $61,998.
What is the Median Household income in Malheur County?
Median Household Income in Malheur County is $48,371.
What is Income or Wage Gap in Malheur County?
Income or Wage Gap in Malheur County is 9.7%.
Women in Malheur County earn 90.3 cents for every dollar earned by a man.
What is Family Income Deficit in Malheur County?
Family Income Deficit in Malheur County is $11,623.
Families that are below poverty line in Malheur County earn $11,623 less on average than the poverty threshold level.
What is Inequality or Gini Index in Malheur County?
Inequality or Gini Index in Malheur County is 0.44.
How Large is the Labor Force in Malheur County?
There are 12,413 People in the Labor Forcein in Malheur County.
What is the Percentage of People in the Labor Force in Malheur County?
50.8% of People are in the Labor Force in Malheur County.
What is the Unemployment Rate in Malheur County?
Unemployment Rate in Malheur County is 6.2%.