Linn County, OR
Linn County Map
Linn County Overview
128,598
TOTAL POPULATION
64,303
MALE POPULATION
64,295
FEMALE POPULATION
100.01
MALES / 100 FEMALES
99.99
FEMALES / 100 MALES
40.0
MEDIAN AGE
3.0
AVG FAMILY SIZE
2.5
AVG HOUSEHOLD SIZE
$32,501
PER CAPITA INCOME
$81,297
AVG FAMILY INCOME
$69,523
AVG HOUSEHOLD INCOME
33.5%
WAGE / INCOME GAP [ % ]
66.5¢/ $1
WAGE / INCOME GAP [ $ ]
$10,068
FAMILY INCOME DEFICIT
0.40
INEQUALITY / GINI INDEX
61,737
LABOR FORCE [ PEOPLE ]
59.9%
PERCENT IN LABOR FORCE
6.2%
UNEMPLOYMENT RATE
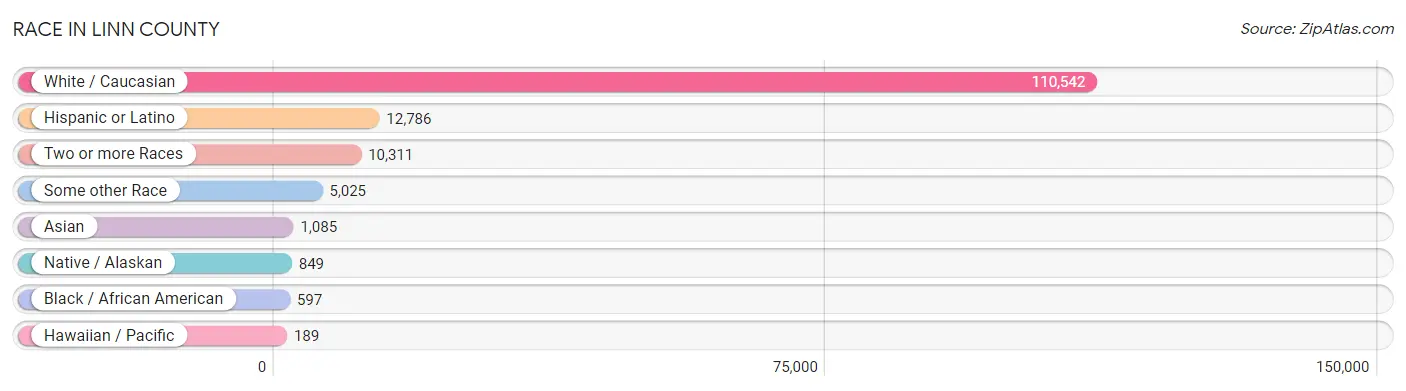
Race in Linn County
The most populous races in Linn County are White / Caucasian (110,542 | 86.0%), Hispanic or Latino (12,786 | 9.9%), and Two or more Races (10,311 | 8.0%).
| Race | # Population | % Population |
| Asian | 1,085 | 0.8% |
| Black / African American | 597 | 0.5% |
| Hawaiian / Pacific | 189 | 0.2% |
| Hispanic or Latino | 12,786 | 9.9% |
| Native / Alaskan | 849 | 0.7% |
| White / Caucasian | 110,542 | 86.0% |
| Two or more Races | 10,311 | 8.0% |
| Some other Race | 5,025 | 3.9% |
| Total | 128,598 | 100.0% |
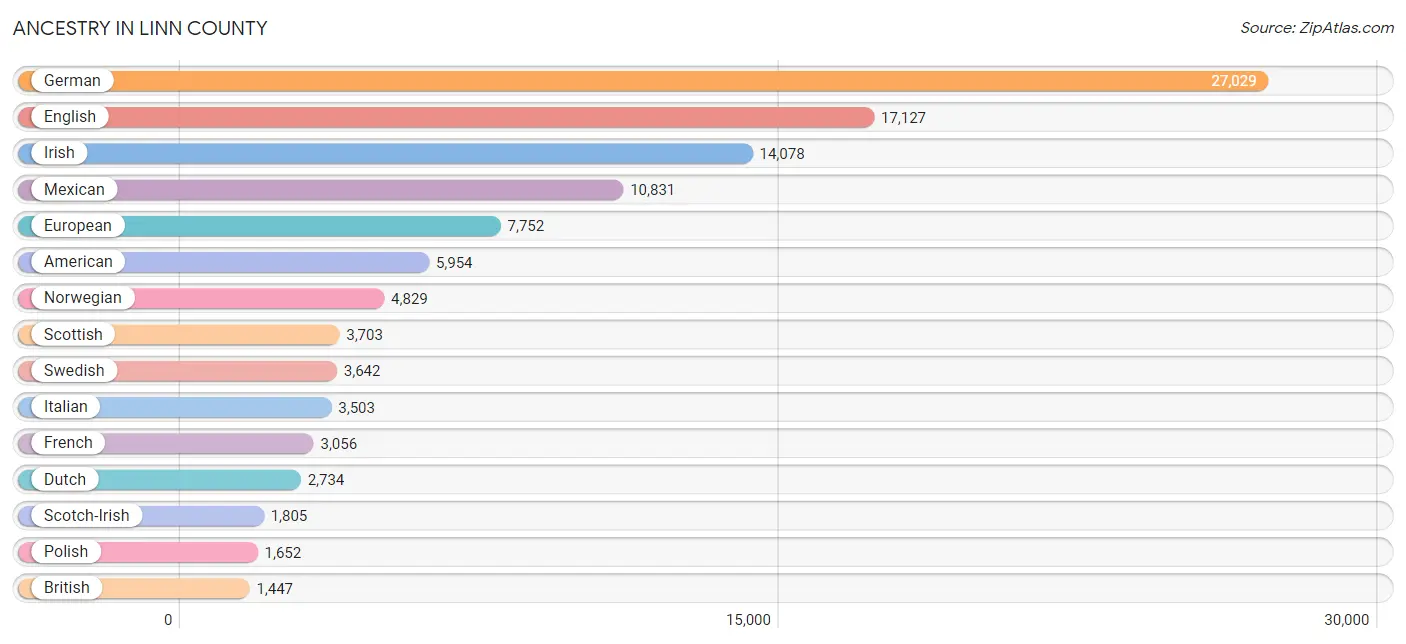
Ancestry in Linn County
The most populous ancestries reported in Linn County are German (27,029 | 21.0%), English (17,127 | 13.3%), Irish (14,078 | 11.0%), Mexican (10,831 | 8.4%), and European (7,752 | 6.0%), together accounting for 59.7% of all Linn County residents.
| Ancestry | # Population | % Population |
| African | 1,072 | 0.8% |
| Alaska Native | 277 | 0.2% |
| Alaskan Athabascan | 149 | 0.1% |
| Aleut | 34 | 0.0% |
| American | 5,954 | 4.6% |
| Apache | 97 | 0.1% |
| Arab | 127 | 0.1% |
| Argentinean | 37 | 0.0% |
| Armenian | 34 | 0.0% |
| Australian | 54 | 0.0% |
| Austrian | 193 | 0.2% |
| Bangladeshi | 206 | 0.2% |
| Basque | 50 | 0.0% |
| Belgian | 300 | 0.2% |
| Bhutanese | 551 | 0.4% |
| Blackfeet | 435 | 0.3% |
| Bolivian | 16 | 0.0% |
| British | 1,447 | 1.1% |
| Bulgarian | 4 | 0.0% |
| Burmese | 316 | 0.3% |
| Cajun | 16 | 0.0% |
| Canadian | 364 | 0.3% |
| Celtic | 21 | 0.0% |
| Central American | 331 | 0.3% |
| Central American Indian | 21 | 0.0% |
| Cherokee | 1,188 | 0.9% |
| Cheyenne | 21 | 0.0% |
| Chickasaw | 58 | 0.1% |
| Chilean | 1 | 0.0% |
| Chinese | 7 | 0.0% |
| Chippewa | 24 | 0.0% |
| Choctaw | 229 | 0.2% |
| Colombian | 58 | 0.1% |
| Colville | 13 | 0.0% |
| Costa Rican | 40 | 0.0% |
| Creek | 51 | 0.0% |
| Croatian | 20 | 0.0% |
| Cuban | 73 | 0.1% |
| Czech | 492 | 0.4% |
| Czechoslovakian | 173 | 0.1% |
| Danish | 1,207 | 0.9% |
| Delaware | 13 | 0.0% |
| Dominican | 157 | 0.1% |
| Dutch | 2,734 | 2.1% |
| Eastern European | 443 | 0.3% |
| Ecuadorian | 30 | 0.0% |
| Egyptian | 14 | 0.0% |
| English | 17,127 | 13.3% |
| Ethiopian | 134 | 0.1% |
| European | 7,752 | 6.0% |
| Fijian | 34 | 0.0% |
| Finnish | 371 | 0.3% |
| French | 3,056 | 2.4% |
| French American Indian | 57 | 0.0% |
| French Canadian | 661 | 0.5% |
| German | 27,029 | 21.0% |
| Greek | 640 | 0.5% |
| Guamanian / Chamorro | 39 | 0.0% |
| Guatemalan | 52 | 0.0% |
| Haitian | 38 | 0.0% |
| Honduran | 90 | 0.1% |
| Hungarian | 296 | 0.2% |
| Icelander | 40 | 0.0% |
| Indian (Asian) | 575 | 0.4% |
| Inupiat | 24 | 0.0% |
| Iranian | 38 | 0.0% |
| Irish | 14,078 | 11.0% |
| Iroquois | 31 | 0.0% |
| Israeli | 7 | 0.0% |
| Italian | 3,503 | 2.7% |
| Jamaican | 24 | 0.0% |
| Kenyan | 7 | 0.0% |
| Kiowa | 41 | 0.0% |
| Korean | 905 | 0.7% |
| Laotian | 25 | 0.0% |
| Latvian | 2 | 0.0% |
| Lebanese | 47 | 0.0% |
| Lithuanian | 235 | 0.2% |
| Luxembourger | 16 | 0.0% |
| Malaysian | 55 | 0.0% |
| Maltese | 8 | 0.0% |
| Mexican | 10,831 | 8.4% |
| Mexican American Indian | 367 | 0.3% |
| Native Hawaiian | 451 | 0.4% |
| Navajo | 61 | 0.1% |
| Nicaraguan | 35 | 0.0% |
| Nigerian | 16 | 0.0% |
| Northern European | 430 | 0.3% |
| Norwegian | 4,829 | 3.8% |
| Osage | 55 | 0.0% |
| Paiute | 5 | 0.0% |
| Pakistani | 18 | 0.0% |
| Panamanian | 10 | 0.0% |
| Pennsylvania German | 9 | 0.0% |
| Peruvian | 10 | 0.0% |
| Polish | 1,652 | 1.3% |
| Portuguese | 627 | 0.5% |
| Puerto Rican | 259 | 0.2% |
| Romanian | 108 | 0.1% |
| Russian | 774 | 0.6% |
| Salvadoran | 104 | 0.1% |
| Samoan | 63 | 0.1% |
| Scandinavian | 1,008 | 0.8% |
| Scotch-Irish | 1,805 | 1.4% |
| Scottish | 3,703 | 2.9% |
| Serbian | 104 | 0.1% |
| Shoshone | 8 | 0.0% |
| Sioux | 121 | 0.1% |
| Slavic | 76 | 0.1% |
| Slovak | 130 | 0.1% |
| Slovene | 9 | 0.0% |
| South African | 13 | 0.0% |
| South American | 152 | 0.1% |
| Spaniard | 313 | 0.2% |
| Spanish | 175 | 0.1% |
| Spanish American Indian | 49 | 0.0% |
| Sri Lankan | 57 | 0.0% |
| Subsaharan African | 1,254 | 1.0% |
| Swedish | 3,642 | 2.8% |
| Swiss | 922 | 0.7% |
| Syrian | 48 | 0.0% |
| Thai | 312 | 0.2% |
| Tlingit-Haida | 71 | 0.1% |
| Trinidadian and Tobagonian | 8 | 0.0% |
| Turkish | 6 | 0.0% |
| Ugandan | 12 | 0.0% |
| Ukrainian | 309 | 0.2% |
| Vietnamese | 26 | 0.0% |
| Welsh | 1,142 | 0.9% |
| Yugoslavian | 75 | 0.1% |
| Yup'ik | 10 | 0.0% | View All 131 Rows |
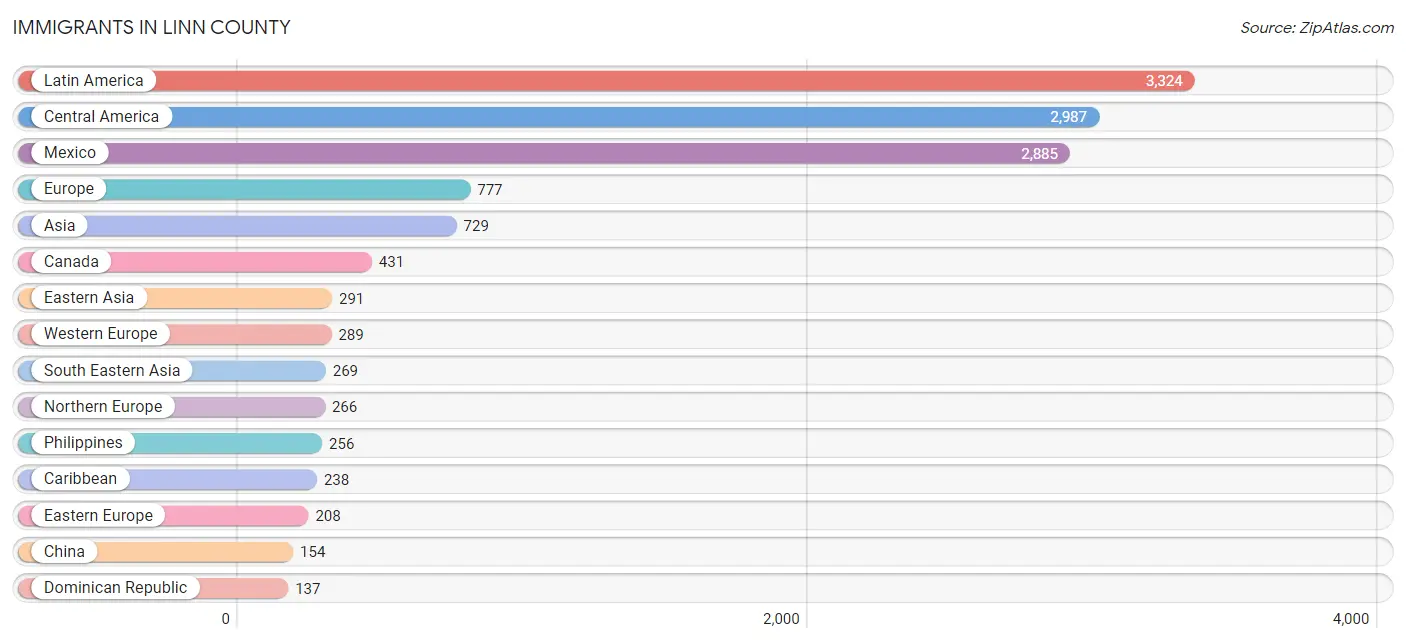
Immigrants in Linn County
The most numerous immigrant groups reported in Linn County came from Latin America (3,324 | 2.6%), Central America (2,987 | 2.3%), Mexico (2,885 | 2.2%), Europe (777 | 0.6%), and Asia (729 | 0.6%), together accounting for 8.3% of all Linn County residents.
| Immigration Origin | # Population | % Population |
| Africa | 72 | 0.1% |
| Armenia | 1 | 0.0% |
| Asia | 729 | 0.6% |
| Australia | 27 | 0.0% |
| Bangladesh | 2 | 0.0% |
| Belgium | 89 | 0.1% |
| Bulgaria | 4 | 0.0% |
| Canada | 431 | 0.3% |
| Caribbean | 238 | 0.2% |
| Central America | 2,987 | 2.3% |
| Chile | 1 | 0.0% |
| China | 154 | 0.1% |
| Colombia | 58 | 0.1% |
| Costa Rica | 18 | 0.0% |
| Cuba | 44 | 0.0% |
| Czechoslovakia | 11 | 0.0% |
| Denmark | 5 | 0.0% |
| Dominican Republic | 137 | 0.1% |
| Eastern Africa | 34 | 0.0% |
| Eastern Asia | 291 | 0.2% |
| Eastern Europe | 208 | 0.2% |
| Ecuador | 30 | 0.0% |
| El Salvador | 70 | 0.1% |
| England | 131 | 0.1% |
| Ethiopia | 12 | 0.0% |
| Europe | 777 | 0.6% |
| France | 83 | 0.1% |
| Germany | 48 | 0.0% |
| Guatemala | 4 | 0.0% |
| Haiti | 38 | 0.0% |
| Hong Kong | 13 | 0.0% |
| Hungary | 12 | 0.0% |
| India | 99 | 0.1% |
| Ireland | 48 | 0.0% |
| Jamaica | 11 | 0.0% |
| Japan | 75 | 0.1% |
| Korea | 62 | 0.1% |
| Latin America | 3,324 | 2.6% |
| Lebanon | 37 | 0.0% |
| Mexico | 2,885 | 2.2% |
| Netherlands | 35 | 0.0% |
| Nicaragua | 10 | 0.0% |
| Nigeria | 4 | 0.0% |
| Northern Europe | 266 | 0.2% |
| Norway | 13 | 0.0% |
| Oceania | 102 | 0.1% |
| Pakistan | 26 | 0.0% |
| Peru | 10 | 0.0% |
| Philippines | 256 | 0.2% |
| Portugal | 14 | 0.0% |
| Romania | 16 | 0.0% |
| Russia | 33 | 0.0% |
| Serbia | 10 | 0.0% |
| South Africa | 34 | 0.0% |
| South America | 99 | 0.1% |
| South Central Asia | 127 | 0.1% |
| South Eastern Asia | 269 | 0.2% |
| Southern Europe | 14 | 0.0% |
| Sweden | 11 | 0.0% |
| Switzerland | 34 | 0.0% |
| Taiwan | 20 | 0.0% |
| Thailand | 13 | 0.0% |
| Trinidad and Tobago | 8 | 0.0% |
| Uganda | 4 | 0.0% |
| Ukraine | 122 | 0.1% |
| Western Africa | 4 | 0.0% |
| Western Asia | 42 | 0.0% |
| Western Europe | 289 | 0.2% | View All 68 Rows |
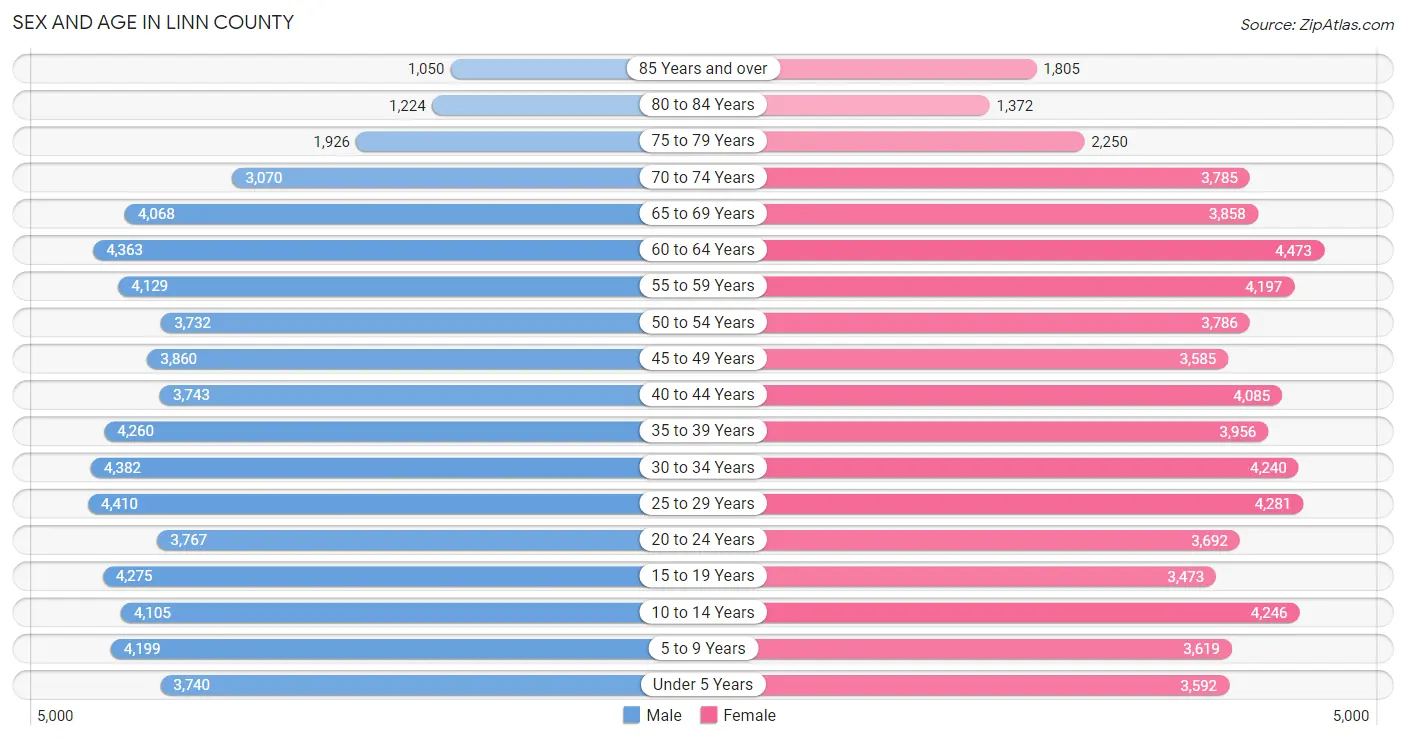
Sex and Age in Linn County
Sex and Age in Linn County
The most populous age groups in Linn County are 25 to 29 Years (4,410 | 6.9%) for men and 60 to 64 Years (4,473 | 7.0%) for women.
| Age Bracket | Male | Female |
| Under 5 Years | 3,740 (5.8%) | 3,592 (5.6%) |
| 5 to 9 Years | 4,199 (6.5%) | 3,619 (5.6%) |
| 10 to 14 Years | 4,105 (6.4%) | 4,246 (6.6%) |
| 15 to 19 Years | 4,275 (6.7%) | 3,473 (5.4%) |
| 20 to 24 Years | 3,767 (5.9%) | 3,692 (5.7%) |
| 25 to 29 Years | 4,410 (6.9%) | 4,281 (6.7%) |
| 30 to 34 Years | 4,382 (6.8%) | 4,240 (6.6%) |
| 35 to 39 Years | 4,260 (6.6%) | 3,956 (6.1%) |
| 40 to 44 Years | 3,743 (5.8%) | 4,085 (6.4%) |
| 45 to 49 Years | 3,860 (6.0%) | 3,585 (5.6%) |
| 50 to 54 Years | 3,732 (5.8%) | 3,786 (5.9%) |
| 55 to 59 Years | 4,129 (6.4%) | 4,197 (6.5%) |
| 60 to 64 Years | 4,363 (6.8%) | 4,473 (7.0%) |
| 65 to 69 Years | 4,068 (6.3%) | 3,858 (6.0%) |
| 70 to 74 Years | 3,070 (4.8%) | 3,785 (5.9%) |
| 75 to 79 Years | 1,926 (3.0%) | 2,250 (3.5%) |
| 80 to 84 Years | 1,224 (1.9%) | 1,372 (2.1%) |
| 85 Years and over | 1,050 (1.6%) | 1,805 (2.8%) |
| Total | 64,303 (100.0%) | 64,295 (100.0%) |
Families and Households in Linn County
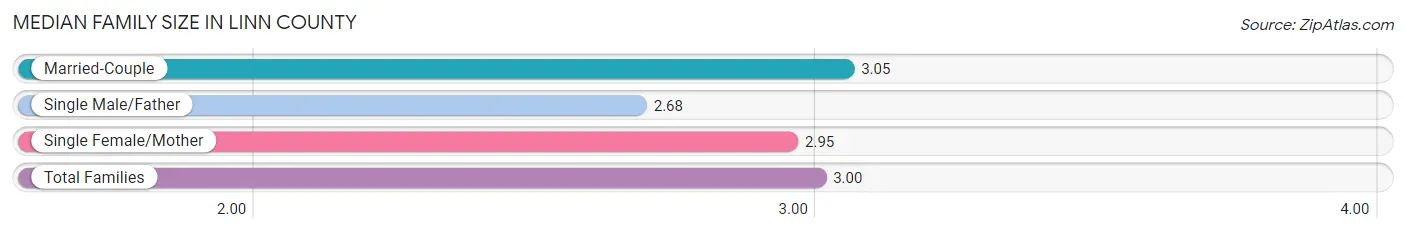
Median Family Size in Linn County
The median family size in Linn County is 3.00 persons per family, with married-couple families (25,685 | 76.7%) accounting for the largest median family size of 3.05 persons per family. On the other hand, single male/father families (2,990 | 8.9%) represent the smallest median family size with 2.68 persons per family.
| Family Type | # Families | Family Size |
| Married-Couple | 25,685 (76.7%) | 3.05 |
| Single Male/Father | 2,990 (8.9%) | 2.68 |
| Single Female/Mother | 4,811 (14.4%) | 2.95 |
| Total Families | 33,486 (100.0%) | 3.00 |
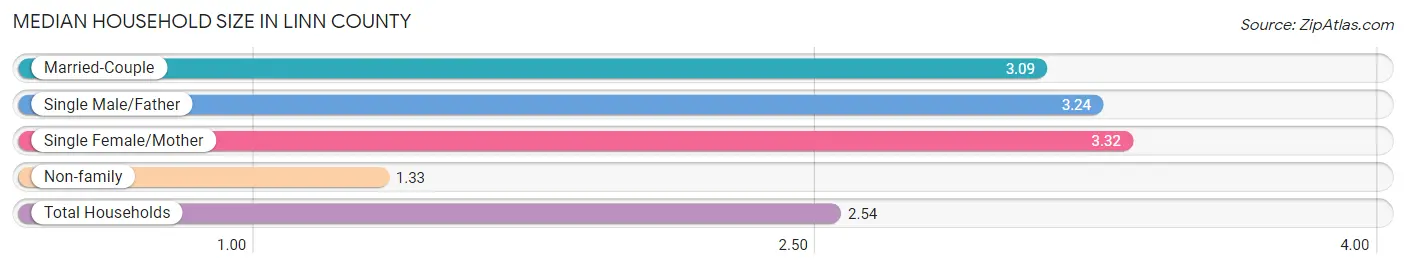
Median Household Size in Linn County
The median household size in Linn County is 2.54 persons per household, with single female/mother households (4,811 | 9.6%) accounting for the largest median household size of 3.32 persons per household. non-family households (16,458 | 33.0%) represent the smallest median household size with 1.33 persons per household.
| Household Type | # Households | Household Size |
| Married-Couple | 25,685 (51.4%) | 3.09 |
| Single Male/Father | 2,990 (6.0%) | 3.24 |
| Single Female/Mother | 4,811 (9.6%) | 3.32 |
| Non-family | 16,458 (33.0%) | 1.33 |
| Total Households | 49,944 (100.0%) | 2.54 |
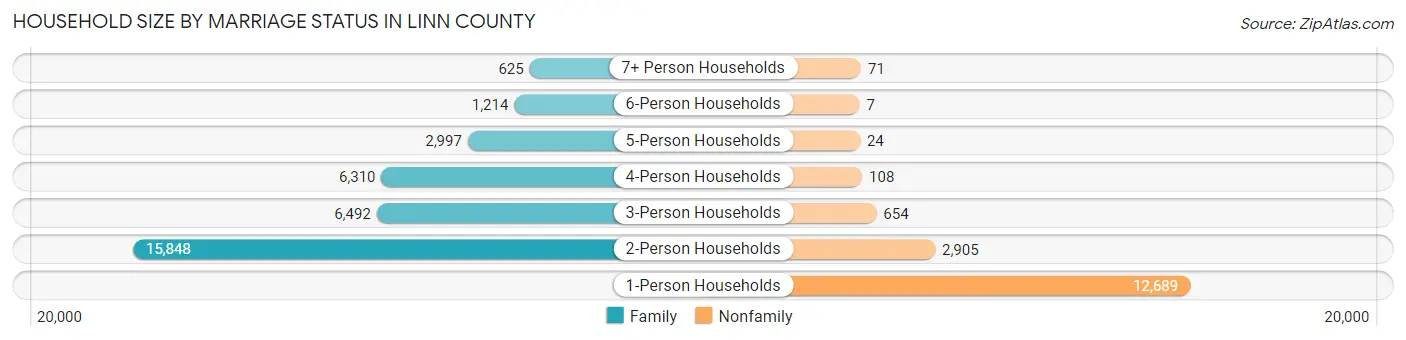
Household Size by Marriage Status in Linn County
Out of a total of 49,944 households in Linn County, 33,486 (67.0%) are family households, while 16,458 (33.0%) are nonfamily households. The most numerous type of family households are 2-person households, comprising 15,848, and the most common type of nonfamily households are 1-person households, comprising 12,689.
| Household Size | Family Households | Nonfamily Households |
| 1-Person Households | - | 12,689 (25.4%) |
| 2-Person Households | 15,848 (31.7%) | 2,905 (5.8%) |
| 3-Person Households | 6,492 (13.0%) | 654 (1.3%) |
| 4-Person Households | 6,310 (12.6%) | 108 (0.2%) |
| 5-Person Households | 2,997 (6.0%) | 24 (0.1%) |
| 6-Person Households | 1,214 (2.4%) | 7 (0.0%) |
| 7+ Person Households | 625 (1.3%) | 71 (0.1%) |
| Total | 33,486 (67.0%) | 16,458 (33.0%) |
Female Fertility in Linn County
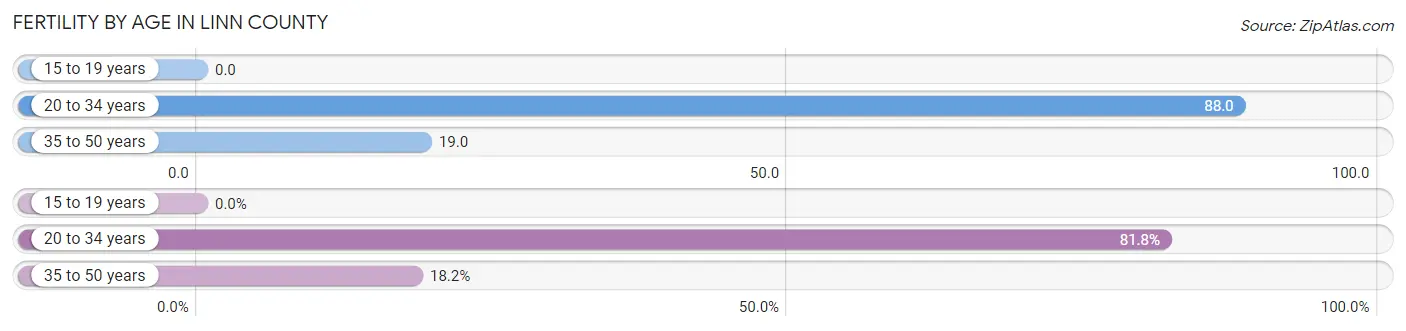
Fertility by Age in Linn County
Average fertility rate in Linn County is 47.0 births per 1,000 women. Women in the age bracket of 20 to 34 years have the highest fertility rate with 88.0 births per 1,000 women. Women in the age bracket of 20 to 34 years acount for 81.8% of all women with births.
| Age Bracket | Women with Births | Births / 1,000 Women |
| 15 to 19 years | 0 (0.0%) | 0.0 |
| 20 to 34 years | 1,071 (81.8%) | 88.0 |
| 35 to 50 years | 239 (18.2%) | 19.0 |
| Total | 1,310 (100.0%) | 47.0 |
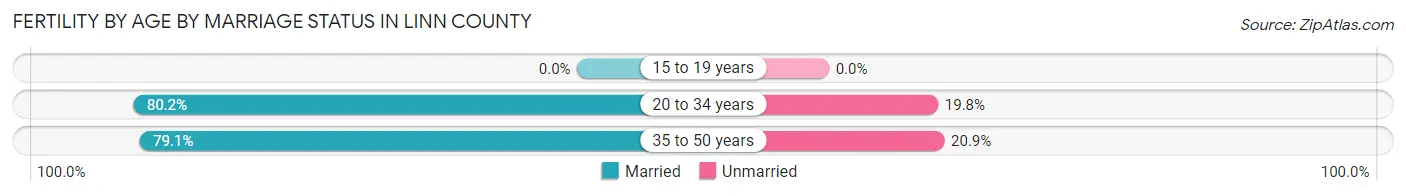
Fertility by Age by Marriage Status in Linn County
80.0% of women with births (1,310) in Linn County are married. The highest percentage of unmarried women with births falls into 35 to 50 years age bracket with 20.9% of them unmarried at the time of birth, while the lowest percentage of unmarried women with births belong to 20 to 34 years age bracket with 19.8% of them unmarried.
| Age Bracket | Married | Unmarried |
| 15 to 19 years | 0 (0.0%) | 0 (0.0%) |
| 20 to 34 years | 859 (80.2%) | 212 (19.8%) |
| 35 to 50 years | 189 (79.1%) | 50 (20.9%) |
| Total | 1,048 (80.0%) | 262 (20.0%) |
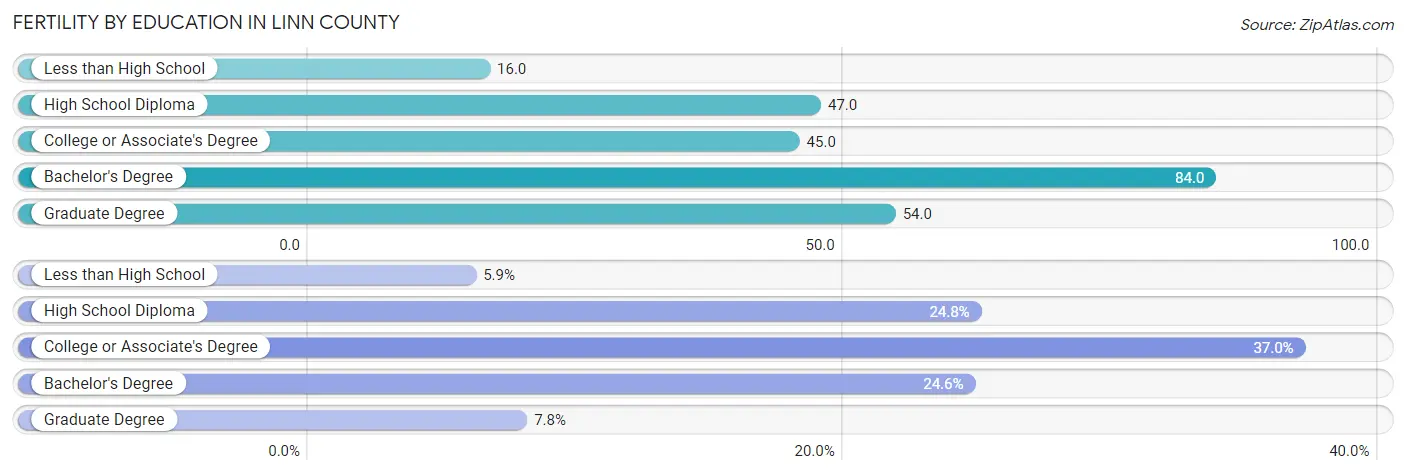
Fertility by Education in Linn County
Average fertility rate in Linn County is 47.0 births per 1,000 women. Women with the education attainment of bachelor's degree have the highest fertility rate of 84.0 births per 1,000 women, while women with the education attainment of less than high school have the lowest fertility at 16.0 births per 1,000 women. Women with the education attainment of college or associate's degree represent 36.9% of all women with births.
| Educational Attainment | Women with Births | Births / 1,000 Women |
| Less than High School | 77 (5.9%) | 16.0 |
| High School Diploma | 325 (24.8%) | 47.0 |
| College or Associate's Degree | 484 (36.9%) | 45.0 |
| Bachelor's Degree | 322 (24.6%) | 84.0 |
| Graduate Degree | 102 (7.8%) | 54.0 |
| Total | 1,310 (100.0%) | 47.0 |
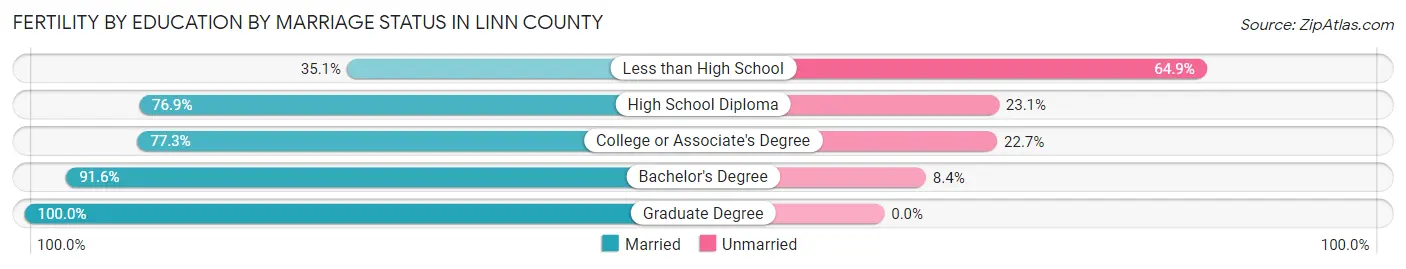
Fertility by Education by Marriage Status in Linn County
20.0% of women with births in Linn County are unmarried. Women with the educational attainment of graduate degree are most likely to be married with 100.0% of them married at childbirth, while women with the educational attainment of less than high school are least likely to be married with 64.9% of them unmarried at childbirth.
| Educational Attainment | Married | Unmarried |
| Less than High School | 27 (35.1%) | 50 (64.9%) |
| High School Diploma | 250 (76.9%) | 75 (23.1%) |
| College or Associate's Degree | 374 (77.3%) | 110 (22.7%) |
| Bachelor's Degree | 295 (91.6%) | 27 (8.4%) |
| Graduate Degree | 102 (100.0%) | 0 (0.0%) |
| Total | 1,048 (80.0%) | 262 (20.0%) |
Income in Linn County
Income Overview in Linn County
Per Capita Income in Linn County is $32,501, while median incomes of families and households are $81,297 and $69,523 respectively.
| Characteristic | Number | Measure |
| Per Capita Income | 128,598 | $32,501 |
| Median Family Income | 33,486 | $81,297 |
| Mean Family Income | 33,486 | $94,239 |
| Median Household Income | 49,944 | $69,523 |
| Mean Household Income | 49,944 | $82,759 |
| Income Deficit | 33,486 | $10,068 |
| Wage / Income Gap (%) | 128,598 | 33.49% |
| Wage / Income Gap ($) | 128,598 | 66.51¢ per $1 |
| Gini / Inequality Index | 128,598 | 0.40 |
Earnings by Sex in Linn County
Average Earnings in Linn County are $40,112, $47,437 for men and $31,552 for women, a difference of 33.5%.
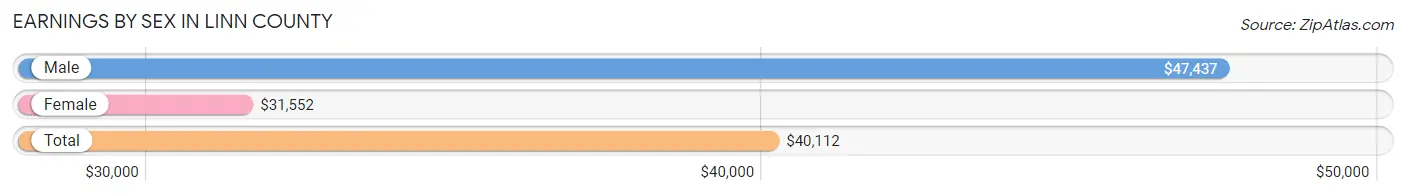
| Sex | Number | Average Earnings |
| Male | 34,328 (53.8%) | $47,437 |
| Female | 29,443 (46.2%) | $31,552 |
| Total | 63,771 (100.0%) | $40,112 |
Earnings by Sex by Income Bracket in Linn County
The most common earnings brackets in Linn County are $75,000 to $99,999 for men (4,861 | 14.2%) and $25,000 to $29,999 for women (2,271 | 7.7%).
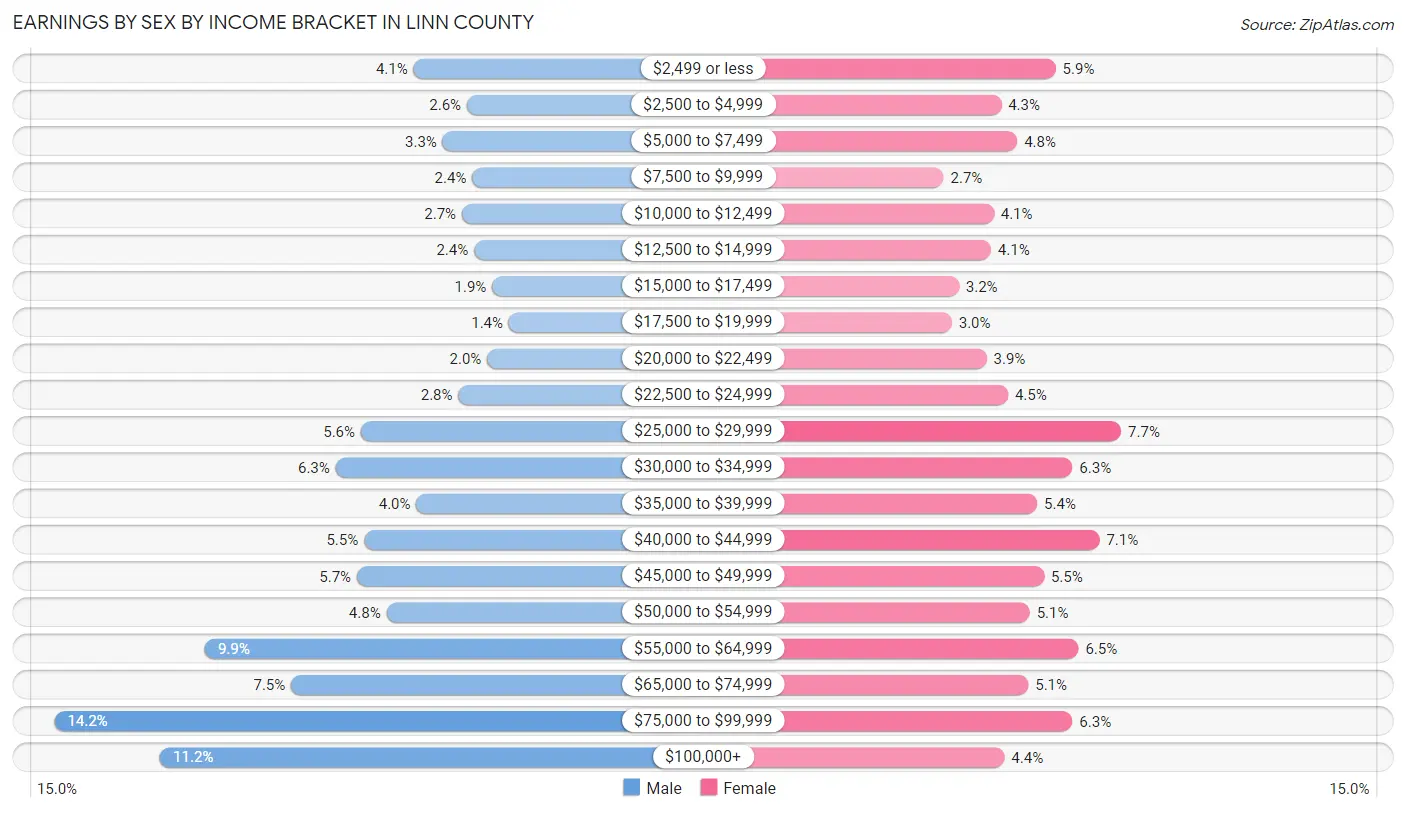
| Income | Male | Female |
| $2,499 or less | 1,398 (4.1%) | 1,728 (5.9%) |
| $2,500 to $4,999 | 882 (2.6%) | 1,278 (4.3%) |
| $5,000 to $7,499 | 1,115 (3.3%) | 1,409 (4.8%) |
| $7,500 to $9,999 | 832 (2.4%) | 800 (2.7%) |
| $10,000 to $12,499 | 931 (2.7%) | 1,216 (4.1%) |
| $12,500 to $14,999 | 815 (2.4%) | 1,191 (4.1%) |
| $15,000 to $17,499 | 638 (1.9%) | 928 (3.2%) |
| $17,500 to $19,999 | 478 (1.4%) | 868 (2.9%) |
| $20,000 to $22,499 | 687 (2.0%) | 1,156 (3.9%) |
| $22,500 to $24,999 | 963 (2.8%) | 1,335 (4.5%) |
| $25,000 to $29,999 | 1,904 (5.6%) | 2,271 (7.7%) |
| $30,000 to $34,999 | 2,149 (6.3%) | 1,867 (6.3%) |
| $35,000 to $39,999 | 1,369 (4.0%) | 1,575 (5.3%) |
| $40,000 to $44,999 | 1,875 (5.5%) | 2,089 (7.1%) |
| $45,000 to $49,999 | 1,943 (5.7%) | 1,630 (5.5%) |
| $50,000 to $54,999 | 1,657 (4.8%) | 1,514 (5.1%) |
| $55,000 to $64,999 | 3,410 (9.9%) | 1,916 (6.5%) |
| $65,000 to $74,999 | 2,578 (7.5%) | 1,501 (5.1%) |
| $75,000 to $99,999 | 4,861 (14.2%) | 1,868 (6.3%) |
| $100,000+ | 3,843 (11.2%) | 1,303 (4.4%) |
| Total | 34,328 (100.0%) | 29,443 (100.0%) |
Earnings by Sex by Educational Attainment in Linn County
Average earnings in Linn County are $53,579 for men and $36,570 for women, a difference of 31.8%. Men with an educational attainment of graduate degree enjoy the highest average annual earnings of $62,804, while those with less than high school education earn the least with $43,982. Women with an educational attainment of graduate degree earn the most with the average annual earnings of $63,871, while those with high school diploma education have the smallest earnings of $26,032.
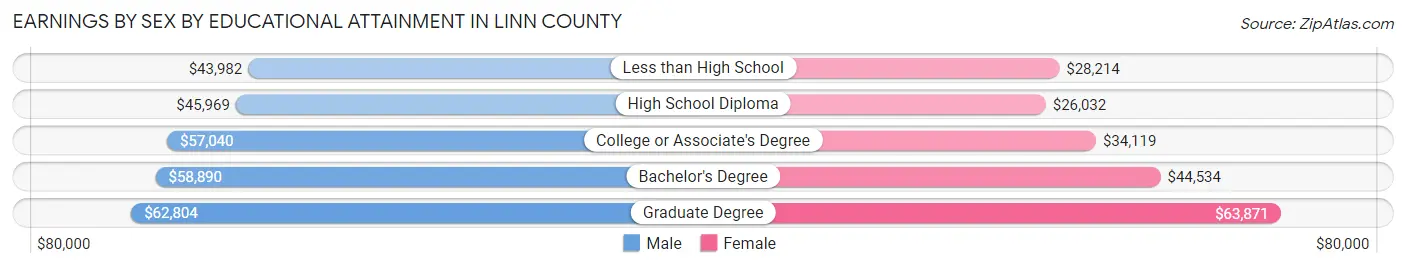
| Educational Attainment | Male Income | Female Income |
| Less than High School | $43,982 | $28,214 |
| High School Diploma | $45,969 | $26,032 |
| College or Associate's Degree | $57,040 | $34,119 |
| Bachelor's Degree | $58,890 | $44,534 |
| Graduate Degree | $62,804 | $63,871 |
| Total | $53,579 | $36,570 |
Family Income in Linn County
Family Income Brackets in Linn County
According to the Linn County family income data, there are 7,702 families falling into the $100,000 to $149,999 income range, which is the most common income bracket and makes up 23.0% of all families. Conversely, the $10,000 to $14,999 income bracket is the least frequent group with only 502 families (1.5%) belonging to this category.
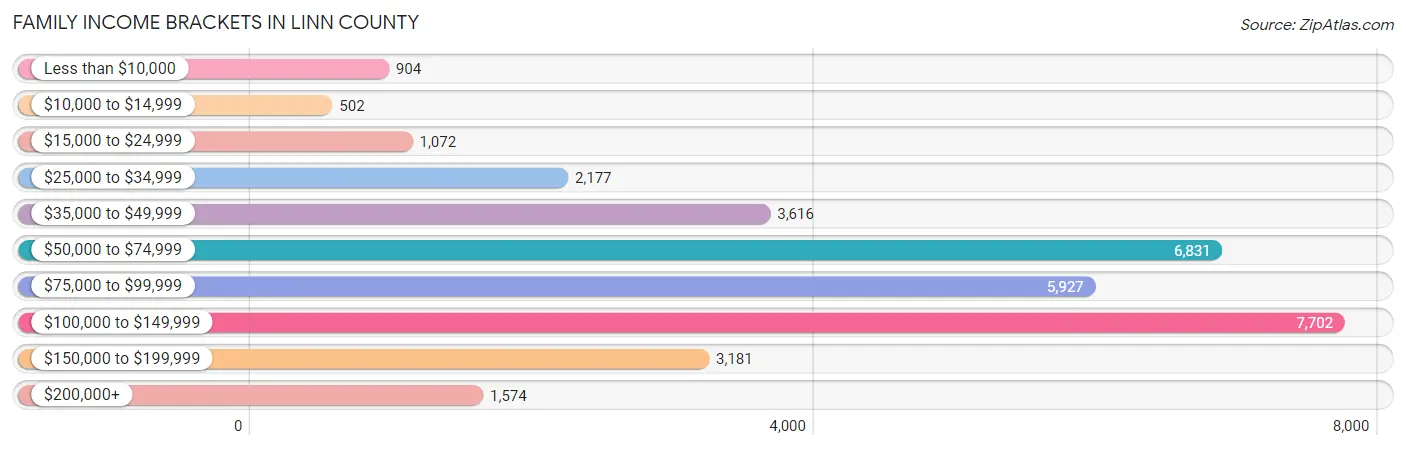
| Income Bracket | # Families | % Families |
| Less than $10,000 | 904 | 2.7% |
| $10,000 to $14,999 | 502 | 1.5% |
| $15,000 to $24,999 | 1,072 | 3.2% |
| $25,000 to $34,999 | 2,177 | 6.5% |
| $35,000 to $49,999 | 3,616 | 10.8% |
| $50,000 to $74,999 | 6,831 | 20.4% |
| $75,000 to $99,999 | 5,927 | 17.7% |
| $100,000 to $149,999 | 7,702 | 23.0% |
| $150,000 to $199,999 | 3,181 | 9.5% |
| $200,000+ | 1,574 | 4.7% |
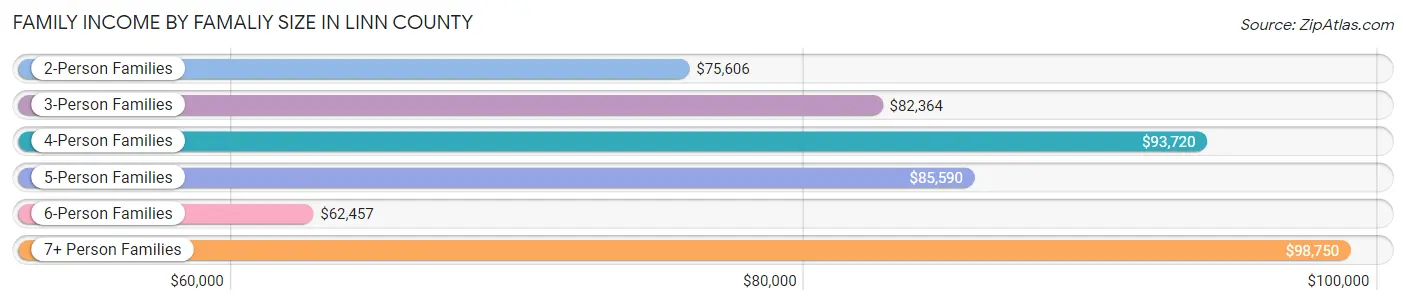
Family Income by Famaliy Size in Linn County
7+ person families (514 | 1.5%) account for the highest median family income in Linn County with $98,750 per family, while 2-person families (17,297 | 51.6%) have the highest median income of $37,803 per family member.
| Income Bracket | # Families | Median Income |
| 2-Person Families | 17,297 (51.6%) | $75,606 |
| 3-Person Families | 6,486 (19.4%) | $82,364 |
| 4-Person Families | 5,813 (17.4%) | $93,720 |
| 5-Person Families | 2,347 (7.0%) | $85,590 |
| 6-Person Families | 1,029 (3.1%) | $62,457 |
| 7+ Person Families | 514 (1.5%) | $98,750 |
| Total | 33,486 (100.0%) | $81,297 |
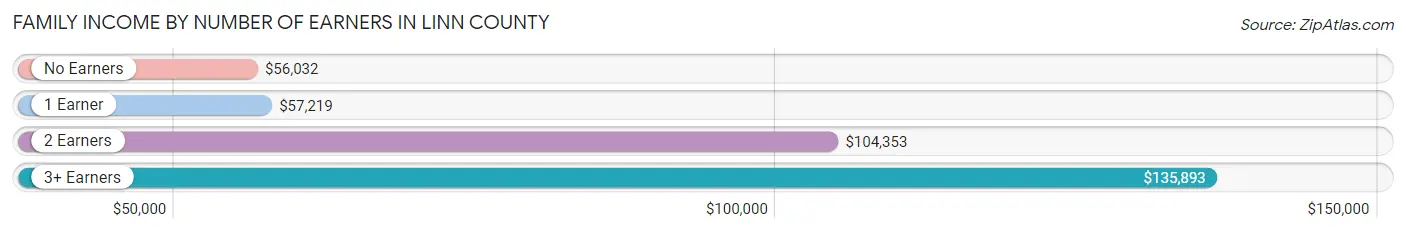
Family Income by Number of Earners in Linn County
The median family income in Linn County is $81,297, with families comprising 3+ earners (2,995) having the highest median family income of $135,893, while families with no earners (6,012) have the lowest median family income of $56,032, accounting for 8.9% and 17.9% of families, respectively.
| Number of Earners | # Families | Median Income |
| No Earners | 6,012 (17.9%) | $56,032 |
| 1 Earner | 10,681 (31.9%) | $57,219 |
| 2 Earners | 13,798 (41.2%) | $104,353 |
| 3+ Earners | 2,995 (8.9%) | $135,893 |
| Total | 33,486 (100.0%) | $81,297 |
Household Income in Linn County
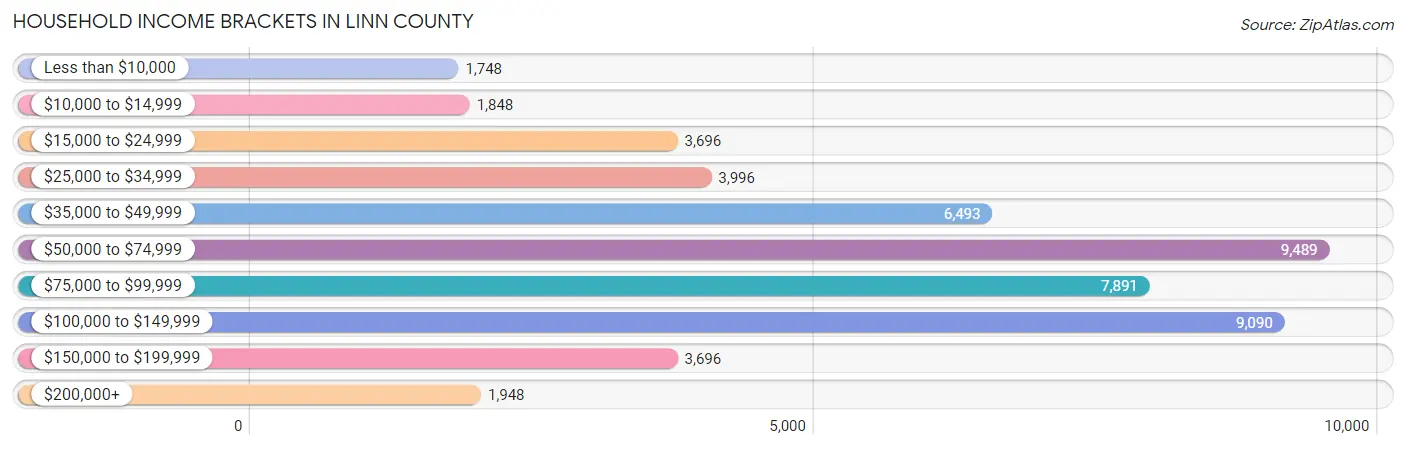
Household Income Brackets in Linn County
With 9,489 households falling in the category, the $50,000 to $74,999 income range is the most frequent in Linn County, accounting for 19.0% of all households. In contrast, only 1,748 households (3.5%) fall into the less than $10,000 income bracket, making it the least populous group.
| Income Bracket | # Households | % Households |
| Less than $10,000 | 1,748 | 3.5% |
| $10,000 to $14,999 | 1,848 | 3.7% |
| $15,000 to $24,999 | 3,696 | 7.4% |
| $25,000 to $34,999 | 3,996 | 8.0% |
| $35,000 to $49,999 | 6,493 | 13.0% |
| $50,000 to $74,999 | 9,489 | 19.0% |
| $75,000 to $99,999 | 7,891 | 15.8% |
| $100,000 to $149,999 | 9,090 | 18.2% |
| $150,000 to $199,999 | 3,696 | 7.4% |
| $200,000+ | 1,948 | 3.9% |
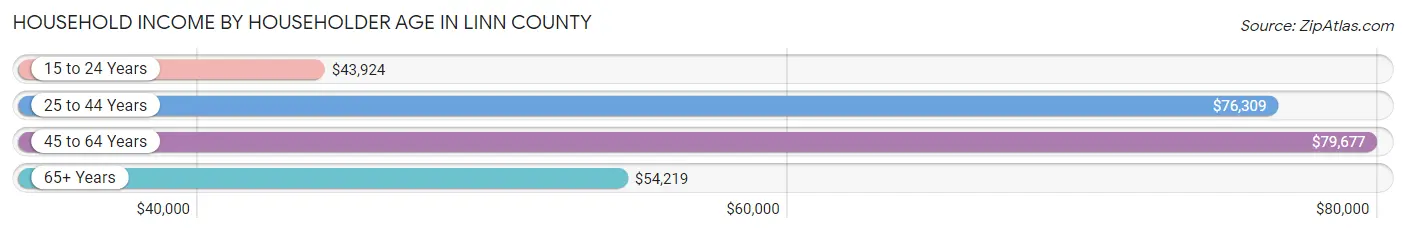
Household Income by Householder Age in Linn County
The median household income in Linn County is $69,523, with the highest median household income of $79,677 found in the 45 to 64 years age bracket for the primary householder. A total of 17,540 households (35.1%) fall into this category. Meanwhile, the 15 to 24 years age bracket for the primary householder has the lowest median household income of $43,924, with 1,913 households (3.8%) in this group.
| Income Bracket | # Households | Median Income |
| 15 to 24 Years | 1,913 (3.8%) | $43,924 |
| 25 to 44 Years | 15,640 (31.3%) | $76,309 |
| 45 to 64 Years | 17,540 (35.1%) | $79,677 |
| 65+ Years | 14,851 (29.7%) | $54,219 |
| Total | 49,944 (100.0%) | $69,523 |
Poverty in Linn County
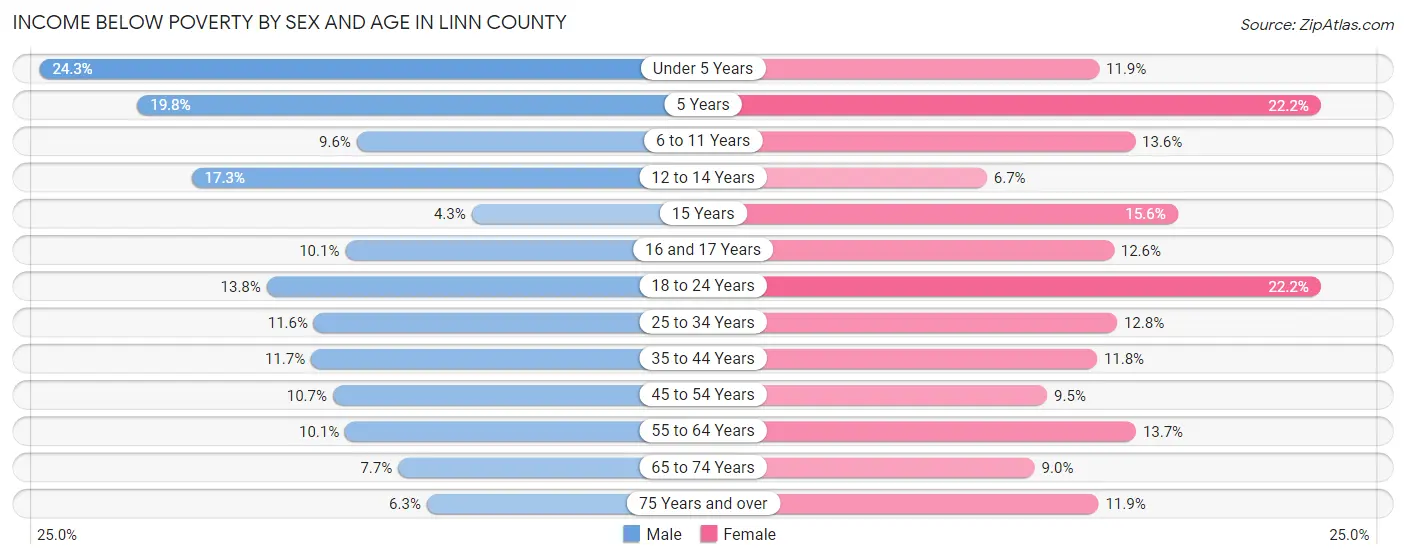
Income Below Poverty by Sex and Age in Linn County
With 11.4% poverty level for males and 12.6% for females among the residents of Linn County, under 5 year old males and 5 year old females are the most vulnerable to poverty, with 836 males (24.3%) and 122 females (22.2%) in their respective age groups living below the poverty level.
| Age Bracket | Male | Female |
| Under 5 Years | 836 (24.3%) | 400 (11.9%) |
| 5 Years | 122 (19.8%) | 122 (22.2%) |
| 6 to 11 Years | 467 (9.6%) | 654 (13.6%) |
| 12 to 14 Years | 384 (17.2%) | 134 (6.7%) |
| 15 Years | 50 (4.3%) | 131 (15.6%) |
| 16 and 17 Years | 157 (10.1%) | 166 (12.6%) |
| 18 to 24 Years | 727 (13.8%) | 1,099 (22.2%) |
| 25 to 34 Years | 1,010 (11.6%) | 1,088 (12.8%) |
| 35 to 44 Years | 932 (11.7%) | 952 (11.8%) |
| 45 to 54 Years | 809 (10.7%) | 702 (9.5%) |
| 55 to 64 Years | 856 (10.1%) | 1,178 (13.7%) |
| 65 to 74 Years | 542 (7.7%) | 683 (8.9%) |
| 75 Years and over | 259 (6.3%) | 614 (11.9%) |
| Total | 7,151 (11.4%) | 7,923 (12.6%) |
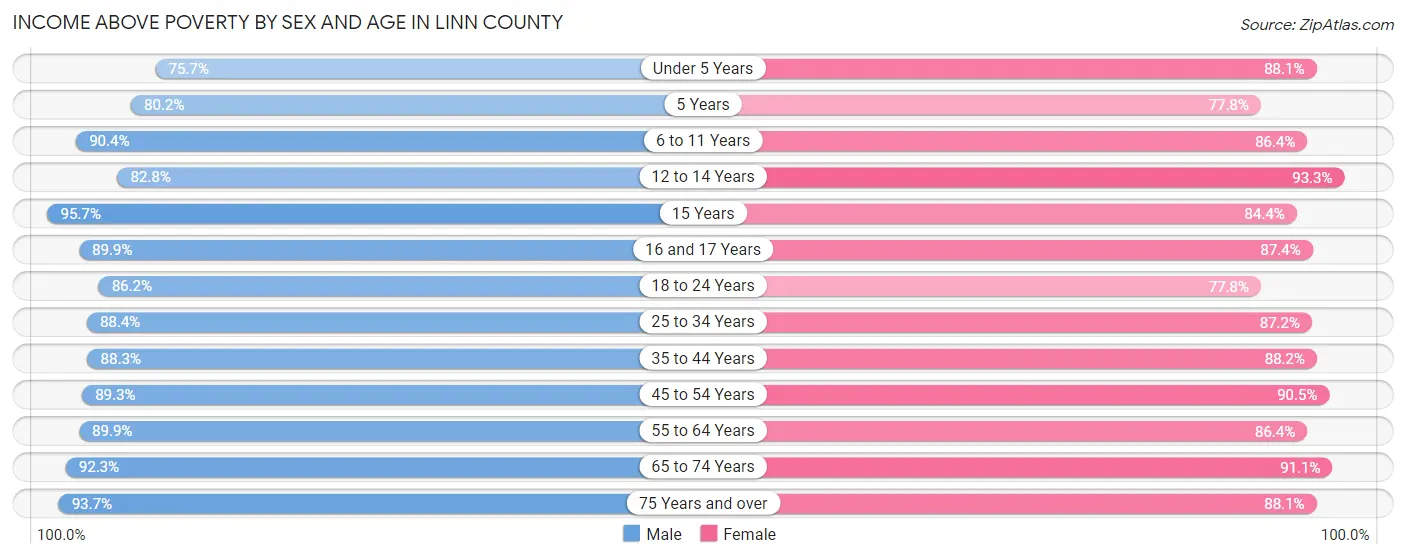
Income Above Poverty by Sex and Age in Linn County
According to the poverty statistics in Linn County, males aged 15 years and females aged 12 to 14 years are the age groups that are most secure financially, with 95.7% of males and 93.3% of females in these age groups living above the poverty line.
| Age Bracket | Male | Female |
| Under 5 Years | 2,603 (75.7%) | 2,949 (88.1%) |
| 5 Years | 495 (80.2%) | 427 (77.8%) |
| 6 to 11 Years | 4,402 (90.4%) | 4,152 (86.4%) |
| 12 to 14 Years | 1,842 (82.8%) | 1,856 (93.3%) |
| 15 Years | 1,124 (95.7%) | 710 (84.4%) |
| 16 and 17 Years | 1,394 (89.9%) | 1,149 (87.4%) |
| 18 to 24 Years | 4,553 (86.2%) | 3,847 (77.8%) |
| 25 to 34 Years | 7,715 (88.4%) | 7,433 (87.2%) |
| 35 to 44 Years | 7,027 (88.3%) | 7,089 (88.2%) |
| 45 to 54 Years | 6,751 (89.3%) | 6,662 (90.5%) |
| 55 to 64 Years | 7,590 (89.9%) | 7,454 (86.4%) |
| 65 to 74 Years | 6,521 (92.3%) | 6,948 (91.0%) |
| 75 Years and over | 3,825 (93.7%) | 4,543 (88.1%) |
| Total | 55,842 (88.6%) | 55,219 (87.5%) |
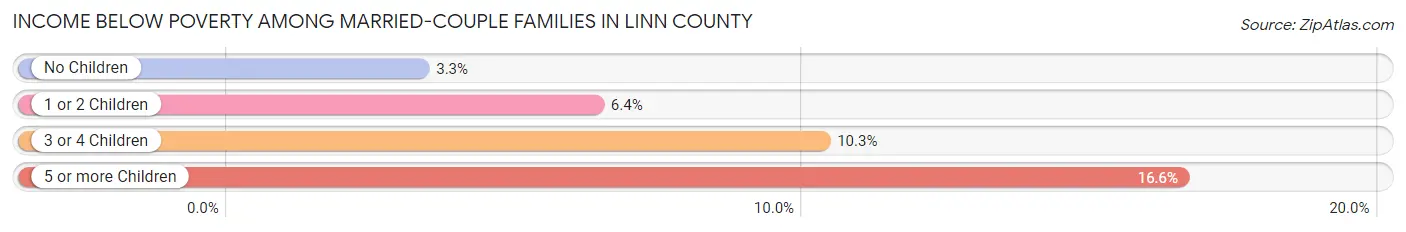
Income Below Poverty Among Married-Couple Families in Linn County
The poverty statistics for married-couple families in Linn County show that 4.9% or 1,252 of the total 25,685 families live below the poverty line. Families with 5 or more children have the highest poverty rate of 16.6%, comprising of 28 families. On the other hand, families with no children have the lowest poverty rate of 3.3%, which includes 536 families.
| Children | Above Poverty | Below Poverty |
| No Children | 15,538 (96.7%) | 536 (3.3%) |
| 1 or 2 Children | 6,779 (93.6%) | 461 (6.4%) |
| 3 or 4 Children | 1,975 (89.7%) | 227 (10.3%) |
| 5 or more Children | 141 (83.4%) | 28 (16.6%) |
| Total | 24,433 (95.1%) | 1,252 (4.9%) |
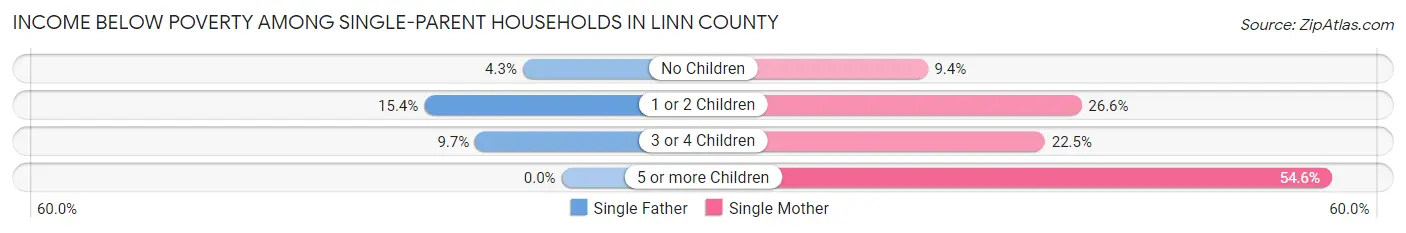
Income Below Poverty Among Single-Parent Households in Linn County
According to the poverty data in Linn County, 8.8% or 263 single-father households and 19.1% or 919 single-mother households are living below the poverty line. Among single-father households, those with 1 or 2 children have the highest poverty rate, with 171 households (15.3%) experiencing poverty. Likewise, among single-mother households, those with 5 or more children have the highest poverty rate, with 12 households (54.5%) falling below the poverty line.
| Children | Single Father | Single Mother |
| No Children | 72 (4.3%) | 189 (9.4%) |
| 1 or 2 Children | 171 (15.3%) | 622 (26.6%) |
| 3 or 4 Children | 20 (9.7%) | 96 (22.5%) |
| 5 or more Children | 0 (0.0%) | 12 (54.5%) |
| Total | 263 (8.8%) | 919 (19.1%) |
Income Below Poverty Among Married-Couple vs Single-Parent Households in Linn County
The poverty data for Linn County shows that 1,252 of the married-couple family households (4.9%) and 1,182 of the single-parent households (15.1%) are living below the poverty level. Within the married-couple family households, those with 5 or more children have the highest poverty rate, with 28 households (16.6%) falling below the poverty line. Among the single-parent households, those with 5 or more children have the highest poverty rate, with 12 household (40.0%) living below poverty.
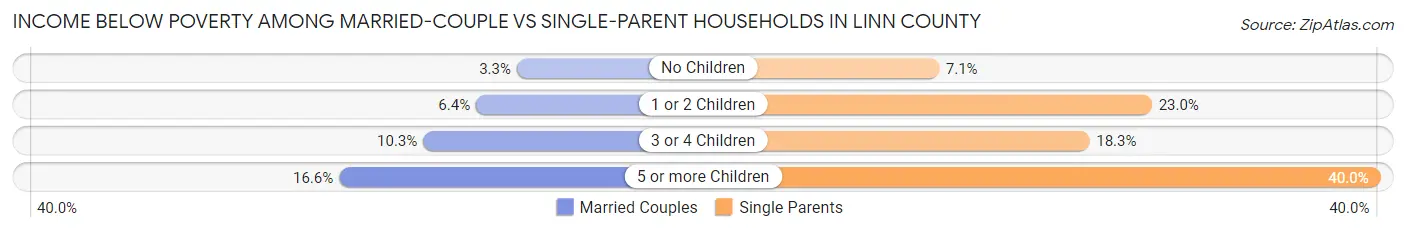
| Children | Married-Couple Families | Single-Parent Households |
| No Children | 536 (3.3%) | 261 (7.1%) |
| 1 or 2 Children | 461 (6.4%) | 793 (23.0%) |
| 3 or 4 Children | 227 (10.3%) | 116 (18.3%) |
| 5 or more Children | 28 (16.6%) | 12 (40.0%) |
| Total | 1,252 (4.9%) | 1,182 (15.1%) |
Employment Characteristics in Linn County
Employment by Class of Employer in Linn County
Among the 56,684 employed individuals in Linn County, private company employees (36,479 | 64.4%), not-for-profit organizations (5,336 | 9.4%), and local government employees (4,587 | 8.1%) make up the most common classes of employment.
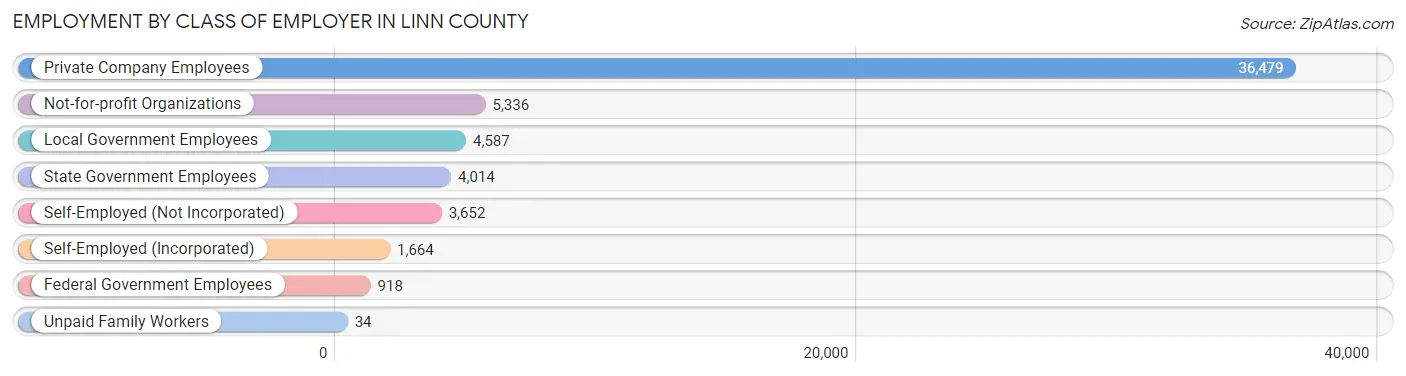
| Employer Class | # Employees | % Employees |
| Private Company Employees | 36,479 | 64.4% |
| Self-Employed (Incorporated) | 1,664 | 2.9% |
| Self-Employed (Not Incorporated) | 3,652 | 6.4% |
| Not-for-profit Organizations | 5,336 | 9.4% |
| Local Government Employees | 4,587 | 8.1% |
| State Government Employees | 4,014 | 7.1% |
| Federal Government Employees | 918 | 1.6% |
| Unpaid Family Workers | 34 | 0.1% |
| Total | 56,684 | 100.0% |
Employment Status by Age in Linn County
According to the labor force statistics for Linn County, out of the total population over 16 years of age (103,066), 59.9% or 61,737 individuals are in the labor force, with 6.2% or 3,828 of them unemployed. The age group with the highest labor force participation rate is 20 to 24 years, with 84.5% or 6,303 individuals in the labor force. Within the labor force, the 16 to 19 years age range has the highest percentage of unemployed individuals, with 18.8% or 480 of them being unemployed.
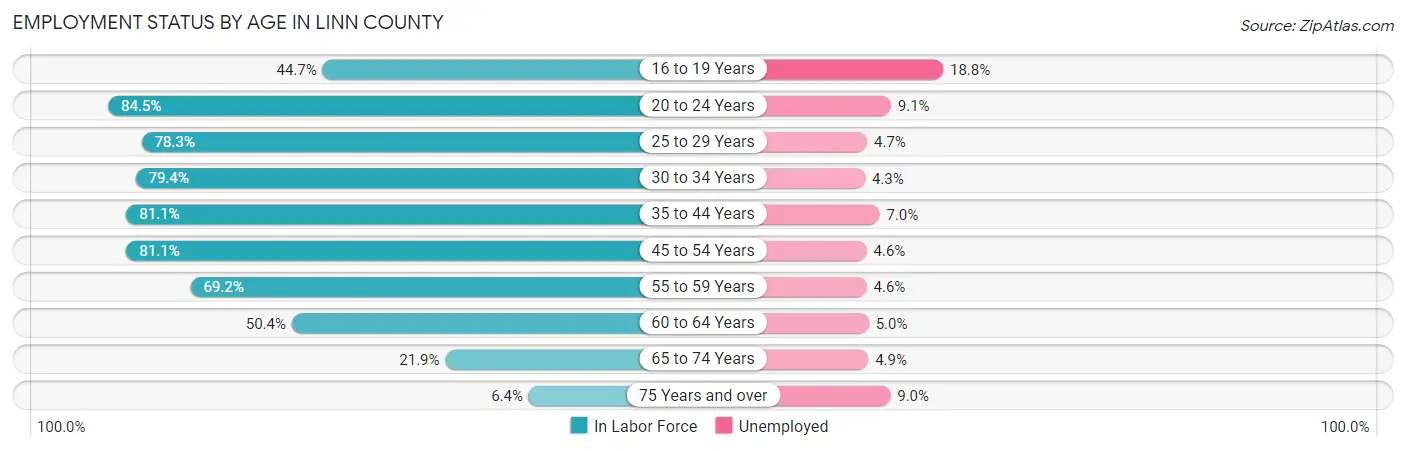
| Age Bracket | In Labor Force | Unemployed |
| 16 to 19 Years | 2,555 (44.7%) | 480 (18.8%) |
| 20 to 24 Years | 6,303 (84.5%) | 574 (9.1%) |
| 25 to 29 Years | 6,805 (78.3%) | 320 (4.7%) |
| 30 to 34 Years | 6,846 (79.4%) | 294 (4.3%) |
| 35 to 44 Years | 13,012 (81.1%) | 911 (7.0%) |
| 45 to 54 Years | 12,135 (81.1%) | 558 (4.6%) |
| 55 to 59 Years | 5,762 (69.2%) | 265 (4.6%) |
| 60 to 64 Years | 4,453 (50.4%) | 223 (5.0%) |
| 65 to 74 Years | 3,237 (21.9%) | 159 (4.9%) |
| 75 Years and over | 616 (6.4%) | 55 (9.0%) |
| Total | 61,737 (59.9%) | 3,828 (6.2%) |
Employment Status by Educational Attainment in Linn County
According to labor force statistics for Linn County, 74.8% of individuals (48,981) out of the total population between 25 and 64 years of age (65,482) are in the labor force, with 5.2% or 2,547 of them being unemployed. The group with the highest labor force participation rate are those with the educational attainment of bachelor's degree or higher, with 83.9% or 11,272 individuals in the labor force. Within the labor force, individuals with less than high school education have the highest percentage of unemployment, with 7.1% or 251 of them being unemployed.
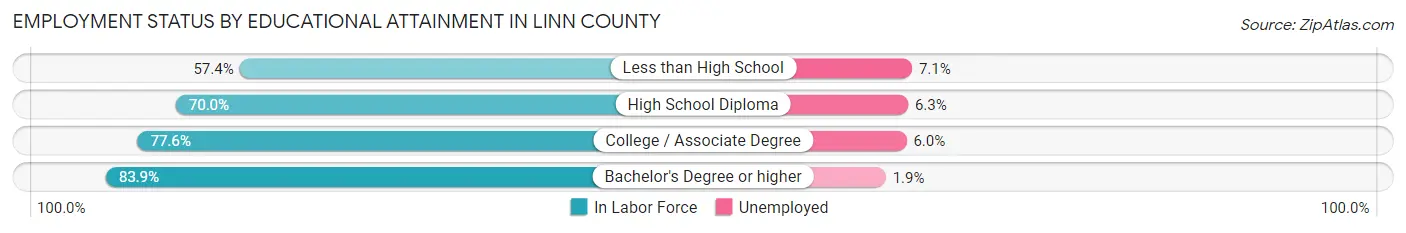
| Educational Attainment | In Labor Force | Unemployed |
| Less than High School | 3,542 (57.4%) | 438 (7.1%) |
| High School Diploma | 13,156 (70.0%) | 1,184 (6.3%) |
| College / Associate Degree | 21,016 (77.6%) | 1,625 (6.0%) |
| Bachelor's Degree or higher | 11,272 (83.9%) | 255 (1.9%) |
| Total | 48,981 (74.8%) | 3,405 (5.2%) |
Employment Occupations by Sex in Linn County
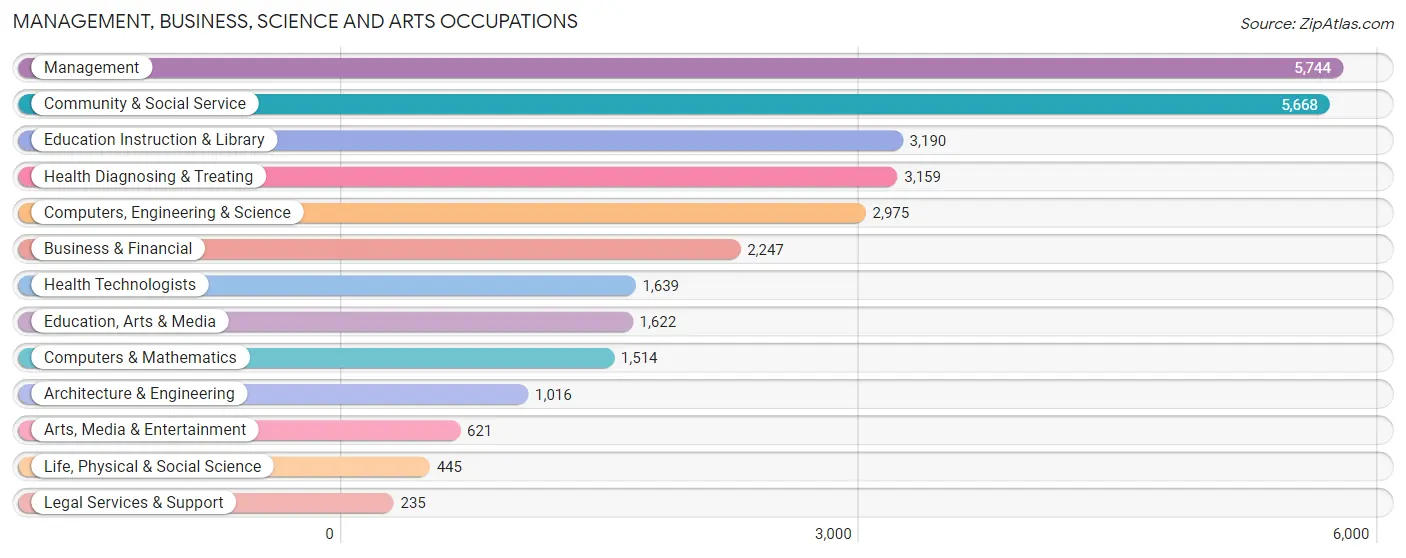
Management, Business, Science and Arts Occupations
The most common Management, Business, Science and Arts occupations in Linn County are Management (5,744 | 9.9%), Community & Social Service (5,668 | 9.8%), Education Instruction & Library (3,190 | 5.5%), Health Diagnosing & Treating (3,159 | 5.5%), and Computers, Engineering & Science (2,975 | 5.1%).
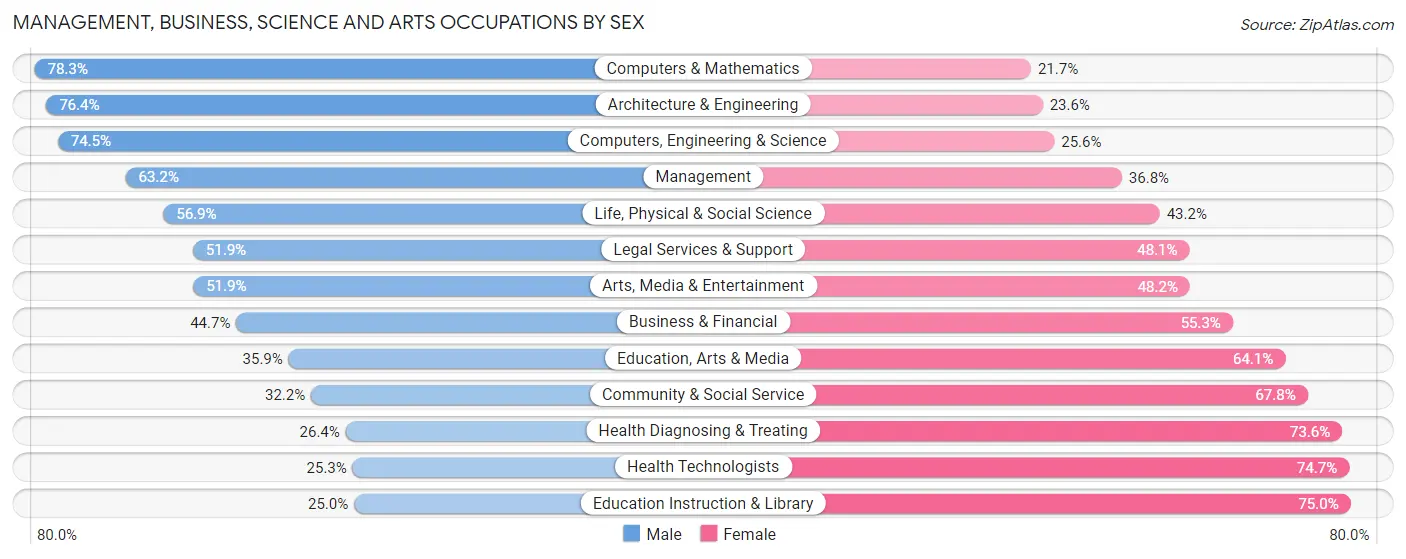
Management, Business, Science and Arts Occupations by Sex
Within the Management, Business, Science and Arts occupations in Linn County, the most male-oriented occupations are Computers & Mathematics (78.3%), Architecture & Engineering (76.4%), and Computers, Engineering & Science (74.5%), while the most female-oriented occupations are Education Instruction & Library (75.0%), Health Technologists (74.7%), and Health Diagnosing & Treating (73.6%).
| Occupation | Male | Female |
| Management | 3,628 (63.2%) | 2,116 (36.8%) |
| Business & Financial | 1,004 (44.7%) | 1,243 (55.3%) |
| Computers, Engineering & Science | 2,215 (74.5%) | 760 (25.6%) |
| Computers & Mathematics | 1,186 (78.3%) | 328 (21.7%) |
| Architecture & Engineering | 776 (76.4%) | 240 (23.6%) |
| Life, Physical & Social Science | 253 (56.9%) | 192 (43.1%) |
| Community & Social Service | 1,825 (32.2%) | 3,843 (67.8%) |
| Education, Arts & Media | 583 (35.9%) | 1,039 (64.1%) |
| Legal Services & Support | 122 (51.9%) | 113 (48.1%) |
| Education Instruction & Library | 798 (25.0%) | 2,392 (75.0%) |
| Arts, Media & Entertainment | 322 (51.8%) | 299 (48.1%) |
| Health Diagnosing & Treating | 835 (26.4%) | 2,324 (73.6%) |
| Health Technologists | 414 (25.3%) | 1,225 (74.7%) |
| Total (Category) | 9,507 (48.0%) | 10,286 (52.0%) |
| Total (Overall) | 31,185 (53.9%) | 26,643 (46.1%) |
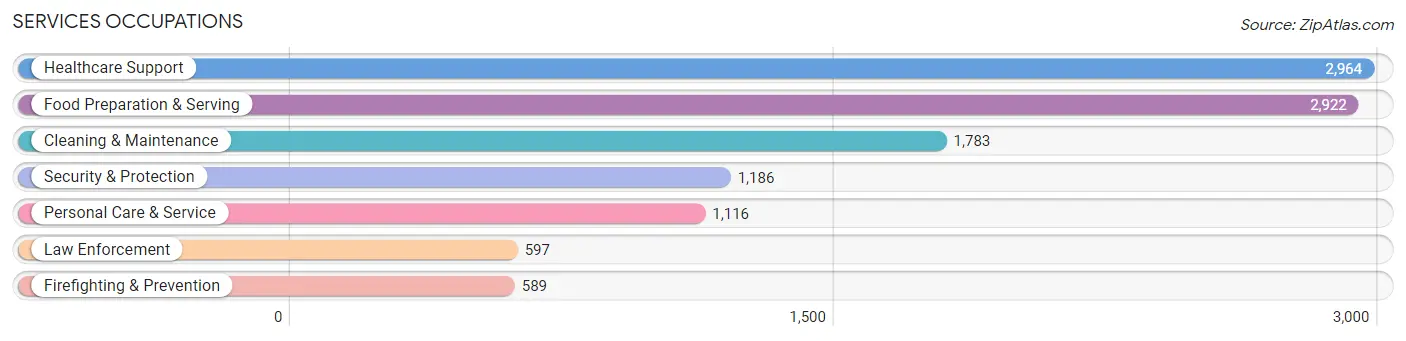
Services Occupations
The most common Services occupations in Linn County are Healthcare Support (2,964 | 5.1%), Food Preparation & Serving (2,922 | 5.1%), Cleaning & Maintenance (1,783 | 3.1%), Security & Protection (1,186 | 2.1%), and Personal Care & Service (1,116 | 1.9%).
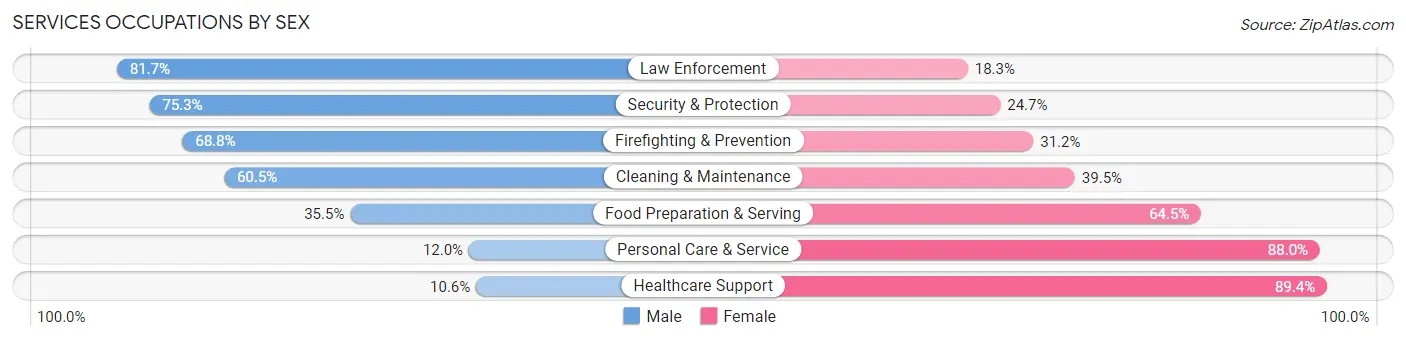
Services Occupations by Sex
Within the Services occupations in Linn County, the most male-oriented occupations are Law Enforcement (81.7%), Security & Protection (75.3%), and Firefighting & Prevention (68.8%), while the most female-oriented occupations are Healthcare Support (89.4%), Personal Care & Service (88.0%), and Food Preparation & Serving (64.5%).
| Occupation | Male | Female |
| Healthcare Support | 314 (10.6%) | 2,650 (89.4%) |
| Security & Protection | 893 (75.3%) | 293 (24.7%) |
| Firefighting & Prevention | 405 (68.8%) | 184 (31.2%) |
| Law Enforcement | 488 (81.7%) | 109 (18.3%) |
| Food Preparation & Serving | 1,038 (35.5%) | 1,884 (64.5%) |
| Cleaning & Maintenance | 1,079 (60.5%) | 704 (39.5%) |
| Personal Care & Service | 134 (12.0%) | 982 (88.0%) |
| Total (Category) | 3,458 (34.7%) | 6,513 (65.3%) |
| Total (Overall) | 31,185 (53.9%) | 26,643 (46.1%) |
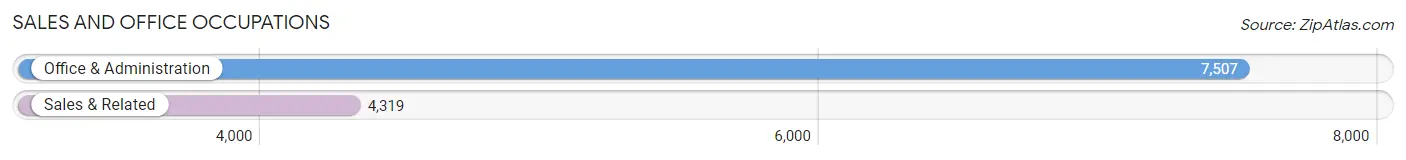
Sales and Office Occupations
The most common Sales and Office occupations in Linn County are Office & Administration (7,507 | 13.0%), and Sales & Related (4,319 | 7.5%).
Sales and Office Occupations by Sex
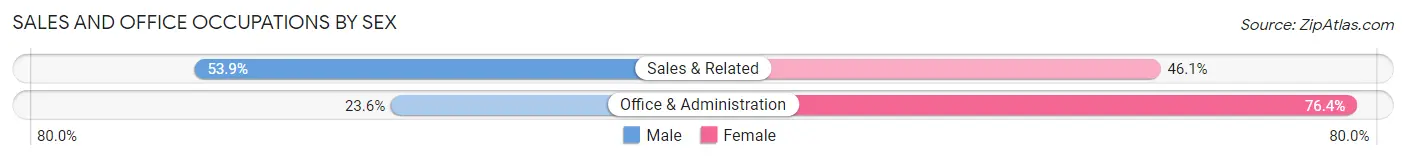
| Occupation | Male | Female |
| Sales & Related | 2,326 (53.9%) | 1,993 (46.1%) |
| Office & Administration | 1,774 (23.6%) | 5,733 (76.4%) |
| Total (Category) | 4,100 (34.7%) | 7,726 (65.3%) |
| Total (Overall) | 31,185 (53.9%) | 26,643 (46.1%) |
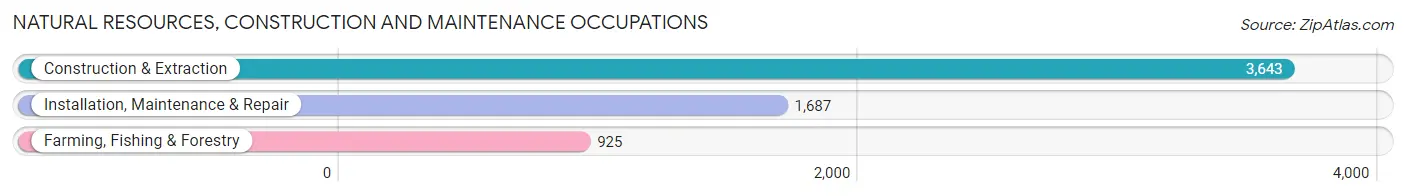
Natural Resources, Construction and Maintenance Occupations
The most common Natural Resources, Construction and Maintenance occupations in Linn County are Construction & Extraction (3,643 | 6.3%), Installation, Maintenance & Repair (1,687 | 2.9%), and Farming, Fishing & Forestry (925 | 1.6%).
Natural Resources, Construction and Maintenance Occupations by Sex
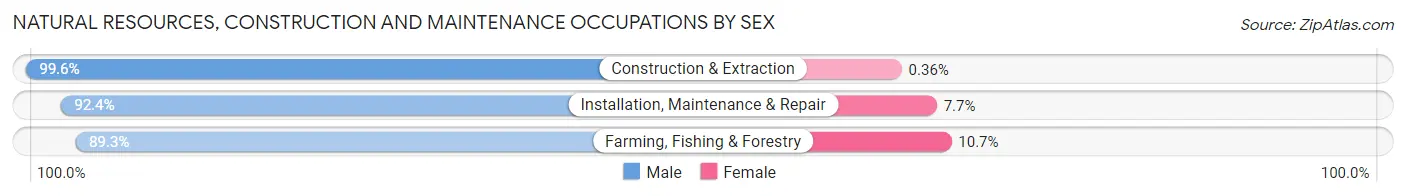
| Occupation | Male | Female |
| Farming, Fishing & Forestry | 826 (89.3%) | 99 (10.7%) |
| Construction & Extraction | 3,630 (99.6%) | 13 (0.4%) |
| Installation, Maintenance & Repair | 1,558 (92.3%) | 129 (7.6%) |
| Total (Category) | 6,014 (96.2%) | 241 (3.8%) |
| Total (Overall) | 31,185 (53.9%) | 26,643 (46.1%) |
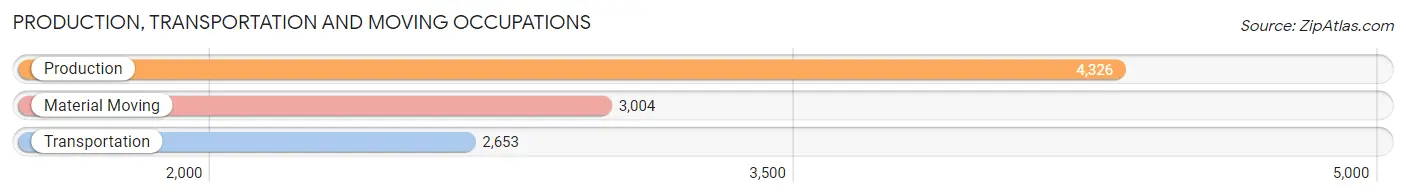
Production, Transportation and Moving Occupations
The most common Production, Transportation and Moving occupations in Linn County are Production (4,326 | 7.5%), Material Moving (3,004 | 5.2%), and Transportation (2,653 | 4.6%).
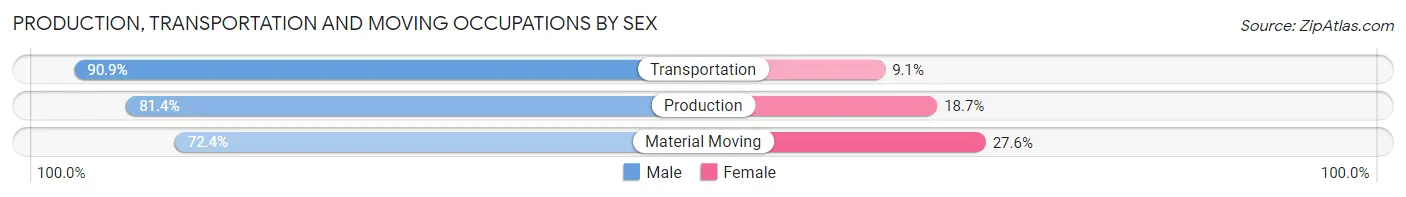
Production, Transportation and Moving Occupations by Sex
| Occupation | Male | Female |
| Production | 3,519 (81.4%) | 807 (18.6%) |
| Transportation | 2,411 (90.9%) | 242 (9.1%) |
| Material Moving | 2,176 (72.4%) | 828 (27.6%) |
| Total (Category) | 8,106 (81.2%) | 1,877 (18.8%) |
| Total (Overall) | 31,185 (53.9%) | 26,643 (46.1%) |
Employment Industries by Sex in Linn County
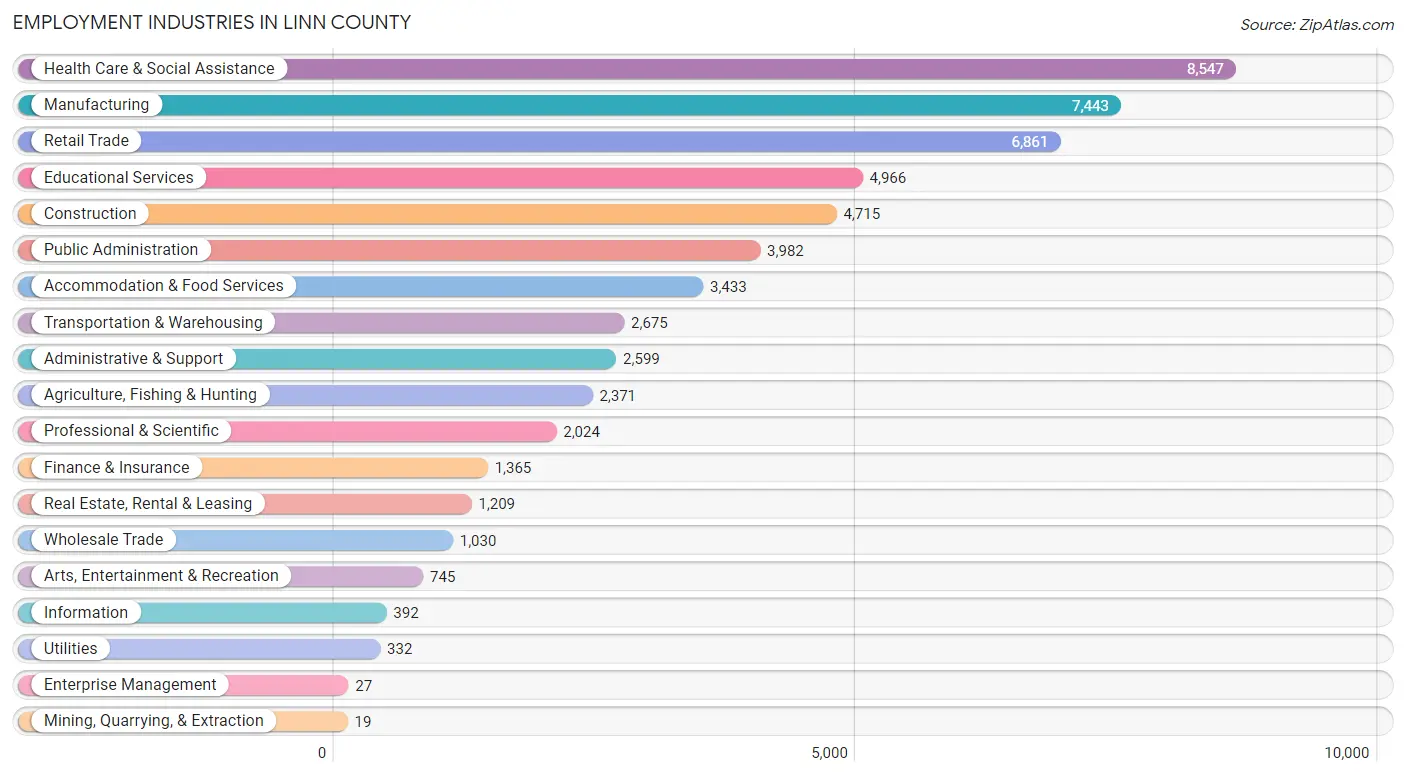
Employment Industries in Linn County
The major employment industries in Linn County include Health Care & Social Assistance (8,547 | 14.8%), Manufacturing (7,443 | 12.9%), Retail Trade (6,861 | 11.9%), Educational Services (4,966 | 8.6%), and Construction (4,715 | 8.2%).
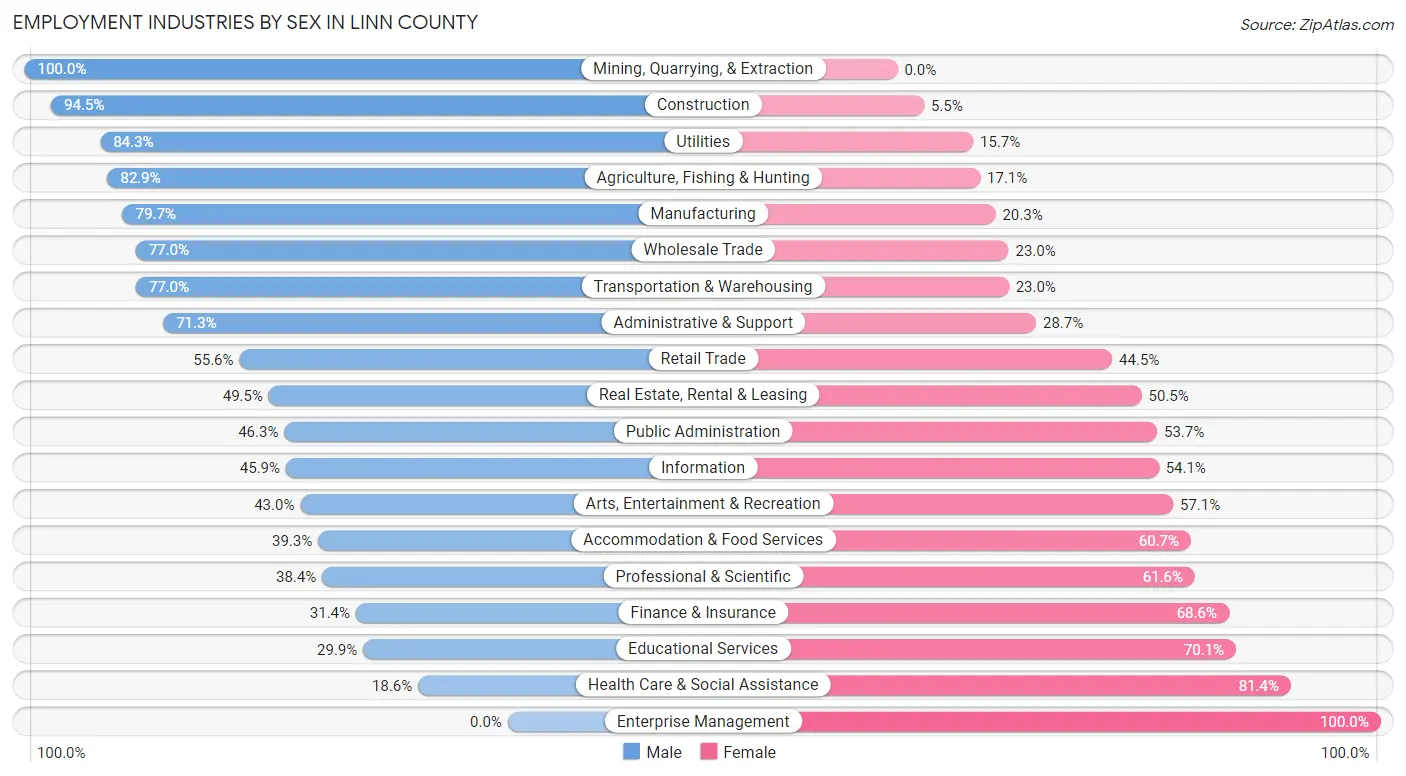
Employment Industries by Sex in Linn County
The Linn County industries that see more men than women are Mining, Quarrying, & Extraction (100.0%), Construction (94.5%), and Utilities (84.3%), whereas the industries that tend to have a higher number of women are Enterprise Management (100.0%), Health Care & Social Assistance (81.4%), and Educational Services (70.1%).
| Industry | Male | Female |
| Agriculture, Fishing & Hunting | 1,965 (82.9%) | 406 (17.1%) |
| Mining, Quarrying, & Extraction | 19 (100.0%) | 0 (0.0%) |
| Construction | 4,456 (94.5%) | 259 (5.5%) |
| Manufacturing | 5,932 (79.7%) | 1,511 (20.3%) |
| Wholesale Trade | 793 (77.0%) | 237 (23.0%) |
| Retail Trade | 3,811 (55.5%) | 3,050 (44.5%) |
| Transportation & Warehousing | 2,059 (77.0%) | 616 (23.0%) |
| Utilities | 280 (84.3%) | 52 (15.7%) |
| Information | 180 (45.9%) | 212 (54.1%) |
| Finance & Insurance | 429 (31.4%) | 936 (68.6%) |
| Real Estate, Rental & Leasing | 598 (49.5%) | 611 (50.5%) |
| Professional & Scientific | 778 (38.4%) | 1,246 (61.6%) |
| Enterprise Management | 0 (0.0%) | 27 (100.0%) |
| Administrative & Support | 1,853 (71.3%) | 746 (28.7%) |
| Educational Services | 1,487 (29.9%) | 3,479 (70.1%) |
| Health Care & Social Assistance | 1,588 (18.6%) | 6,959 (81.4%) |
| Arts, Entertainment & Recreation | 320 (42.9%) | 425 (57.1%) |
| Accommodation & Food Services | 1,348 (39.3%) | 2,085 (60.7%) |
| Public Administration | 1,842 (46.3%) | 2,140 (53.7%) |
| Total | 31,185 (53.9%) | 26,643 (46.1%) |
Education in Linn County
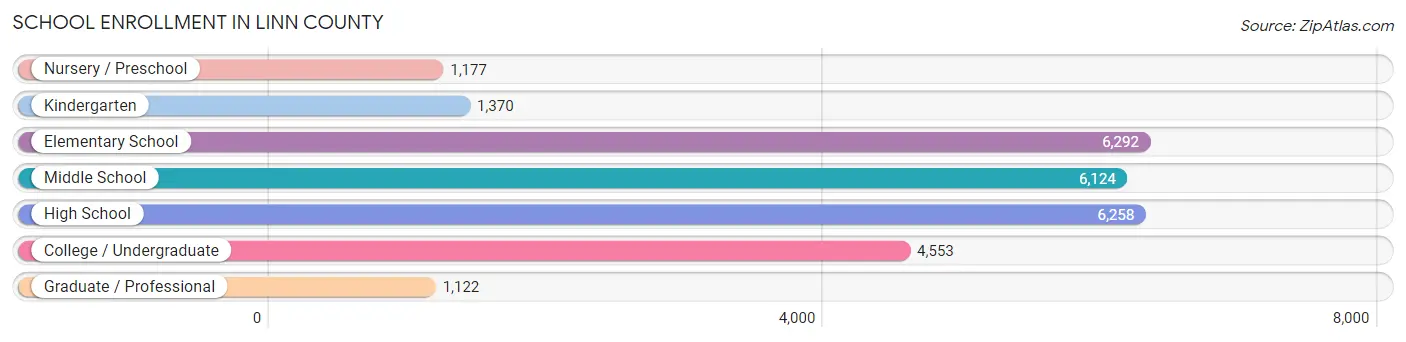
School Enrollment in Linn County
The most common levels of schooling among the 26,896 students in Linn County are elementary school (6,292 | 23.4%), high school (6,258 | 23.3%), and middle school (6,124 | 22.8%).
| School Level | # Students | % Students |
| Nursery / Preschool | 1,177 | 4.4% |
| Kindergarten | 1,370 | 5.1% |
| Elementary School | 6,292 | 23.4% |
| Middle School | 6,124 | 22.8% |
| High School | 6,258 | 23.3% |
| College / Undergraduate | 4,553 | 16.9% |
| Graduate / Professional | 1,122 | 4.2% |
| Total | 26,896 | 100.0% |
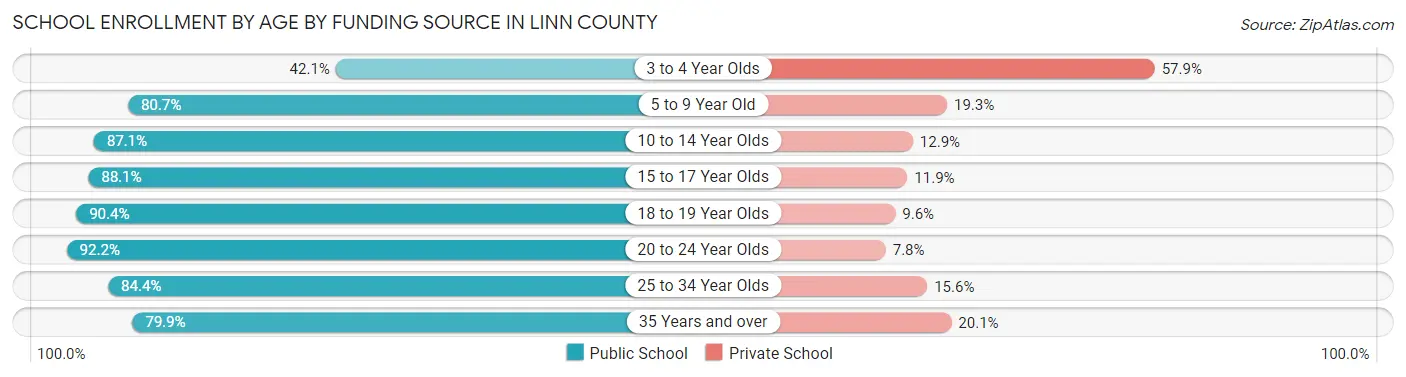
School Enrollment by Age by Funding Source in Linn County
Out of a total of 26,896 students who are enrolled in schools in Linn County, 4,250 (15.8%) attend a private institution, while the remaining 22,646 (84.2%) are enrolled in public schools. The age group of 3 to 4 year olds has the highest likelihood of being enrolled in private schools, with 511 (57.9% in the age bracket) enrolled. Conversely, the age group of 20 to 24 year olds has the lowest likelihood of being enrolled in a private school, with 1,752 (92.2% in the age bracket) attending a public institution.
| Age Bracket | Public School | Private School |
| 3 to 4 Year Olds | 371 (42.1%) | 511 (57.9%) |
| 5 to 9 Year Old | 5,495 (80.7%) | 1,311 (19.3%) |
| 10 to 14 Year Olds | 6,680 (87.1%) | 989 (12.9%) |
| 15 to 17 Year Olds | 4,121 (88.1%) | 555 (11.9%) |
| 18 to 19 Year Olds | 1,654 (90.4%) | 176 (9.6%) |
| 20 to 24 Year Olds | 1,752 (92.2%) | 149 (7.8%) |
| 25 to 34 Year Olds | 1,513 (84.4%) | 279 (15.6%) |
| 35 Years and over | 1,071 (79.9%) | 269 (20.1%) |
| Total | 22,646 (84.2%) | 4,250 (15.8%) |
Educational Attainment by Field of Study in Linn County
Education (2,759 | 13.8%), business (2,607 | 13.0%), science & technology (2,311 | 11.5%), bio, nature & agricultural (1,867 | 9.3%), and social sciences (1,643 | 8.2%) are the most common fields of study among 20,031 individuals in Linn County who have obtained a bachelor's degree or higher.
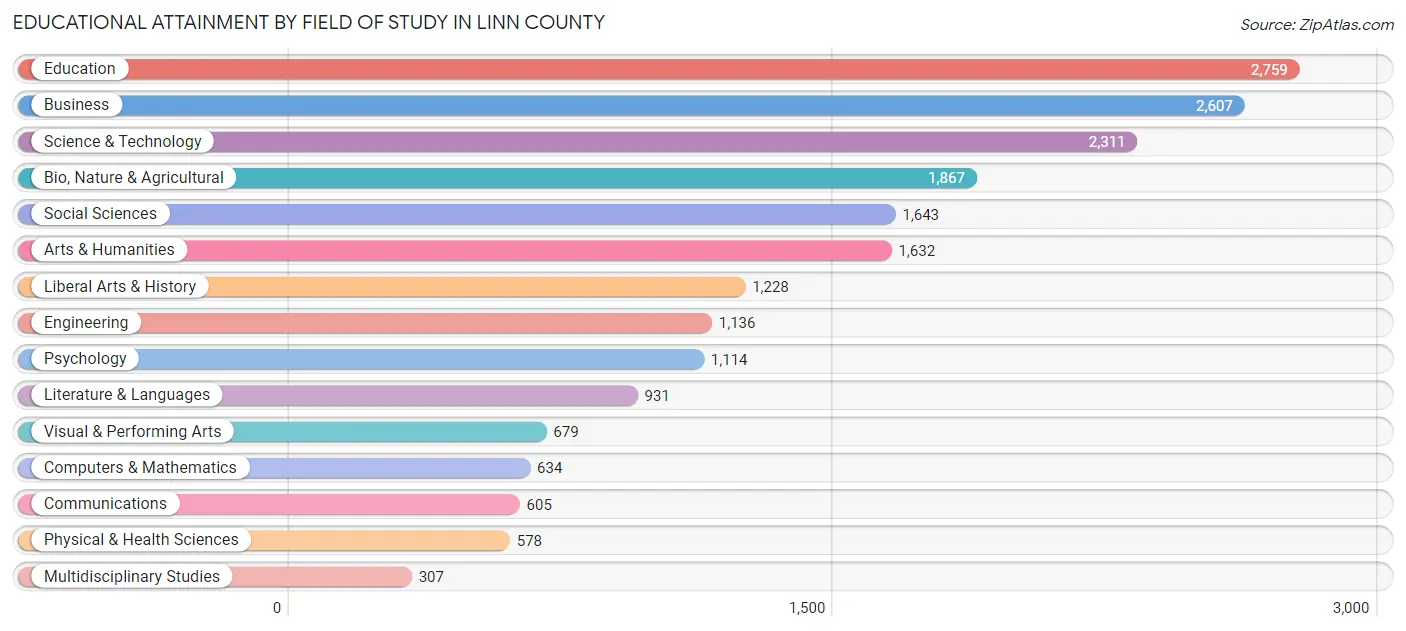
| Field of Study | # Graduates | % Graduates |
| Computers & Mathematics | 634 | 3.2% |
| Bio, Nature & Agricultural | 1,867 | 9.3% |
| Physical & Health Sciences | 578 | 2.9% |
| Psychology | 1,114 | 5.6% |
| Social Sciences | 1,643 | 8.2% |
| Engineering | 1,136 | 5.7% |
| Multidisciplinary Studies | 307 | 1.5% |
| Science & Technology | 2,311 | 11.5% |
| Business | 2,607 | 13.0% |
| Education | 2,759 | 13.8% |
| Literature & Languages | 931 | 4.6% |
| Liberal Arts & History | 1,228 | 6.1% |
| Visual & Performing Arts | 679 | 3.4% |
| Communications | 605 | 3.0% |
| Arts & Humanities | 1,632 | 8.2% |
| Total | 20,031 | 100.0% |
Transportation & Commute in Linn County
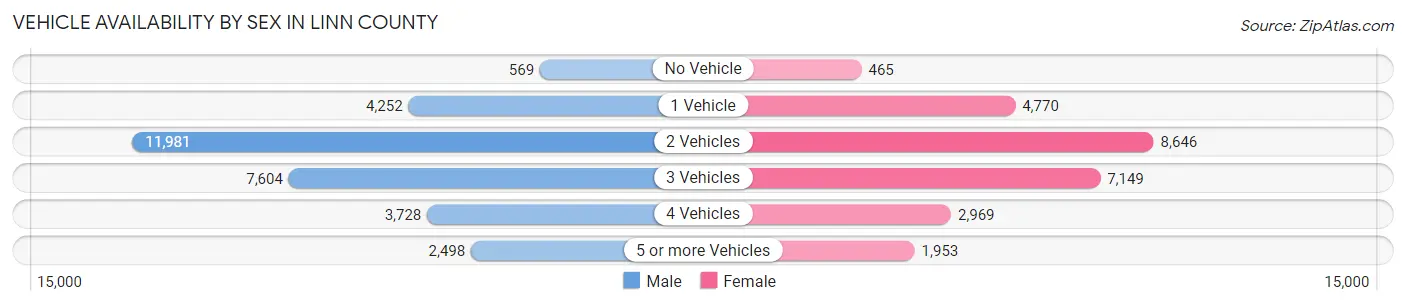
Vehicle Availability by Sex in Linn County
The most prevalent vehicle ownership categories in Linn County are males with 2 vehicles (11,981, accounting for 39.1%) and females with 2 vehicles (8,646, making up 46.2%).
| Vehicles Available | Male | Female |
| No Vehicle | 569 (1.9%) | 465 (1.8%) |
| 1 Vehicle | 4,252 (13.9%) | 4,770 (18.4%) |
| 2 Vehicles | 11,981 (39.1%) | 8,646 (33.3%) |
| 3 Vehicles | 7,604 (24.8%) | 7,149 (27.6%) |
| 4 Vehicles | 3,728 (12.2%) | 2,969 (11.4%) |
| 5 or more Vehicles | 2,498 (8.2%) | 1,953 (7.5%) |
| Total | 30,632 (100.0%) | 25,952 (100.0%) |
Commute Time in Linn County
The most frequently occuring commute durations in Linn County are 10 to 14 minutes (7,594 commuters, 14.7%), 5 to 9 minutes (7,260 commuters, 14.1%), and 30 to 34 minutes (6,804 commuters, 13.2%).
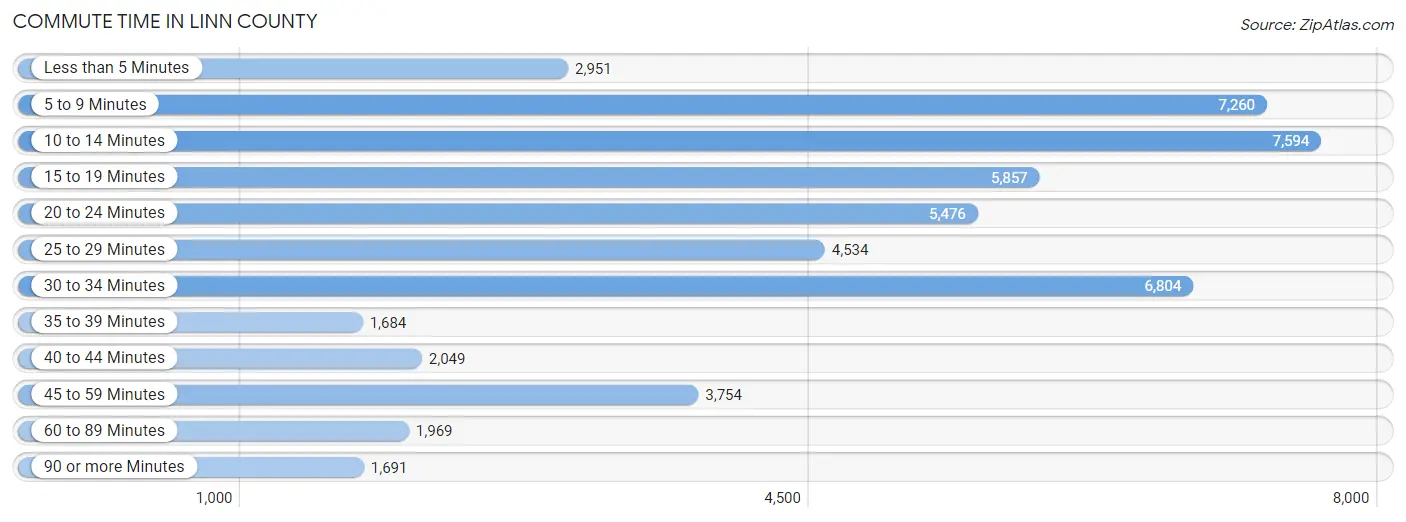
| Commute Time | # Commuters | % Commuters |
| Less than 5 Minutes | 2,951 | 5.7% |
| 5 to 9 Minutes | 7,260 | 14.1% |
| 10 to 14 Minutes | 7,594 | 14.7% |
| 15 to 19 Minutes | 5,857 | 11.4% |
| 20 to 24 Minutes | 5,476 | 10.6% |
| 25 to 29 Minutes | 4,534 | 8.8% |
| 30 to 34 Minutes | 6,804 | 13.2% |
| 35 to 39 Minutes | 1,684 | 3.3% |
| 40 to 44 Minutes | 2,049 | 4.0% |
| 45 to 59 Minutes | 3,754 | 7.3% |
| 60 to 89 Minutes | 1,969 | 3.8% |
| 90 or more Minutes | 1,691 | 3.3% |
Commute Time by Sex in Linn County
The most common commute times in Linn County are 30 to 34 minutes (3,955 commuters, 14.0%) for males and 10 to 14 minutes (3,953 commuters, 17.0%) for females.
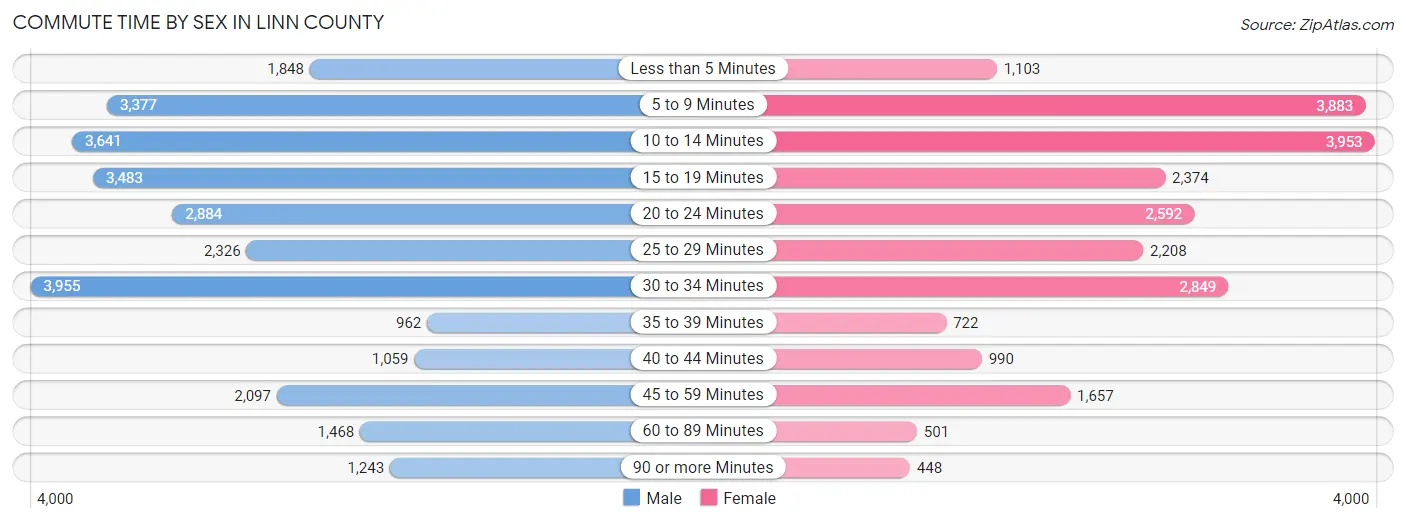
| Commute Time | Male | Female |
| Less than 5 Minutes | 1,848 (6.5%) | 1,103 (4.7%) |
| 5 to 9 Minutes | 3,377 (11.9%) | 3,883 (16.7%) |
| 10 to 14 Minutes | 3,641 (12.9%) | 3,953 (17.0%) |
| 15 to 19 Minutes | 3,483 (12.3%) | 2,374 (10.2%) |
| 20 to 24 Minutes | 2,884 (10.2%) | 2,592 (11.1%) |
| 25 to 29 Minutes | 2,326 (8.2%) | 2,208 (9.5%) |
| 30 to 34 Minutes | 3,955 (14.0%) | 2,849 (12.2%) |
| 35 to 39 Minutes | 962 (3.4%) | 722 (3.1%) |
| 40 to 44 Minutes | 1,059 (3.7%) | 990 (4.3%) |
| 45 to 59 Minutes | 2,097 (7.4%) | 1,657 (7.1%) |
| 60 to 89 Minutes | 1,468 (5.2%) | 501 (2.1%) |
| 90 or more Minutes | 1,243 (4.4%) | 448 (1.9%) |
Time of Departure to Work by Sex in Linn County
The most frequent times of departure to work in Linn County are 7:00 AM to 7:29 AM (3,827, 13.5%) for males and 7:30 AM to 7:59 AM (3,361, 14.4%) for females.
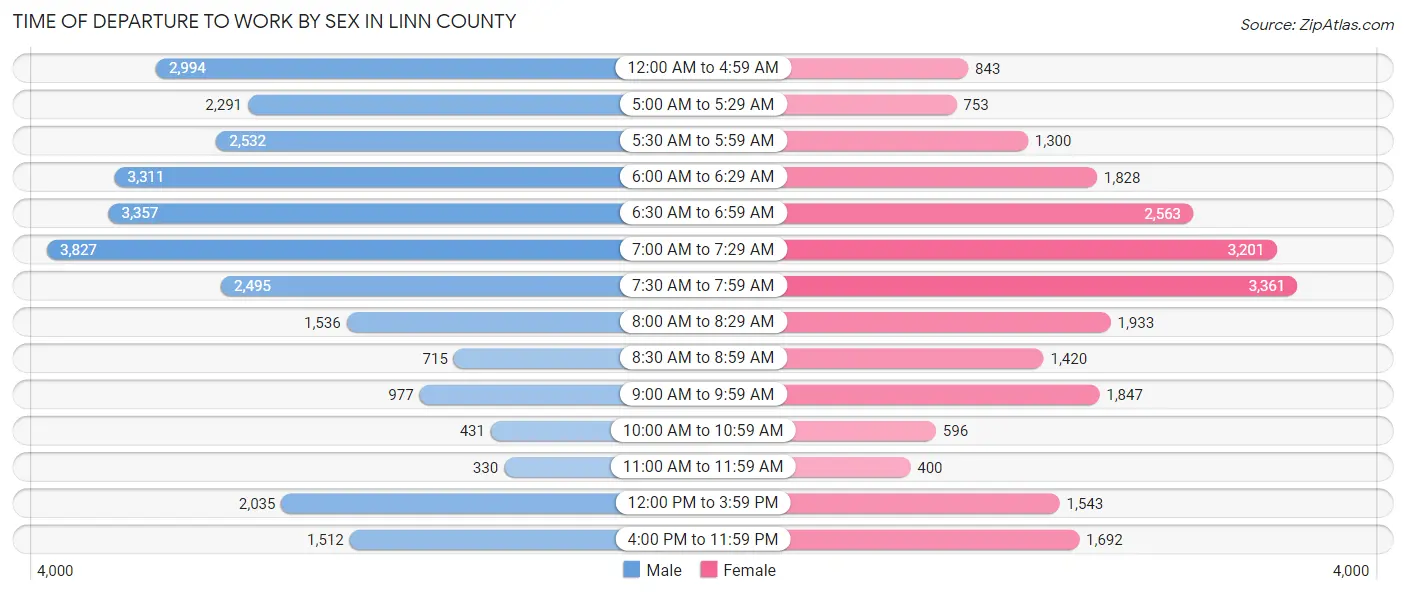
| Time of Departure | Male | Female |
| 12:00 AM to 4:59 AM | 2,994 (10.6%) | 843 (3.6%) |
| 5:00 AM to 5:29 AM | 2,291 (8.1%) | 753 (3.2%) |
| 5:30 AM to 5:59 AM | 2,532 (8.9%) | 1,300 (5.6%) |
| 6:00 AM to 6:29 AM | 3,311 (11.7%) | 1,828 (7.9%) |
| 6:30 AM to 6:59 AM | 3,357 (11.8%) | 2,563 (11.0%) |
| 7:00 AM to 7:29 AM | 3,827 (13.5%) | 3,201 (13.8%) |
| 7:30 AM to 7:59 AM | 2,495 (8.8%) | 3,361 (14.4%) |
| 8:00 AM to 8:29 AM | 1,536 (5.4%) | 1,933 (8.3%) |
| 8:30 AM to 8:59 AM | 715 (2.5%) | 1,420 (6.1%) |
| 9:00 AM to 9:59 AM | 977 (3.5%) | 1,847 (7.9%) |
| 10:00 AM to 10:59 AM | 431 (1.5%) | 596 (2.6%) |
| 11:00 AM to 11:59 AM | 330 (1.2%) | 400 (1.7%) |
| 12:00 PM to 3:59 PM | 2,035 (7.2%) | 1,543 (6.6%) |
| 4:00 PM to 11:59 PM | 1,512 (5.3%) | 1,692 (7.3%) |
| Total | 28,343 (100.0%) | 23,280 (100.0%) |
Housing Occupancy in Linn County
Occupancy by Ownership in Linn County
Of the total 49,944 dwellings in Linn County, owner-occupied units account for 33,445 (67.0%), while renter-occupied units make up 16,499 (33.0%).
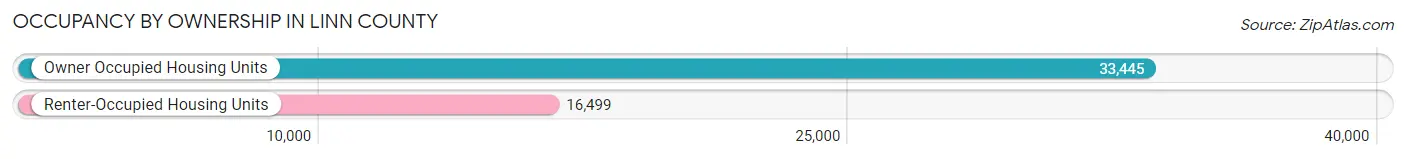
| Occupancy | # Housing Units | % Housing Units |
| Owner Occupied Housing Units | 33,445 | 67.0% |
| Renter-Occupied Housing Units | 16,499 | 33.0% |
| Total Occupied Housing Units | 49,944 | 100.0% |
Occupancy by Household Size in Linn County
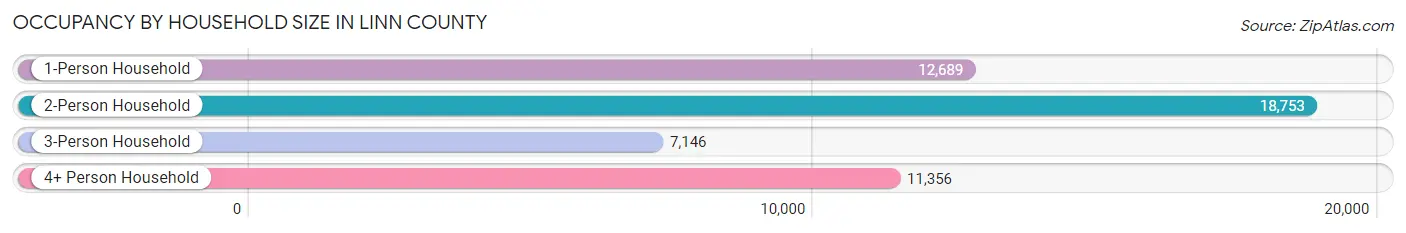
| Household Size | # Housing Units | % Housing Units |
| 1-Person Household | 12,689 | 25.4% |
| 2-Person Household | 18,753 | 37.6% |
| 3-Person Household | 7,146 | 14.3% |
| 4+ Person Household | 11,356 | 22.7% |
| Total Housing Units | 49,944 | 100.0% |
Occupancy by Ownership by Household Size in Linn County
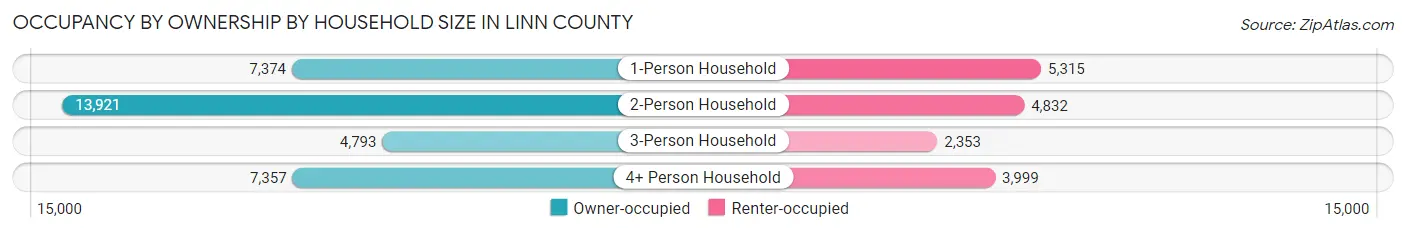
| Household Size | Owner-occupied | Renter-occupied |
| 1-Person Household | 7,374 (58.1%) | 5,315 (41.9%) |
| 2-Person Household | 13,921 (74.2%) | 4,832 (25.8%) |
| 3-Person Household | 4,793 (67.1%) | 2,353 (32.9%) |
| 4+ Person Household | 7,357 (64.8%) | 3,999 (35.2%) |
| Total Housing Units | 33,445 (67.0%) | 16,499 (33.0%) |
Occupancy by Educational Attainment in Linn County
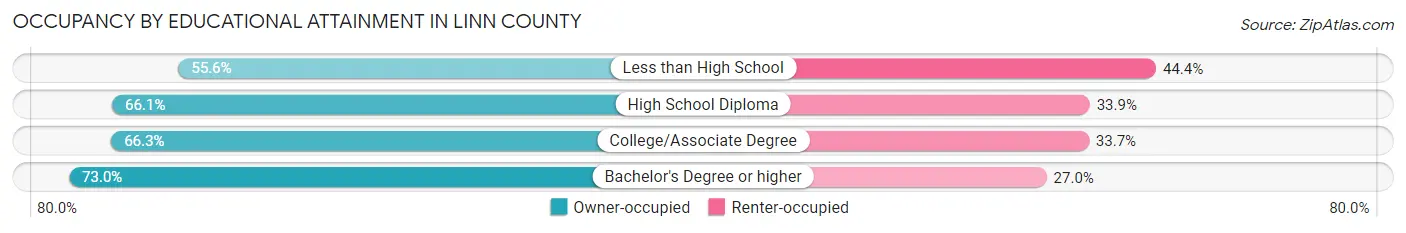
| Household Size | Owner-occupied | Renter-occupied |
| Less than High School | 2,131 (55.6%) | 1,701 (44.4%) |
| High School Diploma | 8,490 (66.1%) | 4,348 (33.9%) |
| College/Associate Degree | 14,357 (66.3%) | 7,312 (33.7%) |
| Bachelor's Degree or higher | 8,467 (73.0%) | 3,138 (27.0%) |
Occupancy by Age of Householder in Linn County
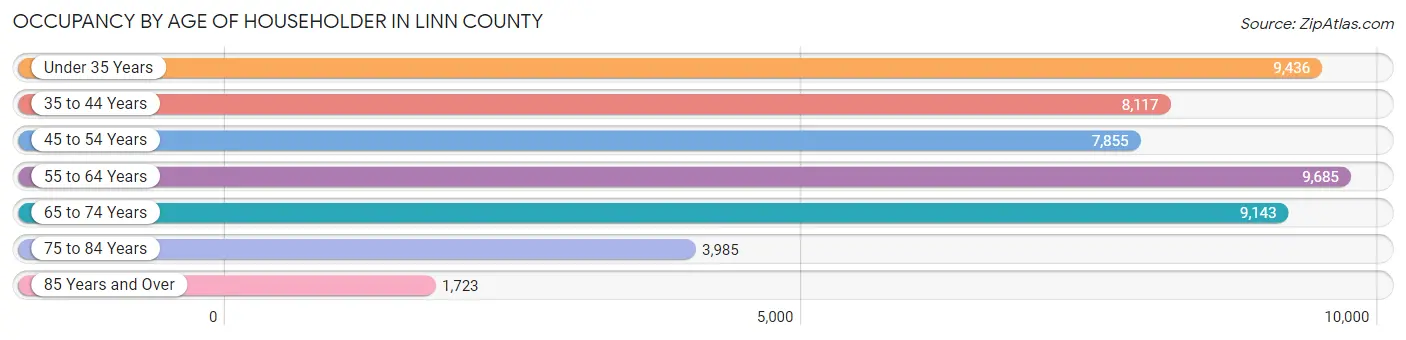
| Age Bracket | # Households | % Households |
| Under 35 Years | 9,436 | 18.9% |
| 35 to 44 Years | 8,117 | 16.3% |
| 45 to 54 Years | 7,855 | 15.7% |
| 55 to 64 Years | 9,685 | 19.4% |
| 65 to 74 Years | 9,143 | 18.3% |
| 75 to 84 Years | 3,985 | 8.0% |
| 85 Years and Over | 1,723 | 3.5% |
| Total | 49,944 | 100.0% |
Housing Finances in Linn County
Median Income by Occupancy in Linn County
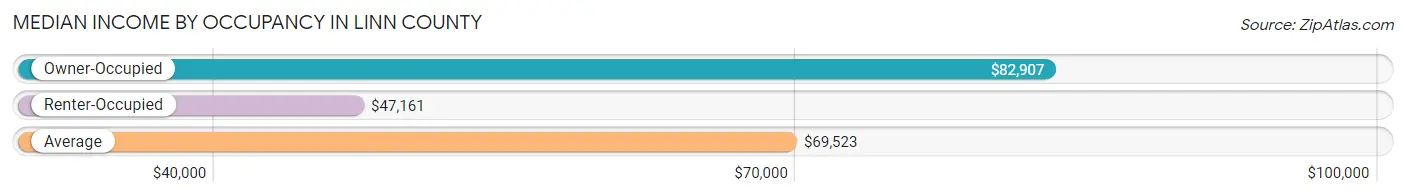
| Occupancy Type | # Households | Median Income |
| Owner-Occupied | 33,445 (67.0%) | $82,907 |
| Renter-Occupied | 16,499 (33.0%) | $47,161 |
| Average | 49,944 (100.0%) | $69,523 |
Occupancy by Householder Income Bracket in Linn County
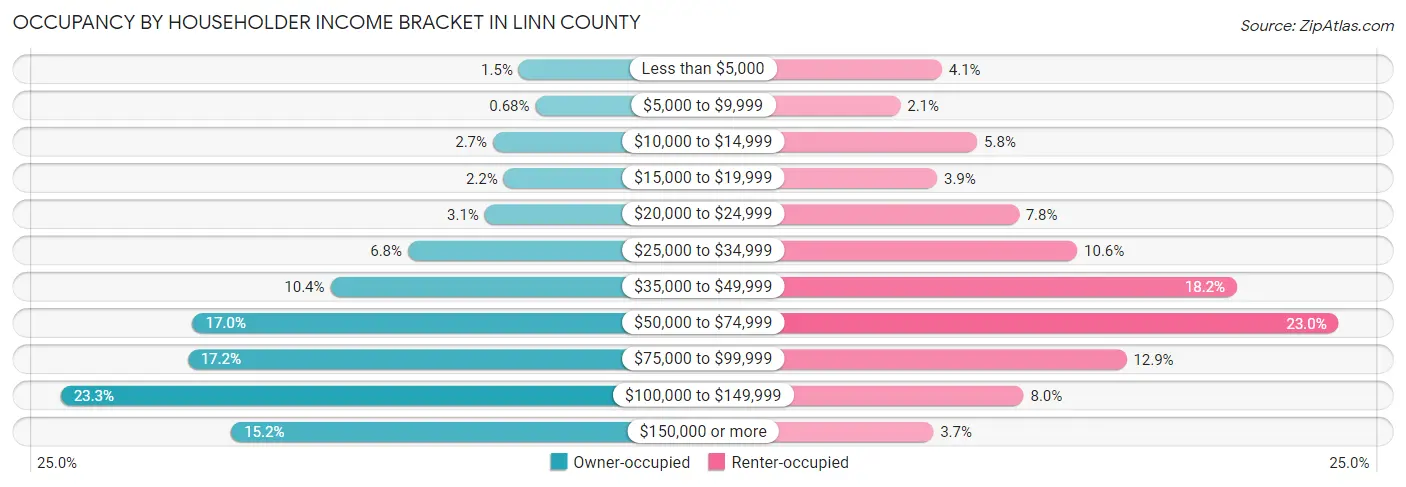
| Income Bracket | Owner-occupied | Renter-occupied |
| Less than $5,000 | 492 (1.5%) | 678 (4.1%) |
| $5,000 to $9,999 | 229 (0.7%) | 351 (2.1%) |
| $10,000 to $14,999 | 903 (2.7%) | 955 (5.8%) |
| $15,000 to $19,999 | 733 (2.2%) | 640 (3.9%) |
| $20,000 to $24,999 | 1,035 (3.1%) | 1,282 (7.8%) |
| $25,000 to $34,999 | 2,258 (6.8%) | 1,741 (10.5%) |
| $35,000 to $49,999 | 3,490 (10.4%) | 2,997 (18.2%) |
| $50,000 to $74,999 | 5,685 (17.0%) | 3,795 (23.0%) |
| $75,000 to $99,999 | 5,763 (17.2%) | 2,129 (12.9%) |
| $100,000 to $149,999 | 7,787 (23.3%) | 1,320 (8.0%) |
| $150,000 or more | 5,070 (15.2%) | 611 (3.7%) |
| Total | 33,445 (100.0%) | 16,499 (100.0%) |
Monthly Housing Cost Tiers in Linn County
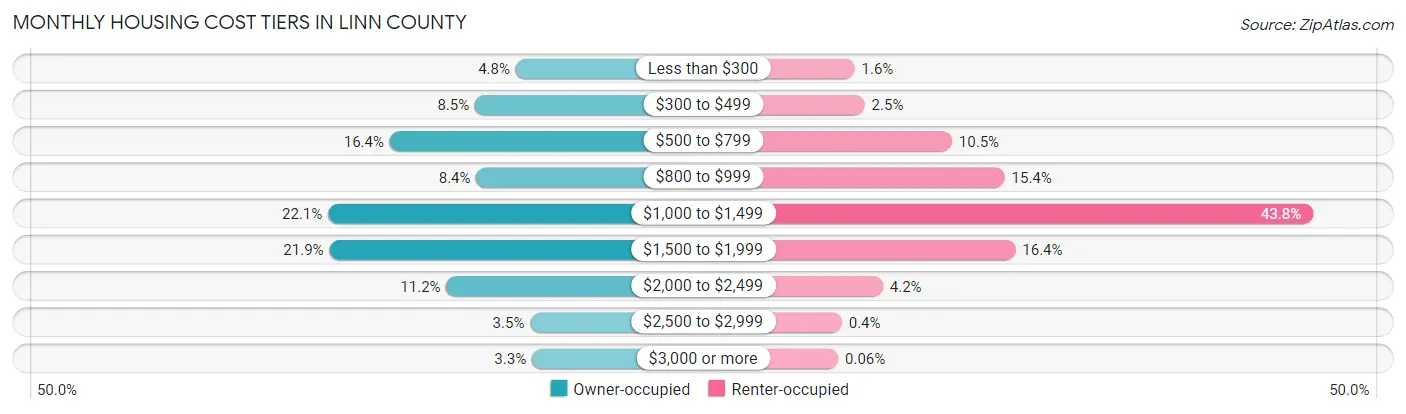
| Monthly Cost | Owner-occupied | Renter-occupied |
| Less than $300 | 1,597 (4.8%) | 261 (1.6%) |
| $300 to $499 | 2,853 (8.5%) | 414 (2.5%) |
| $500 to $799 | 5,477 (16.4%) | 1,739 (10.5%) |
| $800 to $999 | 2,812 (8.4%) | 2,539 (15.4%) |
| $1,000 to $1,499 | 7,378 (22.1%) | 7,224 (43.8%) |
| $1,500 to $1,999 | 7,337 (21.9%) | 2,702 (16.4%) |
| $2,000 to $2,499 | 3,737 (11.2%) | 690 (4.2%) |
| $2,500 to $2,999 | 1,153 (3.5%) | 66 (0.4%) |
| $3,000 or more | 1,101 (3.3%) | 10 (0.1%) |
| Total | 33,445 (100.0%) | 16,499 (100.0%) |
Physical Housing Characteristics in Linn County
Housing Structures in Linn County
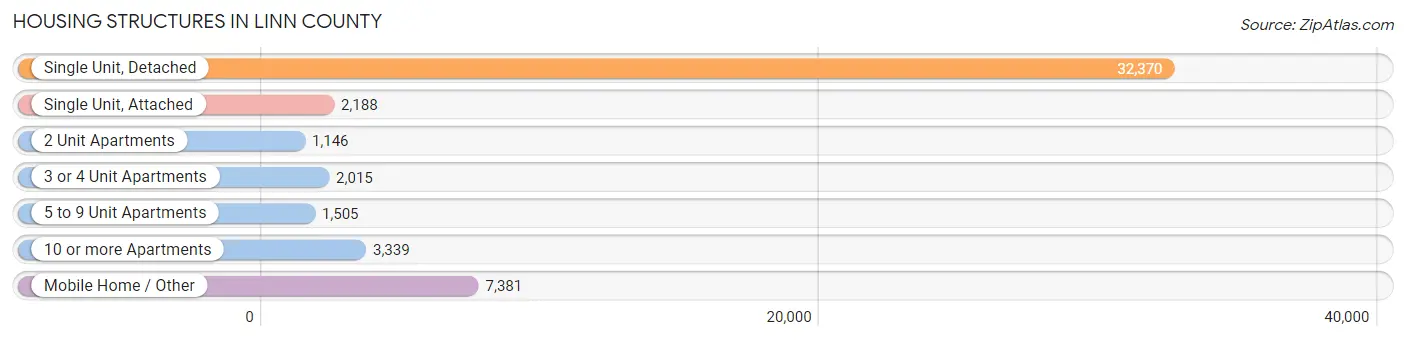
| Structure Type | # Housing Units | % Housing Units |
| Single Unit, Detached | 32,370 | 64.8% |
| Single Unit, Attached | 2,188 | 4.4% |
| 2 Unit Apartments | 1,146 | 2.3% |
| 3 or 4 Unit Apartments | 2,015 | 4.0% |
| 5 to 9 Unit Apartments | 1,505 | 3.0% |
| 10 or more Apartments | 3,339 | 6.7% |
| Mobile Home / Other | 7,381 | 14.8% |
| Total | 49,944 | 100.0% |
Housing Structures by Occupancy in Linn County
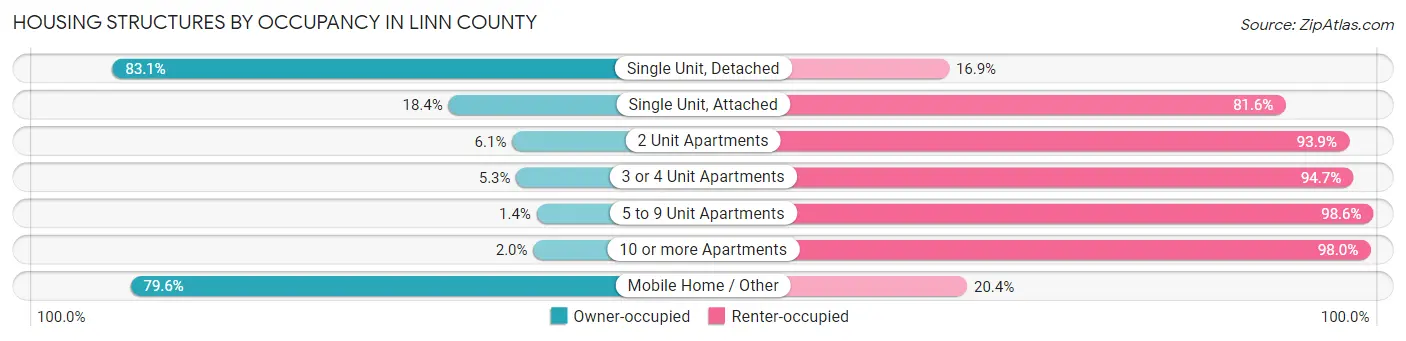
| Structure Type | Owner-occupied | Renter-occupied |
| Single Unit, Detached | 26,900 (83.1%) | 5,470 (16.9%) |
| Single Unit, Attached | 402 (18.4%) | 1,786 (81.6%) |
| 2 Unit Apartments | 70 (6.1%) | 1,076 (93.9%) |
| 3 or 4 Unit Apartments | 107 (5.3%) | 1,908 (94.7%) |
| 5 to 9 Unit Apartments | 21 (1.4%) | 1,484 (98.6%) |
| 10 or more Apartments | 68 (2.0%) | 3,271 (98.0%) |
| Mobile Home / Other | 5,877 (79.6%) | 1,504 (20.4%) |
| Total | 33,445 (67.0%) | 16,499 (33.0%) |
Housing Structures by Number of Rooms in Linn County
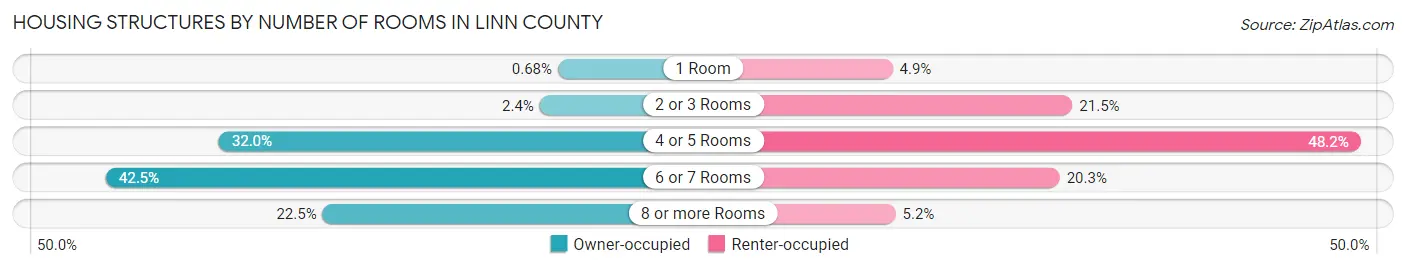
| Number of Rooms | Owner-occupied | Renter-occupied |
| 1 Room | 229 (0.7%) | 804 (4.9%) |
| 2 or 3 Rooms | 790 (2.4%) | 3,547 (21.5%) |
| 4 or 5 Rooms | 10,711 (32.0%) | 7,945 (48.1%) |
| 6 or 7 Rooms | 14,208 (42.5%) | 3,354 (20.3%) |
| 8 or more Rooms | 7,507 (22.5%) | 849 (5.1%) |
| Total | 33,445 (100.0%) | 16,499 (100.0%) |
Housing Structure by Heating Type in Linn County
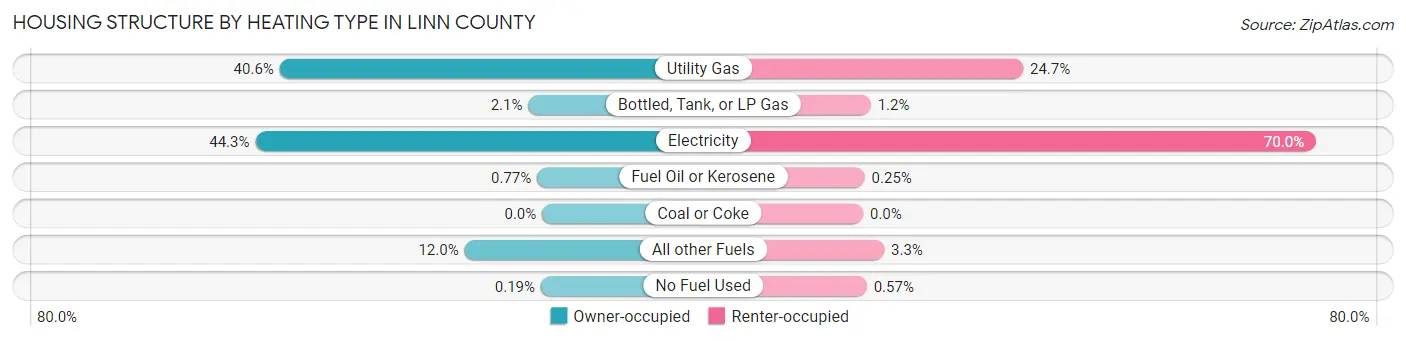
| Heating Type | Owner-occupied | Renter-occupied |
| Utility Gas | 13,570 (40.6%) | 4,080 (24.7%) |
| Bottled, Tank, or LP Gas | 712 (2.1%) | 196 (1.2%) |
| Electricity | 14,830 (44.3%) | 11,552 (70.0%) |
| Fuel Oil or Kerosene | 257 (0.8%) | 41 (0.3%) |
| Coal or Coke | 0 (0.0%) | 0 (0.0%) |
| All other Fuels | 4,013 (12.0%) | 536 (3.3%) |
| No Fuel Used | 63 (0.2%) | 94 (0.6%) |
| Total | 33,445 (100.0%) | 16,499 (100.0%) |
Household Vehicle Usage in Linn County
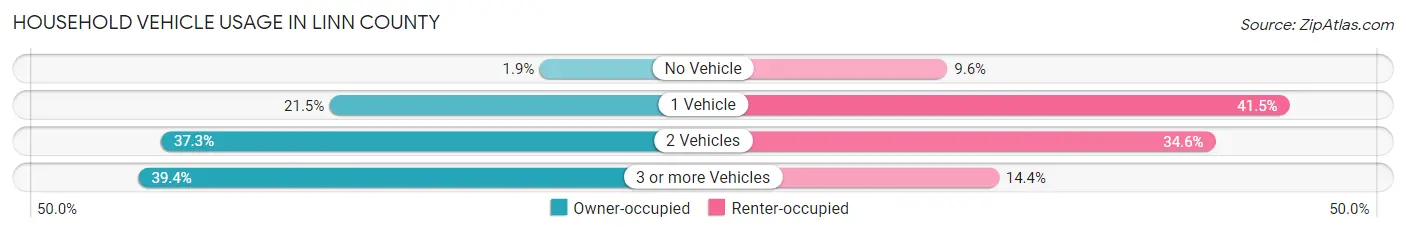
| Vehicles per Household | Owner-occupied | Renter-occupied |
| No Vehicle | 626 (1.9%) | 1,578 (9.6%) |
| 1 Vehicle | 7,183 (21.5%) | 6,846 (41.5%) |
| 2 Vehicles | 12,469 (37.3%) | 5,705 (34.6%) |
| 3 or more Vehicles | 13,167 (39.4%) | 2,370 (14.4%) |
| Total | 33,445 (100.0%) | 16,499 (100.0%) |
Real Estate & Mortgages in Linn County
Real Estate and Mortgage Overview in Linn County
| Characteristic | Without Mortgage | With Mortgage |
| Housing Units | 11,650 | 21,795 |
| Median Property Value | $293,800 | $328,800 |
| Median Household Income | $63,328 | $3,834 |
| Monthly Housing Costs | $577 | $1,037 |
| Real Estate Taxes | $2,906 | $356 |
Property Value by Mortgage Status in Linn County
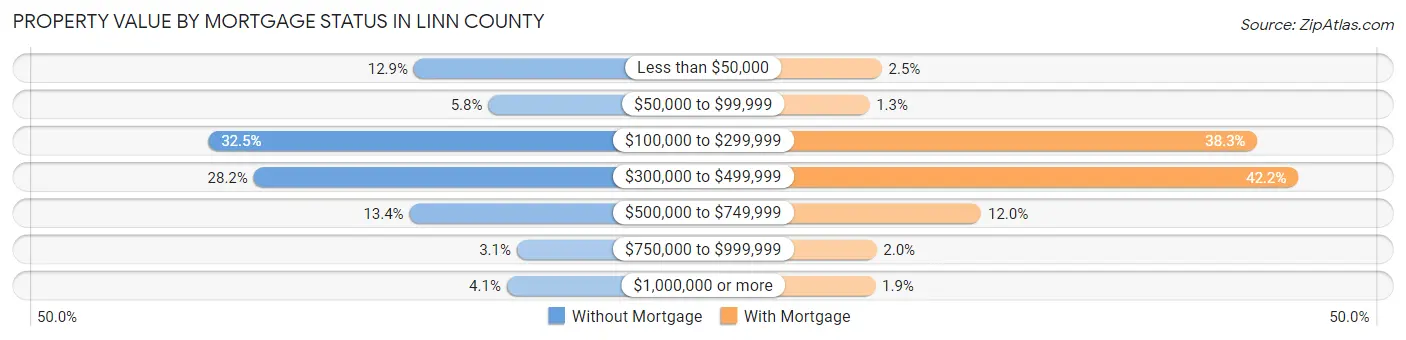
| Property Value | Without Mortgage | With Mortgage |
| Less than $50,000 | 1,506 (12.9%) | 540 (2.5%) |
| $50,000 to $99,999 | 680 (5.8%) | 283 (1.3%) |
| $100,000 to $299,999 | 3,787 (32.5%) | 8,342 (38.3%) |
| $300,000 to $499,999 | 3,284 (28.2%) | 9,188 (42.2%) |
| $500,000 to $749,999 | 1,555 (13.4%) | 2,604 (11.9%) |
| $750,000 to $999,999 | 363 (3.1%) | 432 (2.0%) |
| $1,000,000 or more | 475 (4.1%) | 406 (1.9%) |
| Total | 11,650 (100.0%) | 21,795 (100.0%) |
Household Income by Mortgage Status in Linn County
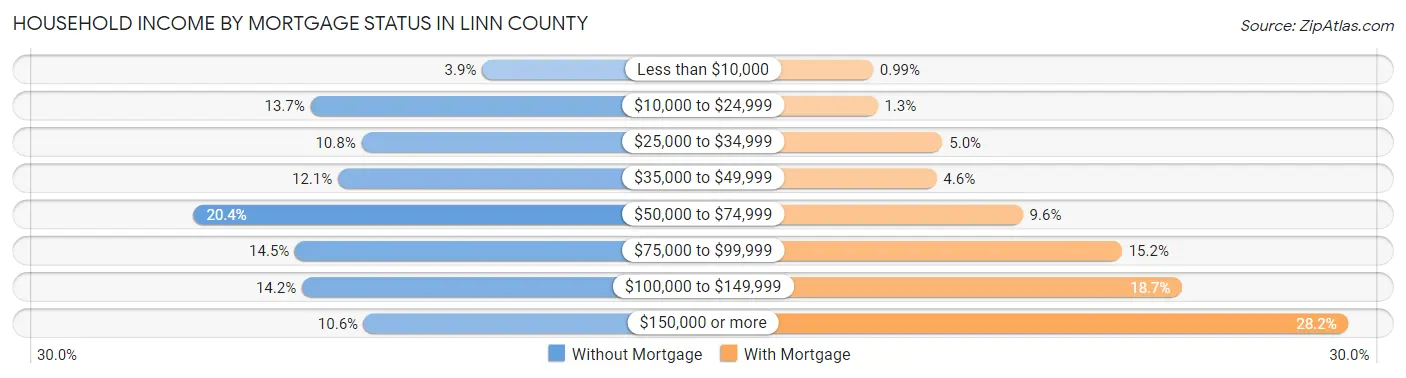
| Household Income | Without Mortgage | With Mortgage |
| Less than $10,000 | 449 (3.8%) | 216 (1.0%) |
| $10,000 to $24,999 | 1,591 (13.7%) | 272 (1.3%) |
| $25,000 to $34,999 | 1,252 (10.7%) | 1,080 (5.0%) |
| $35,000 to $49,999 | 1,409 (12.1%) | 1,006 (4.6%) |
| $50,000 to $74,999 | 2,371 (20.3%) | 2,081 (9.6%) |
| $75,000 to $99,999 | 1,694 (14.5%) | 3,314 (15.2%) |
| $100,000 to $149,999 | 1,648 (14.1%) | 4,069 (18.7%) |
| $150,000 or more | 1,236 (10.6%) | 6,139 (28.2%) |
| Total | 11,650 (100.0%) | 21,795 (100.0%) |
Property Value to Household Income Ratio in Linn County
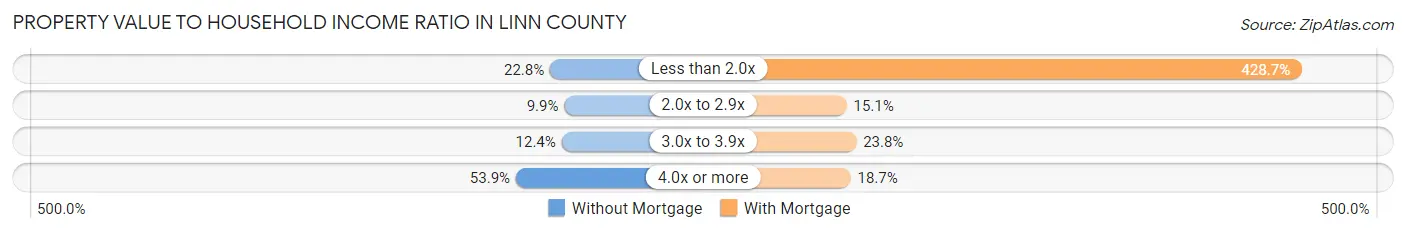
| Value-to-Income Ratio | Without Mortgage | With Mortgage |
| Less than 2.0x | 2,661 (22.8%) | 93,431 (428.7%) |
| 2.0x to 2.9x | 1,152 (9.9%) | 3,285 (15.1%) |
| 3.0x to 3.9x | 1,439 (12.3%) | 5,196 (23.8%) |
| 4.0x or more | 6,274 (53.8%) | 4,082 (18.7%) |
| Total | 11,650 (100.0%) | 21,795 (100.0%) |
Real Estate Taxes by Mortgage Status in Linn County
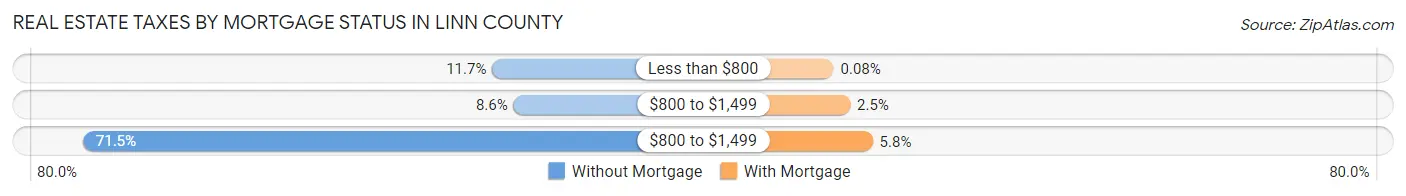
| Property Taxes | Without Mortgage | With Mortgage |
| Less than $800 | 1,360 (11.7%) | 17 (0.1%) |
| $800 to $1,499 | 997 (8.6%) | 543 (2.5%) |
| $800 to $1,499 | 8,328 (71.5%) | 1,262 (5.8%) |
| Total | 11,650 (100.0%) | 21,795 (100.0%) |
Health & Disability in Linn County
Health Insurance Coverage by Age in Linn County
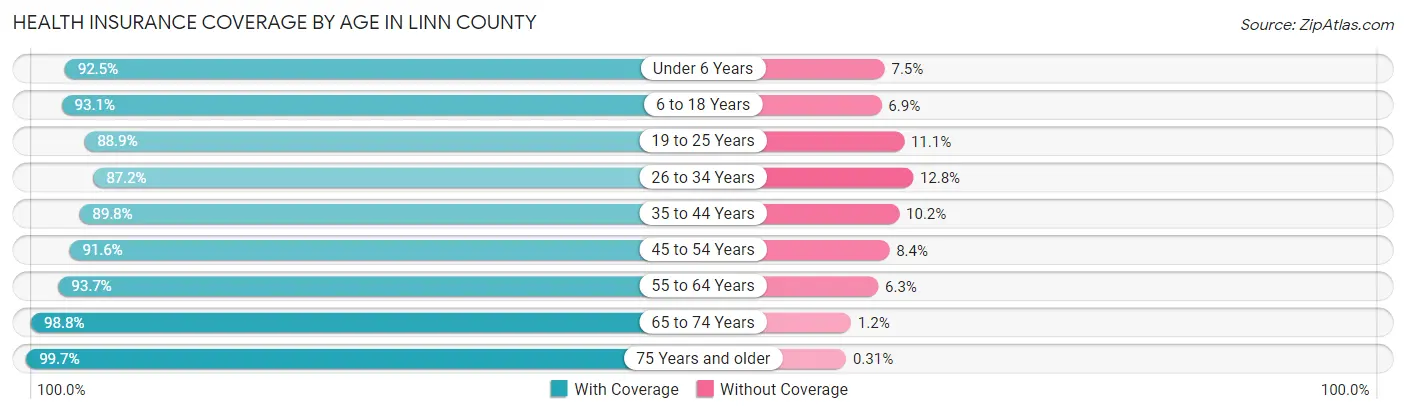
| Age Bracket | With Coverage | Without Coverage |
| Under 6 Years | 7,963 (92.5%) | 647 (7.5%) |
| 6 to 18 Years | 20,075 (93.1%) | 1,492 (6.9%) |
| 19 to 25 Years | 9,203 (88.9%) | 1,153 (11.1%) |
| 26 to 34 Years | 13,342 (87.2%) | 1,959 (12.8%) |
| 35 to 44 Years | 14,337 (89.8%) | 1,632 (10.2%) |
| 45 to 54 Years | 13,675 (91.6%) | 1,249 (8.4%) |
| 55 to 64 Years | 15,998 (93.7%) | 1,078 (6.3%) |
| 65 to 74 Years | 14,513 (98.8%) | 181 (1.2%) |
| 75 Years and older | 9,212 (99.7%) | 29 (0.3%) |
| Total | 118,318 (92.6%) | 9,420 (7.4%) |
Health Insurance Coverage by Citizenship Status in Linn County
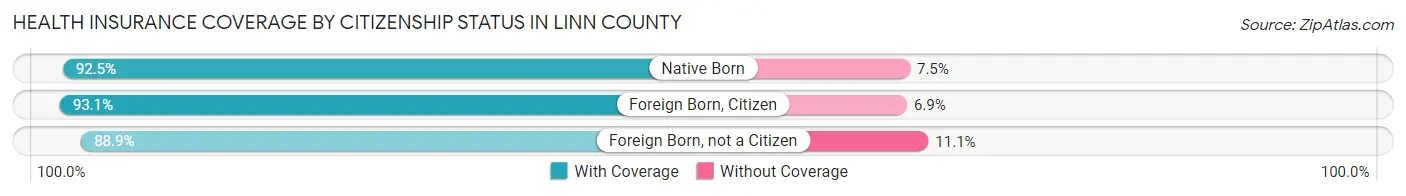
| Citizenship Status | With Coverage | Without Coverage |
| Native Born | 7,963 (92.5%) | 647 (7.5%) |
| Foreign Born, Citizen | 20,075 (93.1%) | 1,492 (6.9%) |
| Foreign Born, not a Citizen | 9,203 (88.9%) | 1,153 (11.1%) |
Health Insurance Coverage by Household Income in Linn County
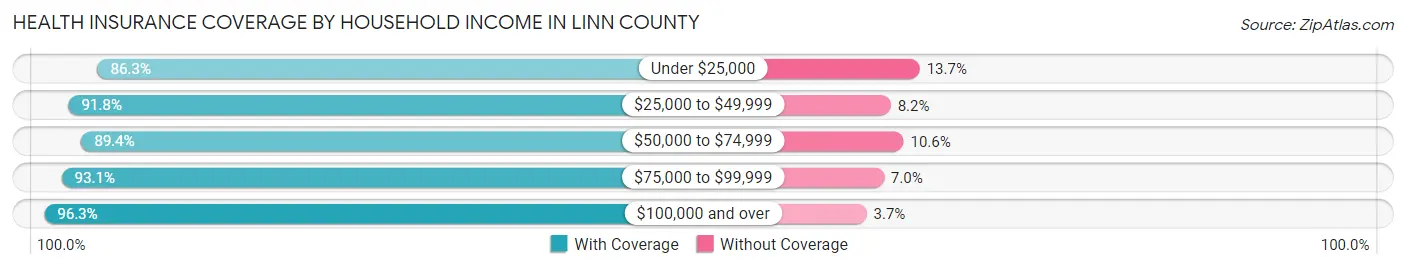
| Household Income | With Coverage | Without Coverage |
| Under $25,000 | 10,677 (86.3%) | 1,690 (13.7%) |
| $25,000 to $49,999 | 21,415 (91.8%) | 1,921 (8.2%) |
| $50,000 to $74,999 | 21,994 (89.4%) | 2,615 (10.6%) |
| $75,000 to $99,999 | 20,234 (93.0%) | 1,512 (7.0%) |
| $100,000 and over | 43,195 (96.3%) | 1,664 (3.7%) |
Public vs Private Health Insurance Coverage by Age in Linn County
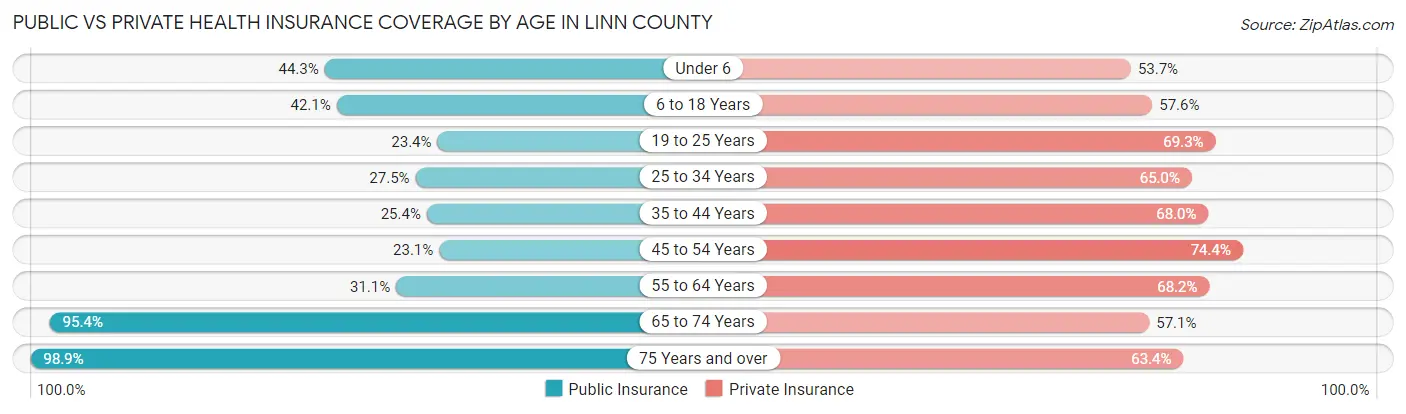
| Age Bracket | Public Insurance | Private Insurance |
| Under 6 | 3,817 (44.3%) | 4,621 (53.7%) |
| 6 to 18 Years | 9,080 (42.1%) | 12,432 (57.6%) |
| 19 to 25 Years | 2,422 (23.4%) | 7,181 (69.3%) |
| 25 to 34 Years | 4,201 (27.5%) | 9,940 (65.0%) |
| 35 to 44 Years | 4,050 (25.4%) | 10,864 (68.0%) |
| 45 to 54 Years | 3,442 (23.1%) | 11,105 (74.4%) |
| 55 to 64 Years | 5,303 (31.1%) | 11,647 (68.2%) |
| 65 to 74 Years | 14,010 (95.4%) | 8,386 (57.1%) |
| 75 Years and over | 9,142 (98.9%) | 5,858 (63.4%) |
| Total | 55,467 (43.4%) | 82,034 (64.2%) |
Disability Status by Sex by Age in Linn County
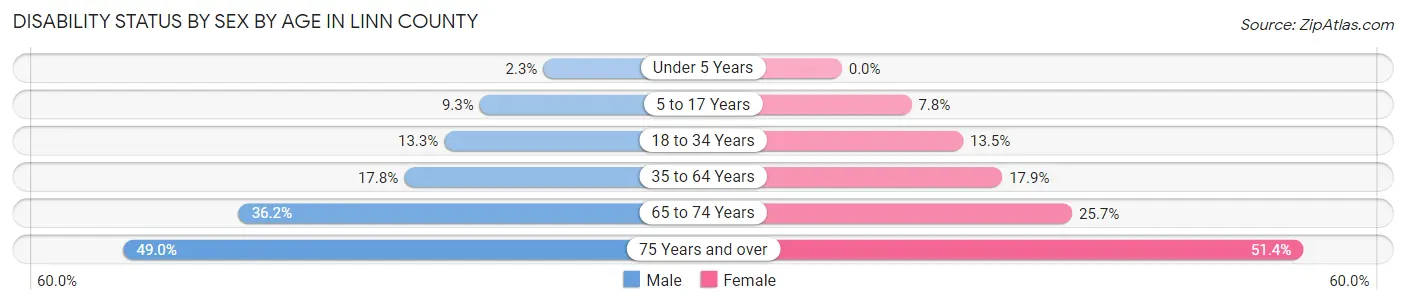
| Age Bracket | Male | Female |
| Under 5 Years | 84 (2.2%) | 0 (0.0%) |
| 5 to 17 Years | 1,029 (9.3%) | 778 (7.8%) |
| 18 to 34 Years | 1,859 (13.3%) | 1,818 (13.5%) |
| 35 to 64 Years | 4,249 (17.7%) | 4,295 (17.9%) |
| 65 to 74 Years | 2,553 (36.1%) | 1,957 (25.7%) |
| 75 Years and over | 2,000 (49.0%) | 2,649 (51.4%) |
Disability Class by Sex by Age in Linn County
Disability Class: Hearing Difficulty
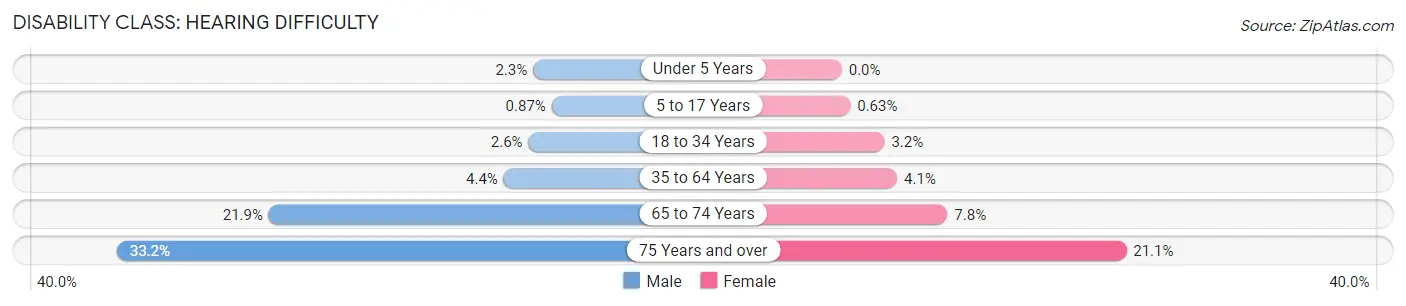
| Age Bracket | Male | Female |
| Under 5 Years | 84 (2.2%) | 0 (0.0%) |
| 5 to 17 Years | 96 (0.9%) | 63 (0.6%) |
| 18 to 34 Years | 362 (2.6%) | 427 (3.2%) |
| 35 to 64 Years | 1,059 (4.4%) | 987 (4.1%) |
| 65 to 74 Years | 1,545 (21.9%) | 598 (7.8%) |
| 75 Years and over | 1,354 (33.2%) | 1,089 (21.1%) |
Disability Class: Vision Difficulty
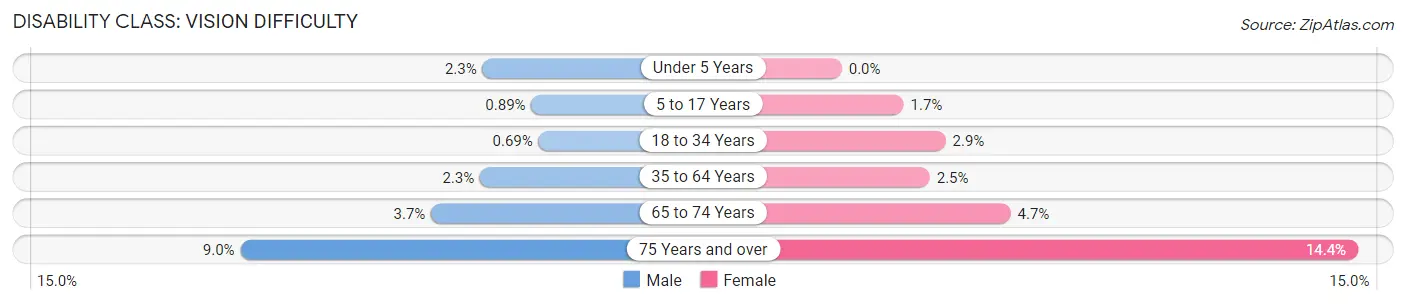
| Age Bracket | Male | Female |
| Under 5 Years | 84 (2.2%) | 0 (0.0%) |
| 5 to 17 Years | 98 (0.9%) | 172 (1.7%) |
| 18 to 34 Years | 96 (0.7%) | 389 (2.9%) |
| 35 to 64 Years | 555 (2.3%) | 589 (2.5%) |
| 65 to 74 Years | 260 (3.7%) | 359 (4.7%) |
| 75 Years and over | 367 (9.0%) | 741 (14.4%) |
Disability Class: Cognitive Difficulty
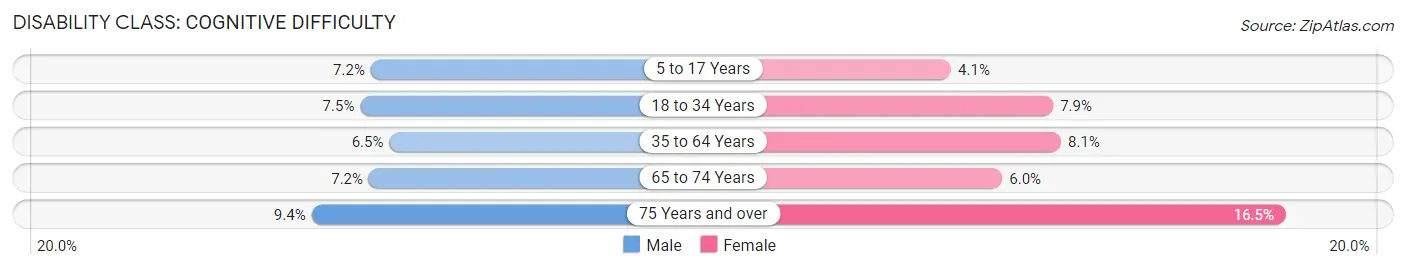
| Age Bracket | Male | Female |
| 5 to 17 Years | 789 (7.1%) | 407 (4.1%) |
| 18 to 34 Years | 1,054 (7.5%) | 1,057 (7.9%) |
| 35 to 64 Years | 1,545 (6.5%) | 1,956 (8.1%) |
| 65 to 74 Years | 510 (7.2%) | 455 (6.0%) |
| 75 Years and over | 382 (9.3%) | 850 (16.5%) |
Disability Class: Ambulatory Difficulty
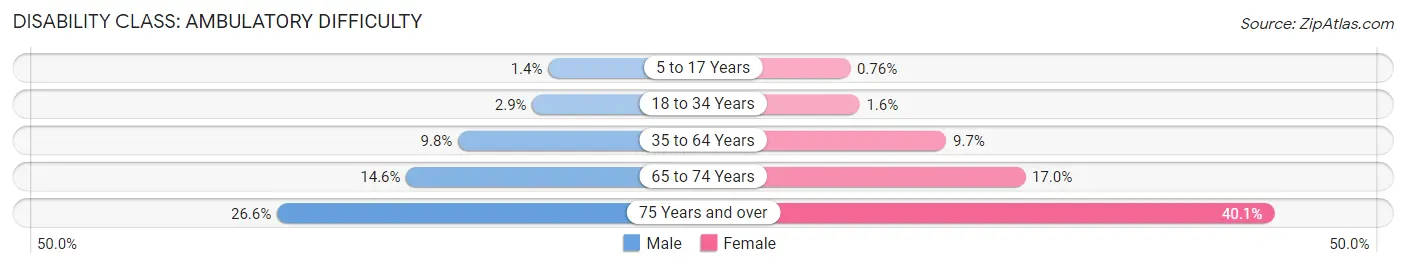
| Age Bracket | Male | Female |
| 5 to 17 Years | 154 (1.4%) | 76 (0.8%) |
| 18 to 34 Years | 402 (2.9%) | 221 (1.6%) |
| 35 to 64 Years | 2,336 (9.8%) | 2,327 (9.7%) |
| 65 to 74 Years | 1,029 (14.6%) | 1,297 (17.0%) |
| 75 Years and over | 1,085 (26.6%) | 2,069 (40.1%) |
Disability Class: Self-Care Difficulty
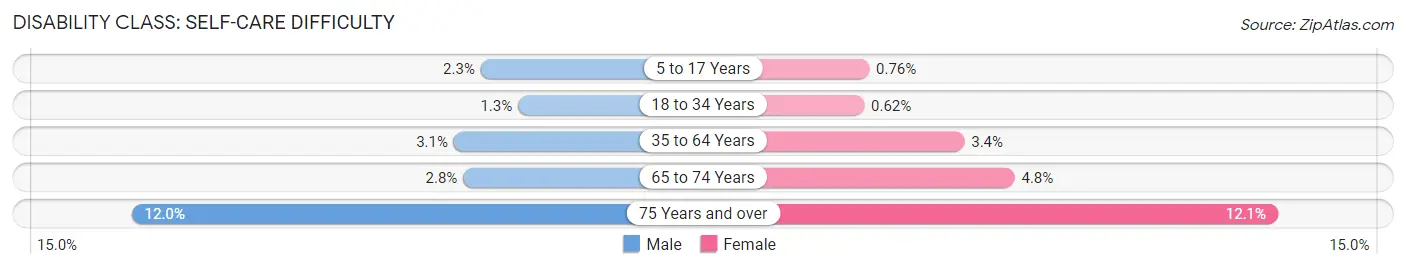
| Age Bracket | Male | Female |
| 5 to 17 Years | 254 (2.3%) | 76 (0.8%) |
| 18 to 34 Years | 176 (1.3%) | 83 (0.6%) |
| 35 to 64 Years | 730 (3.0%) | 820 (3.4%) |
| 65 to 74 Years | 197 (2.8%) | 367 (4.8%) |
| 75 Years and over | 491 (12.0%) | 626 (12.1%) |
Technology Access in Linn County
Computing Device Access in Linn County
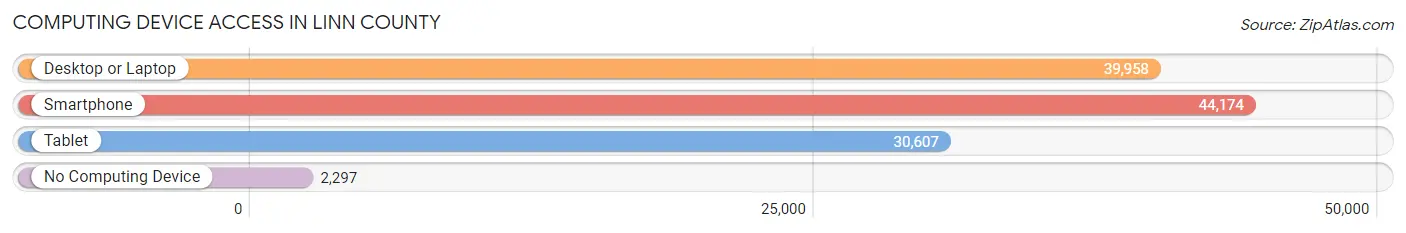
| Device Type | # Households | % Households |
| Desktop or Laptop | 39,958 | 80.0% |
| Smartphone | 44,174 | 88.4% |
| Tablet | 30,607 | 61.3% |
| No Computing Device | 2,297 | 4.6% |
| Total | 49,944 | 100.0% |
Internet Access in Linn County
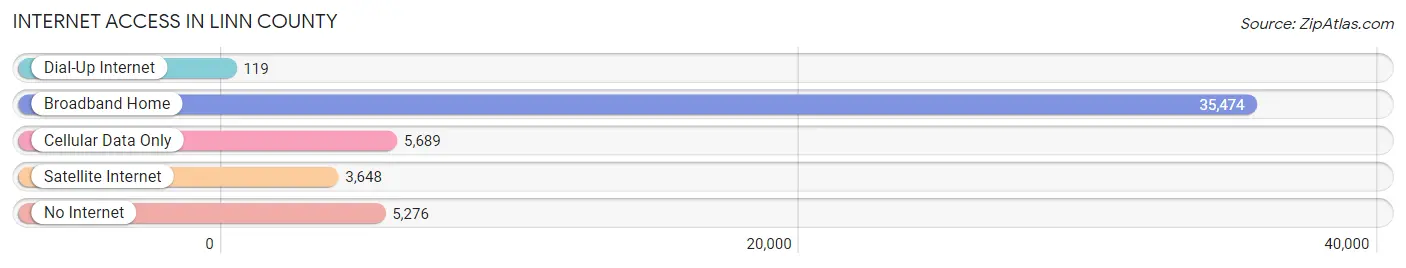
| Internet Type | # Households | % Households |
| Dial-Up Internet | 119 | 0.2% |
| Broadband Home | 35,474 | 71.0% |
| Cellular Data Only | 5,689 | 11.4% |
| Satellite Internet | 3,648 | 7.3% |
| No Internet | 5,276 | 10.6% |
| Total | 49,944 | 100.0% |
Linn County Summary
Linn County, Oregon is located in the Willamette Valley region of the state and is part of the Mid-Willamette Valley region. It is bordered by Benton County to the north, Marion County to the east, Lane County to the south, and Linn County to the west. The county seat is Albany, and the largest city is Lebanon. The population of Linn County was 116,672 in 2019, making it the fourth most populous county in Oregon.
Geography
Linn County is located in the Willamette Valley region of Oregon, and is part of the Mid-Willamette Valley region. It is bordered by Benton County to the north, Marion County to the east, Lane County to the south, and Linn County to the west. The county covers an area of 1,788 square miles, making it the fourth largest county in Oregon. The terrain is mostly rolling hills and valleys, with the Cascade Mountains to the east and the Coast Range to the west. The Willamette River runs through the county, and the Calapooia River runs through the northern part of the county.
The climate of Linn County is generally mild, with warm summers and cool winters. The average annual temperature is around 50°F, and the average annual precipitation is around 40 inches.
History
Linn County was created in 1847 and was named after Lewis F. Linn, a U.S. Senator from Missouri. The county was originally part of the Oregon Territory, and was later part of the Oregon Country. The county seat was originally located in Albany, and the county was divided into two districts in 1851.
The county was largely agricultural in the 19th century, with wheat, oats, and other grains being the main crops. The timber industry also flourished in the county, with the first sawmill being built in 1853. The county was also home to several Native American tribes, including the Kalapuya, Molalla, and Santiam.
Economy
Linn County’s economy is largely based on agriculture, forestry, and manufacturing. The county is home to several large agricultural operations, including the Oregon State University Agricultural Experiment Station, which is located in Corvallis. The county is also home to several timber companies, including Weyerhaeuser and Stimson Lumber Company.
Manufacturing is also an important part of the county’s economy, with several large companies located in the county, including Hewlett-Packard, Intel, and Tektronix. The county is also home to several small businesses, including wineries, breweries, and distilleries.
Demographics
As of 2019, the population of Linn County was 116,672, making it the fourth most populous county in Oregon. The population is largely white (90.2%), with smaller percentages of Hispanic (4.3%), Asian (2.3%), and African American (1.2%) residents. The median household income in the county is $54,845, and the median home value is $239,400.
The county is home to several higher education institutions, including Oregon State University, Linn-Benton Community College, and Corban University. The county is also home to several museums, including the Albany Regional Museum and the Linn County Historical Museum.
Conclusion
Linn County, Oregon is located in the Willamette Valley region of the state and is part of the Mid-Willamette Valley region. It is bordered by Benton County to the north, Marion County to the east, Lane County to the south, and Linn County to the west. The county covers an area of 1,788 square miles, and the population was 116,672 in 2019. The economy of the county is largely based on agriculture, forestry, and manufacturing, and the median household income is $54,845. The county is home to several higher education institutions, museums, and other attractions.
Common Questions
What is the Total Population of Linn County?
Total Population of Linn County is 128,598.
What is the Total Male Population of Linn County?
Total Male Population of Linn County is 64,303.
What is the Total Female Population of Linn County?
Total Female Population of Linn County is 64,295.
What is the Ratio of Males per 100 Females in Linn County?
There are 100.01 Males per 100 Females in Linn County.
What is the Ratio of Females per 100 Males in Linn County?
There are 99.99 Females per 100 Males in Linn County.
What is the Median Population Age in Linn County?
Median Population Age in Linn County is 40.0 Years.
What is the Average Family Size in Linn County
Average Family Size in Linn County is 3.0 People.
What is the Average Household Size in Linn County
Average Household Size in Linn County is 2.5 People.
What is Per Capita Income in Linn County?
Per Capita income in Linn County is $32,501.
What is the Median Family Income in Linn County?
Median Family Income in Linn County is $81,297.
What is the Median Household income in Linn County?
Median Household Income in Linn County is $69,523.
What is Income or Wage Gap in Linn County?
Income or Wage Gap in Linn County is 33.5%.
Women in Linn County earn 66.5 cents for every dollar earned by a man.
What is Family Income Deficit in Linn County?
Family Income Deficit in Linn County is $10,068.
Families that are below poverty line in Linn County earn $10,068 less on average than the poverty threshold level.
What is Inequality or Gini Index in Linn County?
Inequality or Gini Index in Linn County is 0.40.
How Large is the Labor Force in Linn County?
There are 61,737 People in the Labor Forcein in Linn County.
What is the Percentage of People in the Labor Force in Linn County?
59.9% of People are in the Labor Force in Linn County.
What is the Unemployment Rate in Linn County?
Unemployment Rate in Linn County is 6.2%.