Lincoln County, OR
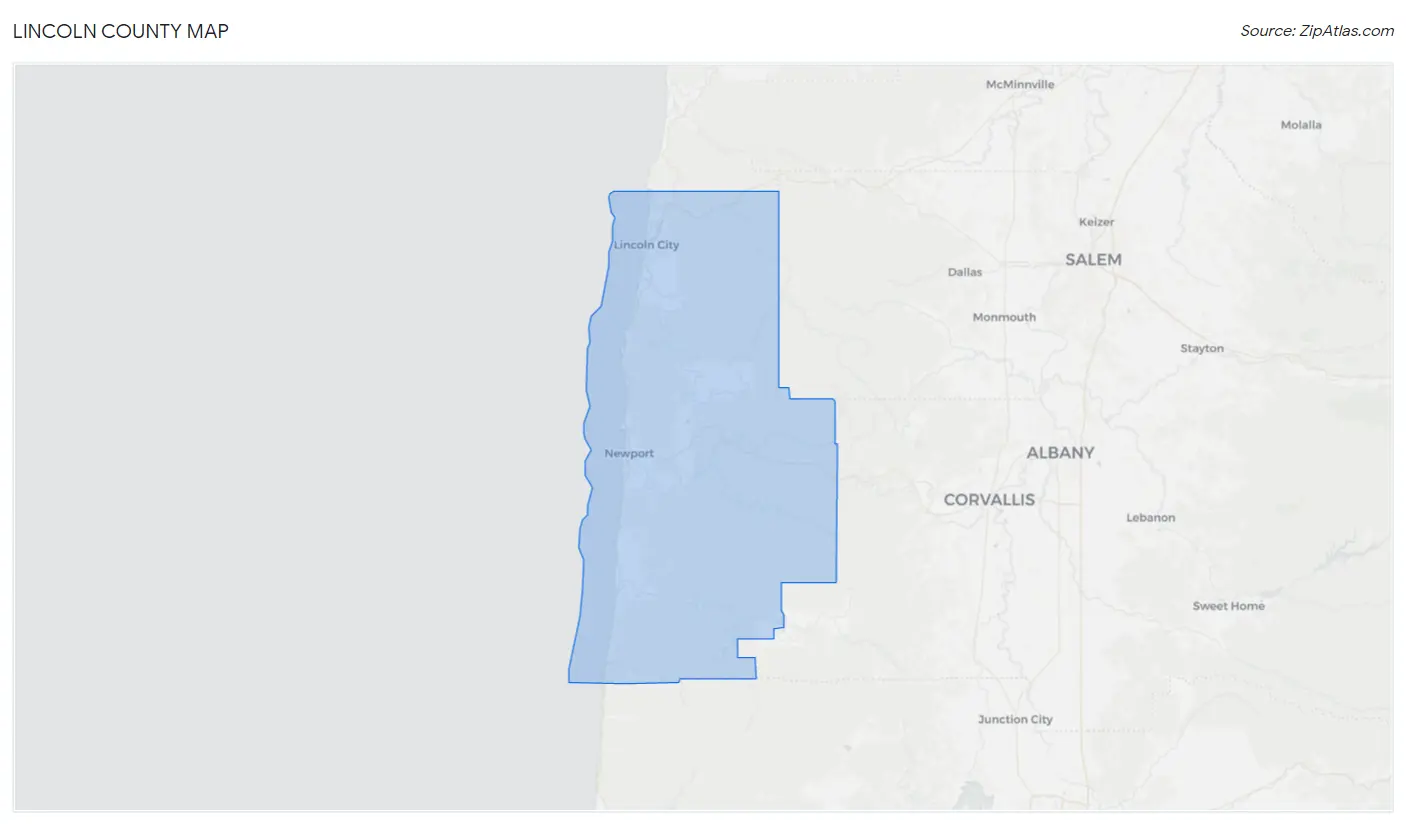
Lincoln County Map
Lincoln County Overview
50,334
TOTAL POPULATION
24,319
MALE POPULATION
26,015
FEMALE POPULATION
93.48
MALES / 100 FEMALES
106.97
FEMALES / 100 MALES
52.4
MEDIAN AGE
2.8
AVG FAMILY SIZE
2.2
AVG HOUSEHOLD SIZE
$35,295
PER CAPITA INCOME
$73,678
AVG FAMILY INCOME
$57,794
AVG HOUSEHOLD INCOME
15.5%
WAGE / INCOME GAP [ % ]
84.5¢/ $1
WAGE / INCOME GAP [ $ ]
$12,194
FAMILY INCOME DEFICIT
0.46
INEQUALITY / GINI INDEX
21,803
LABOR FORCE [ PEOPLE ]
50.4%
PERCENT IN LABOR FORCE
7.7%
UNEMPLOYMENT RATE
Lincoln County Area Codes
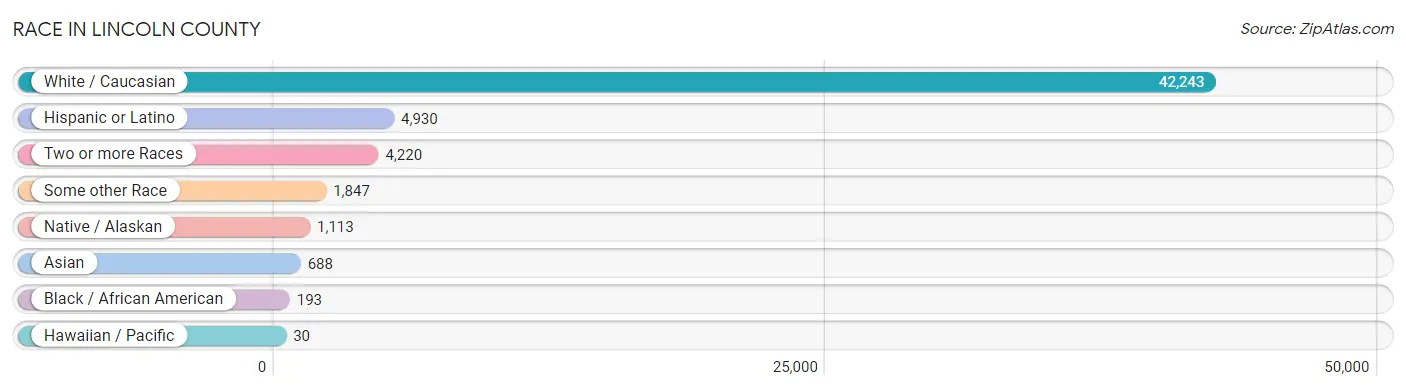
Race in Lincoln County
The most populous races in Lincoln County are White / Caucasian (42,243 | 83.9%), Hispanic or Latino (4,930 | 9.8%), and Two or more Races (4,220 | 8.4%).
| Race | # Population | % Population |
| Asian | 688 | 1.4% |
| Black / African American | 193 | 0.4% |
| Hawaiian / Pacific | 30 | 0.1% |
| Hispanic or Latino | 4,930 | 9.8% |
| Native / Alaskan | 1,113 | 2.2% |
| White / Caucasian | 42,243 | 83.9% |
| Two or more Races | 4,220 | 8.4% |
| Some other Race | 1,847 | 3.7% |
| Total | 50,334 | 100.0% |
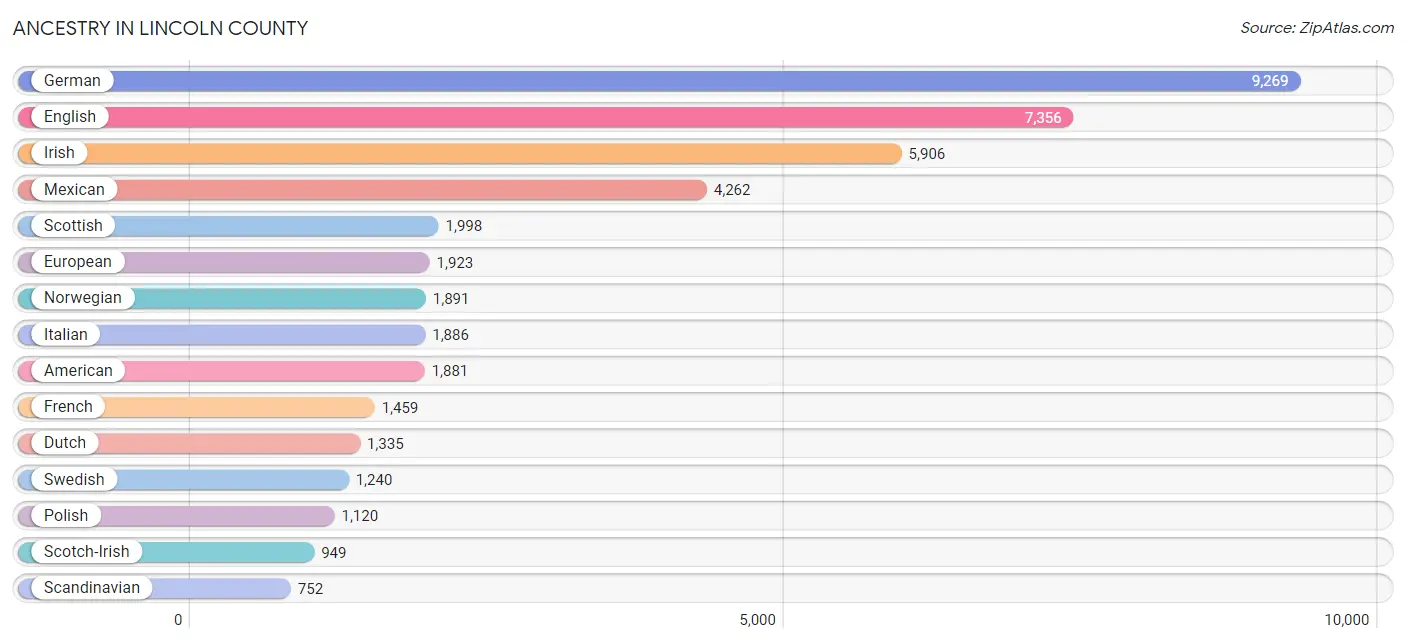
Ancestry in Lincoln County
The most populous ancestries reported in Lincoln County are German (9,269 | 18.4%), English (7,356 | 14.6%), Irish (5,906 | 11.7%), Mexican (4,262 | 8.5%), and Scottish (1,998 | 4.0%), together accounting for 57.2% of all Lincoln County residents.
| Ancestry | # Population | % Population |
| African | 8 | 0.0% |
| Alaska Native | 13 | 0.0% |
| Alaskan Athabascan | 2 | 0.0% |
| Albanian | 10 | 0.0% |
| American | 1,881 | 3.7% |
| Apache | 90 | 0.2% |
| Arab | 65 | 0.1% |
| Armenian | 33 | 0.1% |
| Australian | 18 | 0.0% |
| Austrian | 85 | 0.2% |
| Basque | 128 | 0.3% |
| Belgian | 173 | 0.3% |
| Bhutanese | 142 | 0.3% |
| Blackfeet | 176 | 0.4% |
| British | 362 | 0.7% |
| Burmese | 161 | 0.3% |
| Canadian | 71 | 0.1% |
| Celtic | 16 | 0.0% |
| Central American | 66 | 0.1% |
| Cherokee | 583 | 1.2% |
| Chickasaw | 12 | 0.0% |
| Chilean | 10 | 0.0% |
| Chippewa | 44 | 0.1% |
| Choctaw | 31 | 0.1% |
| Colombian | 59 | 0.1% |
| Comanche | 43 | 0.1% |
| Creek | 20 | 0.0% |
| Croatian | 29 | 0.1% |
| Cuban | 49 | 0.1% |
| Czech | 148 | 0.3% |
| Czechoslovakian | 74 | 0.2% |
| Danish | 650 | 1.3% |
| Delaware | 2 | 0.0% |
| Dominican | 20 | 0.0% |
| Dutch | 1,335 | 2.6% |
| Dutch West Indian | 10 | 0.0% |
| Eastern European | 244 | 0.5% |
| Ecuadorian | 22 | 0.0% |
| English | 7,356 | 14.6% |
| Ethiopian | 4 | 0.0% |
| European | 1,923 | 3.8% |
| Finnish | 414 | 0.8% |
| French | 1,459 | 2.9% |
| French American Indian | 26 | 0.1% |
| French Canadian | 266 | 0.5% |
| German | 9,269 | 18.4% |
| Greek | 77 | 0.2% |
| Guamanian / Chamorro | 23 | 0.1% |
| Guatemalan | 44 | 0.1% |
| Haitian | 4 | 0.0% |
| Hungarian | 189 | 0.4% |
| Indian (Asian) | 232 | 0.5% |
| Irish | 5,906 | 11.7% |
| Italian | 1,886 | 3.7% |
| Korean | 258 | 0.5% |
| Latvian | 18 | 0.0% |
| Lebanese | 47 | 0.1% |
| Lithuanian | 31 | 0.1% |
| Menominee | 3 | 0.0% |
| Mexican | 4,262 | 8.5% |
| Mexican American Indian | 9 | 0.0% |
| Moroccan | 11 | 0.0% |
| Native Hawaiian | 154 | 0.3% |
| Navajo | 24 | 0.1% |
| New Zealander | 34 | 0.1% |
| Nicaraguan | 20 | 0.0% |
| Northern European | 148 | 0.3% |
| Norwegian | 1,891 | 3.8% |
| Osage | 19 | 0.0% |
| Ottawa | 1 | 0.0% |
| Pakistani | 152 | 0.3% |
| Panamanian | 1 | 0.0% |
| Pennsylvania German | 23 | 0.1% |
| Polish | 1,120 | 2.2% |
| Portuguese | 140 | 0.3% |
| Puerto Rican | 134 | 0.3% |
| Puget Sound Salish | 13 | 0.0% |
| Romanian | 39 | 0.1% |
| Russian | 212 | 0.4% |
| Salvadoran | 1 | 0.0% |
| Samoan | 7 | 0.0% |
| Scandinavian | 752 | 1.5% |
| Scotch-Irish | 949 | 1.9% |
| Scottish | 1,998 | 4.0% |
| Sioux | 100 | 0.2% |
| Slavic | 55 | 0.1% |
| Slovak | 68 | 0.1% |
| South African | 290 | 0.6% |
| South American | 91 | 0.2% |
| South American Indian | 13 | 0.0% |
| Spaniard | 56 | 0.1% |
| Spanish | 102 | 0.2% |
| Spanish American | 4 | 0.0% |
| Sri Lankan | 71 | 0.1% |
| Subsaharan African | 302 | 0.6% |
| Swedish | 1,240 | 2.5% |
| Swiss | 226 | 0.4% |
| Thai | 20 | 0.0% |
| Tlingit-Haida | 30 | 0.1% |
| Tongan | 3 | 0.0% |
| Ukrainian | 114 | 0.2% |
| Vietnamese | 5 | 0.0% |
| Welsh | 571 | 1.1% |
| Yaqui | 2 | 0.0% |
| Yugoslavian | 85 | 0.2% | View All 105 Rows |
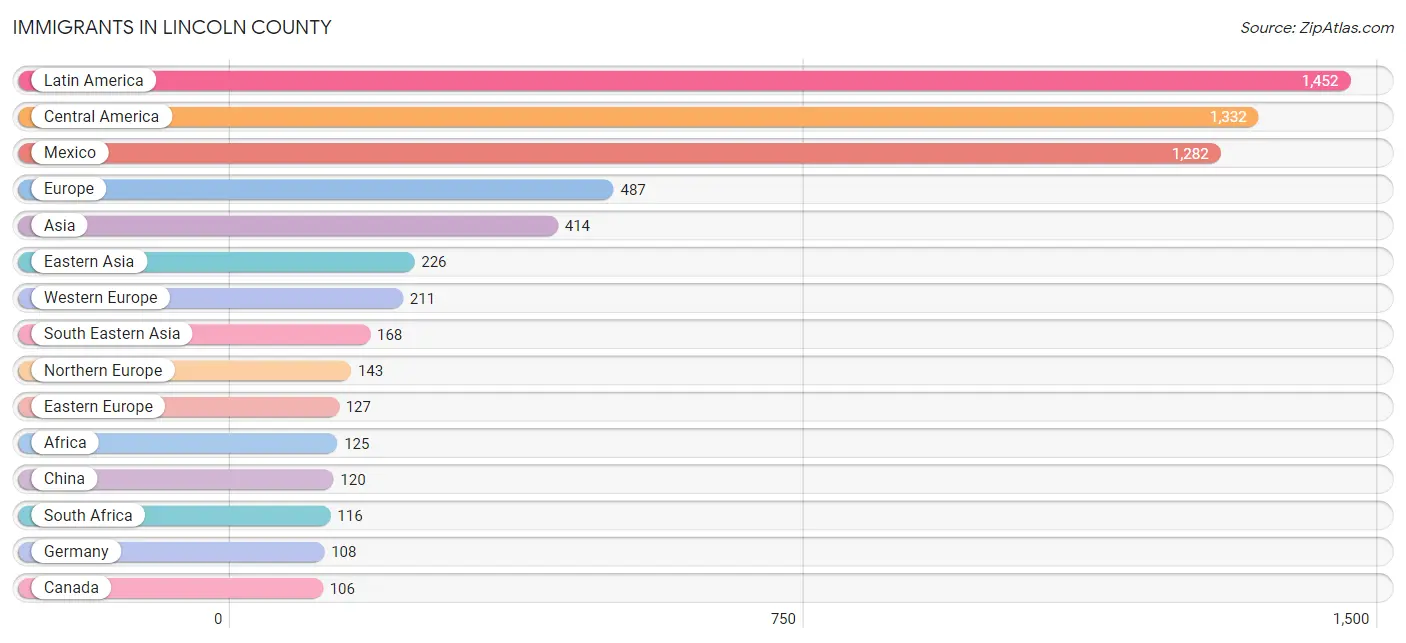
Immigrants in Lincoln County
The most numerous immigrant groups reported in Lincoln County came from Latin America (1,452 | 2.9%), Central America (1,332 | 2.6%), Mexico (1,282 | 2.5%), Europe (487 | 1.0%), and Asia (414 | 0.8%), together accounting for 9.9% of all Lincoln County residents.
| Immigration Origin | # Population | % Population |
| Africa | 125 | 0.3% |
| Asia | 414 | 0.8% |
| Bangladesh | 2 | 0.0% |
| Canada | 106 | 0.2% |
| Caribbean | 39 | 0.1% |
| Central America | 1,332 | 2.6% |
| China | 120 | 0.2% |
| Colombia | 59 | 0.1% |
| Cuba | 28 | 0.1% |
| Czechoslovakia | 15 | 0.0% |
| Dominican Republic | 11 | 0.0% |
| Eastern Africa | 9 | 0.0% |
| Eastern Asia | 226 | 0.4% |
| Eastern Europe | 127 | 0.3% |
| Ecuador | 22 | 0.0% |
| England | 97 | 0.2% |
| Europe | 487 | 1.0% |
| France | 61 | 0.1% |
| Germany | 108 | 0.2% |
| Guatemala | 34 | 0.1% |
| Hong Kong | 29 | 0.1% |
| India | 8 | 0.0% |
| Ireland | 17 | 0.0% |
| Italy | 6 | 0.0% |
| Japan | 25 | 0.1% |
| Korea | 81 | 0.2% |
| Latin America | 1,452 | 2.9% |
| Mexico | 1,282 | 2.5% |
| Netherlands | 19 | 0.0% |
| Nicaragua | 15 | 0.0% |
| Northern Europe | 143 | 0.3% |
| Oceania | 37 | 0.1% |
| Panama | 1 | 0.0% |
| Philippines | 76 | 0.2% |
| Poland | 106 | 0.2% |
| Romania | 1 | 0.0% |
| Russia | 5 | 0.0% |
| South Africa | 116 | 0.2% |
| South America | 81 | 0.2% |
| South Central Asia | 10 | 0.0% |
| South Eastern Asia | 168 | 0.3% |
| Southern Europe | 6 | 0.0% |
| Switzerland | 23 | 0.1% |
| Taiwan | 5 | 0.0% |
| Thailand | 53 | 0.1% |
| Turkey | 10 | 0.0% |
| Vietnam | 39 | 0.1% |
| Western Asia | 10 | 0.0% |
| Western Europe | 211 | 0.4% | View All 49 Rows |
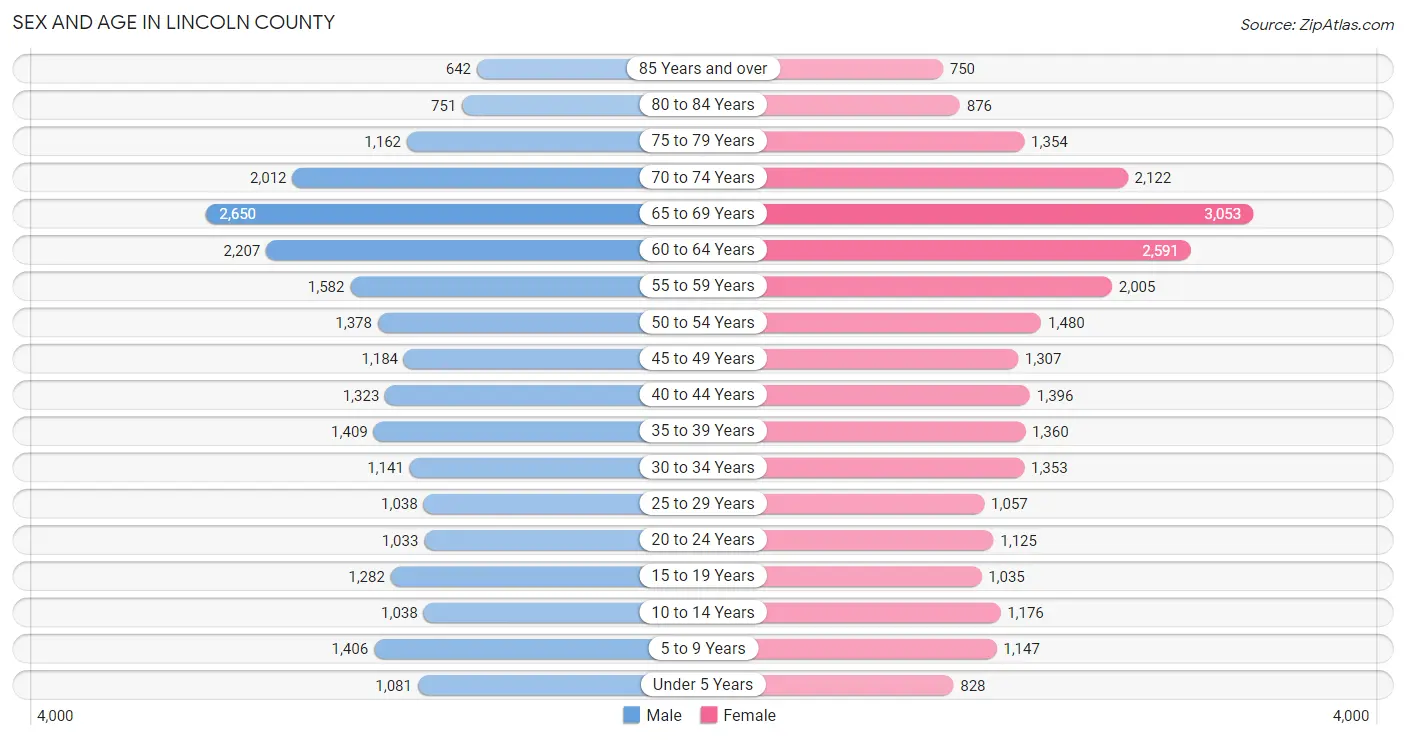
Sex and Age in Lincoln County
Sex and Age in Lincoln County
The most populous age groups in Lincoln County are 65 to 69 Years (2,650 | 10.9%) for men and 65 to 69 Years (3,053 | 11.7%) for women.
| Age Bracket | Male | Female |
| Under 5 Years | 1,081 (4.4%) | 828 (3.2%) |
| 5 to 9 Years | 1,406 (5.8%) | 1,147 (4.4%) |
| 10 to 14 Years | 1,038 (4.3%) | 1,176 (4.5%) |
| 15 to 19 Years | 1,282 (5.3%) | 1,035 (4.0%) |
| 20 to 24 Years | 1,033 (4.3%) | 1,125 (4.3%) |
| 25 to 29 Years | 1,038 (4.3%) | 1,057 (4.1%) |
| 30 to 34 Years | 1,141 (4.7%) | 1,353 (5.2%) |
| 35 to 39 Years | 1,409 (5.8%) | 1,360 (5.2%) |
| 40 to 44 Years | 1,323 (5.4%) | 1,396 (5.4%) |
| 45 to 49 Years | 1,184 (4.9%) | 1,307 (5.0%) |
| 50 to 54 Years | 1,378 (5.7%) | 1,480 (5.7%) |
| 55 to 59 Years | 1,582 (6.5%) | 2,005 (7.7%) |
| 60 to 64 Years | 2,207 (9.1%) | 2,591 (10.0%) |
| 65 to 69 Years | 2,650 (10.9%) | 3,053 (11.7%) |
| 70 to 74 Years | 2,012 (8.3%) | 2,122 (8.2%) |
| 75 to 79 Years | 1,162 (4.8%) | 1,354 (5.2%) |
| 80 to 84 Years | 751 (3.1%) | 876 (3.4%) |
| 85 Years and over | 642 (2.6%) | 750 (2.9%) |
| Total | 24,319 (100.0%) | 26,015 (100.0%) |
Families and Households in Lincoln County
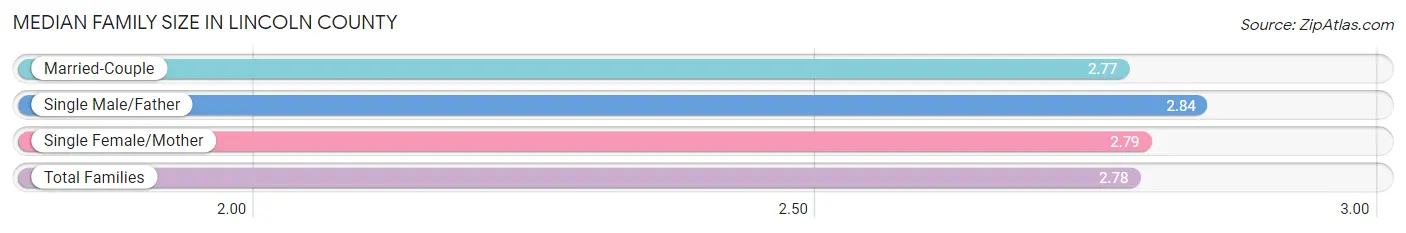
Median Family Size in Lincoln County
The median family size in Lincoln County is 2.78 persons per family, with single male/father families (902 | 6.9%) accounting for the largest median family size of 2.84 persons per family. On the other hand, married-couple families (9,707 | 74.5%) represent the smallest median family size with 2.77 persons per family.
| Family Type | # Families | Family Size |
| Married-Couple | 9,707 (74.5%) | 2.77 |
| Single Male/Father | 902 (6.9%) | 2.84 |
| Single Female/Mother | 2,430 (18.6%) | 2.79 |
| Total Families | 13,039 (100.0%) | 2.78 |
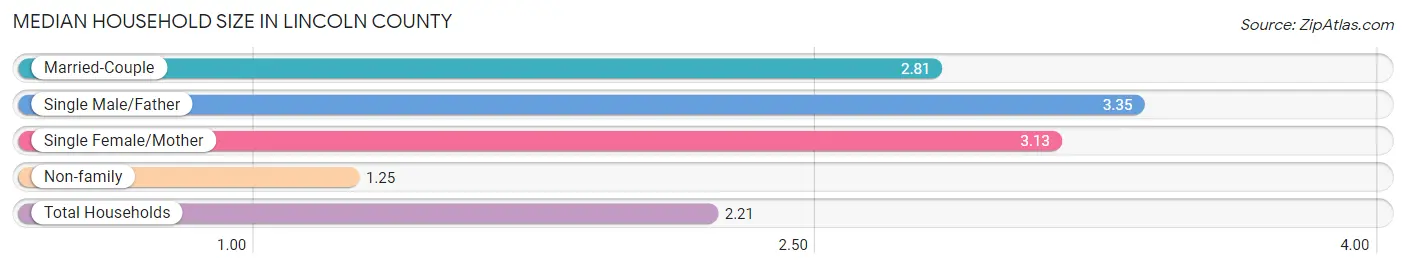
Median Household Size in Lincoln County
The median household size in Lincoln County is 2.21 persons per household, with single male/father households (902 | 4.0%) accounting for the largest median household size of 3.35 persons per household. non-family households (9,444 | 42.0%) represent the smallest median household size with 1.25 persons per household.
| Household Type | # Households | Household Size |
| Married-Couple | 9,707 (43.2%) | 2.81 |
| Single Male/Father | 902 (4.0%) | 3.35 |
| Single Female/Mother | 2,430 (10.8%) | 3.13 |
| Non-family | 9,444 (42.0%) | 1.25 |
| Total Households | 22,483 (100.0%) | 2.21 |
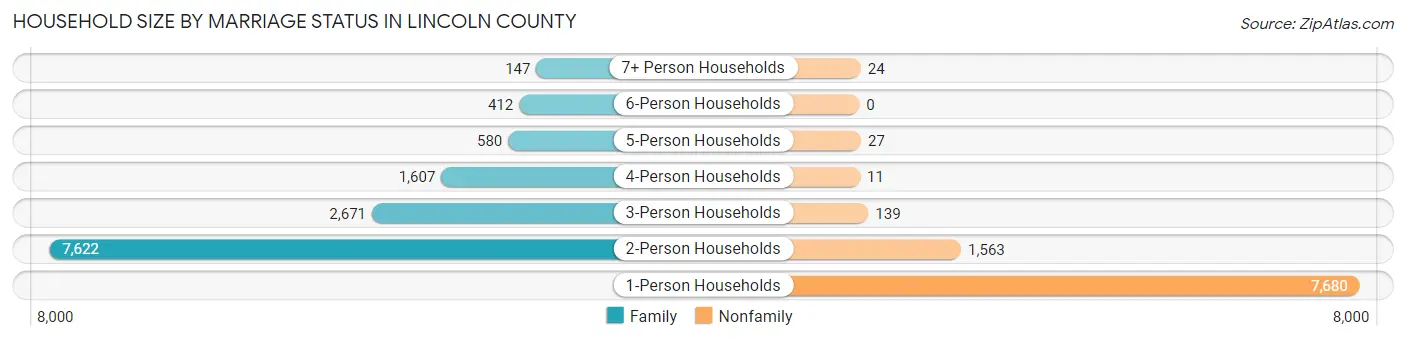
Household Size by Marriage Status in Lincoln County
Out of a total of 22,483 households in Lincoln County, 13,039 (58.0%) are family households, while 9,444 (42.0%) are nonfamily households. The most numerous type of family households are 2-person households, comprising 7,622, and the most common type of nonfamily households are 1-person households, comprising 7,680.
| Household Size | Family Households | Nonfamily Households |
| 1-Person Households | - | 7,680 (34.2%) |
| 2-Person Households | 7,622 (33.9%) | 1,563 (7.0%) |
| 3-Person Households | 2,671 (11.9%) | 139 (0.6%) |
| 4-Person Households | 1,607 (7.1%) | 11 (0.1%) |
| 5-Person Households | 580 (2.6%) | 27 (0.1%) |
| 6-Person Households | 412 (1.8%) | 0 (0.0%) |
| 7+ Person Households | 147 (0.6%) | 24 (0.1%) |
| Total | 13,039 (58.0%) | 9,444 (42.0%) |
Female Fertility in Lincoln County
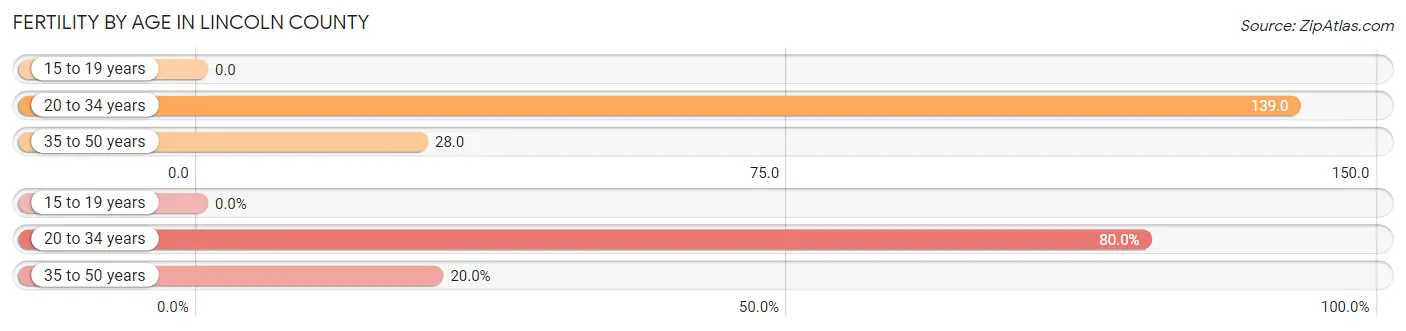
Fertility by Age in Lincoln County
Average fertility rate in Lincoln County is 69.0 births per 1,000 women. Women in the age bracket of 20 to 34 years have the highest fertility rate with 139.0 births per 1,000 women. Women in the age bracket of 20 to 34 years acount for 80.0% of all women with births.
| Age Bracket | Women with Births | Births / 1,000 Women |
| 15 to 19 years | 0 (0.0%) | 0.0 |
| 20 to 34 years | 493 (80.0%) | 139.0 |
| 35 to 50 years | 123 (20.0%) | 28.0 |
| Total | 616 (100.0%) | 69.0 |
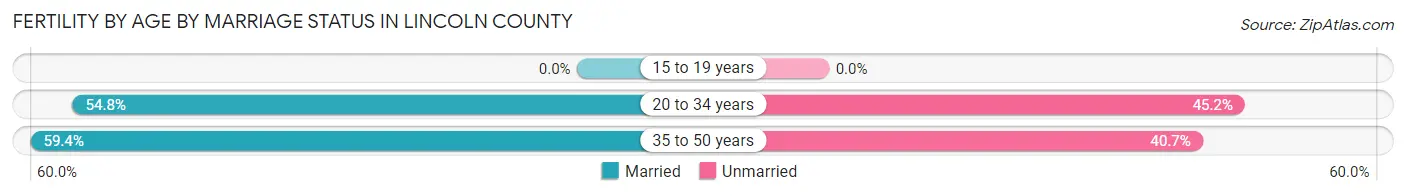
Fertility by Age by Marriage Status in Lincoln County
55.7% of women with births (616) in Lincoln County are married. The highest percentage of unmarried women with births falls into 20 to 34 years age bracket with 45.2% of them unmarried at the time of birth, while the lowest percentage of unmarried women with births belong to 35 to 50 years age bracket with 40.6% of them unmarried.
| Age Bracket | Married | Unmarried |
| 15 to 19 years | 0 (0.0%) | 0 (0.0%) |
| 20 to 34 years | 270 (54.8%) | 223 (45.2%) |
| 35 to 50 years | 73 (59.4%) | 50 (40.6%) |
| Total | 343 (55.7%) | 273 (44.3%) |
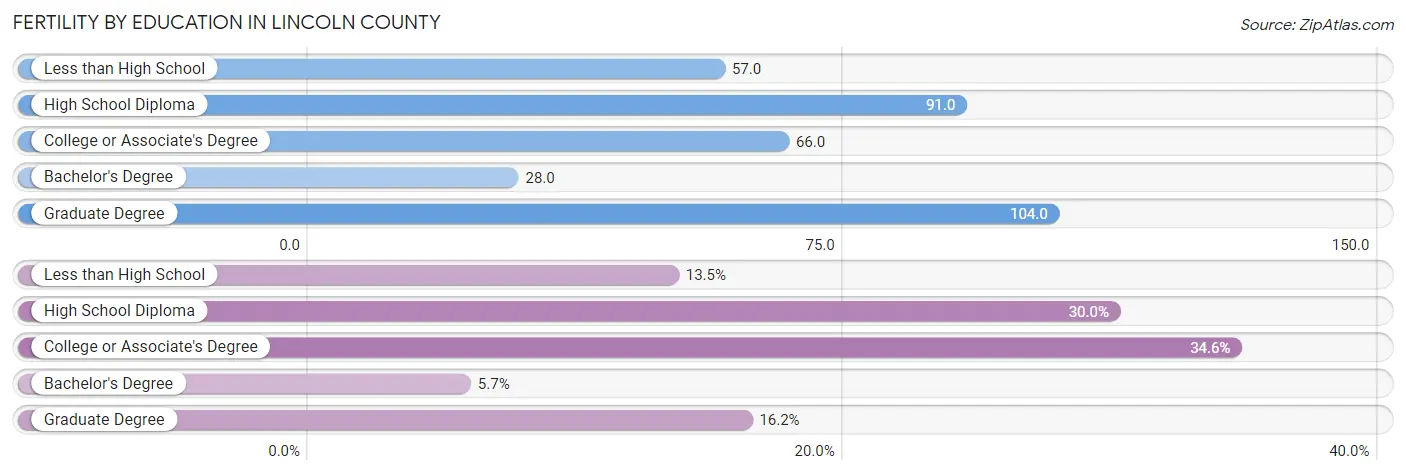
Fertility by Education in Lincoln County
Average fertility rate in Lincoln County is 69.0 births per 1,000 women. Women with the education attainment of graduate degree have the highest fertility rate of 104.0 births per 1,000 women, while women with the education attainment of bachelor's degree have the lowest fertility at 28.0 births per 1,000 women. Women with the education attainment of college or associate's degree represent 34.6% of all women with births.
| Educational Attainment | Women with Births | Births / 1,000 Women |
| Less than High School | 83 (13.5%) | 57.0 |
| High School Diploma | 185 (30.0%) | 91.0 |
| College or Associate's Degree | 213 (34.6%) | 66.0 |
| Bachelor's Degree | 35 (5.7%) | 28.0 |
| Graduate Degree | 100 (16.2%) | 104.0 |
| Total | 616 (100.0%) | 69.0 |
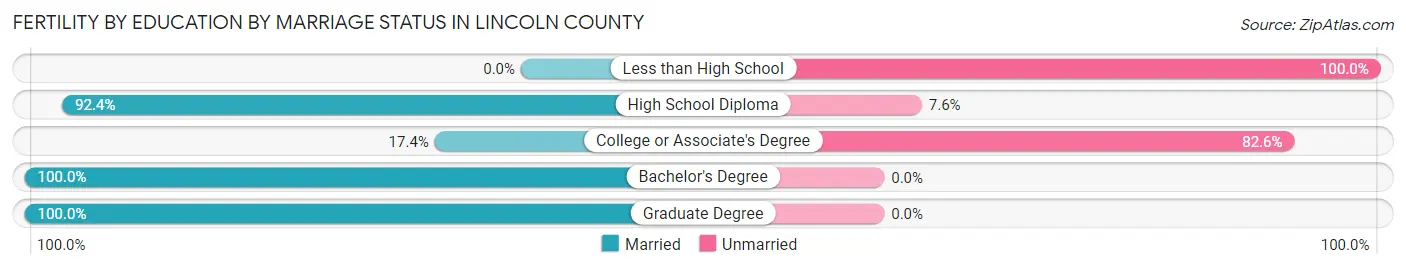
Fertility by Education by Marriage Status in Lincoln County
44.3% of women with births in Lincoln County are unmarried. Women with the educational attainment of bachelor's degree are most likely to be married with 100.0% of them married at childbirth, while women with the educational attainment of less than high school are least likely to be married with 100.0% of them unmarried at childbirth.
| Educational Attainment | Married | Unmarried |
| Less than High School | 0 (0.0%) | 83 (100.0%) |
| High School Diploma | 171 (92.4%) | 14 (7.6%) |
| College or Associate's Degree | 37 (17.4%) | 176 (82.6%) |
| Bachelor's Degree | 35 (100.0%) | 0 (0.0%) |
| Graduate Degree | 100 (100.0%) | 0 (0.0%) |
| Total | 343 (55.7%) | 273 (44.3%) |
Income in Lincoln County
Income Overview in Lincoln County
Per Capita Income in Lincoln County is $35,295, while median incomes of families and households are $73,678 and $57,794 respectively.
| Characteristic | Number | Measure |
| Per Capita Income | 50,334 | $35,295 |
| Median Family Income | 13,039 | $73,678 |
| Mean Family Income | 13,039 | $96,101 |
| Median Household Income | 22,483 | $57,794 |
| Mean Household Income | 22,483 | $78,457 |
| Income Deficit | 13,039 | $12,194 |
| Wage / Income Gap (%) | 50,334 | 15.49% |
| Wage / Income Gap ($) | 50,334 | 84.51¢ per $1 |
| Gini / Inequality Index | 50,334 | 0.46 |
Earnings by Sex in Lincoln County
Average Earnings in Lincoln County are $32,352, $35,240 for men and $29,782 for women, a difference of 15.5%.
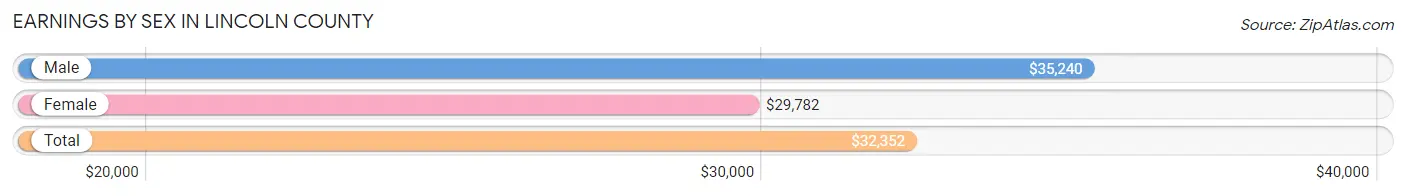
| Sex | Number | Average Earnings |
| Male | 11,519 (49.1%) | $35,240 |
| Female | 11,923 (50.9%) | $29,782 |
| Total | 23,442 (100.0%) | $32,352 |
Earnings by Sex by Income Bracket in Lincoln County
The most common earnings brackets in Lincoln County are $100,000+ for men (1,147 | 10.0%) and $25,000 to $29,999 for women (1,049 | 8.8%).
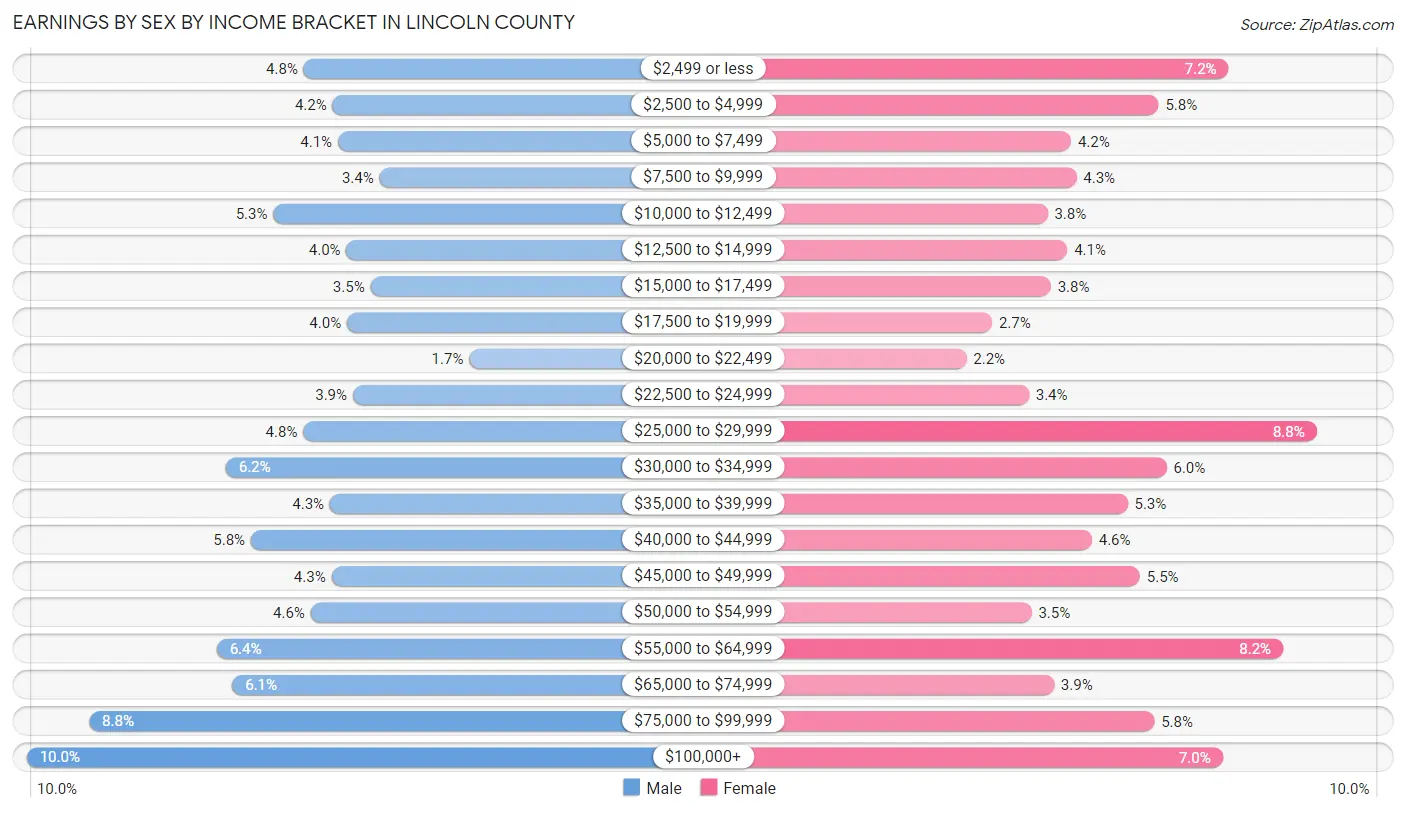
| Income | Male | Female |
| $2,499 or less | 550 (4.8%) | 852 (7.1%) |
| $2,500 to $4,999 | 487 (4.2%) | 696 (5.8%) |
| $5,000 to $7,499 | 476 (4.1%) | 501 (4.2%) |
| $7,500 to $9,999 | 386 (3.4%) | 513 (4.3%) |
| $10,000 to $12,499 | 615 (5.3%) | 448 (3.8%) |
| $12,500 to $14,999 | 457 (4.0%) | 492 (4.1%) |
| $15,000 to $17,499 | 405 (3.5%) | 456 (3.8%) |
| $17,500 to $19,999 | 456 (4.0%) | 324 (2.7%) |
| $20,000 to $22,499 | 192 (1.7%) | 267 (2.2%) |
| $22,500 to $24,999 | 444 (3.8%) | 407 (3.4%) |
| $25,000 to $29,999 | 551 (4.8%) | 1,049 (8.8%) |
| $30,000 to $34,999 | 718 (6.2%) | 714 (6.0%) |
| $35,000 to $39,999 | 493 (4.3%) | 627 (5.3%) |
| $40,000 to $44,999 | 664 (5.8%) | 547 (4.6%) |
| $45,000 to $49,999 | 489 (4.3%) | 654 (5.5%) |
| $50,000 to $54,999 | 535 (4.6%) | 413 (3.5%) |
| $55,000 to $64,999 | 737 (6.4%) | 974 (8.2%) |
| $65,000 to $74,999 | 704 (6.1%) | 463 (3.9%) |
| $75,000 to $99,999 | 1,013 (8.8%) | 687 (5.8%) |
| $100,000+ | 1,147 (10.0%) | 839 (7.0%) |
| Total | 11,519 (100.0%) | 11,923 (100.0%) |
Earnings by Sex by Educational Attainment in Lincoln County
Average earnings in Lincoln County are $41,409 for men and $34,239 for women, a difference of 17.3%. Men with an educational attainment of graduate degree enjoy the highest average annual earnings of $62,045, while those with less than high school education earn the least with $29,946. Women with an educational attainment of graduate degree earn the most with the average annual earnings of $57,835, while those with less than high school education have the smallest earnings of $19,867.
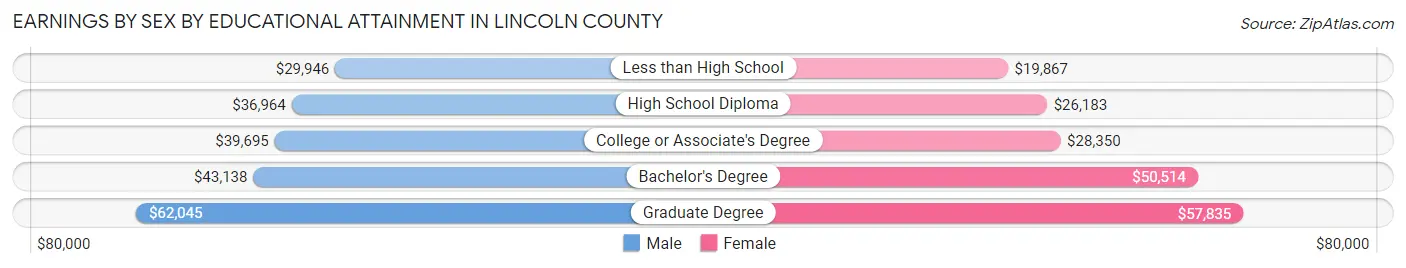
| Educational Attainment | Male Income | Female Income |
| Less than High School | $29,946 | $19,867 |
| High School Diploma | $36,964 | $26,183 |
| College or Associate's Degree | $39,695 | $28,350 |
| Bachelor's Degree | $43,138 | $50,514 |
| Graduate Degree | $62,045 | $57,835 |
| Total | $41,409 | $34,239 |
Family Income in Lincoln County
Family Income Brackets in Lincoln County
According to the Lincoln County family income data, there are 2,738 families falling into the $50,000 to $74,999 income range, which is the most common income bracket and makes up 21.0% of all families. Conversely, the $10,000 to $14,999 income bracket is the least frequent group with only 261 families (2.0%) belonging to this category.
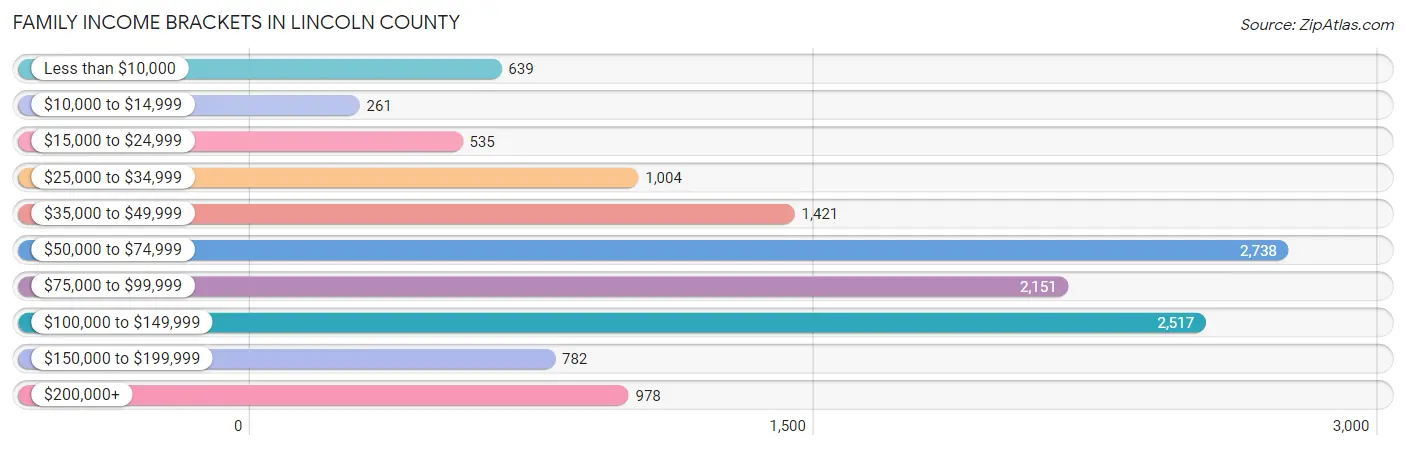
| Income Bracket | # Families | % Families |
| Less than $10,000 | 639 | 4.9% |
| $10,000 to $14,999 | 261 | 2.0% |
| $15,000 to $24,999 | 535 | 4.1% |
| $25,000 to $34,999 | 1,004 | 7.7% |
| $35,000 to $49,999 | 1,421 | 10.9% |
| $50,000 to $74,999 | 2,738 | 21.0% |
| $75,000 to $99,999 | 2,151 | 16.5% |
| $100,000 to $149,999 | 2,517 | 19.3% |
| $150,000 to $199,999 | 782 | 6.0% |
| $200,000+ | 978 | 7.5% |
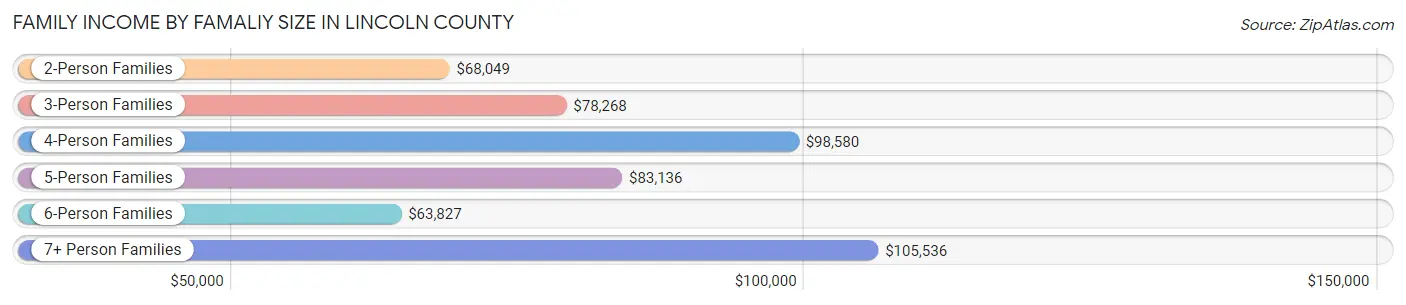
Family Income by Famaliy Size in Lincoln County
7+ person families (81 | 0.6%) account for the highest median family income in Lincoln County with $105,536 per family, while 2-person families (8,338 | 63.9%) have the highest median income of $34,024 per family member.
| Income Bracket | # Families | Median Income |
| 2-Person Families | 8,338 (63.9%) | $68,049 |
| 3-Person Families | 2,353 (18.0%) | $78,268 |
| 4-Person Families | 1,431 (11.0%) | $98,580 |
| 5-Person Families | 516 (4.0%) | $83,136 |
| 6-Person Families | 320 (2.5%) | $63,827 |
| 7+ Person Families | 81 (0.6%) | $105,536 |
| Total | 13,039 (100.0%) | $73,678 |
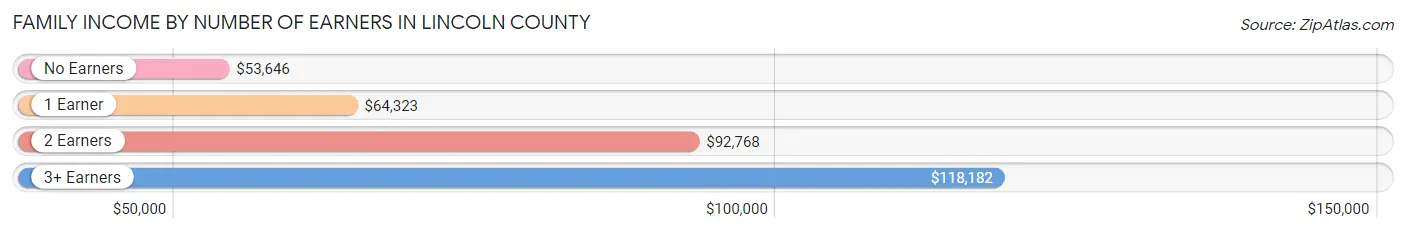
Family Income by Number of Earners in Lincoln County
The median family income in Lincoln County is $73,678, with families comprising 3+ earners (900) having the highest median family income of $118,182, while families with no earners (3,492) have the lowest median family income of $53,646, accounting for 6.9% and 26.8% of families, respectively.
| Number of Earners | # Families | Median Income |
| No Earners | 3,492 (26.8%) | $53,646 |
| 1 Earner | 4,584 (35.2%) | $64,323 |
| 2 Earners | 4,063 (31.2%) | $92,768 |
| 3+ Earners | 900 (6.9%) | $118,182 |
| Total | 13,039 (100.0%) | $73,678 |
Household Income in Lincoln County
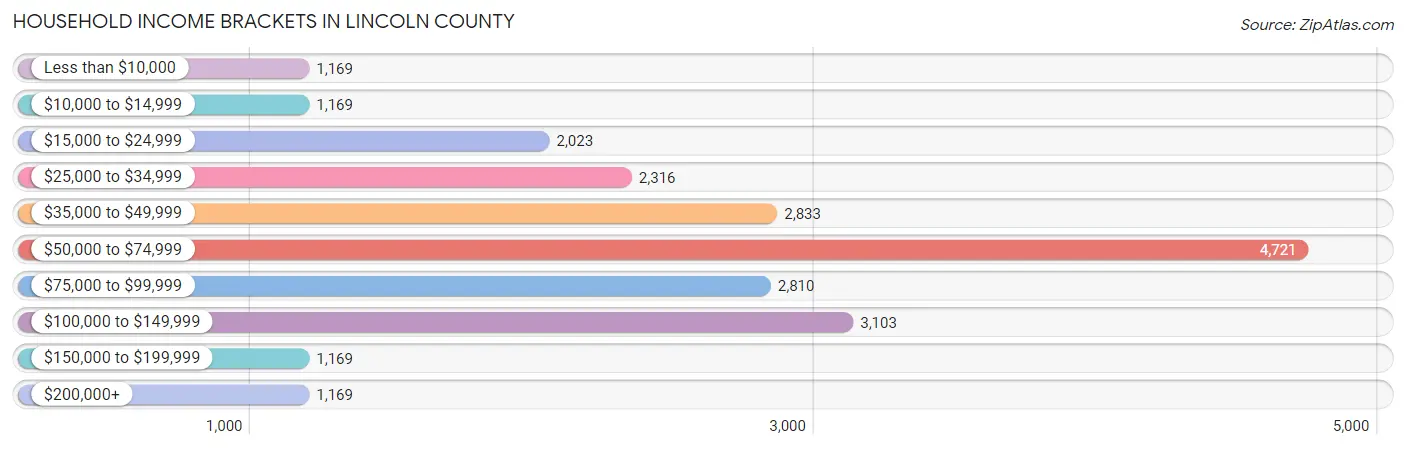
Household Income Brackets in Lincoln County
With 4,721 households falling in the category, the $50,000 to $74,999 income range is the most frequent in Lincoln County, accounting for 21.0% of all households. In contrast, only 1,169 households (5.2%) fall into the less than $10,000 income bracket, making it the least populous group.
| Income Bracket | # Households | % Households |
| Less than $10,000 | 1,169 | 5.2% |
| $10,000 to $14,999 | 1,169 | 5.2% |
| $15,000 to $24,999 | 2,023 | 9.0% |
| $25,000 to $34,999 | 2,316 | 10.3% |
| $35,000 to $49,999 | 2,833 | 12.6% |
| $50,000 to $74,999 | 4,721 | 21.0% |
| $75,000 to $99,999 | 2,810 | 12.5% |
| $100,000 to $149,999 | 3,103 | 13.8% |
| $150,000 to $199,999 | 1,169 | 5.2% |
| $200,000+ | 1,169 | 5.2% |
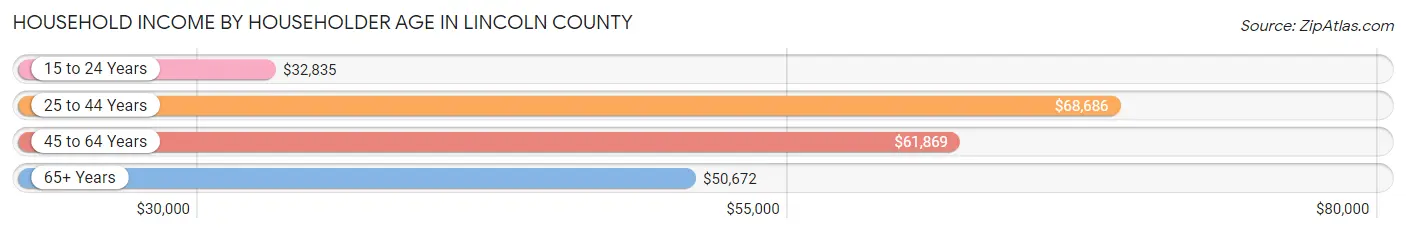
Household Income by Householder Age in Lincoln County
The median household income in Lincoln County is $57,794, with the highest median household income of $68,686 found in the 25 to 44 years age bracket for the primary householder. A total of 4,626 households (20.6%) fall into this category. Meanwhile, the 15 to 24 years age bracket for the primary householder has the lowest median household income of $32,835, with 429 households (1.9%) in this group.
| Income Bracket | # Households | Median Income |
| 15 to 24 Years | 429 (1.9%) | $32,835 |
| 25 to 44 Years | 4,626 (20.6%) | $68,686 |
| 45 to 64 Years | 7,606 (33.8%) | $61,869 |
| 65+ Years | 9,822 (43.7%) | $50,672 |
| Total | 22,483 (100.0%) | $57,794 |
Poverty in Lincoln County
Income Below Poverty by Sex and Age in Lincoln County
With 13.4% poverty level for males and 16.0% for females among the residents of Lincoln County, under 5 year old males and 5 year old females are the most vulnerable to poverty, with 278 males (27.9%) and 86 females (30.1%) in their respective age groups living below the poverty level.
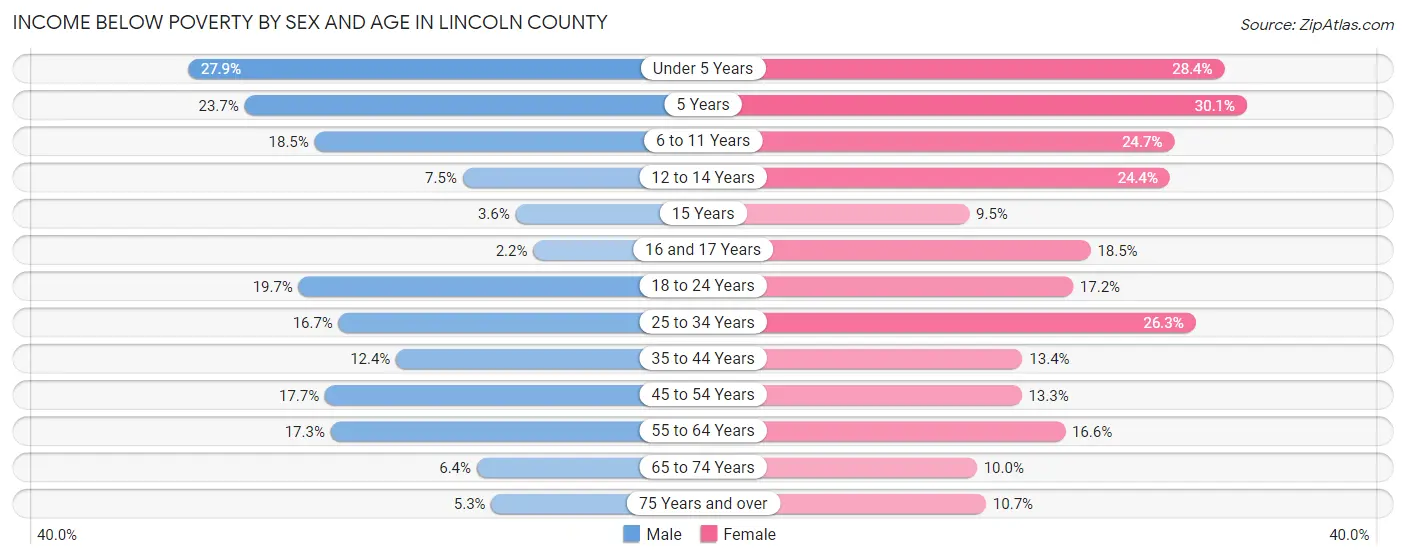
| Age Bracket | Male | Female |
| Under 5 Years | 278 (27.9%) | 232 (28.4%) |
| 5 Years | 40 (23.7%) | 86 (30.1%) |
| 6 to 11 Years | 292 (18.5%) | 311 (24.7%) |
| 12 to 14 Years | 47 (7.5%) | 188 (24.3%) |
| 15 Years | 7 (3.5%) | 19 (9.5%) |
| 16 and 17 Years | 12 (2.2%) | 84 (18.5%) |
| 18 to 24 Years | 294 (19.7%) | 245 (17.2%) |
| 25 to 34 Years | 357 (16.7%) | 629 (26.3%) |
| 35 to 44 Years | 335 (12.4%) | 369 (13.4%) |
| 45 to 54 Years | 445 (17.7%) | 371 (13.3%) |
| 55 to 64 Years | 651 (17.3%) | 761 (16.6%) |
| 65 to 74 Years | 296 (6.4%) | 517 (10.0%) |
| 75 Years and over | 135 (5.3%) | 314 (10.7%) |
| Total | 3,189 (13.4%) | 4,126 (16.0%) |
Income Above Poverty by Sex and Age in Lincoln County
According to the poverty statistics in Lincoln County, males aged 16 and 17 years and females aged 15 years are the age groups that are most secure financially, with 97.8% of males and 90.5% of females in these age groups living above the poverty line.
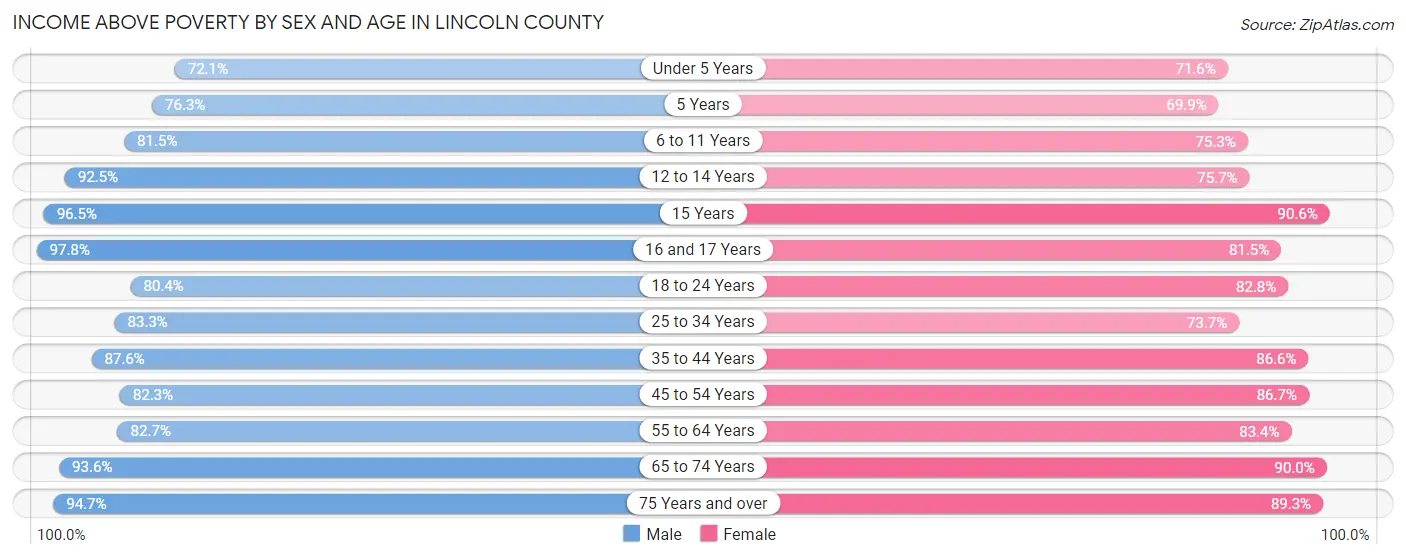
| Age Bracket | Male | Female |
| Under 5 Years | 719 (72.1%) | 585 (71.6%) |
| 5 Years | 129 (76.3%) | 200 (69.9%) |
| 6 to 11 Years | 1,289 (81.5%) | 949 (75.3%) |
| 12 to 14 Years | 582 (92.5%) | 584 (75.6%) |
| 15 Years | 190 (96.5%) | 182 (90.5%) |
| 16 and 17 Years | 526 (97.8%) | 371 (81.5%) |
| 18 to 24 Years | 1,202 (80.3%) | 1,183 (82.8%) |
| 25 to 34 Years | 1,783 (83.3%) | 1,766 (73.7%) |
| 35 to 44 Years | 2,365 (87.6%) | 2,383 (86.6%) |
| 45 to 54 Years | 2,070 (82.3%) | 2,411 (86.7%) |
| 55 to 64 Years | 3,118 (82.7%) | 3,831 (83.4%) |
| 65 to 74 Years | 4,317 (93.6%) | 4,643 (90.0%) |
| 75 Years and over | 2,392 (94.7%) | 2,621 (89.3%) |
| Total | 20,682 (86.6%) | 21,709 (84.0%) |
Income Below Poverty Among Married-Couple Families in Lincoln County
The poverty statistics for married-couple families in Lincoln County show that 5.4% or 525 of the total 9,707 families live below the poverty line. Families with 5 or more children have the highest poverty rate of 13.3%, comprising of 2 families. On the other hand, families with no children have the lowest poverty rate of 4.8%, which includes 363 families.
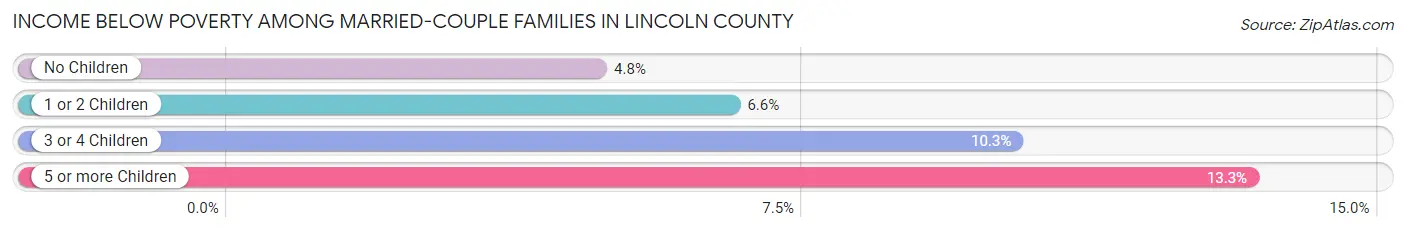
| Children | Above Poverty | Below Poverty |
| No Children | 7,165 (95.2%) | 363 (4.8%) |
| 1 or 2 Children | 1,566 (93.4%) | 110 (6.6%) |
| 3 or 4 Children | 438 (89.7%) | 50 (10.2%) |
| 5 or more Children | 13 (86.7%) | 2 (13.3%) |
| Total | 9,182 (94.6%) | 525 (5.4%) |
Income Below Poverty Among Single-Parent Households in Lincoln County
According to the poverty data in Lincoln County, 11.4% or 103 single-father households and 27.0% or 657 single-mother households are living below the poverty line. Among single-father households, those with 3 or 4 children have the highest poverty rate, with 24 households (40.7%) experiencing poverty. Likewise, among single-mother households, those with 5 or more children have the highest poverty rate, with 66 households (100.0%) falling below the poverty line.
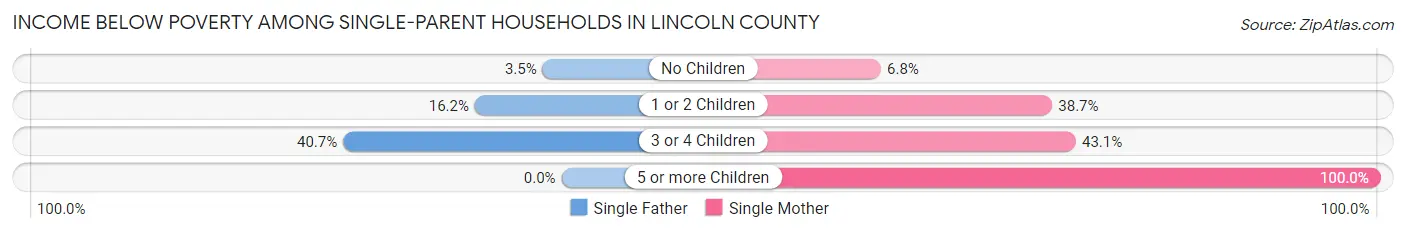
| Children | Single Father | Single Mother |
| No Children | 16 (3.5%) | 70 (6.8%) |
| 1 or 2 Children | 63 (16.2%) | 468 (38.7%) |
| 3 or 4 Children | 24 (40.7%) | 53 (43.1%) |
| 5 or more Children | 0 (0.0%) | 66 (100.0%) |
| Total | 103 (11.4%) | 657 (27.0%) |
Income Below Poverty Among Married-Couple vs Single-Parent Households in Lincoln County
The poverty data for Lincoln County shows that 525 of the married-couple family households (5.4%) and 760 of the single-parent households (22.8%) are living below the poverty level. Within the married-couple family households, those with 5 or more children have the highest poverty rate, with 2 households (13.3%) falling below the poverty line. Among the single-parent households, those with 5 or more children have the highest poverty rate, with 66 household (100.0%) living below poverty.
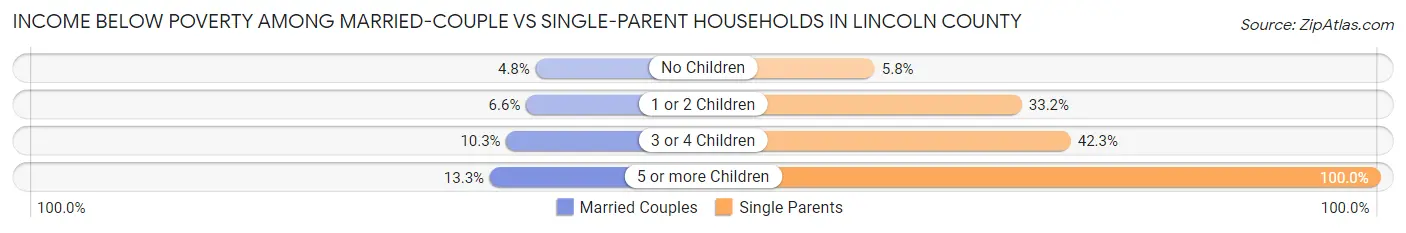
| Children | Married-Couple Families | Single-Parent Households |
| No Children | 363 (4.8%) | 86 (5.8%) |
| 1 or 2 Children | 110 (6.6%) | 531 (33.2%) |
| 3 or 4 Children | 50 (10.2%) | 77 (42.3%) |
| 5 or more Children | 2 (13.3%) | 66 (100.0%) |
| Total | 525 (5.4%) | 760 (22.8%) |
Employment Characteristics in Lincoln County
Employment by Class of Employer in Lincoln County
Among the 19,621 employed individuals in Lincoln County, private company employees (12,042 | 61.4%), self-employed (not incorporated) (1,780 | 9.1%), and local government employees (1,762 | 9.0%) make up the most common classes of employment.
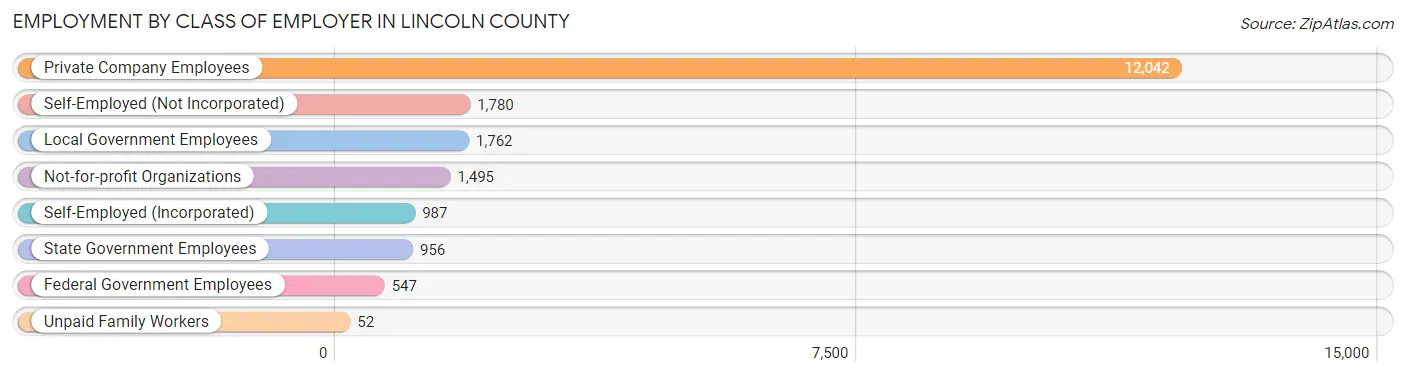
| Employer Class | # Employees | % Employees |
| Private Company Employees | 12,042 | 61.4% |
| Self-Employed (Incorporated) | 987 | 5.0% |
| Self-Employed (Not Incorporated) | 1,780 | 9.1% |
| Not-for-profit Organizations | 1,495 | 7.6% |
| Local Government Employees | 1,762 | 9.0% |
| State Government Employees | 956 | 4.9% |
| Federal Government Employees | 547 | 2.8% |
| Unpaid Family Workers | 52 | 0.3% |
| Total | 19,621 | 100.0% |
Employment Status by Age in Lincoln County
According to the labor force statistics for Lincoln County, out of the total population over 16 years of age (43,260), 50.4% or 21,803 individuals are in the labor force, with 7.7% or 1,679 of them unemployed. The age group with the highest labor force participation rate is 35 to 44 years, with 81.0% or 4,445 individuals in the labor force. Within the labor force, the 16 to 19 years age range has the highest percentage of unemployed individuals, with 15.6% or 143 of them being unemployed.
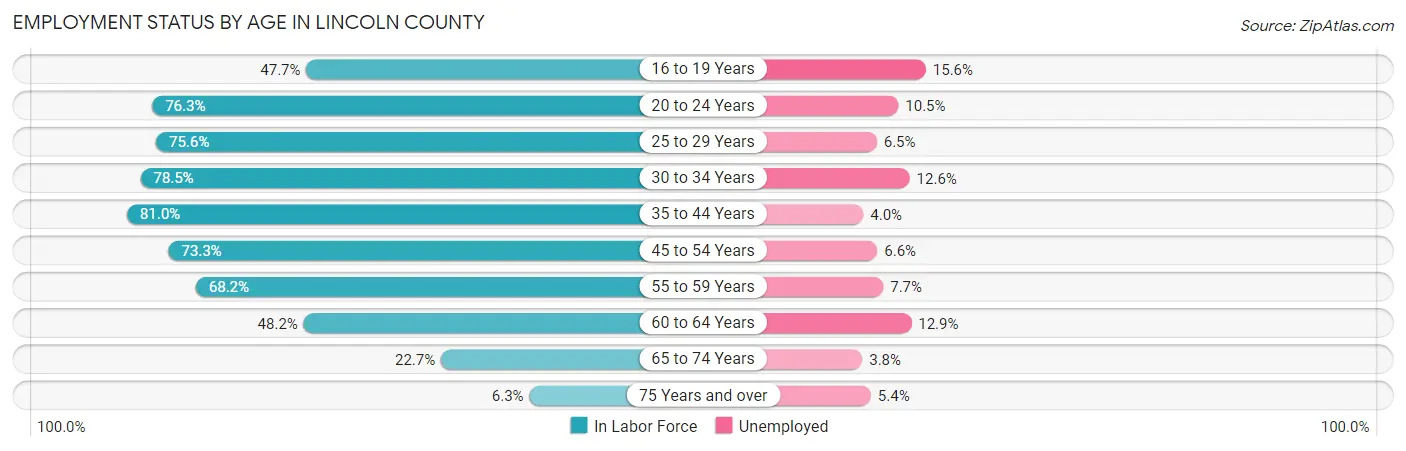
| Age Bracket | In Labor Force | Unemployed |
| 16 to 19 Years | 915 (47.7%) | 143 (15.6%) |
| 20 to 24 Years | 1,647 (76.3%) | 173 (10.5%) |
| 25 to 29 Years | 1,584 (75.6%) | 103 (6.5%) |
| 30 to 34 Years | 1,958 (78.5%) | 247 (12.6%) |
| 35 to 44 Years | 4,445 (81.0%) | 178 (4.0%) |
| 45 to 54 Years | 3,921 (73.3%) | 259 (6.6%) |
| 55 to 59 Years | 2,446 (68.2%) | 188 (7.7%) |
| 60 to 64 Years | 2,313 (48.2%) | 298 (12.9%) |
| 65 to 74 Years | 2,233 (22.7%) | 85 (3.8%) |
| 75 Years and over | 349 (6.3%) | 19 (5.4%) |
| Total | 21,803 (50.4%) | 1,679 (7.7%) |
Employment Status by Educational Attainment in Lincoln County
According to labor force statistics for Lincoln County, 70.0% of individuals (16,668) out of the total population between 25 and 64 years of age (23,811) are in the labor force, with 7.6% or 1,267 of them being unemployed. The group with the highest labor force participation rate are those with the educational attainment of bachelor's degree or higher, with 81.9% or 4,964 individuals in the labor force. Within the labor force, individuals with less than high school education have the highest percentage of unemployment, with 10.9% or 134 of them being unemployed.
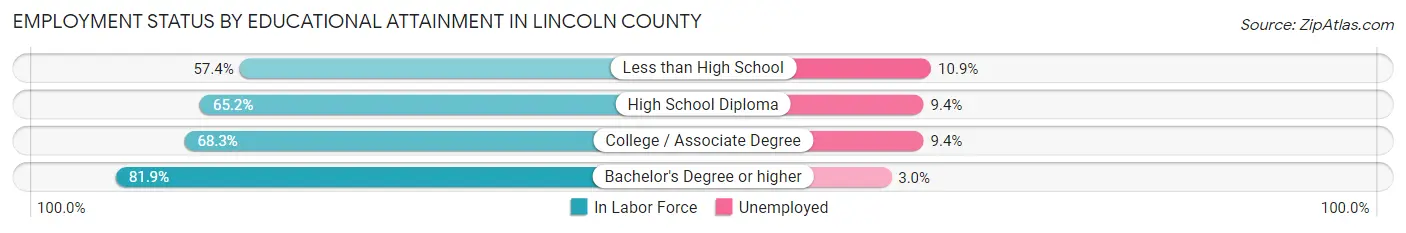
| Educational Attainment | In Labor Force | Unemployed |
| Less than High School | 1,233 (57.4%) | 234 (10.9%) |
| High School Diploma | 3,990 (65.2%) | 575 (9.4%) |
| College / Associate Degree | 6,476 (68.3%) | 891 (9.4%) |
| Bachelor's Degree or higher | 4,964 (81.9%) | 182 (3.0%) |
| Total | 16,668 (70.0%) | 1,810 (7.6%) |
Employment Occupations by Sex in Lincoln County
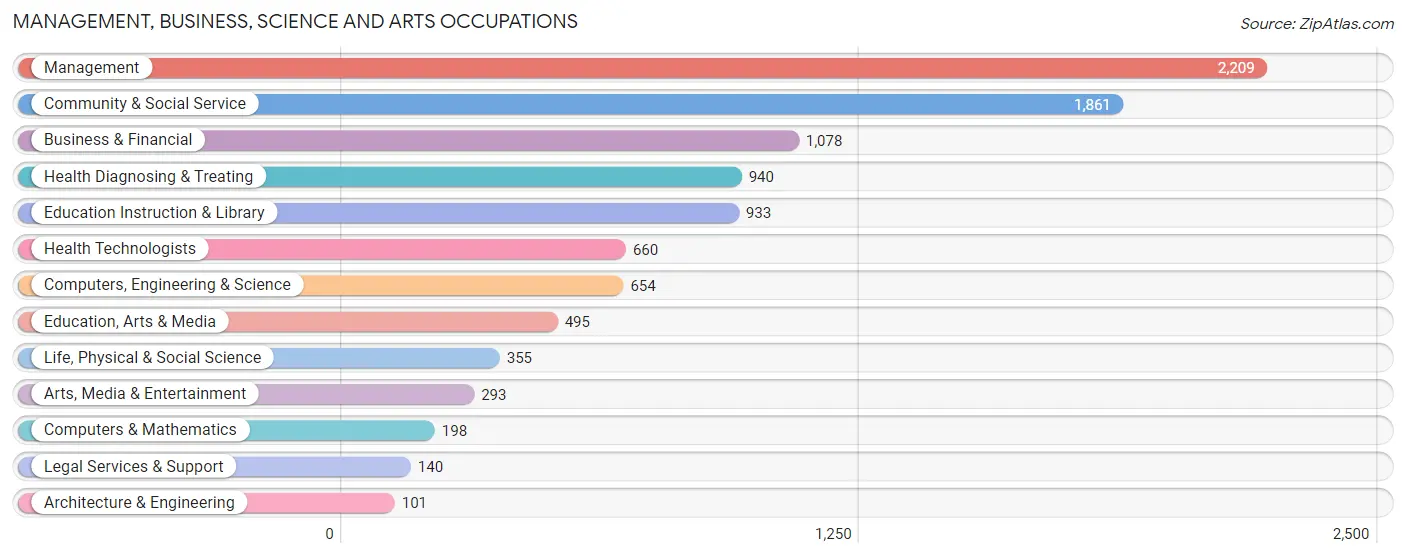
Management, Business, Science and Arts Occupations
The most common Management, Business, Science and Arts occupations in Lincoln County are Management (2,209 | 11.0%), Community & Social Service (1,861 | 9.3%), Business & Financial (1,078 | 5.4%), Health Diagnosing & Treating (940 | 4.7%), and Education Instruction & Library (933 | 4.6%).
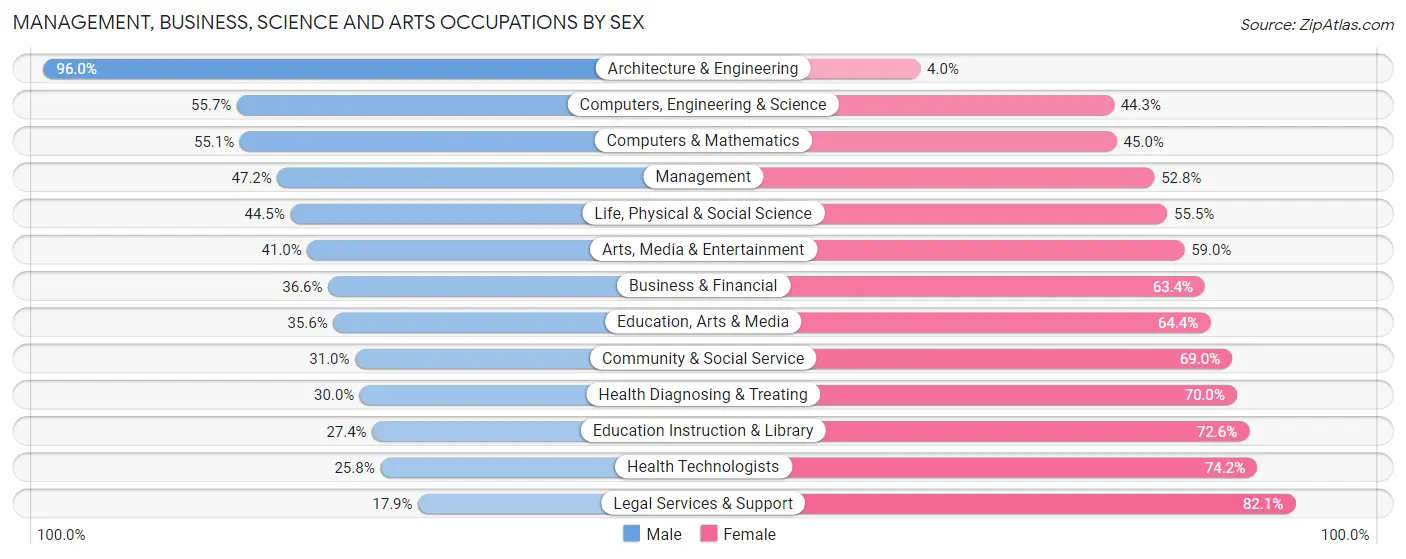
Management, Business, Science and Arts Occupations by Sex
Within the Management, Business, Science and Arts occupations in Lincoln County, the most male-oriented occupations are Architecture & Engineering (96.0%), Computers, Engineering & Science (55.7%), and Computers & Mathematics (55.0%), while the most female-oriented occupations are Legal Services & Support (82.1%), Health Technologists (74.2%), and Education Instruction & Library (72.6%).
| Occupation | Male | Female |
| Management | 1,043 (47.2%) | 1,166 (52.8%) |
| Business & Financial | 395 (36.6%) | 683 (63.4%) |
| Computers, Engineering & Science | 364 (55.7%) | 290 (44.3%) |
| Computers & Mathematics | 109 (55.0%) | 89 (45.0%) |
| Architecture & Engineering | 97 (96.0%) | 4 (4.0%) |
| Life, Physical & Social Science | 158 (44.5%) | 197 (55.5%) |
| Community & Social Service | 577 (31.0%) | 1,284 (69.0%) |
| Education, Arts & Media | 176 (35.6%) | 319 (64.4%) |
| Legal Services & Support | 25 (17.9%) | 115 (82.1%) |
| Education Instruction & Library | 256 (27.4%) | 677 (72.6%) |
| Arts, Media & Entertainment | 120 (41.0%) | 173 (59.0%) |
| Health Diagnosing & Treating | 282 (30.0%) | 658 (70.0%) |
| Health Technologists | 170 (25.8%) | 490 (74.2%) |
| Total (Category) | 2,661 (39.5%) | 4,081 (60.5%) |
| Total (Overall) | 9,991 (49.7%) | 10,116 (50.3%) |
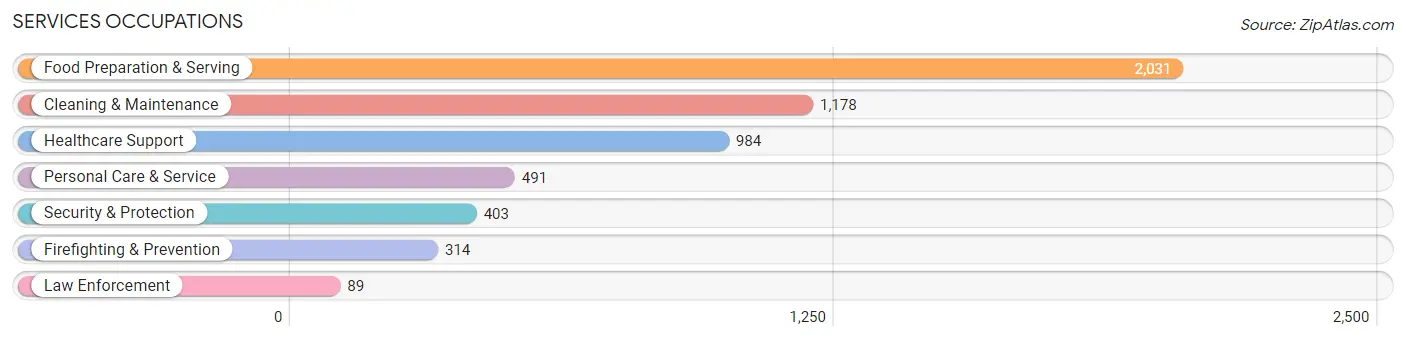
Services Occupations
The most common Services occupations in Lincoln County are Food Preparation & Serving (2,031 | 10.1%), Cleaning & Maintenance (1,178 | 5.9%), Healthcare Support (984 | 4.9%), Personal Care & Service (491 | 2.4%), and Security & Protection (403 | 2.0%).
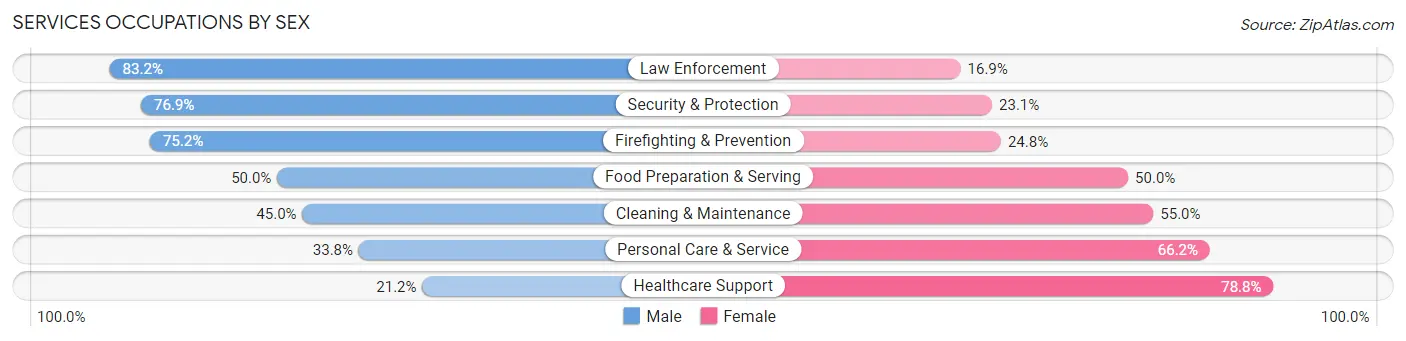
Services Occupations by Sex
Within the Services occupations in Lincoln County, the most male-oriented occupations are Law Enforcement (83.2%), Security & Protection (76.9%), and Firefighting & Prevention (75.2%), while the most female-oriented occupations are Healthcare Support (78.8%), Personal Care & Service (66.2%), and Cleaning & Maintenance (55.0%).
| Occupation | Male | Female |
| Healthcare Support | 209 (21.2%) | 775 (78.8%) |
| Security & Protection | 310 (76.9%) | 93 (23.1%) |
| Firefighting & Prevention | 236 (75.2%) | 78 (24.8%) |
| Law Enforcement | 74 (83.2%) | 15 (16.9%) |
| Food Preparation & Serving | 1,015 (50.0%) | 1,016 (50.0%) |
| Cleaning & Maintenance | 530 (45.0%) | 648 (55.0%) |
| Personal Care & Service | 166 (33.8%) | 325 (66.2%) |
| Total (Category) | 2,230 (43.8%) | 2,857 (56.2%) |
| Total (Overall) | 9,991 (49.7%) | 10,116 (50.3%) |
Sales and Office Occupations
The most common Sales and Office occupations in Lincoln County are Sales & Related (2,251 | 11.2%), and Office & Administration (1,876 | 9.3%).
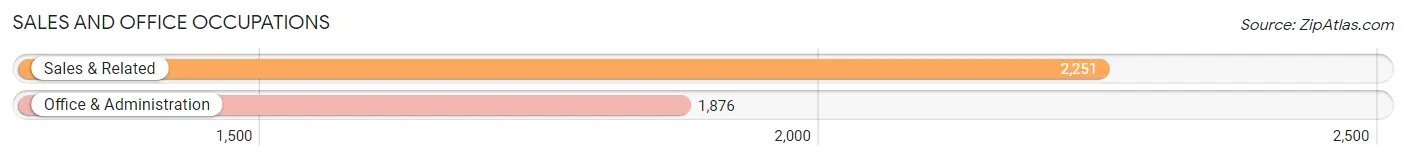
Sales and Office Occupations by Sex
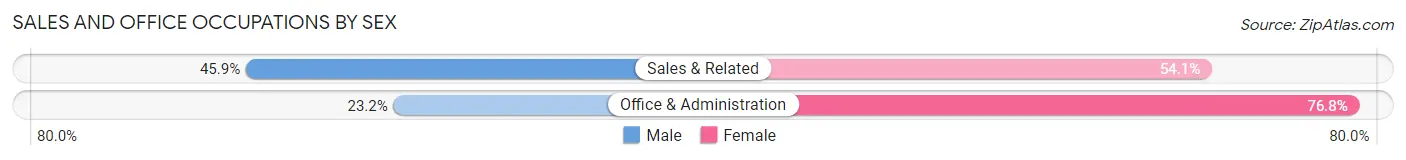
| Occupation | Male | Female |
| Sales & Related | 1,034 (45.9%) | 1,217 (54.1%) |
| Office & Administration | 436 (23.2%) | 1,440 (76.8%) |
| Total (Category) | 1,470 (35.6%) | 2,657 (64.4%) |
| Total (Overall) | 9,991 (49.7%) | 10,116 (50.3%) |
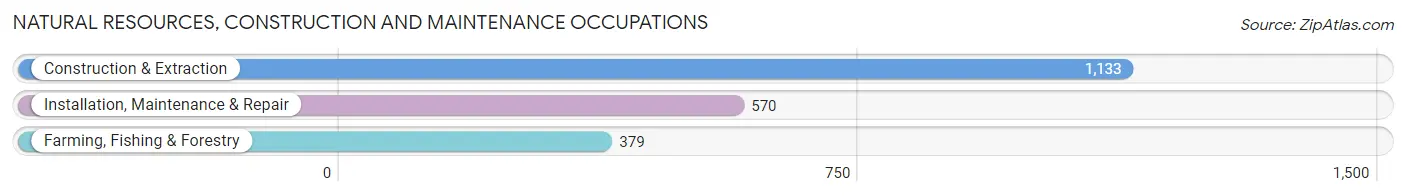
Natural Resources, Construction and Maintenance Occupations
The most common Natural Resources, Construction and Maintenance occupations in Lincoln County are Construction & Extraction (1,133 | 5.6%), Installation, Maintenance & Repair (570 | 2.8%), and Farming, Fishing & Forestry (379 | 1.9%).
Natural Resources, Construction and Maintenance Occupations by Sex
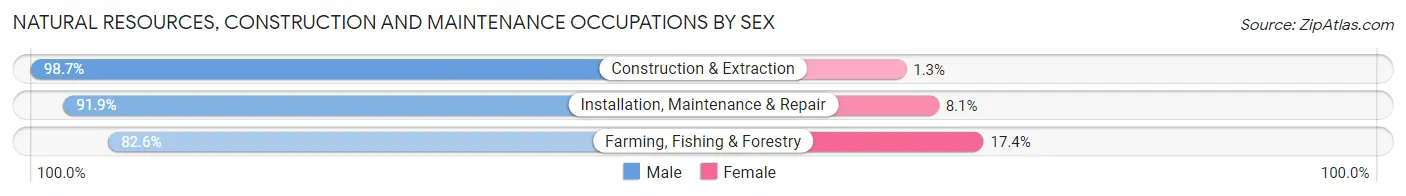
| Occupation | Male | Female |
| Farming, Fishing & Forestry | 313 (82.6%) | 66 (17.4%) |
| Construction & Extraction | 1,118 (98.7%) | 15 (1.3%) |
| Installation, Maintenance & Repair | 524 (91.9%) | 46 (8.1%) |
| Total (Category) | 1,955 (93.9%) | 127 (6.1%) |
| Total (Overall) | 9,991 (49.7%) | 10,116 (50.3%) |
Production, Transportation and Moving Occupations
The most common Production, Transportation and Moving occupations in Lincoln County are Production (934 | 4.6%), Transportation (642 | 3.2%), and Material Moving (493 | 2.5%).

Production, Transportation and Moving Occupations by Sex
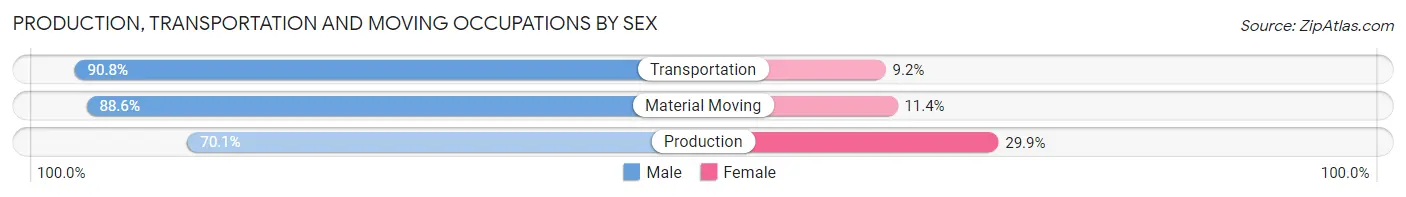
| Occupation | Male | Female |
| Production | 655 (70.1%) | 279 (29.9%) |
| Transportation | 583 (90.8%) | 59 (9.2%) |
| Material Moving | 437 (88.6%) | 56 (11.4%) |
| Total (Category) | 1,675 (81.0%) | 394 (19.0%) |
| Total (Overall) | 9,991 (49.7%) | 10,116 (50.3%) |
Employment Industries by Sex in Lincoln County
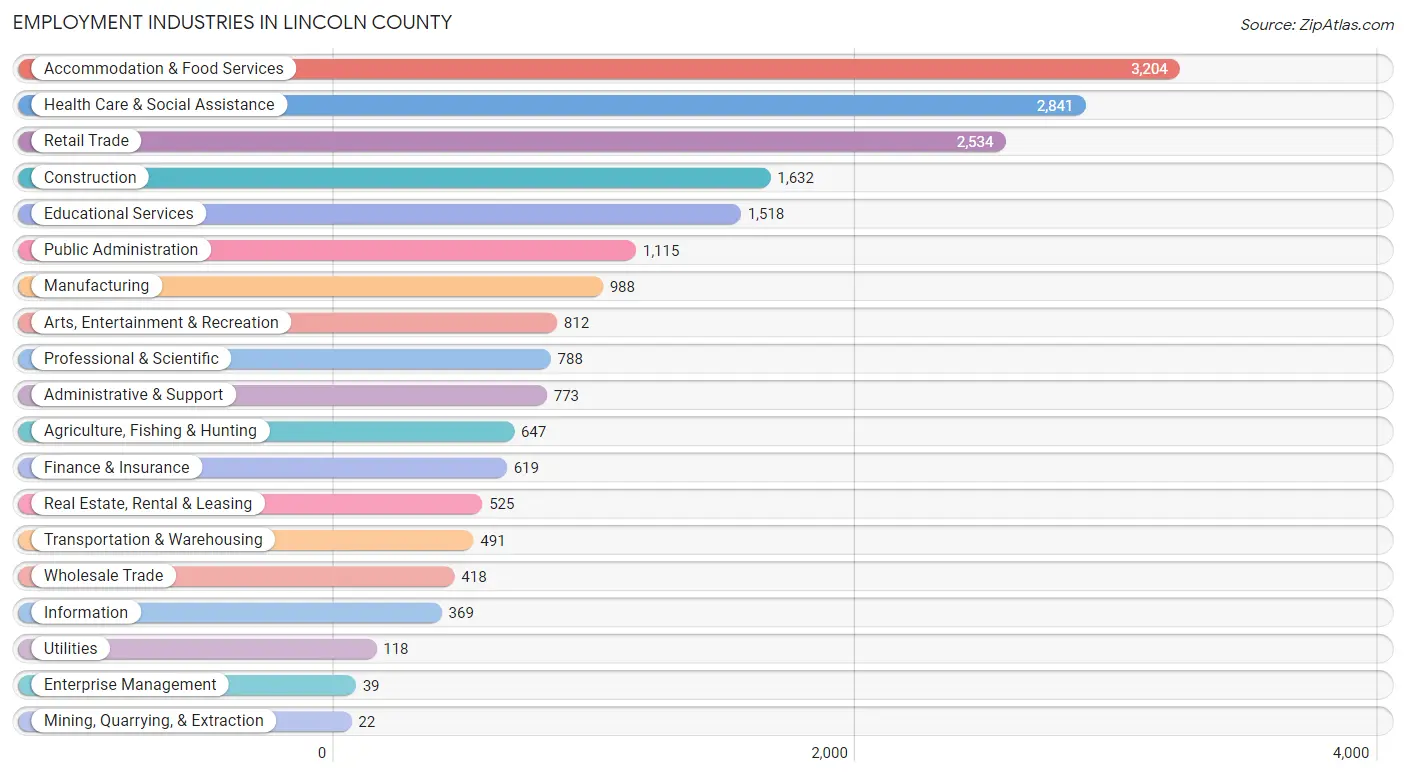
Employment Industries in Lincoln County
The major employment industries in Lincoln County include Accommodation & Food Services (3,204 | 15.9%), Health Care & Social Assistance (2,841 | 14.1%), Retail Trade (2,534 | 12.6%), Construction (1,632 | 8.1%), and Educational Services (1,518 | 7.5%).
Employment Industries by Sex in Lincoln County
The Lincoln County industries that see more men than women are Mining, Quarrying, & Extraction (100.0%), Construction (88.8%), and Agriculture, Fishing & Hunting (83.8%), whereas the industries that tend to have a higher number of women are Health Care & Social Assistance (77.6%), Finance & Insurance (75.8%), and Educational Services (70.2%).
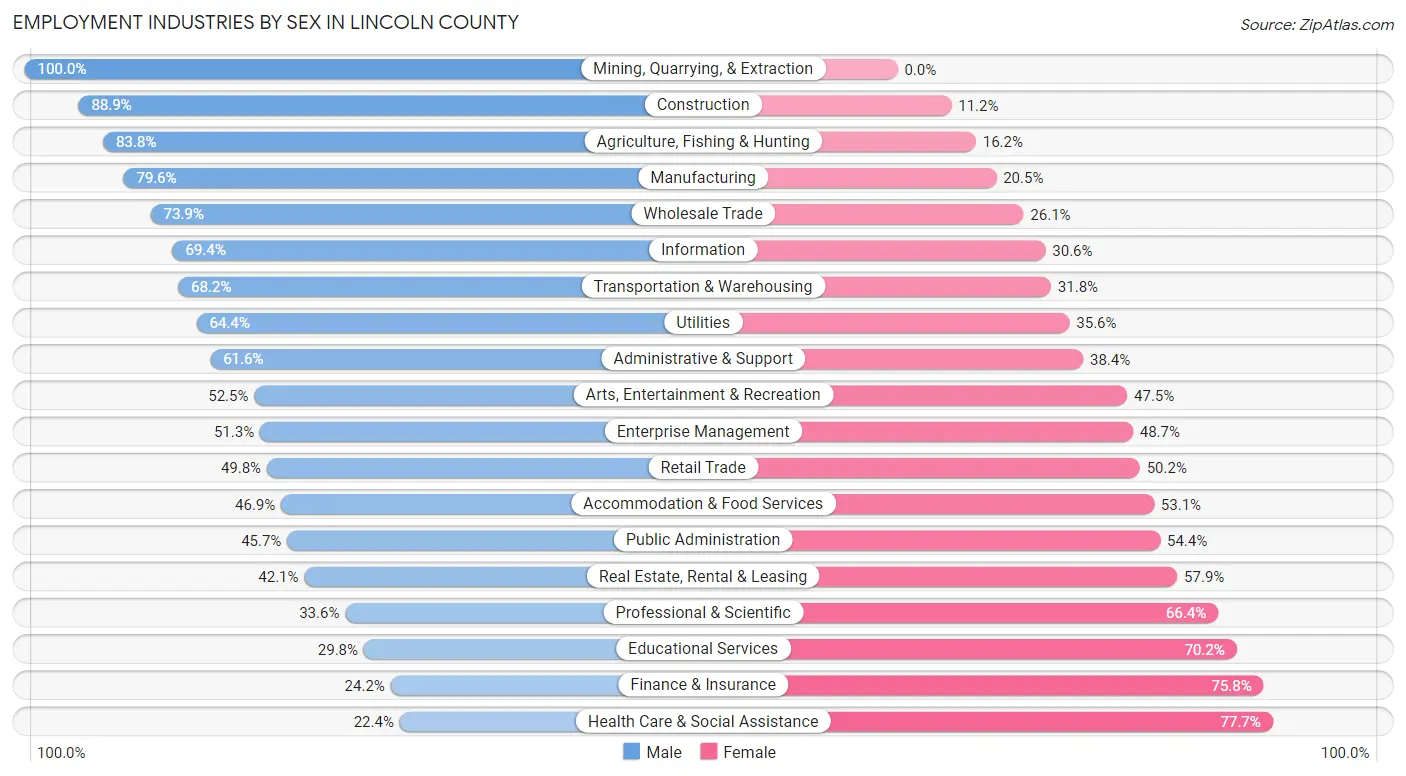
| Industry | Male | Female |
| Agriculture, Fishing & Hunting | 542 (83.8%) | 105 (16.2%) |
| Mining, Quarrying, & Extraction | 22 (100.0%) | 0 (0.0%) |
| Construction | 1,450 (88.8%) | 182 (11.2%) |
| Manufacturing | 786 (79.5%) | 202 (20.4%) |
| Wholesale Trade | 309 (73.9%) | 109 (26.1%) |
| Retail Trade | 1,263 (49.8%) | 1,271 (50.2%) |
| Transportation & Warehousing | 335 (68.2%) | 156 (31.8%) |
| Utilities | 76 (64.4%) | 42 (35.6%) |
| Information | 256 (69.4%) | 113 (30.6%) |
| Finance & Insurance | 150 (24.2%) | 469 (75.8%) |
| Real Estate, Rental & Leasing | 221 (42.1%) | 304 (57.9%) |
| Professional & Scientific | 265 (33.6%) | 523 (66.4%) |
| Enterprise Management | 20 (51.3%) | 19 (48.7%) |
| Administrative & Support | 476 (61.6%) | 297 (38.4%) |
| Educational Services | 452 (29.8%) | 1,066 (70.2%) |
| Health Care & Social Assistance | 635 (22.4%) | 2,206 (77.6%) |
| Arts, Entertainment & Recreation | 426 (52.5%) | 386 (47.5%) |
| Accommodation & Food Services | 1,503 (46.9%) | 1,701 (53.1%) |
| Public Administration | 509 (45.7%) | 606 (54.3%) |
| Total | 9,991 (49.7%) | 10,116 (50.3%) |
Education in Lincoln County
School Enrollment in Lincoln County
The most common levels of schooling among the 8,195 students in Lincoln County are high school (2,075 | 25.3%), elementary school (1,931 | 23.6%), and middle school (1,680 | 20.5%).
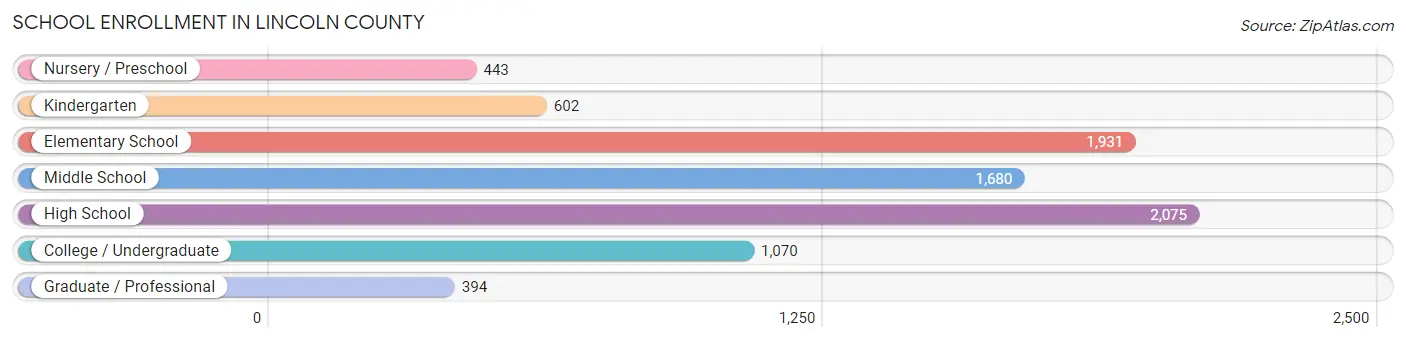
| School Level | # Students | % Students |
| Nursery / Preschool | 443 | 5.4% |
| Kindergarten | 602 | 7.3% |
| Elementary School | 1,931 | 23.6% |
| Middle School | 1,680 | 20.5% |
| High School | 2,075 | 25.3% |
| College / Undergraduate | 1,070 | 13.1% |
| Graduate / Professional | 394 | 4.8% |
| Total | 8,195 | 100.0% |
School Enrollment by Age by Funding Source in Lincoln County
Out of a total of 8,195 students who are enrolled in schools in Lincoln County, 1,221 (14.9%) attend a private institution, while the remaining 6,974 (85.1%) are enrolled in public schools. The age group of 25 to 34 year olds has the highest likelihood of being enrolled in private schools, with 97 (28.9% in the age bracket) enrolled. Conversely, the age group of 18 to 19 year olds has the lowest likelihood of being enrolled in a private school, with 495 (93.2% in the age bracket) attending a public institution.
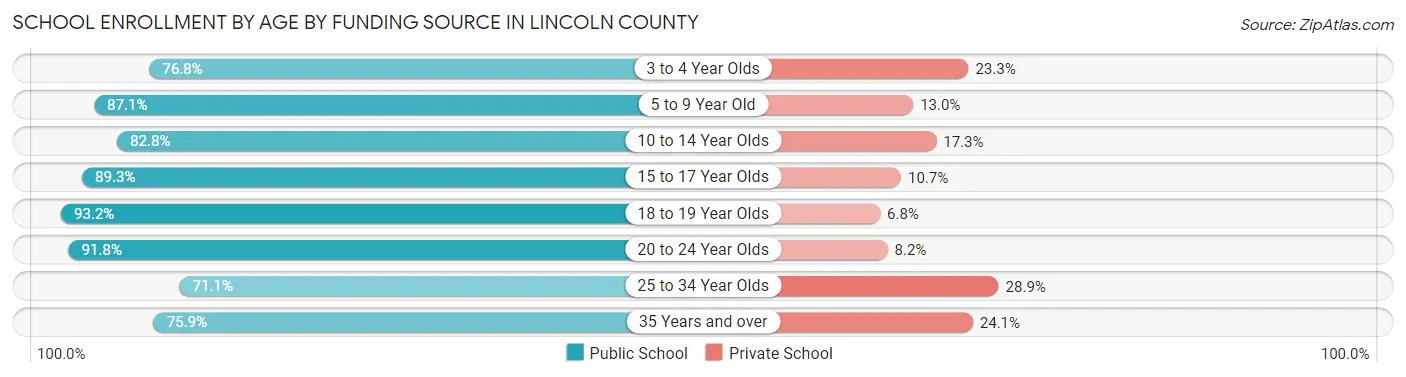
| Age Bracket | Public School | Private School |
| 3 to 4 Year Olds | 274 (76.7%) | 83 (23.3%) |
| 5 to 9 Year Old | 2,064 (87.1%) | 307 (13.0%) |
| 10 to 14 Year Olds | 1,809 (82.8%) | 377 (17.2%) |
| 15 to 17 Year Olds | 1,218 (89.3%) | 146 (10.7%) |
| 18 to 19 Year Olds | 495 (93.2%) | 36 (6.8%) |
| 20 to 24 Year Olds | 449 (91.8%) | 40 (8.2%) |
| 25 to 34 Year Olds | 239 (71.1%) | 97 (28.9%) |
| 35 Years and over | 426 (75.9%) | 135 (24.1%) |
| Total | 6,974 (85.1%) | 1,221 (14.9%) |
Educational Attainment by Field of Study in Lincoln County
Education (1,696 | 13.9%), business (1,532 | 12.6%), science & technology (1,369 | 11.2%), social sciences (1,114 | 9.1%), and bio, nature & agricultural (1,106 | 9.1%) are the most common fields of study among 12,196 individuals in Lincoln County who have obtained a bachelor's degree or higher.
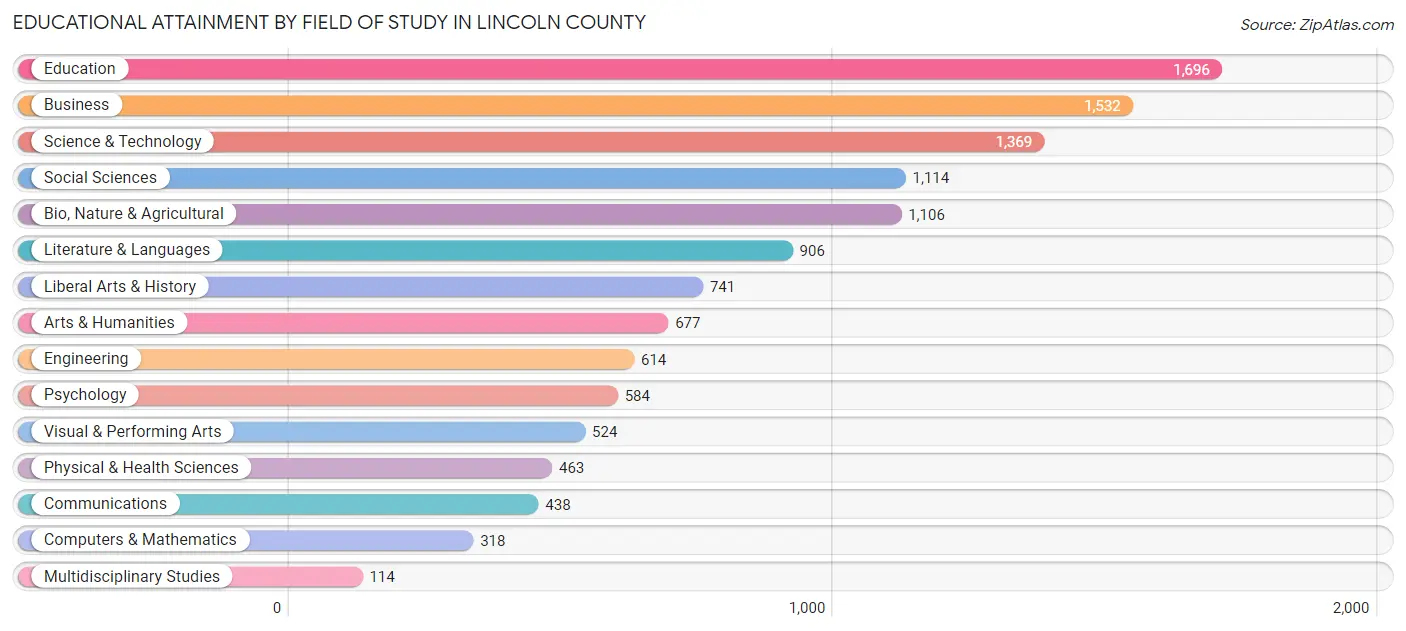
| Field of Study | # Graduates | % Graduates |
| Computers & Mathematics | 318 | 2.6% |
| Bio, Nature & Agricultural | 1,106 | 9.1% |
| Physical & Health Sciences | 463 | 3.8% |
| Psychology | 584 | 4.8% |
| Social Sciences | 1,114 | 9.1% |
| Engineering | 614 | 5.0% |
| Multidisciplinary Studies | 114 | 0.9% |
| Science & Technology | 1,369 | 11.2% |
| Business | 1,532 | 12.6% |
| Education | 1,696 | 13.9% |
| Literature & Languages | 906 | 7.4% |
| Liberal Arts & History | 741 | 6.1% |
| Visual & Performing Arts | 524 | 4.3% |
| Communications | 438 | 3.6% |
| Arts & Humanities | 677 | 5.6% |
| Total | 12,196 | 100.0% |
Transportation & Commute in Lincoln County
Vehicle Availability by Sex in Lincoln County
The most prevalent vehicle ownership categories in Lincoln County are males with 2 vehicles (4,146, accounting for 43.0%) and females with 2 vehicles (3,851, making up 41.9%).
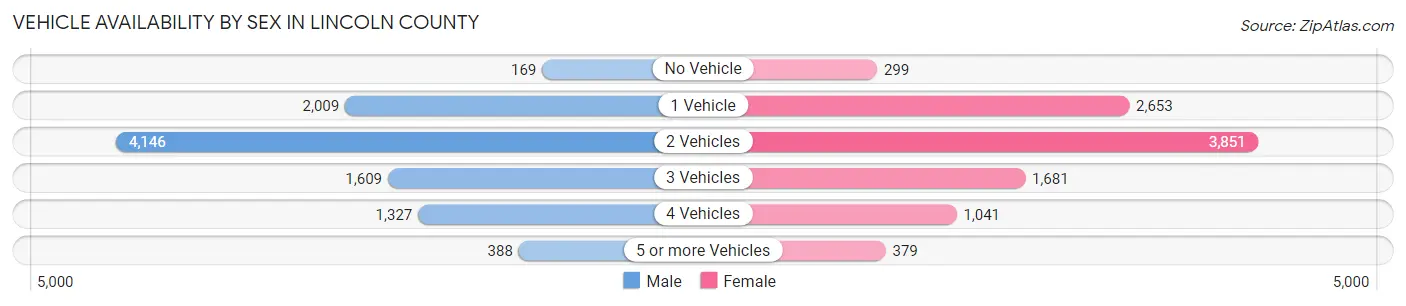
| Vehicles Available | Male | Female |
| No Vehicle | 169 (1.8%) | 299 (3.0%) |
| 1 Vehicle | 2,009 (20.8%) | 2,653 (26.8%) |
| 2 Vehicles | 4,146 (43.0%) | 3,851 (38.9%) |
| 3 Vehicles | 1,609 (16.7%) | 1,681 (17.0%) |
| 4 Vehicles | 1,327 (13.8%) | 1,041 (10.5%) |
| 5 or more Vehicles | 388 (4.0%) | 379 (3.8%) |
| Total | 9,648 (100.0%) | 9,904 (100.0%) |
Commute Time in Lincoln County
The most frequently occuring commute durations in Lincoln County are 5 to 9 minutes (3,413 commuters, 19.7%), 10 to 14 minutes (3,042 commuters, 17.6%), and 15 to 19 minutes (2,567 commuters, 14.8%).
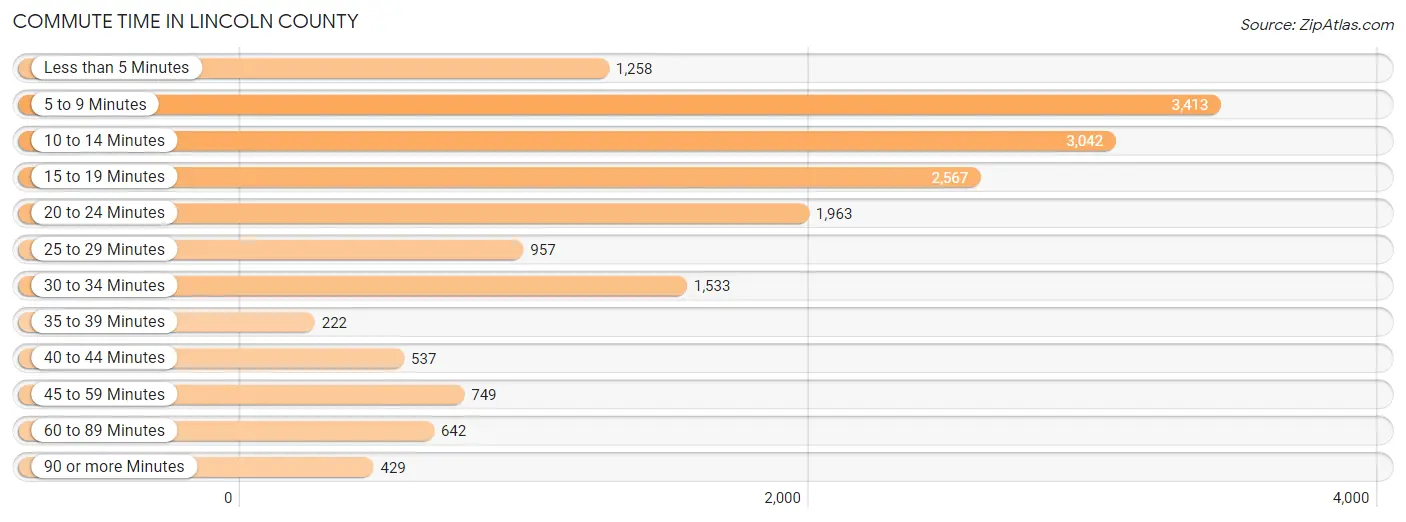
| Commute Time | # Commuters | % Commuters |
| Less than 5 Minutes | 1,258 | 7.3% |
| 5 to 9 Minutes | 3,413 | 19.7% |
| 10 to 14 Minutes | 3,042 | 17.6% |
| 15 to 19 Minutes | 2,567 | 14.8% |
| 20 to 24 Minutes | 1,963 | 11.3% |
| 25 to 29 Minutes | 957 | 5.5% |
| 30 to 34 Minutes | 1,533 | 8.9% |
| 35 to 39 Minutes | 222 | 1.3% |
| 40 to 44 Minutes | 537 | 3.1% |
| 45 to 59 Minutes | 749 | 4.3% |
| 60 to 89 Minutes | 642 | 3.7% |
| 90 or more Minutes | 429 | 2.5% |
Commute Time by Sex in Lincoln County
The most common commute times in Lincoln County are 10 to 14 minutes (1,498 commuters, 17.1%) for males and 5 to 9 minutes (2,014 commuters, 23.6%) for females.
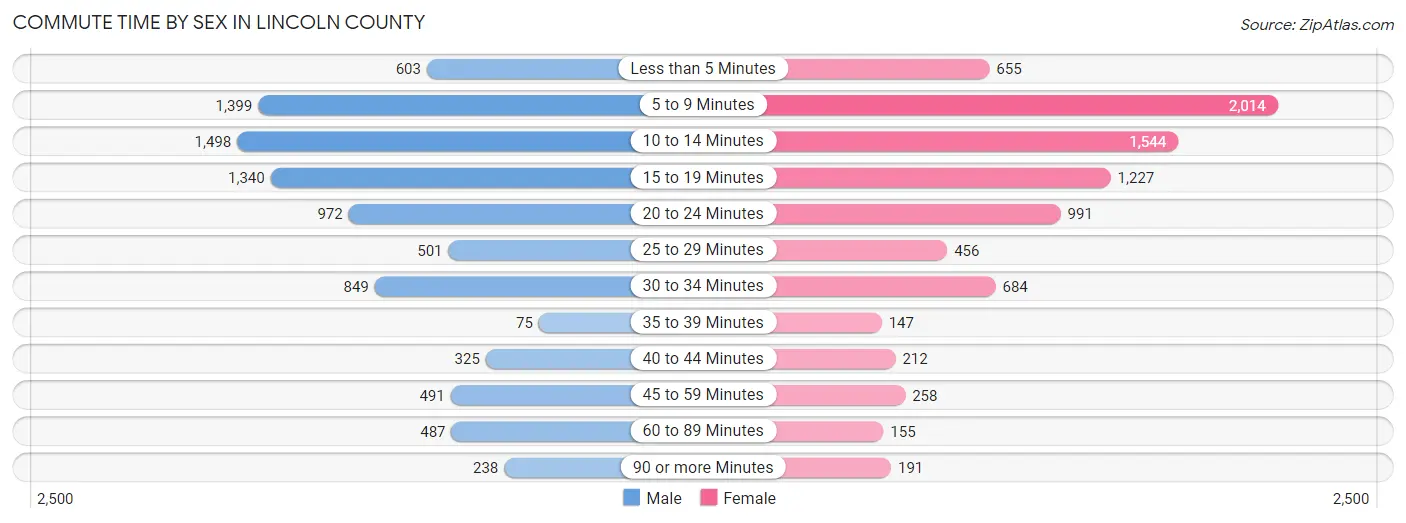
| Commute Time | Male | Female |
| Less than 5 Minutes | 603 (6.9%) | 655 (7.7%) |
| 5 to 9 Minutes | 1,399 (15.9%) | 2,014 (23.6%) |
| 10 to 14 Minutes | 1,498 (17.1%) | 1,544 (18.1%) |
| 15 to 19 Minutes | 1,340 (15.3%) | 1,227 (14.4%) |
| 20 to 24 Minutes | 972 (11.1%) | 991 (11.6%) |
| 25 to 29 Minutes | 501 (5.7%) | 456 (5.3%) |
| 30 to 34 Minutes | 849 (9.7%) | 684 (8.0%) |
| 35 to 39 Minutes | 75 (0.9%) | 147 (1.7%) |
| 40 to 44 Minutes | 325 (3.7%) | 212 (2.5%) |
| 45 to 59 Minutes | 491 (5.6%) | 258 (3.0%) |
| 60 to 89 Minutes | 487 (5.6%) | 155 (1.8%) |
| 90 or more Minutes | 238 (2.7%) | 191 (2.2%) |
Time of Departure to Work by Sex in Lincoln County
The most frequent times of departure to work in Lincoln County are 7:30 AM to 7:59 AM (1,065, 12.1%) for males and 7:30 AM to 7:59 AM (1,263, 14.8%) for females.
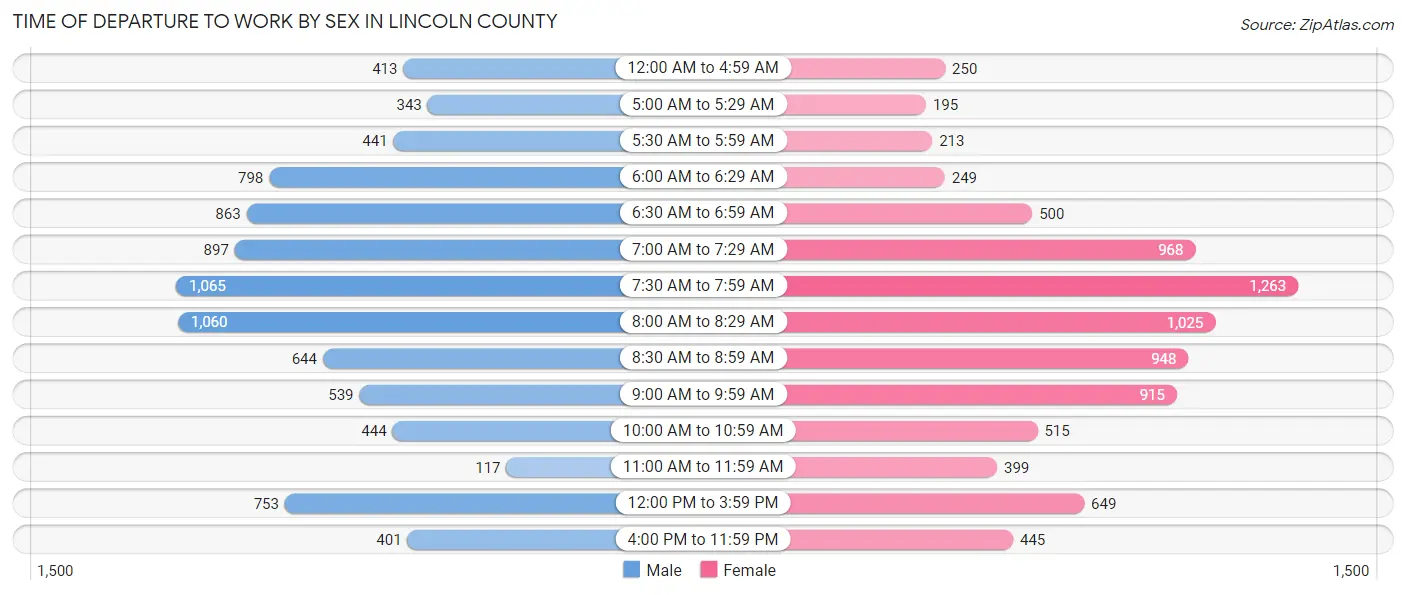
| Time of Departure | Male | Female |
| 12:00 AM to 4:59 AM | 413 (4.7%) | 250 (2.9%) |
| 5:00 AM to 5:29 AM | 343 (3.9%) | 195 (2.3%) |
| 5:30 AM to 5:59 AM | 441 (5.0%) | 213 (2.5%) |
| 6:00 AM to 6:29 AM | 798 (9.1%) | 249 (2.9%) |
| 6:30 AM to 6:59 AM | 863 (9.8%) | 500 (5.9%) |
| 7:00 AM to 7:29 AM | 897 (10.2%) | 968 (11.3%) |
| 7:30 AM to 7:59 AM | 1,065 (12.1%) | 1,263 (14.8%) |
| 8:00 AM to 8:29 AM | 1,060 (12.1%) | 1,025 (12.0%) |
| 8:30 AM to 8:59 AM | 644 (7.3%) | 948 (11.1%) |
| 9:00 AM to 9:59 AM | 539 (6.1%) | 915 (10.7%) |
| 10:00 AM to 10:59 AM | 444 (5.1%) | 515 (6.0%) |
| 11:00 AM to 11:59 AM | 117 (1.3%) | 399 (4.7%) |
| 12:00 PM to 3:59 PM | 753 (8.6%) | 649 (7.6%) |
| 4:00 PM to 11:59 PM | 401 (4.6%) | 445 (5.2%) |
| Total | 8,778 (100.0%) | 8,534 (100.0%) |
Housing Occupancy in Lincoln County
Occupancy by Ownership in Lincoln County
Of the total 22,483 dwellings in Lincoln County, owner-occupied units account for 15,896 (70.7%), while renter-occupied units make up 6,587 (29.3%).
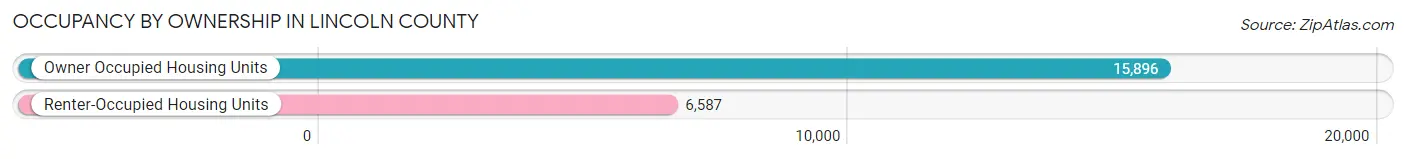
| Occupancy | # Housing Units | % Housing Units |
| Owner Occupied Housing Units | 15,896 | 70.7% |
| Renter-Occupied Housing Units | 6,587 | 29.3% |
| Total Occupied Housing Units | 22,483 | 100.0% |
Occupancy by Household Size in Lincoln County
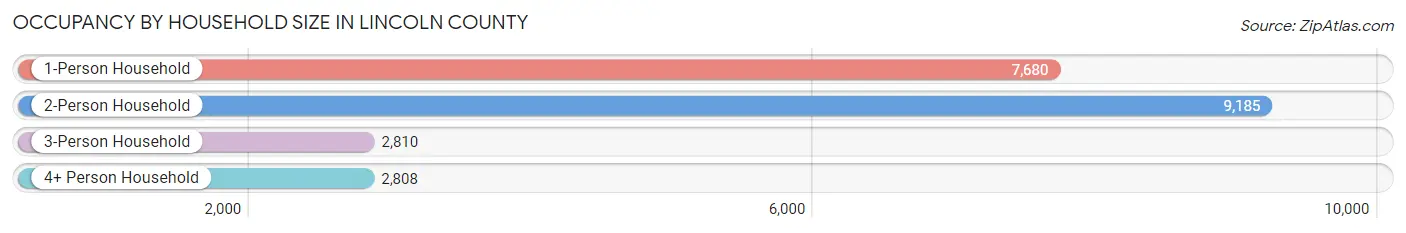
| Household Size | # Housing Units | % Housing Units |
| 1-Person Household | 7,680 | 34.2% |
| 2-Person Household | 9,185 | 40.8% |
| 3-Person Household | 2,810 | 12.5% |
| 4+ Person Household | 2,808 | 12.5% |
| Total Housing Units | 22,483 | 100.0% |
Occupancy by Ownership by Household Size in Lincoln County
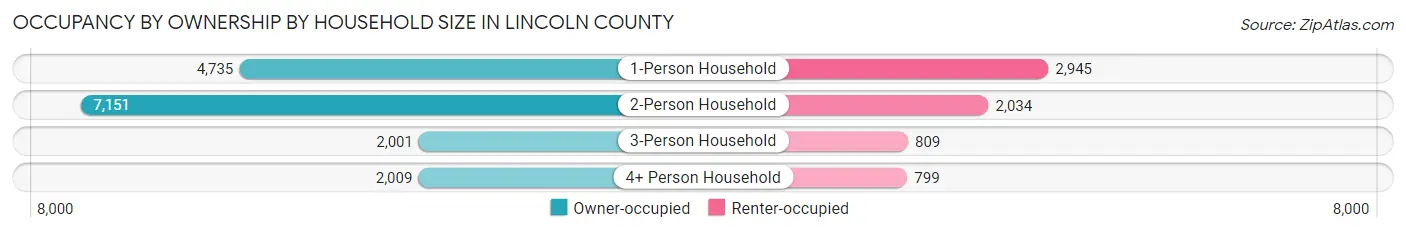
| Household Size | Owner-occupied | Renter-occupied |
| 1-Person Household | 4,735 (61.7%) | 2,945 (38.4%) |
| 2-Person Household | 7,151 (77.9%) | 2,034 (22.1%) |
| 3-Person Household | 2,001 (71.2%) | 809 (28.8%) |
| 4+ Person Household | 2,009 (71.6%) | 799 (28.4%) |
| Total Housing Units | 15,896 (70.7%) | 6,587 (29.3%) |
Occupancy by Educational Attainment in Lincoln County
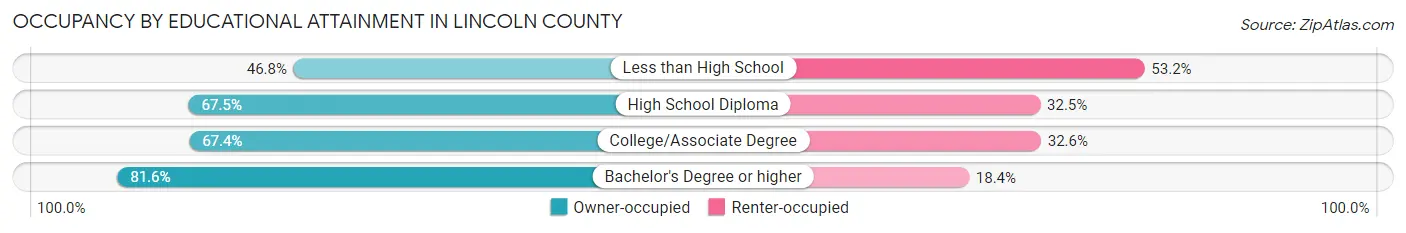
| Household Size | Owner-occupied | Renter-occupied |
| Less than High School | 626 (46.8%) | 711 (53.2%) |
| High School Diploma | 2,964 (67.5%) | 1,427 (32.5%) |
| College/Associate Degree | 6,467 (67.4%) | 3,134 (32.6%) |
| Bachelor's Degree or higher | 5,839 (81.6%) | 1,315 (18.4%) |
Occupancy by Age of Householder in Lincoln County
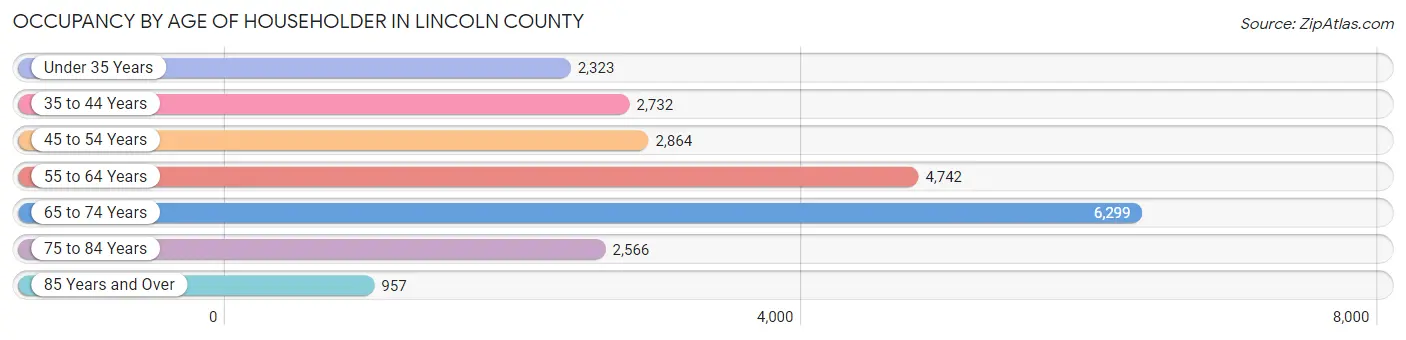
| Age Bracket | # Households | % Households |
| Under 35 Years | 2,323 | 10.3% |
| 35 to 44 Years | 2,732 | 12.1% |
| 45 to 54 Years | 2,864 | 12.7% |
| 55 to 64 Years | 4,742 | 21.1% |
| 65 to 74 Years | 6,299 | 28.0% |
| 75 to 84 Years | 2,566 | 11.4% |
| 85 Years and Over | 957 | 4.3% |
| Total | 22,483 | 100.0% |
Housing Finances in Lincoln County
Median Income by Occupancy in Lincoln County
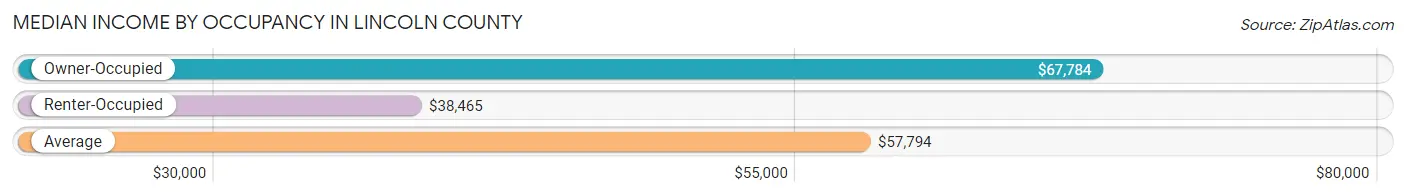
| Occupancy Type | # Households | Median Income |
| Owner-Occupied | 15,896 (70.7%) | $67,784 |
| Renter-Occupied | 6,587 (29.3%) | $38,465 |
| Average | 22,483 (100.0%) | $57,794 |
Occupancy by Householder Income Bracket in Lincoln County
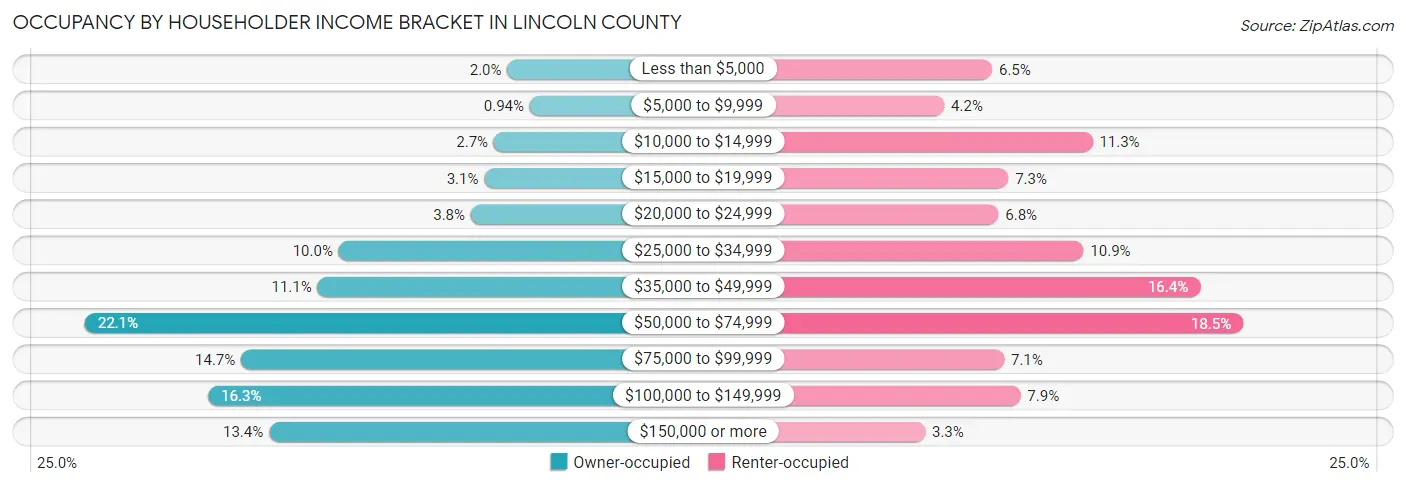
| Income Bracket | Owner-occupied | Renter-occupied |
| Less than $5,000 | 320 (2.0%) | 428 (6.5%) |
| $5,000 to $9,999 | 150 (0.9%) | 278 (4.2%) |
| $10,000 to $14,999 | 421 (2.6%) | 743 (11.3%) |
| $15,000 to $19,999 | 495 (3.1%) | 479 (7.3%) |
| $20,000 to $24,999 | 596 (3.7%) | 448 (6.8%) |
| $25,000 to $34,999 | 1,596 (10.0%) | 715 (10.8%) |
| $35,000 to $49,999 | 1,757 (11.1%) | 1,080 (16.4%) |
| $50,000 to $74,999 | 3,517 (22.1%) | 1,215 (18.4%) |
| $75,000 to $99,999 | 2,335 (14.7%) | 466 (7.1%) |
| $100,000 to $149,999 | 2,585 (16.3%) | 517 (7.9%) |
| $150,000 or more | 2,124 (13.4%) | 218 (3.3%) |
| Total | 15,896 (100.0%) | 6,587 (100.0%) |
Monthly Housing Cost Tiers in Lincoln County
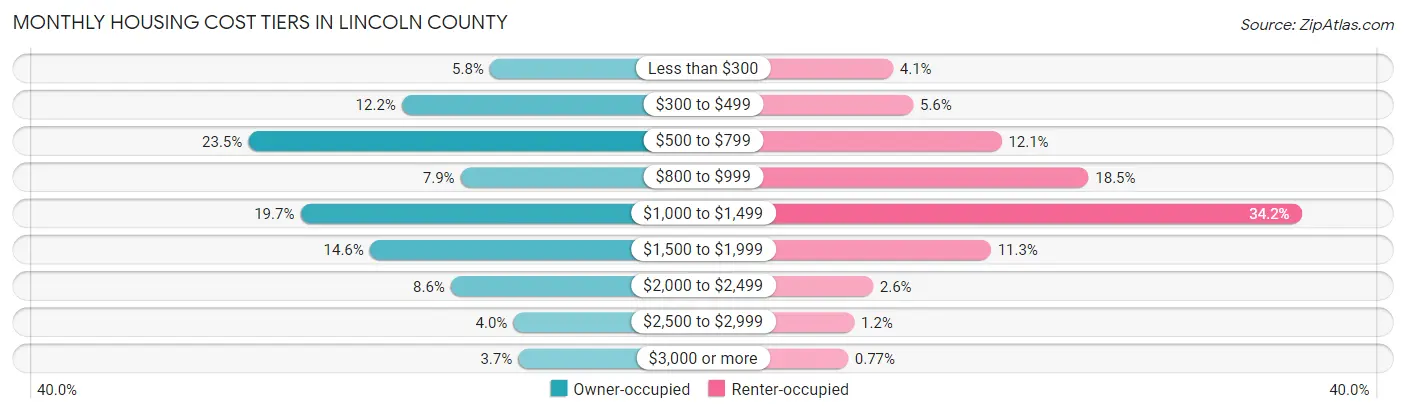
| Monthly Cost | Owner-occupied | Renter-occupied |
| Less than $300 | 914 (5.8%) | 269 (4.1%) |
| $300 to $499 | 1,944 (12.2%) | 367 (5.6%) |
| $500 to $799 | 3,742 (23.5%) | 796 (12.1%) |
| $800 to $999 | 1,256 (7.9%) | 1,217 (18.5%) |
| $1,000 to $1,499 | 3,131 (19.7%) | 2,251 (34.2%) |
| $1,500 to $1,999 | 2,319 (14.6%) | 744 (11.3%) |
| $2,000 to $2,499 | 1,370 (8.6%) | 172 (2.6%) |
| $2,500 to $2,999 | 639 (4.0%) | 81 (1.2%) |
| $3,000 or more | 581 (3.7%) | 51 (0.8%) |
| Total | 15,896 (100.0%) | 6,587 (100.0%) |
Physical Housing Characteristics in Lincoln County
Housing Structures in Lincoln County
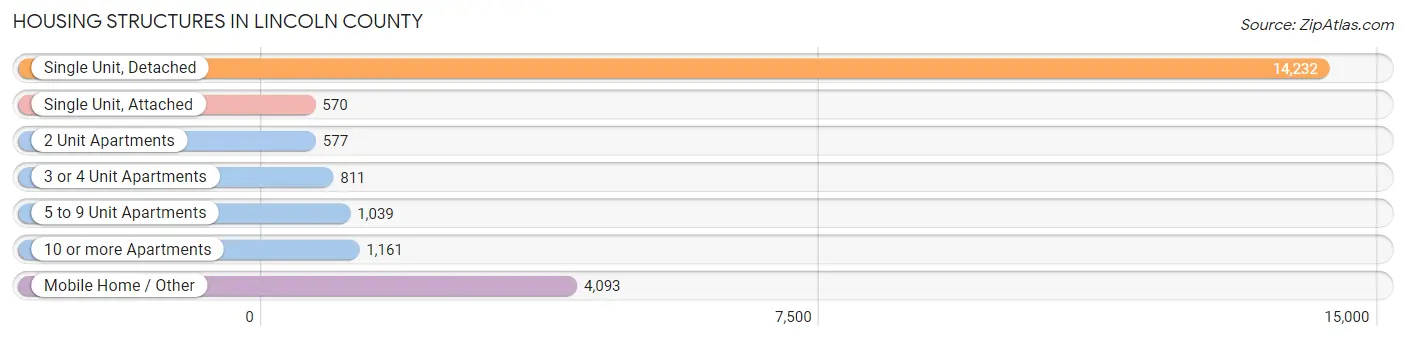
| Structure Type | # Housing Units | % Housing Units |
| Single Unit, Detached | 14,232 | 63.3% |
| Single Unit, Attached | 570 | 2.5% |
| 2 Unit Apartments | 577 | 2.6% |
| 3 or 4 Unit Apartments | 811 | 3.6% |
| 5 to 9 Unit Apartments | 1,039 | 4.6% |
| 10 or more Apartments | 1,161 | 5.2% |
| Mobile Home / Other | 4,093 | 18.2% |
| Total | 22,483 | 100.0% |
Housing Structures by Occupancy in Lincoln County
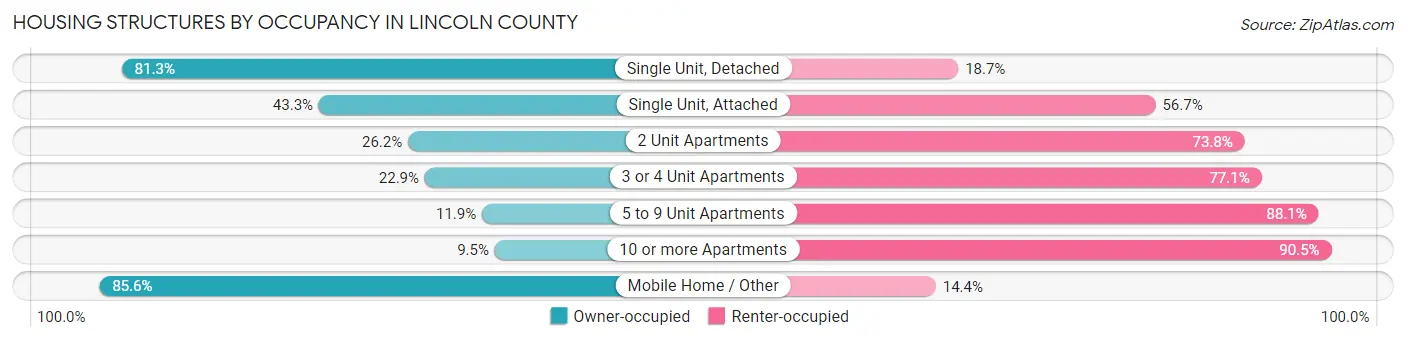
| Structure Type | Owner-occupied | Renter-occupied |
| Single Unit, Detached | 11,573 (81.3%) | 2,659 (18.7%) |
| Single Unit, Attached | 247 (43.3%) | 323 (56.7%) |
| 2 Unit Apartments | 151 (26.2%) | 426 (73.8%) |
| 3 or 4 Unit Apartments | 186 (22.9%) | 625 (77.1%) |
| 5 to 9 Unit Apartments | 124 (11.9%) | 915 (88.1%) |
| 10 or more Apartments | 110 (9.5%) | 1,051 (90.5%) |
| Mobile Home / Other | 3,505 (85.6%) | 588 (14.4%) |
| Total | 15,896 (70.7%) | 6,587 (29.3%) |
Housing Structures by Number of Rooms in Lincoln County
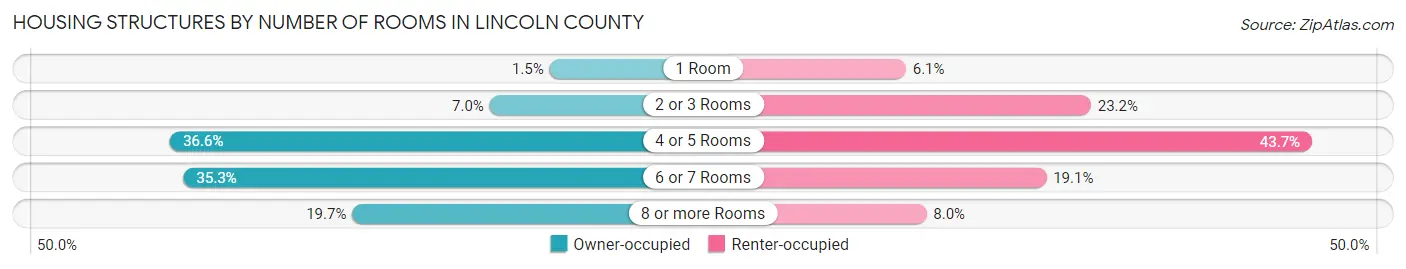
| Number of Rooms | Owner-occupied | Renter-occupied |
| 1 Room | 230 (1.5%) | 401 (6.1%) |
| 2 or 3 Rooms | 1,111 (7.0%) | 1,528 (23.2%) |
| 4 or 5 Rooms | 5,810 (36.5%) | 2,875 (43.6%) |
| 6 or 7 Rooms | 5,613 (35.3%) | 1,257 (19.1%) |
| 8 or more Rooms | 3,132 (19.7%) | 526 (8.0%) |
| Total | 15,896 (100.0%) | 6,587 (100.0%) |
Housing Structure by Heating Type in Lincoln County
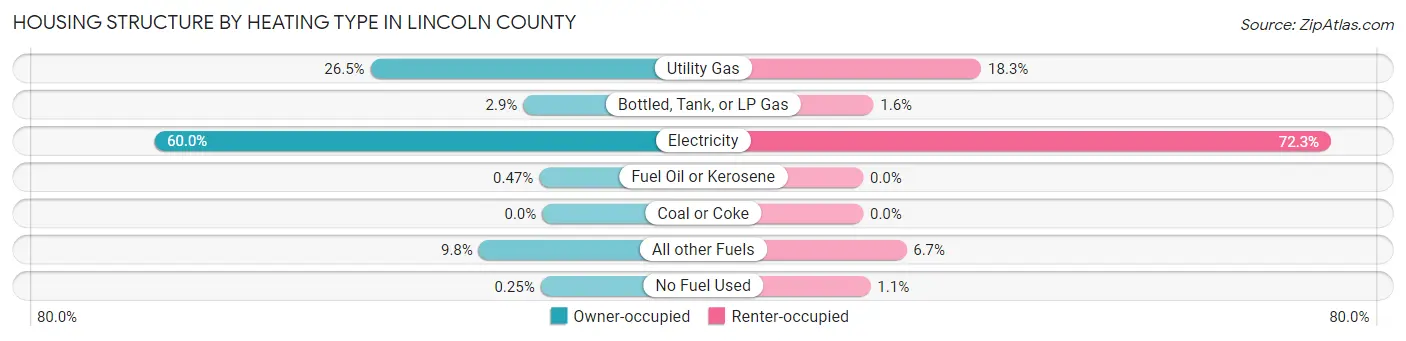
| Heating Type | Owner-occupied | Renter-occupied |
| Utility Gas | 4,219 (26.5%) | 1,203 (18.3%) |
| Bottled, Tank, or LP Gas | 466 (2.9%) | 105 (1.6%) |
| Electricity | 9,538 (60.0%) | 4,764 (72.3%) |
| Fuel Oil or Kerosene | 75 (0.5%) | 0 (0.0%) |
| Coal or Coke | 0 (0.0%) | 0 (0.0%) |
| All other Fuels | 1,559 (9.8%) | 440 (6.7%) |
| No Fuel Used | 39 (0.3%) | 75 (1.1%) |
| Total | 15,896 (100.0%) | 6,587 (100.0%) |
Household Vehicle Usage in Lincoln County
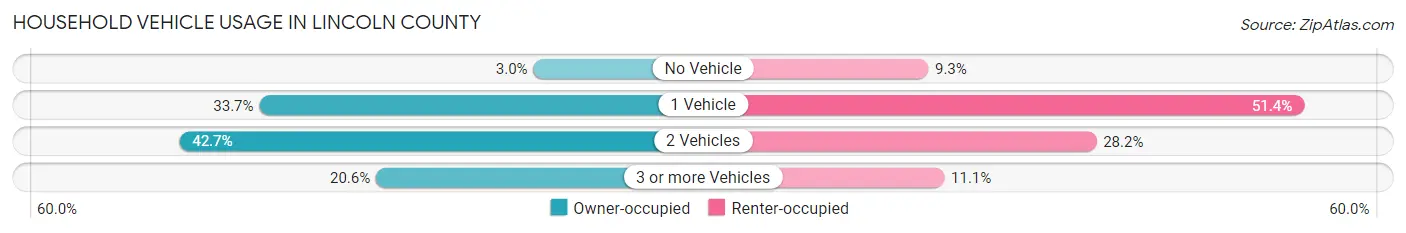
| Vehicles per Household | Owner-occupied | Renter-occupied |
| No Vehicle | 477 (3.0%) | 613 (9.3%) |
| 1 Vehicle | 5,357 (33.7%) | 3,388 (51.4%) |
| 2 Vehicles | 6,783 (42.7%) | 1,854 (28.1%) |
| 3 or more Vehicles | 3,279 (20.6%) | 732 (11.1%) |
| Total | 15,896 (100.0%) | 6,587 (100.0%) |
Real Estate & Mortgages in Lincoln County
Real Estate and Mortgage Overview in Lincoln County
| Characteristic | Without Mortgage | With Mortgage |
| Housing Units | 7,468 | 8,428 |
| Median Property Value | $318,600 | $360,600 |
| Median Household Income | $56,439 | $1,280 |
| Monthly Housing Costs | $582 | $575 |
| Real Estate Taxes | $2,968 | $172 |
Property Value by Mortgage Status in Lincoln County
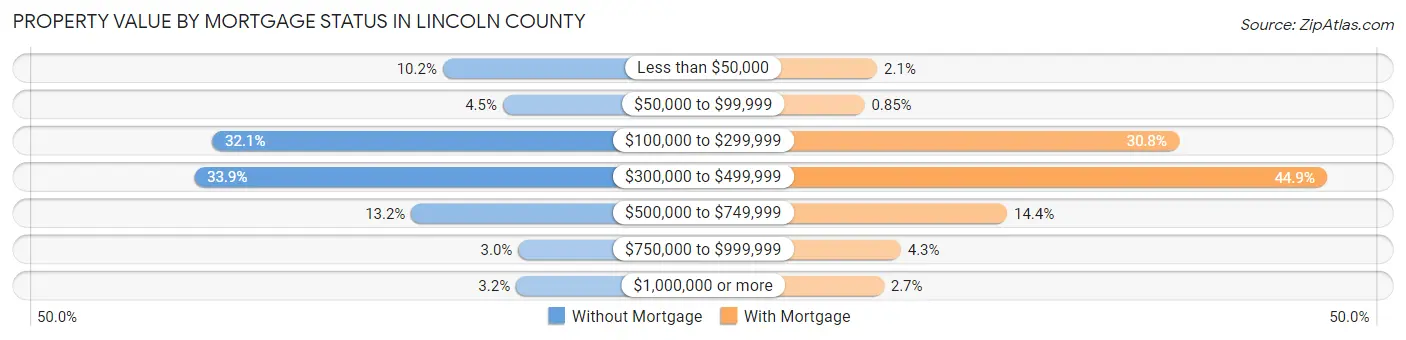
| Property Value | Without Mortgage | With Mortgage |
| Less than $50,000 | 760 (10.2%) | 174 (2.1%) |
| $50,000 to $99,999 | 333 (4.5%) | 72 (0.9%) |
| $100,000 to $299,999 | 2,400 (32.1%) | 2,594 (30.8%) |
| $300,000 to $499,999 | 2,529 (33.9%) | 3,782 (44.9%) |
| $500,000 to $749,999 | 984 (13.2%) | 1,216 (14.4%) |
| $750,000 to $999,999 | 223 (3.0%) | 363 (4.3%) |
| $1,000,000 or more | 239 (3.2%) | 227 (2.7%) |
| Total | 7,468 (100.0%) | 8,428 (100.0%) |
Household Income by Mortgage Status in Lincoln County
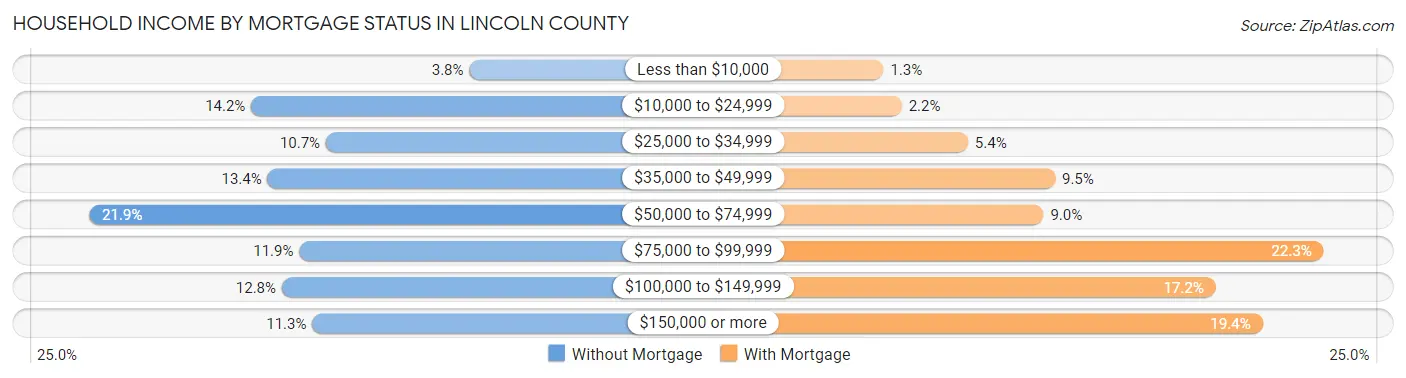
| Household Income | Without Mortgage | With Mortgage |
| Less than $10,000 | 285 (3.8%) | 112 (1.3%) |
| $10,000 to $24,999 | 1,061 (14.2%) | 185 (2.2%) |
| $25,000 to $34,999 | 795 (10.6%) | 451 (5.3%) |
| $35,000 to $49,999 | 1,003 (13.4%) | 801 (9.5%) |
| $50,000 to $74,999 | 1,638 (21.9%) | 754 (8.9%) |
| $75,000 to $99,999 | 890 (11.9%) | 1,879 (22.3%) |
| $100,000 to $149,999 | 952 (12.8%) | 1,445 (17.2%) |
| $150,000 or more | 844 (11.3%) | 1,633 (19.4%) |
| Total | 7,468 (100.0%) | 8,428 (100.0%) |
Property Value to Household Income Ratio in Lincoln County
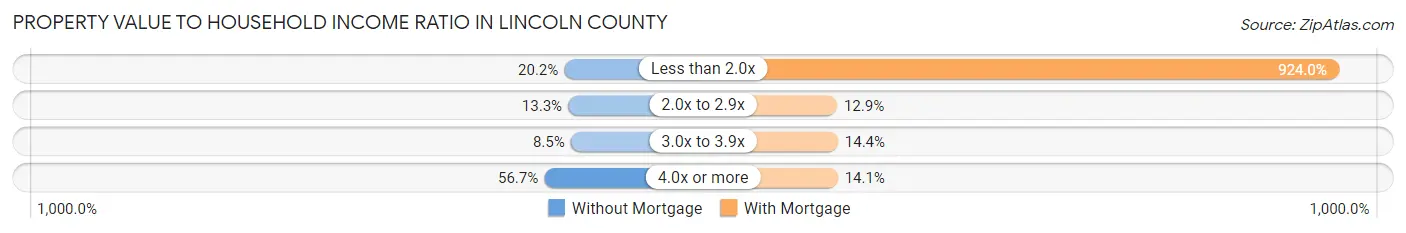
| Value-to-Income Ratio | Without Mortgage | With Mortgage |
| Less than 2.0x | 1,508 (20.2%) | 77,872 (924.0%) |
| 2.0x to 2.9x | 995 (13.3%) | 1,084 (12.9%) |
| 3.0x to 3.9x | 637 (8.5%) | 1,215 (14.4%) |
| 4.0x or more | 4,231 (56.7%) | 1,192 (14.1%) |
| Total | 7,468 (100.0%) | 8,428 (100.0%) |
Real Estate Taxes by Mortgage Status in Lincoln County
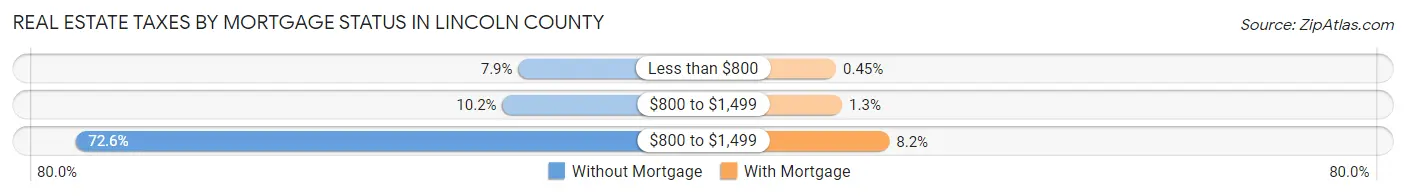
| Property Taxes | Without Mortgage | With Mortgage |
| Less than $800 | 586 (7.9%) | 38 (0.4%) |
| $800 to $1,499 | 760 (10.2%) | 112 (1.3%) |
| $800 to $1,499 | 5,421 (72.6%) | 694 (8.2%) |
| Total | 7,468 (100.0%) | 8,428 (100.0%) |
Health & Disability in Lincoln County
Health Insurance Coverage by Age in Lincoln County
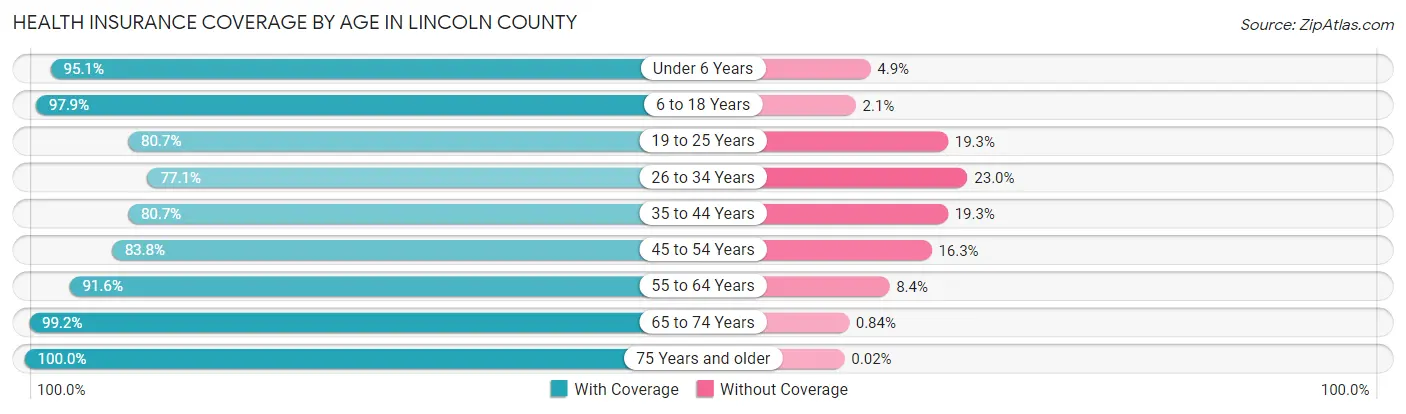
| Age Bracket | With Coverage | Without Coverage |
| Under 6 Years | 2,249 (95.1%) | 115 (4.9%) |
| 6 to 18 Years | 6,092 (97.9%) | 131 (2.1%) |
| 19 to 25 Years | 2,346 (80.7%) | 561 (19.3%) |
| 26 to 34 Years | 3,193 (77.0%) | 951 (23.0%) |
| 35 to 44 Years | 4,401 (80.7%) | 1,051 (19.3%) |
| 45 to 54 Years | 4,436 (83.8%) | 861 (16.3%) |
| 55 to 64 Years | 7,660 (91.6%) | 701 (8.4%) |
| 65 to 74 Years | 9,691 (99.2%) | 82 (0.8%) |
| 75 Years and older | 5,461 (100.0%) | 1 (0.0%) |
| Total | 45,529 (91.1%) | 4,454 (8.9%) |
Health Insurance Coverage by Citizenship Status in Lincoln County
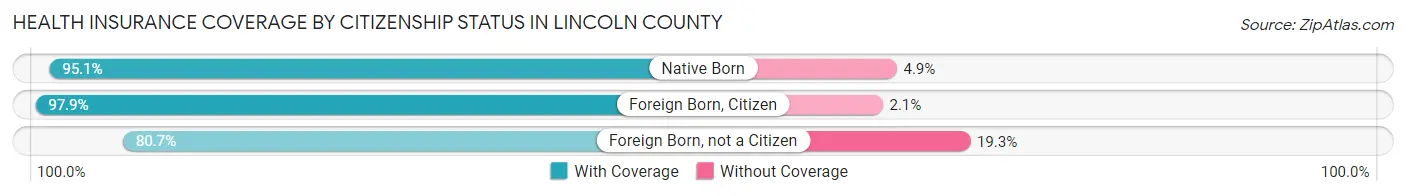
| Citizenship Status | With Coverage | Without Coverage |
| Native Born | 2,249 (95.1%) | 115 (4.9%) |
| Foreign Born, Citizen | 6,092 (97.9%) | 131 (2.1%) |
| Foreign Born, not a Citizen | 2,346 (80.7%) | 561 (19.3%) |
Health Insurance Coverage by Household Income in Lincoln County
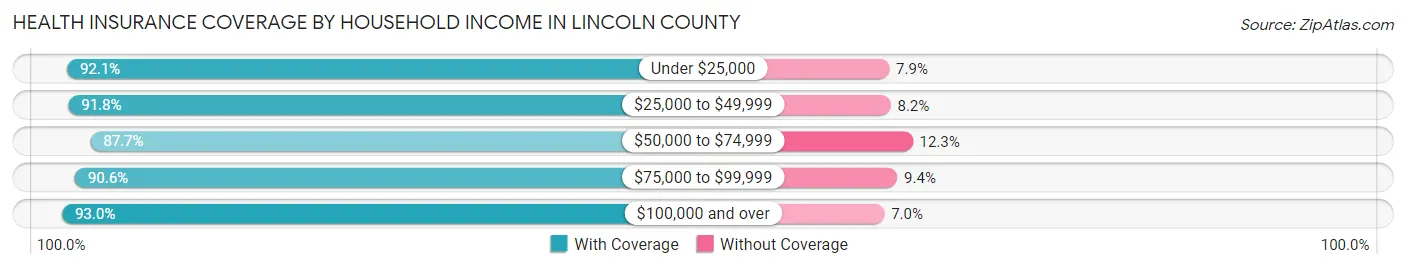
| Household Income | With Coverage | Without Coverage |
| Under $25,000 | 5,933 (92.1%) | 512 (7.9%) |
| $25,000 to $49,999 | 8,618 (91.8%) | 770 (8.2%) |
| $50,000 to $74,999 | 9,944 (87.7%) | 1,397 (12.3%) |
| $75,000 to $99,999 | 6,524 (90.6%) | 679 (9.4%) |
| $100,000 and over | 14,223 (93.0%) | 1,072 (7.0%) |
Public vs Private Health Insurance Coverage by Age in Lincoln County
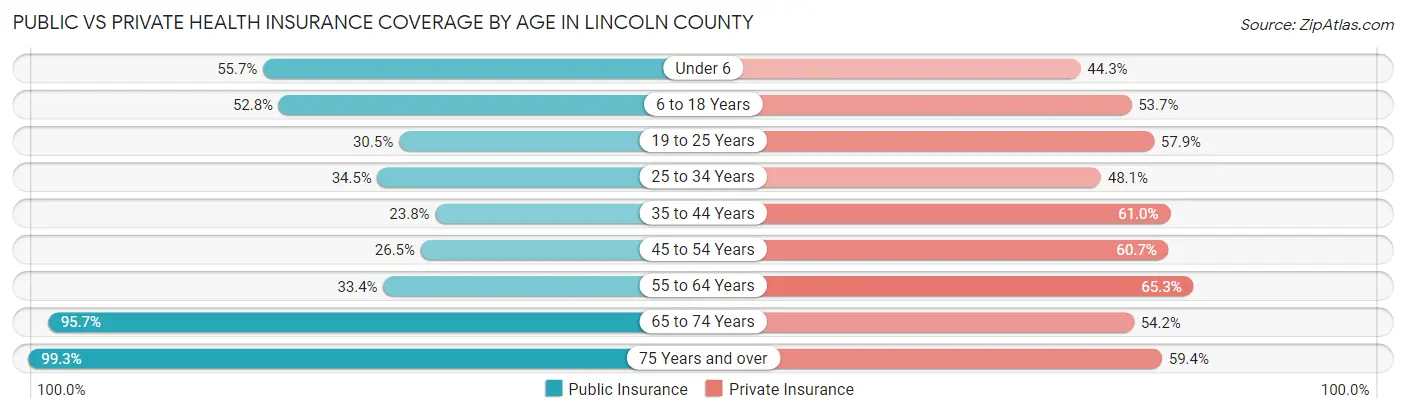
| Age Bracket | Public Insurance | Private Insurance |
| Under 6 | 1,317 (55.7%) | 1,047 (44.3%) |
| 6 to 18 Years | 3,285 (52.8%) | 3,343 (53.7%) |
| 19 to 25 Years | 887 (30.5%) | 1,684 (57.9%) |
| 25 to 34 Years | 1,428 (34.5%) | 1,992 (48.1%) |
| 35 to 44 Years | 1,295 (23.7%) | 3,324 (61.0%) |
| 45 to 54 Years | 1,401 (26.5%) | 3,213 (60.7%) |
| 55 to 64 Years | 2,792 (33.4%) | 5,457 (65.3%) |
| 65 to 74 Years | 9,354 (95.7%) | 5,295 (54.2%) |
| 75 Years and over | 5,424 (99.3%) | 3,244 (59.4%) |
| Total | 27,183 (54.4%) | 28,599 (57.2%) |
Disability Status by Sex by Age in Lincoln County
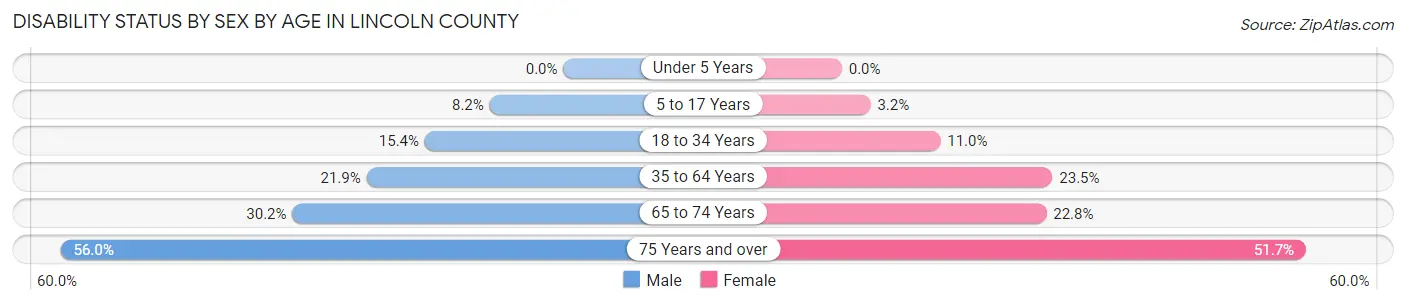
| Age Bracket | Male | Female |
| Under 5 Years | 0 (0.0%) | 0 (0.0%) |
| 5 to 17 Years | 261 (8.2%) | 95 (3.2%) |
| 18 to 34 Years | 567 (15.4%) | 427 (11.0%) |
| 35 to 64 Years | 1,969 (21.9%) | 2,375 (23.4%) |
| 65 to 74 Years | 1,392 (30.2%) | 1,175 (22.8%) |
| 75 Years and over | 1,415 (56.0%) | 1,517 (51.7%) |
Disability Class by Sex by Age in Lincoln County
Disability Class: Hearing Difficulty
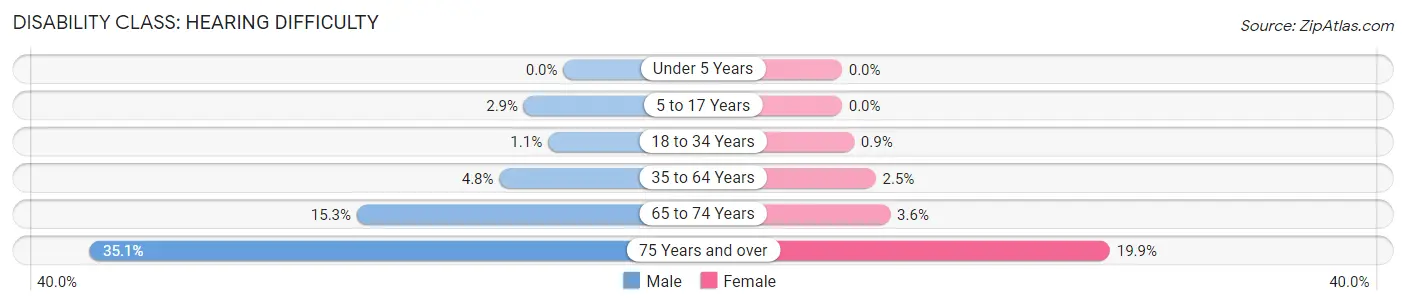
| Age Bracket | Male | Female |
| Under 5 Years | 0 (0.0%) | 0 (0.0%) |
| 5 to 17 Years | 93 (2.9%) | 0 (0.0%) |
| 18 to 34 Years | 42 (1.1%) | 35 (0.9%) |
| 35 to 64 Years | 427 (4.8%) | 254 (2.5%) |
| 65 to 74 Years | 707 (15.3%) | 185 (3.6%) |
| 75 Years and over | 888 (35.1%) | 584 (19.9%) |
Disability Class: Vision Difficulty
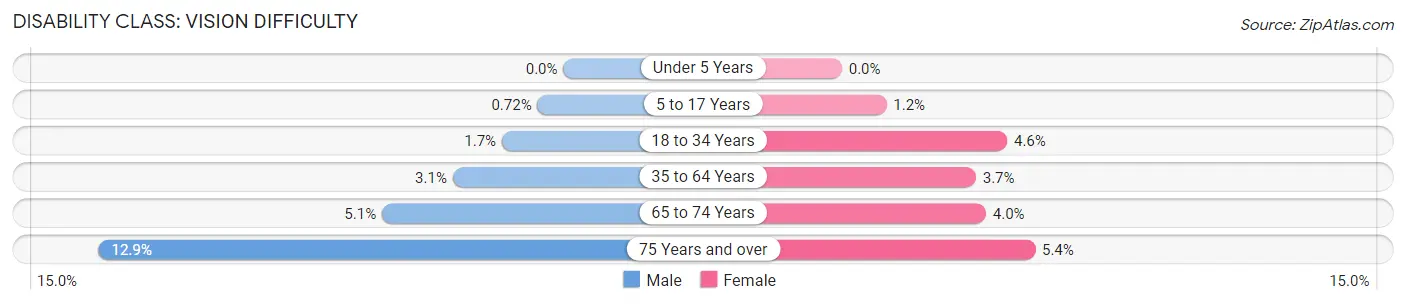
| Age Bracket | Male | Female |
| Under 5 Years | 0 (0.0%) | 0 (0.0%) |
| 5 to 17 Years | 23 (0.7%) | 37 (1.2%) |
| 18 to 34 Years | 63 (1.7%) | 179 (4.6%) |
| 35 to 64 Years | 277 (3.1%) | 378 (3.7%) |
| 65 to 74 Years | 233 (5.1%) | 207 (4.0%) |
| 75 Years and over | 327 (12.9%) | 158 (5.4%) |
Disability Class: Cognitive Difficulty
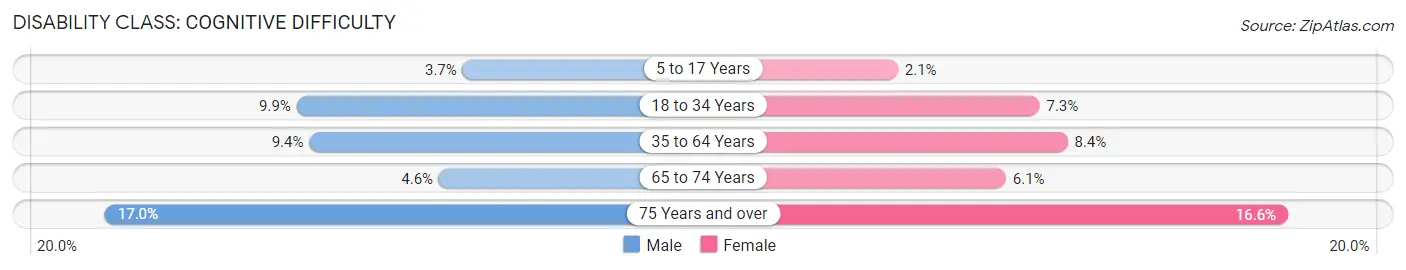
| Age Bracket | Male | Female |
| 5 to 17 Years | 119 (3.7%) | 62 (2.1%) |
| 18 to 34 Years | 364 (9.9%) | 286 (7.3%) |
| 35 to 64 Years | 847 (9.4%) | 849 (8.4%) |
| 65 to 74 Years | 213 (4.6%) | 314 (6.1%) |
| 75 Years and over | 430 (17.0%) | 486 (16.6%) |
Disability Class: Ambulatory Difficulty
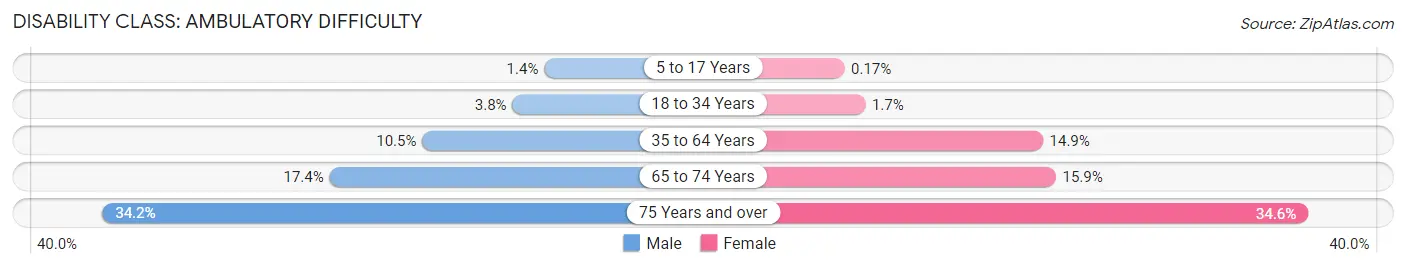
| Age Bracket | Male | Female |
| 5 to 17 Years | 45 (1.4%) | 5 (0.2%) |
| 18 to 34 Years | 139 (3.8%) | 67 (1.7%) |
| 35 to 64 Years | 941 (10.5%) | 1,510 (14.9%) |
| 65 to 74 Years | 801 (17.4%) | 819 (15.9%) |
| 75 Years and over | 865 (34.2%) | 1,016 (34.6%) |
Disability Class: Self-Care Difficulty
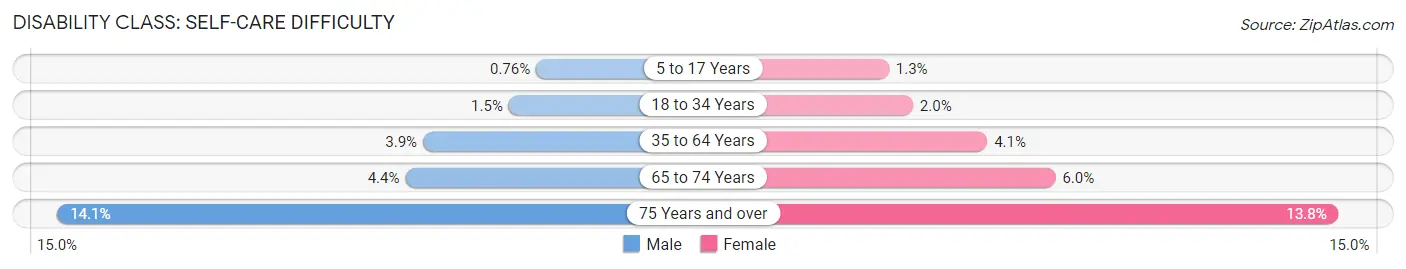
| Age Bracket | Male | Female |
| 5 to 17 Years | 24 (0.8%) | 39 (1.3%) |
| 18 to 34 Years | 56 (1.5%) | 77 (2.0%) |
| 35 to 64 Years | 351 (3.9%) | 410 (4.1%) |
| 65 to 74 Years | 203 (4.4%) | 307 (5.9%) |
| 75 Years and over | 356 (14.1%) | 406 (13.8%) |
Technology Access in Lincoln County
Computing Device Access in Lincoln County
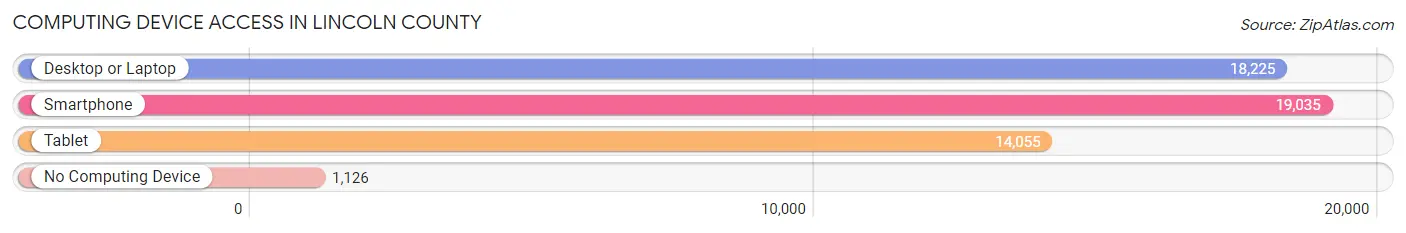
| Device Type | # Households | % Households |
| Desktop or Laptop | 18,225 | 81.1% |
| Smartphone | 19,035 | 84.7% |
| Tablet | 14,055 | 62.5% |
| No Computing Device | 1,126 | 5.0% |
| Total | 22,483 | 100.0% |
Internet Access in Lincoln County
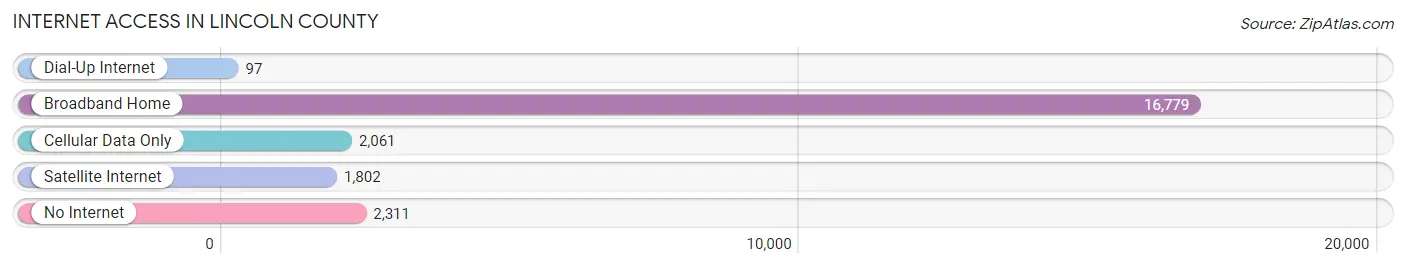
| Internet Type | # Households | % Households |
| Dial-Up Internet | 97 | 0.4% |
| Broadband Home | 16,779 | 74.6% |
| Cellular Data Only | 2,061 | 9.2% |
| Satellite Internet | 1,802 | 8.0% |
| No Internet | 2,311 | 10.3% |
| Total | 22,483 | 100.0% |
Lincoln County Summary
Lincoln County is located in the central Oregon Coast region of the U.S. state of Oregon. It is bordered by the Pacific Ocean to the west, Tillamook County to the north, Polk County to the east, and Benton County to the south. The county seat is Newport, and the largest city is Lincoln City. The county was named after Abraham Lincoln, the 16th President of the United States.
History
The area that is now Lincoln County was originally inhabited by the Siletz and Alsea Native American tribes. The first European settlers arrived in the area in the early 1800s, and the county was officially established in 1893. The county was originally part of Benton County, but was split off in 1893.
Geography
Lincoln County covers an area of 1,194 square miles, making it the 11th largest county in Oregon. The county is located on the central Oregon Coast, and is bordered by the Pacific Ocean to the west, Tillamook County to the north, Polk County to the east, and Benton County to the south. The county is divided into two distinct regions: the Coast Range and the Central Oregon Coast. The Coast Range is a rugged, mountainous region that is home to the Siuslaw National Forest. The Central Oregon Coast is a flat, coastal plain that is home to the cities of Newport and Lincoln City.
The highest point in the county is Marys Peak, which has an elevation of 4,097 feet. The lowest point is the Pacific Ocean, which has an elevation of 0 feet.
Economy
The economy of Lincoln County is largely based on tourism and fishing. The county is home to several popular tourist destinations, including the Oregon Coast Aquarium, the Yaquina Head Lighthouse, and the Lincoln City Cultural Center. The county is also home to several commercial fishing operations, which harvest a variety of seafood, including crab, salmon, and tuna.
The county is also home to several manufacturing companies, including Oregon Freeze Dry, which produces freeze-dried food products, and Oregon Coast Fiberglass, which produces fiberglass boats.
Demographics
As of the 2010 census, the population of Lincoln County was 48,051. The population density was 40.2 people per square mile. The racial makeup of the county was 91.2% White, 0.7% African American, 1.2% Native American, 1.2% Asian, 0.2% Pacific Islander, 2.3% from other races, and 3.2% from two or more races. Hispanic or Latino of any race were 6.2% of the population.
The median income for a household in the county was $41,945, and the median income for a family was $50,945. The per capita income for the county was $22,945. About 11.2% of families and 15.2% of the population were below the poverty line, including 20.2% of those under age 18 and 8.2% of those age 65 or over.
Common Questions
What is the Total Population of Lincoln County?
Total Population of Lincoln County is 50,334.
What is the Total Male Population of Lincoln County?
Total Male Population of Lincoln County is 24,319.
What is the Total Female Population of Lincoln County?
Total Female Population of Lincoln County is 26,015.
What is the Ratio of Males per 100 Females in Lincoln County?
There are 93.48 Males per 100 Females in Lincoln County.
What is the Ratio of Females per 100 Males in Lincoln County?
There are 106.97 Females per 100 Males in Lincoln County.
What is the Median Population Age in Lincoln County?
Median Population Age in Lincoln County is 52.4 Years.
What is the Average Family Size in Lincoln County
Average Family Size in Lincoln County is 2.8 People.
What is the Average Household Size in Lincoln County
Average Household Size in Lincoln County is 2.2 People.
What is Per Capita Income in Lincoln County?
Per Capita income in Lincoln County is $35,295.
What is the Median Family Income in Lincoln County?
Median Family Income in Lincoln County is $73,678.
What is the Median Household income in Lincoln County?
Median Household Income in Lincoln County is $57,794.
What is Income or Wage Gap in Lincoln County?
Income or Wage Gap in Lincoln County is 15.5%.
Women in Lincoln County earn 84.5 cents for every dollar earned by a man.
What is Family Income Deficit in Lincoln County?
Family Income Deficit in Lincoln County is $12,194.
Families that are below poverty line in Lincoln County earn $12,194 less on average than the poverty threshold level.
What is Inequality or Gini Index in Lincoln County?
Inequality or Gini Index in Lincoln County is 0.46.
How Large is the Labor Force in Lincoln County?
There are 21,803 People in the Labor Forcein in Lincoln County.
What is the Percentage of People in the Labor Force in Lincoln County?
50.4% of People are in the Labor Force in Lincoln County.
What is the Unemployment Rate in Lincoln County?
Unemployment Rate in Lincoln County is 7.7%.