Lane County, OR
Lane County Map
Lane County Overview
382,218
TOTAL POPULATION
189,292
MALE POPULATION
192,926
FEMALE POPULATION
98.12
MALES / 100 FEMALES
101.92
FEMALES / 100 MALES
40.1
MEDIAN AGE
2.8
AVG FAMILY SIZE
2.4
AVG HOUSEHOLD SIZE
$36,776
PER CAPITA INCOME
$84,068
AVG FAMILY INCOME
$65,157
AVG HOUSEHOLD INCOME
27.6%
WAGE / INCOME GAP [ % ]
72.4¢/ $1
WAGE / INCOME GAP [ $ ]
$10,082
FAMILY INCOME DEFICIT
0.46
INEQUALITY / GINI INDEX
194,987
LABOR FORCE [ PEOPLE ]
60.5%
PERCENT IN LABOR FORCE
6.7%
UNEMPLOYMENT RATE
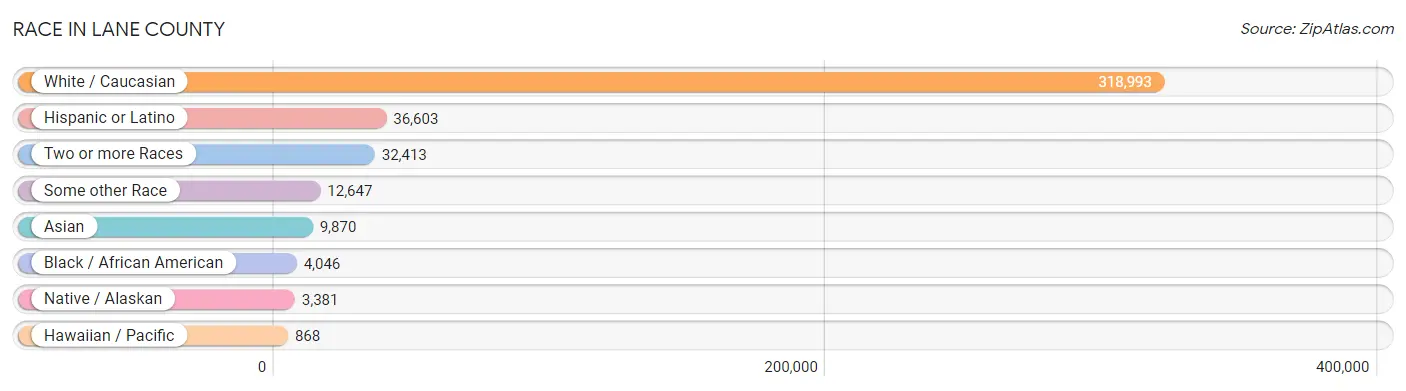
Race in Lane County
The most populous races in Lane County are White / Caucasian (318,993 | 83.5%), Hispanic or Latino (36,603 | 9.6%), and Two or more Races (32,413 | 8.5%).
| Race | # Population | % Population |
| Asian | 9,870 | 2.6% |
| Black / African American | 4,046 | 1.1% |
| Hawaiian / Pacific | 868 | 0.2% |
| Hispanic or Latino | 36,603 | 9.6% |
| Native / Alaskan | 3,381 | 0.9% |
| White / Caucasian | 318,993 | 83.5% |
| Two or more Races | 32,413 | 8.5% |
| Some other Race | 12,647 | 3.3% |
| Total | 382,218 | 100.0% |
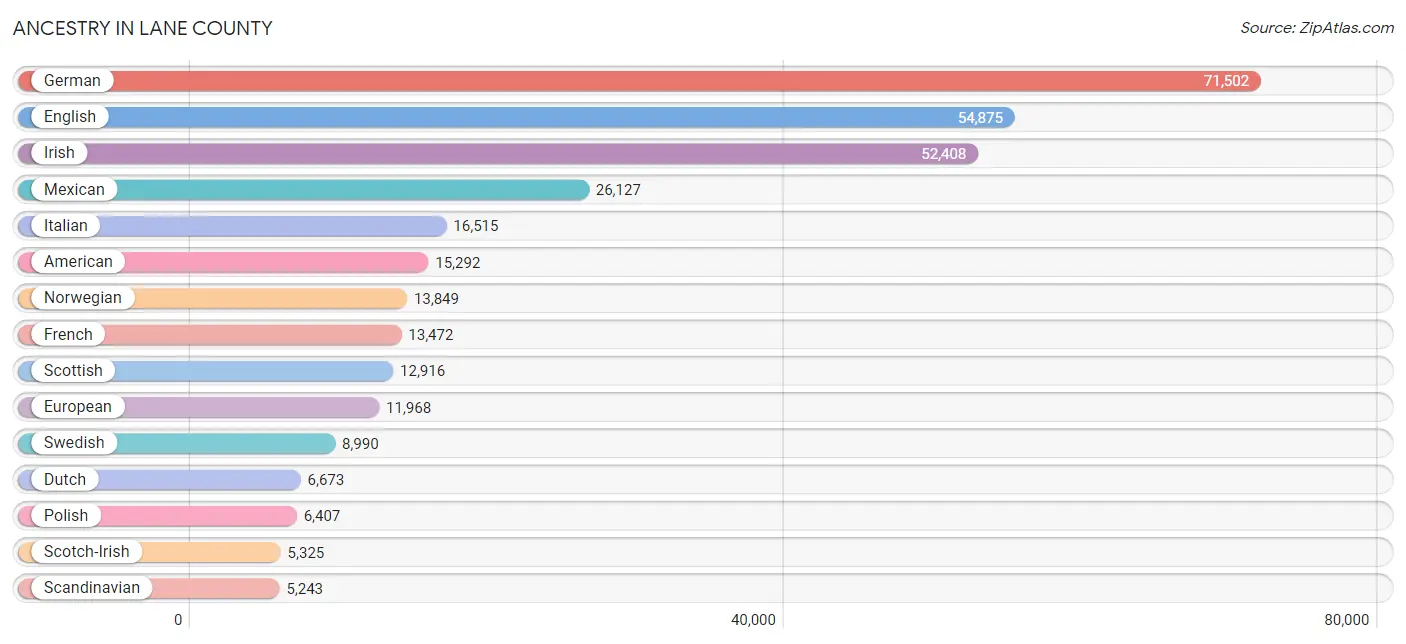
Ancestry in Lane County
The most populous ancestries reported in Lane County are German (71,502 | 18.7%), English (54,875 | 14.4%), Irish (52,408 | 13.7%), Mexican (26,127 | 6.8%), and Italian (16,515 | 4.3%), together accounting for 57.9% of all Lane County residents.
| Ancestry | # Population | % Population |
| Afghan | 85 | 0.0% |
| African | 645 | 0.2% |
| Alaska Native | 10 | 0.0% |
| Alaskan Athabascan | 118 | 0.0% |
| Albanian | 33 | 0.0% |
| Aleut | 85 | 0.0% |
| Alsatian | 38 | 0.0% |
| American | 15,292 | 4.0% |
| Apache | 355 | 0.1% |
| Arab | 1,047 | 0.3% |
| Argentinean | 164 | 0.0% |
| Armenian | 480 | 0.1% |
| Australian | 333 | 0.1% |
| Austrian | 1,015 | 0.3% |
| Bahamian | 7 | 0.0% |
| Bangladeshi | 73 | 0.0% |
| Basque | 181 | 0.1% |
| Belgian | 523 | 0.1% |
| Belizean | 18 | 0.0% |
| Bhutanese | 3,523 | 0.9% |
| Blackfeet | 764 | 0.2% |
| Bolivian | 74 | 0.0% |
| Brazilian | 310 | 0.1% |
| British | 4,459 | 1.2% |
| Bulgarian | 49 | 0.0% |
| Burmese | 1,892 | 0.5% |
| Cajun | 142 | 0.0% |
| Canadian | 987 | 0.3% |
| Cape Verdean | 18 | 0.0% |
| Carpatho Rusyn | 12 | 0.0% |
| Celtic | 109 | 0.0% |
| Central American | 2,189 | 0.6% |
| Central American Indian | 402 | 0.1% |
| Cherokee | 2,973 | 0.8% |
| Cheyenne | 14 | 0.0% |
| Chickasaw | 224 | 0.1% |
| Chilean | 117 | 0.0% |
| Chinese | 60 | 0.0% |
| Chippewa | 376 | 0.1% |
| Choctaw | 641 | 0.2% |
| Colombian | 666 | 0.2% |
| Colville | 151 | 0.0% |
| Comanche | 106 | 0.0% |
| Costa Rican | 196 | 0.1% |
| Cree | 179 | 0.1% |
| Creek | 137 | 0.0% |
| Croatian | 319 | 0.1% |
| Cuban | 690 | 0.2% |
| Czech | 1,715 | 0.4% |
| Czechoslovakian | 428 | 0.1% |
| Danish | 3,924 | 1.0% |
| Delaware | 28 | 0.0% |
| Dominican | 41 | 0.0% |
| Dutch | 6,673 | 1.8% |
| Dutch West Indian | 9 | 0.0% |
| Eastern European | 1,703 | 0.4% |
| Ecuadorian | 265 | 0.1% |
| Egyptian | 176 | 0.1% |
| English | 54,875 | 14.4% |
| Estonian | 65 | 0.0% |
| Ethiopian | 18 | 0.0% |
| European | 11,968 | 3.1% |
| Fijian | 58 | 0.0% |
| Filipino | 32 | 0.0% |
| Finnish | 1,893 | 0.5% |
| French | 13,472 | 3.5% |
| French American Indian | 87 | 0.0% |
| French Canadian | 2,536 | 0.7% |
| German | 71,502 | 18.7% |
| German Russian | 11 | 0.0% |
| Ghanaian | 118 | 0.0% |
| Greek | 1,781 | 0.5% |
| Guamanian / Chamorro | 175 | 0.1% |
| Guatemalan | 858 | 0.2% |
| Haitian | 17 | 0.0% |
| Honduran | 46 | 0.0% |
| Hopi | 23 | 0.0% |
| Hungarian | 1,415 | 0.4% |
| Icelander | 138 | 0.0% |
| Indian (Asian) | 4,579 | 1.2% |
| Indonesian | 112 | 0.0% |
| Inupiat | 151 | 0.0% |
| Iranian | 621 | 0.2% |
| Iraqi | 18 | 0.0% |
| Irish | 52,408 | 13.7% |
| Iroquois | 102 | 0.0% |
| Israeli | 264 | 0.1% |
| Italian | 16,515 | 4.3% |
| Jamaican | 137 | 0.0% |
| Japanese | 246 | 0.1% |
| Jordanian | 48 | 0.0% |
| Kenyan | 35 | 0.0% |
| Kiowa | 101 | 0.0% |
| Korean | 4,260 | 1.1% |
| Laotian | 213 | 0.1% |
| Latvian | 131 | 0.0% |
| Lebanese | 299 | 0.1% |
| Lithuanian | 512 | 0.1% |
| Lumbee | 106 | 0.0% |
| Luxembourger | 33 | 0.0% |
| Malaysian | 160 | 0.0% |
| Maltese | 91 | 0.0% |
| Mexican | 26,127 | 6.8% |
| Mexican American Indian | 795 | 0.2% |
| Mongolian | 38 | 0.0% |
| Moroccan | 35 | 0.0% |
| Native Hawaiian | 1,154 | 0.3% |
| Navajo | 396 | 0.1% |
| Nepalese | 12 | 0.0% |
| New Zealander | 58 | 0.0% |
| Nicaraguan | 160 | 0.0% |
| Nigerian | 391 | 0.1% |
| Northern European | 2,188 | 0.6% |
| Norwegian | 13,849 | 3.6% |
| Okinawan | 21 | 0.0% |
| Osage | 60 | 0.0% |
| Paiute | 97 | 0.0% |
| Pakistani | 358 | 0.1% |
| Palestinian | 68 | 0.0% |
| Panamanian | 313 | 0.1% |
| Pennsylvania German | 189 | 0.1% |
| Peruvian | 449 | 0.1% |
| Polish | 6,407 | 1.7% |
| Portuguese | 2,770 | 0.7% |
| Potawatomi | 216 | 0.1% |
| Pueblo | 61 | 0.0% |
| Puerto Rican | 1,433 | 0.4% |
| Puget Sound Salish | 85 | 0.0% |
| Romanian | 373 | 0.1% |
| Russian | 3,224 | 0.8% |
| Salvadoran | 609 | 0.2% |
| Samoan | 248 | 0.1% |
| Scandinavian | 5,243 | 1.4% |
| Scotch-Irish | 5,325 | 1.4% |
| Scottish | 12,916 | 3.4% |
| Seminole | 71 | 0.0% |
| Serbian | 182 | 0.1% |
| Shoshone | 87 | 0.0% |
| Sioux | 647 | 0.2% |
| Slavic | 337 | 0.1% |
| Slovak | 239 | 0.1% |
| Slovene | 46 | 0.0% |
| South African | 16 | 0.0% |
| South American | 1,862 | 0.5% |
| South American Indian | 42 | 0.0% |
| Spaniard | 1,125 | 0.3% |
| Spanish | 1,564 | 0.4% |
| Sri Lankan | 1,011 | 0.3% |
| Subsaharan African | 1,541 | 0.4% |
| Swedish | 8,990 | 2.4% |
| Swiss | 2,355 | 0.6% |
| Syrian | 131 | 0.0% |
| Thai | 1,453 | 0.4% |
| Tlingit-Haida | 47 | 0.0% |
| Tongan | 26 | 0.0% |
| Trinidadian and Tobagonian | 31 | 0.0% |
| Turkish | 107 | 0.0% |
| Ugandan | 53 | 0.0% |
| Ukrainian | 1,069 | 0.3% |
| Uruguayan | 74 | 0.0% |
| Venezuelan | 53 | 0.0% |
| Welsh | 4,326 | 1.1% |
| West Indian | 60 | 0.0% |
| Yakama | 70 | 0.0% |
| Yaqui | 53 | 0.0% |
| Yugoslavian | 193 | 0.1% | View All 166 Rows |
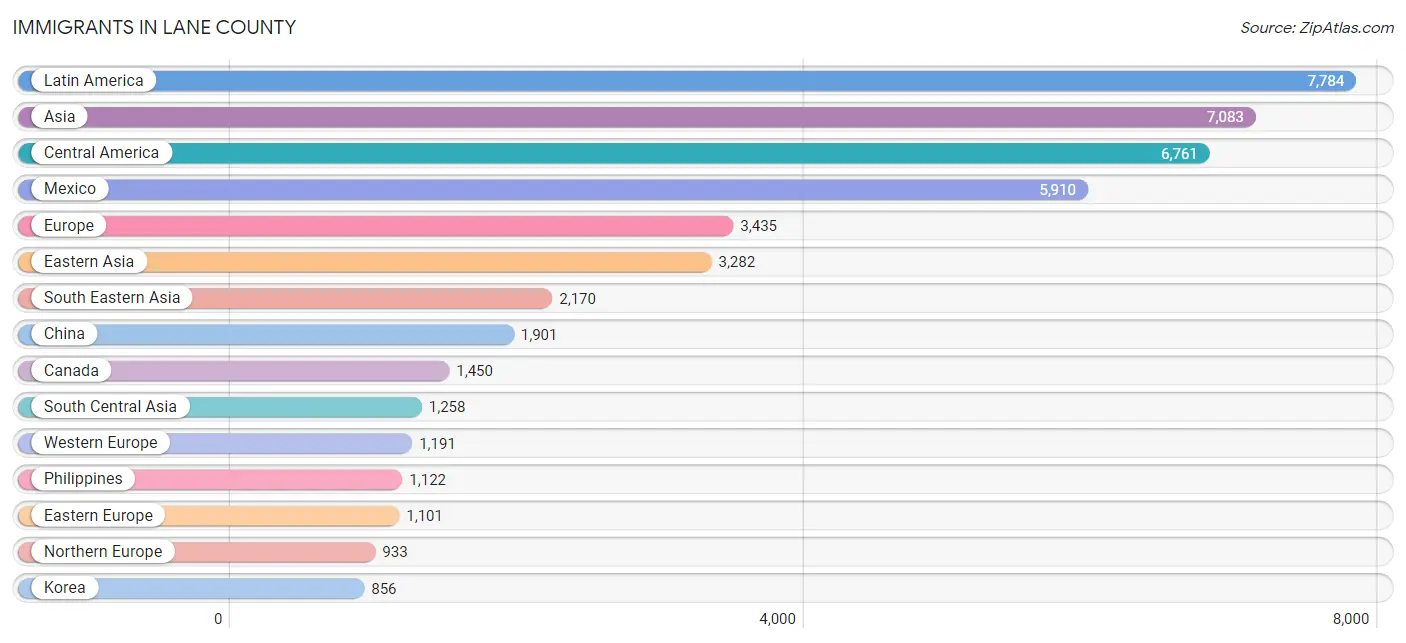
Immigrants in Lane County
The most numerous immigrant groups reported in Lane County came from Latin America (7,784 | 2.0%), Asia (7,083 | 1.8%), Central America (6,761 | 1.8%), Mexico (5,910 | 1.5%), and Europe (3,435 | 0.9%), together accounting for 8.1% of all Lane County residents.
| Immigration Origin | # Population | % Population |
| Afghanistan | 116 | 0.0% |
| Africa | 831 | 0.2% |
| Albania | 19 | 0.0% |
| Argentina | 34 | 0.0% |
| Asia | 7,083 | 1.8% |
| Australia | 208 | 0.1% |
| Austria | 100 | 0.0% |
| Azores | 9 | 0.0% |
| Bangladesh | 29 | 0.0% |
| Belgium | 13 | 0.0% |
| Belize | 18 | 0.0% |
| Bolivia | 36 | 0.0% |
| Brazil | 201 | 0.1% |
| Bulgaria | 75 | 0.0% |
| Cambodia | 206 | 0.1% |
| Canada | 1,450 | 0.4% |
| Caribbean | 282 | 0.1% |
| Central America | 6,761 | 1.8% |
| Chile | 20 | 0.0% |
| China | 1,901 | 0.5% |
| Colombia | 45 | 0.0% |
| Costa Rica | 218 | 0.1% |
| Cuba | 110 | 0.0% |
| Czechoslovakia | 34 | 0.0% |
| Denmark | 14 | 0.0% |
| Dominica | 7 | 0.0% |
| Eastern Africa | 183 | 0.1% |
| Eastern Asia | 3,282 | 0.9% |
| Eastern Europe | 1,101 | 0.3% |
| Ecuador | 87 | 0.0% |
| Egypt | 30 | 0.0% |
| El Salvador | 202 | 0.1% |
| England | 481 | 0.1% |
| Ethiopia | 18 | 0.0% |
| Europe | 3,435 | 0.9% |
| Fiji | 75 | 0.0% |
| France | 193 | 0.1% |
| Germany | 634 | 0.2% |
| Ghana | 161 | 0.0% |
| Greece | 23 | 0.0% |
| Guatemala | 308 | 0.1% |
| Haiti | 23 | 0.0% |
| Honduras | 11 | 0.0% |
| Hong Kong | 100 | 0.0% |
| Hungary | 62 | 0.0% |
| India | 414 | 0.1% |
| Indonesia | 126 | 0.0% |
| Iran | 403 | 0.1% |
| Iraq | 11 | 0.0% |
| Ireland | 37 | 0.0% |
| Israel | 126 | 0.0% |
| Italy | 72 | 0.0% |
| Jamaica | 111 | 0.0% |
| Japan | 525 | 0.1% |
| Jordan | 16 | 0.0% |
| Kenya | 27 | 0.0% |
| Korea | 856 | 0.2% |
| Kuwait | 21 | 0.0% |
| Laos | 22 | 0.0% |
| Latin America | 7,784 | 2.0% |
| Latvia | 6 | 0.0% |
| Lebanon | 18 | 0.0% |
| Malaysia | 118 | 0.0% |
| Mexico | 5,910 | 1.5% |
| Micronesia | 84 | 0.0% |
| Middle Africa | 14 | 0.0% |
| Moldova | 12 | 0.0% |
| Nepal | 162 | 0.0% |
| Netherlands | 244 | 0.1% |
| Nicaragua | 39 | 0.0% |
| Nigeria | 42 | 0.0% |
| Northern Africa | 39 | 0.0% |
| Northern Europe | 933 | 0.2% |
| Norway | 38 | 0.0% |
| Oceania | 458 | 0.1% |
| Pakistan | 111 | 0.0% |
| Panama | 16 | 0.0% |
| Peru | 229 | 0.1% |
| Philippines | 1,122 | 0.3% |
| Poland | 178 | 0.1% |
| Portugal | 40 | 0.0% |
| Romania | 81 | 0.0% |
| Russia | 351 | 0.1% |
| Saudi Arabia | 53 | 0.0% |
| Scotland | 27 | 0.0% |
| Serbia | 22 | 0.0% |
| Singapore | 119 | 0.0% |
| South Africa | 253 | 0.1% |
| South America | 741 | 0.2% |
| South Central Asia | 1,258 | 0.3% |
| South Eastern Asia | 2,170 | 0.6% |
| Southern Europe | 203 | 0.1% |
| Spain | 68 | 0.0% |
| Sweden | 26 | 0.0% |
| Switzerland | 7 | 0.0% |
| Taiwan | 107 | 0.0% |
| Thailand | 99 | 0.0% |
| Trinidad and Tobago | 31 | 0.0% |
| Turkey | 30 | 0.0% |
| Uganda | 67 | 0.0% |
| Ukraine | 235 | 0.1% |
| Uruguay | 59 | 0.0% |
| Uzbekistan | 23 | 0.0% |
| Venezuela | 30 | 0.0% |
| Vietnam | 337 | 0.1% |
| Western Africa | 342 | 0.1% |
| Western Asia | 351 | 0.1% |
| Western Europe | 1,191 | 0.3% |
| Yemen | 1 | 0.0% |
| Zaire | 7 | 0.0% |
| Zimbabwe | 17 | 0.0% | View All 111 Rows |
Sex and Age in Lane County
Sex and Age in Lane County
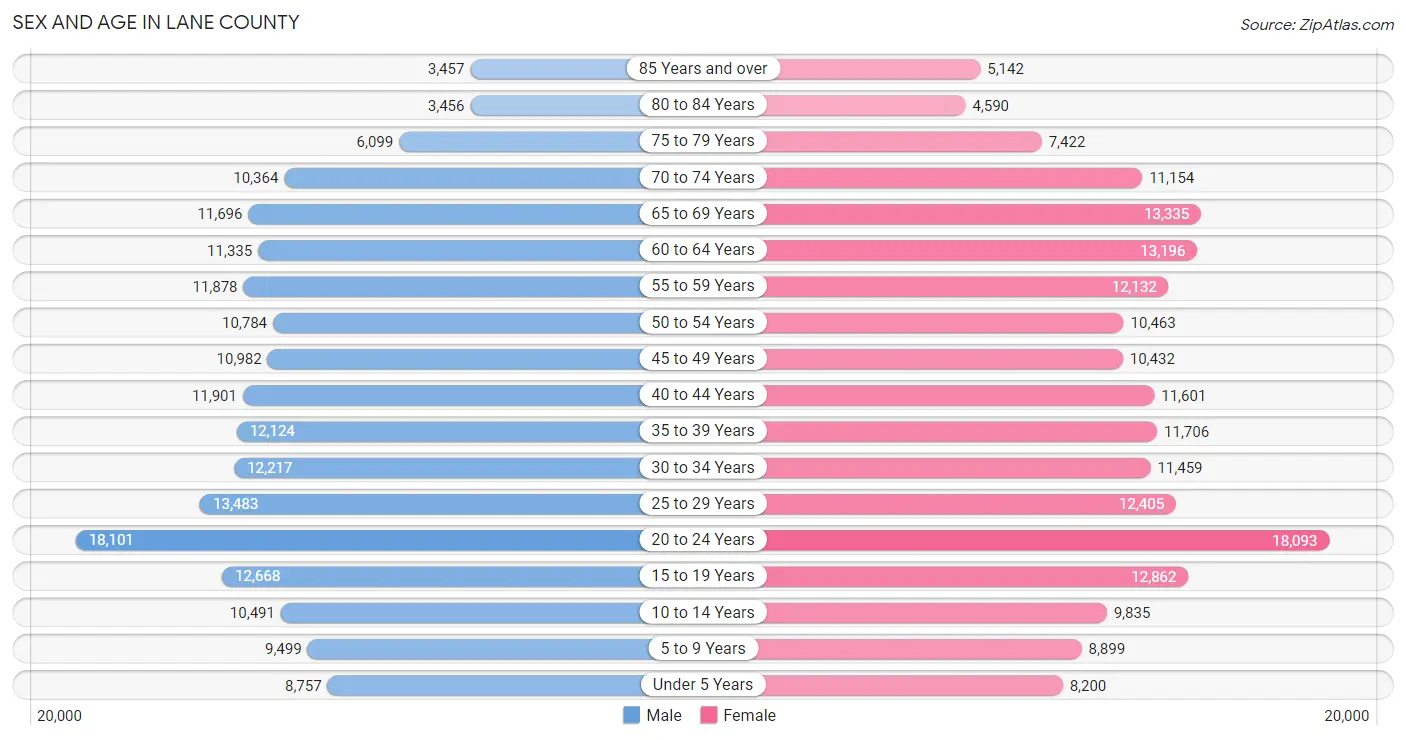
The most populous age groups in Lane County are 20 to 24 Years (18,101 | 9.6%) for men and 20 to 24 Years (18,093 | 9.4%) for women.
| Age Bracket | Male | Female |
| Under 5 Years | 8,757 (4.6%) | 8,200 (4.3%) |
| 5 to 9 Years | 9,499 (5.0%) | 8,899 (4.6%) |
| 10 to 14 Years | 10,491 (5.5%) | 9,835 (5.1%) |
| 15 to 19 Years | 12,668 (6.7%) | 12,862 (6.7%) |
| 20 to 24 Years | 18,101 (9.6%) | 18,093 (9.4%) |
| 25 to 29 Years | 13,483 (7.1%) | 12,405 (6.4%) |
| 30 to 34 Years | 12,217 (6.5%) | 11,459 (5.9%) |
| 35 to 39 Years | 12,124 (6.4%) | 11,706 (6.1%) |
| 40 to 44 Years | 11,901 (6.3%) | 11,601 (6.0%) |
| 45 to 49 Years | 10,982 (5.8%) | 10,432 (5.4%) |
| 50 to 54 Years | 10,784 (5.7%) | 10,463 (5.4%) |
| 55 to 59 Years | 11,878 (6.3%) | 12,132 (6.3%) |
| 60 to 64 Years | 11,335 (6.0%) | 13,196 (6.8%) |
| 65 to 69 Years | 11,696 (6.2%) | 13,335 (6.9%) |
| 70 to 74 Years | 10,364 (5.5%) | 11,154 (5.8%) |
| 75 to 79 Years | 6,099 (3.2%) | 7,422 (3.8%) |
| 80 to 84 Years | 3,456 (1.8%) | 4,590 (2.4%) |
| 85 Years and over | 3,457 (1.8%) | 5,142 (2.7%) |
| Total | 189,292 (100.0%) | 192,926 (100.0%) |
Families and Households in Lane County
Median Family Size in Lane County
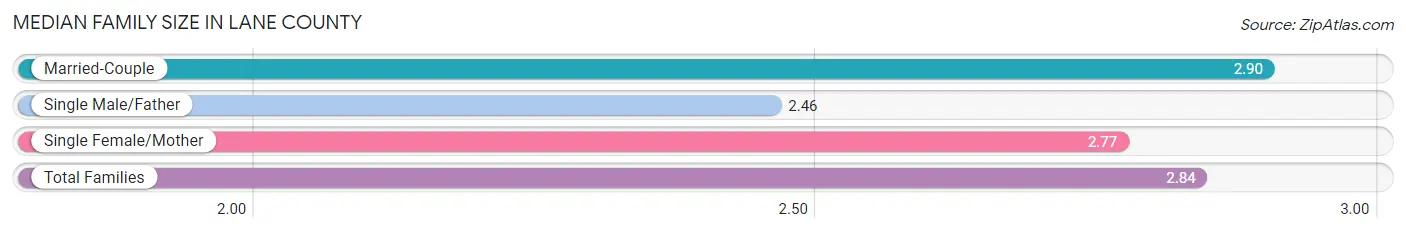
The median family size in Lane County is 2.84 persons per family, with married-couple families (67,621 | 73.6%) accounting for the largest median family size of 2.9 persons per family. On the other hand, single male/father families (7,261 | 7.9%) represent the smallest median family size with 2.46 persons per family.
| Family Type | # Families | Family Size |
| Married-Couple | 67,621 (73.6%) | 2.90 |
| Single Male/Father | 7,261 (7.9%) | 2.46 |
| Single Female/Mother | 16,972 (18.5%) | 2.77 |
| Total Families | 91,854 (100.0%) | 2.84 |
Median Household Size in Lane County
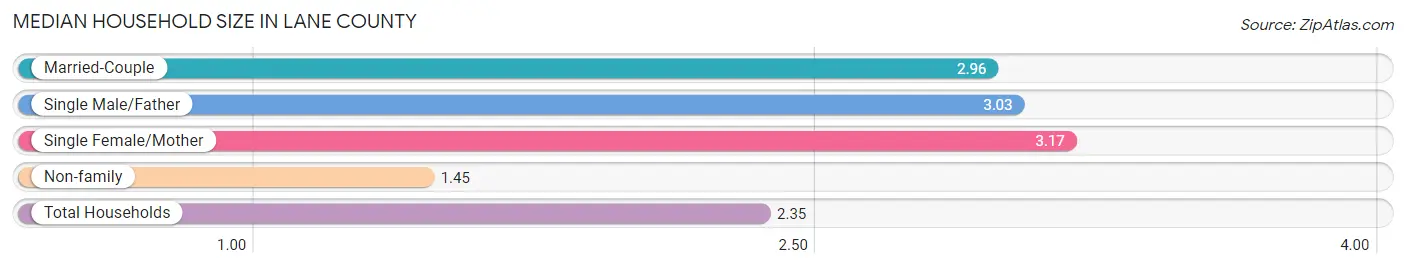
The median household size in Lane County is 2.35 persons per household, with single female/mother households (16,972 | 10.7%) accounting for the largest median household size of 3.17 persons per household. non-family households (66,767 | 42.1%) represent the smallest median household size with 1.45 persons per household.
| Household Type | # Households | Household Size |
| Married-Couple | 67,621 (42.6%) | 2.96 |
| Single Male/Father | 7,261 (4.6%) | 3.03 |
| Single Female/Mother | 16,972 (10.7%) | 3.17 |
| Non-family | 66,767 (42.1%) | 1.45 |
| Total Households | 158,621 (100.0%) | 2.35 |
Household Size by Marriage Status in Lane County
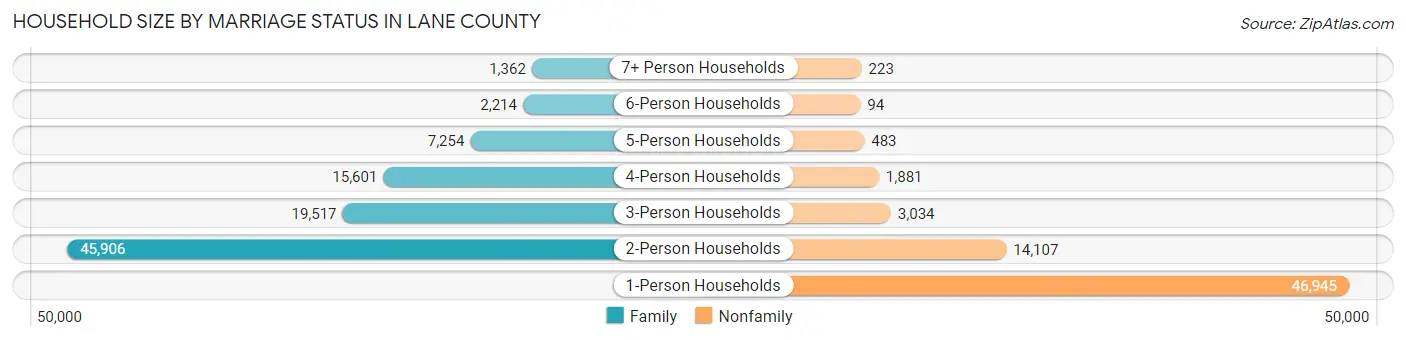
Out of a total of 158,621 households in Lane County, 91,854 (57.9%) are family households, while 66,767 (42.1%) are nonfamily households. The most numerous type of family households are 2-person households, comprising 45,906, and the most common type of nonfamily households are 1-person households, comprising 46,945.
| Household Size | Family Households | Nonfamily Households |
| 1-Person Households | - | 46,945 (29.6%) |
| 2-Person Households | 45,906 (28.9%) | 14,107 (8.9%) |
| 3-Person Households | 19,517 (12.3%) | 3,034 (1.9%) |
| 4-Person Households | 15,601 (9.8%) | 1,881 (1.2%) |
| 5-Person Households | 7,254 (4.6%) | 483 (0.3%) |
| 6-Person Households | 2,214 (1.4%) | 94 (0.1%) |
| 7+ Person Households | 1,362 (0.9%) | 223 (0.1%) |
| Total | 91,854 (57.9%) | 66,767 (42.1%) |
Female Fertility in Lane County
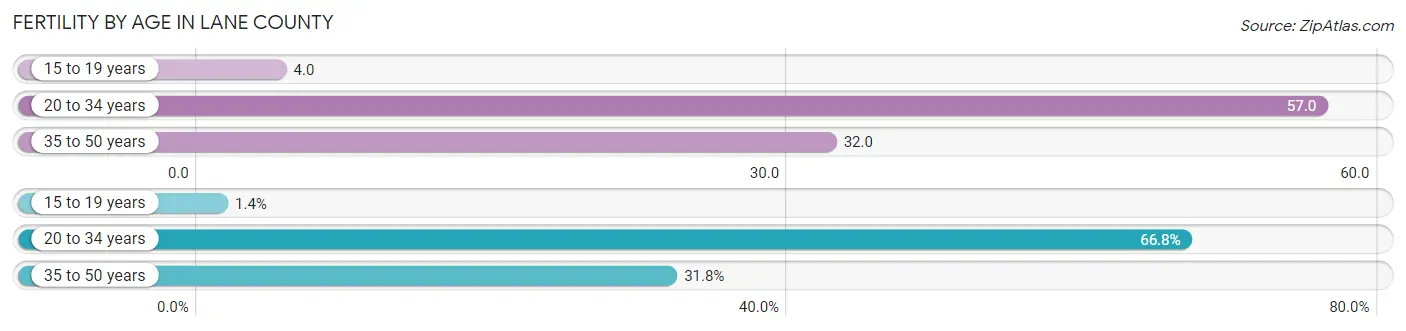
Fertility by Age in Lane County
Average fertility rate in Lane County is 40.0 births per 1,000 women. Women in the age bracket of 20 to 34 years have the highest fertility rate with 57.0 births per 1,000 women. Women in the age bracket of 20 to 34 years acount for 66.8% of all women with births.
| Age Bracket | Women with Births | Births / 1,000 Women |
| 15 to 19 years | 49 (1.4%) | 4.0 |
| 20 to 34 years | 2,408 (66.8%) | 57.0 |
| 35 to 50 years | 1,148 (31.8%) | 32.0 |
| Total | 3,605 (100.0%) | 40.0 |
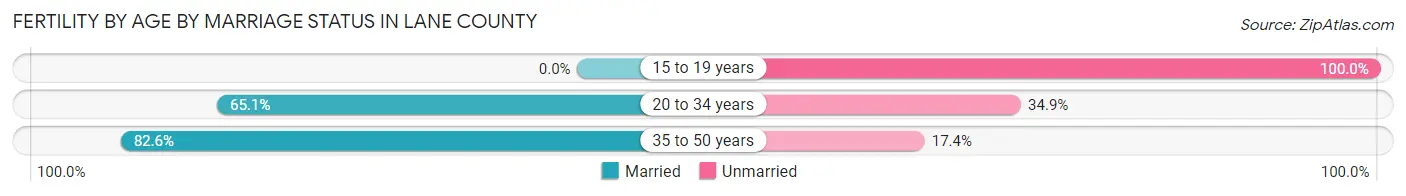
Fertility by Age by Marriage Status in Lane County
69.8% of women with births (3,605) in Lane County are married. The highest percentage of unmarried women with births falls into 15 to 19 years age bracket with 100.0% of them unmarried at the time of birth, while the lowest percentage of unmarried women with births belong to 35 to 50 years age bracket with 17.4% of them unmarried.
| Age Bracket | Married | Unmarried |
| 15 to 19 years | 0 (0.0%) | 49 (100.0%) |
| 20 to 34 years | 1,568 (65.1%) | 840 (34.9%) |
| 35 to 50 years | 948 (82.6%) | 200 (17.4%) |
| Total | 2,516 (69.8%) | 1,089 (30.2%) |
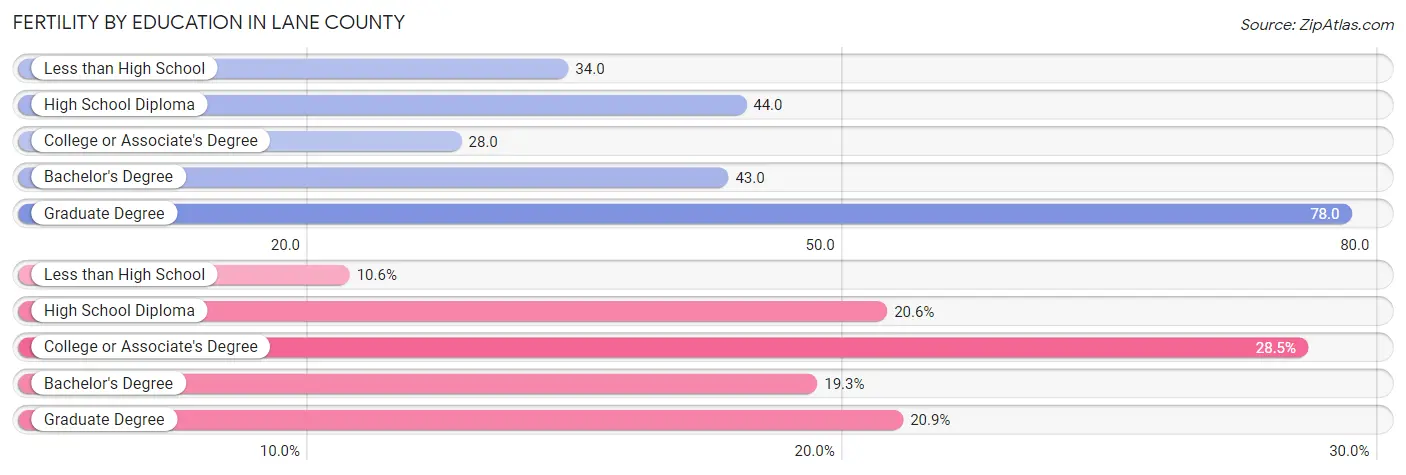
Fertility by Education in Lane County
Average fertility rate in Lane County is 40.0 births per 1,000 women. Women with the education attainment of graduate degree have the highest fertility rate of 78.0 births per 1,000 women, while women with the education attainment of college or associate's degree have the lowest fertility at 28.0 births per 1,000 women. Women with the education attainment of college or associate's degree represent 28.5% of all women with births.
| Educational Attainment | Women with Births | Births / 1,000 Women |
| Less than High School | 381 (10.6%) | 34.0 |
| High School Diploma | 744 (20.6%) | 44.0 |
| College or Associate's Degree | 1,028 (28.5%) | 28.0 |
| Bachelor's Degree | 697 (19.3%) | 43.0 |
| Graduate Degree | 755 (20.9%) | 78.0 |
| Total | 3,605 (100.0%) | 40.0 |
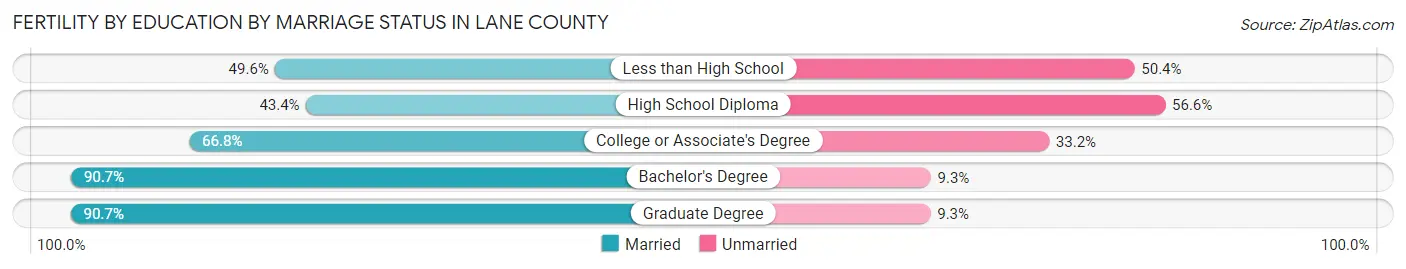
Fertility by Education by Marriage Status in Lane County
30.2% of women with births in Lane County are unmarried. Women with the educational attainment of graduate degree are most likely to be married with 90.7% of them married at childbirth, while women with the educational attainment of high school diploma are least likely to be married with 56.6% of them unmarried at childbirth.
| Educational Attainment | Married | Unmarried |
| Less than High School | 189 (49.6%) | 192 (50.4%) |
| High School Diploma | 323 (43.4%) | 421 (56.6%) |
| College or Associate's Degree | 687 (66.8%) | 341 (33.2%) |
| Bachelor's Degree | 632 (90.7%) | 65 (9.3%) |
| Graduate Degree | 685 (90.7%) | 70 (9.3%) |
| Total | 2,516 (69.8%) | 1,089 (30.2%) |
Income in Lane County
Income Overview in Lane County
Per Capita Income in Lane County is $36,776, while median incomes of families and households are $84,068 and $65,157 respectively.
| Characteristic | Number | Measure |
| Per Capita Income | 382,218 | $36,776 |
| Median Family Income | 91,854 | $84,068 |
| Mean Family Income | 91,854 | $105,355 |
| Median Household Income | 158,621 | $65,157 |
| Mean Household Income | 158,621 | $87,189 |
| Income Deficit | 91,854 | $10,082 |
| Wage / Income Gap (%) | 382,218 | 27.59% |
| Wage / Income Gap ($) | 382,218 | 72.41¢ per $1 |
| Gini / Inequality Index | 382,218 | 0.46 |
Earnings by Sex in Lane County
Average Earnings in Lane County are $33,552, $39,150 for men and $28,350 for women, a difference of 27.6%.
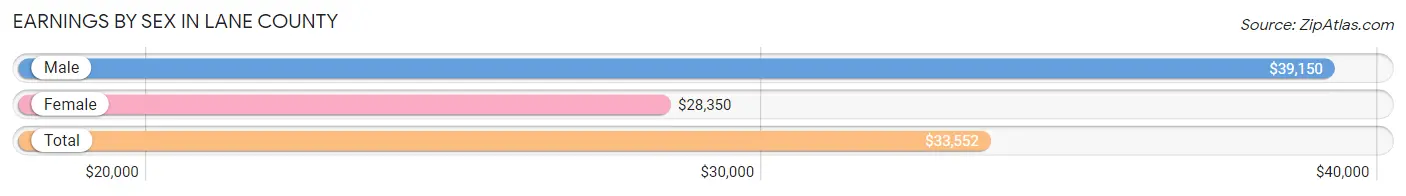
| Sex | Number | Average Earnings |
| Male | 108,369 (51.9%) | $39,150 |
| Female | 100,590 (48.1%) | $28,350 |
| Total | 208,959 (100.0%) | $33,552 |
Earnings by Sex by Income Bracket in Lane County
The most common earnings brackets in Lane County are $100,000+ for men (13,832 | 12.8%) and $2,499 or less for women (8,306 | 8.3%).
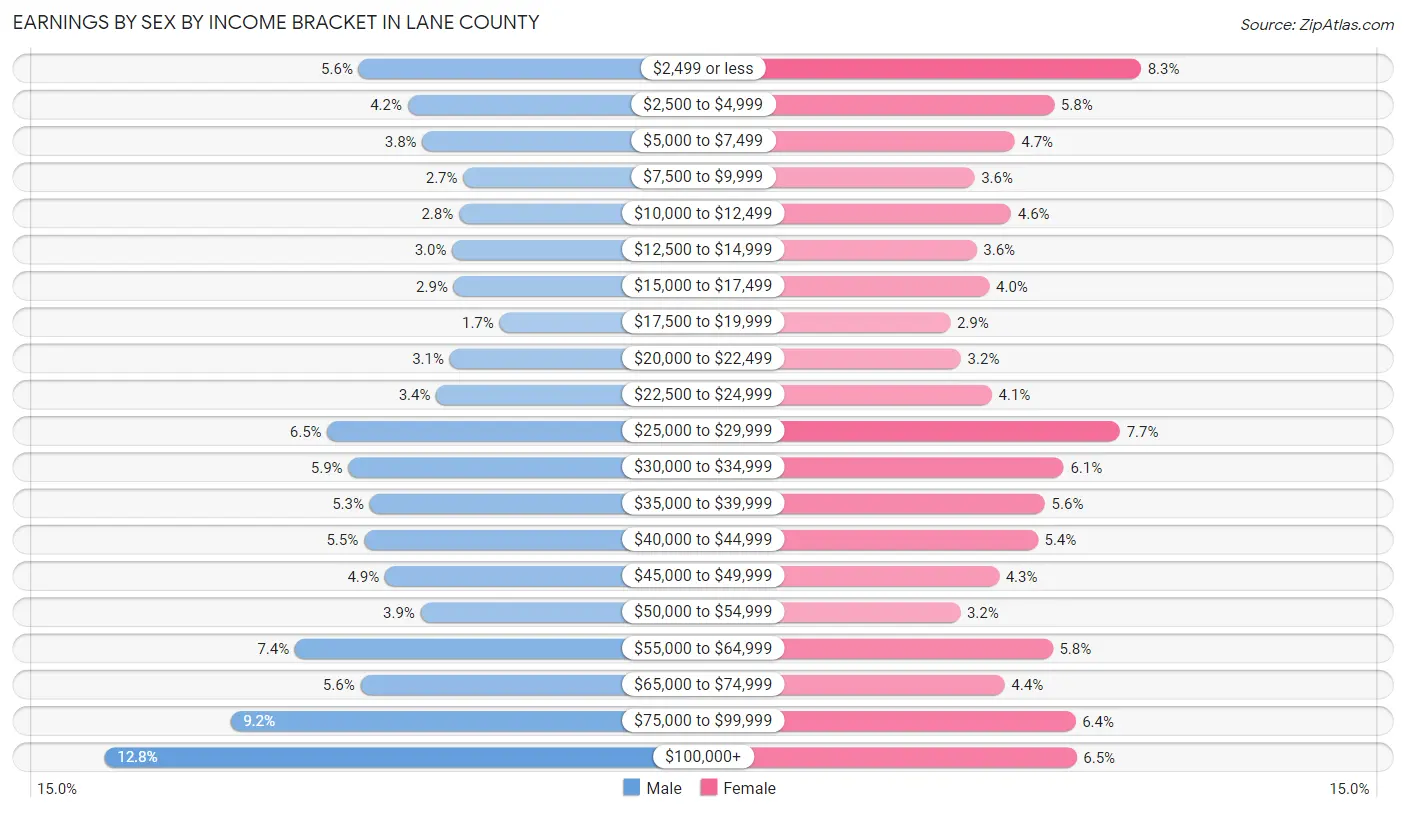
| Income | Male | Female |
| $2,499 or less | 6,076 (5.6%) | 8,306 (8.3%) |
| $2,500 to $4,999 | 4,584 (4.2%) | 5,855 (5.8%) |
| $5,000 to $7,499 | 4,143 (3.8%) | 4,742 (4.7%) |
| $7,500 to $9,999 | 2,889 (2.7%) | 3,603 (3.6%) |
| $10,000 to $12,499 | 3,023 (2.8%) | 4,637 (4.6%) |
| $12,500 to $14,999 | 3,230 (3.0%) | 3,660 (3.6%) |
| $15,000 to $17,499 | 3,185 (2.9%) | 4,020 (4.0%) |
| $17,500 to $19,999 | 1,790 (1.7%) | 2,915 (2.9%) |
| $20,000 to $22,499 | 3,307 (3.0%) | 3,218 (3.2%) |
| $22,500 to $24,999 | 3,720 (3.4%) | 4,090 (4.1%) |
| $25,000 to $29,999 | 7,028 (6.5%) | 7,720 (7.7%) |
| $30,000 to $34,999 | 6,395 (5.9%) | 6,128 (6.1%) |
| $35,000 to $39,999 | 5,739 (5.3%) | 5,593 (5.6%) |
| $40,000 to $44,999 | 5,921 (5.5%) | 5,393 (5.4%) |
| $45,000 to $49,999 | 5,280 (4.9%) | 4,300 (4.3%) |
| $50,000 to $54,999 | 4,193 (3.9%) | 3,200 (3.2%) |
| $55,000 to $64,999 | 8,021 (7.4%) | 5,814 (5.8%) |
| $65,000 to $74,999 | 6,024 (5.6%) | 4,454 (4.4%) |
| $75,000 to $99,999 | 9,989 (9.2%) | 6,456 (6.4%) |
| $100,000+ | 13,832 (12.8%) | 6,486 (6.5%) |
| Total | 108,369 (100.0%) | 100,590 (100.0%) |
Earnings by Sex by Educational Attainment in Lane County
Average earnings in Lane County are $46,979 for men and $36,014 for women, a difference of 23.3%. Men with an educational attainment of graduate degree enjoy the highest average annual earnings of $73,811, while those with less than high school education earn the least with $34,056. Women with an educational attainment of graduate degree earn the most with the average annual earnings of $58,758, while those with less than high school education have the smallest earnings of $23,442.
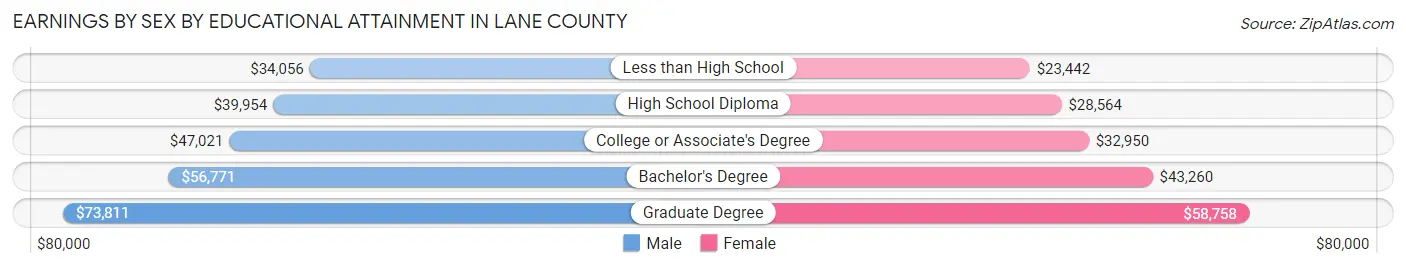
| Educational Attainment | Male Income | Female Income |
| Less than High School | $34,056 | $23,442 |
| High School Diploma | $39,954 | $28,564 |
| College or Associate's Degree | $47,021 | $32,950 |
| Bachelor's Degree | $56,771 | $43,260 |
| Graduate Degree | $73,811 | $58,758 |
| Total | $46,979 | $36,014 |
Family Income in Lane County
Family Income Brackets in Lane County
According to the Lane County family income data, there are 19,289 families falling into the $100,000 to $149,999 income range, which is the most common income bracket and makes up 21.0% of all families. Conversely, the $10,000 to $14,999 income bracket is the least frequent group with only 1,837 families (2.0%) belonging to this category.
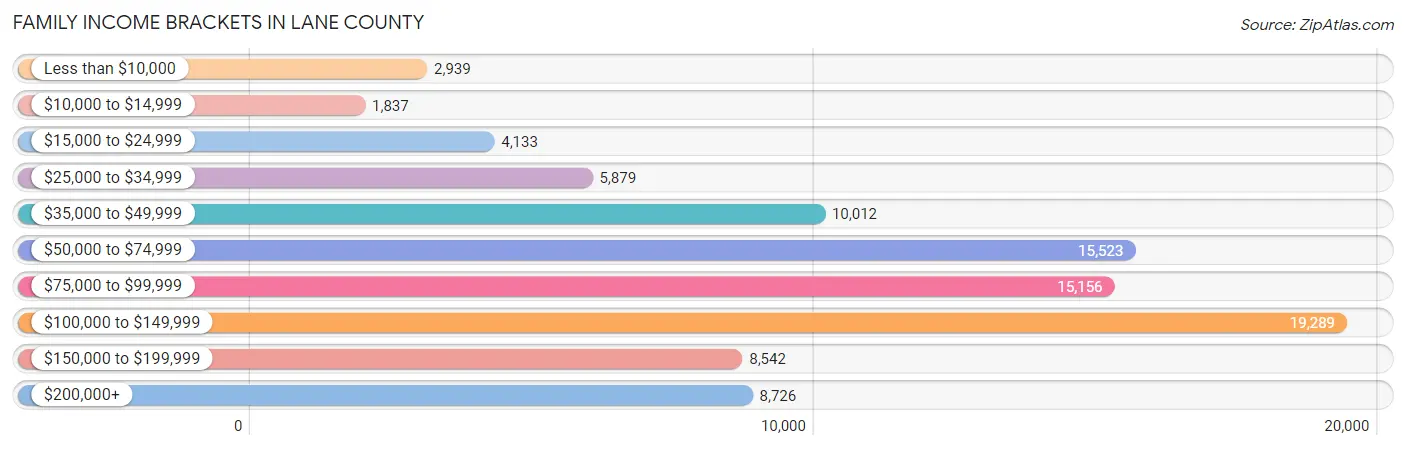
| Income Bracket | # Families | % Families |
| Less than $10,000 | 2,939 | 3.2% |
| $10,000 to $14,999 | 1,837 | 2.0% |
| $15,000 to $24,999 | 4,133 | 4.5% |
| $25,000 to $34,999 | 5,879 | 6.4% |
| $35,000 to $49,999 | 10,012 | 10.9% |
| $50,000 to $74,999 | 15,523 | 16.9% |
| $75,000 to $99,999 | 15,156 | 16.5% |
| $100,000 to $149,999 | 19,289 | 21.0% |
| $150,000 to $199,999 | 8,542 | 9.3% |
| $200,000+ | 8,726 | 9.5% |
Family Income by Famaliy Size in Lane County
7+ person families (806 | 0.9%) account for the highest median family income in Lane County with $114,628 per family, while 2-person families (50,713 | 55.2%) have the highest median income of $37,928 per family member.
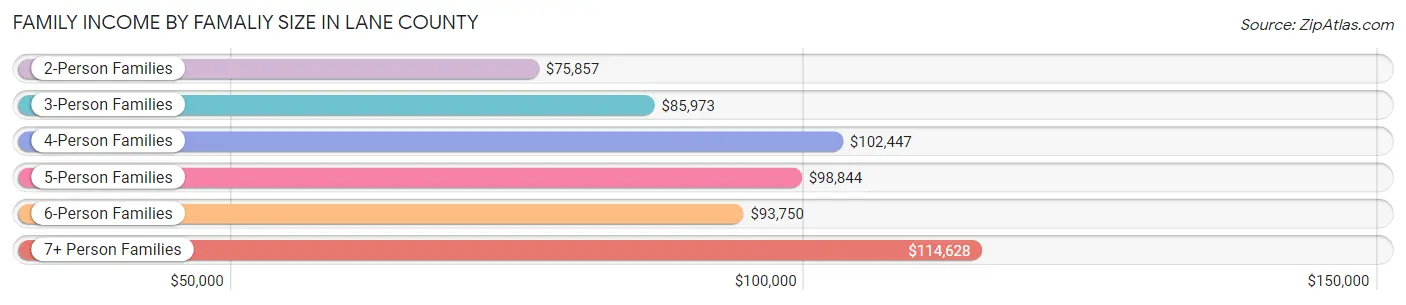
| Income Bracket | # Families | Median Income |
| 2-Person Families | 50,713 (55.2%) | $75,857 |
| 3-Person Families | 19,482 (21.2%) | $85,973 |
| 4-Person Families | 13,469 (14.7%) | $102,447 |
| 5-Person Families | 5,779 (6.3%) | $98,844 |
| 6-Person Families | 1,605 (1.8%) | $93,750 |
| 7+ Person Families | 806 (0.9%) | $114,628 |
| Total | 91,854 (100.0%) | $84,068 |
Family Income by Number of Earners in Lane County
The median family income in Lane County is $84,068, with families comprising 3+ earners (8,011) having the highest median family income of $132,963, while families with no earners (17,624) have the lowest median family income of $56,945, accounting for 8.7% and 19.2% of families, respectively.
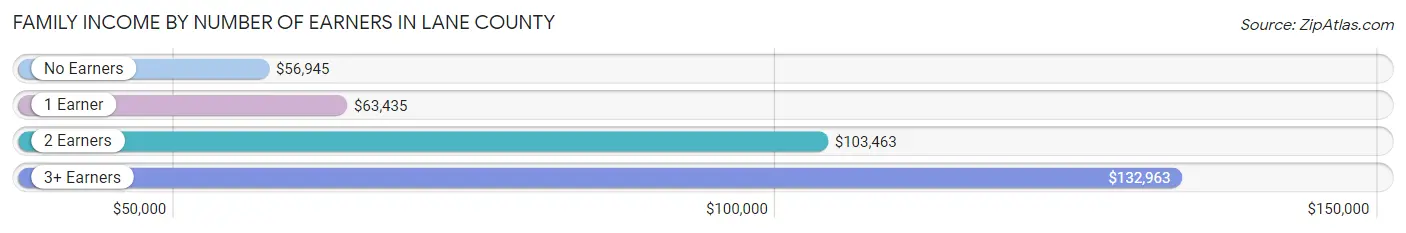
| Number of Earners | # Families | Median Income |
| No Earners | 17,624 (19.2%) | $56,945 |
| 1 Earner | 30,211 (32.9%) | $63,435 |
| 2 Earners | 36,008 (39.2%) | $103,463 |
| 3+ Earners | 8,011 (8.7%) | $132,963 |
| Total | 91,854 (100.0%) | $84,068 |
Household Income in Lane County
Household Income Brackets in Lane County
With 27,441 households falling in the category, the $50,000 to $74,999 income range is the most frequent in Lane County, accounting for 17.3% of all households. In contrast, only 7,138 households (4.5%) fall into the $10,000 to $14,999 income bracket, making it the least populous group.
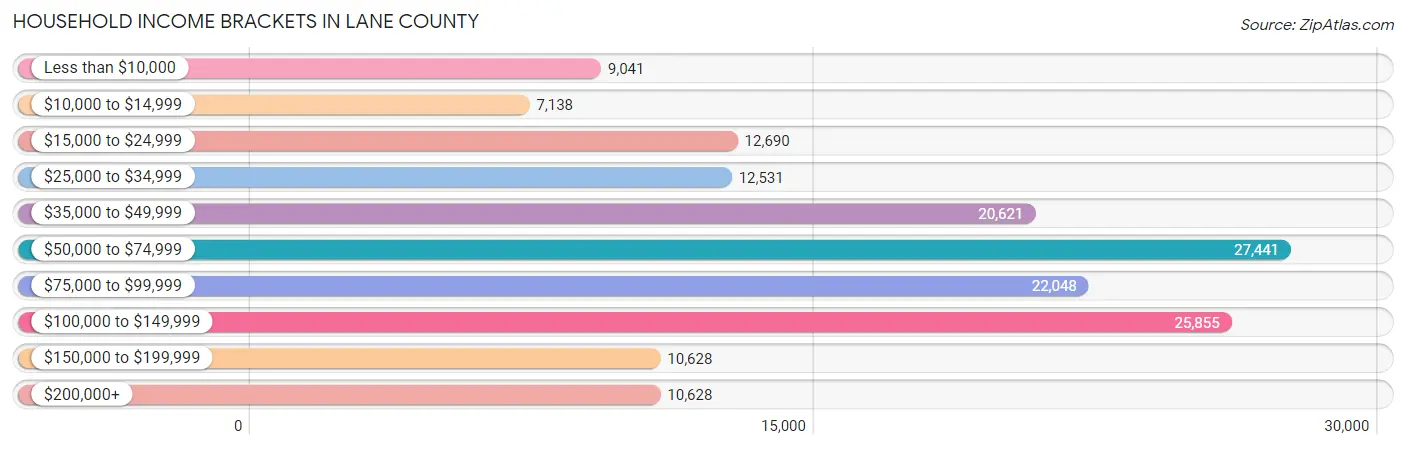
| Income Bracket | # Households | % Households |
| Less than $10,000 | 9,041 | 5.7% |
| $10,000 to $14,999 | 7,138 | 4.5% |
| $15,000 to $24,999 | 12,690 | 8.0% |
| $25,000 to $34,999 | 12,531 | 7.9% |
| $35,000 to $49,999 | 20,621 | 13.0% |
| $50,000 to $74,999 | 27,441 | 17.3% |
| $75,000 to $99,999 | 22,048 | 13.9% |
| $100,000 to $149,999 | 25,855 | 16.3% |
| $150,000 to $199,999 | 10,628 | 6.7% |
| $200,000+ | 10,628 | 6.7% |
Household Income by Householder Age in Lane County
The median household income in Lane County is $65,157, with the highest median household income of $78,145 found in the 45 to 64 years age bracket for the primary householder. A total of 50,833 households (32.1%) fall into this category. Meanwhile, the 15 to 24 years age bracket for the primary householder has the lowest median household income of $33,436, with 11,908 households (7.5%) in this group.
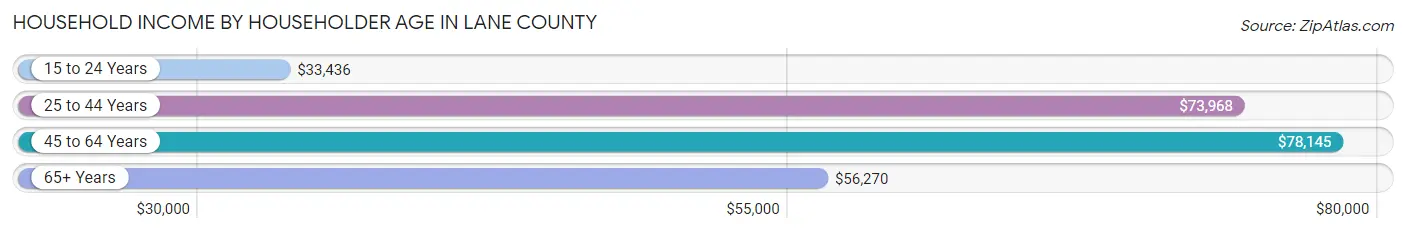
| Income Bracket | # Households | Median Income |
| 15 to 24 Years | 11,908 (7.5%) | $33,436 |
| 25 to 44 Years | 47,753 (30.1%) | $73,968 |
| 45 to 64 Years | 50,833 (32.1%) | $78,145 |
| 65+ Years | 48,127 (30.3%) | $56,270 |
| Total | 158,621 (100.0%) | $65,157 |
Poverty in Lane County
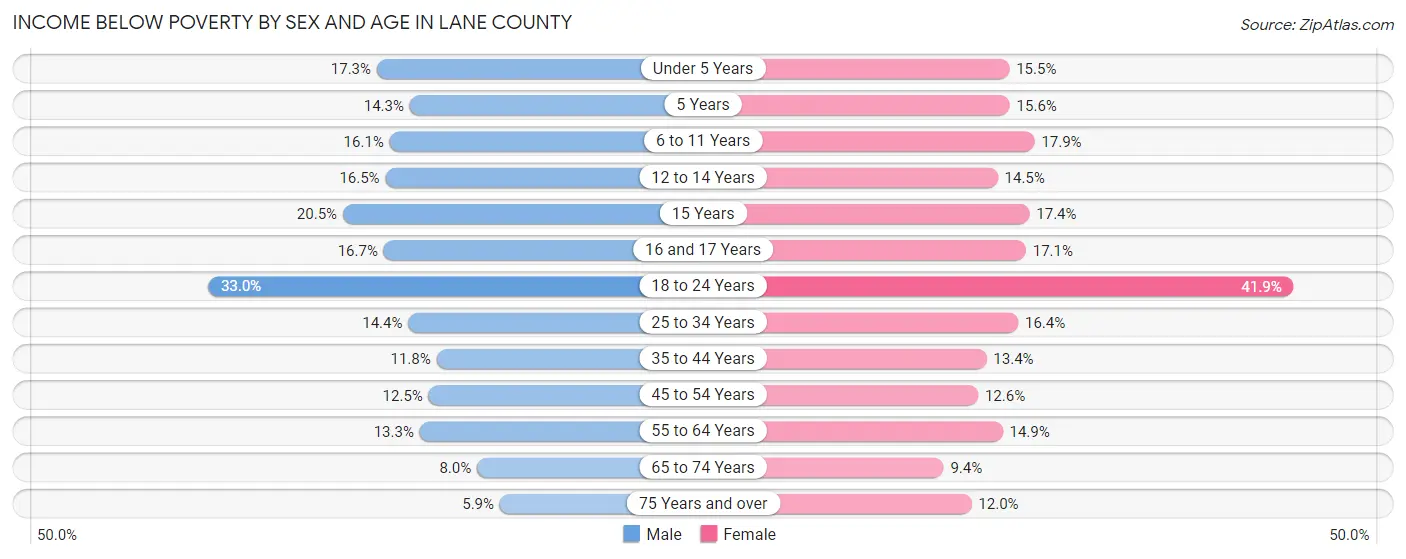
Income Below Poverty by Sex and Age in Lane County
With 15.1% poverty level for males and 17.2% for females among the residents of Lane County, 18 to 24 year old males and 18 to 24 year old females are the most vulnerable to poverty, with 7,491 males (33.0%) and 9,427 females (41.9%) in their respective age groups living below the poverty level.
| Age Bracket | Male | Female |
| Under 5 Years | 1,436 (17.3%) | 1,238 (15.5%) |
| 5 Years | 250 (14.2%) | 225 (15.6%) |
| 6 to 11 Years | 1,762 (16.1%) | 1,925 (17.9%) |
| 12 to 14 Years | 1,058 (16.5%) | 836 (14.5%) |
| 15 Years | 461 (20.5%) | 346 (17.4%) |
| 16 and 17 Years | 653 (16.7%) | 668 (17.1%) |
| 18 to 24 Years | 7,491 (33.0%) | 9,427 (41.9%) |
| 25 to 34 Years | 3,676 (14.4%) | 3,892 (16.4%) |
| 35 to 44 Years | 2,813 (11.8%) | 3,127 (13.4%) |
| 45 to 54 Years | 2,707 (12.5%) | 2,639 (12.6%) |
| 55 to 64 Years | 3,059 (13.3%) | 3,771 (14.9%) |
| 65 to 74 Years | 1,759 (8.0%) | 2,300 (9.4%) |
| 75 Years and over | 756 (5.9%) | 2,023 (12.0%) |
| Total | 27,881 (15.1%) | 32,417 (17.2%) |
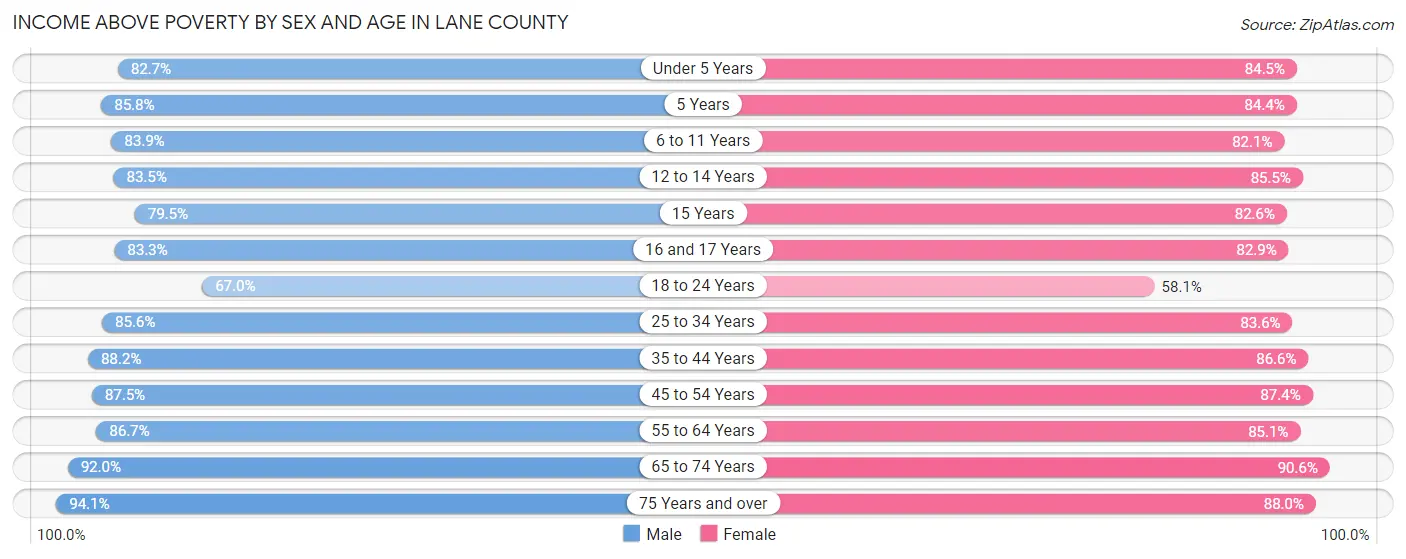
Income Above Poverty by Sex and Age in Lane County
According to the poverty statistics in Lane County, males aged 75 years and over and females aged 65 to 74 years are the age groups that are most secure financially, with 94.1% of males and 90.6% of females in these age groups living above the poverty line.
| Age Bracket | Male | Female |
| Under 5 Years | 6,862 (82.7%) | 6,729 (84.5%) |
| 5 Years | 1,505 (85.8%) | 1,219 (84.4%) |
| 6 to 11 Years | 9,166 (83.9%) | 8,840 (82.1%) |
| 12 to 14 Years | 5,350 (83.5%) | 4,946 (85.5%) |
| 15 Years | 1,792 (79.5%) | 1,641 (82.6%) |
| 16 and 17 Years | 3,264 (83.3%) | 3,242 (82.9%) |
| 18 to 24 Years | 15,223 (67.0%) | 13,055 (58.1%) |
| 25 to 34 Years | 21,864 (85.6%) | 19,891 (83.6%) |
| 35 to 44 Years | 21,077 (88.2%) | 20,169 (86.6%) |
| 45 to 54 Years | 18,954 (87.5%) | 18,238 (87.4%) |
| 55 to 64 Years | 19,897 (86.7%) | 21,508 (85.1%) |
| 65 to 74 Years | 20,205 (92.0%) | 22,064 (90.6%) |
| 75 Years and over | 12,073 (94.1%) | 14,789 (88.0%) |
| Total | 157,232 (84.9%) | 156,331 (82.8%) |
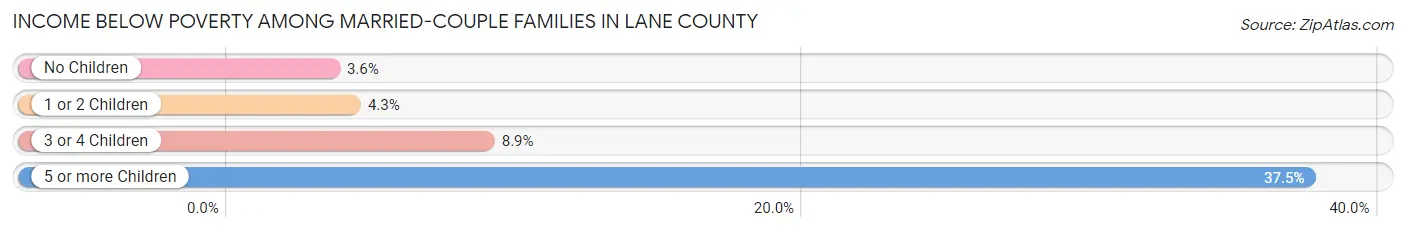
Income Below Poverty Among Married-Couple Families in Lane County
The poverty statistics for married-couple families in Lane County show that 4.2% or 2,864 of the total 67,621 families live below the poverty line. Families with 5 or more children have the highest poverty rate of 37.5%, comprising of 125 families. On the other hand, families with no children have the lowest poverty rate of 3.5%, which includes 1,580 families.
| Children | Above Poverty | Below Poverty |
| No Children | 42,938 (96.5%) | 1,580 (3.5%) |
| 1 or 2 Children | 17,993 (95.7%) | 804 (4.3%) |
| 3 or 4 Children | 3,618 (91.1%) | 355 (8.9%) |
| 5 or more Children | 208 (62.5%) | 125 (37.5%) |
| Total | 64,757 (95.8%) | 2,864 (4.2%) |
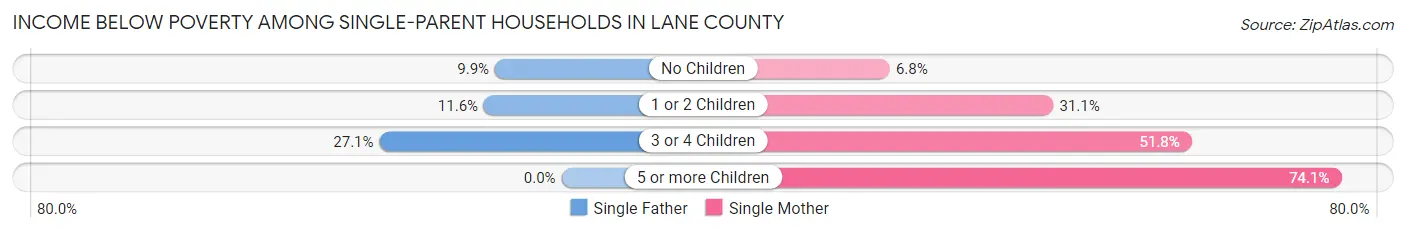
Income Below Poverty Among Single-Parent Households in Lane County
According to the poverty data in Lane County, 11.5% or 832 single-father households and 23.9% or 4,064 single-mother households are living below the poverty line. Among single-father households, those with 3 or 4 children have the highest poverty rate, with 73 households (27.1%) experiencing poverty. Likewise, among single-mother households, those with 5 or more children have the highest poverty rate, with 43 households (74.1%) falling below the poverty line.
| Children | Single Father | Single Mother |
| No Children | 291 (9.9%) | 413 (6.8%) |
| 1 or 2 Children | 468 (11.6%) | 2,988 (31.1%) |
| 3 or 4 Children | 73 (27.1%) | 620 (51.8%) |
| 5 or more Children | 0 (0.0%) | 43 (74.1%) |
| Total | 832 (11.5%) | 4,064 (23.9%) |
Income Below Poverty Among Married-Couple vs Single-Parent Households in Lane County
The poverty data for Lane County shows that 2,864 of the married-couple family households (4.2%) and 4,896 of the single-parent households (20.2%) are living below the poverty level. Within the married-couple family households, those with 5 or more children have the highest poverty rate, with 125 households (37.5%) falling below the poverty line. Among the single-parent households, those with 5 or more children have the highest poverty rate, with 43 household (64.2%) living below poverty.
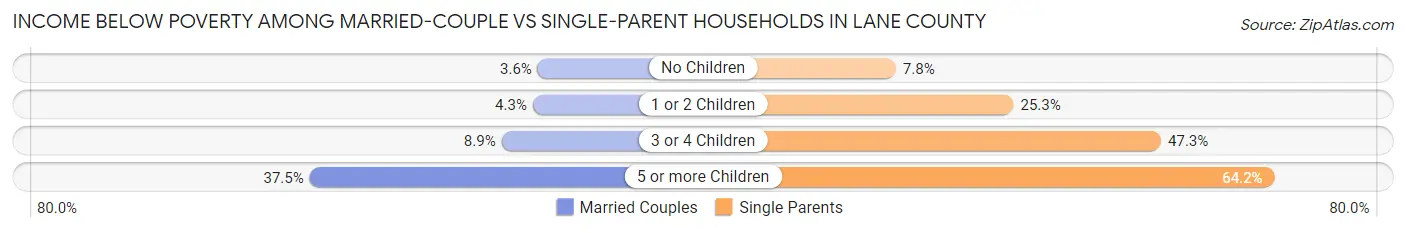
| Children | Married-Couple Families | Single-Parent Households |
| No Children | 1,580 (3.5%) | 704 (7.8%) |
| 1 or 2 Children | 804 (4.3%) | 3,456 (25.3%) |
| 3 or 4 Children | 355 (8.9%) | 693 (47.3%) |
| 5 or more Children | 125 (37.5%) | 43 (64.2%) |
| Total | 2,864 (4.2%) | 4,896 (20.2%) |
Employment Characteristics in Lane County
Employment by Class of Employer in Lane County
Among the 178,879 employed individuals in Lane County, private company employees (109,665 | 61.3%), not-for-profit organizations (17,333 | 9.7%), and state government employees (13,775 | 7.7%) make up the most common classes of employment.
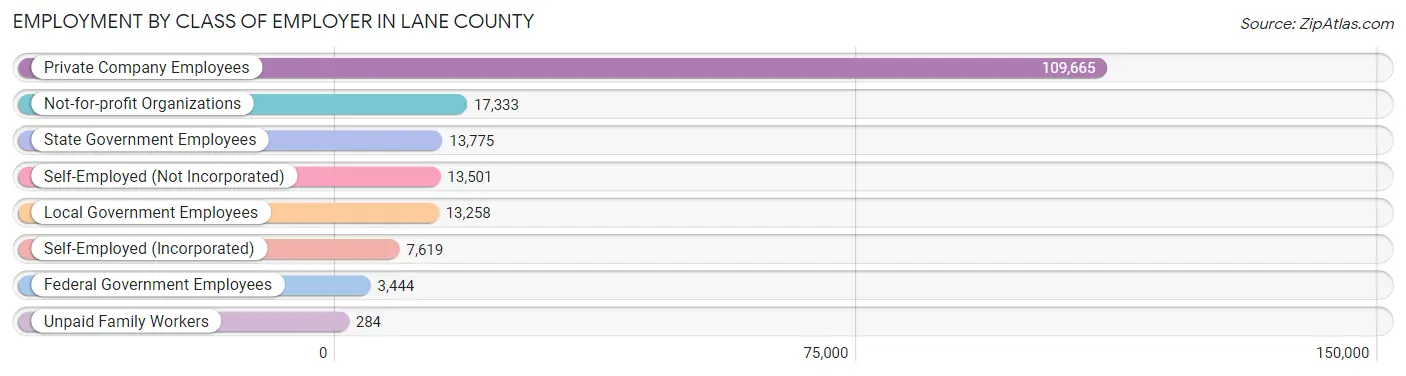
| Employer Class | # Employees | % Employees |
| Private Company Employees | 109,665 | 61.3% |
| Self-Employed (Incorporated) | 7,619 | 4.3% |
| Self-Employed (Not Incorporated) | 13,501 | 7.5% |
| Not-for-profit Organizations | 17,333 | 9.7% |
| Local Government Employees | 13,258 | 7.4% |
| State Government Employees | 13,775 | 7.7% |
| Federal Government Employees | 3,444 | 1.9% |
| Unpaid Family Workers | 284 | 0.2% |
| Total | 178,879 | 100.0% |
Employment Status by Age in Lane County
According to the labor force statistics for Lane County, out of the total population over 16 years of age (322,293), 60.5% or 194,987 individuals are in the labor force, with 6.7% or 13,064 of them unemployed. The age group with the highest labor force participation rate is 30 to 34 years, with 84.3% or 19,959 individuals in the labor force. Within the labor force, the 16 to 19 years age range has the highest percentage of unemployed individuals, with 20.0% or 1,771 of them being unemployed.
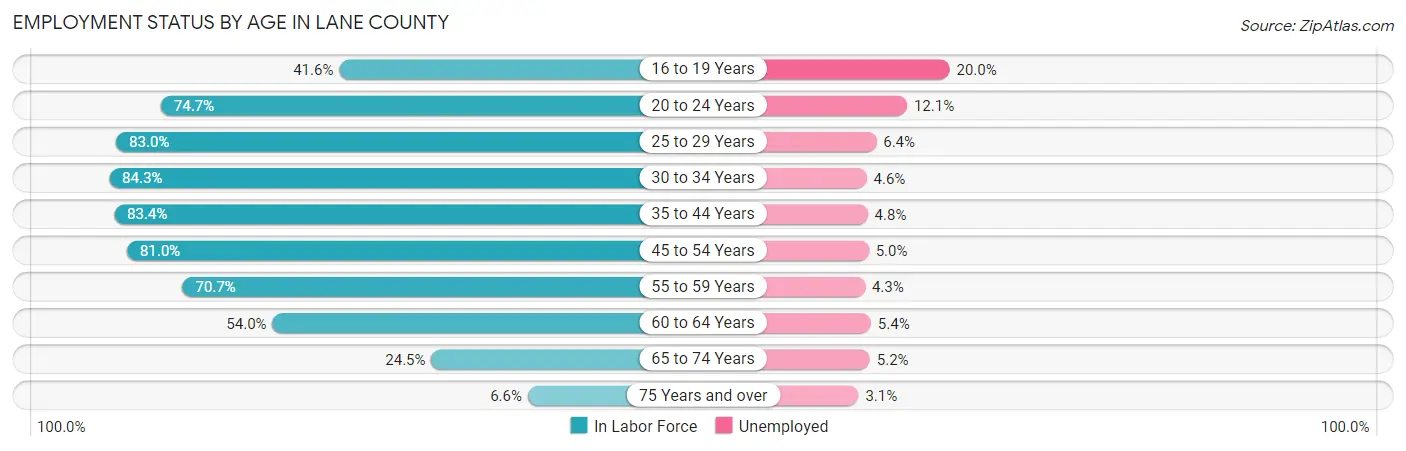
| Age Bracket | In Labor Force | Unemployed |
| 16 to 19 Years | 8,855 (41.6%) | 1,771 (20.0%) |
| 20 to 24 Years | 27,037 (74.7%) | 3,271 (12.1%) |
| 25 to 29 Years | 21,487 (83.0%) | 1,375 (6.4%) |
| 30 to 34 Years | 19,959 (84.3%) | 918 (4.6%) |
| 35 to 44 Years | 39,475 (83.4%) | 1,895 (4.8%) |
| 45 to 54 Years | 34,555 (81.0%) | 1,728 (5.0%) |
| 55 to 59 Years | 16,975 (70.7%) | 730 (4.3%) |
| 60 to 64 Years | 13,247 (54.0%) | 715 (5.4%) |
| 65 to 74 Years | 11,405 (24.5%) | 593 (5.2%) |
| 75 Years and over | 1,991 (6.6%) | 62 (3.1%) |
| Total | 194,987 (60.5%) | 13,064 (6.7%) |
Employment Status by Educational Attainment in Lane County
According to labor force statistics for Lane County, 77.5% of individuals (145,776) out of the total population between 25 and 64 years of age (188,098) are in the labor force, with 5.1% or 7,435 of them being unemployed. The group with the highest labor force participation rate are those with the educational attainment of bachelor's degree or higher, with 85.0% or 51,570 individuals in the labor force. Within the labor force, individuals with less than high school education have the highest percentage of unemployment, with 7.9% or 700 of them being unemployed.
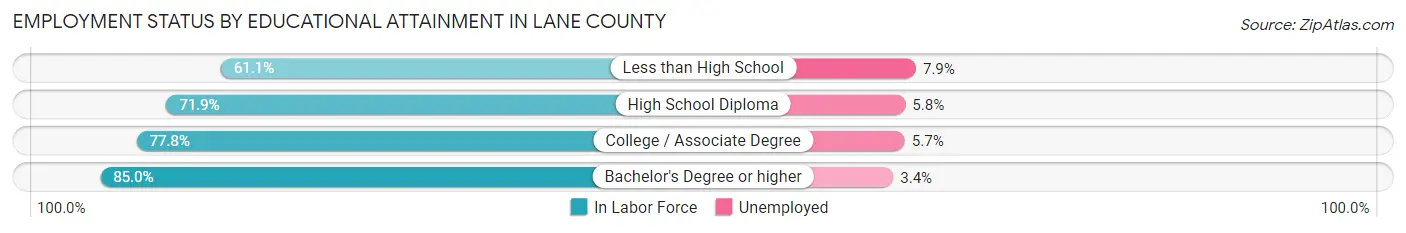
| Educational Attainment | In Labor Force | Unemployed |
| Less than High School | 8,858 (61.1%) | 1,145 (7.9%) |
| High School Diploma | 30,879 (71.9%) | 2,491 (5.8%) |
| College / Associate Degree | 54,446 (77.8%) | 3,989 (5.7%) |
| Bachelor's Degree or higher | 51,570 (85.0%) | 2,063 (3.4%) |
| Total | 145,776 (77.5%) | 9,593 (5.1%) |
Employment Occupations by Sex in Lane County
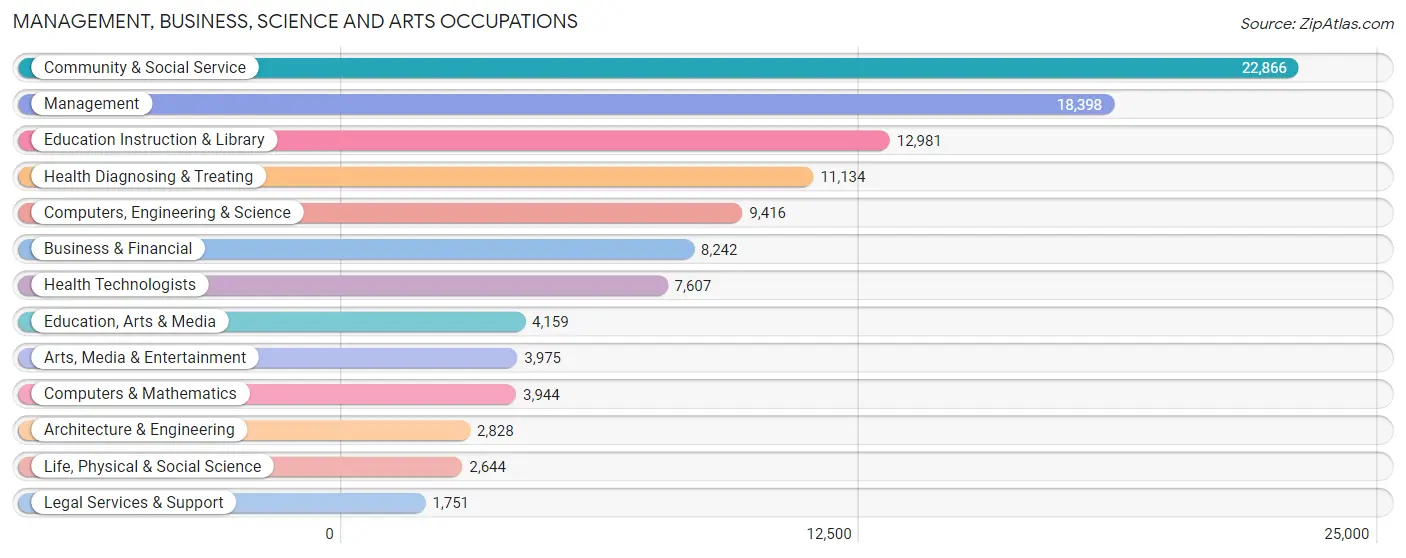
Management, Business, Science and Arts Occupations
The most common Management, Business, Science and Arts occupations in Lane County are Community & Social Service (22,866 | 12.6%), Management (18,398 | 10.1%), Education Instruction & Library (12,981 | 7.1%), Health Diagnosing & Treating (11,134 | 6.1%), and Computers, Engineering & Science (9,416 | 5.2%).
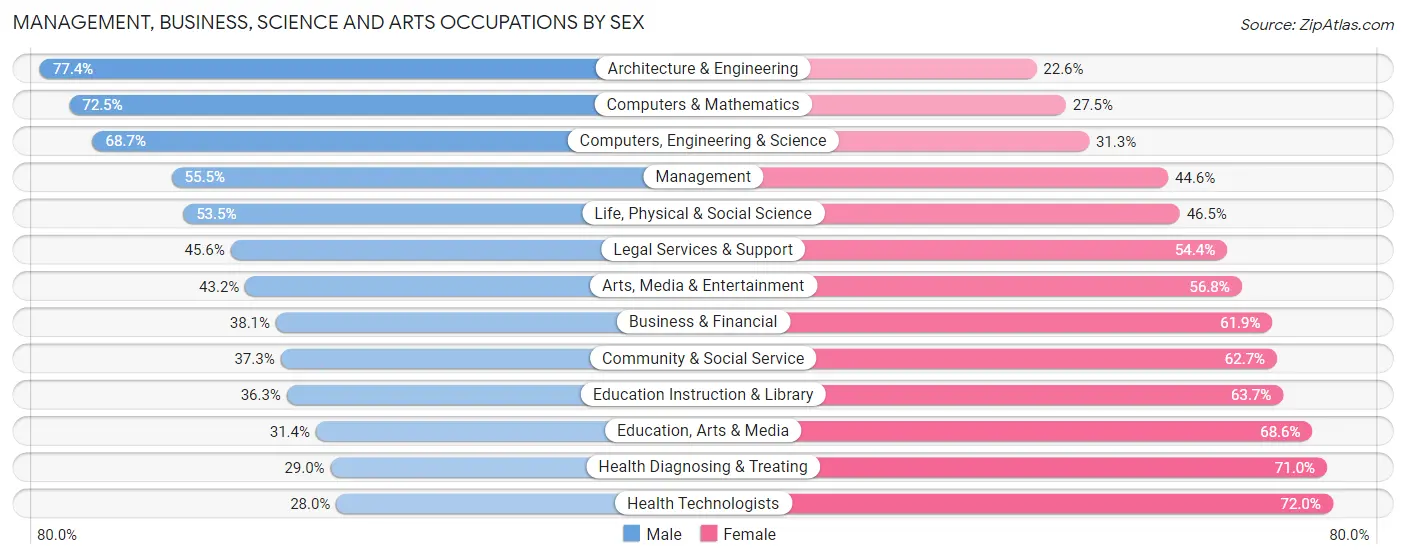
Management, Business, Science and Arts Occupations by Sex
Within the Management, Business, Science and Arts occupations in Lane County, the most male-oriented occupations are Architecture & Engineering (77.4%), Computers & Mathematics (72.5%), and Computers, Engineering & Science (68.7%), while the most female-oriented occupations are Health Technologists (72.0%), Health Diagnosing & Treating (71.0%), and Education, Arts & Media (68.6%).
| Occupation | Male | Female |
| Management | 10,201 (55.4%) | 8,197 (44.6%) |
| Business & Financial | 3,138 (38.1%) | 5,104 (61.9%) |
| Computers, Engineering & Science | 6,465 (68.7%) | 2,951 (31.3%) |
| Computers & Mathematics | 2,860 (72.5%) | 1,084 (27.5%) |
| Architecture & Engineering | 2,190 (77.4%) | 638 (22.6%) |
| Life, Physical & Social Science | 1,415 (53.5%) | 1,229 (46.5%) |
| Community & Social Service | 8,529 (37.3%) | 14,337 (62.7%) |
| Education, Arts & Media | 1,306 (31.4%) | 2,853 (68.6%) |
| Legal Services & Support | 799 (45.6%) | 952 (54.4%) |
| Education Instruction & Library | 4,707 (36.3%) | 8,274 (63.7%) |
| Arts, Media & Entertainment | 1,717 (43.2%) | 2,258 (56.8%) |
| Health Diagnosing & Treating | 3,224 (29.0%) | 7,910 (71.0%) |
| Health Technologists | 2,130 (28.0%) | 5,477 (72.0%) |
| Total (Category) | 31,557 (45.1%) | 38,499 (54.9%) |
| Total (Overall) | 94,395 (52.0%) | 87,278 (48.0%) |
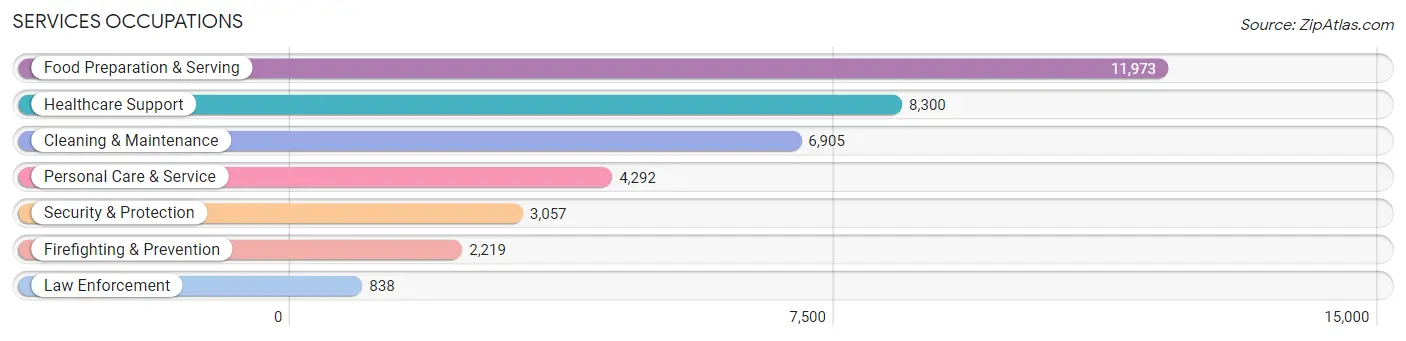
Services Occupations
The most common Services occupations in Lane County are Food Preparation & Serving (11,973 | 6.6%), Healthcare Support (8,300 | 4.6%), Cleaning & Maintenance (6,905 | 3.8%), Personal Care & Service (4,292 | 2.4%), and Security & Protection (3,057 | 1.7%).
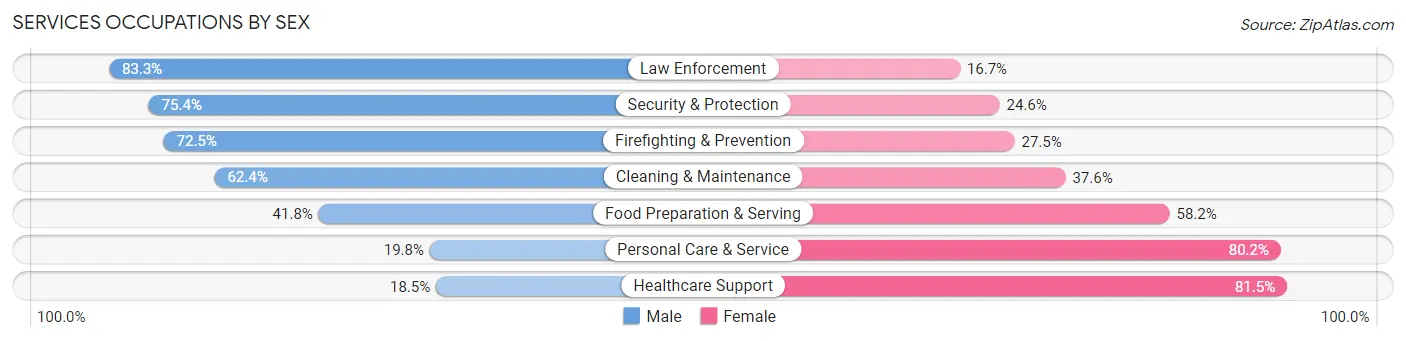
Services Occupations by Sex
Within the Services occupations in Lane County, the most male-oriented occupations are Law Enforcement (83.3%), Security & Protection (75.4%), and Firefighting & Prevention (72.5%), while the most female-oriented occupations are Healthcare Support (81.5%), Personal Care & Service (80.2%), and Food Preparation & Serving (58.2%).
| Occupation | Male | Female |
| Healthcare Support | 1,538 (18.5%) | 6,762 (81.5%) |
| Security & Protection | 2,306 (75.4%) | 751 (24.6%) |
| Firefighting & Prevention | 1,608 (72.5%) | 611 (27.5%) |
| Law Enforcement | 698 (83.3%) | 140 (16.7%) |
| Food Preparation & Serving | 5,001 (41.8%) | 6,972 (58.2%) |
| Cleaning & Maintenance | 4,308 (62.4%) | 2,597 (37.6%) |
| Personal Care & Service | 848 (19.8%) | 3,444 (80.2%) |
| Total (Category) | 14,001 (40.6%) | 20,526 (59.5%) |
| Total (Overall) | 94,395 (52.0%) | 87,278 (48.0%) |
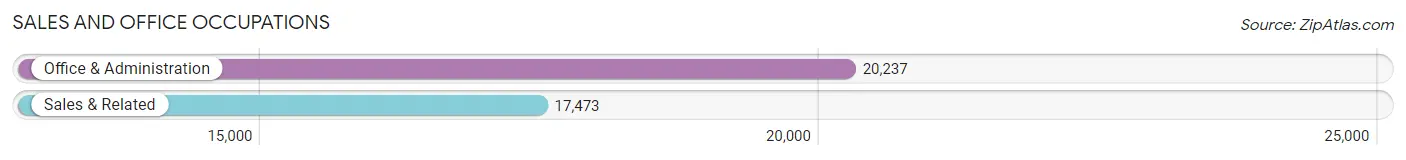
Sales and Office Occupations
The most common Sales and Office occupations in Lane County are Office & Administration (20,237 | 11.1%), and Sales & Related (17,473 | 9.6%).
Sales and Office Occupations by Sex
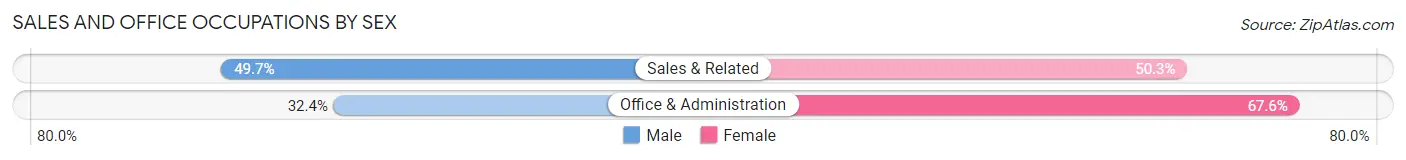
| Occupation | Male | Female |
| Sales & Related | 8,691 (49.7%) | 8,782 (50.3%) |
| Office & Administration | 6,565 (32.4%) | 13,672 (67.6%) |
| Total (Category) | 15,256 (40.5%) | 22,454 (59.5%) |
| Total (Overall) | 94,395 (52.0%) | 87,278 (48.0%) |
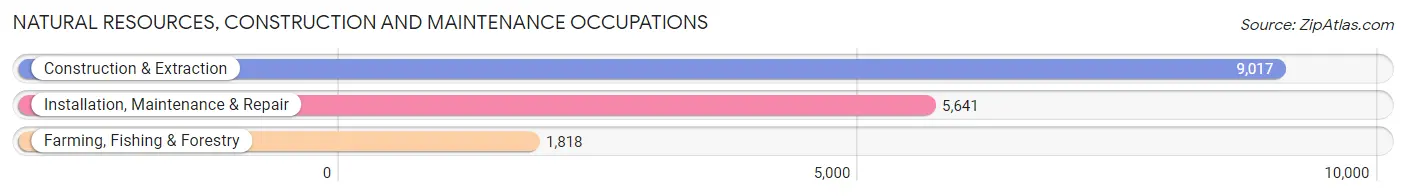
Natural Resources, Construction and Maintenance Occupations
The most common Natural Resources, Construction and Maintenance occupations in Lane County are Construction & Extraction (9,017 | 5.0%), Installation, Maintenance & Repair (5,641 | 3.1%), and Farming, Fishing & Forestry (1,818 | 1.0%).
Natural Resources, Construction and Maintenance Occupations by Sex
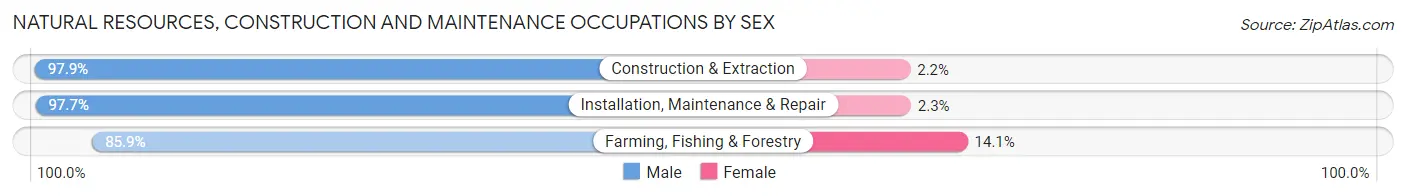
| Occupation | Male | Female |
| Farming, Fishing & Forestry | 1,562 (85.9%) | 256 (14.1%) |
| Construction & Extraction | 8,823 (97.9%) | 194 (2.1%) |
| Installation, Maintenance & Repair | 5,513 (97.7%) | 128 (2.3%) |
| Total (Category) | 15,898 (96.5%) | 578 (3.5%) |
| Total (Overall) | 94,395 (52.0%) | 87,278 (48.0%) |
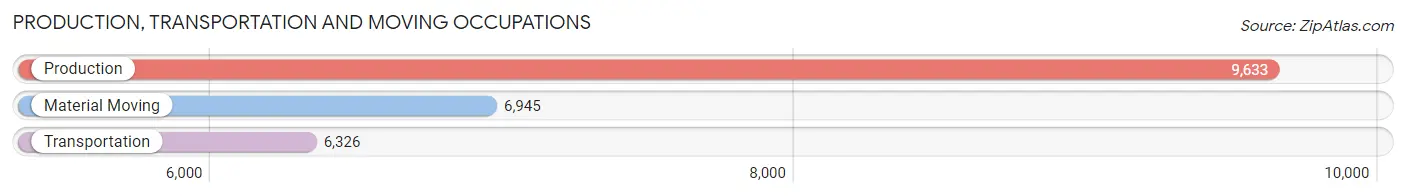
Production, Transportation and Moving Occupations
The most common Production, Transportation and Moving occupations in Lane County are Production (9,633 | 5.3%), Material Moving (6,945 | 3.8%), and Transportation (6,326 | 3.5%).
Production, Transportation and Moving Occupations by Sex
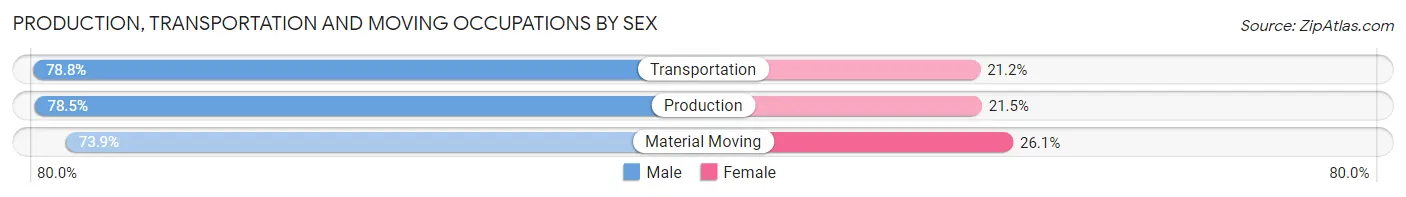
| Occupation | Male | Female |
| Production | 7,565 (78.5%) | 2,068 (21.5%) |
| Transportation | 4,983 (78.8%) | 1,343 (21.2%) |
| Material Moving | 5,135 (73.9%) | 1,810 (26.1%) |
| Total (Category) | 17,683 (77.2%) | 5,221 (22.8%) |
| Total (Overall) | 94,395 (52.0%) | 87,278 (48.0%) |
Employment Industries by Sex in Lane County
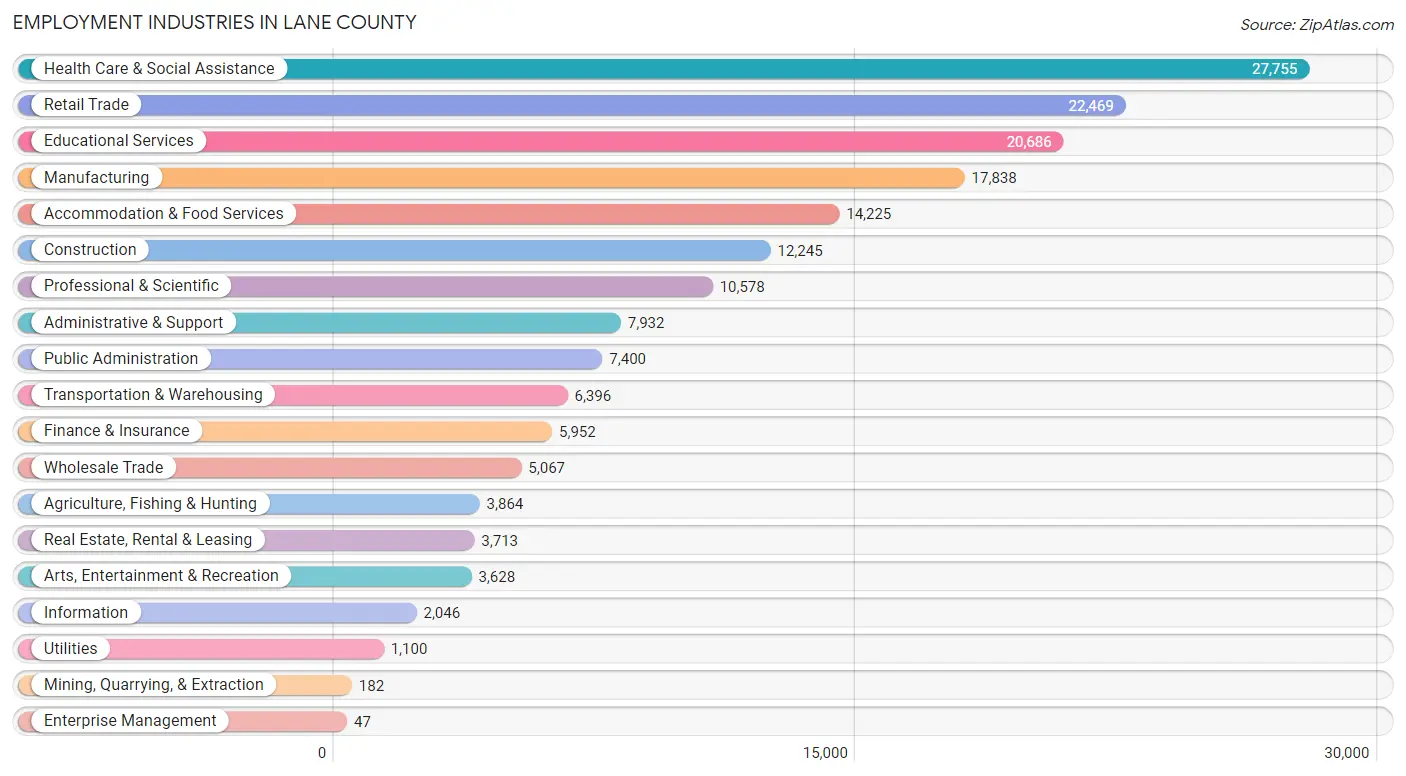
Employment Industries in Lane County
The major employment industries in Lane County include Health Care & Social Assistance (27,755 | 15.3%), Retail Trade (22,469 | 12.4%), Educational Services (20,686 | 11.4%), Manufacturing (17,838 | 9.8%), and Accommodation & Food Services (14,225 | 7.8%).
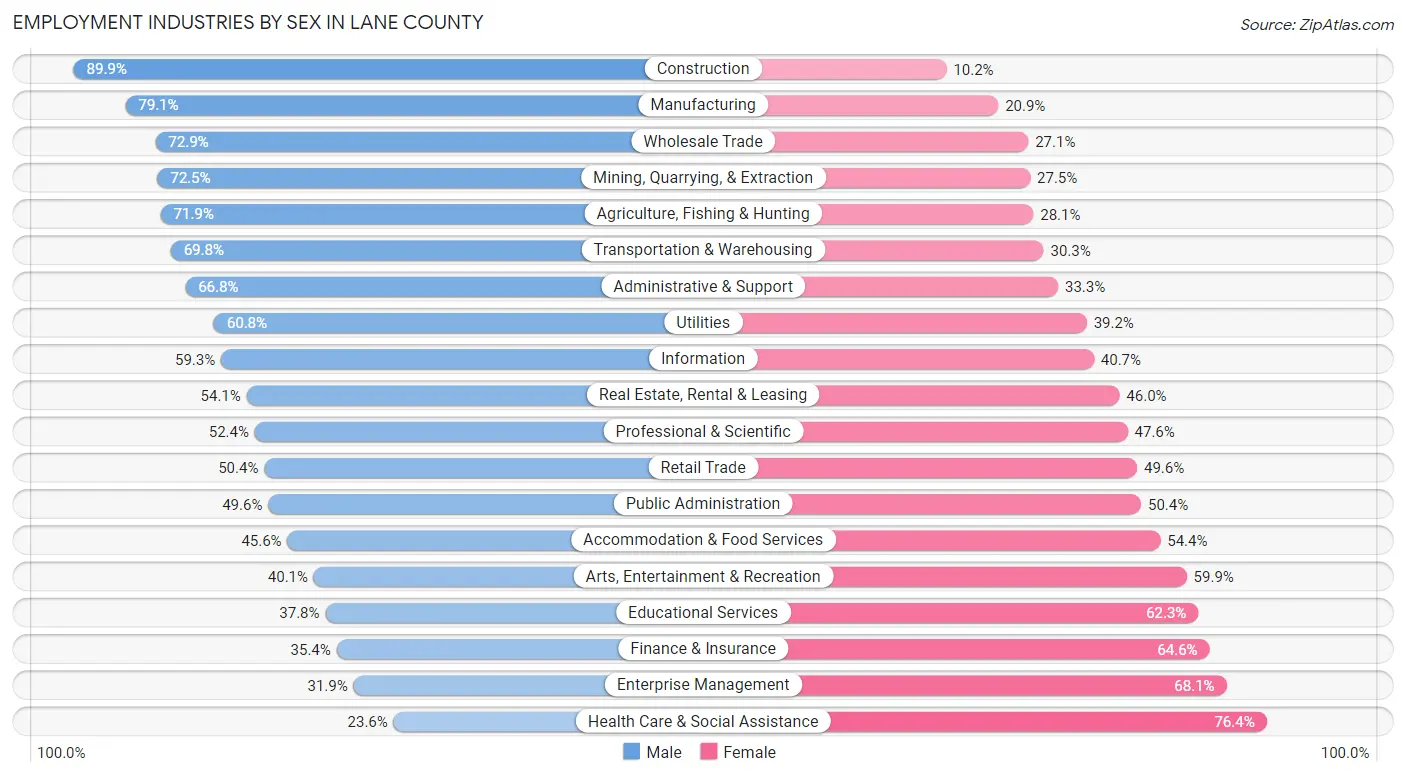
Employment Industries by Sex in Lane County
The Lane County industries that see more men than women are Construction (89.8%), Manufacturing (79.1%), and Wholesale Trade (72.9%), whereas the industries that tend to have a higher number of women are Health Care & Social Assistance (76.4%), Enterprise Management (68.1%), and Finance & Insurance (64.6%).
| Industry | Male | Female |
| Agriculture, Fishing & Hunting | 2,777 (71.9%) | 1,087 (28.1%) |
| Mining, Quarrying, & Extraction | 132 (72.5%) | 50 (27.5%) |
| Construction | 11,002 (89.8%) | 1,243 (10.2%) |
| Manufacturing | 14,117 (79.1%) | 3,721 (20.9%) |
| Wholesale Trade | 3,695 (72.9%) | 1,372 (27.1%) |
| Retail Trade | 11,325 (50.4%) | 11,144 (49.6%) |
| Transportation & Warehousing | 4,461 (69.8%) | 1,935 (30.2%) |
| Utilities | 669 (60.8%) | 431 (39.2%) |
| Information | 1,214 (59.3%) | 832 (40.7%) |
| Finance & Insurance | 2,108 (35.4%) | 3,844 (64.6%) |
| Real Estate, Rental & Leasing | 2,007 (54.0%) | 1,706 (46.0%) |
| Professional & Scientific | 5,539 (52.4%) | 5,039 (47.6%) |
| Enterprise Management | 15 (31.9%) | 32 (68.1%) |
| Administrative & Support | 5,295 (66.7%) | 2,637 (33.3%) |
| Educational Services | 7,809 (37.8%) | 12,877 (62.3%) |
| Health Care & Social Assistance | 6,557 (23.6%) | 21,198 (76.4%) |
| Arts, Entertainment & Recreation | 1,456 (40.1%) | 2,172 (59.9%) |
| Accommodation & Food Services | 6,485 (45.6%) | 7,740 (54.4%) |
| Public Administration | 3,668 (49.6%) | 3,732 (50.4%) |
| Total | 94,395 (52.0%) | 87,278 (48.0%) |
Education in Lane County
School Enrollment in Lane County
The most common levels of schooling among the 89,630 students in Lane County are college / undergraduate (29,869 | 33.3%), high school (16,122 | 18.0%), and middle school (16,082 | 17.9%).
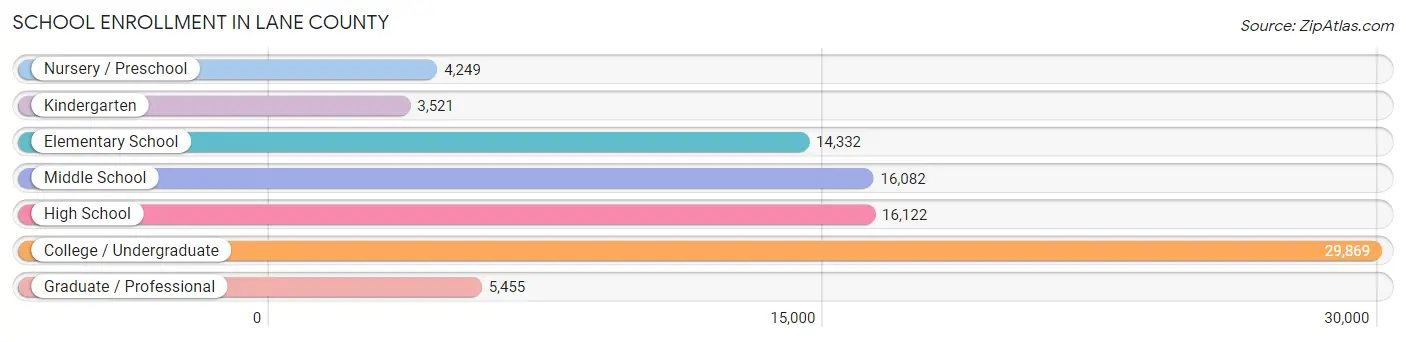
| School Level | # Students | % Students |
| Nursery / Preschool | 4,249 | 4.7% |
| Kindergarten | 3,521 | 3.9% |
| Elementary School | 14,332 | 16.0% |
| Middle School | 16,082 | 17.9% |
| High School | 16,122 | 18.0% |
| College / Undergraduate | 29,869 | 33.3% |
| Graduate / Professional | 5,455 | 6.1% |
| Total | 89,630 | 100.0% |
School Enrollment by Age by Funding Source in Lane County
Out of a total of 89,630 students who are enrolled in schools in Lane County, 10,039 (11.2%) attend a private institution, while the remaining 79,591 (88.8%) are enrolled in public schools. The age group of 3 to 4 year olds has the highest likelihood of being enrolled in private schools, with 1,503 (45.7% in the age bracket) enrolled. Conversely, the age group of 18 to 19 year olds has the lowest likelihood of being enrolled in a private school, with 9,333 (94.2% in the age bracket) attending a public institution.
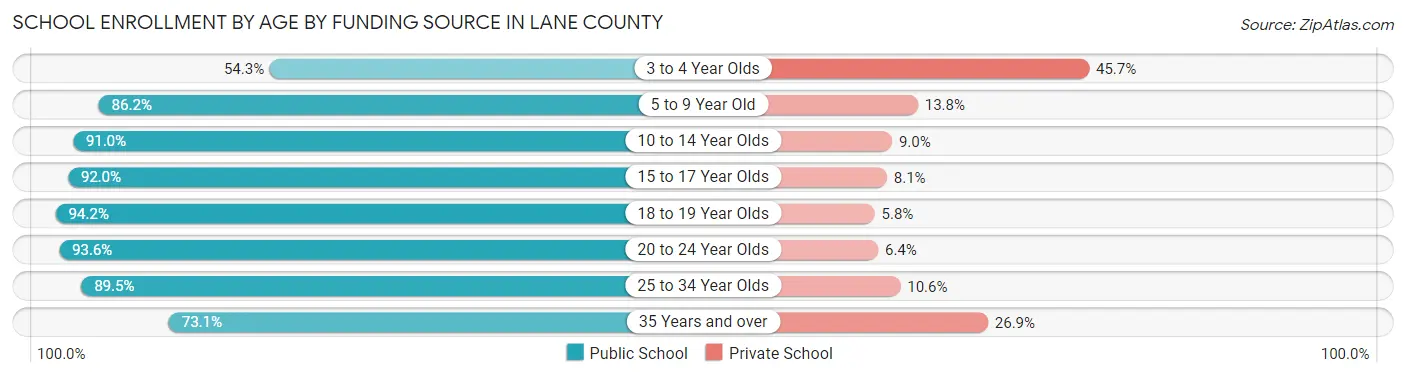
| Age Bracket | Public School | Private School |
| 3 to 4 Year Olds | 1,785 (54.3%) | 1,503 (45.7%) |
| 5 to 9 Year Old | 14,552 (86.2%) | 2,330 (13.8%) |
| 10 to 14 Year Olds | 18,204 (91.0%) | 1,800 (9.0%) |
| 15 to 17 Year Olds | 10,730 (91.9%) | 940 (8.1%) |
| 18 to 19 Year Olds | 9,333 (94.2%) | 570 (5.8%) |
| 20 to 24 Year Olds | 16,077 (93.6%) | 1,100 (6.4%) |
| 25 to 34 Year Olds | 5,760 (89.4%) | 679 (10.5%) |
| 35 Years and over | 3,121 (73.1%) | 1,146 (26.9%) |
| Total | 79,591 (88.8%) | 10,039 (11.2%) |
Educational Attainment by Field of Study in Lane County
Business (11,811 | 12.1%), social sciences (10,698 | 11.0%), education (9,576 | 9.8%), bio, nature & agricultural (8,861 | 9.1%), and science & technology (8,655 | 8.9%) are the most common fields of study among 97,426 individuals in Lane County who have obtained a bachelor's degree or higher.
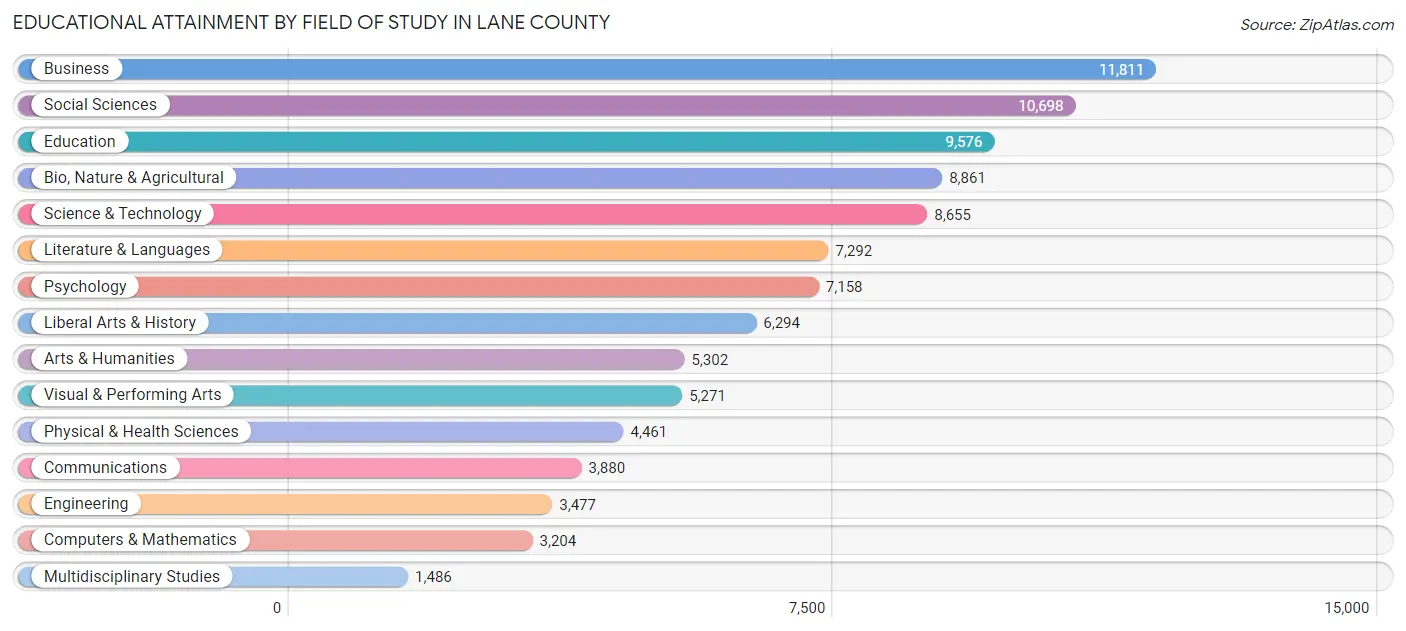
| Field of Study | # Graduates | % Graduates |
| Computers & Mathematics | 3,204 | 3.3% |
| Bio, Nature & Agricultural | 8,861 | 9.1% |
| Physical & Health Sciences | 4,461 | 4.6% |
| Psychology | 7,158 | 7.3% |
| Social Sciences | 10,698 | 11.0% |
| Engineering | 3,477 | 3.6% |
| Multidisciplinary Studies | 1,486 | 1.5% |
| Science & Technology | 8,655 | 8.9% |
| Business | 11,811 | 12.1% |
| Education | 9,576 | 9.8% |
| Literature & Languages | 7,292 | 7.5% |
| Liberal Arts & History | 6,294 | 6.5% |
| Visual & Performing Arts | 5,271 | 5.4% |
| Communications | 3,880 | 4.0% |
| Arts & Humanities | 5,302 | 5.4% |
| Total | 97,426 | 100.0% |
Transportation & Commute in Lane County
Vehicle Availability by Sex in Lane County
The most prevalent vehicle ownership categories in Lane County are males with 2 vehicles (36,963, accounting for 39.8%) and females with 2 vehicles (32,681, making up 43.6%).
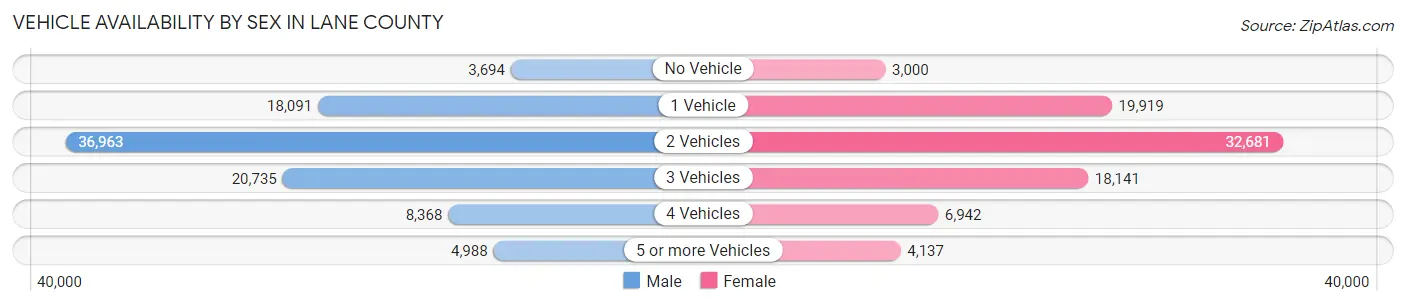
| Vehicles Available | Male | Female |
| No Vehicle | 3,694 (4.0%) | 3,000 (3.5%) |
| 1 Vehicle | 18,091 (19.5%) | 19,919 (23.5%) |
| 2 Vehicles | 36,963 (39.8%) | 32,681 (38.5%) |
| 3 Vehicles | 20,735 (22.3%) | 18,141 (21.4%) |
| 4 Vehicles | 8,368 (9.0%) | 6,942 (8.2%) |
| 5 or more Vehicles | 4,988 (5.4%) | 4,137 (4.9%) |
| Total | 92,839 (100.0%) | 84,820 (100.0%) |
Commute Time in Lane County
The most frequently occuring commute durations in Lane County are 15 to 19 minutes (34,195 commuters, 21.8%), 10 to 14 minutes (32,399 commuters, 20.7%), and 20 to 24 minutes (24,052 commuters, 15.3%).
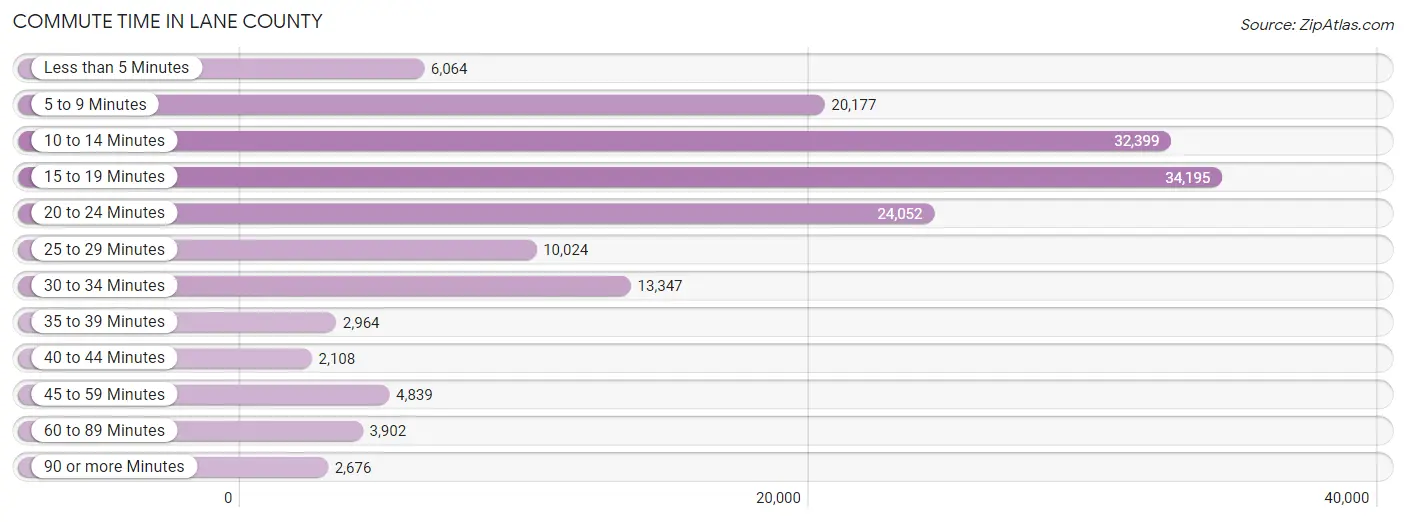
| Commute Time | # Commuters | % Commuters |
| Less than 5 Minutes | 6,064 | 3.9% |
| 5 to 9 Minutes | 20,177 | 12.9% |
| 10 to 14 Minutes | 32,399 | 20.7% |
| 15 to 19 Minutes | 34,195 | 21.8% |
| 20 to 24 Minutes | 24,052 | 15.3% |
| 25 to 29 Minutes | 10,024 | 6.4% |
| 30 to 34 Minutes | 13,347 | 8.5% |
| 35 to 39 Minutes | 2,964 | 1.9% |
| 40 to 44 Minutes | 2,108 | 1.3% |
| 45 to 59 Minutes | 4,839 | 3.1% |
| 60 to 89 Minutes | 3,902 | 2.5% |
| 90 or more Minutes | 2,676 | 1.7% |
Commute Time by Sex in Lane County
The most common commute times in Lane County are 15 to 19 minutes (18,174 commuters, 21.7%) for males and 15 to 19 minutes (16,021 commuters, 21.9%) for females.
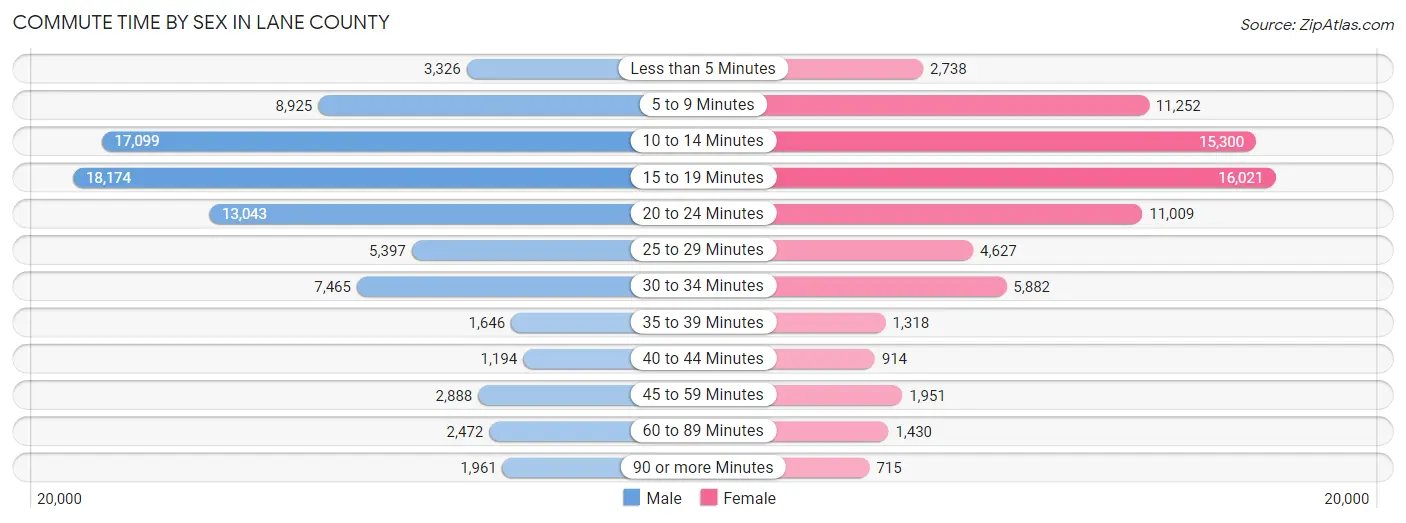
| Commute Time | Male | Female |
| Less than 5 Minutes | 3,326 (4.0%) | 2,738 (3.7%) |
| 5 to 9 Minutes | 8,925 (10.7%) | 11,252 (15.4%) |
| 10 to 14 Minutes | 17,099 (20.5%) | 15,300 (20.9%) |
| 15 to 19 Minutes | 18,174 (21.7%) | 16,021 (21.9%) |
| 20 to 24 Minutes | 13,043 (15.6%) | 11,009 (15.0%) |
| 25 to 29 Minutes | 5,397 (6.5%) | 4,627 (6.3%) |
| 30 to 34 Minutes | 7,465 (8.9%) | 5,882 (8.0%) |
| 35 to 39 Minutes | 1,646 (2.0%) | 1,318 (1.8%) |
| 40 to 44 Minutes | 1,194 (1.4%) | 914 (1.3%) |
| 45 to 59 Minutes | 2,888 (3.5%) | 1,951 (2.7%) |
| 60 to 89 Minutes | 2,472 (3.0%) | 1,430 (1.9%) |
| 90 or more Minutes | 1,961 (2.4%) | 715 (1.0%) |
Time of Departure to Work by Sex in Lane County
The most frequent times of departure to work in Lane County are 7:30 AM to 7:59 AM (10,579, 12.7%) for males and 7:30 AM to 7:59 AM (11,933, 16.3%) for females.
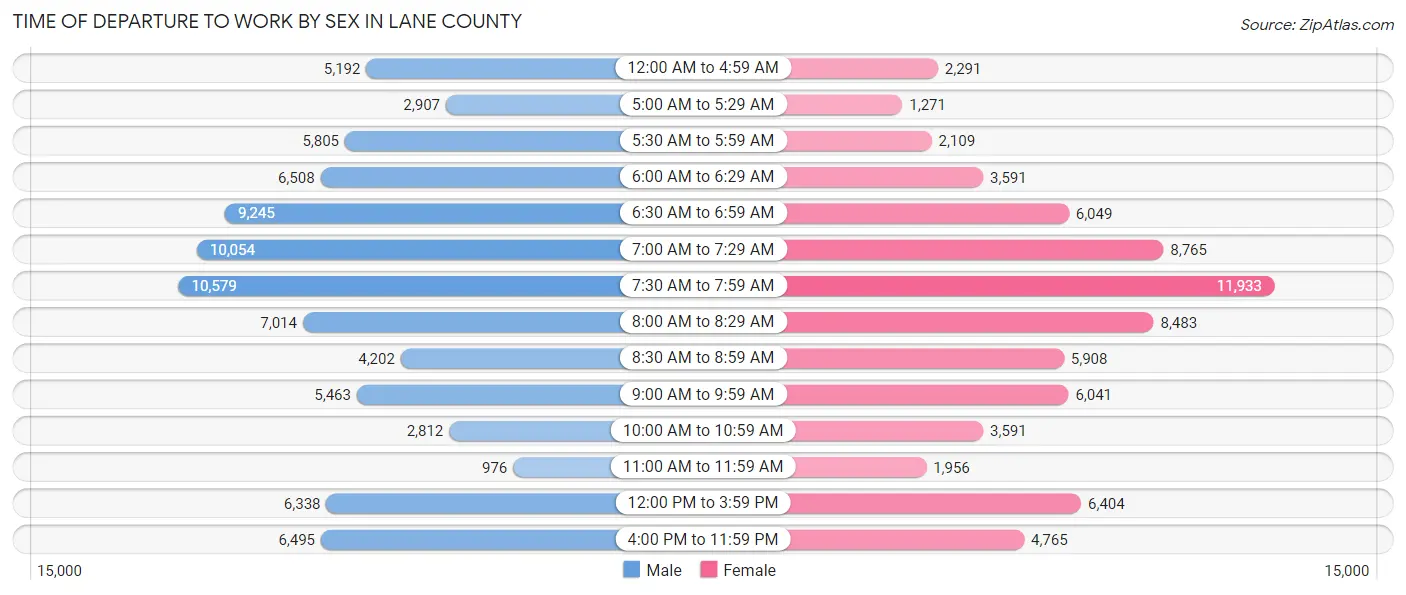
| Time of Departure | Male | Female |
| 12:00 AM to 4:59 AM | 5,192 (6.2%) | 2,291 (3.1%) |
| 5:00 AM to 5:29 AM | 2,907 (3.5%) | 1,271 (1.7%) |
| 5:30 AM to 5:59 AM | 5,805 (6.9%) | 2,109 (2.9%) |
| 6:00 AM to 6:29 AM | 6,508 (7.8%) | 3,591 (4.9%) |
| 6:30 AM to 6:59 AM | 9,245 (11.1%) | 6,049 (8.3%) |
| 7:00 AM to 7:29 AM | 10,054 (12.0%) | 8,765 (12.0%) |
| 7:30 AM to 7:59 AM | 10,579 (12.7%) | 11,933 (16.3%) |
| 8:00 AM to 8:29 AM | 7,014 (8.4%) | 8,483 (11.6%) |
| 8:30 AM to 8:59 AM | 4,202 (5.0%) | 5,908 (8.1%) |
| 9:00 AM to 9:59 AM | 5,463 (6.5%) | 6,041 (8.3%) |
| 10:00 AM to 10:59 AM | 2,812 (3.4%) | 3,591 (4.9%) |
| 11:00 AM to 11:59 AM | 976 (1.2%) | 1,956 (2.7%) |
| 12:00 PM to 3:59 PM | 6,338 (7.6%) | 6,404 (8.7%) |
| 4:00 PM to 11:59 PM | 6,495 (7.8%) | 4,765 (6.5%) |
| Total | 83,590 (100.0%) | 73,157 (100.0%) |
Housing Occupancy in Lane County
Occupancy by Ownership in Lane County
Of the total 158,621 dwellings in Lane County, owner-occupied units account for 94,086 (59.3%), while renter-occupied units make up 64,535 (40.7%).
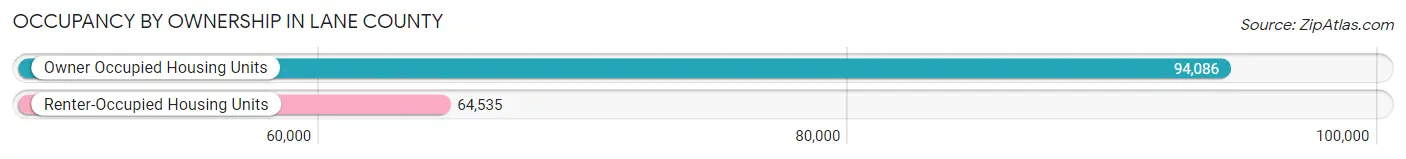
| Occupancy | # Housing Units | % Housing Units |
| Owner Occupied Housing Units | 94,086 | 59.3% |
| Renter-Occupied Housing Units | 64,535 | 40.7% |
| Total Occupied Housing Units | 158,621 | 100.0% |
Occupancy by Household Size in Lane County
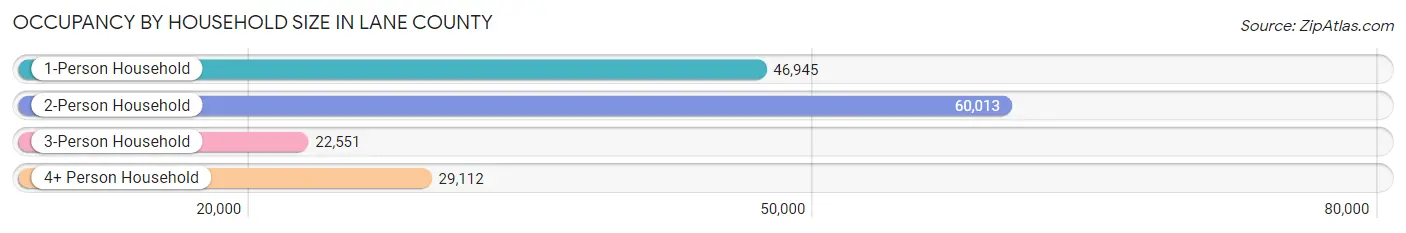
| Household Size | # Housing Units | % Housing Units |
| 1-Person Household | 46,945 | 29.6% |
| 2-Person Household | 60,013 | 37.8% |
| 3-Person Household | 22,551 | 14.2% |
| 4+ Person Household | 29,112 | 18.3% |
| Total Housing Units | 158,621 | 100.0% |
Occupancy by Ownership by Household Size in Lane County
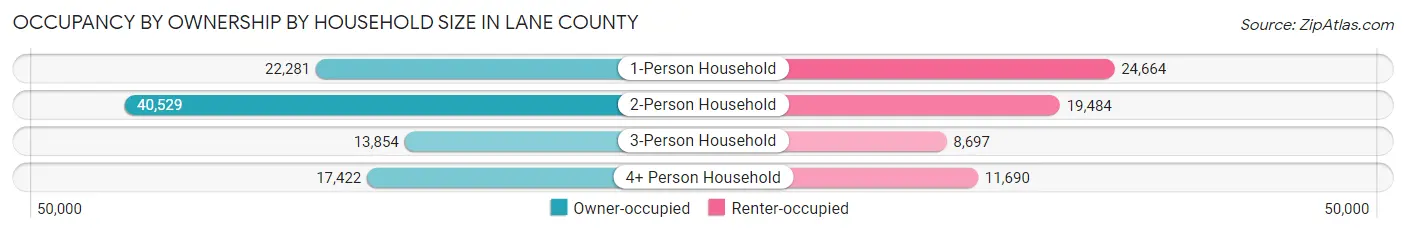
| Household Size | Owner-occupied | Renter-occupied |
| 1-Person Household | 22,281 (47.5%) | 24,664 (52.5%) |
| 2-Person Household | 40,529 (67.5%) | 19,484 (32.5%) |
| 3-Person Household | 13,854 (61.4%) | 8,697 (38.6%) |
| 4+ Person Household | 17,422 (59.8%) | 11,690 (40.2%) |
| Total Housing Units | 94,086 (59.3%) | 64,535 (40.7%) |
Occupancy by Educational Attainment in Lane County
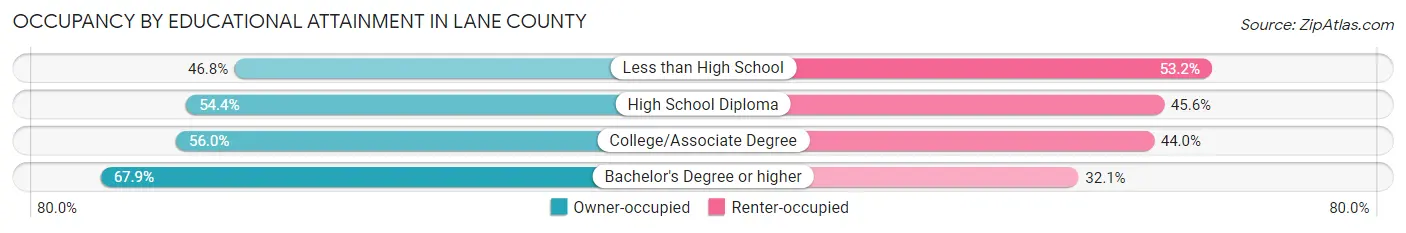
| Household Size | Owner-occupied | Renter-occupied |
| Less than High School | 4,294 (46.8%) | 4,886 (53.2%) |
| High School Diploma | 16,091 (54.4%) | 13,509 (45.6%) |
| College/Associate Degree | 36,036 (56.0%) | 28,346 (44.0%) |
| Bachelor's Degree or higher | 37,665 (67.9%) | 17,794 (32.1%) |
Occupancy by Age of Householder in Lane County
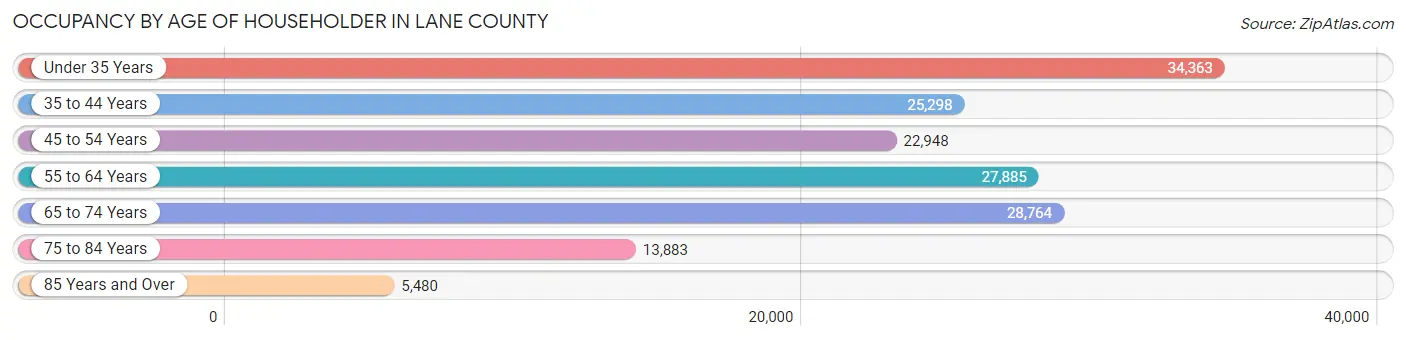
| Age Bracket | # Households | % Households |
| Under 35 Years | 34,363 | 21.7% |
| 35 to 44 Years | 25,298 | 16.0% |
| 45 to 54 Years | 22,948 | 14.5% |
| 55 to 64 Years | 27,885 | 17.6% |
| 65 to 74 Years | 28,764 | 18.1% |
| 75 to 84 Years | 13,883 | 8.7% |
| 85 Years and Over | 5,480 | 3.5% |
| Total | 158,621 | 100.0% |
Housing Finances in Lane County
Median Income by Occupancy in Lane County
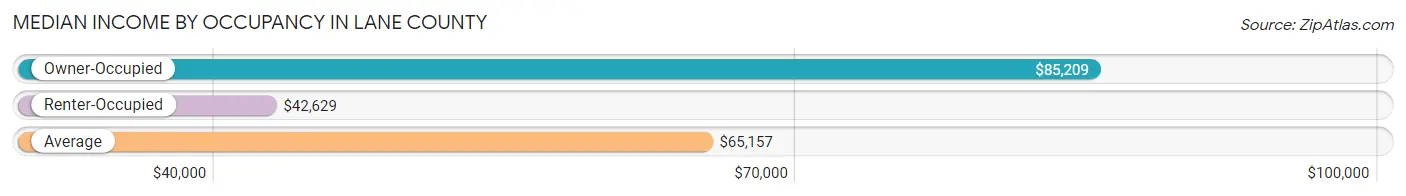
| Occupancy Type | # Households | Median Income |
| Owner-Occupied | 94,086 (59.3%) | $85,209 |
| Renter-Occupied | 64,535 (40.7%) | $42,629 |
| Average | 158,621 (100.0%) | $65,157 |
Occupancy by Householder Income Bracket in Lane County
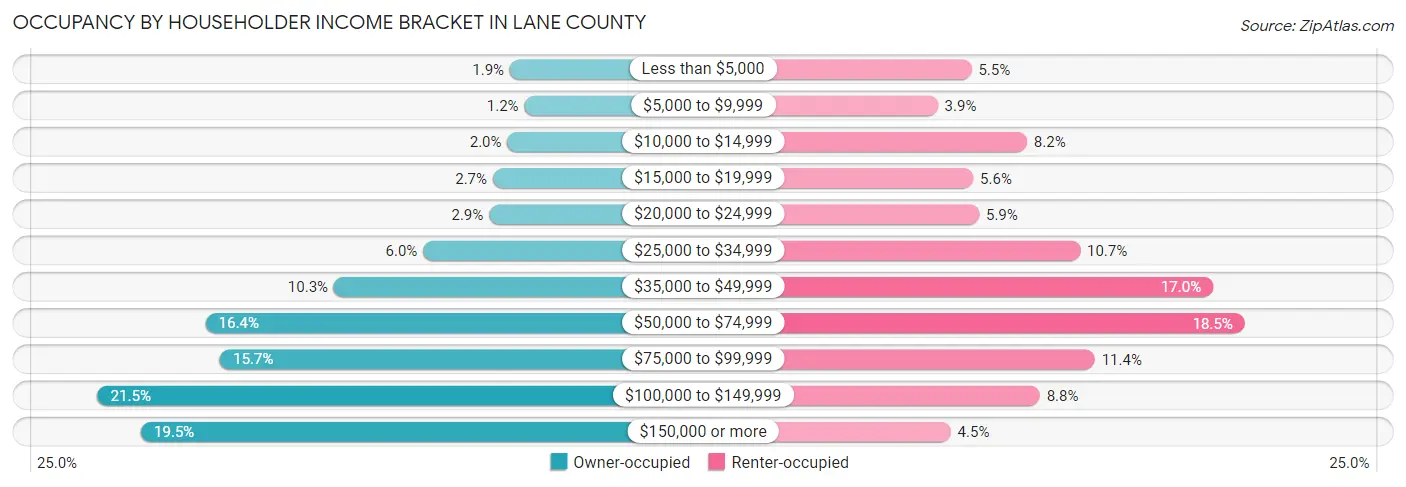
| Income Bracket | Owner-occupied | Renter-occupied |
| Less than $5,000 | 1,775 (1.9%) | 3,560 (5.5%) |
| $5,000 to $9,999 | 1,126 (1.2%) | 2,522 (3.9%) |
| $10,000 to $14,999 | 1,889 (2.0%) | 5,264 (8.2%) |
| $15,000 to $19,999 | 2,536 (2.7%) | 3,613 (5.6%) |
| $20,000 to $24,999 | 2,705 (2.9%) | 3,796 (5.9%) |
| $25,000 to $34,999 | 5,668 (6.0%) | 6,901 (10.7%) |
| $35,000 to $49,999 | 9,662 (10.3%) | 10,984 (17.0%) |
| $50,000 to $74,999 | 15,411 (16.4%) | 11,957 (18.5%) |
| $75,000 to $99,999 | 14,758 (15.7%) | 7,351 (11.4%) |
| $100,000 to $149,999 | 20,246 (21.5%) | 5,662 (8.8%) |
| $150,000 or more | 18,310 (19.5%) | 2,925 (4.5%) |
| Total | 94,086 (100.0%) | 64,535 (100.0%) |
Monthly Housing Cost Tiers in Lane County
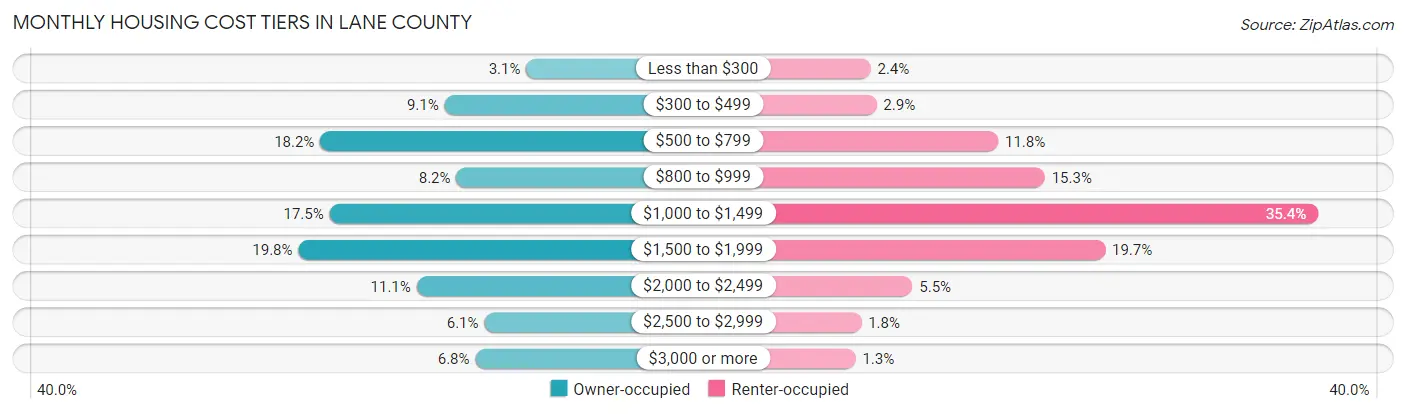
| Monthly Cost | Owner-occupied | Renter-occupied |
| Less than $300 | 2,870 (3.0%) | 1,575 (2.4%) |
| $300 to $499 | 8,531 (9.1%) | 1,853 (2.9%) |
| $500 to $799 | 17,150 (18.2%) | 7,633 (11.8%) |
| $800 to $999 | 7,717 (8.2%) | 9,855 (15.3%) |
| $1,000 to $1,499 | 16,503 (17.5%) | 22,840 (35.4%) |
| $1,500 to $1,999 | 18,670 (19.8%) | 12,722 (19.7%) |
| $2,000 to $2,499 | 10,468 (11.1%) | 3,562 (5.5%) |
| $2,500 to $2,999 | 5,775 (6.1%) | 1,128 (1.8%) |
| $3,000 or more | 6,402 (6.8%) | 861 (1.3%) |
| Total | 94,086 (100.0%) | 64,535 (100.0%) |
Physical Housing Characteristics in Lane County
Housing Structures in Lane County
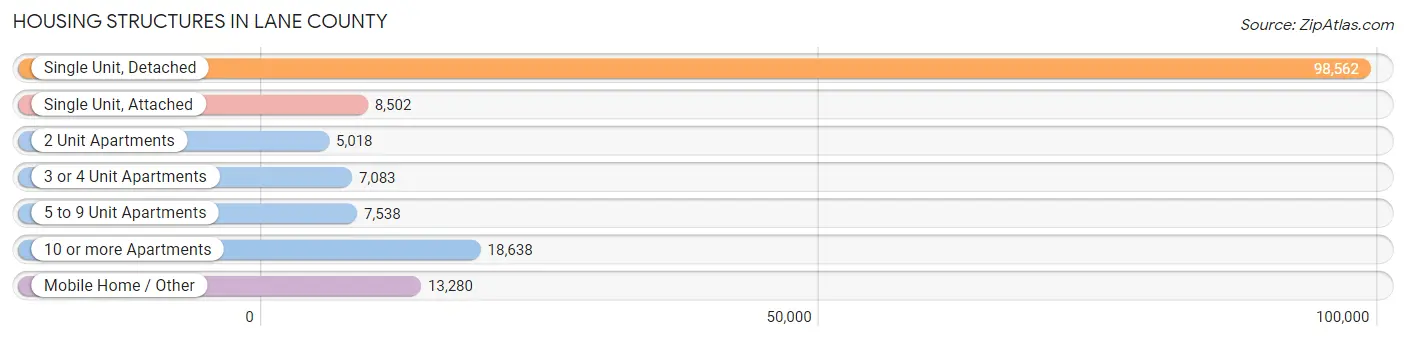
| Structure Type | # Housing Units | % Housing Units |
| Single Unit, Detached | 98,562 | 62.1% |
| Single Unit, Attached | 8,502 | 5.4% |
| 2 Unit Apartments | 5,018 | 3.2% |
| 3 or 4 Unit Apartments | 7,083 | 4.5% |
| 5 to 9 Unit Apartments | 7,538 | 4.8% |
| 10 or more Apartments | 18,638 | 11.7% |
| Mobile Home / Other | 13,280 | 8.4% |
| Total | 158,621 | 100.0% |
Housing Structures by Occupancy in Lane County
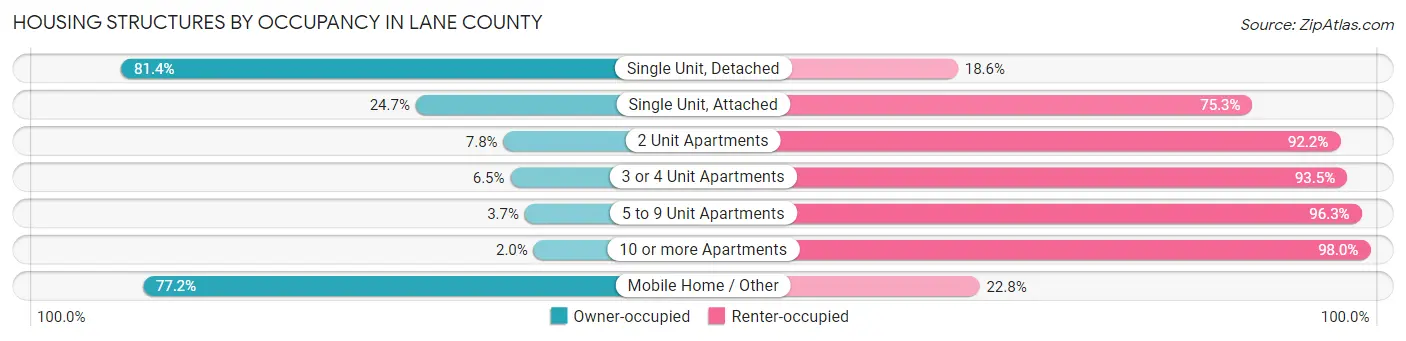
| Structure Type | Owner-occupied | Renter-occupied |
| Single Unit, Detached | 80,231 (81.4%) | 18,331 (18.6%) |
| Single Unit, Attached | 2,099 (24.7%) | 6,403 (75.3%) |
| 2 Unit Apartments | 392 (7.8%) | 4,626 (92.2%) |
| 3 or 4 Unit Apartments | 458 (6.5%) | 6,625 (93.5%) |
| 5 to 9 Unit Apartments | 278 (3.7%) | 7,260 (96.3%) |
| 10 or more Apartments | 373 (2.0%) | 18,265 (98.0%) |
| Mobile Home / Other | 10,255 (77.2%) | 3,025 (22.8%) |
| Total | 94,086 (59.3%) | 64,535 (40.7%) |
Housing Structures by Number of Rooms in Lane County
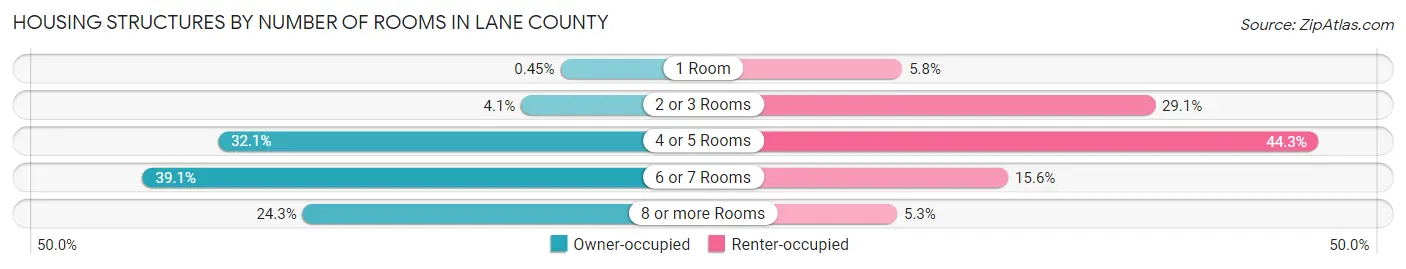
| Number of Rooms | Owner-occupied | Renter-occupied |
| 1 Room | 422 (0.4%) | 3,717 (5.8%) |
| 2 or 3 Rooms | 3,833 (4.1%) | 18,807 (29.1%) |
| 4 or 5 Rooms | 30,197 (32.1%) | 28,560 (44.3%) |
| 6 or 7 Rooms | 36,773 (39.1%) | 10,044 (15.6%) |
| 8 or more Rooms | 22,861 (24.3%) | 3,407 (5.3%) |
| Total | 94,086 (100.0%) | 64,535 (100.0%) |
Housing Structure by Heating Type in Lane County
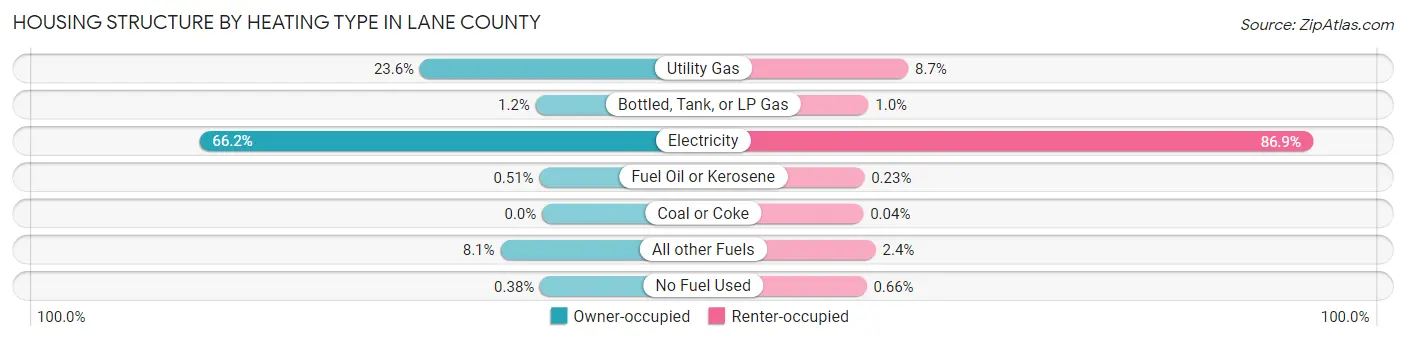
| Heating Type | Owner-occupied | Renter-occupied |
| Utility Gas | 22,202 (23.6%) | 5,623 (8.7%) |
| Bottled, Tank, or LP Gas | 1,169 (1.2%) | 659 (1.0%) |
| Electricity | 62,293 (66.2%) | 56,083 (86.9%) |
| Fuel Oil or Kerosene | 479 (0.5%) | 151 (0.2%) |
| Coal or Coke | 0 (0.0%) | 28 (0.0%) |
| All other Fuels | 7,586 (8.1%) | 1,564 (2.4%) |
| No Fuel Used | 357 (0.4%) | 427 (0.7%) |
| Total | 94,086 (100.0%) | 64,535 (100.0%) |
Household Vehicle Usage in Lane County
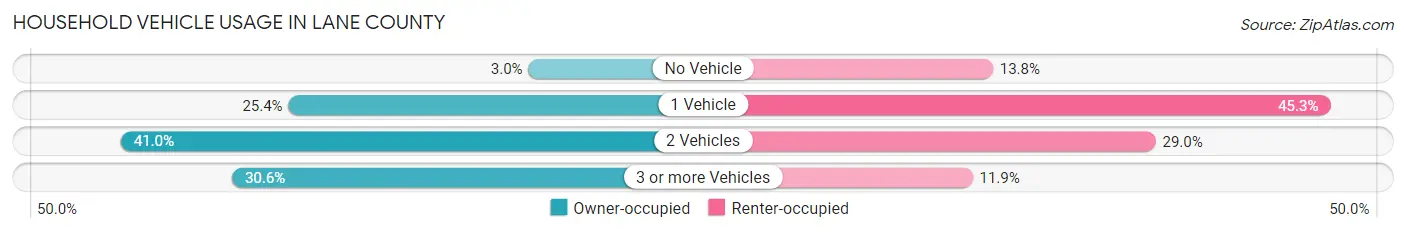
| Vehicles per Household | Owner-occupied | Renter-occupied |
| No Vehicle | 2,795 (3.0%) | 8,904 (13.8%) |
| 1 Vehicle | 23,872 (25.4%) | 29,233 (45.3%) |
| 2 Vehicles | 38,591 (41.0%) | 18,713 (29.0%) |
| 3 or more Vehicles | 28,828 (30.6%) | 7,685 (11.9%) |
| Total | 94,086 (100.0%) | 64,535 (100.0%) |
Real Estate & Mortgages in Lane County
Real Estate and Mortgage Overview in Lane County
| Characteristic | Without Mortgage | With Mortgage |
| Housing Units | 34,999 | 59,087 |
| Median Property Value | $334,000 | $378,600 |
| Median Household Income | $63,057 | $13,869 |
| Monthly Housing Costs | $607 | $6,381 |
| Real Estate Taxes | $3,107 | $998 |
Property Value by Mortgage Status in Lane County
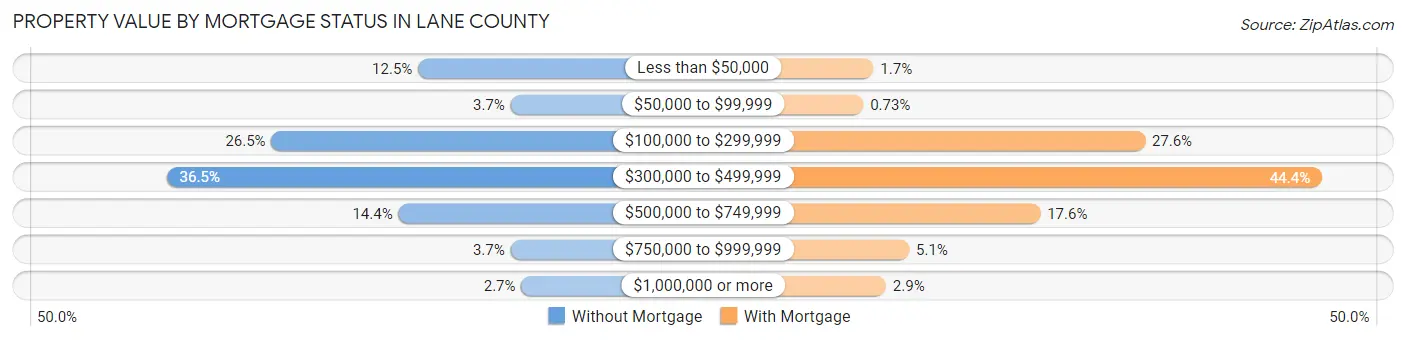
| Property Value | Without Mortgage | With Mortgage |
| Less than $50,000 | 4,383 (12.5%) | 1,007 (1.7%) |
| $50,000 to $99,999 | 1,299 (3.7%) | 432 (0.7%) |
| $100,000 to $299,999 | 9,272 (26.5%) | 16,285 (27.6%) |
| $300,000 to $499,999 | 12,764 (36.5%) | 26,249 (44.4%) |
| $500,000 to $749,999 | 5,038 (14.4%) | 10,394 (17.6%) |
| $750,000 to $999,999 | 1,301 (3.7%) | 3,015 (5.1%) |
| $1,000,000 or more | 942 (2.7%) | 1,705 (2.9%) |
| Total | 34,999 (100.0%) | 59,087 (100.0%) |
Household Income by Mortgage Status in Lane County
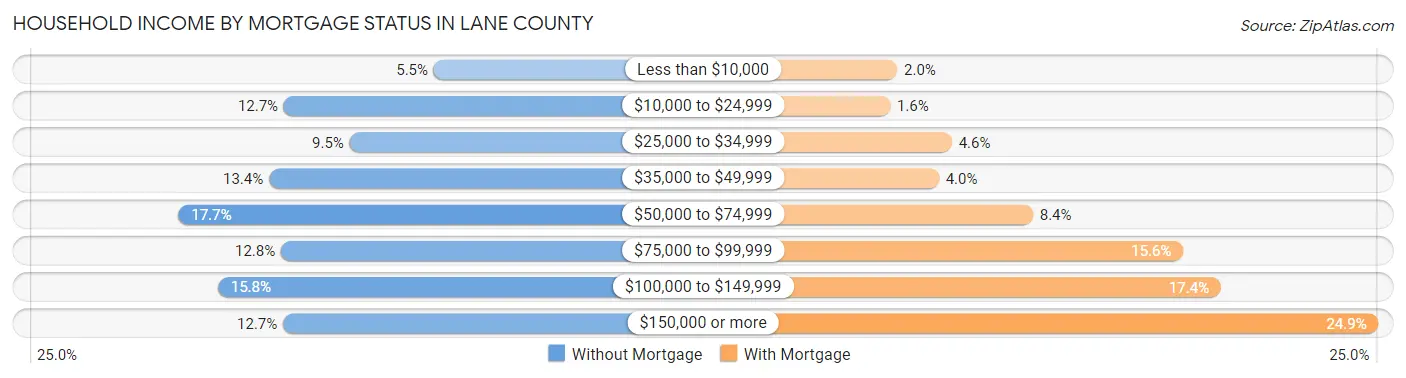
| Household Income | Without Mortgage | With Mortgage |
| Less than $10,000 | 1,930 (5.5%) | 1,171 (2.0%) |
| $10,000 to $24,999 | 4,426 (12.7%) | 971 (1.6%) |
| $25,000 to $34,999 | 3,331 (9.5%) | 2,704 (4.6%) |
| $35,000 to $49,999 | 4,677 (13.4%) | 2,337 (4.0%) |
| $50,000 to $74,999 | 6,188 (17.7%) | 4,985 (8.4%) |
| $75,000 to $99,999 | 4,475 (12.8%) | 9,223 (15.6%) |
| $100,000 to $149,999 | 5,531 (15.8%) | 10,283 (17.4%) |
| $150,000 or more | 4,441 (12.7%) | 14,715 (24.9%) |
| Total | 34,999 (100.0%) | 59,087 (100.0%) |
Property Value to Household Income Ratio in Lane County
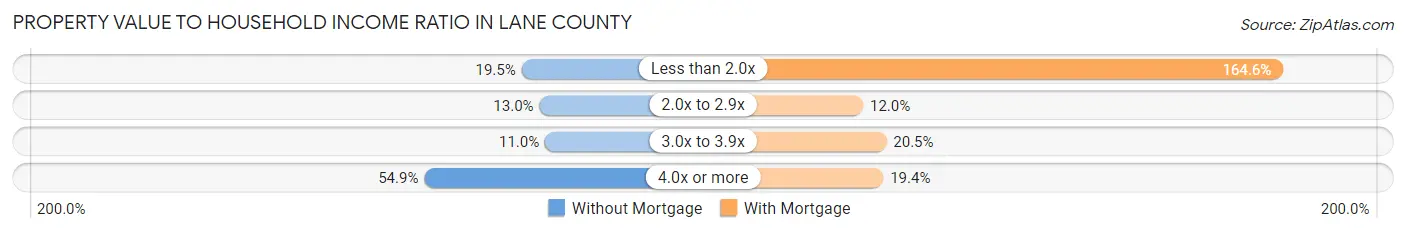
| Value-to-Income Ratio | Without Mortgage | With Mortgage |
| Less than 2.0x | 6,822 (19.5%) | 97,264 (164.6%) |
| 2.0x to 2.9x | 4,554 (13.0%) | 7,117 (12.0%) |
| 3.0x to 3.9x | 3,831 (11.0%) | 12,115 (20.5%) |
| 4.0x or more | 19,197 (54.8%) | 11,447 (19.4%) |
| Total | 34,999 (100.0%) | 59,087 (100.0%) |
Real Estate Taxes by Mortgage Status in Lane County
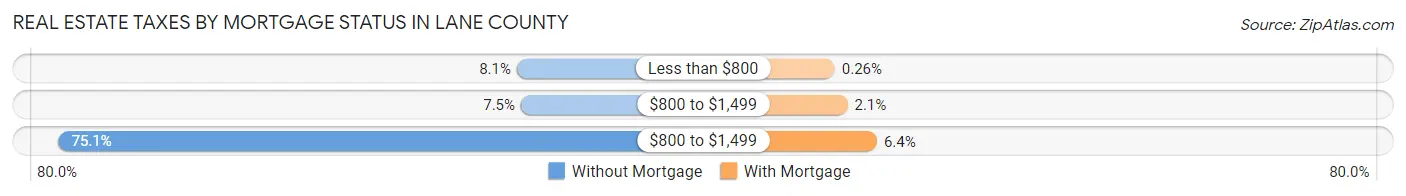
| Property Taxes | Without Mortgage | With Mortgage |
| Less than $800 | 2,828 (8.1%) | 156 (0.3%) |
| $800 to $1,499 | 2,623 (7.5%) | 1,253 (2.1%) |
| $800 to $1,499 | 26,267 (75.0%) | 3,792 (6.4%) |
| Total | 34,999 (100.0%) | 59,087 (100.0%) |
Health & Disability in Lane County
Health Insurance Coverage by Age in Lane County
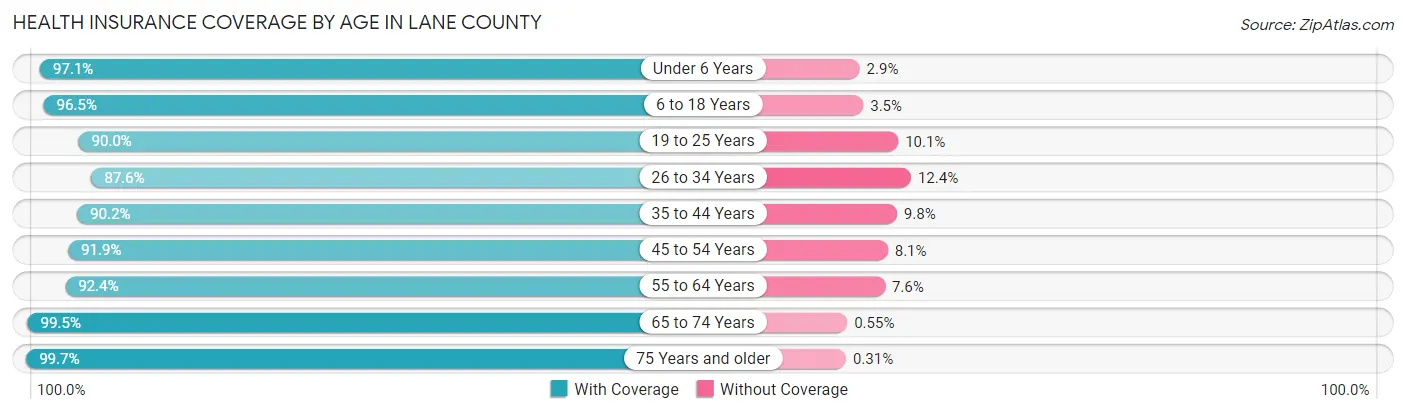
| Age Bracket | With Coverage | Without Coverage |
| Under 6 Years | 19,717 (97.1%) | 580 (2.9%) |
| 6 to 18 Years | 51,740 (96.5%) | 1,898 (3.5%) |
| 19 to 25 Years | 43,058 (89.9%) | 4,810 (10.1%) |
| 26 to 34 Years | 39,125 (87.6%) | 5,557 (12.4%) |
| 35 to 44 Years | 42,521 (90.2%) | 4,624 (9.8%) |
| 45 to 54 Years | 38,949 (91.9%) | 3,437 (8.1%) |
| 55 to 64 Years | 44,581 (92.4%) | 3,654 (7.6%) |
| 65 to 74 Years | 46,073 (99.5%) | 255 (0.5%) |
| 75 Years and older | 29,550 (99.7%) | 91 (0.3%) |
| Total | 355,314 (93.4%) | 24,906 (6.6%) |
Health Insurance Coverage by Citizenship Status in Lane County
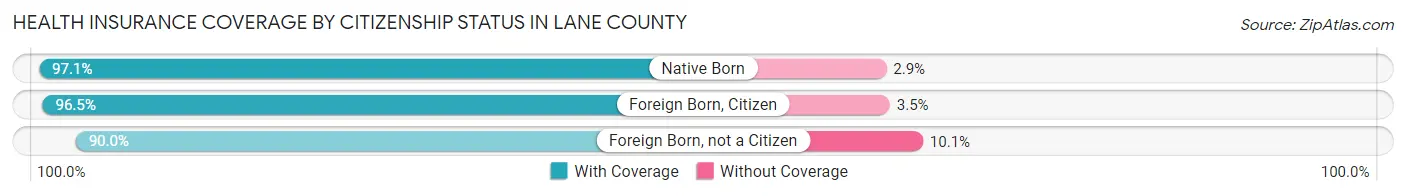
| Citizenship Status | With Coverage | Without Coverage |
| Native Born | 19,717 (97.1%) | 580 (2.9%) |
| Foreign Born, Citizen | 51,740 (96.5%) | 1,898 (3.5%) |
| Foreign Born, not a Citizen | 43,058 (89.9%) | 4,810 (10.1%) |
Health Insurance Coverage by Household Income in Lane County
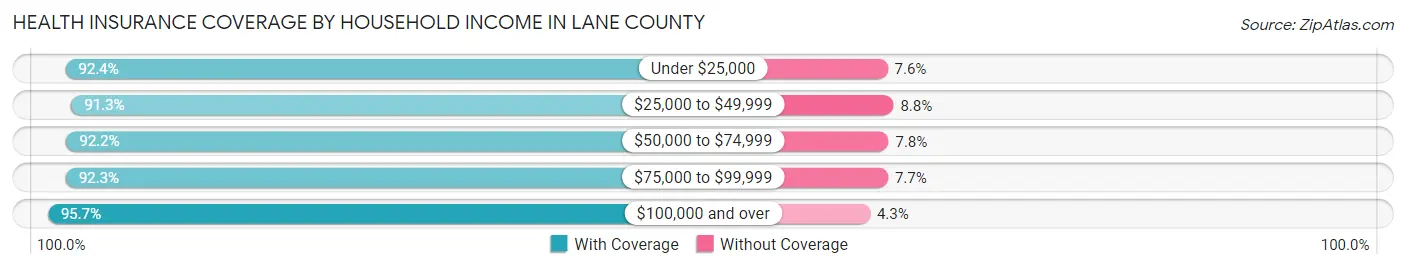
| Household Income | With Coverage | Without Coverage |
| Under $25,000 | 43,533 (92.4%) | 3,599 (7.6%) |
| $25,000 to $49,999 | 59,757 (91.2%) | 5,727 (8.7%) |
| $50,000 to $74,999 | 58,586 (92.2%) | 4,968 (7.8%) |
| $75,000 to $99,999 | 53,554 (92.3%) | 4,471 (7.7%) |
| $100,000 and over | 132,678 (95.7%) | 6,021 (4.3%) |
Public vs Private Health Insurance Coverage by Age in Lane County
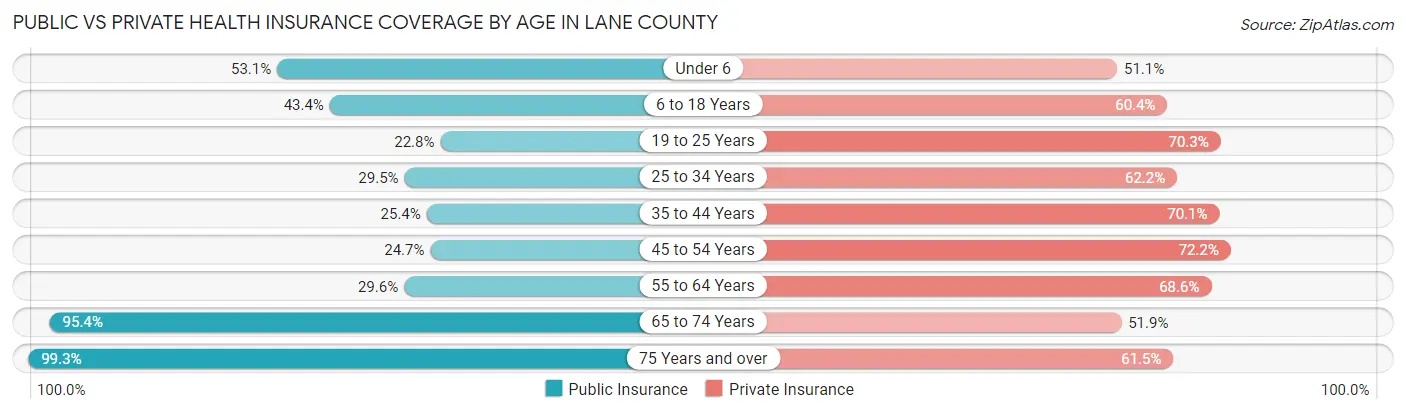
| Age Bracket | Public Insurance | Private Insurance |
| Under 6 | 10,786 (53.1%) | 10,370 (51.1%) |
| 6 to 18 Years | 23,262 (43.4%) | 32,412 (60.4%) |
| 19 to 25 Years | 10,935 (22.8%) | 33,652 (70.3%) |
| 25 to 34 Years | 13,179 (29.5%) | 27,800 (62.2%) |
| 35 to 44 Years | 11,965 (25.4%) | 33,035 (70.1%) |
| 45 to 54 Years | 10,463 (24.7%) | 30,597 (72.2%) |
| 55 to 64 Years | 14,267 (29.6%) | 33,075 (68.6%) |
| 65 to 74 Years | 44,173 (95.4%) | 24,030 (51.9%) |
| 75 Years and over | 29,438 (99.3%) | 18,236 (61.5%) |
| Total | 168,468 (44.3%) | 243,207 (64.0%) |
Disability Status by Sex by Age in Lane County
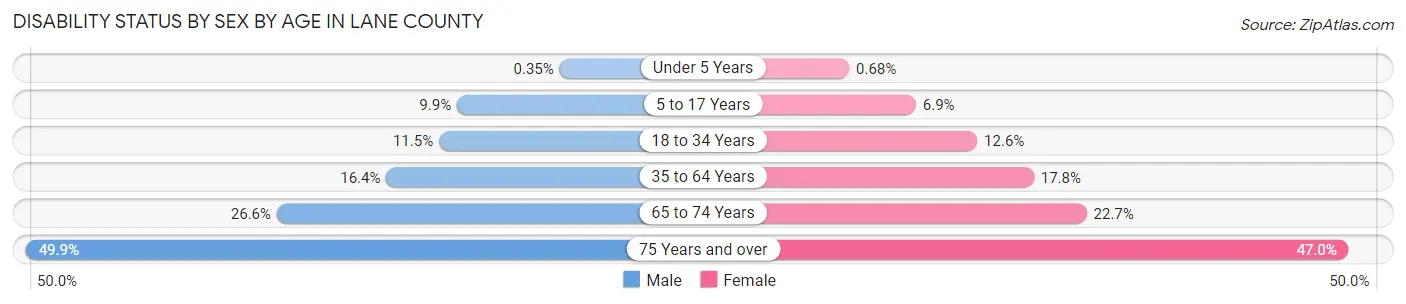
| Age Bracket | Male | Female |
| Under 5 Years | 31 (0.4%) | 56 (0.7%) |
| 5 to 17 Years | 2,585 (9.9%) | 1,697 (6.9%) |
| 18 to 34 Years | 5,759 (11.5%) | 6,121 (12.6%) |
| 35 to 64 Years | 11,226 (16.4%) | 12,374 (17.8%) |
| 65 to 74 Years | 5,841 (26.6%) | 5,536 (22.7%) |
| 75 Years and over | 6,400 (49.9%) | 7,908 (47.0%) |
Disability Class by Sex by Age in Lane County
Disability Class: Hearing Difficulty
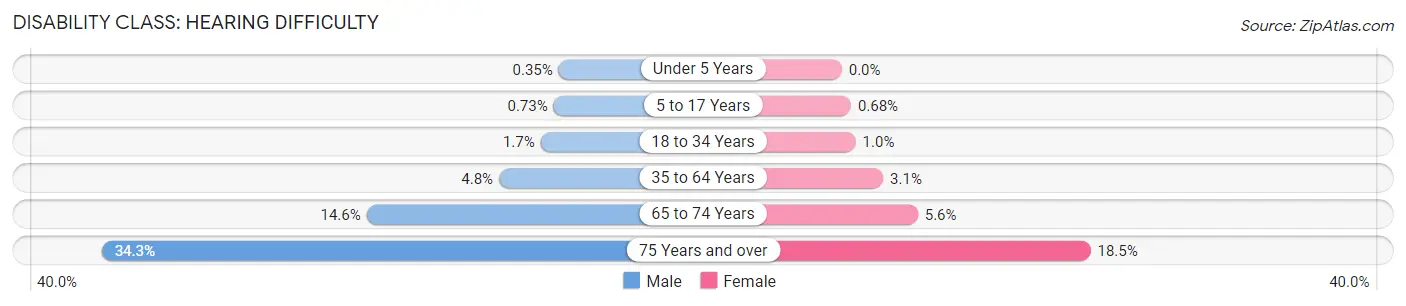
| Age Bracket | Male | Female |
| Under 5 Years | 31 (0.4%) | 0 (0.0%) |
| 5 to 17 Years | 192 (0.7%) | 168 (0.7%) |
| 18 to 34 Years | 845 (1.7%) | 504 (1.0%) |
| 35 to 64 Years | 3,268 (4.8%) | 2,135 (3.1%) |
| 65 to 74 Years | 3,209 (14.6%) | 1,375 (5.6%) |
| 75 Years and over | 4,396 (34.3%) | 3,106 (18.5%) |
Disability Class: Vision Difficulty
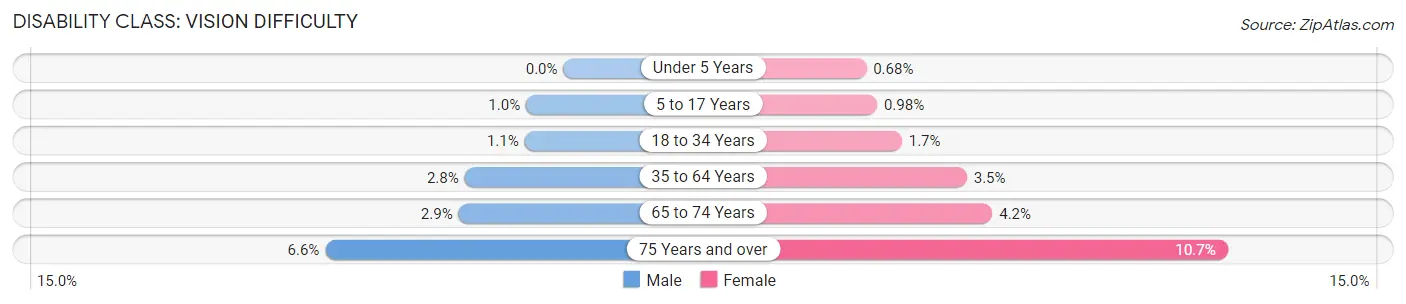
| Age Bracket | Male | Female |
| Under 5 Years | 0 (0.0%) | 56 (0.7%) |
| 5 to 17 Years | 273 (1.0%) | 242 (1.0%) |
| 18 to 34 Years | 541 (1.1%) | 816 (1.7%) |
| 35 to 64 Years | 1,876 (2.8%) | 2,418 (3.5%) |
| 65 to 74 Years | 642 (2.9%) | 1,020 (4.2%) |
| 75 Years and over | 851 (6.6%) | 1,806 (10.7%) |
Disability Class: Cognitive Difficulty
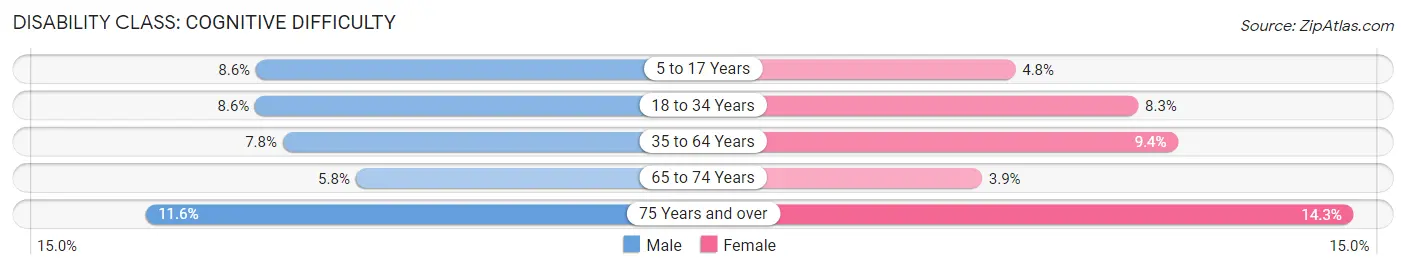
| Age Bracket | Male | Female |
| 5 to 17 Years | 2,242 (8.6%) | 1,193 (4.8%) |
| 18 to 34 Years | 4,283 (8.6%) | 4,023 (8.3%) |
| 35 to 64 Years | 5,336 (7.8%) | 6,510 (9.4%) |
| 65 to 74 Years | 1,270 (5.8%) | 951 (3.9%) |
| 75 Years and over | 1,493 (11.6%) | 2,396 (14.2%) |
Disability Class: Ambulatory Difficulty
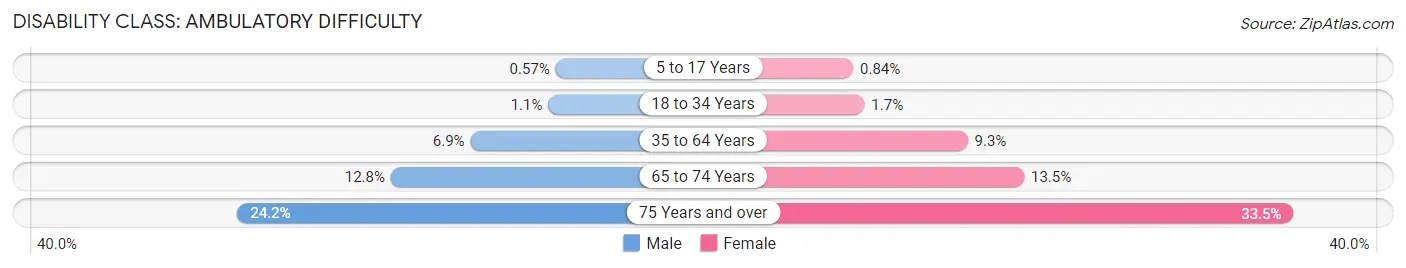
| Age Bracket | Male | Female |
| 5 to 17 Years | 149 (0.6%) | 208 (0.8%) |
| 18 to 34 Years | 561 (1.1%) | 821 (1.7%) |
| 35 to 64 Years | 4,712 (6.9%) | 6,488 (9.3%) |
| 65 to 74 Years | 2,813 (12.8%) | 3,296 (13.5%) |
| 75 Years and over | 3,105 (24.2%) | 5,635 (33.5%) |
Disability Class: Self-Care Difficulty
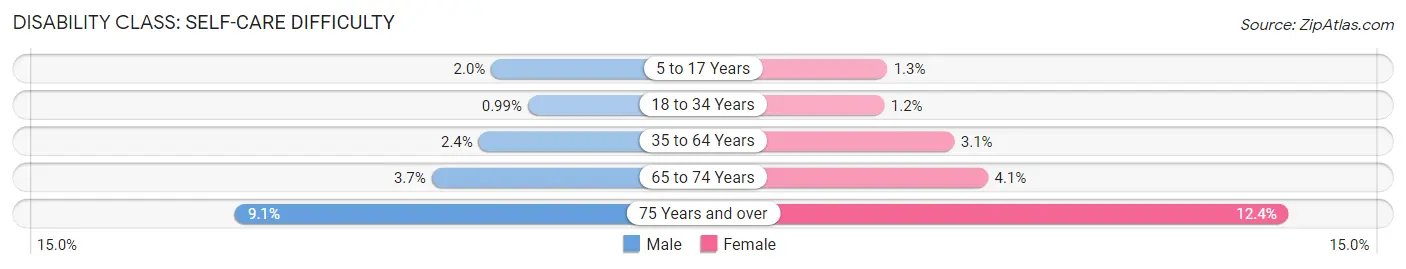
| Age Bracket | Male | Female |
| 5 to 17 Years | 525 (2.0%) | 308 (1.3%) |
| 18 to 34 Years | 494 (1.0%) | 571 (1.2%) |
| 35 to 64 Years | 1,609 (2.4%) | 2,168 (3.1%) |
| 65 to 74 Years | 806 (3.7%) | 990 (4.1%) |
| 75 Years and over | 1,172 (9.1%) | 2,091 (12.4%) |
Technology Access in Lane County
Computing Device Access in Lane County
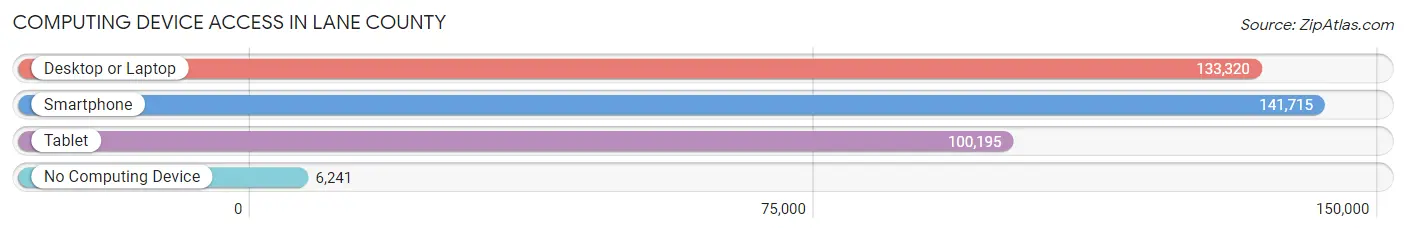
| Device Type | # Households | % Households |
| Desktop or Laptop | 133,320 | 84.1% |
| Smartphone | 141,715 | 89.3% |
| Tablet | 100,195 | 63.2% |
| No Computing Device | 6,241 | 3.9% |
| Total | 158,621 | 100.0% |
Internet Access in Lane County
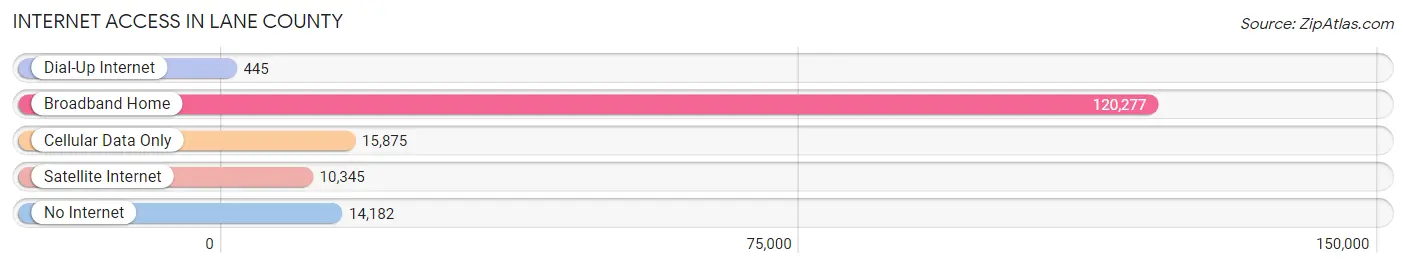
| Internet Type | # Households | % Households |
| Dial-Up Internet | 445 | 0.3% |
| Broadband Home | 120,277 | 75.8% |
| Cellular Data Only | 15,875 | 10.0% |
| Satellite Internet | 10,345 | 6.5% |
| No Internet | 14,182 | 8.9% |
| Total | 158,621 | 100.0% |
Lane County Summary
Lane County is located in the western part of the U.S. state of Oregon. It is the fourth most populous county in the state, with a population of approximately 375,000 people as of 2019. The county seat is Eugene, the second-largest city in the state. Lane County is bordered by the Willamette River to the north, the Cascade Mountains to the east, the Pacific Ocean to the west, and the Siuslaw National Forest to the south.
History
Lane County was created in 1851 and named after Joseph Lane, the first territorial governor of Oregon. The county was originally part of the Oregon Territory, which was established in 1848. The county was initially populated by Native American tribes, including the Kalapuya, Molalla, and Chasta.
In the late 19th century, the county experienced a population boom due to the arrival of settlers from the east coast. The county was also home to several lumber mills, which provided jobs for many of the new arrivals.
In the early 20th century, the county experienced a period of economic growth due to the development of the timber industry. The county also became a popular tourist destination, with the opening of several resorts and attractions.
Geography
Lane County covers an area of 4,722 square miles, making it the fourth-largest county in Oregon. The county is located in the Willamette Valley, which is a fertile agricultural region. The county is bordered by the Willamette River to the north, the Cascade Mountains to the east, the Pacific Ocean to the west, and the Siuslaw National Forest to the south.
The county is home to several mountain ranges, including the Cascade Range, the Coast Range, and the Siskiyou Mountains. The highest point in the county is Marys Peak, which has an elevation of 4,097 feet.
The county is home to several rivers, including the Willamette, the McKenzie, and the Umpqua. The county also contains several lakes, including Fern Ridge Lake, Dorena Lake, and Dexter Lake.
Economy
Lane County has a diverse economy, with industries ranging from agriculture to manufacturing. The county is home to several large employers, including the University of Oregon, PeaceHealth, and the Eugene Water & Electric Board.
The county is also home to several major agricultural producers, including grass seed, hazelnuts, and Christmas trees. The county is also home to several wineries and breweries, as well as a thriving craft beer industry.
The county is home to several major retail centers, including Valley River Center, Gateway Mall, and Oakway Center. The county is also home to several major manufacturing companies, including International Paper, Boise Cascade, and Oregon Freeze Dry.
Demographics
As of 2019, Lane County had an estimated population of 375,000 people. The county is home to a diverse population, with the largest ethnic groups being White (77.2%), Hispanic or Latino (9.2%), and Asian (4.7%).
The median household income in the county is $54,000, and the median home value is $250,000. The county has a poverty rate of 13.3%, and the unemployment rate is 4.2%.
Conclusion
Lane County is a diverse and vibrant county located in the western part of Oregon. The county has a rich history, and it is home to a diverse population and a thriving economy. The county is home to several major employers, agricultural producers, and retail centers. The county also has a median household income of $54,000 and a median home value of $250,000.
Common Questions
What is the Total Population of Lane County?
Total Population of Lane County is 382,218.
What is the Total Male Population of Lane County?
Total Male Population of Lane County is 189,292.
What is the Total Female Population of Lane County?
Total Female Population of Lane County is 192,926.
What is the Ratio of Males per 100 Females in Lane County?
There are 98.12 Males per 100 Females in Lane County.
What is the Ratio of Females per 100 Males in Lane County?
There are 101.92 Females per 100 Males in Lane County.
What is the Median Population Age in Lane County?
Median Population Age in Lane County is 40.1 Years.
What is the Average Family Size in Lane County
Average Family Size in Lane County is 2.8 People.
What is the Average Household Size in Lane County
Average Household Size in Lane County is 2.4 People.
What is Per Capita Income in Lane County?
Per Capita income in Lane County is $36,776.
What is the Median Family Income in Lane County?
Median Family Income in Lane County is $84,068.
What is the Median Household income in Lane County?
Median Household Income in Lane County is $65,157.
What is Income or Wage Gap in Lane County?
Income or Wage Gap in Lane County is 27.6%.
Women in Lane County earn 72.4 cents for every dollar earned by a man.
What is Family Income Deficit in Lane County?
Family Income Deficit in Lane County is $10,082.
Families that are below poverty line in Lane County earn $10,082 less on average than the poverty threshold level.
What is Inequality or Gini Index in Lane County?
Inequality or Gini Index in Lane County is 0.46.
How Large is the Labor Force in Lane County?
There are 194,987 People in the Labor Forcein in Lane County.
What is the Percentage of People in the Labor Force in Lane County?
60.5% of People are in the Labor Force in Lane County.
What is the Unemployment Rate in Lane County?
Unemployment Rate in Lane County is 6.7%.