Lake County, OR
Lake County Map
Lake County Overview
8,201
TOTAL POPULATION
4,465
MALE POPULATION
3,736
FEMALE POPULATION
119.51
MALES / 100 FEMALES
83.67
FEMALES / 100 MALES
46.1
MEDIAN AGE
3.0
AVG FAMILY SIZE
2.3
AVG HOUSEHOLD SIZE
$29,400
PER CAPITA INCOME
$74,322
AVG FAMILY INCOME
$54,663
AVG HOUSEHOLD INCOME
36.9%
WAGE / INCOME GAP [ % ]
63.1¢/ $1
WAGE / INCOME GAP [ $ ]
$10,918
FAMILY INCOME DEFICIT
0.44
INEQUALITY / GINI INDEX
3,347
LABOR FORCE [ PEOPLE ]
48.6%
PERCENT IN LABOR FORCE
7.7%
UNEMPLOYMENT RATE
Lake County Area Codes
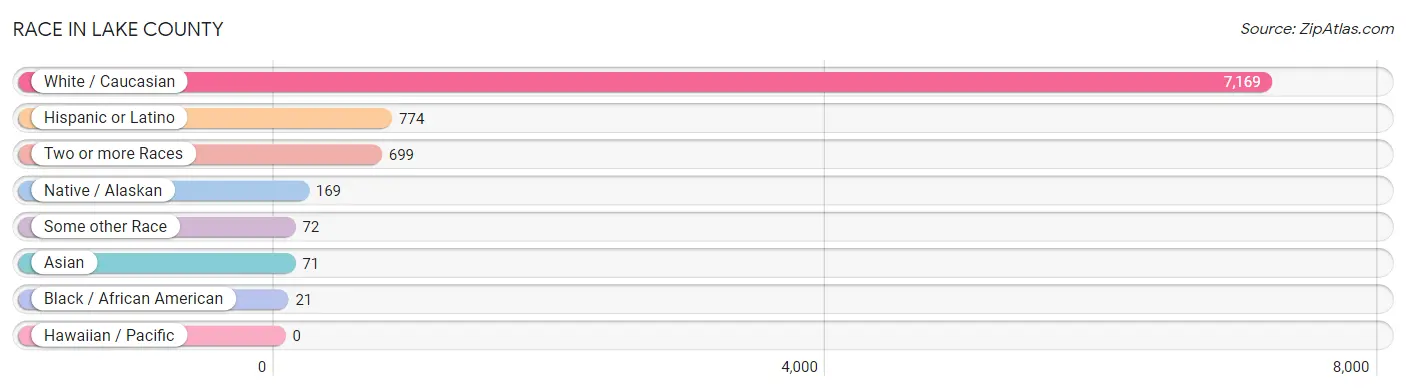
Race in Lake County
The most populous races in Lake County are White / Caucasian (7,169 | 87.4%), Hispanic or Latino (774 | 9.4%), and Two or more Races (699 | 8.5%).
| Race | # Population | % Population |
| Asian | 71 | 0.9% |
| Black / African American | 21 | 0.3% |
| Hawaiian / Pacific | 0 | 0.0% |
| Hispanic or Latino | 774 | 9.4% |
| Native / Alaskan | 169 | 2.1% |
| White / Caucasian | 7,169 | 87.4% |
| Two or more Races | 699 | 8.5% |
| Some other Race | 72 | 0.9% |
| Total | 8,201 | 100.0% |
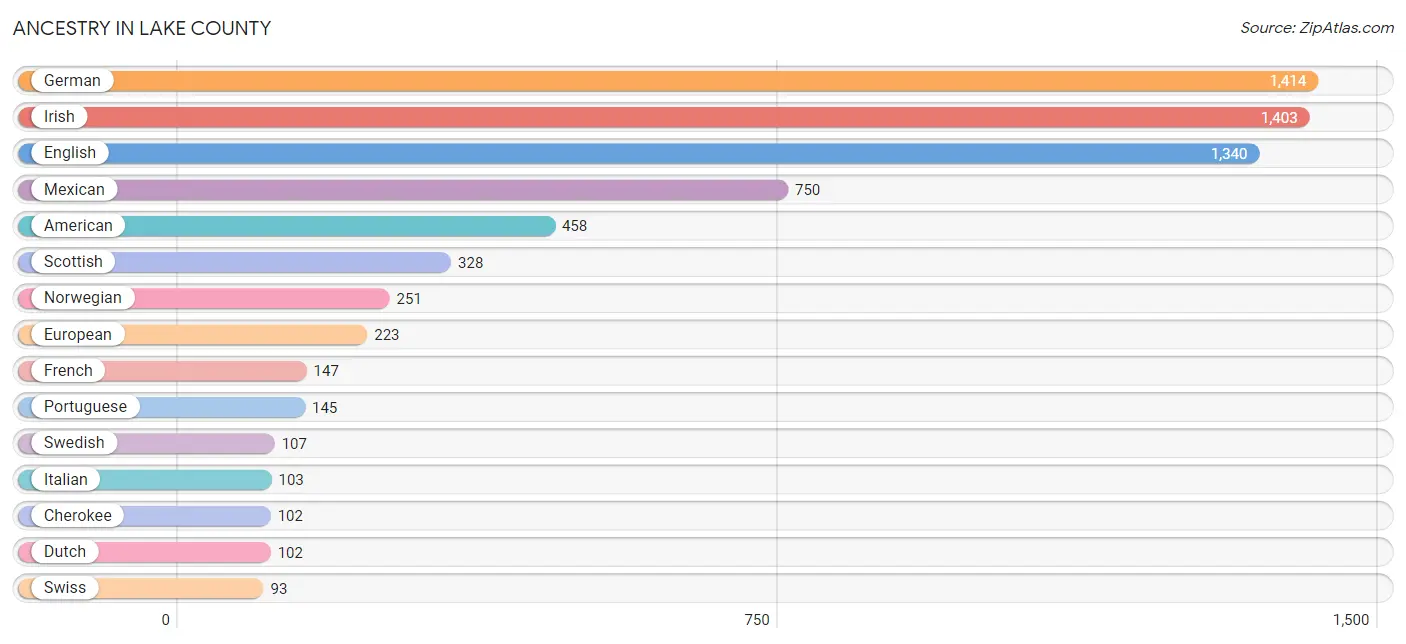
Ancestry in Lake County
The most populous ancestries reported in Lake County are German (1,414 | 17.2%), Irish (1,403 | 17.1%), English (1,340 | 16.3%), Mexican (750 | 9.1%), and American (458 | 5.6%), together accounting for 65.4% of all Lake County residents.
| Ancestry | # Population | % Population |
| Alaska Native | 2 | 0.0% |
| American | 458 | 5.6% |
| Apache | 25 | 0.3% |
| Austrian | 10 | 0.1% |
| Basque | 3 | 0.0% |
| British | 61 | 0.7% |
| Burmese | 12 | 0.2% |
| Canadian | 6 | 0.1% |
| Central American | 6 | 0.1% |
| Central American Indian | 8 | 0.1% |
| Cherokee | 102 | 1.2% |
| Chickasaw | 6 | 0.1% |
| Chippewa | 4 | 0.1% |
| Colville | 2 | 0.0% |
| Costa Rican | 4 | 0.1% |
| Czech | 8 | 0.1% |
| Czechoslovakian | 3 | 0.0% |
| Danish | 74 | 0.9% |
| Dutch | 102 | 1.2% |
| Eastern European | 13 | 0.2% |
| English | 1,340 | 16.3% |
| European | 223 | 2.7% |
| Finnish | 55 | 0.7% |
| French | 147 | 1.8% |
| French Canadian | 26 | 0.3% |
| German | 1,414 | 17.2% |
| Greek | 17 | 0.2% |
| Guatemalan | 2 | 0.0% |
| Hungarian | 5 | 0.1% |
| Indian (Asian) | 8 | 0.1% |
| Irish | 1,403 | 17.1% |
| Iroquois | 11 | 0.1% |
| Italian | 103 | 1.3% |
| Korean | 10 | 0.1% |
| Lithuanian | 4 | 0.1% |
| Mexican | 750 | 9.1% |
| Navajo | 9 | 0.1% |
| Northern European | 44 | 0.5% |
| Norwegian | 251 | 3.1% |
| Paiute | 25 | 0.3% |
| Pima | 31 | 0.4% |
| Polish | 89 | 1.1% |
| Portuguese | 145 | 1.8% |
| Potawatomi | 17 | 0.2% |
| Russian | 31 | 0.4% |
| Samoan | 2 | 0.0% |
| Scandinavian | 14 | 0.2% |
| Scotch-Irish | 66 | 0.8% |
| Scottish | 328 | 4.0% |
| Seminole | 6 | 0.1% |
| Slovak | 19 | 0.2% |
| Spaniard | 7 | 0.1% |
| Spanish | 3 | 0.0% |
| Sri Lankan | 46 | 0.6% |
| Swedish | 107 | 1.3% |
| Swiss | 93 | 1.1% |
| Thai | 51 | 0.6% |
| Tsimshian | 12 | 0.2% |
| Welsh | 55 | 0.7% | View All 59 Rows |
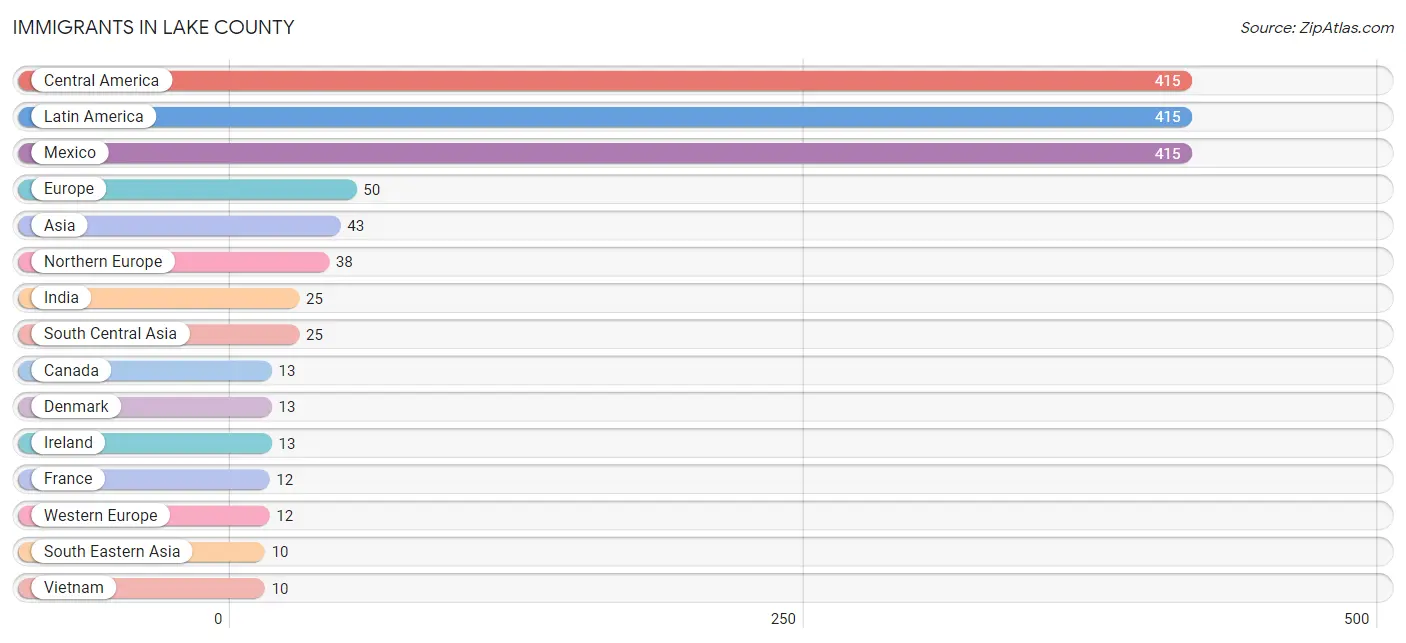
Immigrants in Lake County
The most numerous immigrant groups reported in Lake County came from Central America (415 | 5.1%), Latin America (415 | 5.1%), Mexico (415 | 5.1%), Europe (50 | 0.6%), and Asia (43 | 0.5%), together accounting for 16.3% of all Lake County residents.
| Immigration Origin | # Population | % Population |
| Asia | 43 | 0.5% |
| Canada | 13 | 0.2% |
| Central America | 415 | 5.1% |
| China | 8 | 0.1% |
| Denmark | 13 | 0.2% |
| Eastern Asia | 8 | 0.1% |
| Europe | 50 | 0.6% |
| France | 12 | 0.2% |
| India | 25 | 0.3% |
| Ireland | 13 | 0.2% |
| Latin America | 415 | 5.1% |
| Mexico | 415 | 5.1% |
| Northern Europe | 38 | 0.5% |
| South Central Asia | 25 | 0.3% |
| South Eastern Asia | 10 | 0.1% |
| Vietnam | 10 | 0.1% |
| Western Europe | 12 | 0.2% | View All 17 Rows |
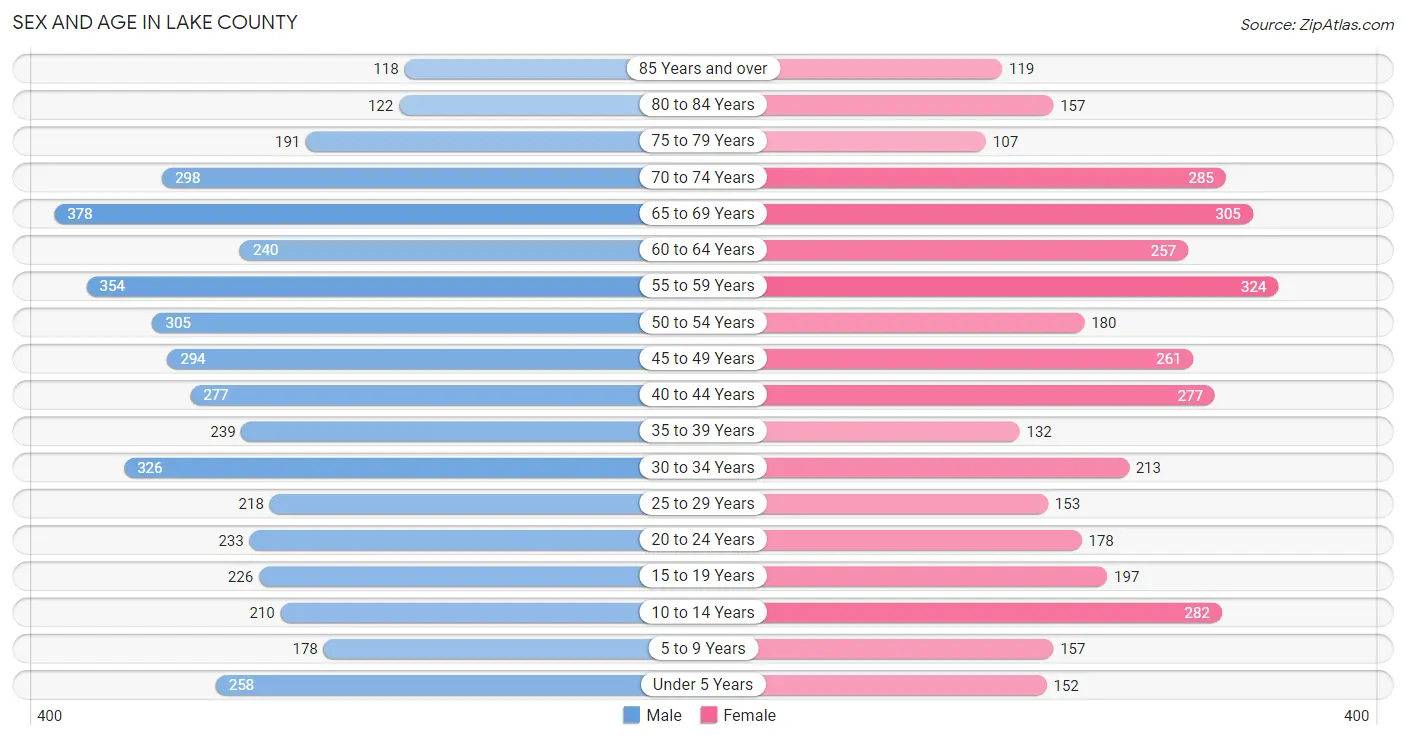
Sex and Age in Lake County
Sex and Age in Lake County
The most populous age groups in Lake County are 65 to 69 Years (378 | 8.5%) for men and 55 to 59 Years (324 | 8.7%) for women.
| Age Bracket | Male | Female |
| Under 5 Years | 258 (5.8%) | 152 (4.1%) |
| 5 to 9 Years | 178 (4.0%) | 157 (4.2%) |
| 10 to 14 Years | 210 (4.7%) | 282 (7.5%) |
| 15 to 19 Years | 226 (5.1%) | 197 (5.3%) |
| 20 to 24 Years | 233 (5.2%) | 178 (4.8%) |
| 25 to 29 Years | 218 (4.9%) | 153 (4.1%) |
| 30 to 34 Years | 326 (7.3%) | 213 (5.7%) |
| 35 to 39 Years | 239 (5.3%) | 132 (3.5%) |
| 40 to 44 Years | 277 (6.2%) | 277 (7.4%) |
| 45 to 49 Years | 294 (6.6%) | 261 (7.0%) |
| 50 to 54 Years | 305 (6.8%) | 180 (4.8%) |
| 55 to 59 Years | 354 (7.9%) | 324 (8.7%) |
| 60 to 64 Years | 240 (5.4%) | 257 (6.9%) |
| 65 to 69 Years | 378 (8.5%) | 305 (8.2%) |
| 70 to 74 Years | 298 (6.7%) | 285 (7.6%) |
| 75 to 79 Years | 191 (4.3%) | 107 (2.9%) |
| 80 to 84 Years | 122 (2.7%) | 157 (4.2%) |
| 85 Years and over | 118 (2.6%) | 119 (3.2%) |
| Total | 4,465 (100.0%) | 3,736 (100.0%) |
Families and Households in Lake County
Median Family Size in Lake County
The median family size in Lake County is 3.03 persons per family, with single female/mother families (245 | 12.7%) accounting for the largest median family size of 4.21 persons per family. On the other hand, single male/father families (133 | 6.9%) represent the smallest median family size with 2.76 persons per family.
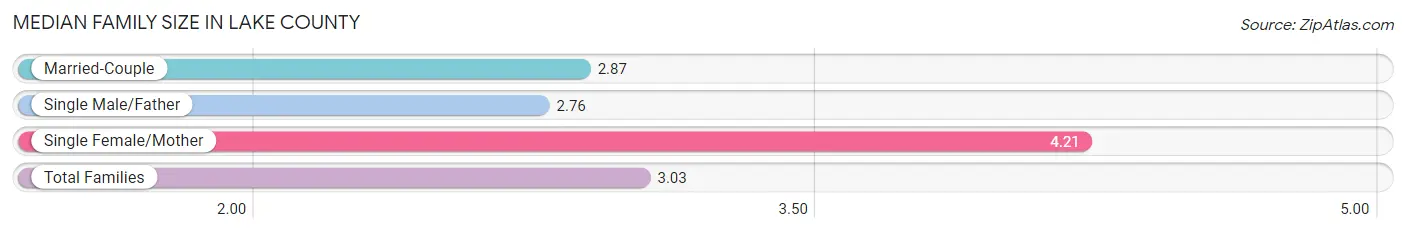
| Family Type | # Families | Family Size |
| Married-Couple | 1,550 (80.4%) | 2.87 |
| Single Male/Father | 133 (6.9%) | 2.76 |
| Single Female/Mother | 245 (12.7%) | 4.21 |
| Total Families | 1,928 (100.0%) | 3.03 |
Median Household Size in Lake County
The median household size in Lake County is 2.28 persons per household, with single female/mother households (245 | 7.3%) accounting for the largest median household size of 4.28 persons per household. non-family households (1,436 | 42.7%) represent the smallest median household size with 1.20 persons per household.
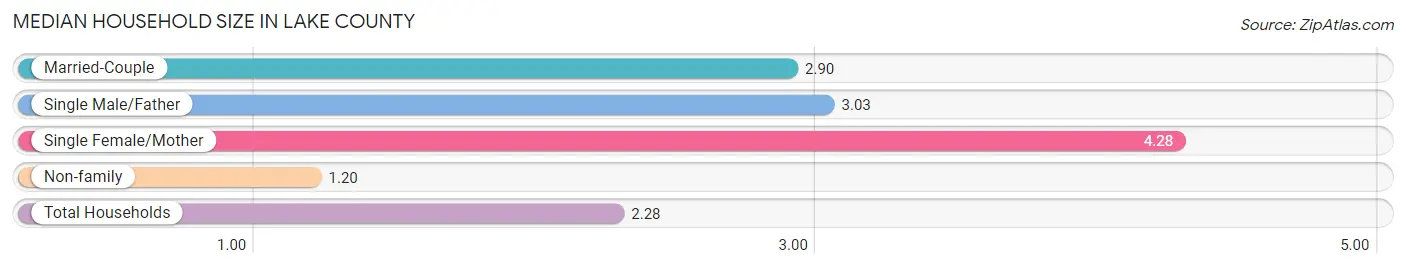
| Household Type | # Households | Household Size |
| Married-Couple | 1,550 (46.1%) | 2.90 |
| Single Male/Father | 133 (4.0%) | 3.03 |
| Single Female/Mother | 245 (7.3%) | 4.28 |
| Non-family | 1,436 (42.7%) | 1.20 |
| Total Households | 3,364 (100.0%) | 2.28 |
Household Size by Marriage Status in Lake County
Out of a total of 3,364 households in Lake County, 1,928 (57.3%) are family households, while 1,436 (42.7%) are nonfamily households. The most numerous type of family households are 2-person households, comprising 1,145, and the most common type of nonfamily households are 1-person households, comprising 1,176.
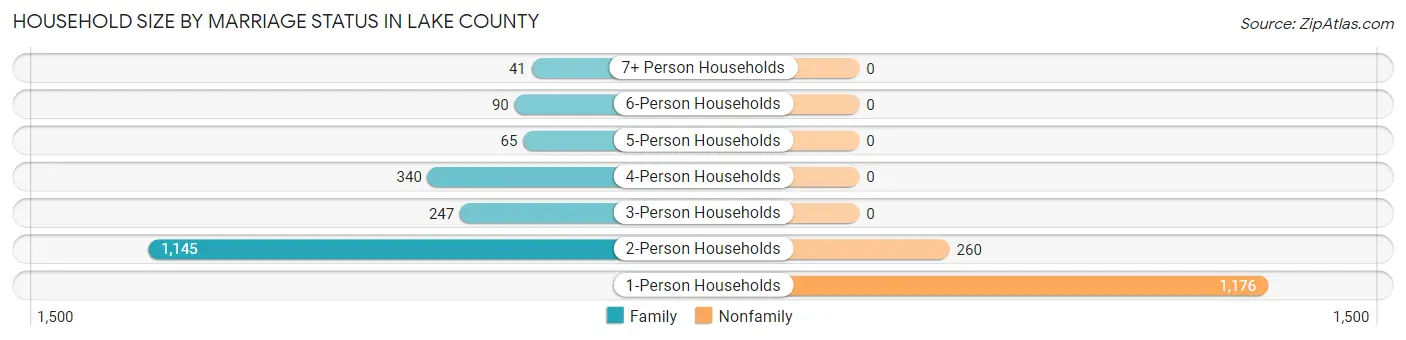
| Household Size | Family Households | Nonfamily Households |
| 1-Person Households | - | 1,176 (35.0%) |
| 2-Person Households | 1,145 (34.0%) | 260 (7.7%) |
| 3-Person Households | 247 (7.3%) | 0 (0.0%) |
| 4-Person Households | 340 (10.1%) | 0 (0.0%) |
| 5-Person Households | 65 (1.9%) | 0 (0.0%) |
| 6-Person Households | 90 (2.7%) | 0 (0.0%) |
| 7+ Person Households | 41 (1.2%) | 0 (0.0%) |
| Total | 1,928 (57.3%) | 1,436 (42.7%) |
Female Fertility in Lake County
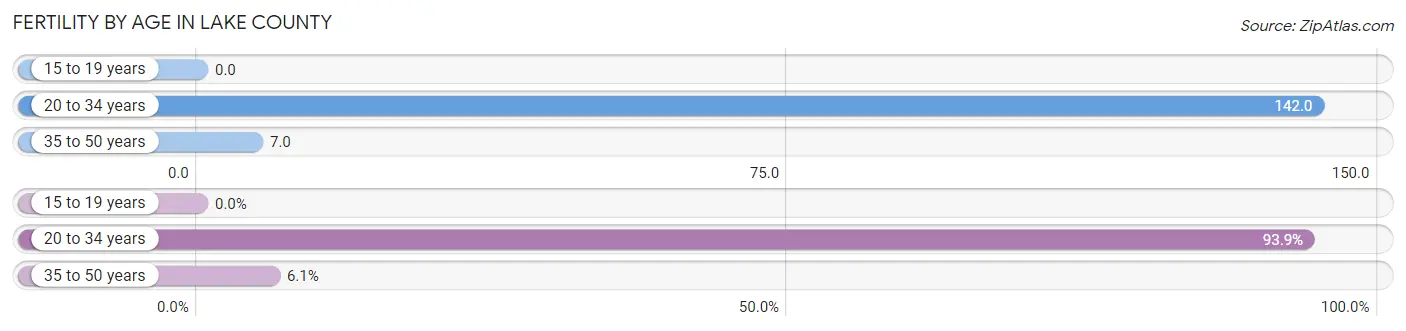
Fertility by Age in Lake County
Average fertility rate in Lake County is 57.0 births per 1,000 women. Women in the age bracket of 20 to 34 years have the highest fertility rate with 142.0 births per 1,000 women. Women in the age bracket of 20 to 34 years acount for 93.9% of all women with births.
| Age Bracket | Women with Births | Births / 1,000 Women |
| 15 to 19 years | 0 (0.0%) | 0.0 |
| 20 to 34 years | 77 (93.9%) | 142.0 |
| 35 to 50 years | 5 (6.1%) | 7.0 |
| Total | 82 (100.0%) | 57.0 |
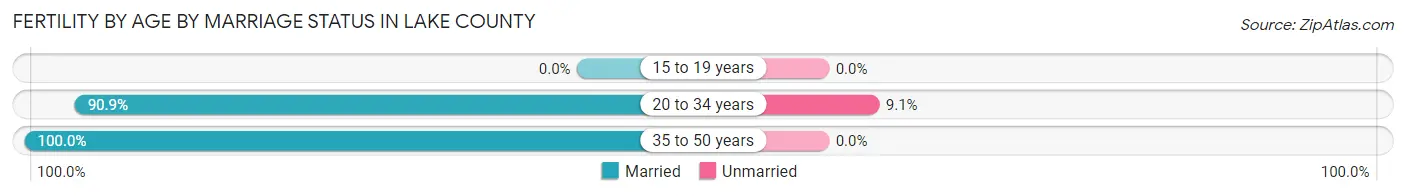
Fertility by Age by Marriage Status in Lake County
91.5% of women with births (82) in Lake County are married. The highest percentage of unmarried women with births falls into 20 to 34 years age bracket with 9.1% of them unmarried at the time of birth, while the lowest percentage of unmarried women with births belong to 35 to 50 years age bracket with 0.0% of them unmarried.
| Age Bracket | Married | Unmarried |
| 15 to 19 years | 0 (0.0%) | 0 (0.0%) |
| 20 to 34 years | 70 (90.9%) | 7 (9.1%) |
| 35 to 50 years | 5 (100.0%) | 0 (0.0%) |
| Total | 75 (91.5%) | 7 (8.5%) |
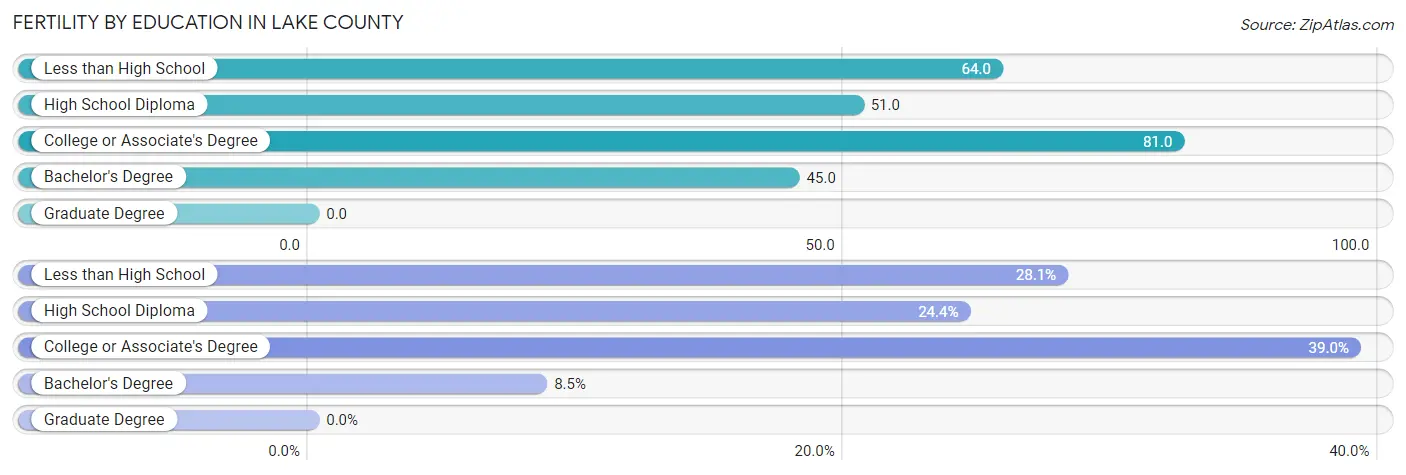
Fertility by Education in Lake County
| Educational Attainment | Women with Births | Births / 1,000 Women |
| Less than High School | 23 (28.1%) | 64.0 |
| High School Diploma | 20 (24.4%) | 51.0 |
| College or Associate's Degree | 32 (39.0%) | 81.0 |
| Bachelor's Degree | 7 (8.5%) | 45.0 |
| Graduate Degree | 0 (0.0%) | 0.0 |
| Total | 82 (100.0%) | 57.0 |
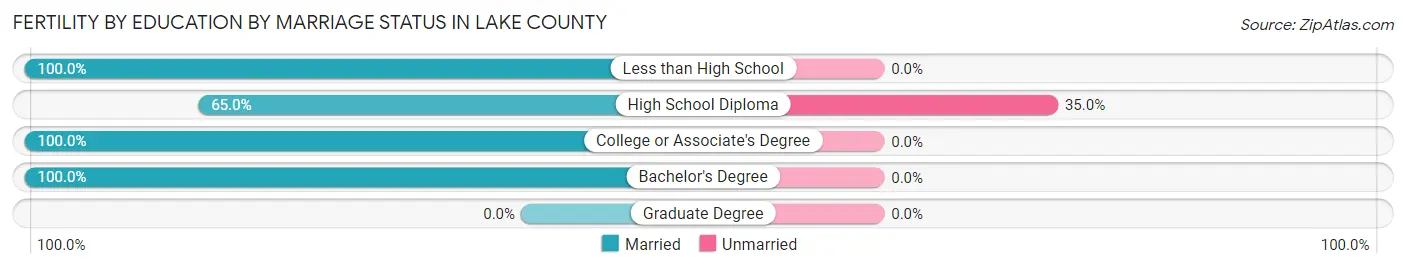
Fertility by Education by Marriage Status in Lake County
8.5% of women with births in Lake County are unmarried. Women with the educational attainment of less than high school are most likely to be married with 100.0% of them married at childbirth, while women with the educational attainment of high school diploma are least likely to be married with 35.0% of them unmarried at childbirth.
| Educational Attainment | Married | Unmarried |
| Less than High School | 23 (100.0%) | 0 (0.0%) |
| High School Diploma | 13 (65.0%) | 7 (35.0%) |
| College or Associate's Degree | 32 (100.0%) | 0 (0.0%) |
| Bachelor's Degree | 7 (100.0%) | 0 (0.0%) |
| Graduate Degree | 0 (0.0%) | 0 (0.0%) |
| Total | 75 (91.5%) | 7 (8.5%) |
Income in Lake County
Income Overview in Lake County
Per Capita Income in Lake County is $29,400, while median incomes of families and households are $74,322 and $54,663 respectively.
| Characteristic | Number | Measure |
| Per Capita Income | 8,201 | $29,400 |
| Median Family Income | 1,928 | $74,322 |
| Mean Family Income | 1,928 | $86,280 |
| Median Household Income | 3,364 | $54,663 |
| Mean Household Income | 3,364 | $67,927 |
| Income Deficit | 1,928 | $10,918 |
| Wage / Income Gap (%) | 8,201 | 36.92% |
| Wage / Income Gap ($) | 8,201 | 63.08¢ per $1 |
| Gini / Inequality Index | 8,201 | 0.44 |
Earnings by Sex in Lake County
Average Earnings in Lake County are $28,075, $38,229 for men and $24,116 for women, a difference of 36.9%.
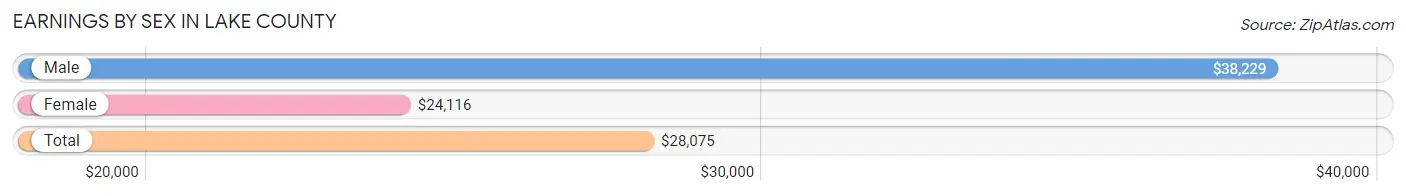
| Sex | Number | Average Earnings |
| Male | 2,318 (58.1%) | $38,229 |
| Female | 1,675 (41.9%) | $24,116 |
| Total | 3,993 (100.0%) | $28,075 |
Earnings by Sex by Income Bracket in Lake County
The most common earnings brackets in Lake County are $100,000+ for men (272 | 11.7%) and $22,500 to $24,999 for women (140 | 8.4%).
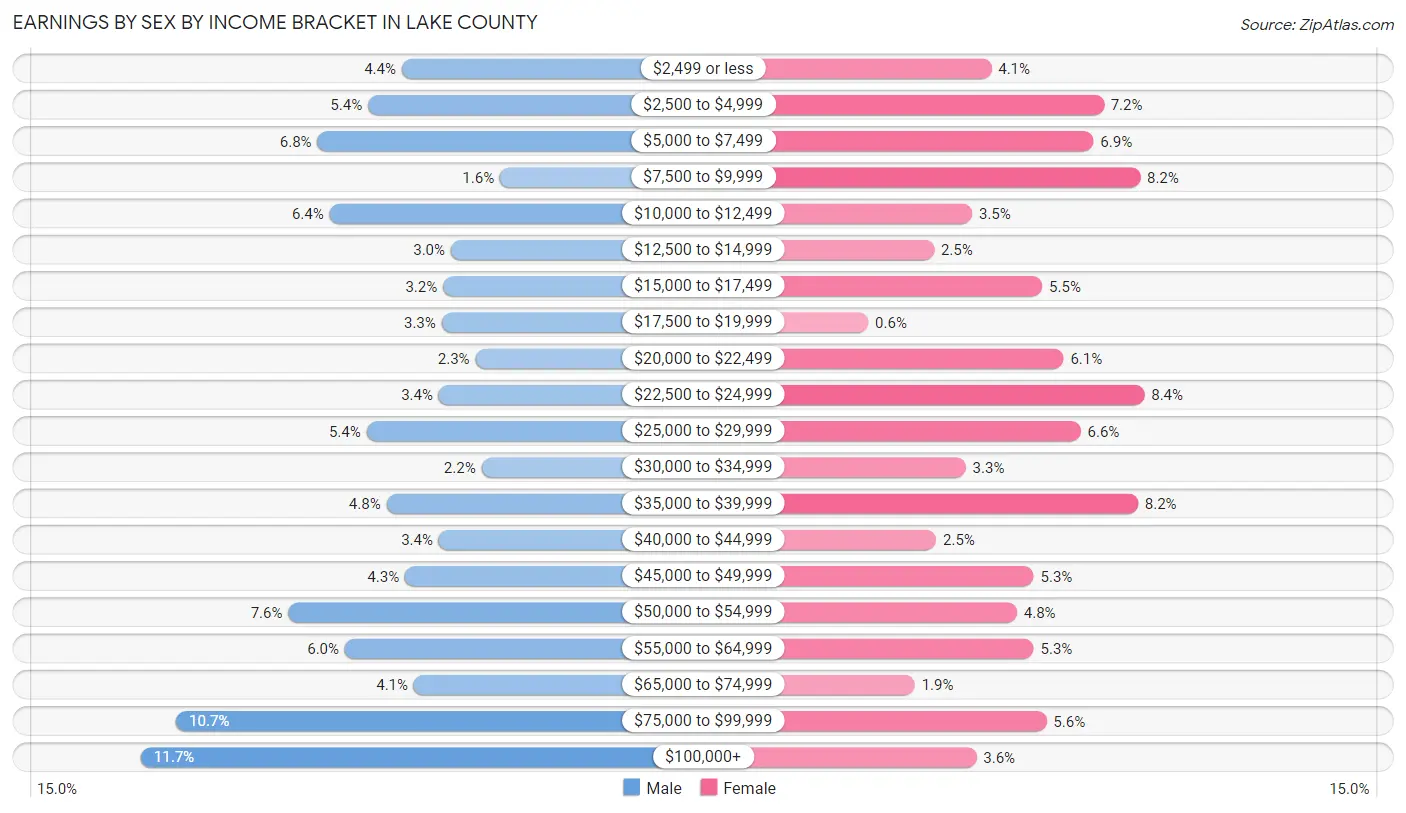
| Income | Male | Female |
| $2,499 or less | 102 (4.4%) | 68 (4.1%) |
| $2,500 to $4,999 | 124 (5.3%) | 121 (7.2%) |
| $5,000 to $7,499 | 157 (6.8%) | 116 (6.9%) |
| $7,500 to $9,999 | 38 (1.6%) | 138 (8.2%) |
| $10,000 to $12,499 | 149 (6.4%) | 59 (3.5%) |
| $12,500 to $14,999 | 70 (3.0%) | 41 (2.5%) |
| $15,000 to $17,499 | 75 (3.2%) | 92 (5.5%) |
| $17,500 to $19,999 | 76 (3.3%) | 10 (0.6%) |
| $20,000 to $22,499 | 54 (2.3%) | 102 (6.1%) |
| $22,500 to $24,999 | 78 (3.4%) | 140 (8.4%) |
| $25,000 to $29,999 | 125 (5.4%) | 110 (6.6%) |
| $30,000 to $34,999 | 50 (2.2%) | 56 (3.3%) |
| $35,000 to $39,999 | 112 (4.8%) | 137 (8.2%) |
| $40,000 to $44,999 | 78 (3.4%) | 42 (2.5%) |
| $45,000 to $49,999 | 100 (4.3%) | 88 (5.2%) |
| $50,000 to $54,999 | 176 (7.6%) | 80 (4.8%) |
| $55,000 to $64,999 | 139 (6.0%) | 88 (5.2%) |
| $65,000 to $74,999 | 94 (4.1%) | 32 (1.9%) |
| $75,000 to $99,999 | 249 (10.7%) | 94 (5.6%) |
| $100,000+ | 272 (11.7%) | 61 (3.6%) |
| Total | 2,318 (100.0%) | 1,675 (100.0%) |
Earnings by Sex by Educational Attainment in Lake County
Average earnings in Lake County are $40,992 for men and $27,528 for women, a difference of 32.9%. Men with an educational attainment of graduate degree enjoy the highest average annual earnings of $111,458, while those with less than high school education earn the least with $11,860. Women with an educational attainment of graduate degree earn the most with the average annual earnings of $56,250, while those with college or associate's degree education have the smallest earnings of $24,006.
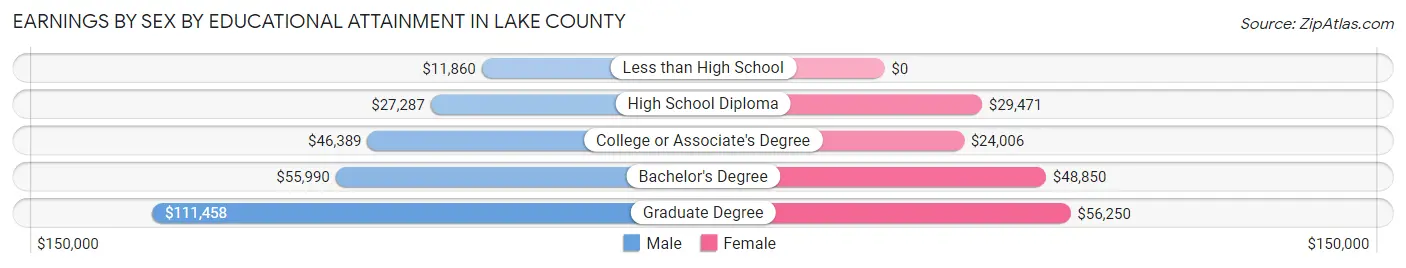
| Educational Attainment | Male Income | Female Income |
| Less than High School | $11,860 | $0 |
| High School Diploma | $27,287 | $29,471 |
| College or Associate's Degree | $46,389 | $24,006 |
| Bachelor's Degree | $55,990 | $48,850 |
| Graduate Degree | $111,458 | $56,250 |
| Total | $40,992 | $27,528 |
Family Income in Lake County
Family Income Brackets in Lake County
According to the Lake County family income data, there are 399 families falling into the $50,000 to $74,999 income range, which is the most common income bracket and makes up 20.7% of all families. Conversely, the less than $10,000 income bracket is the least frequent group with only 33 families (1.7%) belonging to this category.
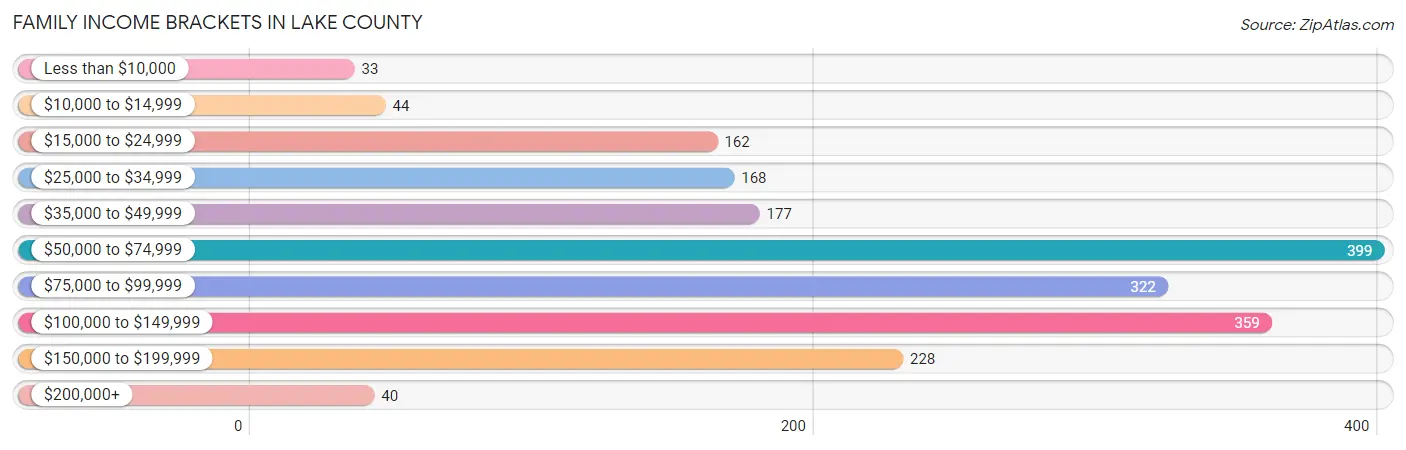
| Income Bracket | # Families | % Families |
| Less than $10,000 | 33 | 1.7% |
| $10,000 to $14,999 | 44 | 2.3% |
| $15,000 to $24,999 | 162 | 8.4% |
| $25,000 to $34,999 | 168 | 8.7% |
| $35,000 to $49,999 | 177 | 9.2% |
| $50,000 to $74,999 | 399 | 20.7% |
| $75,000 to $99,999 | 322 | 16.7% |
| $100,000 to $149,999 | 359 | 18.6% |
| $150,000 to $199,999 | 228 | 11.8% |
| $200,000+ | 40 | 2.1% |
Family Income by Famaliy Size in Lake County
4-person families (283 | 14.7%) account for the highest median family income in Lake County with $92,679 per family, while 2-person families (1,160 | 60.2%) have the highest median income of $34,570 per family member.
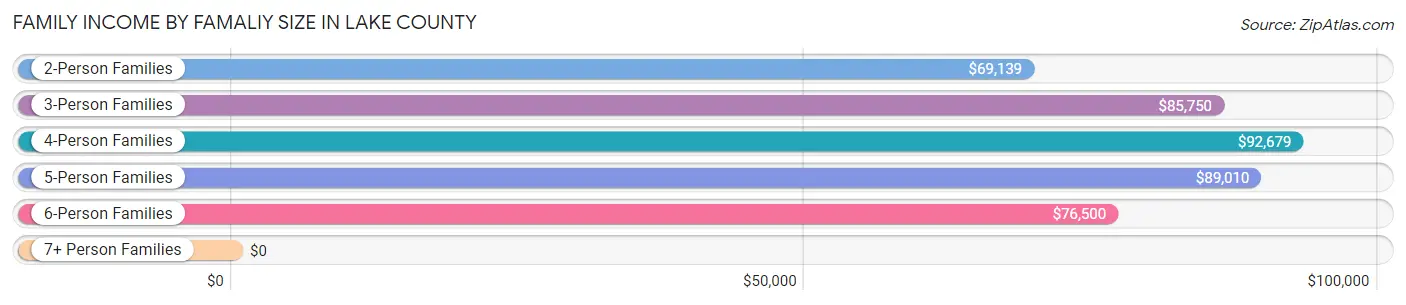
| Income Bracket | # Families | Median Income |
| 2-Person Families | 1,160 (60.2%) | $69,139 |
| 3-Person Families | 289 (15.0%) | $85,750 |
| 4-Person Families | 283 (14.7%) | $92,679 |
| 5-Person Families | 75 (3.9%) | $89,010 |
| 6-Person Families | 80 (4.2%) | $76,500 |
| 7+ Person Families | 41 (2.1%) | $0 |
| Total | 1,928 (100.0%) | $74,322 |
Family Income by Number of Earners in Lake County
The median family income in Lake County is $74,322, with families comprising 2 earners (828) having the highest median family income of $97,955, while families with no earners (488) have the lowest median family income of $38,561, accounting for 42.9% and 25.3% of families, respectively.
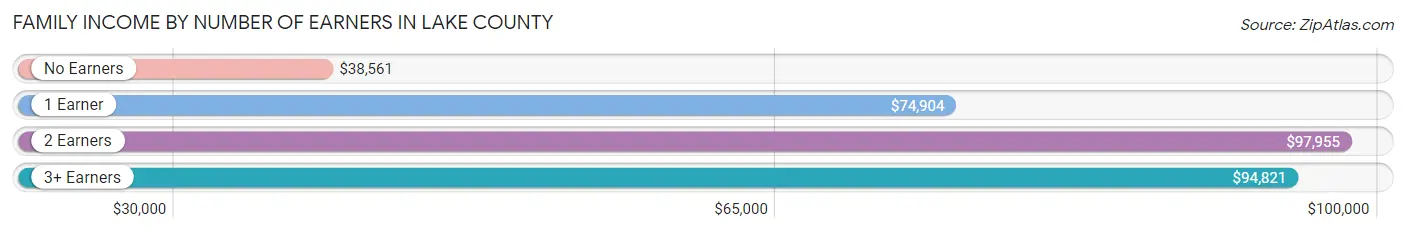
| Number of Earners | # Families | Median Income |
| No Earners | 488 (25.3%) | $38,561 |
| 1 Earner | 427 (22.2%) | $74,904 |
| 2 Earners | 828 (42.9%) | $97,955 |
| 3+ Earners | 185 (9.6%) | $94,821 |
| Total | 1,928 (100.0%) | $74,322 |
Household Income in Lake County
Household Income Brackets in Lake County
With 669 households falling in the category, the $50,000 to $74,999 income range is the most frequent in Lake County, accounting for 19.9% of all households. In contrast, only 44 households (1.3%) fall into the $200,000+ income bracket, making it the least populous group.
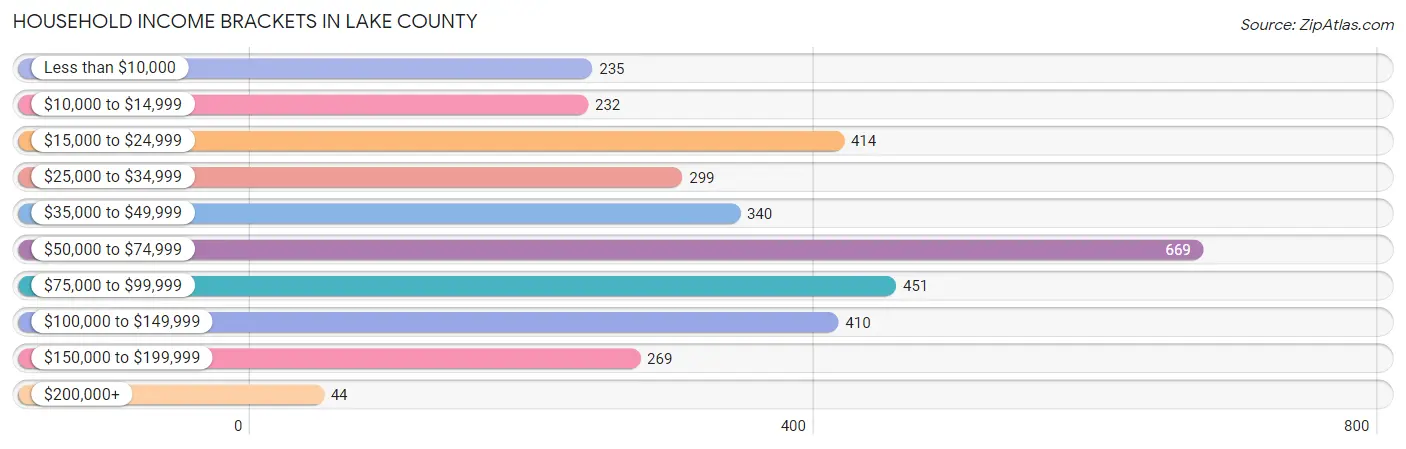
| Income Bracket | # Households | % Households |
| Less than $10,000 | 235 | 7.0% |
| $10,000 to $14,999 | 232 | 6.9% |
| $15,000 to $24,999 | 414 | 12.3% |
| $25,000 to $34,999 | 299 | 8.9% |
| $35,000 to $49,999 | 340 | 10.1% |
| $50,000 to $74,999 | 669 | 19.9% |
| $75,000 to $99,999 | 451 | 13.4% |
| $100,000 to $149,999 | 410 | 12.2% |
| $150,000 to $199,999 | 269 | 8.0% |
| $200,000+ | 44 | 1.3% |
Household Income by Householder Age in Lake County
The median household income in Lake County is $54,663, with the highest median household income of $71,563 found in the 45 to 64 years age bracket for the primary householder. A total of 1,044 households (31.0%) fall into this category. Meanwhile, the 65+ years age bracket for the primary householder has the lowest median household income of $38,772, with 1,377 households (40.9%) in this group.
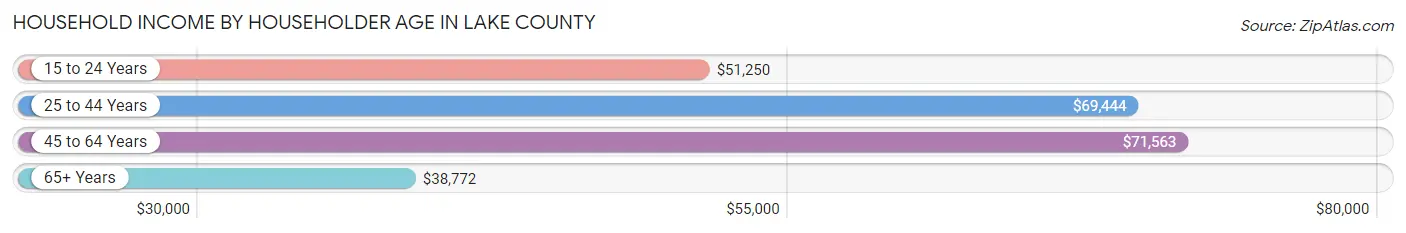
| Income Bracket | # Households | Median Income |
| 15 to 24 Years | 161 (4.8%) | $51,250 |
| 25 to 44 Years | 782 (23.3%) | $69,444 |
| 45 to 64 Years | 1,044 (31.0%) | $71,563 |
| 65+ Years | 1,377 (40.9%) | $38,772 |
| Total | 3,364 (100.0%) | $54,663 |
Poverty in Lake County
Income Below Poverty by Sex and Age in Lake County
With 18.3% poverty level for males and 20.9% for females among the residents of Lake County, 15 year old males and 45 to 54 year old females are the most vulnerable to poverty, with 49 males (75.4%) and 229 females (51.9%) in their respective age groups living below the poverty level.
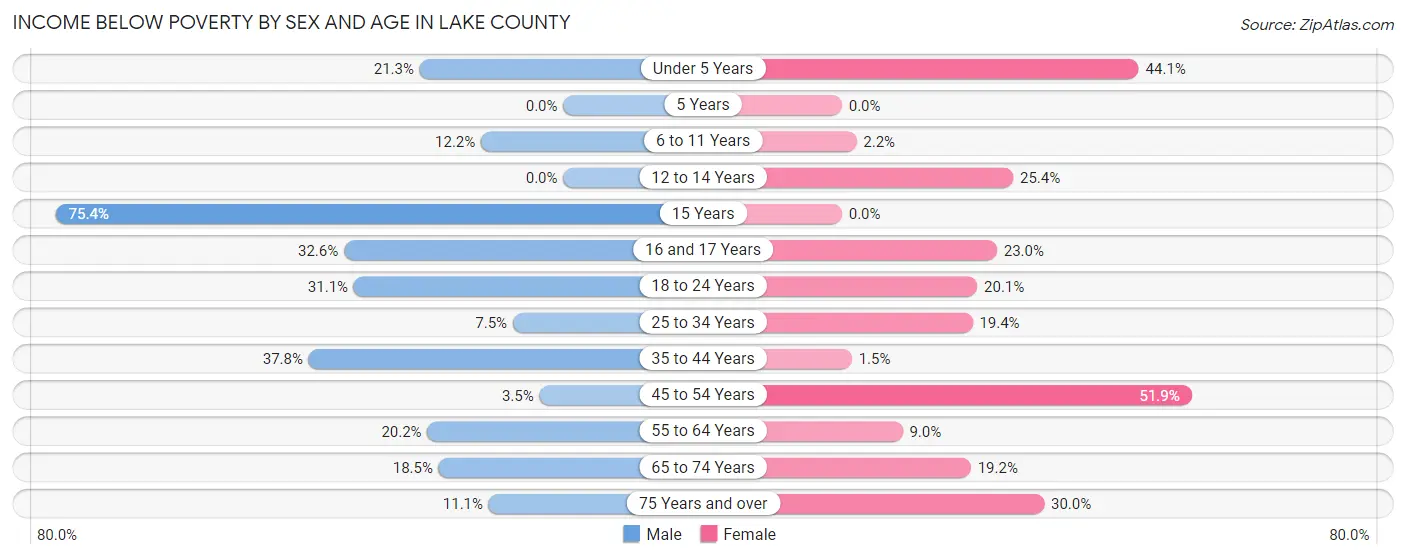
| Age Bracket | Male | Female |
| Under 5 Years | 55 (21.3%) | 67 (44.1%) |
| 5 Years | 0 (0.0%) | 0 (0.0%) |
| 6 to 11 Years | 26 (12.2%) | 5 (2.2%) |
| 12 to 14 Years | 0 (0.0%) | 44 (25.4%) |
| 15 Years | 49 (75.4%) | 0 (0.0%) |
| 16 and 17 Years | 28 (32.6%) | 32 (23.0%) |
| 18 to 24 Years | 88 (31.1%) | 45 (20.1%) |
| 25 to 34 Years | 29 (7.5%) | 71 (19.4%) |
| 35 to 44 Years | 155 (37.8%) | 6 (1.5%) |
| 45 to 54 Years | 16 (3.5%) | 229 (51.9%) |
| 55 to 64 Years | 110 (20.2%) | 52 (9.0%) |
| 65 to 74 Years | 125 (18.5%) | 113 (19.2%) |
| 75 Years and over | 45 (11.1%) | 115 (30.0%) |
| Total | 726 (18.3%) | 779 (20.9%) |
Income Above Poverty by Sex and Age in Lake County
According to the poverty statistics in Lake County, males aged 5 years and females aged 5 years are the age groups that are most secure financially, with 100.0% of males and 100.0% of females in these age groups living above the poverty line.
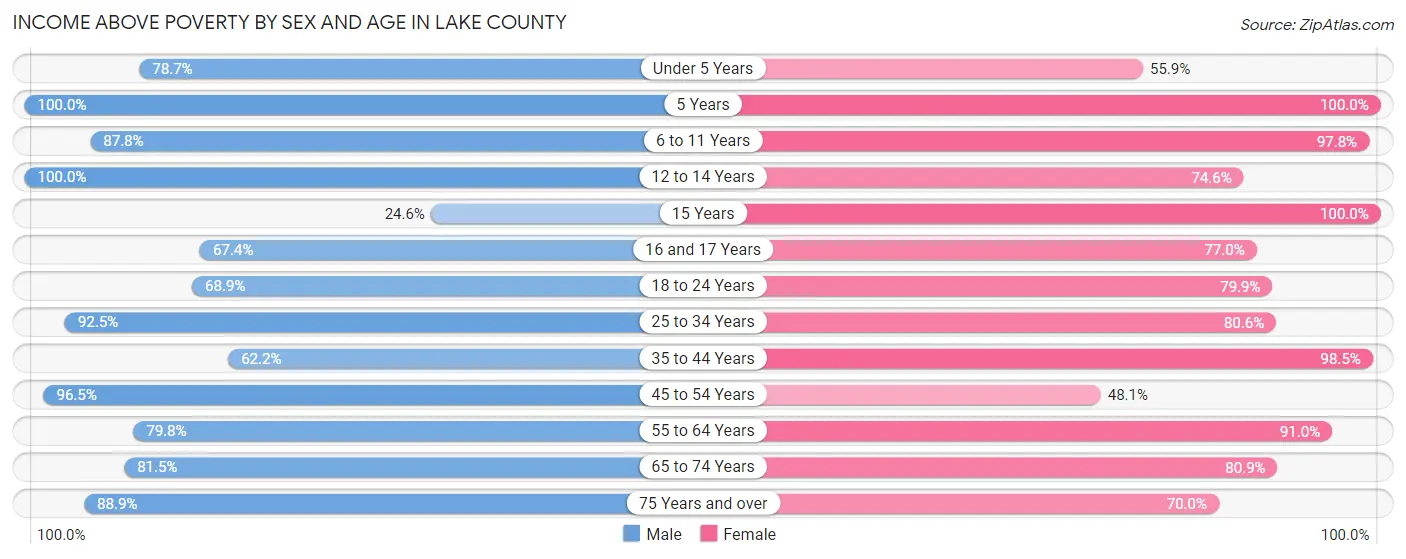
| Age Bracket | Male | Female |
| Under 5 Years | 203 (78.7%) | 85 (55.9%) |
| 5 Years | 28 (100.0%) | 34 (100.0%) |
| 6 to 11 Years | 187 (87.8%) | 227 (97.8%) |
| 12 to 14 Years | 147 (100.0%) | 129 (74.6%) |
| 15 Years | 16 (24.6%) | 12 (100.0%) |
| 16 and 17 Years | 58 (67.4%) | 107 (77.0%) |
| 18 to 24 Years | 195 (68.9%) | 179 (79.9%) |
| 25 to 34 Years | 358 (92.5%) | 295 (80.6%) |
| 35 to 44 Years | 255 (62.2%) | 403 (98.5%) |
| 45 to 54 Years | 437 (96.5%) | 212 (48.1%) |
| 55 to 64 Years | 435 (79.8%) | 525 (91.0%) |
| 65 to 74 Years | 551 (81.5%) | 477 (80.8%) |
| 75 Years and over | 362 (88.9%) | 268 (70.0%) |
| Total | 3,232 (81.7%) | 2,953 (79.1%) |
Income Below Poverty Among Married-Couple Families in Lake County
The poverty statistics for married-couple families in Lake County show that 7.9% or 123 of the total 1,550 families live below the poverty line. Families with 3 or 4 children have the highest poverty rate of 26.4%, comprising of 29 families. On the other hand, families with 5 or more children have the lowest poverty rate of 0.0%, which includes 0 families.
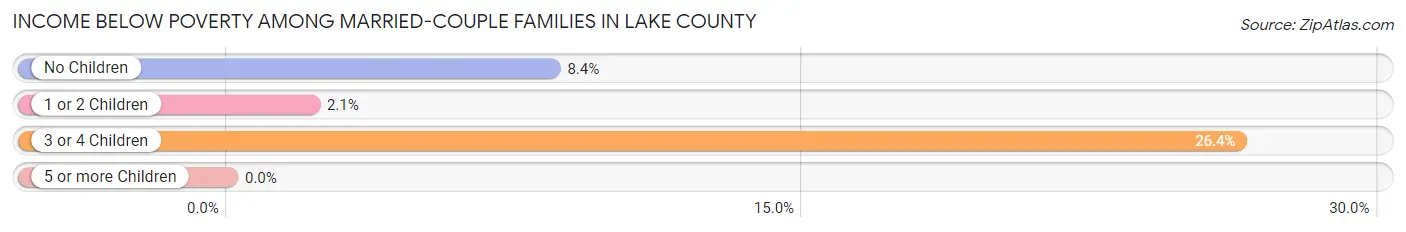
| Children | Above Poverty | Below Poverty |
| No Children | 924 (91.6%) | 85 (8.4%) |
| 1 or 2 Children | 412 (97.9%) | 9 (2.1%) |
| 3 or 4 Children | 81 (73.6%) | 29 (26.4%) |
| 5 or more Children | 10 (100.0%) | 0 (0.0%) |
| Total | 1,427 (92.1%) | 123 (7.9%) |
Income Below Poverty Among Single-Parent Households in Lake County
According to the poverty data in Lake County, 7.5% or 10 single-father households and 26.1% or 64 single-mother households are living below the poverty line. Among single-father households, those with no children have the highest poverty rate, with 8 households (8.6%) experiencing poverty. Likewise, among single-mother households, those with 5 or more children have the highest poverty rate, with 31 households (100.0%) falling below the poverty line.
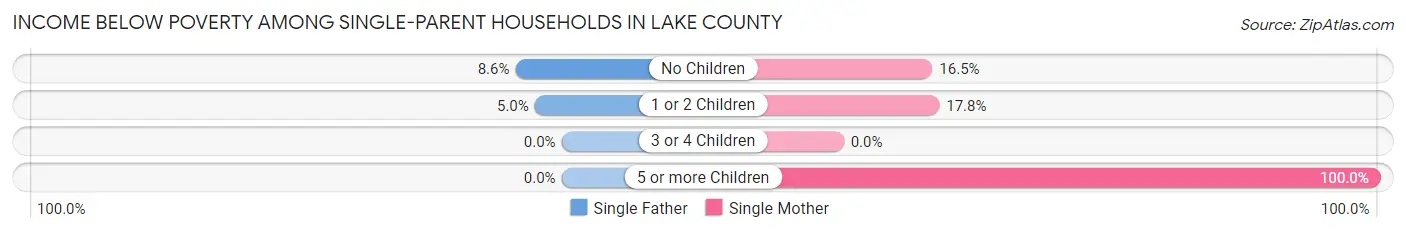
| Children | Single Father | Single Mother |
| No Children | 8 (8.6%) | 20 (16.5%) |
| 1 or 2 Children | 2 (5.0%) | 13 (17.8%) |
| 3 or 4 Children | 0 (0.0%) | 0 (0.0%) |
| 5 or more Children | 0 (0.0%) | 31 (100.0%) |
| Total | 10 (7.5%) | 64 (26.1%) |
Income Below Poverty Among Married-Couple vs Single-Parent Households in Lake County
The poverty data for Lake County shows that 123 of the married-couple family households (7.9%) and 74 of the single-parent households (19.6%) are living below the poverty level. Within the married-couple family households, those with 3 or 4 children have the highest poverty rate, with 29 households (26.4%) falling below the poverty line. Among the single-parent households, those with 5 or more children have the highest poverty rate, with 31 household (100.0%) living below poverty.
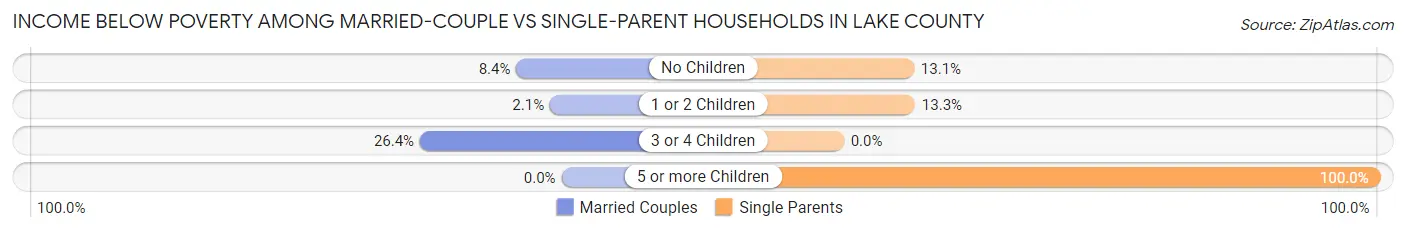
| Children | Married-Couple Families | Single-Parent Households |
| No Children | 85 (8.4%) | 28 (13.1%) |
| 1 or 2 Children | 9 (2.1%) | 15 (13.3%) |
| 3 or 4 Children | 29 (26.4%) | 0 (0.0%) |
| 5 or more Children | 0 (0.0%) | 31 (100.0%) |
| Total | 123 (7.9%) | 74 (19.6%) |
Employment Characteristics in Lake County
Employment by Class of Employer in Lake County
Among the 3,037 employed individuals in Lake County, private company employees (1,321 | 43.5%), self-employed (not incorporated) (397 | 13.1%), and not-for-profit organizations (373 | 12.3%) make up the most common classes of employment.
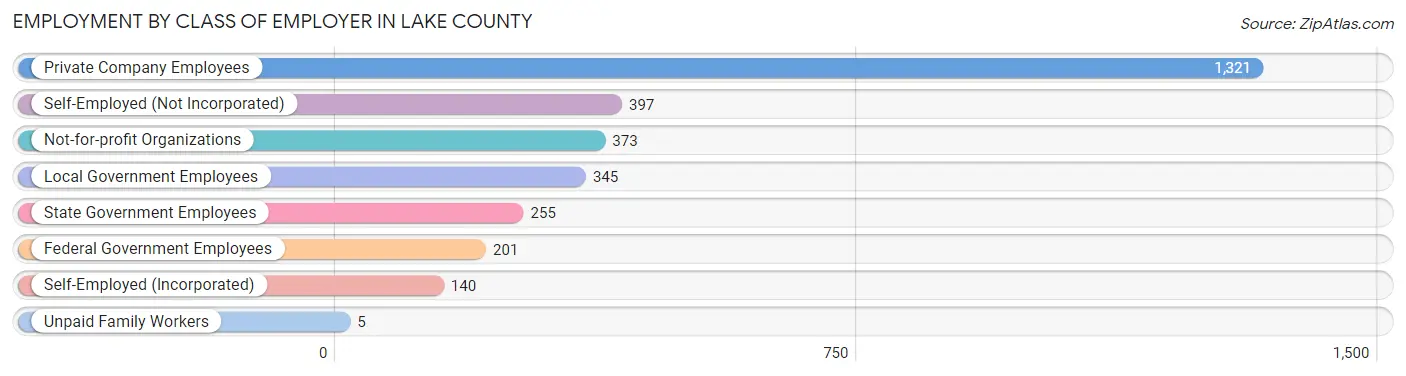
| Employer Class | # Employees | % Employees |
| Private Company Employees | 1,321 | 43.5% |
| Self-Employed (Incorporated) | 140 | 4.6% |
| Self-Employed (Not Incorporated) | 397 | 13.1% |
| Not-for-profit Organizations | 373 | 12.3% |
| Local Government Employees | 345 | 11.4% |
| State Government Employees | 255 | 8.4% |
| Federal Government Employees | 201 | 6.6% |
| Unpaid Family Workers | 5 | 0.2% |
| Total | 3,037 | 100.0% |
Employment Status by Age in Lake County
According to the labor force statistics for Lake County, out of the total population over 16 years of age (6,887), 48.6% or 3,347 individuals are in the labor force, with 7.7% or 258 of them unemployed. The age group with the highest labor force participation rate is 25 to 29 years, with 73.6% or 273 individuals in the labor force. Within the labor force, the 20 to 24 years age range has the highest percentage of unemployed individuals, with 16.3% or 41 of them being unemployed.
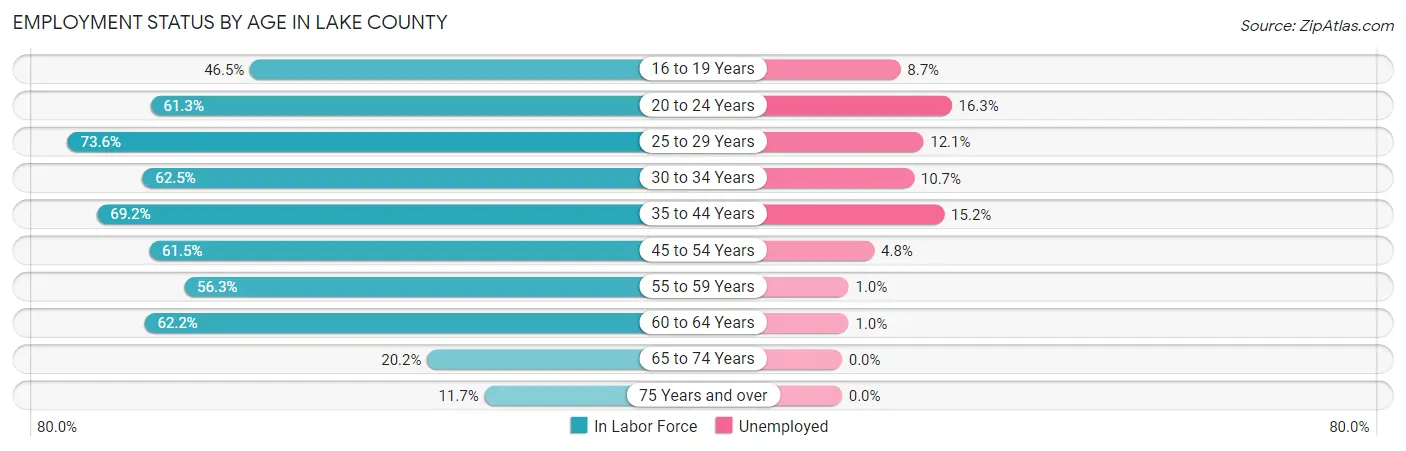
| Age Bracket | In Labor Force | Unemployed |
| 16 to 19 Years | 161 (46.5%) | 14 (8.7%) |
| 20 to 24 Years | 252 (61.3%) | 41 (16.3%) |
| 25 to 29 Years | 273 (73.6%) | 33 (12.1%) |
| 30 to 34 Years | 337 (62.5%) | 36 (10.7%) |
| 35 to 44 Years | 640 (69.2%) | 97 (15.2%) |
| 45 to 54 Years | 640 (61.5%) | 31 (4.8%) |
| 55 to 59 Years | 382 (56.3%) | 4 (1.0%) |
| 60 to 64 Years | 309 (62.2%) | 3 (1.0%) |
| 65 to 74 Years | 256 (20.2%) | 0 (0.0%) |
| 75 Years and over | 95 (11.7%) | 0 (0.0%) |
| Total | 3,347 (48.6%) | 258 (7.7%) |
Employment Status by Educational Attainment in Lake County
According to labor force statistics for Lake County, 63.7% of individuals (2,580) out of the total population between 25 and 64 years of age (4,050) are in the labor force, with 7.9% or 204 of them being unemployed. The group with the highest labor force participation rate are those with the educational attainment of bachelor's degree or higher, with 89.7% or 786 individuals in the labor force. Within the labor force, individuals with less than high school education have the highest percentage of unemployment, with 28.6% or 54 of them being unemployed.
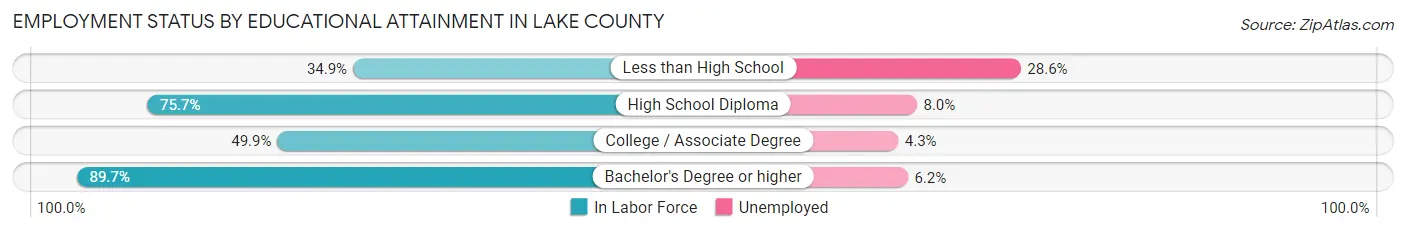
| Educational Attainment | In Labor Force | Unemployed |
| Less than High School | 189 (34.9%) | 155 (28.6%) |
| High School Diploma | 859 (75.7%) | 91 (8.0%) |
| College / Associate Degree | 747 (49.9%) | 64 (4.3%) |
| Bachelor's Degree or higher | 786 (89.7%) | 54 (6.2%) |
| Total | 2,580 (63.7%) | 320 (7.9%) |
Employment Occupations by Sex in Lake County
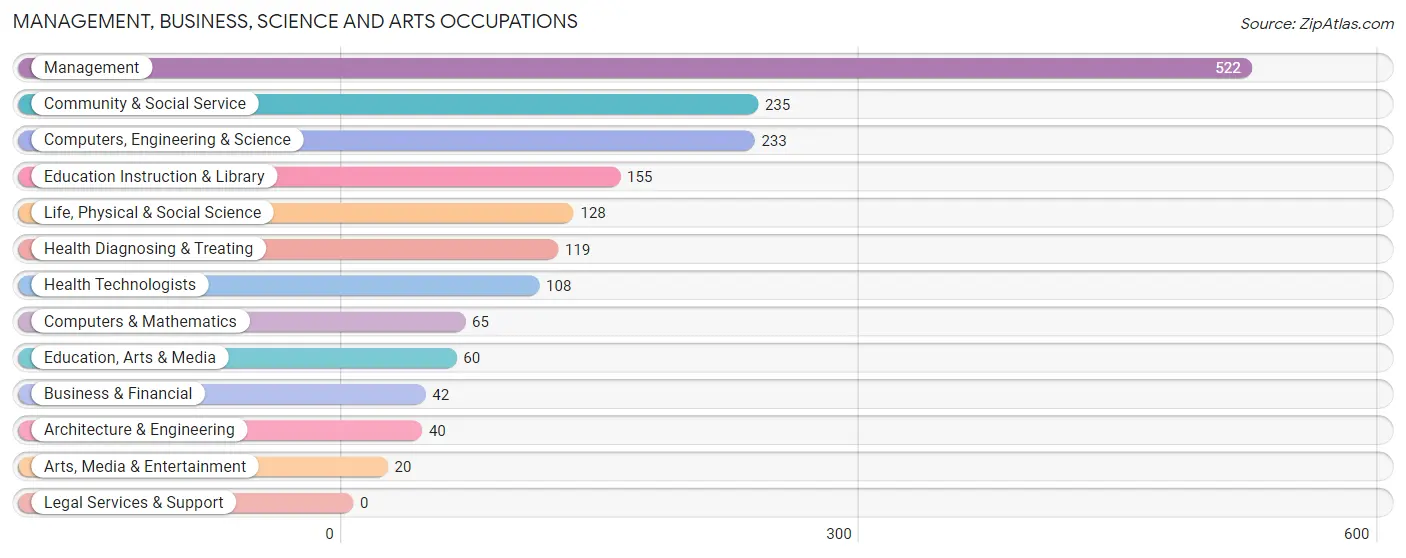
Management, Business, Science and Arts Occupations
The most common Management, Business, Science and Arts occupations in Lake County are Management (522 | 16.9%), Community & Social Service (235 | 7.6%), Computers, Engineering & Science (233 | 7.5%), Education Instruction & Library (155 | 5.0%), and Life, Physical & Social Science (128 | 4.2%).
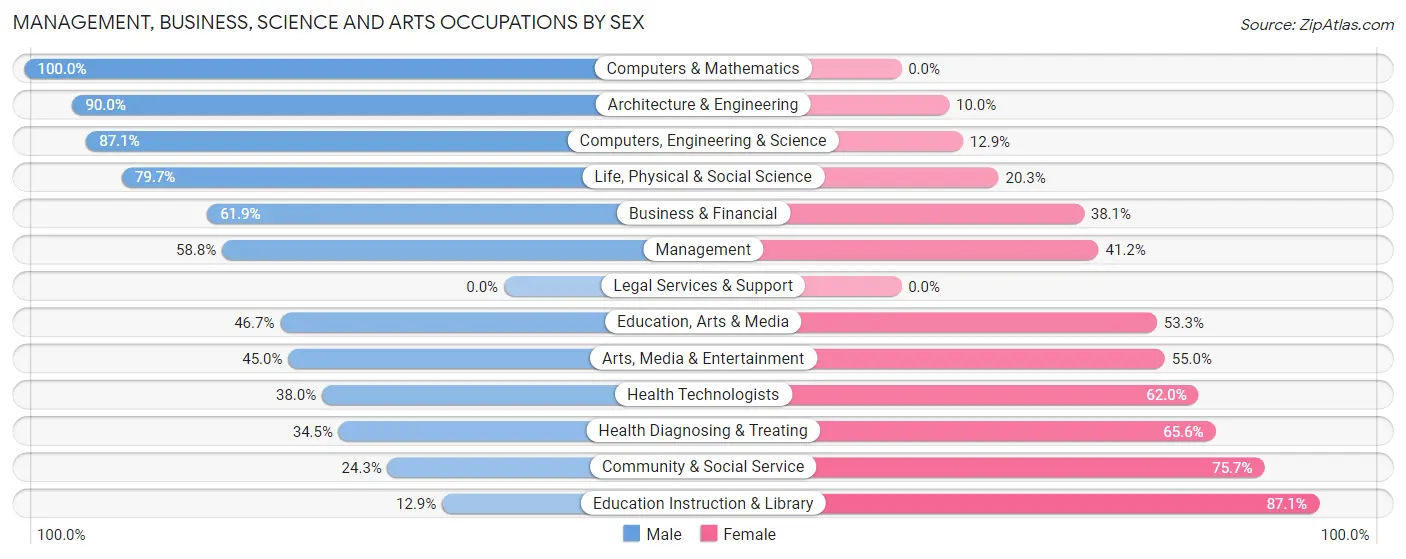
Management, Business, Science and Arts Occupations by Sex
Within the Management, Business, Science and Arts occupations in Lake County, the most male-oriented occupations are Computers & Mathematics (100.0%), Architecture & Engineering (90.0%), and Computers, Engineering & Science (87.1%), while the most female-oriented occupations are Education Instruction & Library (87.1%), Community & Social Service (75.7%), and Health Diagnosing & Treating (65.5%).
| Occupation | Male | Female |
| Management | 307 (58.8%) | 215 (41.2%) |
| Business & Financial | 26 (61.9%) | 16 (38.1%) |
| Computers, Engineering & Science | 203 (87.1%) | 30 (12.9%) |
| Computers & Mathematics | 65 (100.0%) | 0 (0.0%) |
| Architecture & Engineering | 36 (90.0%) | 4 (10.0%) |
| Life, Physical & Social Science | 102 (79.7%) | 26 (20.3%) |
| Community & Social Service | 57 (24.3%) | 178 (75.7%) |
| Education, Arts & Media | 28 (46.7%) | 32 (53.3%) |
| Legal Services & Support | 0 (0.0%) | 0 (0.0%) |
| Education Instruction & Library | 20 (12.9%) | 135 (87.1%) |
| Arts, Media & Entertainment | 9 (45.0%) | 11 (55.0%) |
| Health Diagnosing & Treating | 41 (34.4%) | 78 (65.5%) |
| Health Technologists | 41 (38.0%) | 67 (62.0%) |
| Total (Category) | 634 (55.1%) | 517 (44.9%) |
| Total (Overall) | 1,756 (56.9%) | 1,330 (43.1%) |
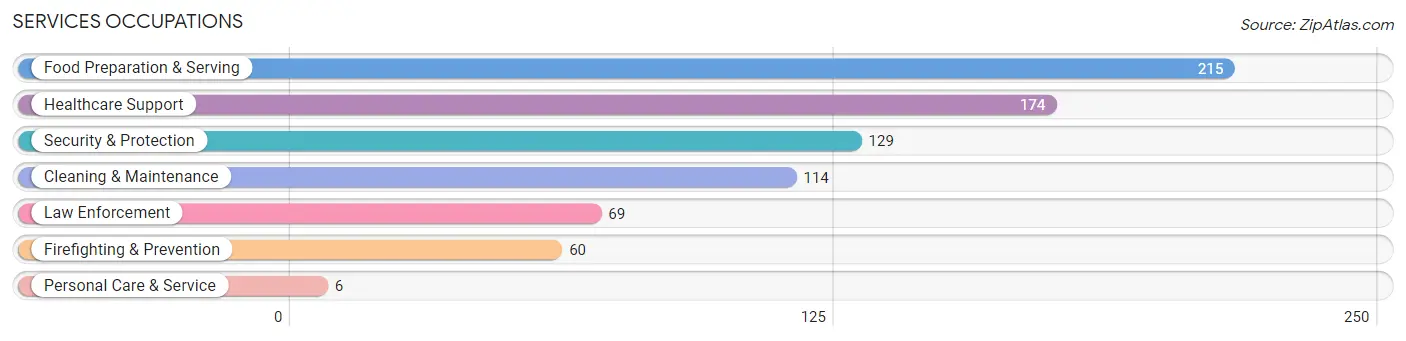
Services Occupations
The most common Services occupations in Lake County are Food Preparation & Serving (215 | 7.0%), Healthcare Support (174 | 5.6%), Security & Protection (129 | 4.2%), Cleaning & Maintenance (114 | 3.7%), and Law Enforcement (69 | 2.2%).
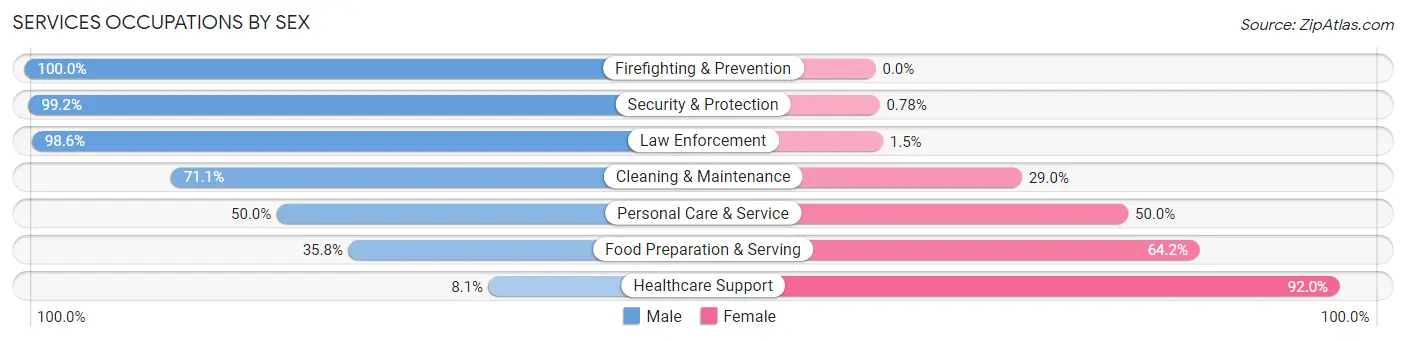
Services Occupations by Sex
Within the Services occupations in Lake County, the most male-oriented occupations are Firefighting & Prevention (100.0%), Security & Protection (99.2%), and Law Enforcement (98.6%), while the most female-oriented occupations are Healthcare Support (91.9%), Food Preparation & Serving (64.2%), and Personal Care & Service (50.0%).
| Occupation | Male | Female |
| Healthcare Support | 14 (8.1%) | 160 (91.9%) |
| Security & Protection | 128 (99.2%) | 1 (0.8%) |
| Firefighting & Prevention | 60 (100.0%) | 0 (0.0%) |
| Law Enforcement | 68 (98.6%) | 1 (1.5%) |
| Food Preparation & Serving | 77 (35.8%) | 138 (64.2%) |
| Cleaning & Maintenance | 81 (71.1%) | 33 (28.9%) |
| Personal Care & Service | 3 (50.0%) | 3 (50.0%) |
| Total (Category) | 303 (47.5%) | 335 (52.5%) |
| Total (Overall) | 1,756 (56.9%) | 1,330 (43.1%) |
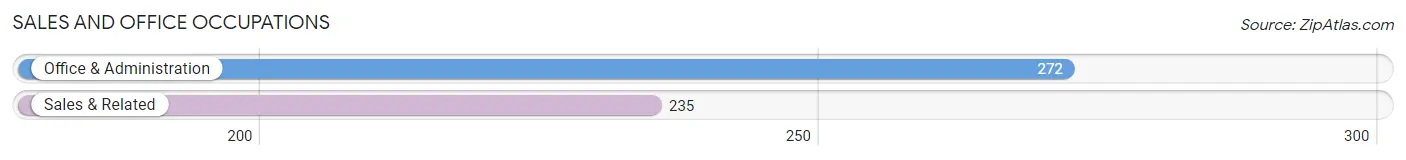
Sales and Office Occupations
The most common Sales and Office occupations in Lake County are Office & Administration (272 | 8.8%), and Sales & Related (235 | 7.6%).
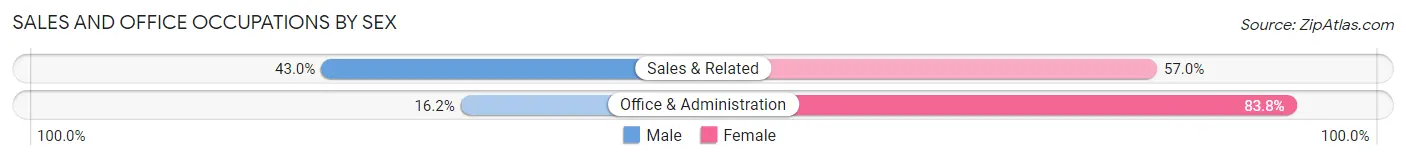
Sales and Office Occupations by Sex
| Occupation | Male | Female |
| Sales & Related | 101 (43.0%) | 134 (57.0%) |
| Office & Administration | 44 (16.2%) | 228 (83.8%) |
| Total (Category) | 145 (28.6%) | 362 (71.4%) |
| Total (Overall) | 1,756 (56.9%) | 1,330 (43.1%) |
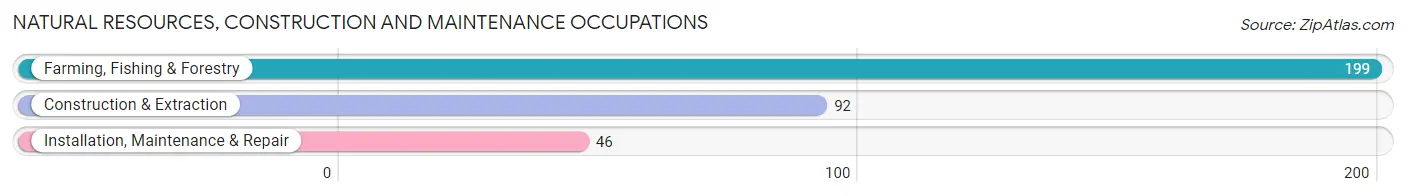
Natural Resources, Construction and Maintenance Occupations
The most common Natural Resources, Construction and Maintenance occupations in Lake County are Farming, Fishing & Forestry (199 | 6.5%), Construction & Extraction (92 | 3.0%), and Installation, Maintenance & Repair (46 | 1.5%).
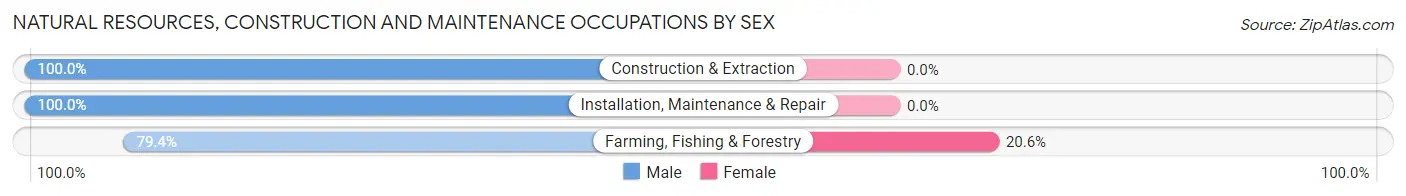
Natural Resources, Construction and Maintenance Occupations by Sex
| Occupation | Male | Female |
| Farming, Fishing & Forestry | 158 (79.4%) | 41 (20.6%) |
| Construction & Extraction | 92 (100.0%) | 0 (0.0%) |
| Installation, Maintenance & Repair | 46 (100.0%) | 0 (0.0%) |
| Total (Category) | 296 (87.8%) | 41 (12.2%) |
| Total (Overall) | 1,756 (56.9%) | 1,330 (43.1%) |
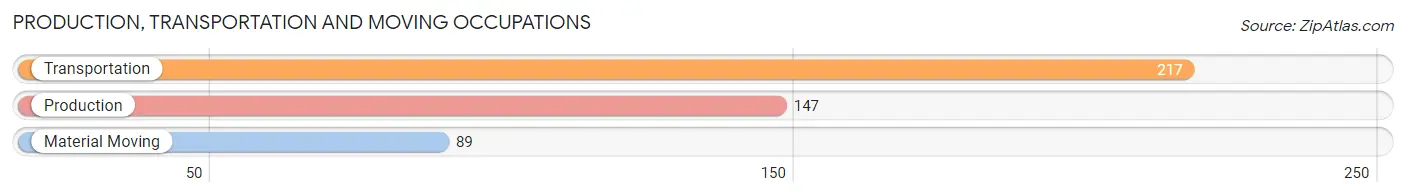
Production, Transportation and Moving Occupations
The most common Production, Transportation and Moving occupations in Lake County are Transportation (217 | 7.0%), Production (147 | 4.8%), and Material Moving (89 | 2.9%).
Production, Transportation and Moving Occupations by Sex
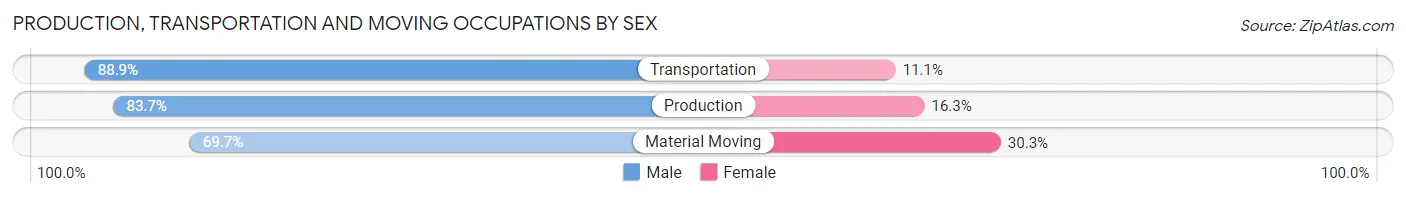
| Occupation | Male | Female |
| Production | 123 (83.7%) | 24 (16.3%) |
| Transportation | 193 (88.9%) | 24 (11.1%) |
| Material Moving | 62 (69.7%) | 27 (30.3%) |
| Total (Category) | 378 (83.4%) | 75 (16.6%) |
| Total (Overall) | 1,756 (56.9%) | 1,330 (43.1%) |
Employment Industries by Sex in Lake County
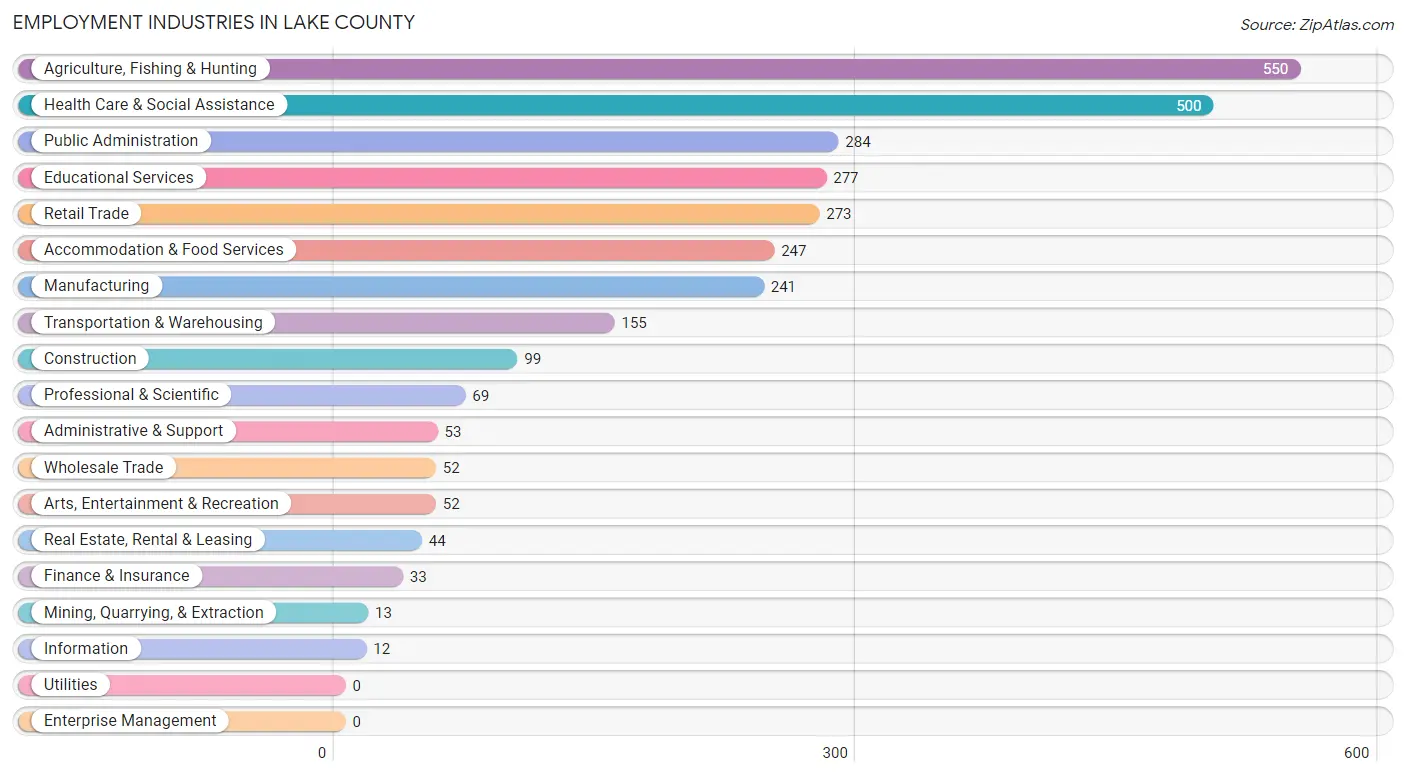
Employment Industries in Lake County
The major employment industries in Lake County include Agriculture, Fishing & Hunting (550 | 17.8%), Health Care & Social Assistance (500 | 16.2%), Public Administration (284 | 9.2%), Educational Services (277 | 9.0%), and Retail Trade (273 | 8.8%).
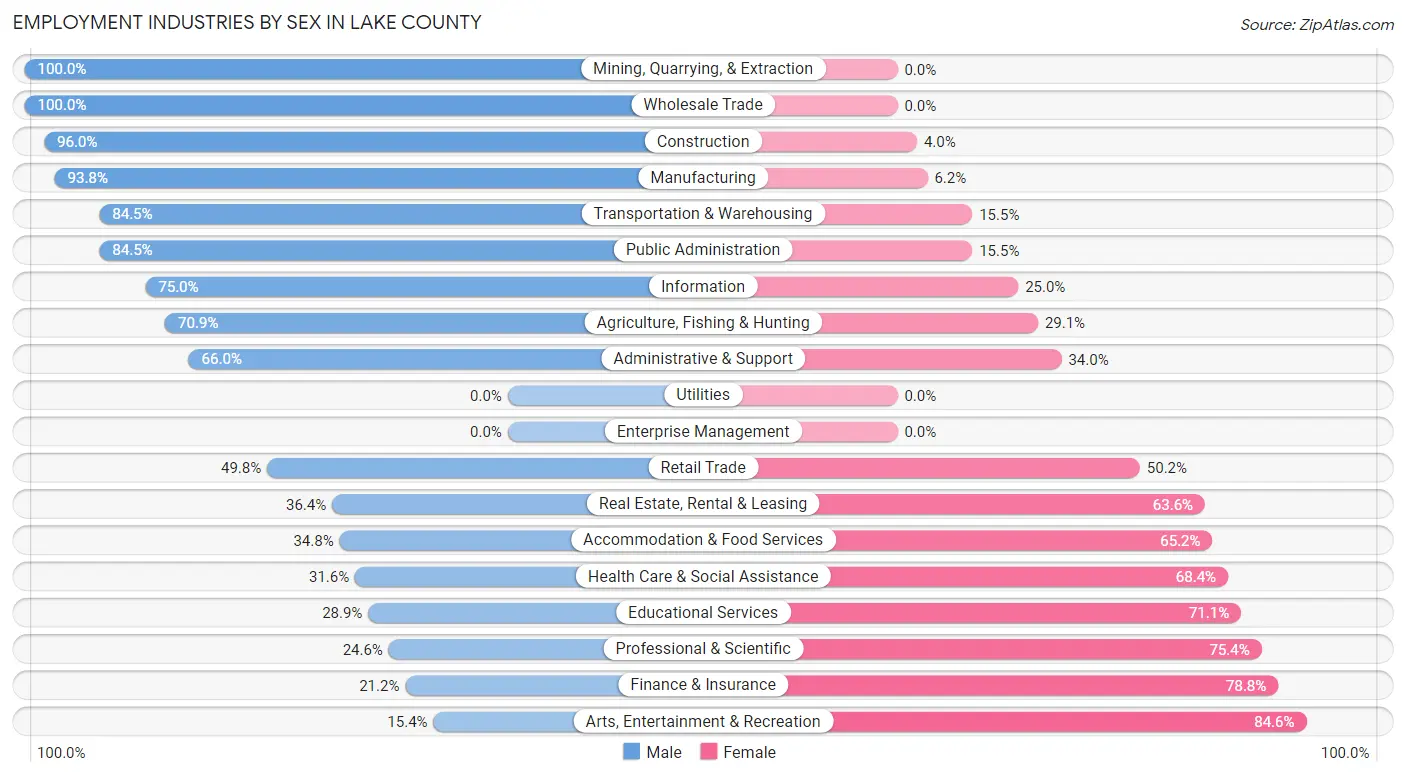
Employment Industries by Sex in Lake County
The Lake County industries that see more men than women are Mining, Quarrying, & Extraction (100.0%), Wholesale Trade (100.0%), and Construction (96.0%), whereas the industries that tend to have a higher number of women are Arts, Entertainment & Recreation (84.6%), Finance & Insurance (78.8%), and Professional & Scientific (75.4%).
| Industry | Male | Female |
| Agriculture, Fishing & Hunting | 390 (70.9%) | 160 (29.1%) |
| Mining, Quarrying, & Extraction | 13 (100.0%) | 0 (0.0%) |
| Construction | 95 (96.0%) | 4 (4.0%) |
| Manufacturing | 226 (93.8%) | 15 (6.2%) |
| Wholesale Trade | 52 (100.0%) | 0 (0.0%) |
| Retail Trade | 136 (49.8%) | 137 (50.2%) |
| Transportation & Warehousing | 131 (84.5%) | 24 (15.5%) |
| Utilities | 0 (0.0%) | 0 (0.0%) |
| Information | 9 (75.0%) | 3 (25.0%) |
| Finance & Insurance | 7 (21.2%) | 26 (78.8%) |
| Real Estate, Rental & Leasing | 16 (36.4%) | 28 (63.6%) |
| Professional & Scientific | 17 (24.6%) | 52 (75.4%) |
| Enterprise Management | 0 (0.0%) | 0 (0.0%) |
| Administrative & Support | 35 (66.0%) | 18 (34.0%) |
| Educational Services | 80 (28.9%) | 197 (71.1%) |
| Health Care & Social Assistance | 158 (31.6%) | 342 (68.4%) |
| Arts, Entertainment & Recreation | 8 (15.4%) | 44 (84.6%) |
| Accommodation & Food Services | 86 (34.8%) | 161 (65.2%) |
| Public Administration | 240 (84.5%) | 44 (15.5%) |
| Total | 1,756 (56.9%) | 1,330 (43.1%) |
Education in Lake County
School Enrollment in Lake County
The most common levels of schooling among the 1,294 students in Lake County are middle school (454 | 35.1%), high school (294 | 22.7%), and elementary school (282 | 21.8%).
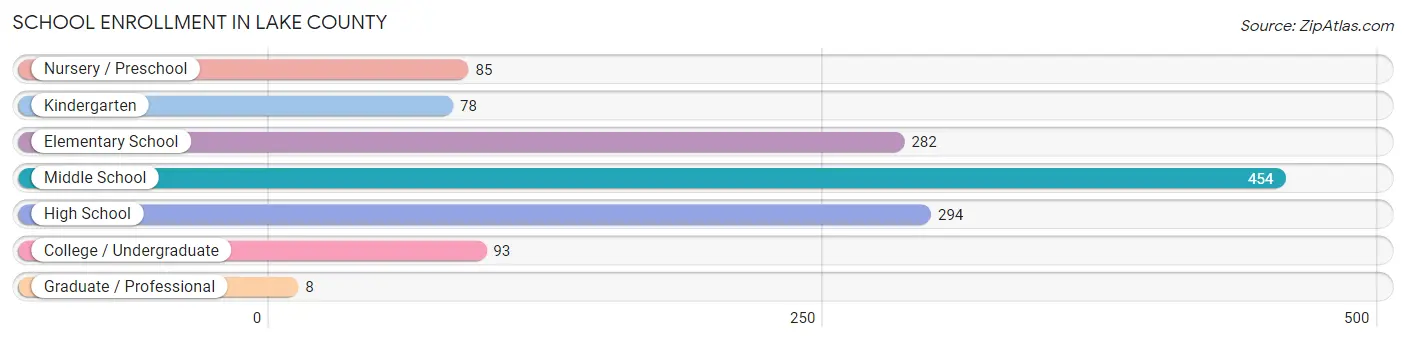
| School Level | # Students | % Students |
| Nursery / Preschool | 85 | 6.6% |
| Kindergarten | 78 | 6.0% |
| Elementary School | 282 | 21.8% |
| Middle School | 454 | 35.1% |
| High School | 294 | 22.7% |
| College / Undergraduate | 93 | 7.2% |
| Graduate / Professional | 8 | 0.6% |
| Total | 1,294 | 100.0% |
School Enrollment by Age by Funding Source in Lake County
Out of a total of 1,294 students who are enrolled in schools in Lake County, 82 (6.3%) attend a private institution, while the remaining 1,212 (93.7%) are enrolled in public schools. The age group of 35 years and over has the highest likelihood of being enrolled in private schools, with 7 (22.6% in the age bracket) enrolled. Conversely, the age group of 18 to 19 year olds has the lowest likelihood of being enrolled in a private school, with 58 (100.0% in the age bracket) attending a public institution.
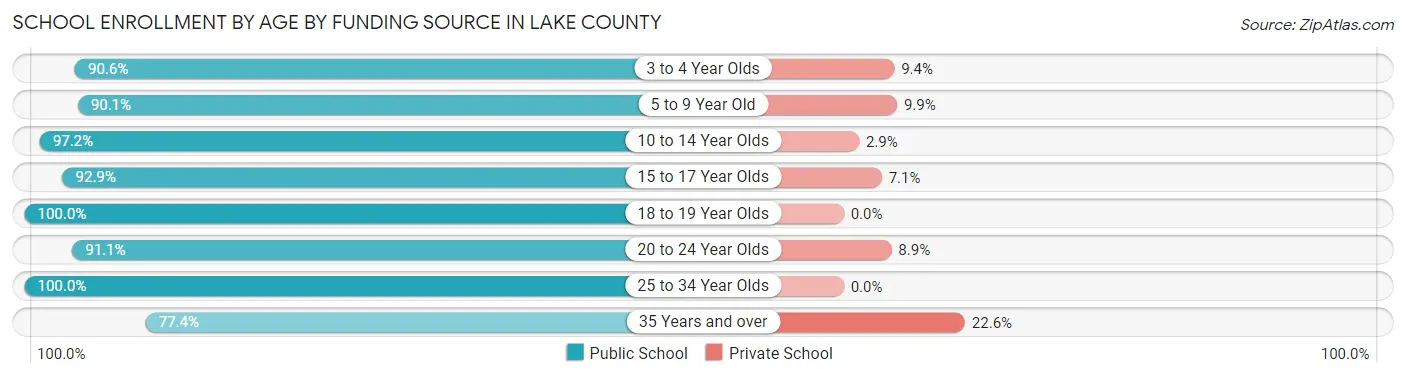
| Age Bracket | Public School | Private School |
| 3 to 4 Year Olds | 77 (90.6%) | 8 (9.4%) |
| 5 to 9 Year Old | 272 (90.1%) | 30 (9.9%) |
| 10 to 14 Year Olds | 478 (97.2%) | 14 (2.9%) |
| 15 to 17 Year Olds | 249 (92.9%) | 19 (7.1%) |
| 18 to 19 Year Olds | 58 (100.0%) | 0 (0.0%) |
| 20 to 24 Year Olds | 41 (91.1%) | 4 (8.9%) |
| 25 to 34 Year Olds | 13 (100.0%) | 0 (0.0%) |
| 35 Years and over | 24 (77.4%) | 7 (22.6%) |
| Total | 1,212 (93.7%) | 82 (6.3%) |
Educational Attainment by Field of Study in Lake County
Bio, nature & agricultural (416 | 31.3%), business (136 | 10.2%), science & technology (116 | 8.7%), liberal arts & history (116 | 8.7%), and education (97 | 7.3%) are the most common fields of study among 1,329 individuals in Lake County who have obtained a bachelor's degree or higher.
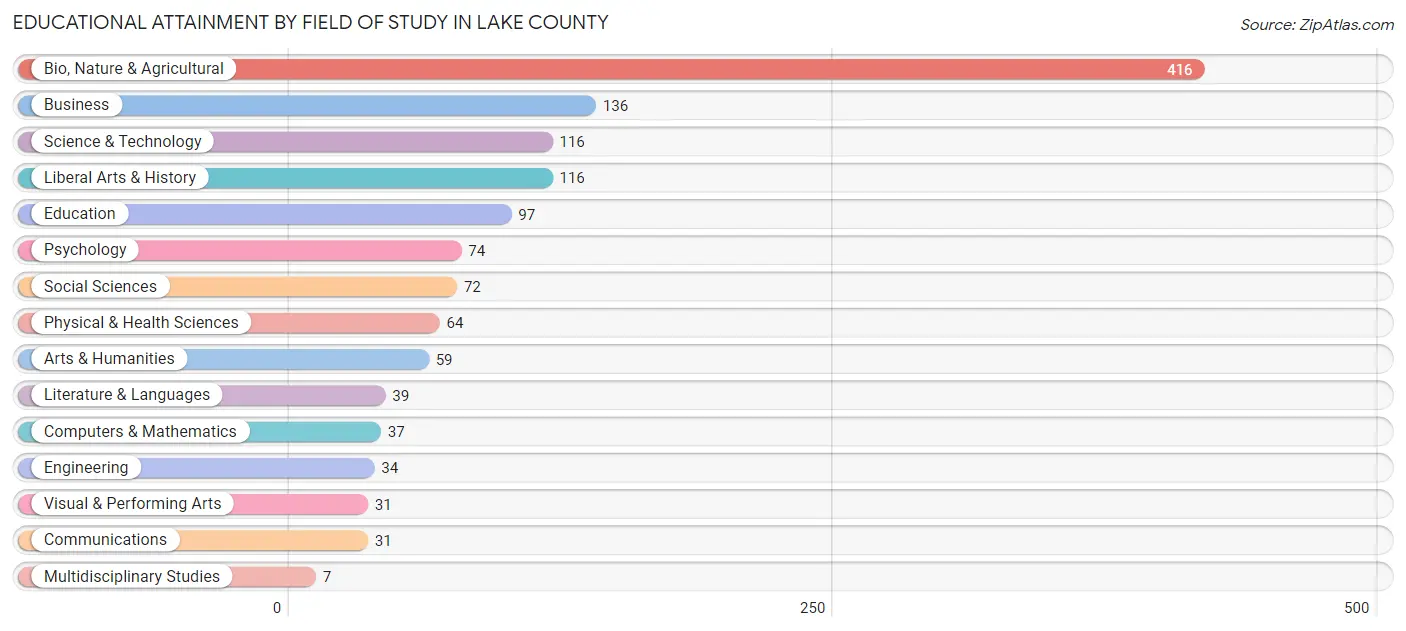
| Field of Study | # Graduates | % Graduates |
| Computers & Mathematics | 37 | 2.8% |
| Bio, Nature & Agricultural | 416 | 31.3% |
| Physical & Health Sciences | 64 | 4.8% |
| Psychology | 74 | 5.6% |
| Social Sciences | 72 | 5.4% |
| Engineering | 34 | 2.6% |
| Multidisciplinary Studies | 7 | 0.5% |
| Science & Technology | 116 | 8.7% |
| Business | 136 | 10.2% |
| Education | 97 | 7.3% |
| Literature & Languages | 39 | 2.9% |
| Liberal Arts & History | 116 | 8.7% |
| Visual & Performing Arts | 31 | 2.3% |
| Communications | 31 | 2.3% |
| Arts & Humanities | 59 | 4.4% |
| Total | 1,329 | 100.0% |
Transportation & Commute in Lake County
Vehicle Availability by Sex in Lake County
The most prevalent vehicle ownership categories in Lake County are males with 2 vehicles (584, accounting for 34.1%) and females with 2 vehicles (386, making up 44.4%).
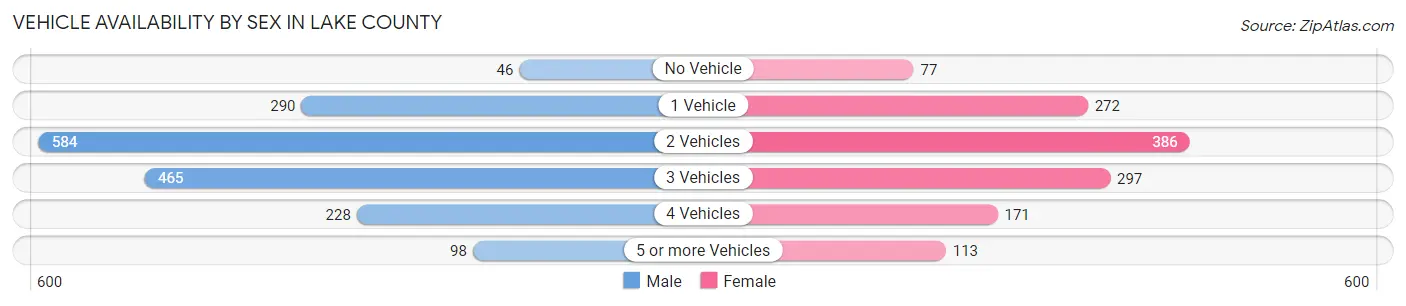
| Vehicles Available | Male | Female |
| No Vehicle | 46 (2.7%) | 77 (5.9%) |
| 1 Vehicle | 290 (17.0%) | 272 (20.7%) |
| 2 Vehicles | 584 (34.1%) | 386 (29.3%) |
| 3 Vehicles | 465 (27.2%) | 297 (22.6%) |
| 4 Vehicles | 228 (13.3%) | 171 (13.0%) |
| 5 or more Vehicles | 98 (5.7%) | 113 (8.6%) |
| Total | 1,711 (100.0%) | 1,316 (100.0%) |
Commute Time in Lake County
The most frequently occuring commute durations in Lake County are 5 to 9 minutes (1,061 commuters, 40.0%), less than 5 minutes (684 commuters, 25.8%), and 10 to 14 minutes (237 commuters, 8.9%).
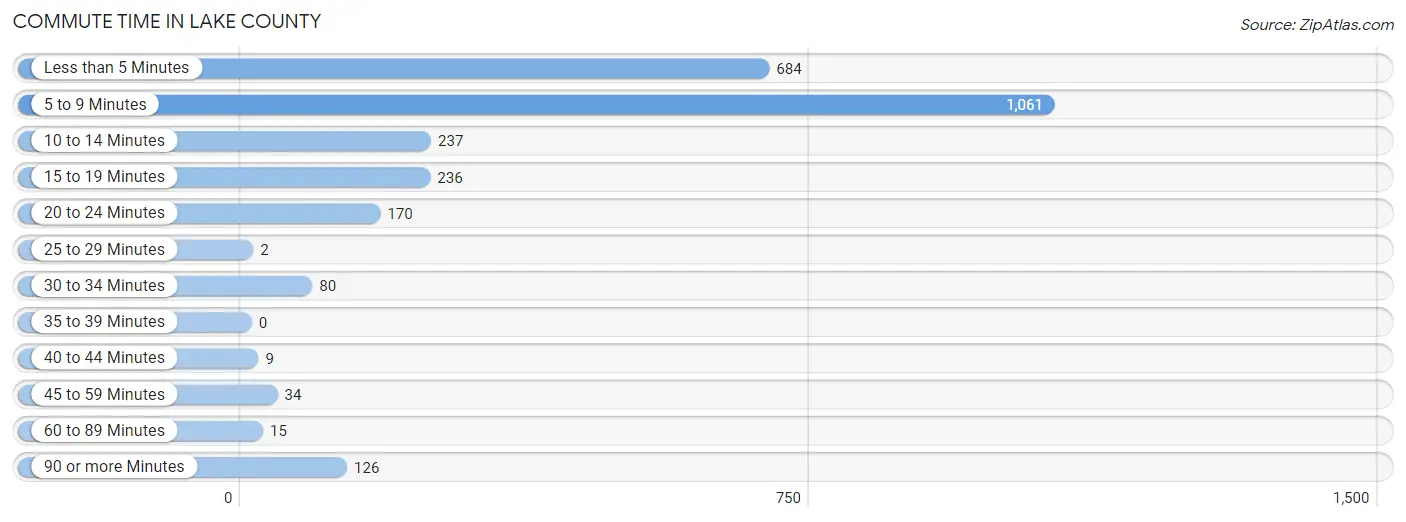
| Commute Time | # Commuters | % Commuters |
| Less than 5 Minutes | 684 | 25.8% |
| 5 to 9 Minutes | 1,061 | 40.0% |
| 10 to 14 Minutes | 237 | 8.9% |
| 15 to 19 Minutes | 236 | 8.9% |
| 20 to 24 Minutes | 170 | 6.4% |
| 25 to 29 Minutes | 2 | 0.1% |
| 30 to 34 Minutes | 80 | 3.0% |
| 35 to 39 Minutes | 0 | 0.0% |
| 40 to 44 Minutes | 9 | 0.3% |
| 45 to 59 Minutes | 34 | 1.3% |
| 60 to 89 Minutes | 15 | 0.6% |
| 90 or more Minutes | 126 | 4.8% |
Commute Time by Sex in Lake County
The most common commute times in Lake County are 5 to 9 minutes (499 commuters, 32.6%) for males and 5 to 9 minutes (562 commuters, 50.0%) for females.
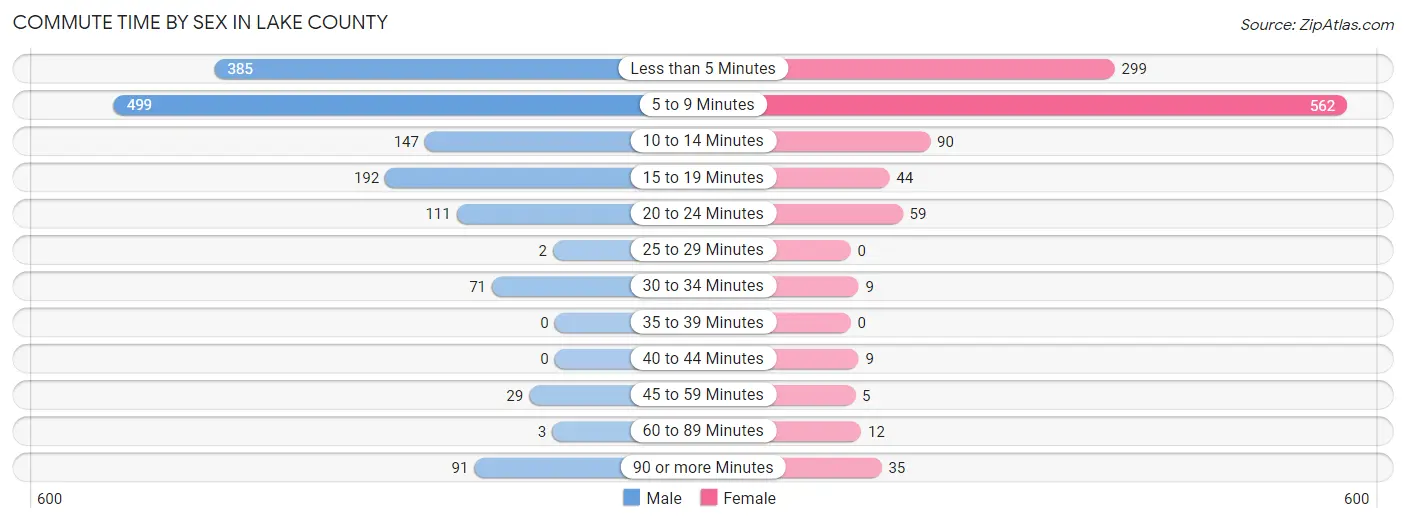
| Commute Time | Male | Female |
| Less than 5 Minutes | 385 (25.2%) | 299 (26.6%) |
| 5 to 9 Minutes | 499 (32.6%) | 562 (50.0%) |
| 10 to 14 Minutes | 147 (9.6%) | 90 (8.0%) |
| 15 to 19 Minutes | 192 (12.6%) | 44 (3.9%) |
| 20 to 24 Minutes | 111 (7.2%) | 59 (5.2%) |
| 25 to 29 Minutes | 2 (0.1%) | 0 (0.0%) |
| 30 to 34 Minutes | 71 (4.6%) | 9 (0.8%) |
| 35 to 39 Minutes | 0 (0.0%) | 0 (0.0%) |
| 40 to 44 Minutes | 0 (0.0%) | 9 (0.8%) |
| 45 to 59 Minutes | 29 (1.9%) | 5 (0.4%) |
| 60 to 89 Minutes | 3 (0.2%) | 12 (1.1%) |
| 90 or more Minutes | 91 (5.9%) | 35 (3.1%) |
Time of Departure to Work by Sex in Lake County
The most frequent times of departure to work in Lake County are 5:30 AM to 5:59 AM (265, 17.3%) for males and 7:30 AM to 7:59 AM (273, 24.3%) for females.
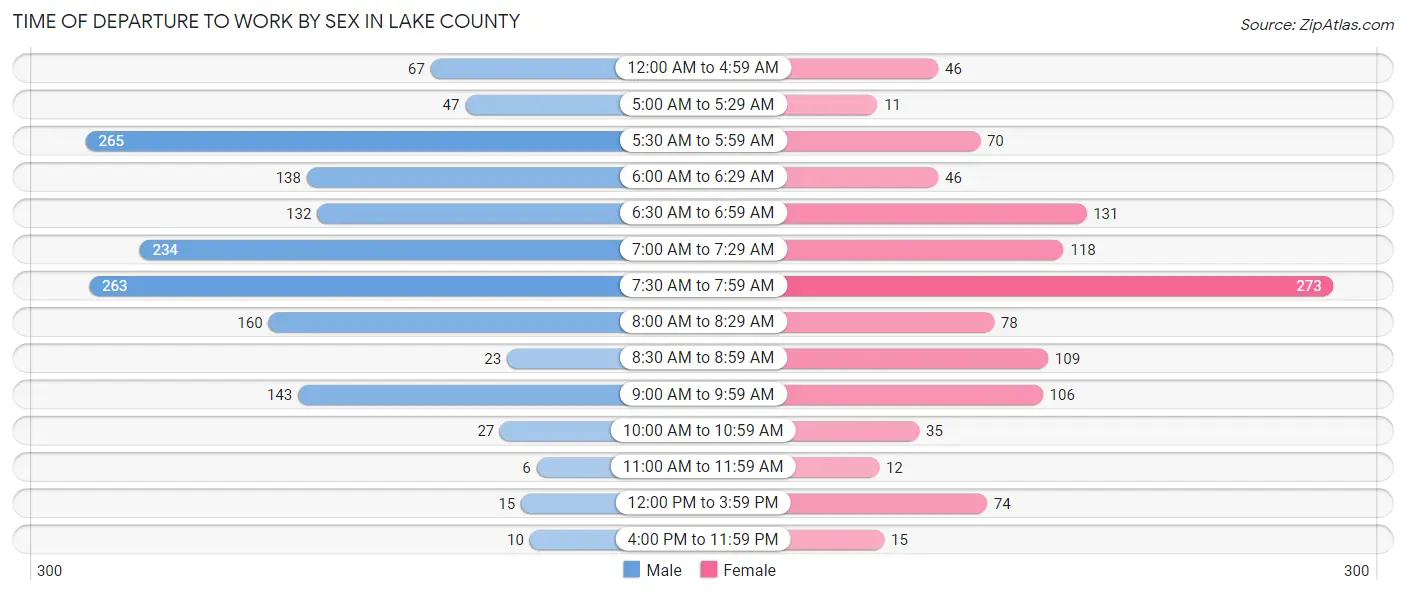
| Time of Departure | Male | Female |
| 12:00 AM to 4:59 AM | 67 (4.4%) | 46 (4.1%) |
| 5:00 AM to 5:29 AM | 47 (3.1%) | 11 (1.0%) |
| 5:30 AM to 5:59 AM | 265 (17.3%) | 70 (6.2%) |
| 6:00 AM to 6:29 AM | 138 (9.0%) | 46 (4.1%) |
| 6:30 AM to 6:59 AM | 132 (8.6%) | 131 (11.7%) |
| 7:00 AM to 7:29 AM | 234 (15.3%) | 118 (10.5%) |
| 7:30 AM to 7:59 AM | 263 (17.2%) | 273 (24.3%) |
| 8:00 AM to 8:29 AM | 160 (10.5%) | 78 (6.9%) |
| 8:30 AM to 8:59 AM | 23 (1.5%) | 109 (9.7%) |
| 9:00 AM to 9:59 AM | 143 (9.3%) | 106 (9.4%) |
| 10:00 AM to 10:59 AM | 27 (1.8%) | 35 (3.1%) |
| 11:00 AM to 11:59 AM | 6 (0.4%) | 12 (1.1%) |
| 12:00 PM to 3:59 PM | 15 (1.0%) | 74 (6.6%) |
| 4:00 PM to 11:59 PM | 10 (0.6%) | 15 (1.3%) |
| Total | 1,530 (100.0%) | 1,124 (100.0%) |
Housing Occupancy in Lake County
Occupancy by Ownership in Lake County
Of the total 3,364 dwellings in Lake County, owner-occupied units account for 2,102 (62.5%), while renter-occupied units make up 1,262 (37.5%).
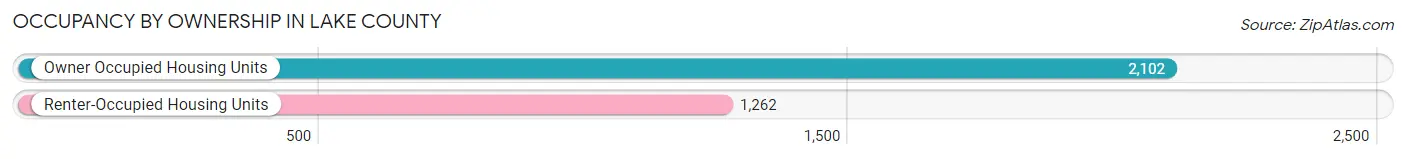
| Occupancy | # Housing Units | % Housing Units |
| Owner Occupied Housing Units | 2,102 | 62.5% |
| Renter-Occupied Housing Units | 1,262 | 37.5% |
| Total Occupied Housing Units | 3,364 | 100.0% |
Occupancy by Household Size in Lake County
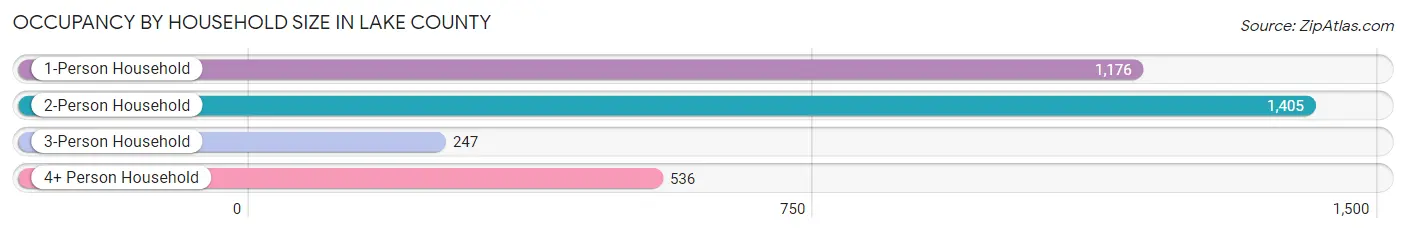
| Household Size | # Housing Units | % Housing Units |
| 1-Person Household | 1,176 | 35.0% |
| 2-Person Household | 1,405 | 41.8% |
| 3-Person Household | 247 | 7.3% |
| 4+ Person Household | 536 | 15.9% |
| Total Housing Units | 3,364 | 100.0% |
Occupancy by Ownership by Household Size in Lake County
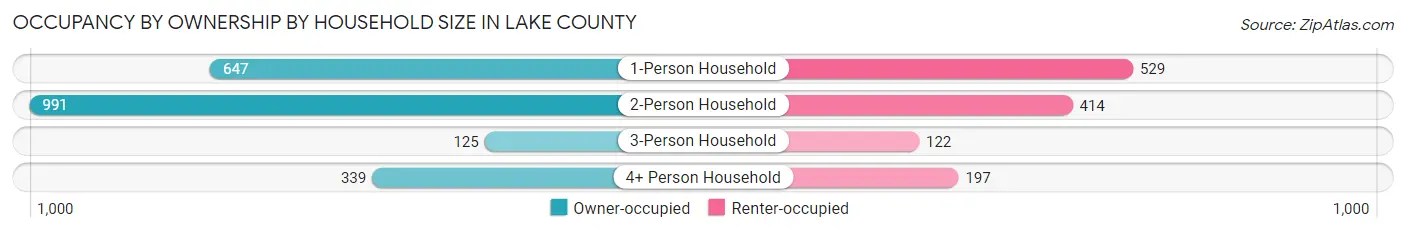
| Household Size | Owner-occupied | Renter-occupied |
| 1-Person Household | 647 (55.0%) | 529 (45.0%) |
| 2-Person Household | 991 (70.5%) | 414 (29.5%) |
| 3-Person Household | 125 (50.6%) | 122 (49.4%) |
| 4+ Person Household | 339 (63.2%) | 197 (36.7%) |
| Total Housing Units | 2,102 (62.5%) | 1,262 (37.5%) |
Occupancy by Educational Attainment in Lake County
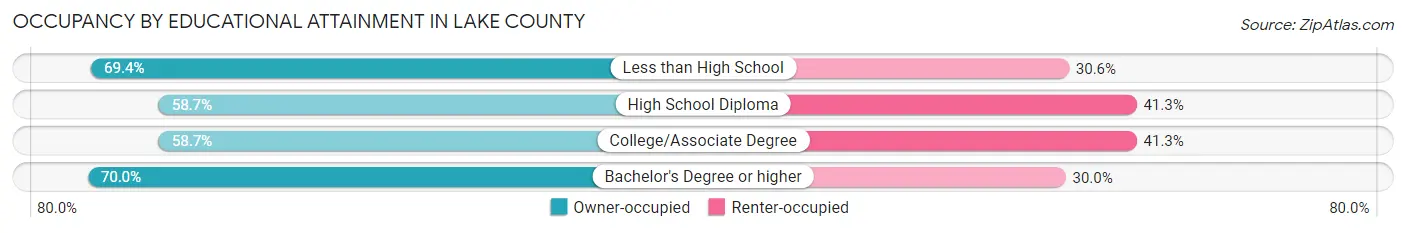
| Household Size | Owner-occupied | Renter-occupied |
| Less than High School | 234 (69.4%) | 103 (30.6%) |
| High School Diploma | 657 (58.7%) | 462 (41.3%) |
| College/Associate Degree | 645 (58.7%) | 454 (41.3%) |
| Bachelor's Degree or higher | 566 (70.0%) | 243 (30.0%) |
Occupancy by Age of Householder in Lake County
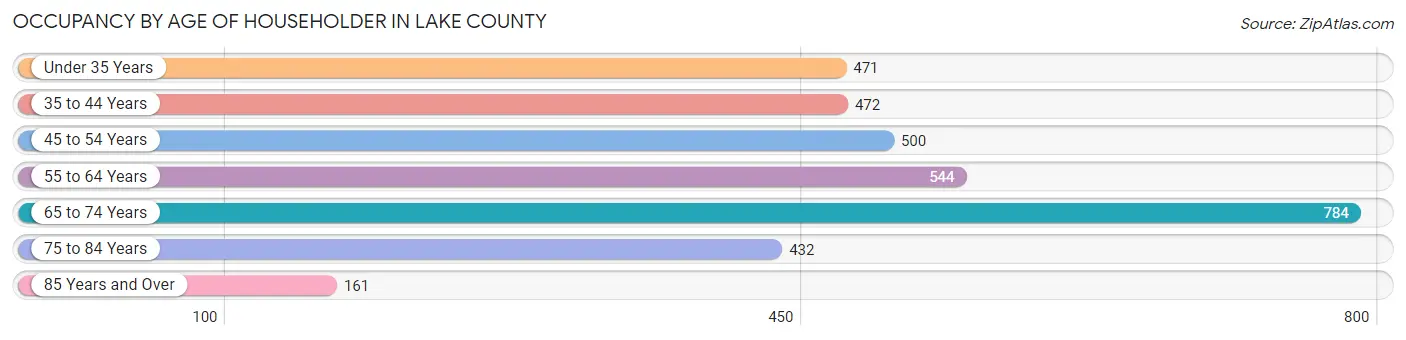
| Age Bracket | # Households | % Households |
| Under 35 Years | 471 | 14.0% |
| 35 to 44 Years | 472 | 14.0% |
| 45 to 54 Years | 500 | 14.9% |
| 55 to 64 Years | 544 | 16.2% |
| 65 to 74 Years | 784 | 23.3% |
| 75 to 84 Years | 432 | 12.8% |
| 85 Years and Over | 161 | 4.8% |
| Total | 3,364 | 100.0% |
Housing Finances in Lake County
Median Income by Occupancy in Lake County
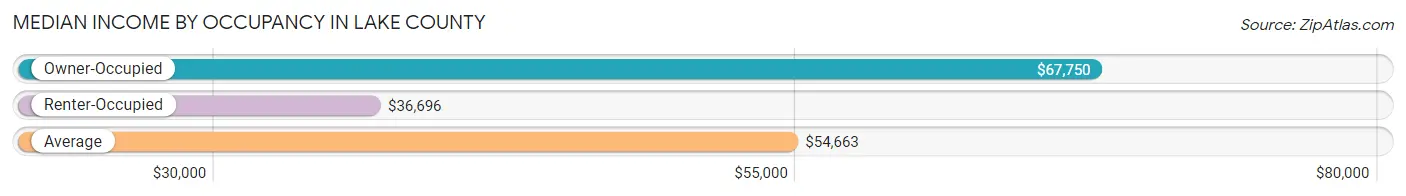
| Occupancy Type | # Households | Median Income |
| Owner-Occupied | 2,102 (62.5%) | $67,750 |
| Renter-Occupied | 1,262 (37.5%) | $36,696 |
| Average | 3,364 (100.0%) | $54,663 |
Occupancy by Householder Income Bracket in Lake County
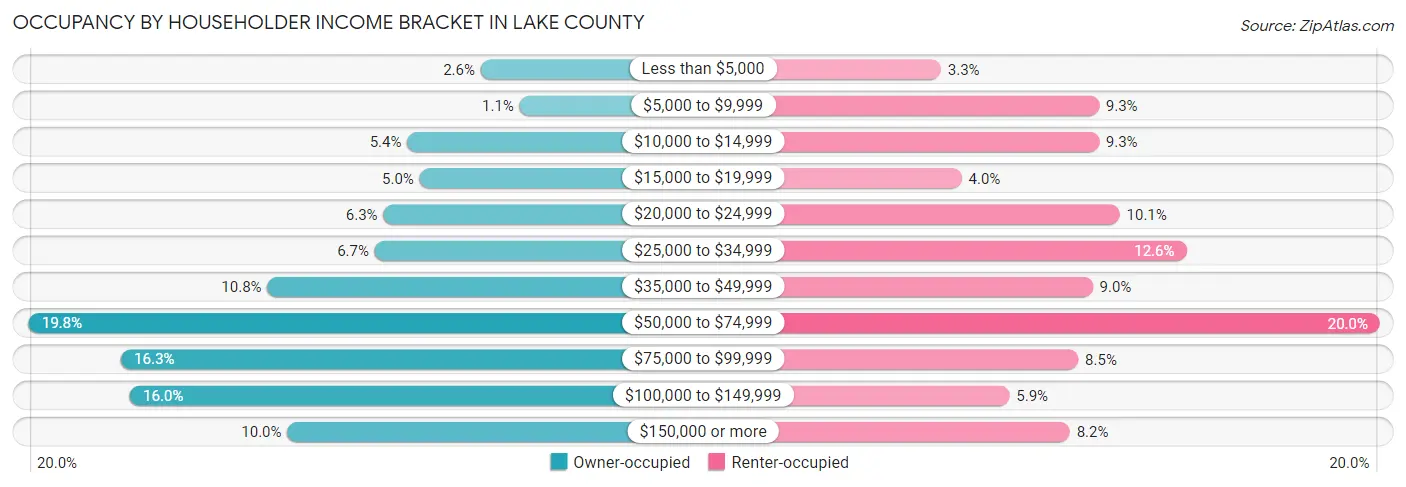
| Income Bracket | Owner-occupied | Renter-occupied |
| Less than $5,000 | 55 (2.6%) | 41 (3.3%) |
| $5,000 to $9,999 | 24 (1.1%) | 117 (9.3%) |
| $10,000 to $14,999 | 114 (5.4%) | 117 (9.3%) |
| $15,000 to $19,999 | 104 (5.0%) | 51 (4.0%) |
| $20,000 to $24,999 | 133 (6.3%) | 127 (10.1%) |
| $25,000 to $34,999 | 140 (6.7%) | 159 (12.6%) |
| $35,000 to $49,999 | 226 (10.7%) | 114 (9.0%) |
| $50,000 to $74,999 | 417 (19.8%) | 252 (20.0%) |
| $75,000 to $99,999 | 343 (16.3%) | 107 (8.5%) |
| $100,000 to $149,999 | 336 (16.0%) | 74 (5.9%) |
| $150,000 or more | 210 (10.0%) | 103 (8.2%) |
| Total | 2,102 (100.0%) | 1,262 (100.0%) |
Monthly Housing Cost Tiers in Lake County
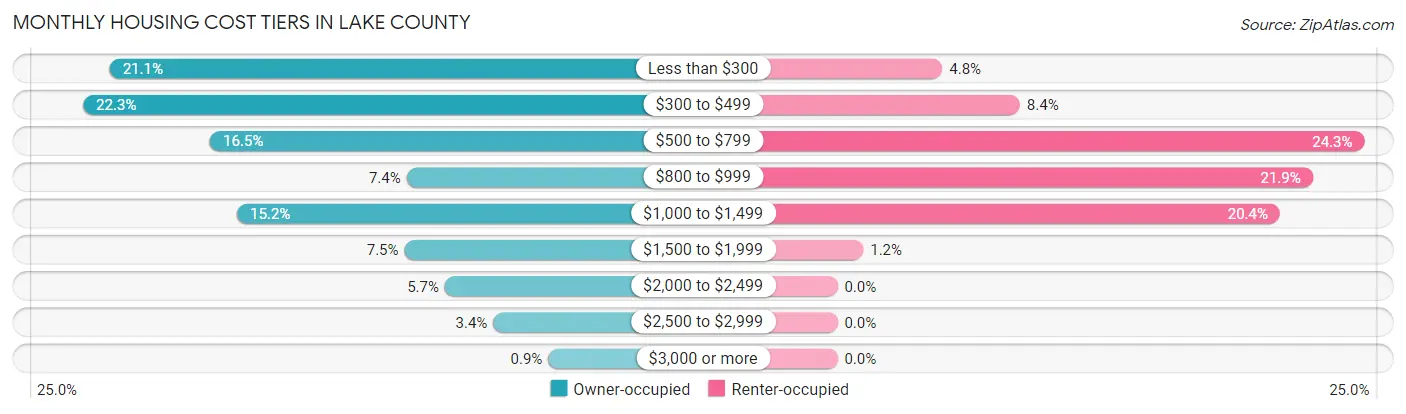
| Monthly Cost | Owner-occupied | Renter-occupied |
| Less than $300 | 443 (21.1%) | 61 (4.8%) |
| $300 to $499 | 469 (22.3%) | 106 (8.4%) |
| $500 to $799 | 346 (16.5%) | 306 (24.2%) |
| $800 to $999 | 156 (7.4%) | 276 (21.9%) |
| $1,000 to $1,499 | 320 (15.2%) | 257 (20.4%) |
| $1,500 to $1,999 | 158 (7.5%) | 15 (1.2%) |
| $2,000 to $2,499 | 119 (5.7%) | 0 (0.0%) |
| $2,500 to $2,999 | 72 (3.4%) | 0 (0.0%) |
| $3,000 or more | 19 (0.9%) | 0 (0.0%) |
| Total | 2,102 (100.0%) | 1,262 (100.0%) |
Physical Housing Characteristics in Lake County
Housing Structures in Lake County
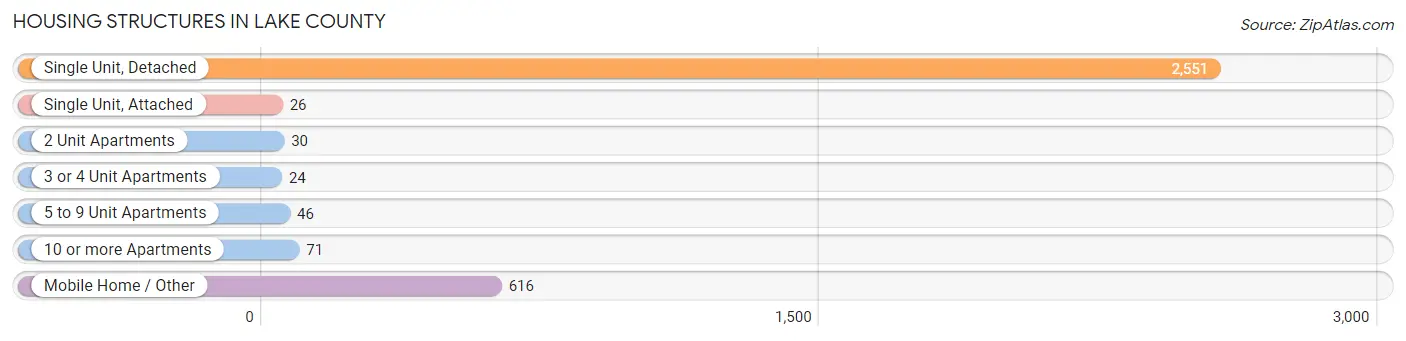
| Structure Type | # Housing Units | % Housing Units |
| Single Unit, Detached | 2,551 | 75.8% |
| Single Unit, Attached | 26 | 0.8% |
| 2 Unit Apartments | 30 | 0.9% |
| 3 or 4 Unit Apartments | 24 | 0.7% |
| 5 to 9 Unit Apartments | 46 | 1.4% |
| 10 or more Apartments | 71 | 2.1% |
| Mobile Home / Other | 616 | 18.3% |
| Total | 3,364 | 100.0% |
Housing Structures by Occupancy in Lake County
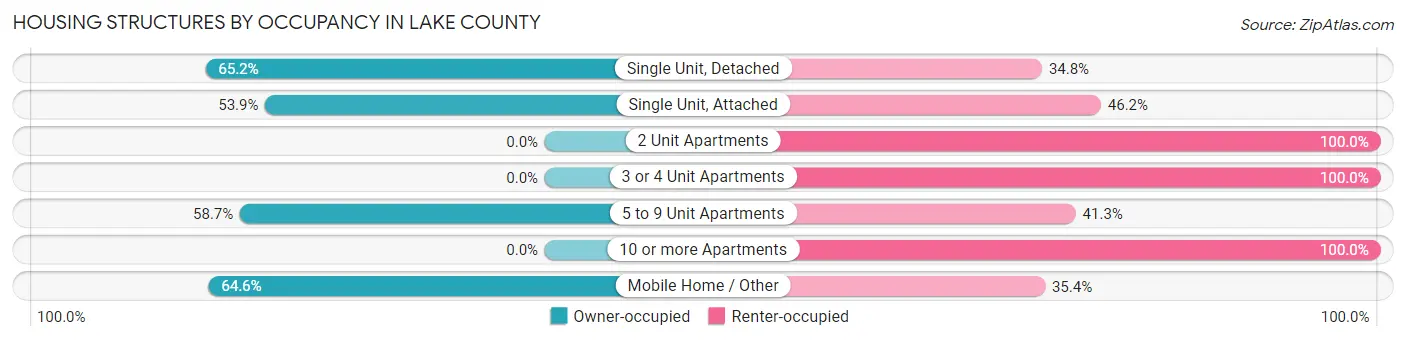
| Structure Type | Owner-occupied | Renter-occupied |
| Single Unit, Detached | 1,663 (65.2%) | 888 (34.8%) |
| Single Unit, Attached | 14 (53.8%) | 12 (46.2%) |
| 2 Unit Apartments | 0 (0.0%) | 30 (100.0%) |
| 3 or 4 Unit Apartments | 0 (0.0%) | 24 (100.0%) |
| 5 to 9 Unit Apartments | 27 (58.7%) | 19 (41.3%) |
| 10 or more Apartments | 0 (0.0%) | 71 (100.0%) |
| Mobile Home / Other | 398 (64.6%) | 218 (35.4%) |
| Total | 2,102 (62.5%) | 1,262 (37.5%) |
Housing Structures by Number of Rooms in Lake County
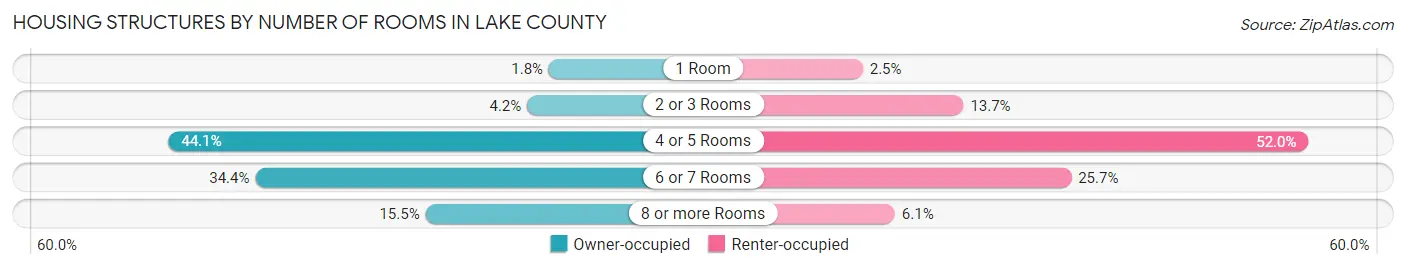
| Number of Rooms | Owner-occupied | Renter-occupied |
| 1 Room | 38 (1.8%) | 32 (2.5%) |
| 2 or 3 Rooms | 89 (4.2%) | 173 (13.7%) |
| 4 or 5 Rooms | 926 (44.1%) | 656 (52.0%) |
| 6 or 7 Rooms | 723 (34.4%) | 324 (25.7%) |
| 8 or more Rooms | 326 (15.5%) | 77 (6.1%) |
| Total | 2,102 (100.0%) | 1,262 (100.0%) |
Housing Structure by Heating Type in Lake County
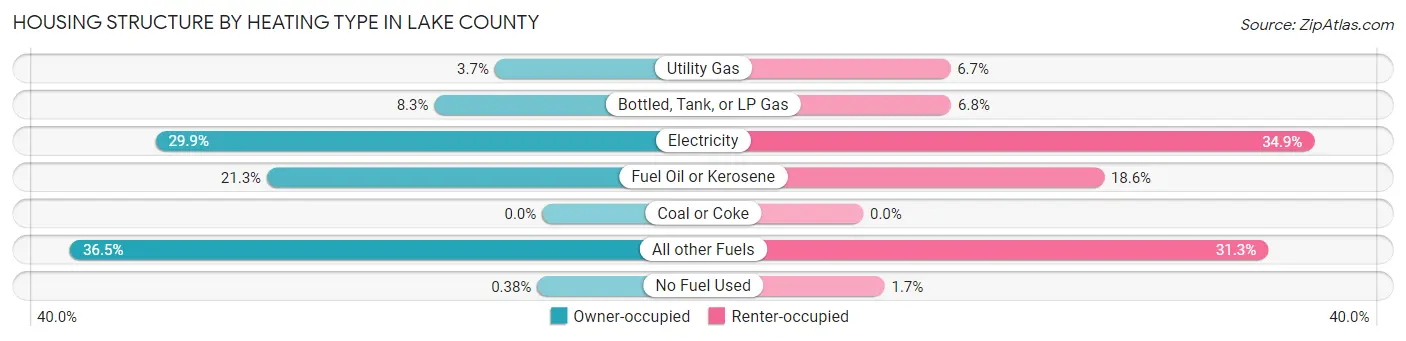
| Heating Type | Owner-occupied | Renter-occupied |
| Utility Gas | 77 (3.7%) | 85 (6.7%) |
| Bottled, Tank, or LP Gas | 175 (8.3%) | 86 (6.8%) |
| Electricity | 628 (29.9%) | 440 (34.9%) |
| Fuel Oil or Kerosene | 447 (21.3%) | 235 (18.6%) |
| Coal or Coke | 0 (0.0%) | 0 (0.0%) |
| All other Fuels | 767 (36.5%) | 395 (31.3%) |
| No Fuel Used | 8 (0.4%) | 21 (1.7%) |
| Total | 2,102 (100.0%) | 1,262 (100.0%) |
Household Vehicle Usage in Lake County
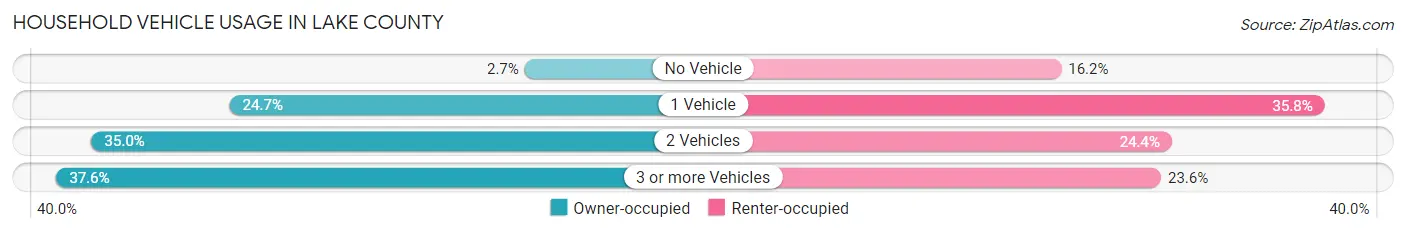
| Vehicles per Household | Owner-occupied | Renter-occupied |
| No Vehicle | 56 (2.7%) | 204 (16.2%) |
| 1 Vehicle | 519 (24.7%) | 452 (35.8%) |
| 2 Vehicles | 736 (35.0%) | 308 (24.4%) |
| 3 or more Vehicles | 791 (37.6%) | 298 (23.6%) |
| Total | 2,102 (100.0%) | 1,262 (100.0%) |
Real Estate & Mortgages in Lake County
Real Estate and Mortgage Overview in Lake County
| Characteristic | Without Mortgage | With Mortgage |
| Housing Units | 1,190 | 912 |
| Median Property Value | $144,300 | $205,600 |
| Median Household Income | $53,487 | $126 |
| Monthly Housing Costs | $365 | $19 |
| Real Estate Taxes | $1,239 | $35 |
Property Value by Mortgage Status in Lake County
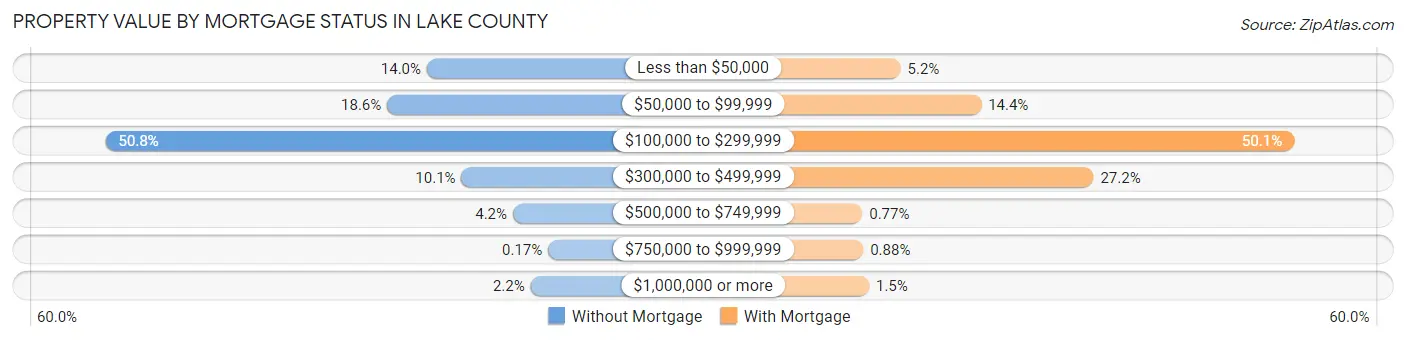
| Property Value | Without Mortgage | With Mortgage |
| Less than $50,000 | 167 (14.0%) | 47 (5.1%) |
| $50,000 to $99,999 | 221 (18.6%) | 131 (14.4%) |
| $100,000 to $299,999 | 604 (50.8%) | 457 (50.1%) |
| $300,000 to $499,999 | 120 (10.1%) | 248 (27.2%) |
| $500,000 to $749,999 | 50 (4.2%) | 7 (0.8%) |
| $750,000 to $999,999 | 2 (0.2%) | 8 (0.9%) |
| $1,000,000 or more | 26 (2.2%) | 14 (1.5%) |
| Total | 1,190 (100.0%) | 912 (100.0%) |
Household Income by Mortgage Status in Lake County
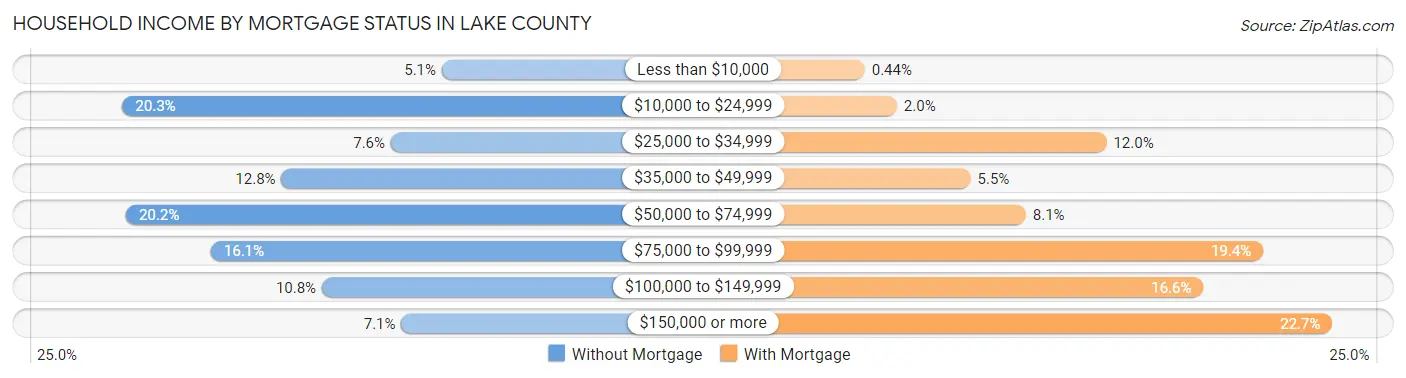
| Household Income | Without Mortgage | With Mortgage |
| Less than $10,000 | 61 (5.1%) | 4 (0.4%) |
| $10,000 to $24,999 | 242 (20.3%) | 18 (2.0%) |
| $25,000 to $34,999 | 90 (7.6%) | 109 (11.9%) |
| $35,000 to $49,999 | 152 (12.8%) | 50 (5.5%) |
| $50,000 to $74,999 | 240 (20.2%) | 74 (8.1%) |
| $75,000 to $99,999 | 192 (16.1%) | 177 (19.4%) |
| $100,000 to $149,999 | 129 (10.8%) | 151 (16.6%) |
| $150,000 or more | 84 (7.1%) | 207 (22.7%) |
| Total | 1,190 (100.0%) | 912 (100.0%) |
Property Value to Household Income Ratio in Lake County
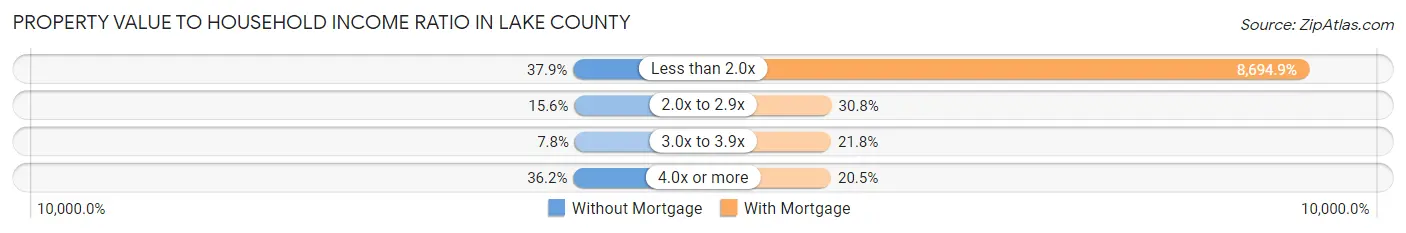
| Value-to-Income Ratio | Without Mortgage | With Mortgage |
| Less than 2.0x | 451 (37.9%) | 79,297 (8,694.8%) |
| 2.0x to 2.9x | 185 (15.5%) | 281 (30.8%) |
| 3.0x to 3.9x | 93 (7.8%) | 199 (21.8%) |
| 4.0x or more | 431 (36.2%) | 187 (20.5%) |
| Total | 1,190 (100.0%) | 912 (100.0%) |
Real Estate Taxes by Mortgage Status in Lake County
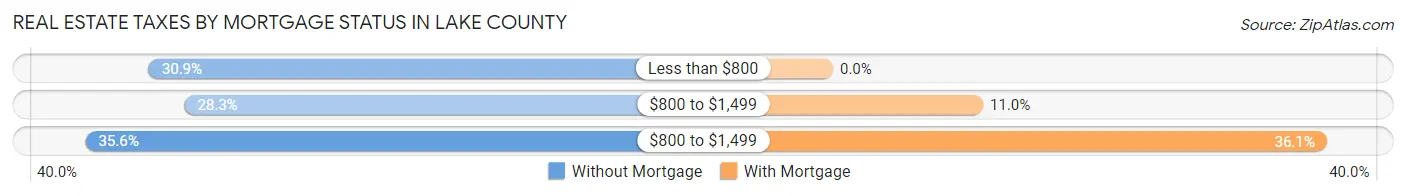
| Property Taxes | Without Mortgage | With Mortgage |
| Less than $800 | 368 (30.9%) | 0 (0.0%) |
| $800 to $1,499 | 337 (28.3%) | 100 (11.0%) |
| $800 to $1,499 | 423 (35.5%) | 329 (36.1%) |
| Total | 1,190 (100.0%) | 912 (100.0%) |
Health & Disability in Lake County
Health Insurance Coverage by Age in Lake County
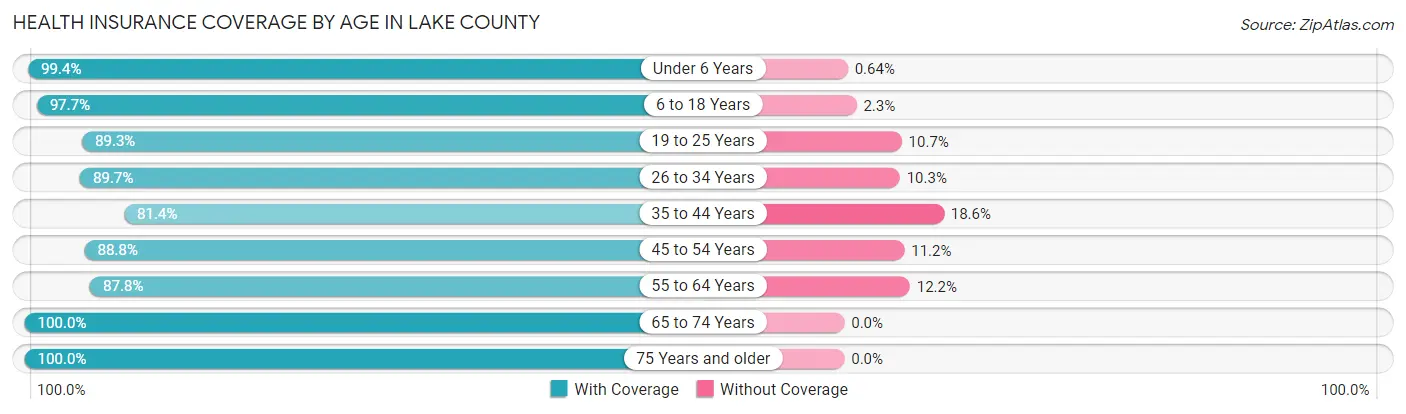
| Age Bracket | With Coverage | Without Coverage |
| Under 6 Years | 469 (99.4%) | 3 (0.6%) |
| 6 to 18 Years | 1,120 (97.7%) | 26 (2.3%) |
| 19 to 25 Years | 459 (89.3%) | 55 (10.7%) |
| 26 to 34 Years | 598 (89.7%) | 69 (10.3%) |
| 35 to 44 Years | 667 (81.4%) | 152 (18.6%) |
| 45 to 54 Years | 794 (88.8%) | 100 (11.2%) |
| 55 to 64 Years | 985 (87.8%) | 137 (12.2%) |
| 65 to 74 Years | 1,266 (100.0%) | 0 (0.0%) |
| 75 Years and older | 790 (100.0%) | 0 (0.0%) |
| Total | 7,148 (92.9%) | 542 (7.0%) |
Health Insurance Coverage by Citizenship Status in Lake County
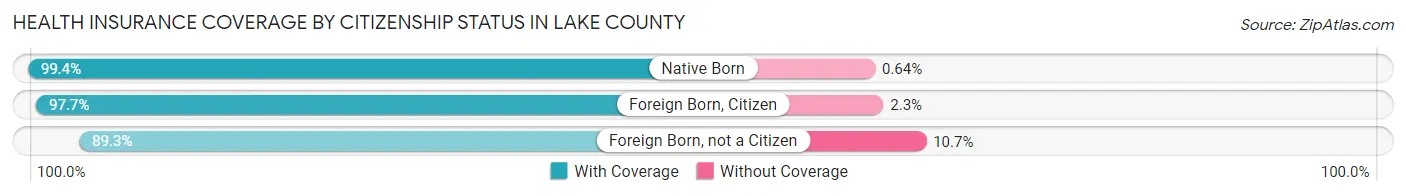
| Citizenship Status | With Coverage | Without Coverage |
| Native Born | 469 (99.4%) | 3 (0.6%) |
| Foreign Born, Citizen | 1,120 (97.7%) | 26 (2.3%) |
| Foreign Born, not a Citizen | 459 (89.3%) | 55 (10.7%) |
Health Insurance Coverage by Household Income in Lake County
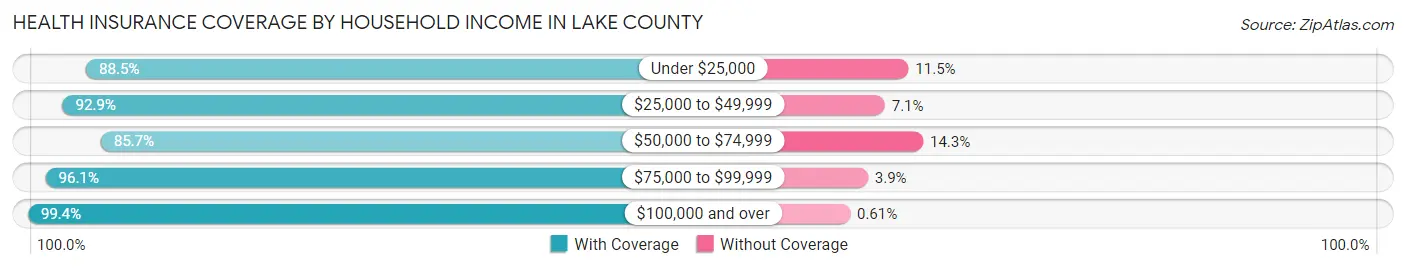
| Household Income | With Coverage | Without Coverage |
| Under $25,000 | 1,296 (88.5%) | 169 (11.5%) |
| $25,000 to $49,999 | 1,318 (92.9%) | 101 (7.1%) |
| $50,000 to $74,999 | 1,195 (85.7%) | 199 (14.3%) |
| $75,000 to $99,999 | 1,219 (96.1%) | 50 (3.9%) |
| $100,000 and over | 2,104 (99.4%) | 13 (0.6%) |
Public vs Private Health Insurance Coverage by Age in Lake County
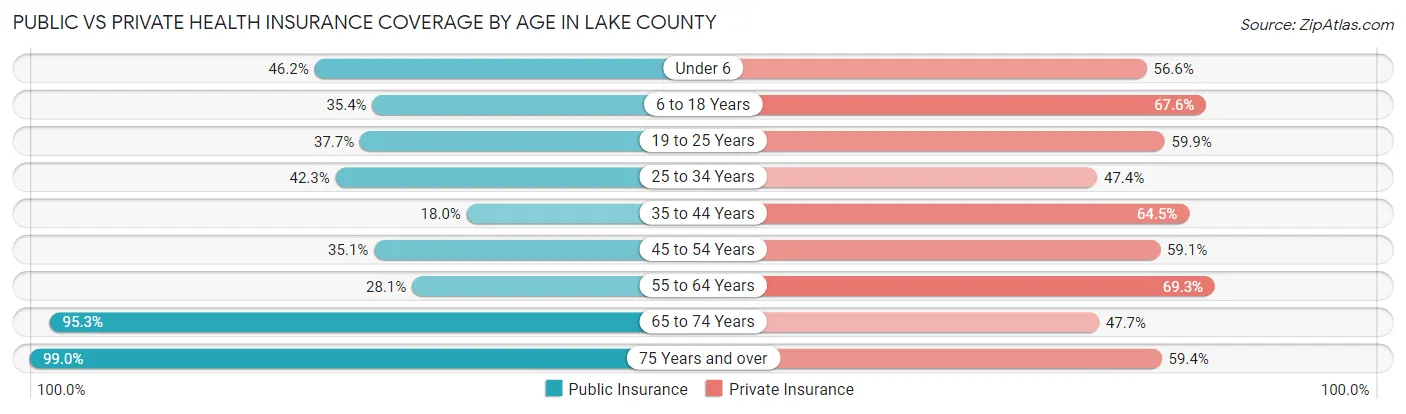
| Age Bracket | Public Insurance | Private Insurance |
| Under 6 | 218 (46.2%) | 267 (56.6%) |
| 6 to 18 Years | 406 (35.4%) | 775 (67.6%) |
| 19 to 25 Years | 194 (37.7%) | 308 (59.9%) |
| 25 to 34 Years | 282 (42.3%) | 316 (47.4%) |
| 35 to 44 Years | 147 (17.9%) | 528 (64.5%) |
| 45 to 54 Years | 314 (35.1%) | 528 (59.1%) |
| 55 to 64 Years | 315 (28.1%) | 777 (69.3%) |
| 65 to 74 Years | 1,207 (95.3%) | 604 (47.7%) |
| 75 Years and over | 782 (99.0%) | 469 (59.4%) |
| Total | 3,865 (50.3%) | 4,572 (59.5%) |
Disability Status by Sex by Age in Lake County
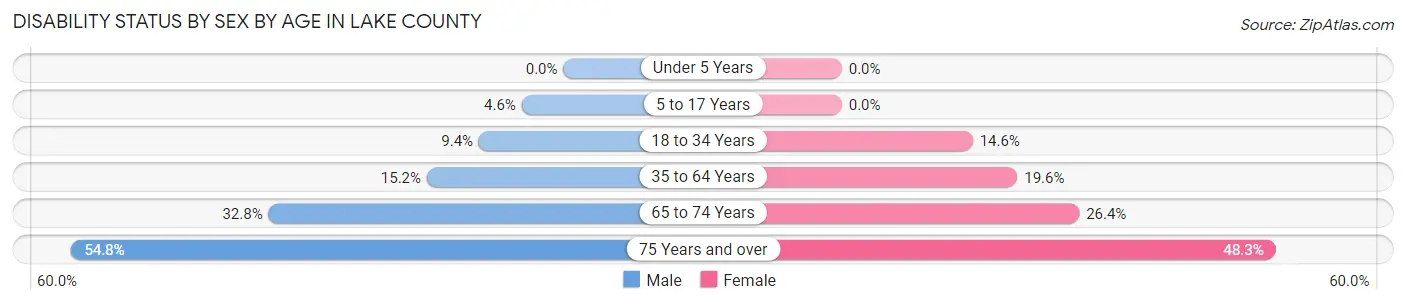
| Age Bracket | Male | Female |
| Under 5 Years | 0 (0.0%) | 0 (0.0%) |
| 5 to 17 Years | 25 (4.6%) | 0 (0.0%) |
| 18 to 34 Years | 63 (9.4%) | 86 (14.6%) |
| 35 to 64 Years | 214 (15.2%) | 279 (19.6%) |
| 65 to 74 Years | 222 (32.8%) | 156 (26.4%) |
| 75 Years and over | 223 (54.8%) | 185 (48.3%) |
Disability Class by Sex by Age in Lake County
Disability Class: Hearing Difficulty
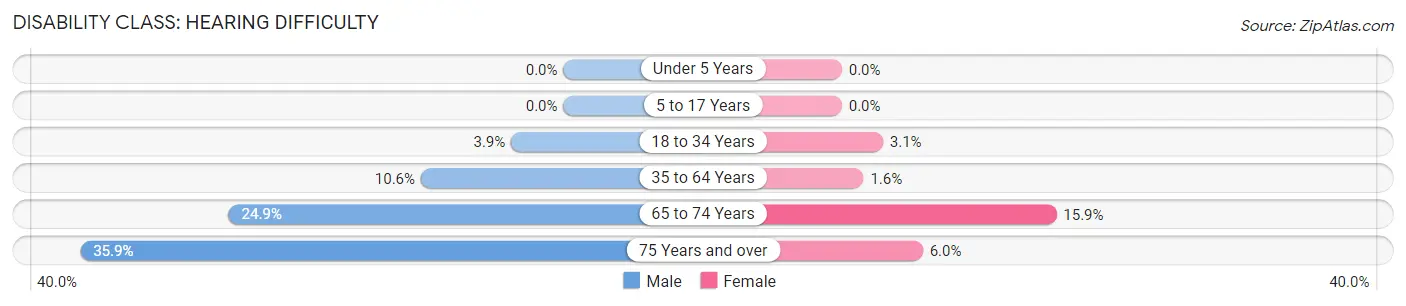
| Age Bracket | Male | Female |
| Under 5 Years | 0 (0.0%) | 0 (0.0%) |
| 5 to 17 Years | 0 (0.0%) | 0 (0.0%) |
| 18 to 34 Years | 26 (3.9%) | 18 (3.0%) |
| 35 to 64 Years | 149 (10.6%) | 23 (1.6%) |
| 65 to 74 Years | 168 (24.8%) | 94 (15.9%) |
| 75 Years and over | 146 (35.9%) | 23 (6.0%) |
Disability Class: Vision Difficulty
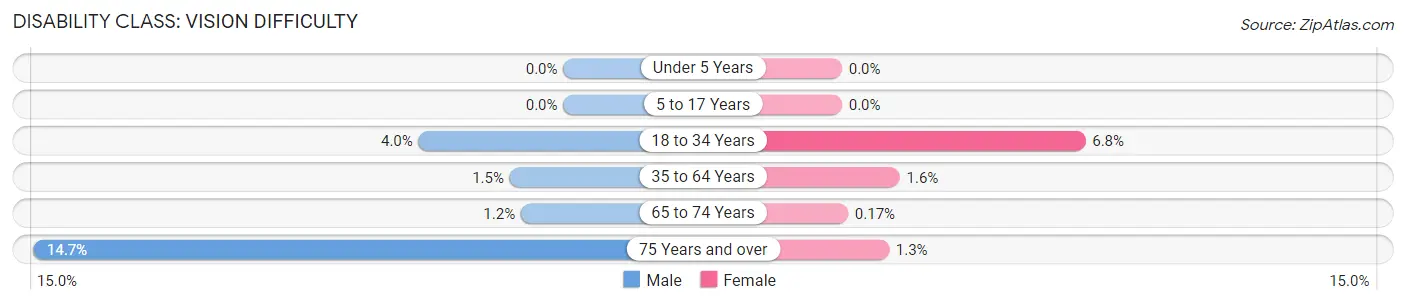
| Age Bracket | Male | Female |
| Under 5 Years | 0 (0.0%) | 0 (0.0%) |
| 5 to 17 Years | 0 (0.0%) | 0 (0.0%) |
| 18 to 34 Years | 27 (4.0%) | 40 (6.8%) |
| 35 to 64 Years | 21 (1.5%) | 23 (1.6%) |
| 65 to 74 Years | 8 (1.2%) | 1 (0.2%) |
| 75 Years and over | 60 (14.7%) | 5 (1.3%) |
Disability Class: Cognitive Difficulty
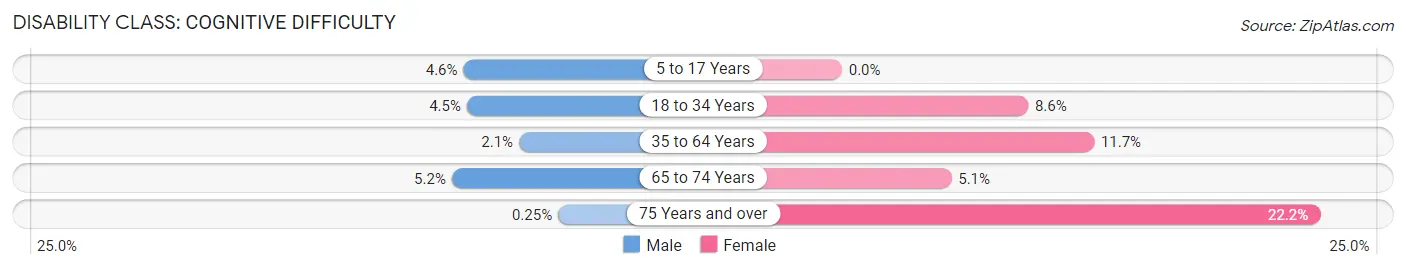
| Age Bracket | Male | Female |
| 5 to 17 Years | 25 (4.6%) | 0 (0.0%) |
| 18 to 34 Years | 30 (4.5%) | 51 (8.6%) |
| 35 to 64 Years | 29 (2.1%) | 167 (11.7%) |
| 65 to 74 Years | 35 (5.2%) | 30 (5.1%) |
| 75 Years and over | 1 (0.3%) | 85 (22.2%) |
Disability Class: Ambulatory Difficulty
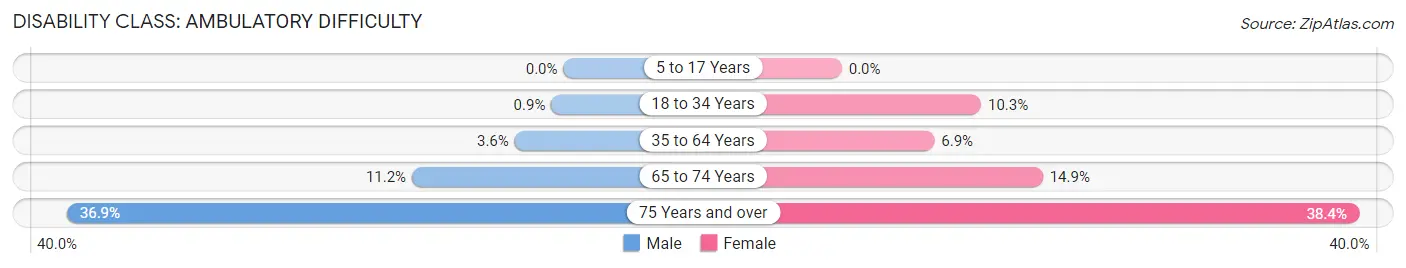
| Age Bracket | Male | Female |
| 5 to 17 Years | 0 (0.0%) | 0 (0.0%) |
| 18 to 34 Years | 6 (0.9%) | 61 (10.3%) |
| 35 to 64 Years | 51 (3.6%) | 98 (6.9%) |
| 65 to 74 Years | 76 (11.2%) | 88 (14.9%) |
| 75 Years and over | 150 (36.9%) | 147 (38.4%) |
Disability Class: Self-Care Difficulty
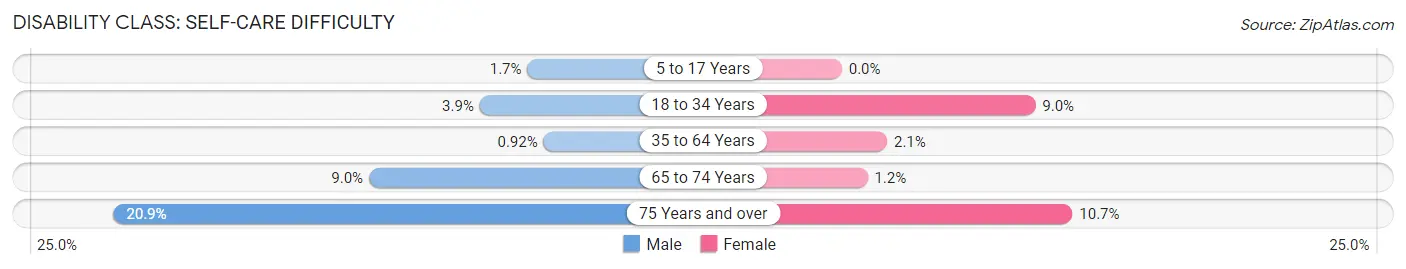
| Age Bracket | Male | Female |
| 5 to 17 Years | 9 (1.7%) | 0 (0.0%) |
| 18 to 34 Years | 26 (3.9%) | 53 (9.0%) |
| 35 to 64 Years | 13 (0.9%) | 30 (2.1%) |
| 65 to 74 Years | 61 (9.0%) | 7 (1.2%) |
| 75 Years and over | 85 (20.9%) | 41 (10.7%) |
Technology Access in Lake County
Computing Device Access in Lake County
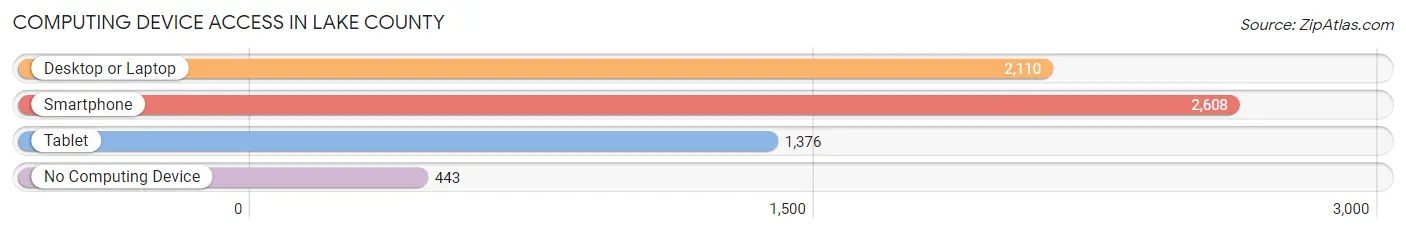
| Device Type | # Households | % Households |
| Desktop or Laptop | 2,110 | 62.7% |
| Smartphone | 2,608 | 77.5% |
| Tablet | 1,376 | 40.9% |
| No Computing Device | 443 | 13.2% |
| Total | 3,364 | 100.0% |
Internet Access in Lake County
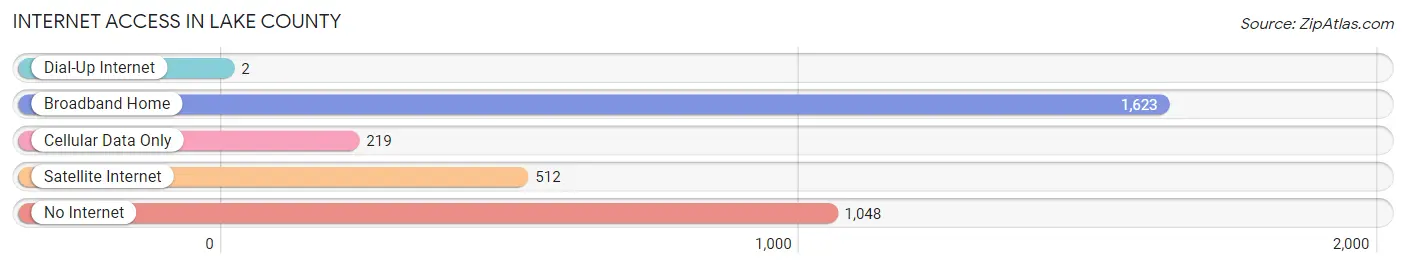
| Internet Type | # Households | % Households |
| Dial-Up Internet | 2 | 0.1% |
| Broadband Home | 1,623 | 48.2% |
| Cellular Data Only | 219 | 6.5% |
| Satellite Internet | 512 | 15.2% |
| No Internet | 1,048 | 31.1% |
| Total | 3,364 | 100.0% |
Lake County Summary
Lake County, Oregon is a county located in the south-central part of the state. It is bordered by Deschutes County to the north, Klamath County to the east, Harney County to the south, and Crook County to the west. The county seat is Lakeview, and the largest city is Paisley. The county has a total area of 6,637 square miles, making it the fourth-largest county in Oregon. As of the 2010 census, the population was 7,895.
History
The area that is now Lake County was originally inhabited by the Northern Paiute and Klamath tribes. The first non-Native American settlers arrived in the area in the 1860s, and the county was officially established in 1874. The county was named for the many lakes in the area, including Lake Abert, which is the largest natural lake in Oregon.
Geography
Lake County is located in the south-central part of Oregon. It is bordered by Deschutes County to the north, Klamath County to the east, Harney County to the south, and Crook County to the west. The county has a total area of 6,637 square miles, making it the fourth-largest county in Oregon.
The county is mostly made up of high desert terrain, with the Cascade Mountains to the west and the Great Basin Desert to the east. The county is home to several mountain ranges, including the Warner Mountains, the Hart Mountain National Antelope Refuge, and the Fremont National Forest. The county also contains several lakes, including Lake Abert, which is the largest natural lake in Oregon.
Economy
The economy of Lake County is largely based on agriculture and tourism. The county is home to several large ranches, and the agricultural industry is the largest employer in the county. Cattle ranching is the most common form of agriculture, and the county is also home to several vineyards and wineries.
Tourism is also an important part of the economy, with visitors coming to the county to enjoy the many outdoor activities available. The county is home to several national parks and monuments, including the Hart Mountain National Antelope Refuge, the Fremont National Forest, and the Newberry National Volcanic Monument.
Demographics
As of the 2010 census, the population of Lake County was 7,895. The population is spread out across the county, with the largest city being Paisley, which has a population of 1,092. The county is predominantly white, with the largest racial group being non-Hispanic whites, who make up 87.3% of the population. The next largest racial group is Hispanic or Latino, who make up 8.2% of the population.
The median household income in Lake County is $37,945, and the median family income is $45,938. The per capita income is $20,945. The unemployment rate is 6.2%, and the poverty rate is 17.3%.
Conclusion
Lake County, Oregon is a county located in the south-central part of the state. It is bordered by Deschutes County to the north, Klamath County to the east, Harney County to the south, and Crook County to the west. The county has a total area of 6,637 square miles, making it the fourth-largest county in Oregon. As of the 2010 census, the population was 7,895. The economy of Lake County is largely based on agriculture and tourism, and the county is home to several national parks and monuments. The population is predominantly white, with the largest racial group being non-Hispanic whites, who make up 87.3% of the population. The median household income in Lake County is $37,945, and the median family income is $45,938. The per capita income is $20,945. The unemployment rate is 6.2%, and the poverty rate is 17.3%.
Common Questions
What is the Total Population of Lake County?
Total Population of Lake County is 8,201.
What is the Total Male Population of Lake County?
Total Male Population of Lake County is 4,465.
What is the Total Female Population of Lake County?
Total Female Population of Lake County is 3,736.
What is the Ratio of Males per 100 Females in Lake County?
There are 119.51 Males per 100 Females in Lake County.
What is the Ratio of Females per 100 Males in Lake County?
There are 83.67 Females per 100 Males in Lake County.
What is the Median Population Age in Lake County?
Median Population Age in Lake County is 46.1 Years.
What is the Average Family Size in Lake County
Average Family Size in Lake County is 3.0 People.
What is the Average Household Size in Lake County
Average Household Size in Lake County is 2.3 People.
What is Per Capita Income in Lake County?
Per Capita income in Lake County is $29,400.
What is the Median Family Income in Lake County?
Median Family Income in Lake County is $74,322.
What is the Median Household income in Lake County?
Median Household Income in Lake County is $54,663.
What is Income or Wage Gap in Lake County?
Income or Wage Gap in Lake County is 36.9%.
Women in Lake County earn 63.1 cents for every dollar earned by a man.
What is Family Income Deficit in Lake County?
Family Income Deficit in Lake County is $10,918.
Families that are below poverty line in Lake County earn $10,918 less on average than the poverty threshold level.
What is Inequality or Gini Index in Lake County?
Inequality or Gini Index in Lake County is 0.44.
How Large is the Labor Force in Lake County?
There are 3,347 People in the Labor Forcein in Lake County.
What is the Percentage of People in the Labor Force in Lake County?
48.6% of People are in the Labor Force in Lake County.
What is the Unemployment Rate in Lake County?
Unemployment Rate in Lake County is 7.7%.