Josephine County, OR
Josephine County Map
Josephine County Overview
87,994
TOTAL POPULATION
43,101
MALE POPULATION
44,893
FEMALE POPULATION
96.01
MALES / 100 FEMALES
104.16
FEMALES / 100 MALES
47.4
MEDIAN AGE
2.9
AVG FAMILY SIZE
2.4
AVG HOUSEHOLD SIZE
$32,159
PER CAPITA INCOME
$66,158
AVG FAMILY INCOME
$56,068
AVG HOUSEHOLD INCOME
27.4%
WAGE / INCOME GAP [ % ]
72.6¢/ $1
WAGE / INCOME GAP [ $ ]
$10,553
FAMILY INCOME DEFICIT
0.47
INEQUALITY / GINI INDEX
36,426
LABOR FORCE [ PEOPLE ]
49.7%
PERCENT IN LABOR FORCE
8.1%
UNEMPLOYMENT RATE
Josephine County Area Codes
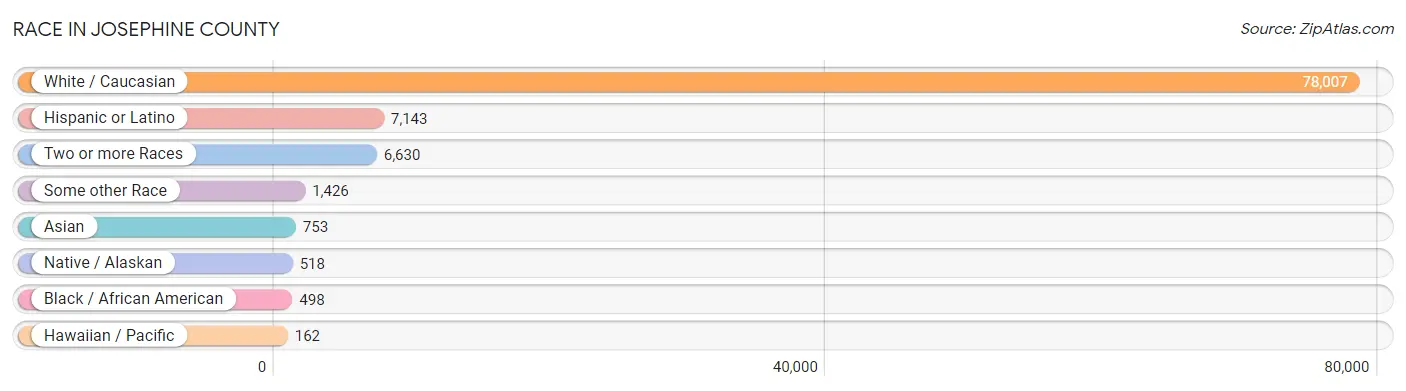
Race in Josephine County
The most populous races in Josephine County are White / Caucasian (78,007 | 88.6%), Hispanic or Latino (7,143 | 8.1%), and Two or more Races (6,630 | 7.5%).
| Race | # Population | % Population |
| Asian | 753 | 0.9% |
| Black / African American | 498 | 0.6% |
| Hawaiian / Pacific | 162 | 0.2% |
| Hispanic or Latino | 7,143 | 8.1% |
| Native / Alaskan | 518 | 0.6% |
| White / Caucasian | 78,007 | 88.6% |
| Two or more Races | 6,630 | 7.5% |
| Some other Race | 1,426 | 1.6% |
| Total | 87,994 | 100.0% |
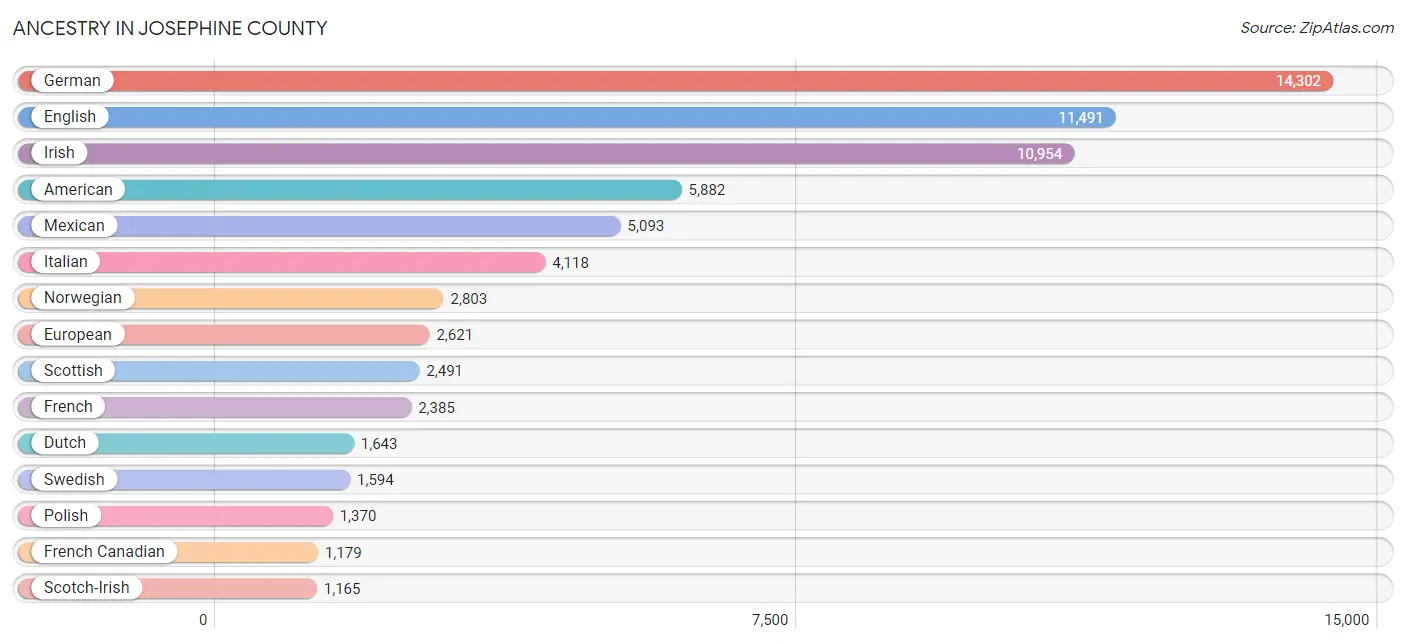
Ancestry in Josephine County
The most populous ancestries reported in Josephine County are German (14,302 | 16.3%), English (11,491 | 13.1%), Irish (10,954 | 12.4%), American (5,882 | 6.7%), and Mexican (5,093 | 5.8%), together accounting for 54.2% of all Josephine County residents.
| Ancestry | # Population | % Population |
| African | 54 | 0.1% |
| Alaska Native | 18 | 0.0% |
| Alsatian | 15 | 0.0% |
| American | 5,882 | 6.7% |
| Apache | 271 | 0.3% |
| Arab | 142 | 0.2% |
| Argentinean | 8 | 0.0% |
| Armenian | 30 | 0.0% |
| Australian | 51 | 0.1% |
| Austrian | 317 | 0.4% |
| Basque | 79 | 0.1% |
| Belgian | 91 | 0.1% |
| Bhutanese | 201 | 0.2% |
| Blackfeet | 240 | 0.3% |
| British | 720 | 0.8% |
| Bulgarian | 34 | 0.0% |
| Burmese | 152 | 0.2% |
| Cajun | 10 | 0.0% |
| Canadian | 35 | 0.0% |
| Celtic | 5 | 0.0% |
| Central American | 396 | 0.4% |
| Central American Indian | 30 | 0.0% |
| Cherokee | 849 | 1.0% |
| Chickasaw | 4 | 0.0% |
| Chippewa | 1 | 0.0% |
| Choctaw | 244 | 0.3% |
| Colombian | 77 | 0.1% |
| Costa Rican | 77 | 0.1% |
| Creek | 91 | 0.1% |
| Croatian | 100 | 0.1% |
| Cuban | 16 | 0.0% |
| Czech | 259 | 0.3% |
| Czechoslovakian | 20 | 0.0% |
| Danish | 465 | 0.5% |
| Dutch | 1,643 | 1.9% |
| Dutch West Indian | 23 | 0.0% |
| Eastern European | 249 | 0.3% |
| Ecuadorian | 27 | 0.0% |
| English | 11,491 | 13.1% |
| Estonian | 29 | 0.0% |
| European | 2,621 | 3.0% |
| Finnish | 136 | 0.2% |
| French | 2,385 | 2.7% |
| French Canadian | 1,179 | 1.3% |
| German | 14,302 | 16.3% |
| Greek | 346 | 0.4% |
| Guamanian / Chamorro | 57 | 0.1% |
| Guatemalan | 22 | 0.0% |
| Haitian | 65 | 0.1% |
| Honduran | 12 | 0.0% |
| Hopi | 22 | 0.0% |
| Hungarian | 278 | 0.3% |
| Icelander | 16 | 0.0% |
| Indian (Asian) | 454 | 0.5% |
| Inupiat | 65 | 0.1% |
| Iranian | 21 | 0.0% |
| Irish | 10,954 | 12.4% |
| Iroquois | 246 | 0.3% |
| Italian | 4,118 | 4.7% |
| Korean | 530 | 0.6% |
| Laotian | 87 | 0.1% |
| Latvian | 26 | 0.0% |
| Lebanese | 50 | 0.1% |
| Lithuanian | 155 | 0.2% |
| Menominee | 22 | 0.0% |
| Mexican | 5,093 | 5.8% |
| Mexican American Indian | 220 | 0.3% |
| Native Hawaiian | 451 | 0.5% |
| Navajo | 31 | 0.0% |
| Nicaraguan | 78 | 0.1% |
| Nigerian | 16 | 0.0% |
| Northern European | 330 | 0.4% |
| Norwegian | 2,803 | 3.2% |
| Paiute | 16 | 0.0% |
| Pakistani | 65 | 0.1% |
| Palestinian | 9 | 0.0% |
| Pennsylvania German | 41 | 0.1% |
| Peruvian | 78 | 0.1% |
| Polish | 1,370 | 1.6% |
| Portuguese | 805 | 0.9% |
| Potawatomi | 18 | 0.0% |
| Pueblo | 7 | 0.0% |
| Puerto Rican | 375 | 0.4% |
| Romanian | 29 | 0.0% |
| Russian | 499 | 0.6% |
| Salvadoran | 207 | 0.2% |
| Samoan | 57 | 0.1% |
| Scandinavian | 453 | 0.5% |
| Scotch-Irish | 1,165 | 1.3% |
| Scottish | 2,491 | 2.8% |
| Sioux | 80 | 0.1% |
| Slavic | 8 | 0.0% |
| Slovene | 8 | 0.0% |
| South African | 23 | 0.0% |
| South American | 190 | 0.2% |
| South American Indian | 76 | 0.1% |
| Spaniard | 391 | 0.4% |
| Spanish | 430 | 0.5% |
| Spanish American | 6 | 0.0% |
| Sri Lankan | 226 | 0.3% |
| Subsaharan African | 105 | 0.1% |
| Swedish | 1,594 | 1.8% |
| Swiss | 599 | 0.7% |
| Syrian | 83 | 0.1% |
| Thai | 106 | 0.1% |
| Tohono O'Odham | 22 | 0.0% |
| Ukrainian | 87 | 0.1% |
| Welsh | 758 | 0.9% |
| Yakama | 74 | 0.1% |
| Yaqui | 61 | 0.1% |
| Yugoslavian | 33 | 0.0% |
| Yup'ik | 1 | 0.0% | View All 112 Rows |
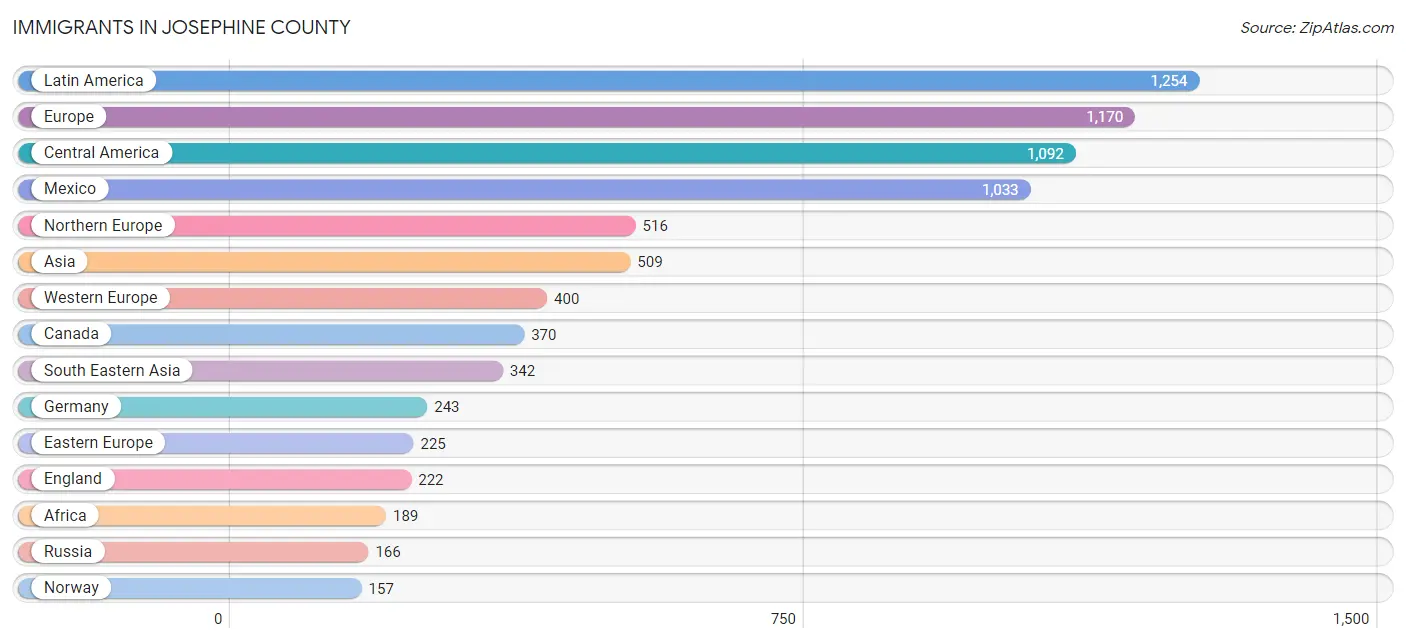
Immigrants in Josephine County
The most numerous immigrant groups reported in Josephine County came from Latin America (1,254 | 1.4%), Europe (1,170 | 1.3%), Central America (1,092 | 1.2%), Mexico (1,033 | 1.2%), and Northern Europe (516 | 0.6%), together accounting for 5.8% of all Josephine County residents.
| Immigration Origin | # Population | % Population |
| Africa | 189 | 0.2% |
| Asia | 509 | 0.6% |
| Australia | 51 | 0.1% |
| Belize | 7 | 0.0% |
| Bulgaria | 15 | 0.0% |
| Canada | 370 | 0.4% |
| Caribbean | 65 | 0.1% |
| Central America | 1,092 | 1.2% |
| China | 86 | 0.1% |
| Colombia | 5 | 0.0% |
| Denmark | 8 | 0.0% |
| Eastern Africa | 71 | 0.1% |
| Eastern Asia | 127 | 0.1% |
| Eastern Europe | 225 | 0.3% |
| El Salvador | 44 | 0.1% |
| England | 222 | 0.3% |
| Ethiopia | 26 | 0.0% |
| Europe | 1,170 | 1.3% |
| France | 34 | 0.0% |
| Germany | 243 | 0.3% |
| Greece | 15 | 0.0% |
| Guatemala | 2 | 0.0% |
| Haiti | 65 | 0.1% |
| Hong Kong | 28 | 0.0% |
| Hungary | 33 | 0.0% |
| India | 19 | 0.0% |
| Indonesia | 67 | 0.1% |
| Iran | 21 | 0.0% |
| Ireland | 29 | 0.0% |
| Japan | 34 | 0.0% |
| Kenya | 31 | 0.0% |
| Korea | 7 | 0.0% |
| Laos | 52 | 0.1% |
| Latin America | 1,254 | 1.4% |
| Mexico | 1,033 | 1.2% |
| Netherlands | 111 | 0.1% |
| Nicaragua | 6 | 0.0% |
| Northern Europe | 516 | 0.6% |
| Norway | 157 | 0.2% |
| Oceania | 51 | 0.1% |
| Peru | 82 | 0.1% |
| Philippines | 114 | 0.1% |
| Portugal | 14 | 0.0% |
| Russia | 166 | 0.2% |
| South Africa | 88 | 0.1% |
| South America | 97 | 0.1% |
| South Central Asia | 40 | 0.1% |
| South Eastern Asia | 342 | 0.4% |
| Southern Europe | 29 | 0.0% |
| Sweden | 13 | 0.0% |
| Switzerland | 12 | 0.0% |
| Taiwan | 23 | 0.0% |
| Thailand | 65 | 0.1% |
| Venezuela | 10 | 0.0% |
| Vietnam | 44 | 0.1% |
| Western Africa | 30 | 0.0% |
| Western Europe | 400 | 0.4% | View All 57 Rows |
Sex and Age in Josephine County
Sex and Age in Josephine County
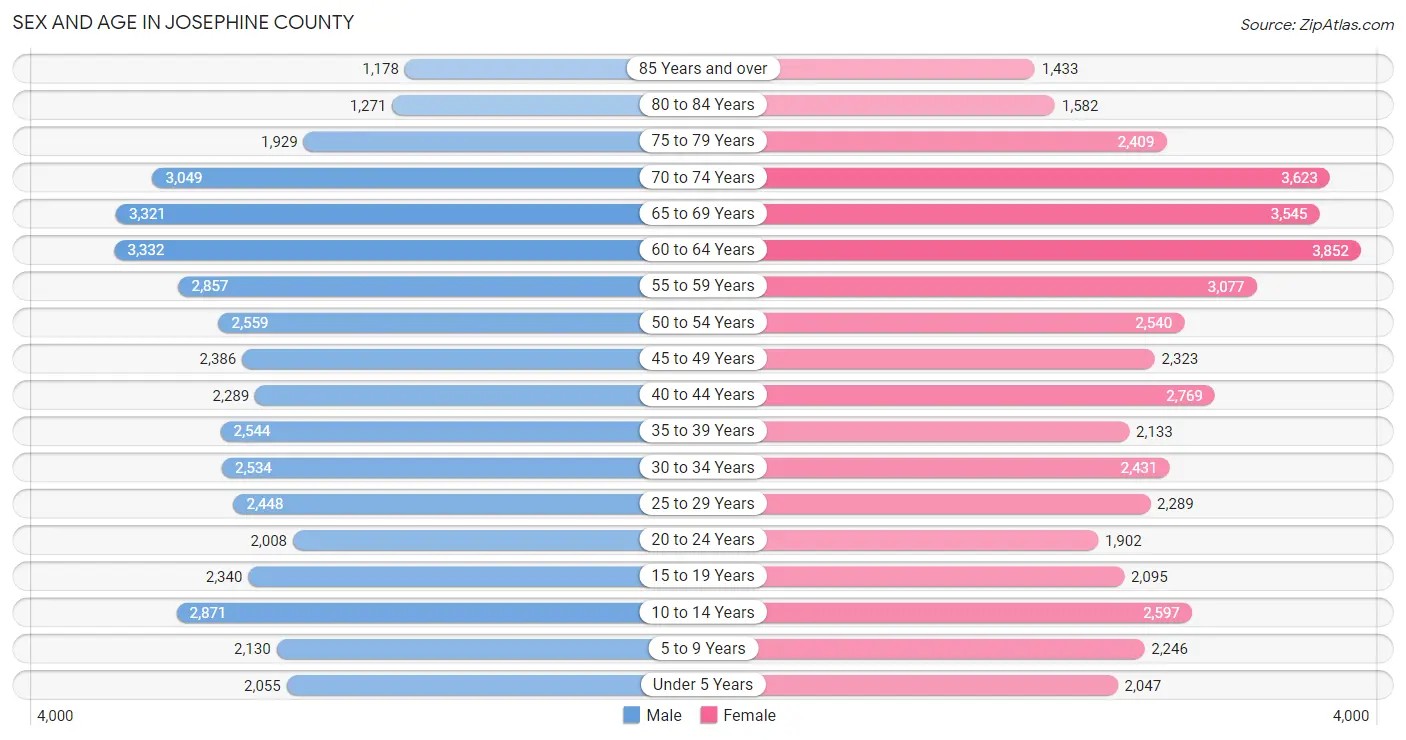
The most populous age groups in Josephine County are 60 to 64 Years (3,332 | 7.7%) for men and 60 to 64 Years (3,852 | 8.6%) for women.
| Age Bracket | Male | Female |
| Under 5 Years | 2,055 (4.8%) | 2,047 (4.6%) |
| 5 to 9 Years | 2,130 (4.9%) | 2,246 (5.0%) |
| 10 to 14 Years | 2,871 (6.7%) | 2,597 (5.8%) |
| 15 to 19 Years | 2,340 (5.4%) | 2,095 (4.7%) |
| 20 to 24 Years | 2,008 (4.7%) | 1,902 (4.2%) |
| 25 to 29 Years | 2,448 (5.7%) | 2,289 (5.1%) |
| 30 to 34 Years | 2,534 (5.9%) | 2,431 (5.4%) |
| 35 to 39 Years | 2,544 (5.9%) | 2,133 (4.8%) |
| 40 to 44 Years | 2,289 (5.3%) | 2,769 (6.2%) |
| 45 to 49 Years | 2,386 (5.5%) | 2,323 (5.2%) |
| 50 to 54 Years | 2,559 (5.9%) | 2,540 (5.7%) |
| 55 to 59 Years | 2,857 (6.6%) | 3,077 (6.9%) |
| 60 to 64 Years | 3,332 (7.7%) | 3,852 (8.6%) |
| 65 to 69 Years | 3,321 (7.7%) | 3,545 (7.9%) |
| 70 to 74 Years | 3,049 (7.1%) | 3,623 (8.1%) |
| 75 to 79 Years | 1,929 (4.5%) | 2,409 (5.4%) |
| 80 to 84 Years | 1,271 (2.9%) | 1,582 (3.5%) |
| 85 Years and over | 1,178 (2.7%) | 1,433 (3.2%) |
| Total | 43,101 (100.0%) | 44,893 (100.0%) |
Families and Households in Josephine County
Median Family Size in Josephine County
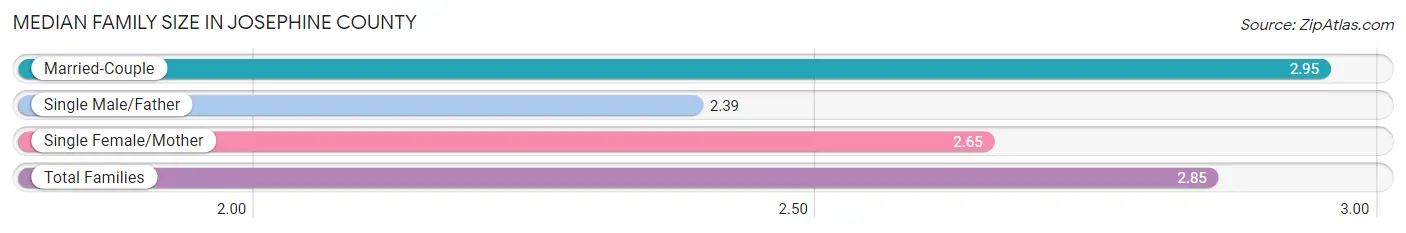
The median family size in Josephine County is 2.85 persons per family, with married-couple families (17,240 | 73.5%) accounting for the largest median family size of 2.95 persons per family. On the other hand, single male/father families (1,955 | 8.3%) represent the smallest median family size with 2.39 persons per family.
| Family Type | # Families | Family Size |
| Married-Couple | 17,240 (73.5%) | 2.95 |
| Single Male/Father | 1,955 (8.3%) | 2.39 |
| Single Female/Mother | 4,273 (18.2%) | 2.65 |
| Total Families | 23,468 (100.0%) | 2.85 |
Median Household Size in Josephine County
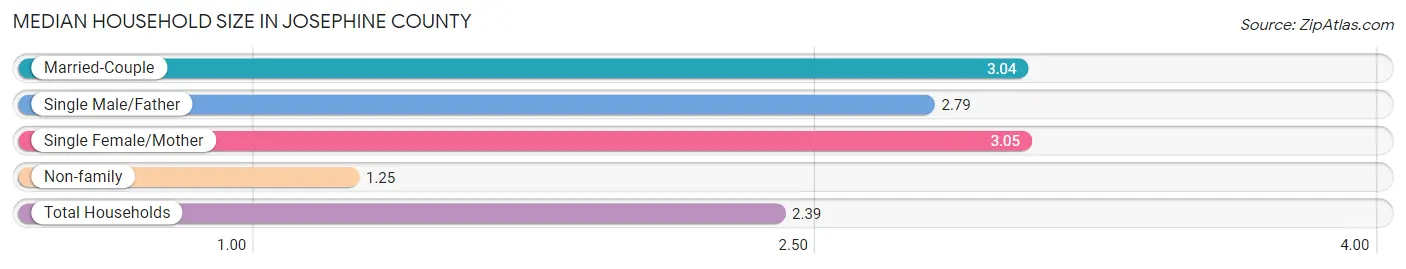
The median household size in Josephine County is 2.39 persons per household, with single female/mother households (4,273 | 11.8%) accounting for the largest median household size of 3.05 persons per household. non-family households (12,742 | 35.2%) represent the smallest median household size with 1.25 persons per household.
| Household Type | # Households | Household Size |
| Married-Couple | 17,240 (47.6%) | 3.04 |
| Single Male/Father | 1,955 (5.4%) | 2.79 |
| Single Female/Mother | 4,273 (11.8%) | 3.05 |
| Non-family | 12,742 (35.2%) | 1.25 |
| Total Households | 36,210 (100.0%) | 2.39 |
Household Size by Marriage Status in Josephine County
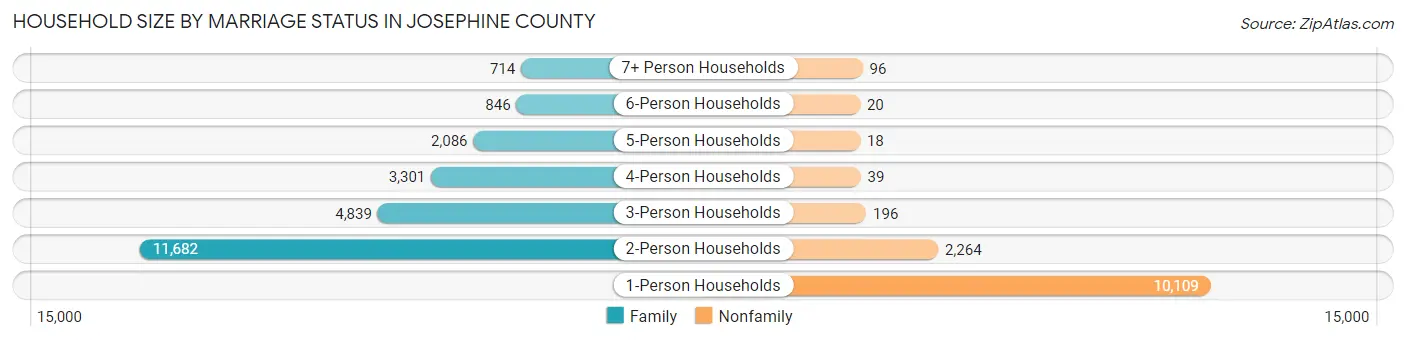
Out of a total of 36,210 households in Josephine County, 23,468 (64.8%) are family households, while 12,742 (35.2%) are nonfamily households. The most numerous type of family households are 2-person households, comprising 11,682, and the most common type of nonfamily households are 1-person households, comprising 10,109.
| Household Size | Family Households | Nonfamily Households |
| 1-Person Households | - | 10,109 (27.9%) |
| 2-Person Households | 11,682 (32.3%) | 2,264 (6.2%) |
| 3-Person Households | 4,839 (13.4%) | 196 (0.5%) |
| 4-Person Households | 3,301 (9.1%) | 39 (0.1%) |
| 5-Person Households | 2,086 (5.8%) | 18 (0.1%) |
| 6-Person Households | 846 (2.3%) | 20 (0.1%) |
| 7+ Person Households | 714 (2.0%) | 96 (0.3%) |
| Total | 23,468 (64.8%) | 12,742 (35.2%) |
Female Fertility in Josephine County
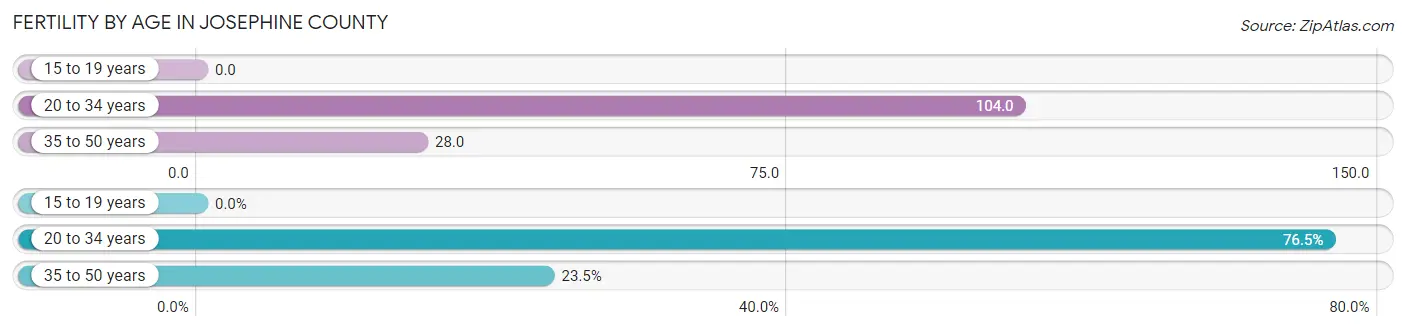
Fertility by Age in Josephine County
Average fertility rate in Josephine County is 55.0 births per 1,000 women. Women in the age bracket of 20 to 34 years have the highest fertility rate with 104.0 births per 1,000 women. Women in the age bracket of 20 to 34 years acount for 76.5% of all women with births.
| Age Bracket | Women with Births | Births / 1,000 Women |
| 15 to 19 years | 0 (0.0%) | 0.0 |
| 20 to 34 years | 686 (76.5%) | 104.0 |
| 35 to 50 years | 211 (23.5%) | 28.0 |
| Total | 897 (100.0%) | 55.0 |
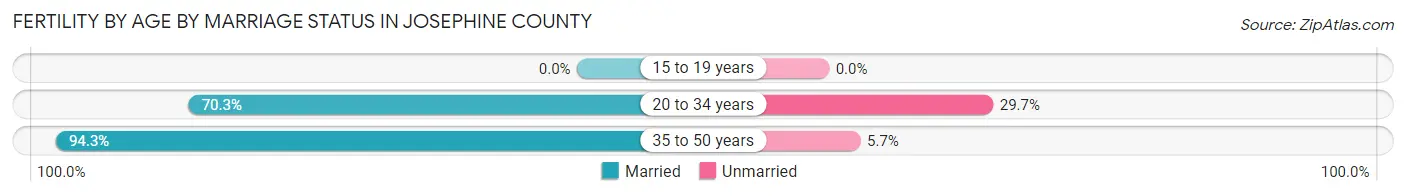
Fertility by Age by Marriage Status in Josephine County
75.9% of women with births (897) in Josephine County are married. The highest percentage of unmarried women with births falls into 20 to 34 years age bracket with 29.7% of them unmarried at the time of birth, while the lowest percentage of unmarried women with births belong to 35 to 50 years age bracket with 5.7% of them unmarried.
| Age Bracket | Married | Unmarried |
| 15 to 19 years | 0 (0.0%) | 0 (0.0%) |
| 20 to 34 years | 482 (70.3%) | 204 (29.7%) |
| 35 to 50 years | 199 (94.3%) | 12 (5.7%) |
| Total | 681 (75.9%) | 216 (24.1%) |
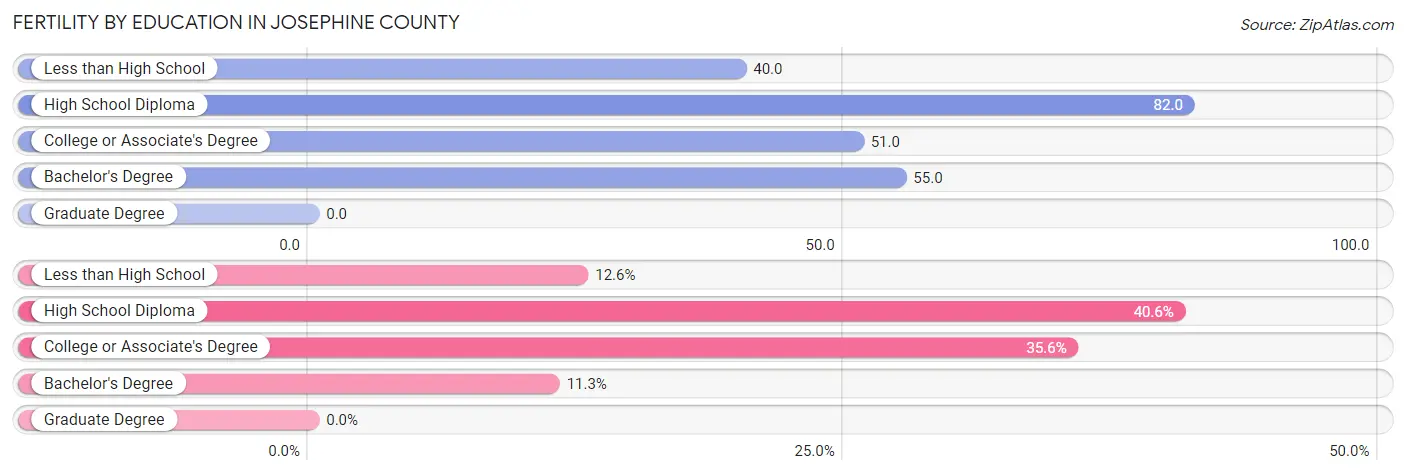
Fertility by Education in Josephine County
| Educational Attainment | Women with Births | Births / 1,000 Women |
| Less than High School | 113 (12.6%) | 40.0 |
| High School Diploma | 364 (40.6%) | 82.0 |
| College or Associate's Degree | 319 (35.6%) | 51.0 |
| Bachelor's Degree | 101 (11.3%) | 55.0 |
| Graduate Degree | 0 (0.0%) | 0.0 |
| Total | 897 (100.0%) | 55.0 |
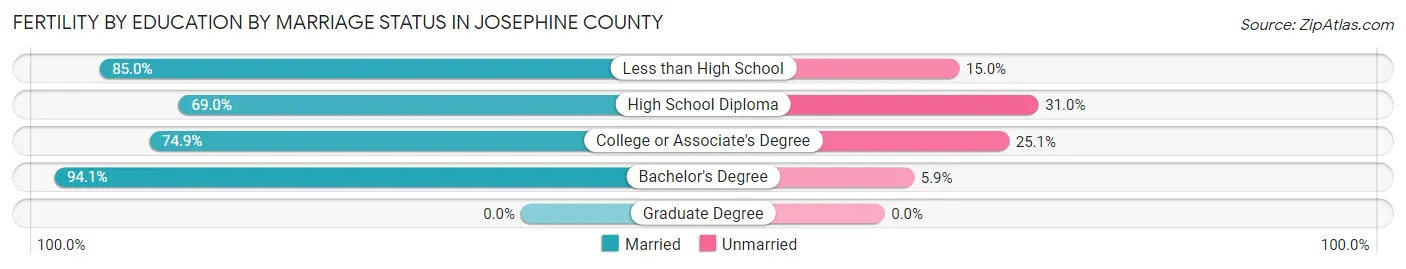
Fertility by Education by Marriage Status in Josephine County
24.1% of women with births in Josephine County are unmarried. Women with the educational attainment of bachelor's degree are most likely to be married with 94.1% of them married at childbirth, while women with the educational attainment of high school diploma are least likely to be married with 31.0% of them unmarried at childbirth.
| Educational Attainment | Married | Unmarried |
| Less than High School | 96 (85.0%) | 17 (15.0%) |
| High School Diploma | 251 (69.0%) | 113 (31.0%) |
| College or Associate's Degree | 239 (74.9%) | 80 (25.1%) |
| Bachelor's Degree | 95 (94.1%) | 6 (5.9%) |
| Graduate Degree | 0 (0.0%) | 0 (0.0%) |
| Total | 681 (75.9%) | 216 (24.1%) |
Income in Josephine County
Income Overview in Josephine County
Per Capita Income in Josephine County is $32,159, while median incomes of families and households are $66,158 and $56,068 respectively.
| Characteristic | Number | Measure |
| Per Capita Income | 87,994 | $32,159 |
| Median Family Income | 23,468 | $66,158 |
| Mean Family Income | 23,468 | $89,090 |
| Median Household Income | 36,210 | $56,068 |
| Mean Household Income | 36,210 | $78,355 |
| Income Deficit | 23,468 | $10,553 |
| Wage / Income Gap (%) | 87,994 | 27.45% |
| Wage / Income Gap ($) | 87,994 | 72.55¢ per $1 |
| Gini / Inequality Index | 87,994 | 0.47 |
Earnings by Sex in Josephine County
Average Earnings in Josephine County are $31,545, $36,549 for men and $26,518 for women, a difference of 27.5%.
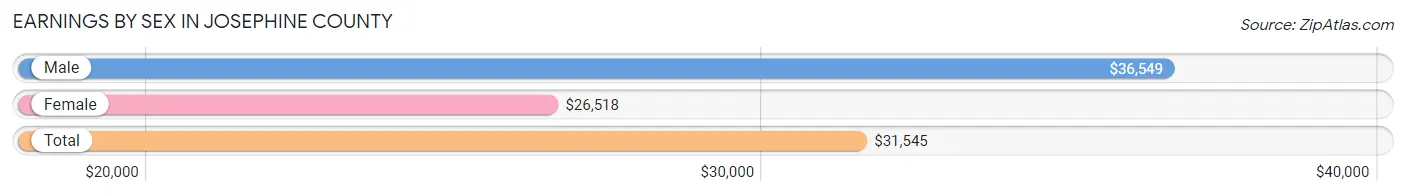
| Sex | Number | Average Earnings |
| Male | 19,922 (52.0%) | $36,549 |
| Female | 18,359 (48.0%) | $26,518 |
| Total | 38,281 (100.0%) | $31,545 |
Earnings by Sex by Income Bracket in Josephine County
The most common earnings brackets in Josephine County are $100,000+ for men (2,251 | 11.3%) and $25,000 to $29,999 for women (1,546 | 8.4%).
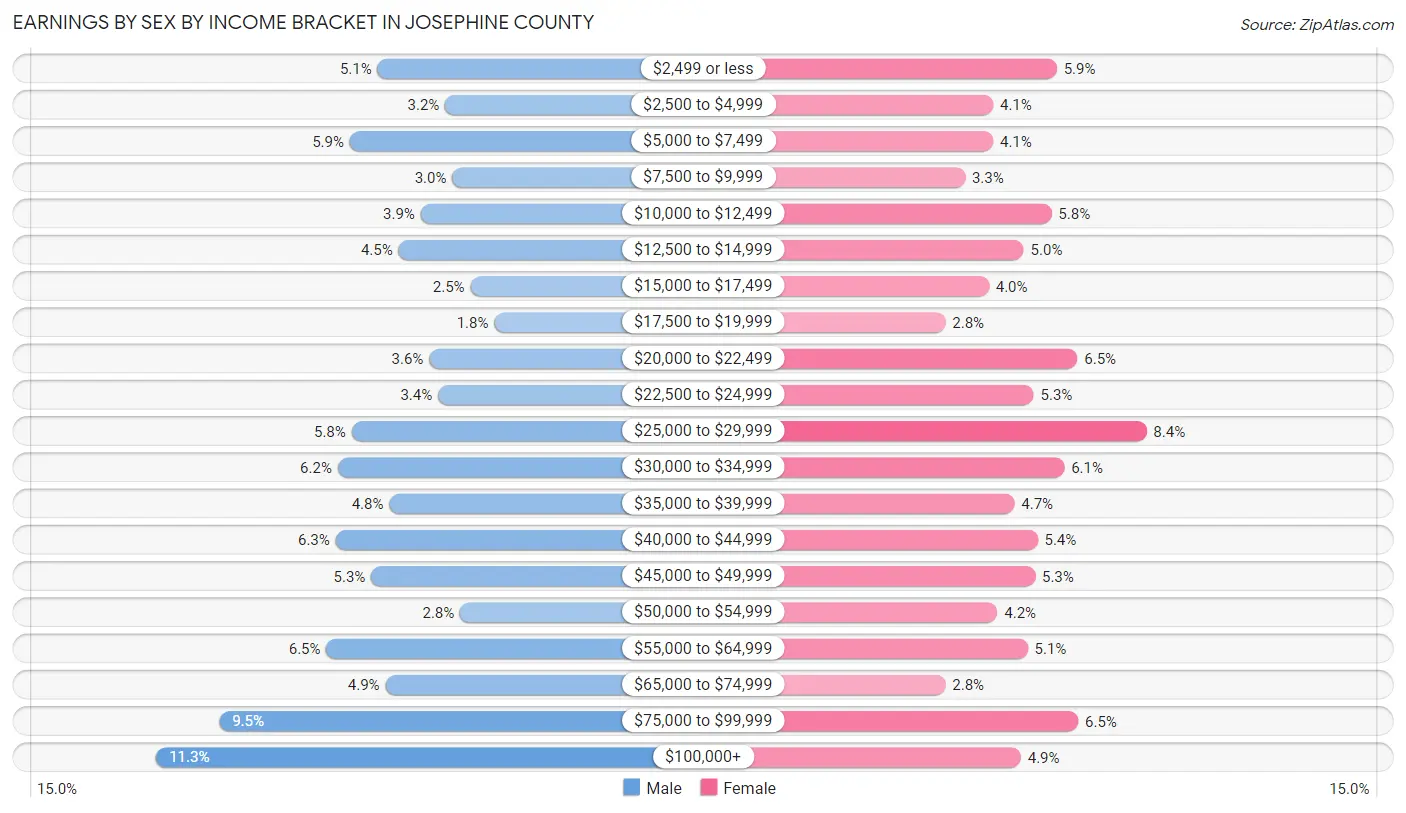
| Income | Male | Female |
| $2,499 or less | 1,013 (5.1%) | 1,084 (5.9%) |
| $2,500 to $4,999 | 634 (3.2%) | 755 (4.1%) |
| $5,000 to $7,499 | 1,168 (5.9%) | 754 (4.1%) |
| $7,500 to $9,999 | 593 (3.0%) | 609 (3.3%) |
| $10,000 to $12,499 | 771 (3.9%) | 1,055 (5.8%) |
| $12,500 to $14,999 | 894 (4.5%) | 912 (5.0%) |
| $15,000 to $17,499 | 493 (2.5%) | 732 (4.0%) |
| $17,500 to $19,999 | 359 (1.8%) | 509 (2.8%) |
| $20,000 to $22,499 | 724 (3.6%) | 1,189 (6.5%) |
| $22,500 to $24,999 | 673 (3.4%) | 963 (5.2%) |
| $25,000 to $29,999 | 1,158 (5.8%) | 1,546 (8.4%) |
| $30,000 to $34,999 | 1,235 (6.2%) | 1,121 (6.1%) |
| $35,000 to $39,999 | 946 (4.8%) | 864 (4.7%) |
| $40,000 to $44,999 | 1,247 (6.3%) | 984 (5.4%) |
| $45,000 to $49,999 | 1,048 (5.3%) | 972 (5.3%) |
| $50,000 to $54,999 | 550 (2.8%) | 777 (4.2%) |
| $55,000 to $64,999 | 1,298 (6.5%) | 932 (5.1%) |
| $65,000 to $74,999 | 969 (4.9%) | 509 (2.8%) |
| $75,000 to $99,999 | 1,898 (9.5%) | 1,194 (6.5%) |
| $100,000+ | 2,251 (11.3%) | 898 (4.9%) |
| Total | 19,922 (100.0%) | 18,359 (100.0%) |
Earnings by Sex by Educational Attainment in Josephine County
Average earnings in Josephine County are $41,228 for men and $29,913 for women, a difference of 27.4%. Men with an educational attainment of graduate degree enjoy the highest average annual earnings of $73,659, while those with less than high school education earn the least with $34,467. Women with an educational attainment of graduate degree earn the most with the average annual earnings of $63,505, while those with less than high school education have the smallest earnings of $22,788.
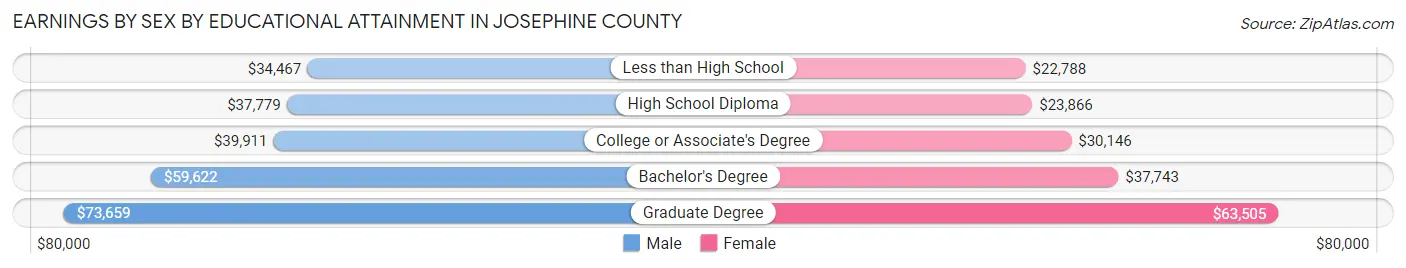
| Educational Attainment | Male Income | Female Income |
| Less than High School | $34,467 | $22,788 |
| High School Diploma | $37,779 | $23,866 |
| College or Associate's Degree | $39,911 | $30,146 |
| Bachelor's Degree | $59,622 | $37,743 |
| Graduate Degree | $73,659 | $63,505 |
| Total | $41,228 | $29,913 |
Family Income in Josephine County
Family Income Brackets in Josephine County
According to the Josephine County family income data, there are 4,787 families falling into the $50,000 to $74,999 income range, which is the most common income bracket and makes up 20.4% of all families. Conversely, the $10,000 to $14,999 income bracket is the least frequent group with only 516 families (2.2%) belonging to this category.
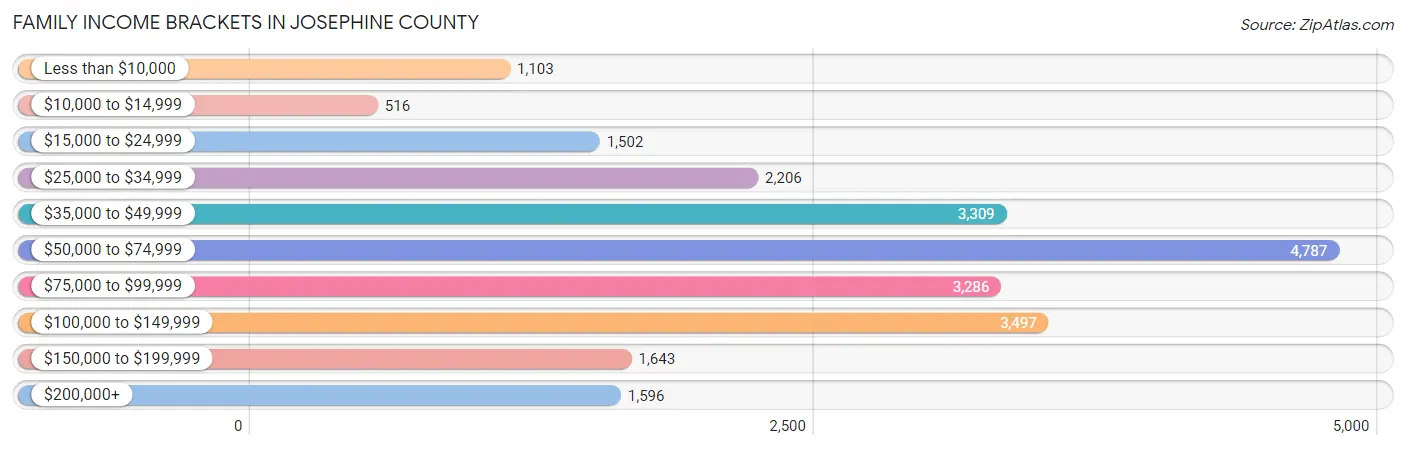
| Income Bracket | # Families | % Families |
| Less than $10,000 | 1,103 | 4.7% |
| $10,000 to $14,999 | 516 | 2.2% |
| $15,000 to $24,999 | 1,502 | 6.4% |
| $25,000 to $34,999 | 2,206 | 9.4% |
| $35,000 to $49,999 | 3,309 | 14.1% |
| $50,000 to $74,999 | 4,787 | 20.4% |
| $75,000 to $99,999 | 3,286 | 14.0% |
| $100,000 to $149,999 | 3,497 | 14.9% |
| $150,000 to $199,999 | 1,643 | 7.0% |
| $200,000+ | 1,596 | 6.8% |
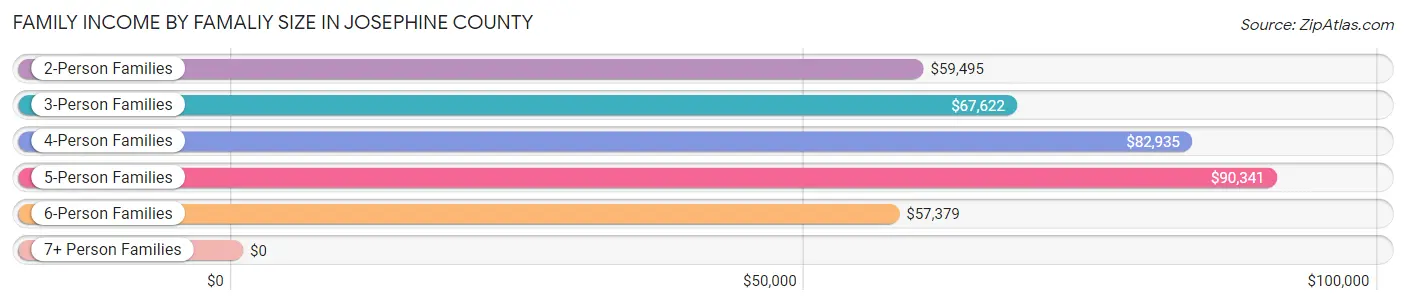
Family Income by Famaliy Size in Josephine County
5-person families (1,864 | 7.9%) account for the highest median family income in Josephine County with $90,341 per family, while 2-person families (13,062 | 55.7%) have the highest median income of $29,748 per family member.
| Income Bracket | # Families | Median Income |
| 2-Person Families | 13,062 (55.7%) | $59,495 |
| 3-Person Families | 4,640 (19.8%) | $67,622 |
| 4-Person Families | 2,735 (11.7%) | $82,935 |
| 5-Person Families | 1,864 (7.9%) | $90,341 |
| 6-Person Families | 639 (2.7%) | $57,379 |
| 7+ Person Families | 528 (2.2%) | $0 |
| Total | 23,468 (100.0%) | $66,158 |
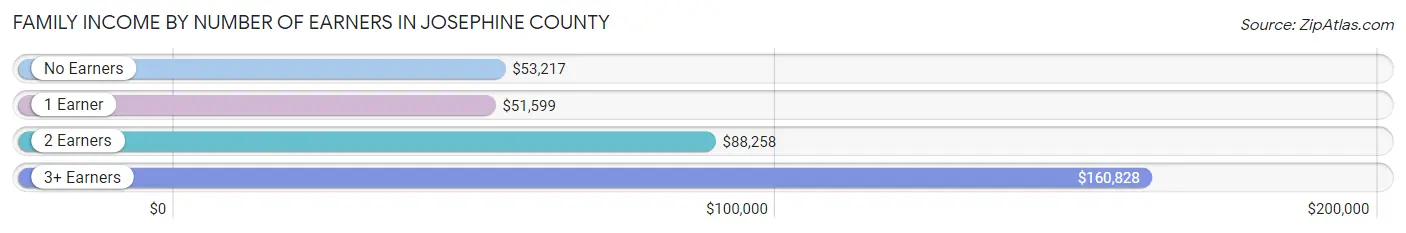
Family Income by Number of Earners in Josephine County
The median family income in Josephine County is $66,158, with families comprising 3+ earners (1,459) having the highest median family income of $160,828, while families with 1 earner (8,324) have the lowest median family income of $51,599, accounting for 6.2% and 35.5% of families, respectively.
| Number of Earners | # Families | Median Income |
| No Earners | 6,089 (26.0%) | $53,217 |
| 1 Earner | 8,324 (35.5%) | $51,599 |
| 2 Earners | 7,596 (32.4%) | $88,258 |
| 3+ Earners | 1,459 (6.2%) | $160,828 |
| Total | 23,468 (100.0%) | $66,158 |
Household Income in Josephine County
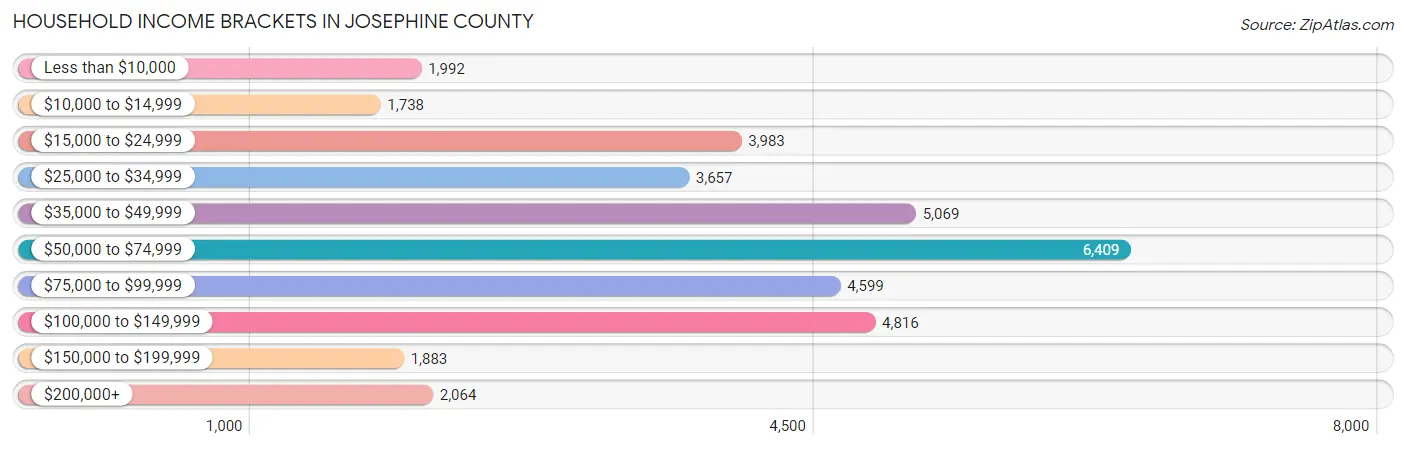
Household Income Brackets in Josephine County
With 6,409 households falling in the category, the $50,000 to $74,999 income range is the most frequent in Josephine County, accounting for 17.7% of all households. In contrast, only 1,738 households (4.8%) fall into the $10,000 to $14,999 income bracket, making it the least populous group.
| Income Bracket | # Households | % Households |
| Less than $10,000 | 1,992 | 5.5% |
| $10,000 to $14,999 | 1,738 | 4.8% |
| $15,000 to $24,999 | 3,983 | 11.0% |
| $25,000 to $34,999 | 3,657 | 10.1% |
| $35,000 to $49,999 | 5,069 | 14.0% |
| $50,000 to $74,999 | 6,409 | 17.7% |
| $75,000 to $99,999 | 4,599 | 12.7% |
| $100,000 to $149,999 | 4,816 | 13.3% |
| $150,000 to $199,999 | 1,883 | 5.2% |
| $200,000+ | 2,064 | 5.7% |
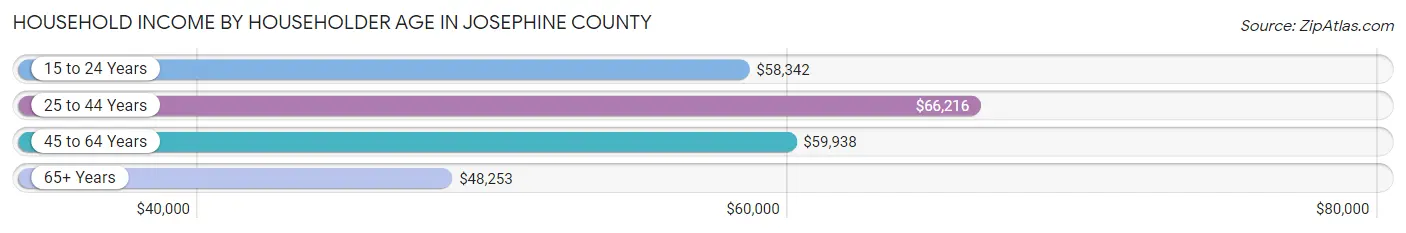
Household Income by Householder Age in Josephine County
The median household income in Josephine County is $56,068, with the highest median household income of $66,216 found in the 25 to 44 years age bracket for the primary householder. A total of 8,664 households (23.9%) fall into this category. Meanwhile, the 65+ years age bracket for the primary householder has the lowest median household income of $48,253, with 14,026 households (38.7%) in this group.
| Income Bracket | # Households | Median Income |
| 15 to 24 Years | 1,105 (3.0%) | $58,342 |
| 25 to 44 Years | 8,664 (23.9%) | $66,216 |
| 45 to 64 Years | 12,415 (34.3%) | $59,938 |
| 65+ Years | 14,026 (38.7%) | $48,253 |
| Total | 36,210 (100.0%) | $56,068 |
Poverty in Josephine County
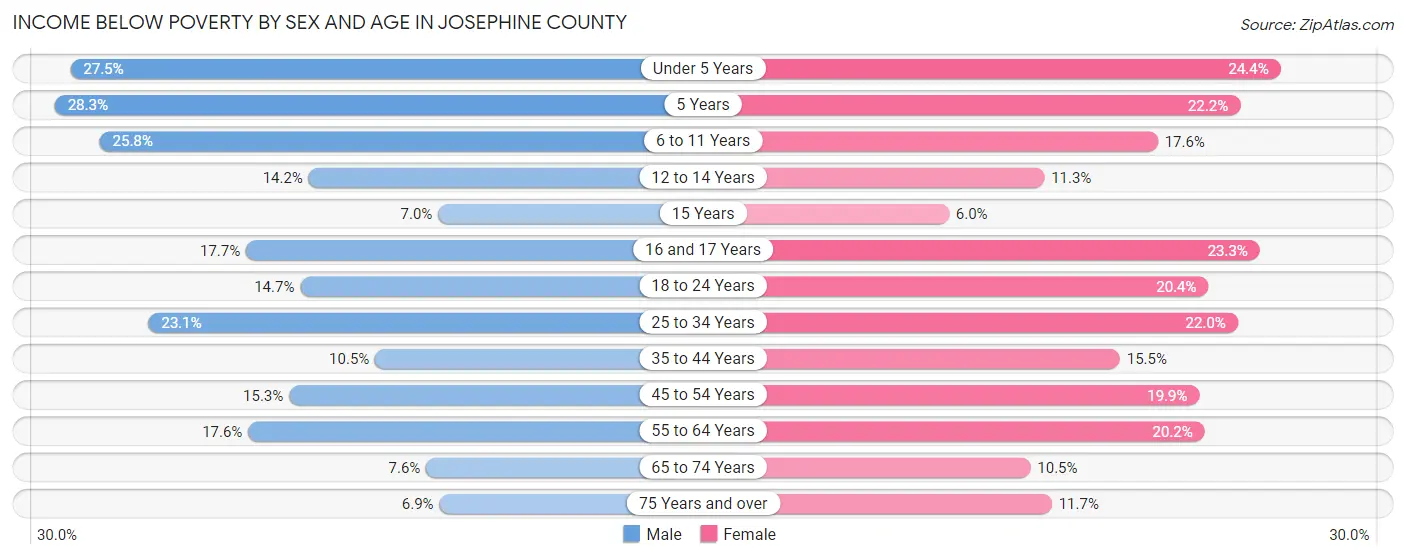
Income Below Poverty by Sex and Age in Josephine County
With 15.2% poverty level for males and 17.0% for females among the residents of Josephine County, 5 year old males and under 5 year old females are the most vulnerable to poverty, with 98 males (28.3%) and 489 females (24.4%) in their respective age groups living below the poverty level.
| Age Bracket | Male | Female |
| Under 5 Years | 538 (27.5%) | 489 (24.4%) |
| 5 Years | 98 (28.3%) | 88 (22.2%) |
| 6 to 11 Years | 664 (25.8%) | 496 (17.6%) |
| 12 to 14 Years | 256 (14.2%) | 166 (11.3%) |
| 15 Years | 23 (7.0%) | 24 (6.0%) |
| 16 and 17 Years | 193 (17.7%) | 226 (23.3%) |
| 18 to 24 Years | 413 (14.6%) | 535 (20.4%) |
| 25 to 34 Years | 1,144 (23.1%) | 1,040 (22.0%) |
| 35 to 44 Years | 504 (10.5%) | 758 (15.5%) |
| 45 to 54 Years | 749 (15.3%) | 958 (19.9%) |
| 55 to 64 Years | 1,071 (17.5%) | 1,399 (20.2%) |
| 65 to 74 Years | 482 (7.6%) | 747 (10.5%) |
| 75 Years and over | 296 (6.9%) | 624 (11.7%) |
| Total | 6,431 (15.2%) | 7,550 (17.0%) |
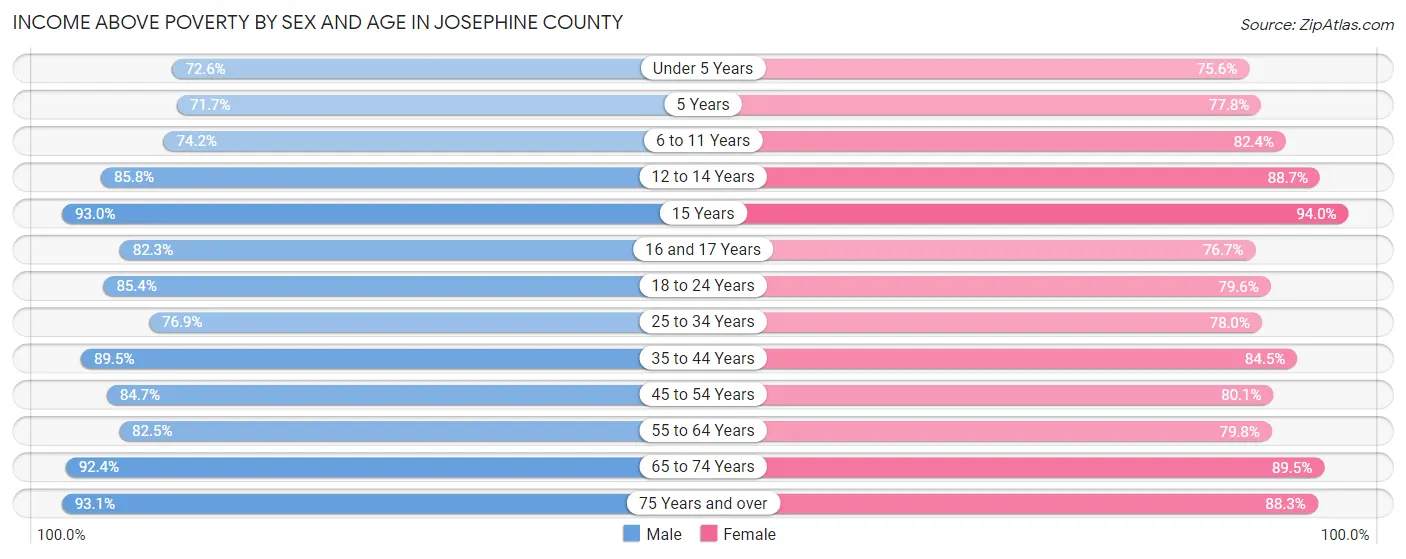
Income Above Poverty by Sex and Age in Josephine County
According to the poverty statistics in Josephine County, males aged 75 years and over and females aged 15 years are the age groups that are most secure financially, with 93.1% of males and 94.0% of females in these age groups living above the poverty line.
| Age Bracket | Male | Female |
| Under 5 Years | 1,422 (72.6%) | 1,513 (75.6%) |
| 5 Years | 248 (71.7%) | 309 (77.8%) |
| 6 to 11 Years | 1,908 (74.2%) | 2,323 (82.4%) |
| 12 to 14 Years | 1,549 (85.8%) | 1,307 (88.7%) |
| 15 Years | 307 (93.0%) | 379 (94.0%) |
| 16 and 17 Years | 899 (82.3%) | 745 (76.7%) |
| 18 to 24 Years | 2,406 (85.4%) | 2,086 (79.6%) |
| 25 to 34 Years | 3,807 (76.9%) | 3,678 (78.0%) |
| 35 to 44 Years | 4,304 (89.5%) | 4,140 (84.5%) |
| 45 to 54 Years | 4,156 (84.7%) | 3,853 (80.1%) |
| 55 to 64 Years | 5,030 (82.5%) | 5,526 (79.8%) |
| 65 to 74 Years | 5,825 (92.4%) | 6,369 (89.5%) |
| 75 Years and over | 3,991 (93.1%) | 4,715 (88.3%) |
| Total | 35,852 (84.8%) | 36,943 (83.0%) |
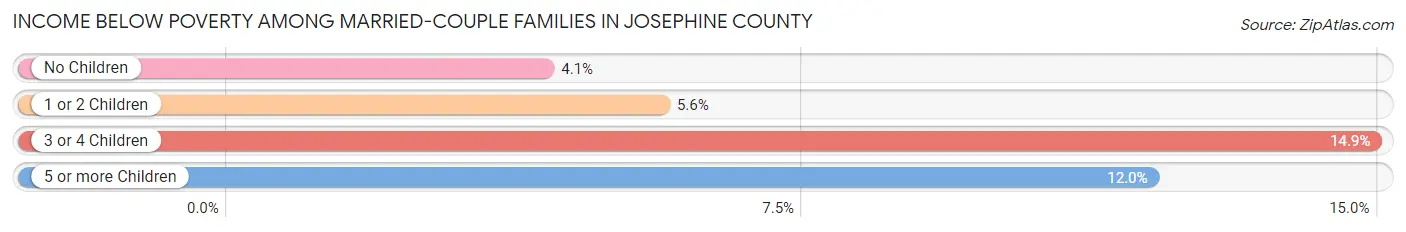
Income Below Poverty Among Married-Couple Families in Josephine County
The poverty statistics for married-couple families in Josephine County show that 5.6% or 971 of the total 17,240 families live below the poverty line. Families with 3 or 4 children have the highest poverty rate of 14.9%, comprising of 259 families. On the other hand, families with no children have the lowest poverty rate of 4.1%, which includes 466 families.
| Children | Above Poverty | Below Poverty |
| No Children | 10,827 (95.9%) | 466 (4.1%) |
| 1 or 2 Children | 3,850 (94.4%) | 230 (5.6%) |
| 3 or 4 Children | 1,475 (85.1%) | 259 (14.9%) |
| 5 or more Children | 117 (88.0%) | 16 (12.0%) |
| Total | 16,269 (94.4%) | 971 (5.6%) |
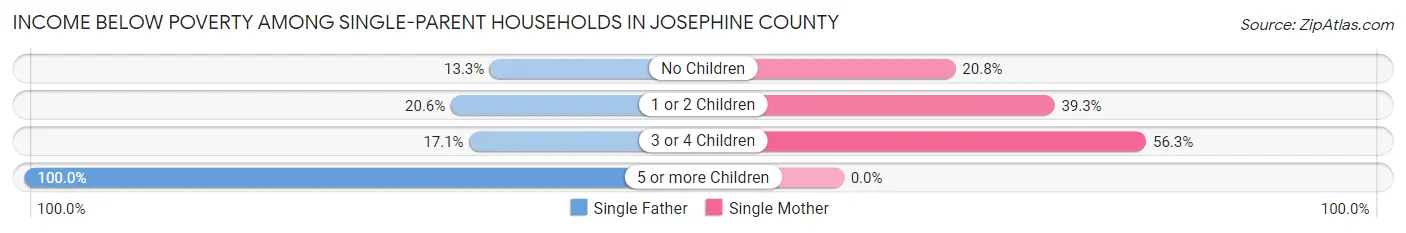
Income Below Poverty Among Single-Parent Households in Josephine County
According to the poverty data in Josephine County, 18.1% or 354 single-father households and 32.8% or 1,400 single-mother households are living below the poverty line. Among single-father households, those with 5 or more children have the highest poverty rate, with 17 households (100.0%) experiencing poverty. Likewise, among single-mother households, those with 3 or 4 children have the highest poverty rate, with 227 households (56.3%) falling below the poverty line.
| Children | Single Father | Single Mother |
| No Children | 110 (13.3%) | 372 (20.8%) |
| 1 or 2 Children | 221 (20.6%) | 801 (39.3%) |
| 3 or 4 Children | 6 (17.1%) | 227 (56.3%) |
| 5 or more Children | 17 (100.0%) | 0 (0.0%) |
| Total | 354 (18.1%) | 1,400 (32.8%) |
Income Below Poverty Among Married-Couple vs Single-Parent Households in Josephine County
The poverty data for Josephine County shows that 971 of the married-couple family households (5.6%) and 1,754 of the single-parent households (28.2%) are living below the poverty level. Within the married-couple family households, those with 3 or 4 children have the highest poverty rate, with 259 households (14.9%) falling below the poverty line. Among the single-parent households, those with 3 or 4 children have the highest poverty rate, with 233 household (53.2%) living below poverty.
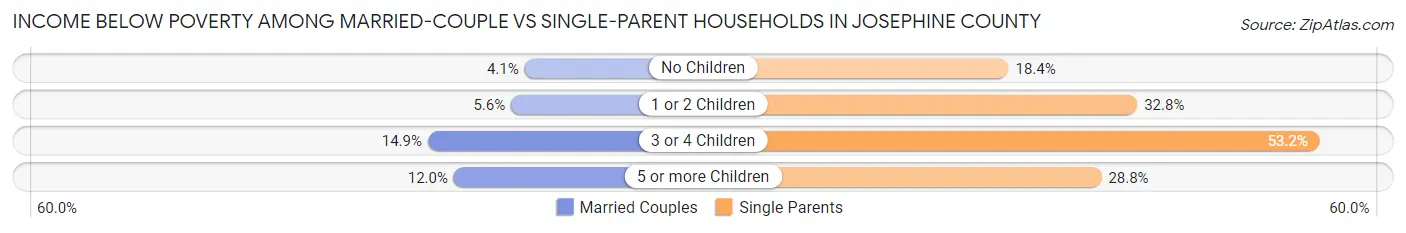
| Children | Married-Couple Families | Single-Parent Households |
| No Children | 466 (4.1%) | 482 (18.4%) |
| 1 or 2 Children | 230 (5.6%) | 1,022 (32.8%) |
| 3 or 4 Children | 259 (14.9%) | 233 (53.2%) |
| 5 or more Children | 16 (12.0%) | 17 (28.8%) |
| Total | 971 (5.6%) | 1,754 (28.2%) |
Employment Characteristics in Josephine County
Employment by Class of Employer in Josephine County
Among the 32,841 employed individuals in Josephine County, private company employees (19,829 | 60.4%), self-employed (not incorporated) (3,773 | 11.5%), and not-for-profit organizations (3,177 | 9.7%) make up the most common classes of employment.
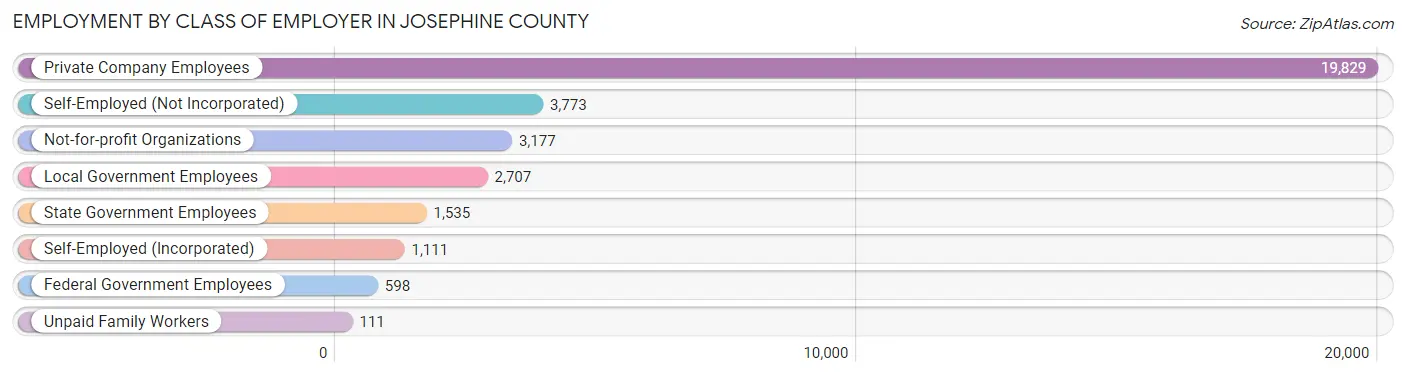
| Employer Class | # Employees | % Employees |
| Private Company Employees | 19,829 | 60.4% |
| Self-Employed (Incorporated) | 1,111 | 3.4% |
| Self-Employed (Not Incorporated) | 3,773 | 11.5% |
| Not-for-profit Organizations | 3,177 | 9.7% |
| Local Government Employees | 2,707 | 8.2% |
| State Government Employees | 1,535 | 4.7% |
| Federal Government Employees | 598 | 1.8% |
| Unpaid Family Workers | 111 | 0.3% |
| Total | 32,841 | 100.0% |
Employment Status by Age in Josephine County
According to the labor force statistics for Josephine County, out of the total population over 16 years of age (73,292), 49.7% or 36,426 individuals are in the labor force, with 8.1% or 2,951 of them unemployed. The age group with the highest labor force participation rate is 20 to 24 years, with 88.9% or 3,476 individuals in the labor force. Within the labor force, the 75 years and over age range has the highest percentage of unemployed individuals, with 23.8% or 126 of them being unemployed.
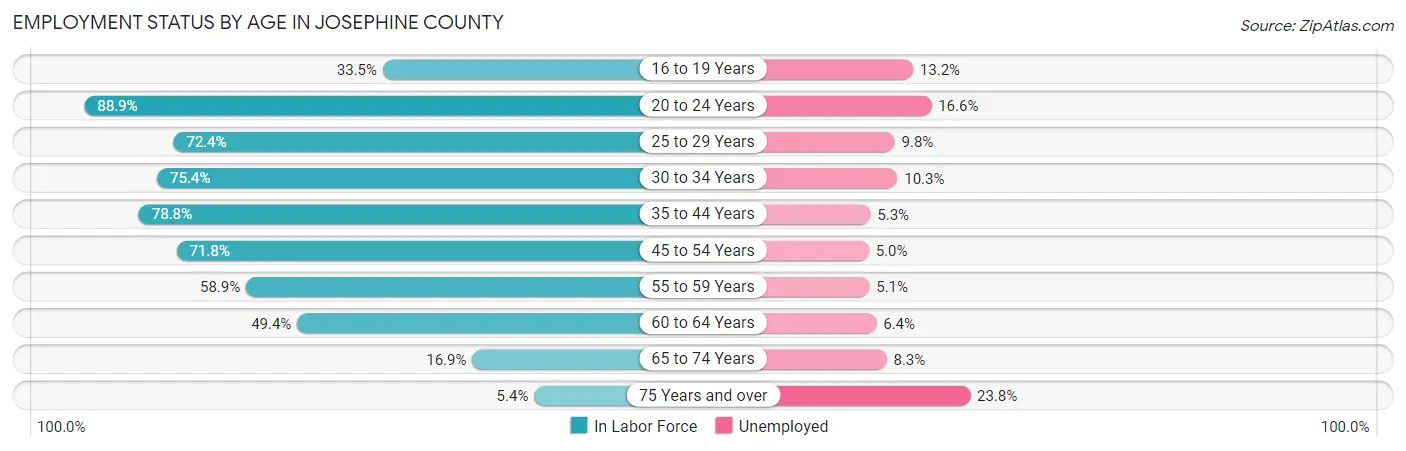
| Age Bracket | In Labor Force | Unemployed |
| 16 to 19 Years | 1,232 (33.5%) | 163 (13.2%) |
| 20 to 24 Years | 3,476 (88.9%) | 577 (16.6%) |
| 25 to 29 Years | 3,430 (72.4%) | 336 (9.8%) |
| 30 to 34 Years | 3,744 (75.4%) | 386 (10.3%) |
| 35 to 44 Years | 7,671 (78.8%) | 407 (5.3%) |
| 45 to 54 Years | 7,042 (71.8%) | 352 (5.0%) |
| 55 to 59 Years | 3,495 (58.9%) | 178 (5.1%) |
| 60 to 64 Years | 3,549 (49.4%) | 227 (6.4%) |
| 65 to 74 Years | 2,288 (16.9%) | 190 (8.3%) |
| 75 Years and over | 529 (5.4%) | 126 (23.8%) |
| Total | 36,426 (49.7%) | 2,951 (8.1%) |
Employment Status by Educational Attainment in Josephine County
According to labor force statistics for Josephine County, 68.3% of individuals (28,934) out of the total population between 25 and 64 years of age (42,363) are in the labor force, with 6.5% or 1,881 of them being unemployed. The group with the highest labor force participation rate are those with the educational attainment of bachelor's degree or higher, with 77.2% or 5,795 individuals in the labor force. Within the labor force, individuals with less than high school education have the highest percentage of unemployment, with 13.7% or 310 of them being unemployed.
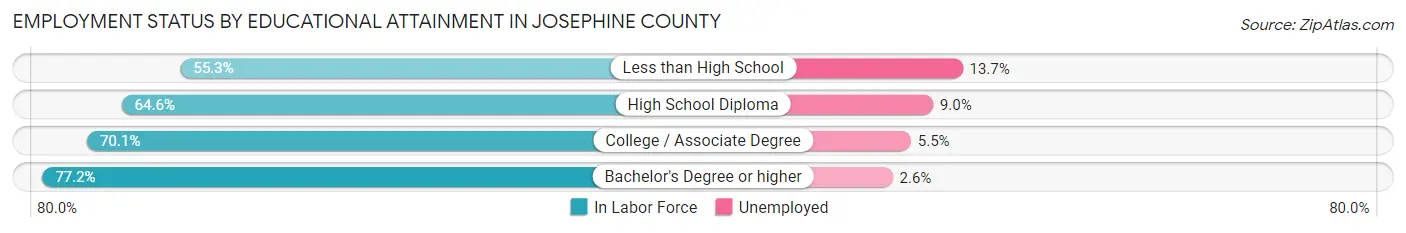
| Educational Attainment | In Labor Force | Unemployed |
| Less than High School | 2,262 (55.3%) | 560 (13.7%) |
| High School Diploma | 8,162 (64.6%) | 1,137 (9.0%) |
| College / Associate Degree | 12,711 (70.1%) | 997 (5.5%) |
| Bachelor's Degree or higher | 5,795 (77.2%) | 195 (2.6%) |
| Total | 28,934 (68.3%) | 2,754 (6.5%) |
Employment Occupations by Sex in Josephine County
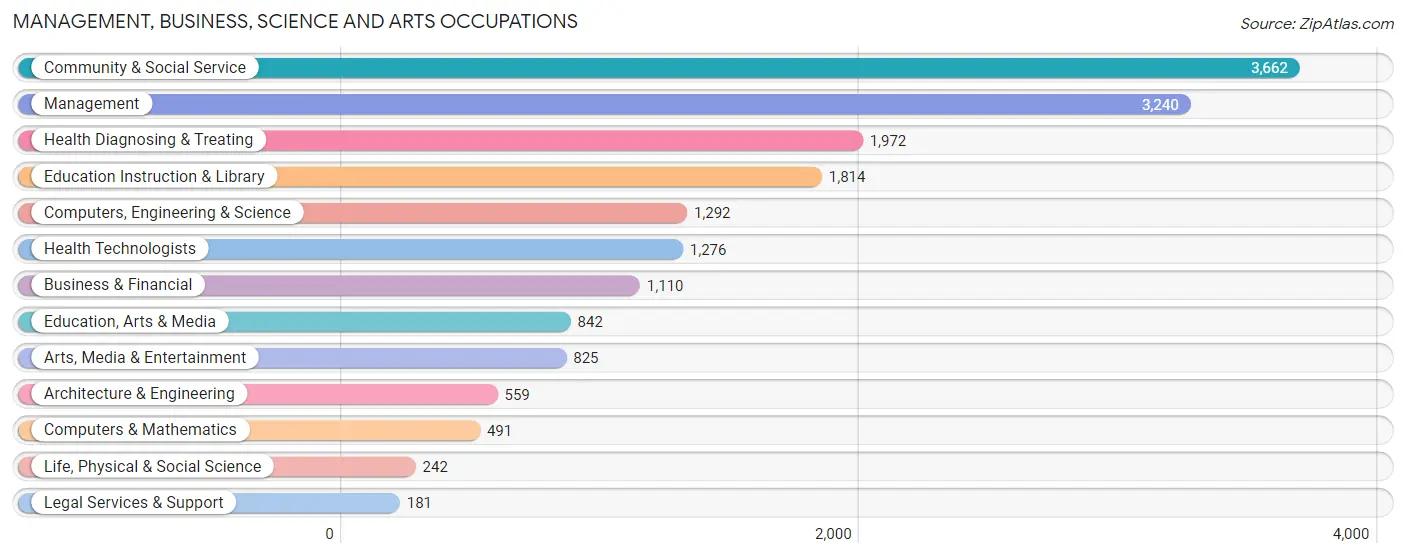
Management, Business, Science and Arts Occupations
The most common Management, Business, Science and Arts occupations in Josephine County are Community & Social Service (3,662 | 10.9%), Management (3,240 | 9.7%), Health Diagnosing & Treating (1,972 | 5.9%), Education Instruction & Library (1,814 | 5.4%), and Computers, Engineering & Science (1,292 | 3.9%).
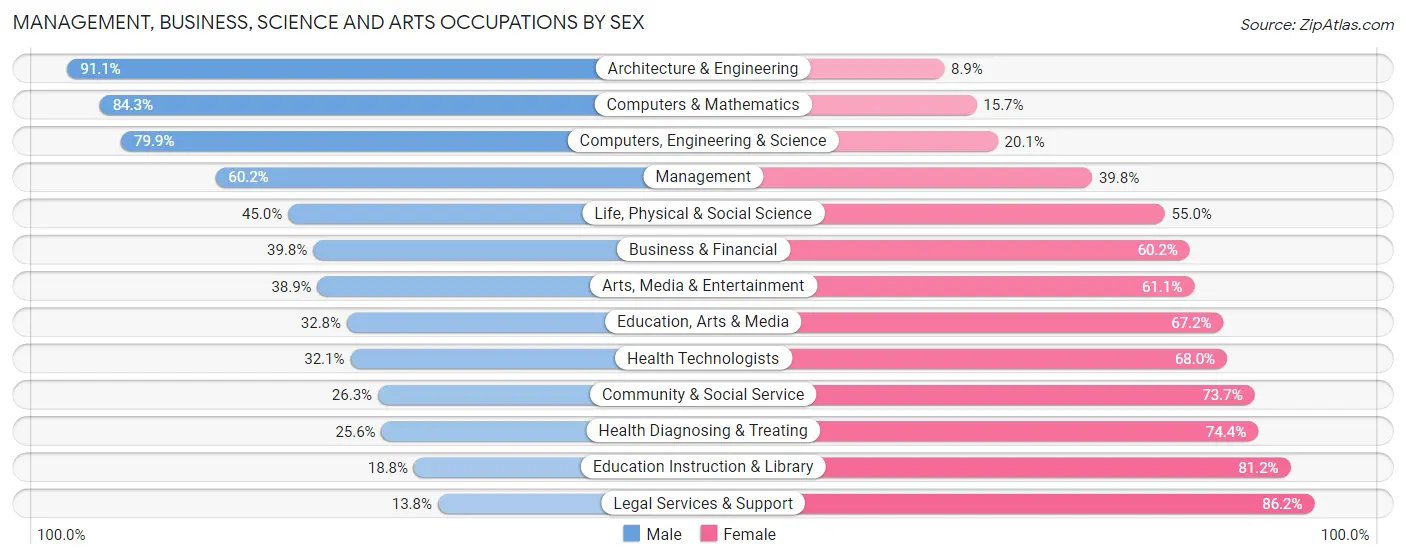
Management, Business, Science and Arts Occupations by Sex
Within the Management, Business, Science and Arts occupations in Josephine County, the most male-oriented occupations are Architecture & Engineering (91.1%), Computers & Mathematics (84.3%), and Computers, Engineering & Science (79.9%), while the most female-oriented occupations are Legal Services & Support (86.2%), Education Instruction & Library (81.2%), and Health Diagnosing & Treating (74.4%).
| Occupation | Male | Female |
| Management | 1,950 (60.2%) | 1,290 (39.8%) |
| Business & Financial | 442 (39.8%) | 668 (60.2%) |
| Computers, Engineering & Science | 1,032 (79.9%) | 260 (20.1%) |
| Computers & Mathematics | 414 (84.3%) | 77 (15.7%) |
| Architecture & Engineering | 509 (91.1%) | 50 (8.9%) |
| Life, Physical & Social Science | 109 (45.0%) | 133 (55.0%) |
| Community & Social Service | 963 (26.3%) | 2,699 (73.7%) |
| Education, Arts & Media | 276 (32.8%) | 566 (67.2%) |
| Legal Services & Support | 25 (13.8%) | 156 (86.2%) |
| Education Instruction & Library | 341 (18.8%) | 1,473 (81.2%) |
| Arts, Media & Entertainment | 321 (38.9%) | 504 (61.1%) |
| Health Diagnosing & Treating | 504 (25.6%) | 1,468 (74.4%) |
| Health Technologists | 409 (32.1%) | 867 (67.9%) |
| Total (Category) | 4,891 (43.4%) | 6,385 (56.6%) |
| Total (Overall) | 17,124 (51.1%) | 16,357 (48.8%) |
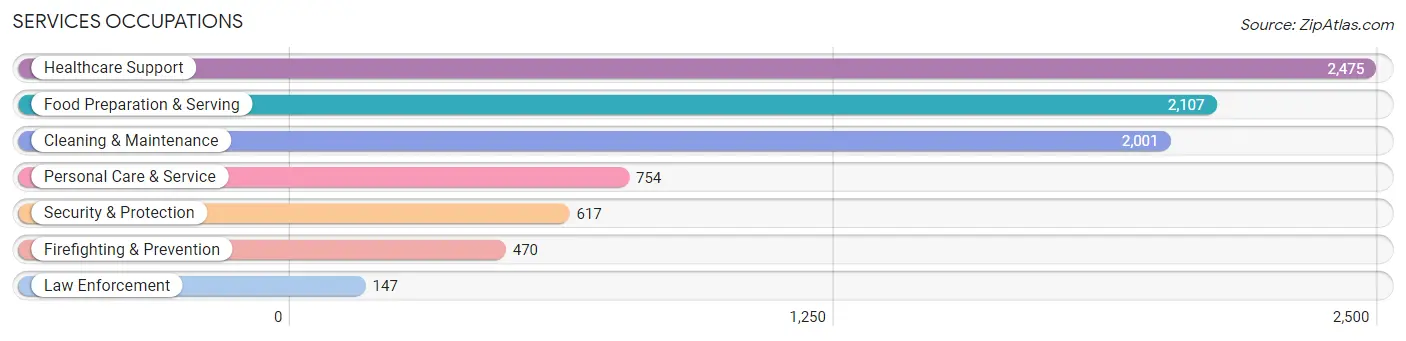
Services Occupations
The most common Services occupations in Josephine County are Healthcare Support (2,475 | 7.4%), Food Preparation & Serving (2,107 | 6.3%), Cleaning & Maintenance (2,001 | 6.0%), Personal Care & Service (754 | 2.2%), and Security & Protection (617 | 1.8%).
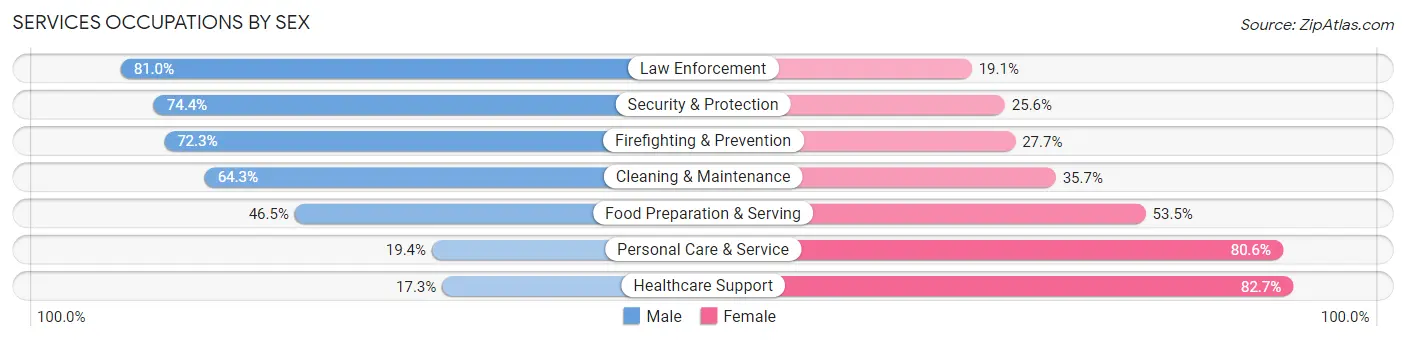
Services Occupations by Sex
Within the Services occupations in Josephine County, the most male-oriented occupations are Law Enforcement (80.9%), Security & Protection (74.4%), and Firefighting & Prevention (72.3%), while the most female-oriented occupations are Healthcare Support (82.7%), Personal Care & Service (80.6%), and Food Preparation & Serving (53.5%).
| Occupation | Male | Female |
| Healthcare Support | 429 (17.3%) | 2,046 (82.7%) |
| Security & Protection | 459 (74.4%) | 158 (25.6%) |
| Firefighting & Prevention | 340 (72.3%) | 130 (27.7%) |
| Law Enforcement | 119 (80.9%) | 28 (19.1%) |
| Food Preparation & Serving | 980 (46.5%) | 1,127 (53.5%) |
| Cleaning & Maintenance | 1,287 (64.3%) | 714 (35.7%) |
| Personal Care & Service | 146 (19.4%) | 608 (80.6%) |
| Total (Category) | 3,301 (41.5%) | 4,653 (58.5%) |
| Total (Overall) | 17,124 (51.1%) | 16,357 (48.8%) |
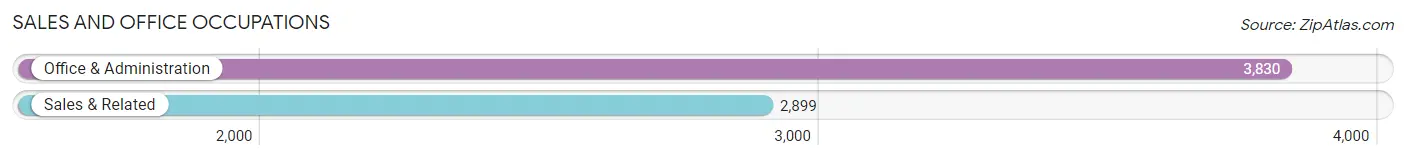
Sales and Office Occupations
The most common Sales and Office occupations in Josephine County are Office & Administration (3,830 | 11.4%), and Sales & Related (2,899 | 8.7%).
Sales and Office Occupations by Sex
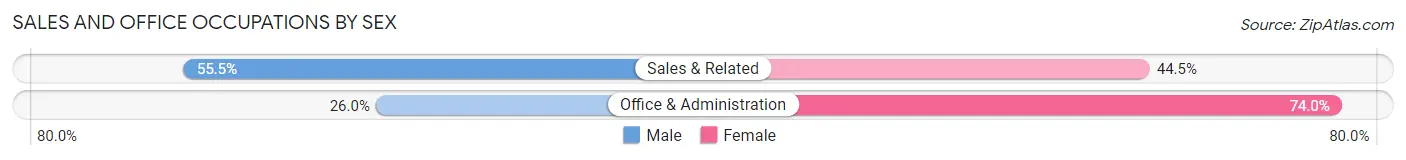
| Occupation | Male | Female |
| Sales & Related | 1,609 (55.5%) | 1,290 (44.5%) |
| Office & Administration | 995 (26.0%) | 2,835 (74.0%) |
| Total (Category) | 2,604 (38.7%) | 4,125 (61.3%) |
| Total (Overall) | 17,124 (51.1%) | 16,357 (48.8%) |
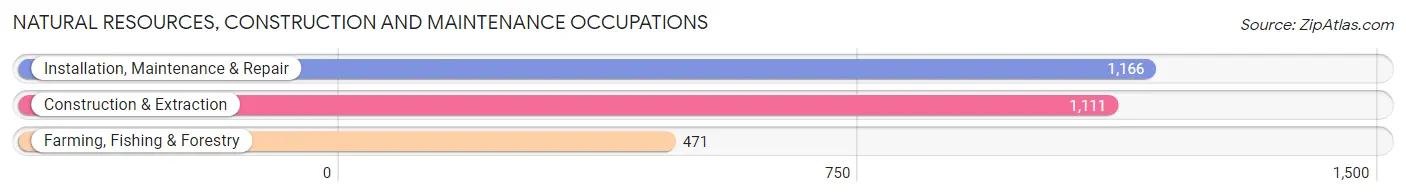
Natural Resources, Construction and Maintenance Occupations
The most common Natural Resources, Construction and Maintenance occupations in Josephine County are Installation, Maintenance & Repair (1,166 | 3.5%), Construction & Extraction (1,111 | 3.3%), and Farming, Fishing & Forestry (471 | 1.4%).
Natural Resources, Construction and Maintenance Occupations by Sex
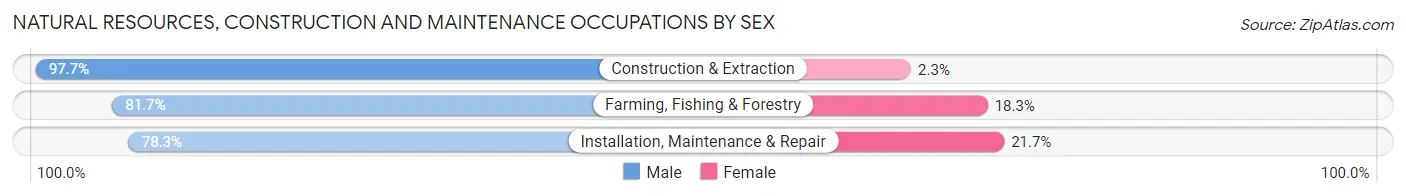
| Occupation | Male | Female |
| Farming, Fishing & Forestry | 385 (81.7%) | 86 (18.3%) |
| Construction & Extraction | 1,085 (97.7%) | 26 (2.3%) |
| Installation, Maintenance & Repair | 913 (78.3%) | 253 (21.7%) |
| Total (Category) | 2,383 (86.7%) | 365 (13.3%) |
| Total (Overall) | 17,124 (51.1%) | 16,357 (48.8%) |
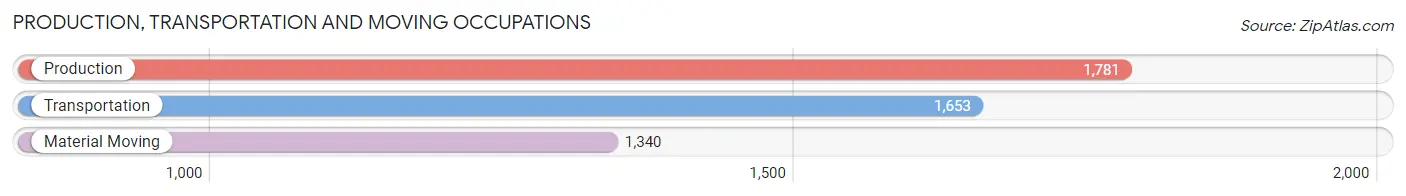
Production, Transportation and Moving Occupations
The most common Production, Transportation and Moving occupations in Josephine County are Production (1,781 | 5.3%), Transportation (1,653 | 4.9%), and Material Moving (1,340 | 4.0%).
Production, Transportation and Moving Occupations by Sex
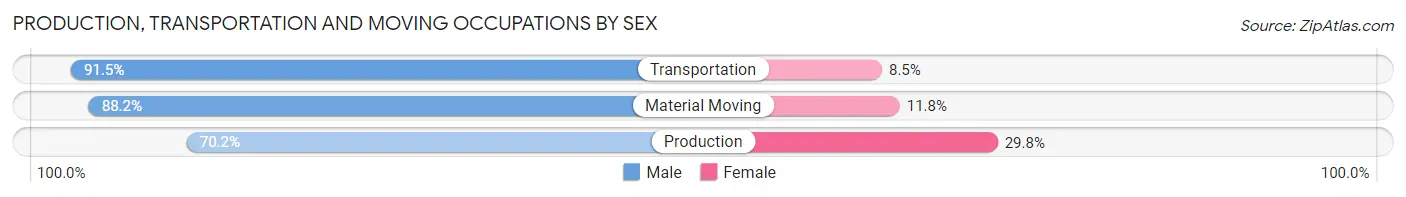
| Occupation | Male | Female |
| Production | 1,251 (70.2%) | 530 (29.8%) |
| Transportation | 1,512 (91.5%) | 141 (8.5%) |
| Material Moving | 1,182 (88.2%) | 158 (11.8%) |
| Total (Category) | 3,945 (82.6%) | 829 (17.4%) |
| Total (Overall) | 17,124 (51.1%) | 16,357 (48.8%) |
Employment Industries by Sex in Josephine County
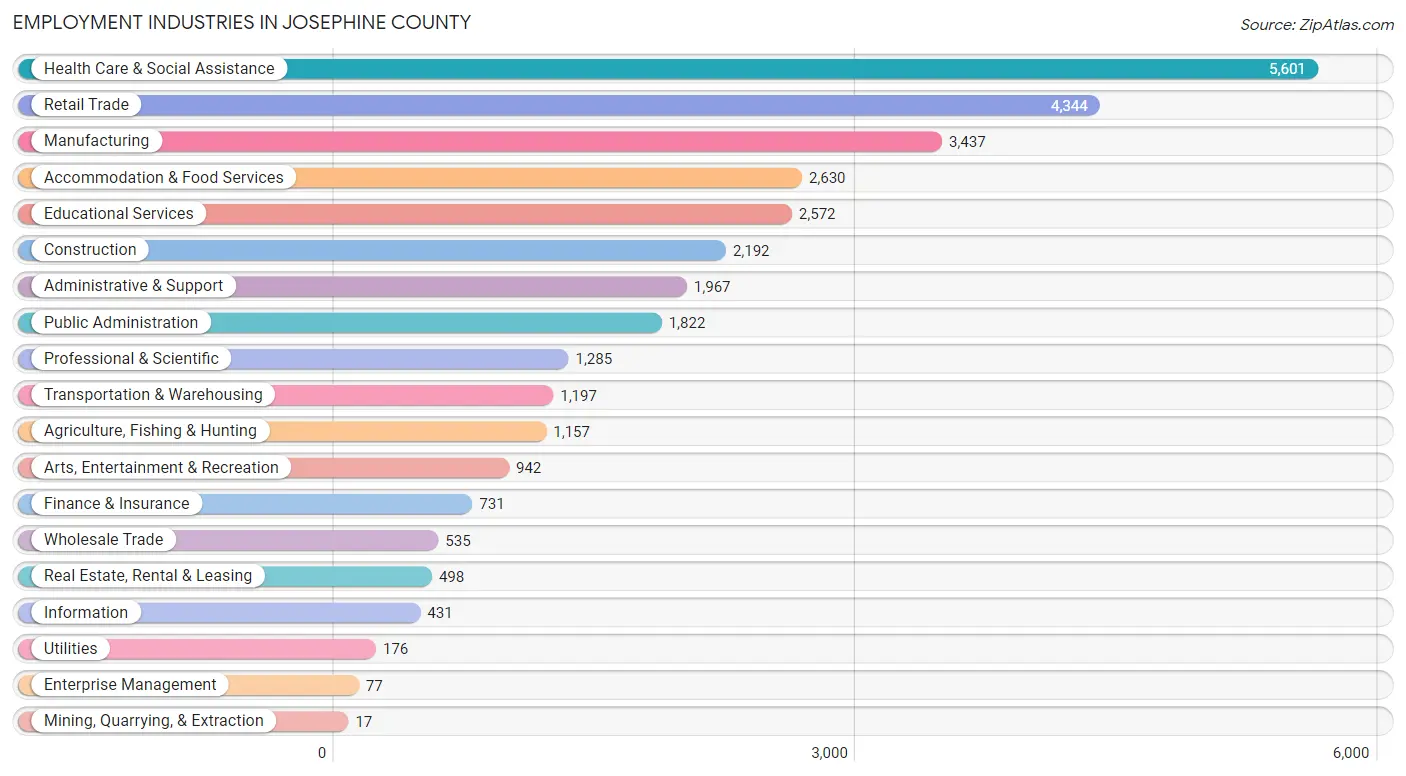
Employment Industries in Josephine County
The major employment industries in Josephine County include Health Care & Social Assistance (5,601 | 16.7%), Retail Trade (4,344 | 13.0%), Manufacturing (3,437 | 10.3%), Accommodation & Food Services (2,630 | 7.9%), and Educational Services (2,572 | 7.7%).
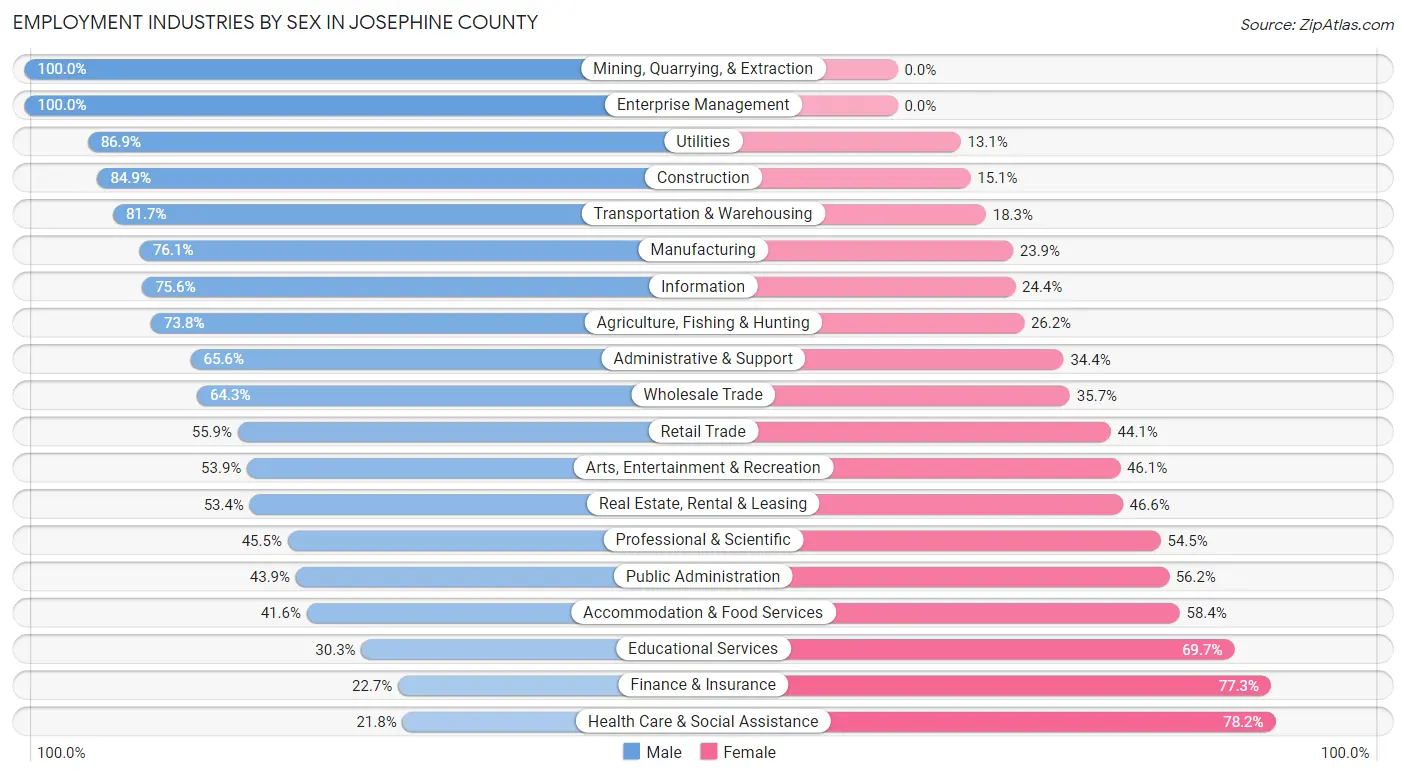
Employment Industries by Sex in Josephine County
The Josephine County industries that see more men than women are Mining, Quarrying, & Extraction (100.0%), Enterprise Management (100.0%), and Utilities (86.9%), whereas the industries that tend to have a higher number of women are Health Care & Social Assistance (78.2%), Finance & Insurance (77.3%), and Educational Services (69.7%).
| Industry | Male | Female |
| Agriculture, Fishing & Hunting | 854 (73.8%) | 303 (26.2%) |
| Mining, Quarrying, & Extraction | 17 (100.0%) | 0 (0.0%) |
| Construction | 1,861 (84.9%) | 331 (15.1%) |
| Manufacturing | 2,616 (76.1%) | 821 (23.9%) |
| Wholesale Trade | 344 (64.3%) | 191 (35.7%) |
| Retail Trade | 2,427 (55.9%) | 1,917 (44.1%) |
| Transportation & Warehousing | 978 (81.7%) | 219 (18.3%) |
| Utilities | 153 (86.9%) | 23 (13.1%) |
| Information | 326 (75.6%) | 105 (24.4%) |
| Finance & Insurance | 166 (22.7%) | 565 (77.3%) |
| Real Estate, Rental & Leasing | 266 (53.4%) | 232 (46.6%) |
| Professional & Scientific | 585 (45.5%) | 700 (54.5%) |
| Enterprise Management | 77 (100.0%) | 0 (0.0%) |
| Administrative & Support | 1,291 (65.6%) | 676 (34.4%) |
| Educational Services | 779 (30.3%) | 1,793 (69.7%) |
| Health Care & Social Assistance | 1,220 (21.8%) | 4,381 (78.2%) |
| Arts, Entertainment & Recreation | 508 (53.9%) | 434 (46.1%) |
| Accommodation & Food Services | 1,094 (41.6%) | 1,536 (58.4%) |
| Public Administration | 799 (43.9%) | 1,023 (56.1%) |
| Total | 17,124 (51.1%) | 16,357 (48.8%) |
Education in Josephine County
School Enrollment in Josephine County
The most common levels of schooling among the 16,729 students in Josephine County are high school (4,093 | 24.5%), middle school (4,041 | 24.2%), and elementary school (4,016 | 24.0%).
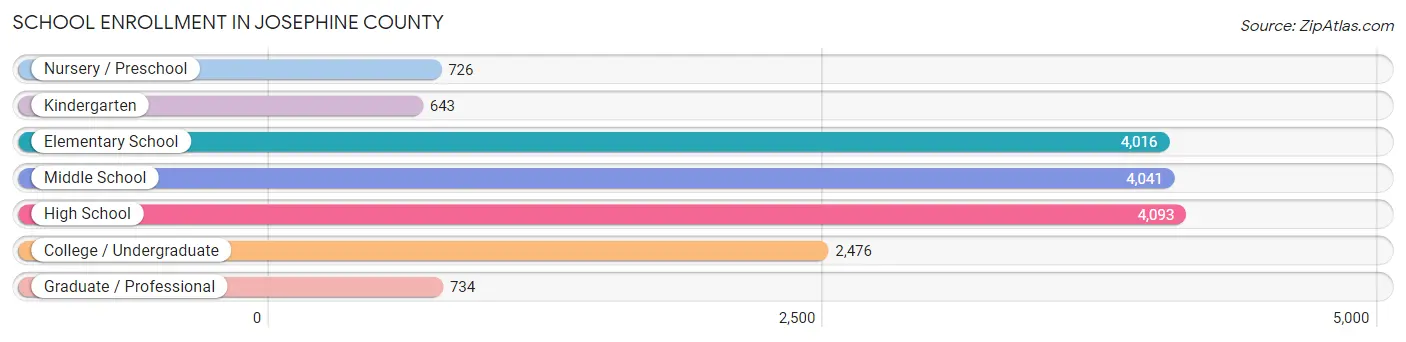
| School Level | # Students | % Students |
| Nursery / Preschool | 726 | 4.3% |
| Kindergarten | 643 | 3.8% |
| Elementary School | 4,016 | 24.0% |
| Middle School | 4,041 | 24.2% |
| High School | 4,093 | 24.5% |
| College / Undergraduate | 2,476 | 14.8% |
| Graduate / Professional | 734 | 4.4% |
| Total | 16,729 | 100.0% |
School Enrollment by Age by Funding Source in Josephine County
Out of a total of 16,729 students who are enrolled in schools in Josephine County, 3,061 (18.3%) attend a private institution, while the remaining 13,668 (81.7%) are enrolled in public schools. The age group of 3 to 4 year olds has the highest likelihood of being enrolled in private schools, with 282 (53.7% in the age bracket) enrolled. Conversely, the age group of 15 to 17 year olds has the lowest likelihood of being enrolled in a private school, with 2,562 (93.9% in the age bracket) attending a public institution.
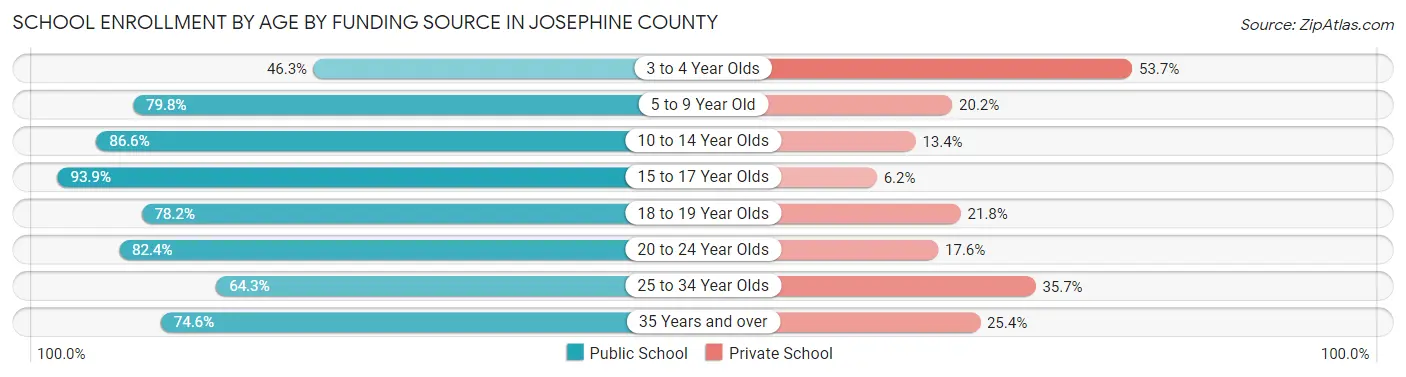
| Age Bracket | Public School | Private School |
| 3 to 4 Year Olds | 243 (46.3%) | 282 (53.7%) |
| 5 to 9 Year Old | 3,211 (79.8%) | 813 (20.2%) |
| 10 to 14 Year Olds | 4,680 (86.6%) | 722 (13.4%) |
| 15 to 17 Year Olds | 2,562 (93.9%) | 168 (6.1%) |
| 18 to 19 Year Olds | 837 (78.2%) | 233 (21.8%) |
| 20 to 24 Year Olds | 478 (82.4%) | 102 (17.6%) |
| 25 to 34 Year Olds | 835 (64.3%) | 464 (35.7%) |
| 35 Years and over | 820 (74.6%) | 279 (25.4%) |
| Total | 13,668 (81.7%) | 3,061 (18.3%) |
Educational Attainment by Field of Study in Josephine County
Business (1,697 | 12.5%), education (1,672 | 12.3%), science & technology (1,276 | 9.4%), bio, nature & agricultural (1,258 | 9.3%), and psychology (1,194 | 8.8%) are the most common fields of study among 13,573 individuals in Josephine County who have obtained a bachelor's degree or higher.
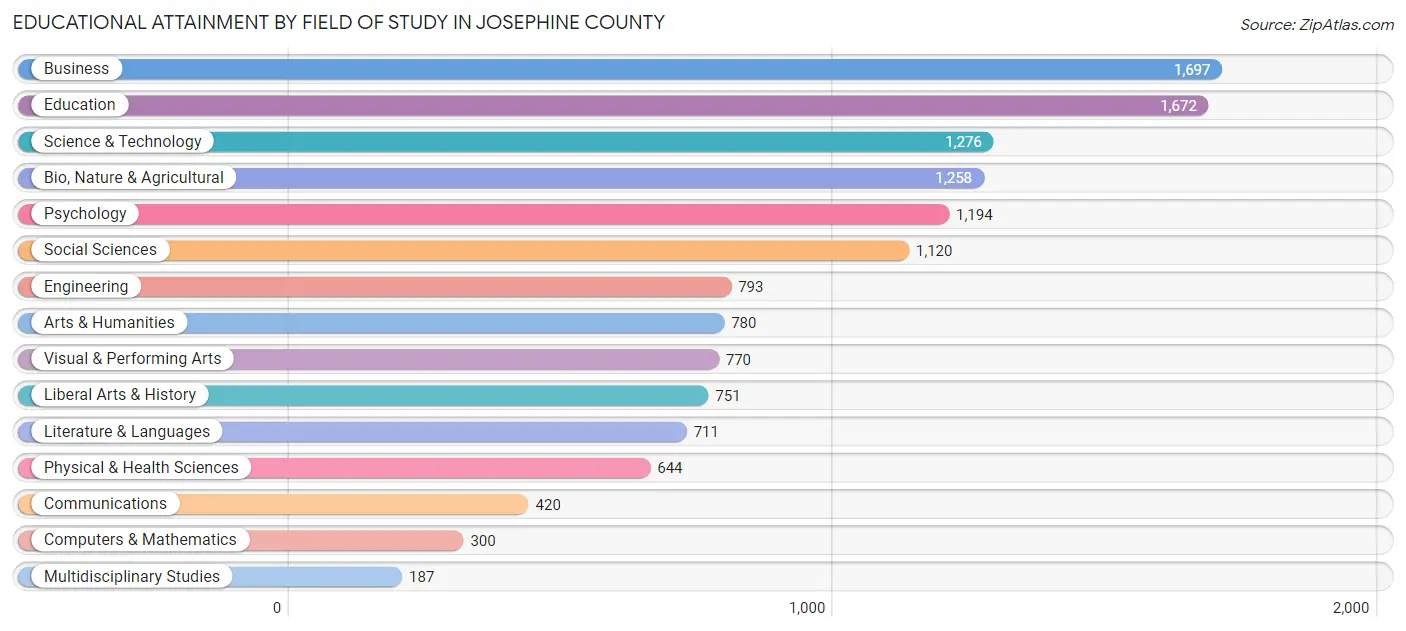
| Field of Study | # Graduates | % Graduates |
| Computers & Mathematics | 300 | 2.2% |
| Bio, Nature & Agricultural | 1,258 | 9.3% |
| Physical & Health Sciences | 644 | 4.7% |
| Psychology | 1,194 | 8.8% |
| Social Sciences | 1,120 | 8.3% |
| Engineering | 793 | 5.8% |
| Multidisciplinary Studies | 187 | 1.4% |
| Science & Technology | 1,276 | 9.4% |
| Business | 1,697 | 12.5% |
| Education | 1,672 | 12.3% |
| Literature & Languages | 711 | 5.2% |
| Liberal Arts & History | 751 | 5.5% |
| Visual & Performing Arts | 770 | 5.7% |
| Communications | 420 | 3.1% |
| Arts & Humanities | 780 | 5.8% |
| Total | 13,573 | 100.0% |
Transportation & Commute in Josephine County
Vehicle Availability by Sex in Josephine County
The most prevalent vehicle ownership categories in Josephine County are males with 2 vehicles (6,212, accounting for 37.0%) and females with 2 vehicles (5,519, making up 38.9%).
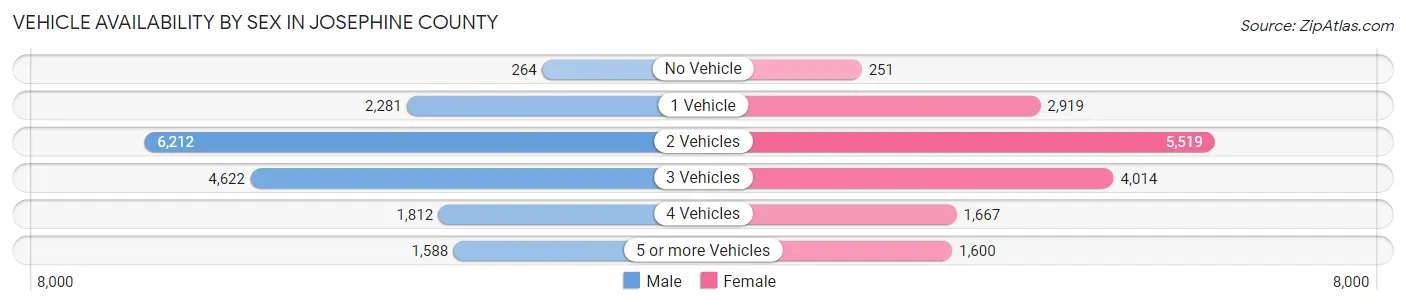
| Vehicles Available | Male | Female |
| No Vehicle | 264 (1.6%) | 251 (1.6%) |
| 1 Vehicle | 2,281 (13.6%) | 2,919 (18.3%) |
| 2 Vehicles | 6,212 (37.0%) | 5,519 (34.6%) |
| 3 Vehicles | 4,622 (27.6%) | 4,014 (25.1%) |
| 4 Vehicles | 1,812 (10.8%) | 1,667 (10.4%) |
| 5 or more Vehicles | 1,588 (9.5%) | 1,600 (10.0%) |
| Total | 16,779 (100.0%) | 15,970 (100.0%) |
Commute Time in Josephine County
The most frequently occuring commute durations in Josephine County are 15 to 19 minutes (5,667 commuters, 19.4%), 10 to 14 minutes (5,559 commuters, 19.0%), and 5 to 9 minutes (5,493 commuters, 18.8%).
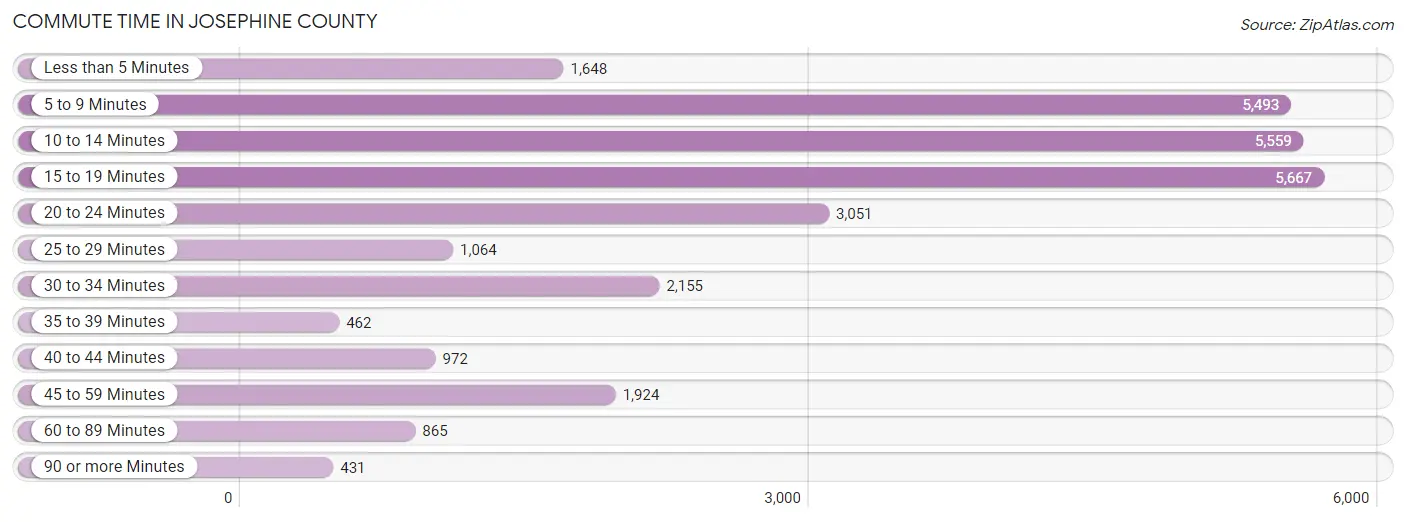
| Commute Time | # Commuters | % Commuters |
| Less than 5 Minutes | 1,648 | 5.6% |
| 5 to 9 Minutes | 5,493 | 18.8% |
| 10 to 14 Minutes | 5,559 | 19.0% |
| 15 to 19 Minutes | 5,667 | 19.4% |
| 20 to 24 Minutes | 3,051 | 10.4% |
| 25 to 29 Minutes | 1,064 | 3.6% |
| 30 to 34 Minutes | 2,155 | 7.4% |
| 35 to 39 Minutes | 462 | 1.6% |
| 40 to 44 Minutes | 972 | 3.3% |
| 45 to 59 Minutes | 1,924 | 6.6% |
| 60 to 89 Minutes | 865 | 2.9% |
| 90 or more Minutes | 431 | 1.5% |
Commute Time by Sex in Josephine County
The most common commute times in Josephine County are 10 to 14 minutes (2,988 commuters, 19.9%) for males and 5 to 9 minutes (3,234 commuters, 22.7%) for females.
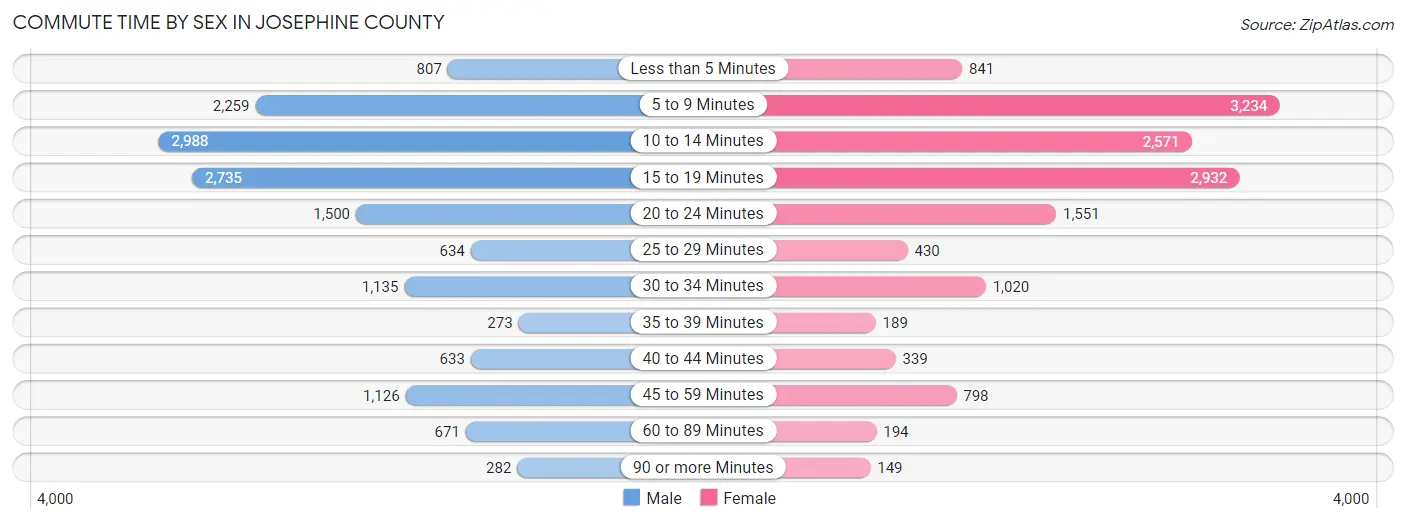
| Commute Time | Male | Female |
| Less than 5 Minutes | 807 (5.4%) | 841 (5.9%) |
| 5 to 9 Minutes | 2,259 (15.0%) | 3,234 (22.7%) |
| 10 to 14 Minutes | 2,988 (19.9%) | 2,571 (18.0%) |
| 15 to 19 Minutes | 2,735 (18.2%) | 2,932 (20.6%) |
| 20 to 24 Minutes | 1,500 (10.0%) | 1,551 (10.9%) |
| 25 to 29 Minutes | 634 (4.2%) | 430 (3.0%) |
| 30 to 34 Minutes | 1,135 (7.5%) | 1,020 (7.2%) |
| 35 to 39 Minutes | 273 (1.8%) | 189 (1.3%) |
| 40 to 44 Minutes | 633 (4.2%) | 339 (2.4%) |
| 45 to 59 Minutes | 1,126 (7.5%) | 798 (5.6%) |
| 60 to 89 Minutes | 671 (4.5%) | 194 (1.4%) |
| 90 or more Minutes | 282 (1.9%) | 149 (1.1%) |
Time of Departure to Work by Sex in Josephine County
The most frequent times of departure to work in Josephine County are 7:30 AM to 7:59 AM (2,186, 14.5%) for males and 7:30 AM to 7:59 AM (2,378, 16.7%) for females.
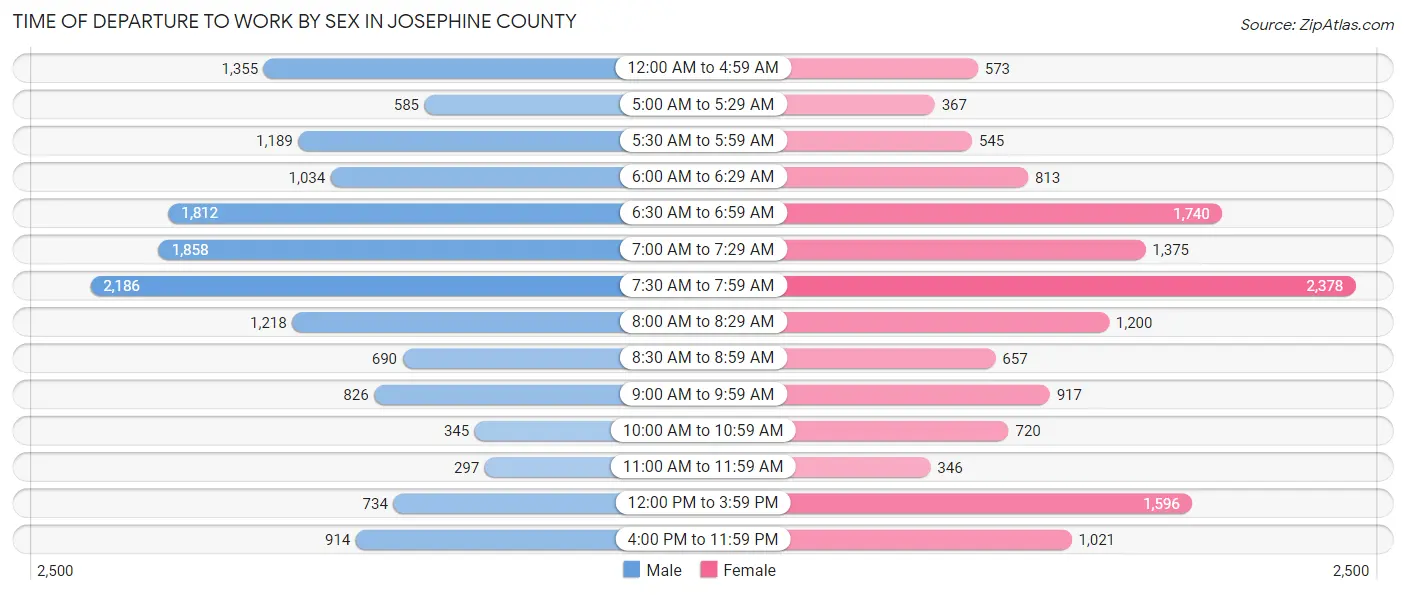
| Time of Departure | Male | Female |
| 12:00 AM to 4:59 AM | 1,355 (9.0%) | 573 (4.0%) |
| 5:00 AM to 5:29 AM | 585 (3.9%) | 367 (2.6%) |
| 5:30 AM to 5:59 AM | 1,189 (7.9%) | 545 (3.8%) |
| 6:00 AM to 6:29 AM | 1,034 (6.9%) | 813 (5.7%) |
| 6:30 AM to 6:59 AM | 1,812 (12.0%) | 1,740 (12.2%) |
| 7:00 AM to 7:29 AM | 1,858 (12.3%) | 1,375 (9.7%) |
| 7:30 AM to 7:59 AM | 2,186 (14.5%) | 2,378 (16.7%) |
| 8:00 AM to 8:29 AM | 1,218 (8.1%) | 1,200 (8.4%) |
| 8:30 AM to 8:59 AM | 690 (4.6%) | 657 (4.6%) |
| 9:00 AM to 9:59 AM | 826 (5.5%) | 917 (6.4%) |
| 10:00 AM to 10:59 AM | 345 (2.3%) | 720 (5.1%) |
| 11:00 AM to 11:59 AM | 297 (2.0%) | 346 (2.4%) |
| 12:00 PM to 3:59 PM | 734 (4.9%) | 1,596 (11.2%) |
| 4:00 PM to 11:59 PM | 914 (6.1%) | 1,021 (7.2%) |
| Total | 15,043 (100.0%) | 14,248 (100.0%) |
Housing Occupancy in Josephine County
Occupancy by Ownership in Josephine County
Of the total 36,210 dwellings in Josephine County, owner-occupied units account for 25,565 (70.6%), while renter-occupied units make up 10,645 (29.4%).
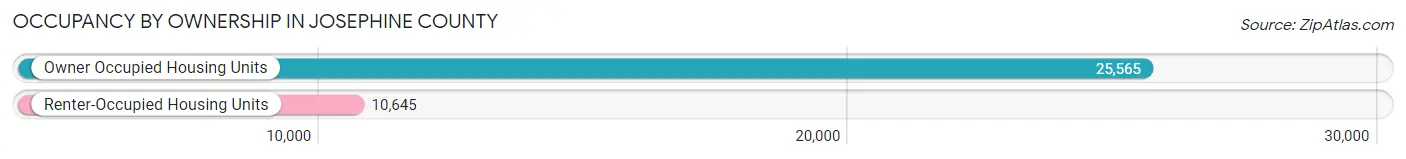
| Occupancy | # Housing Units | % Housing Units |
| Owner Occupied Housing Units | 25,565 | 70.6% |
| Renter-Occupied Housing Units | 10,645 | 29.4% |
| Total Occupied Housing Units | 36,210 | 100.0% |
Occupancy by Household Size in Josephine County
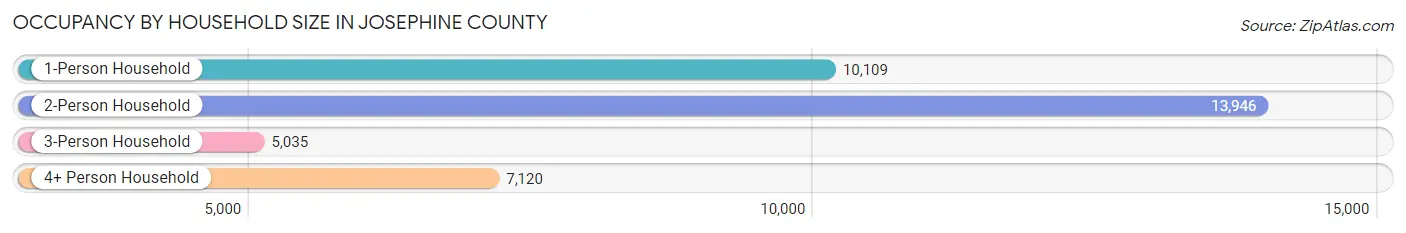
| Household Size | # Housing Units | % Housing Units |
| 1-Person Household | 10,109 | 27.9% |
| 2-Person Household | 13,946 | 38.5% |
| 3-Person Household | 5,035 | 13.9% |
| 4+ Person Household | 7,120 | 19.7% |
| Total Housing Units | 36,210 | 100.0% |
Occupancy by Ownership by Household Size in Josephine County
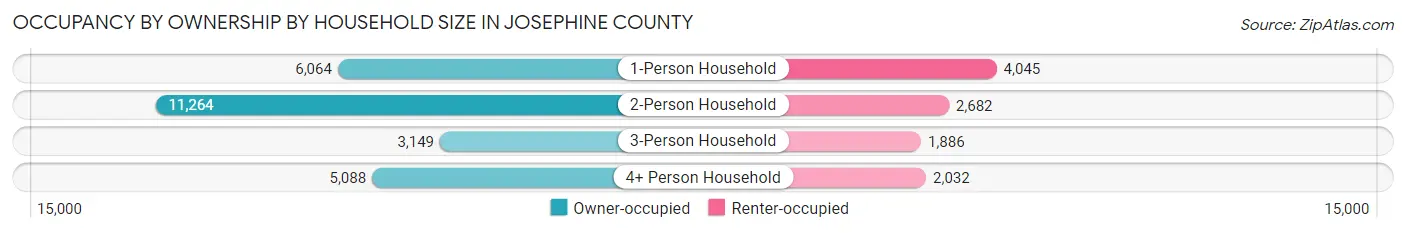
| Household Size | Owner-occupied | Renter-occupied |
| 1-Person Household | 6,064 (60.0%) | 4,045 (40.0%) |
| 2-Person Household | 11,264 (80.8%) | 2,682 (19.2%) |
| 3-Person Household | 3,149 (62.5%) | 1,886 (37.5%) |
| 4+ Person Household | 5,088 (71.5%) | 2,032 (28.5%) |
| Total Housing Units | 25,565 (70.6%) | 10,645 (29.4%) |
Occupancy by Educational Attainment in Josephine County
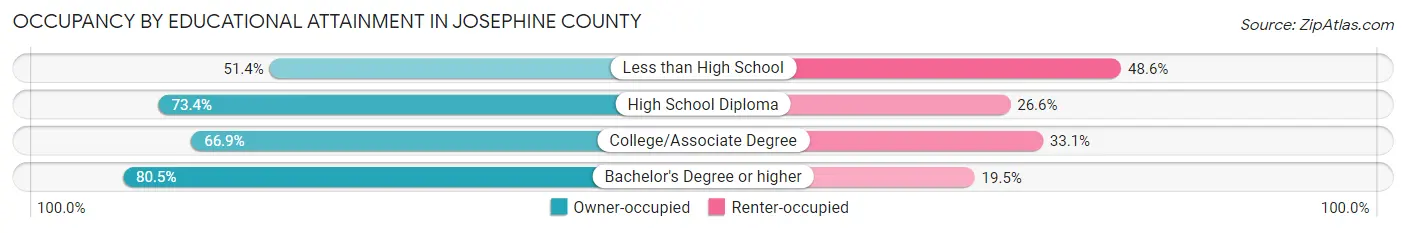
| Household Size | Owner-occupied | Renter-occupied |
| Less than High School | 1,258 (51.4%) | 1,188 (48.6%) |
| High School Diploma | 7,048 (73.4%) | 2,553 (26.6%) |
| College/Associate Degree | 10,813 (66.9%) | 5,340 (33.1%) |
| Bachelor's Degree or higher | 6,446 (80.5%) | 1,564 (19.5%) |
Occupancy by Age of Householder in Josephine County
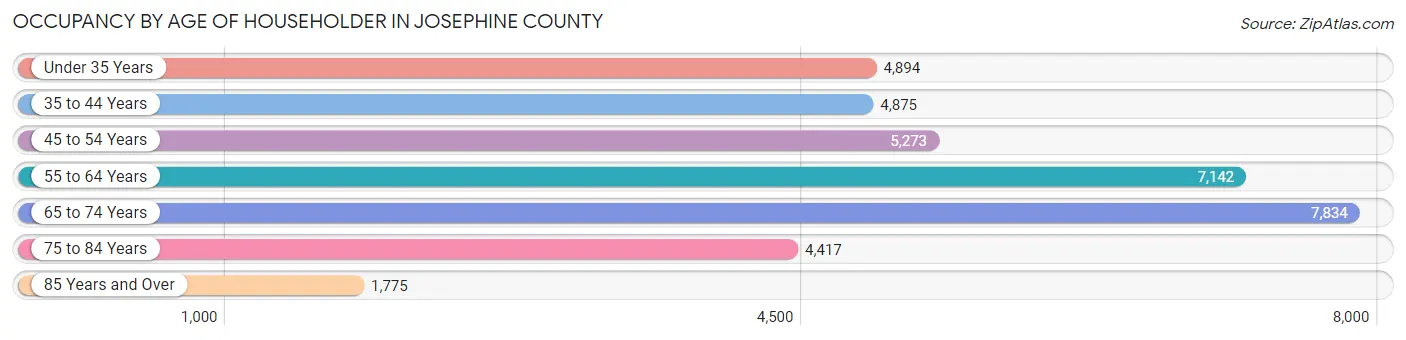
| Age Bracket | # Households | % Households |
| Under 35 Years | 4,894 | 13.5% |
| 35 to 44 Years | 4,875 | 13.5% |
| 45 to 54 Years | 5,273 | 14.6% |
| 55 to 64 Years | 7,142 | 19.7% |
| 65 to 74 Years | 7,834 | 21.6% |
| 75 to 84 Years | 4,417 | 12.2% |
| 85 Years and Over | 1,775 | 4.9% |
| Total | 36,210 | 100.0% |
Housing Finances in Josephine County
Median Income by Occupancy in Josephine County
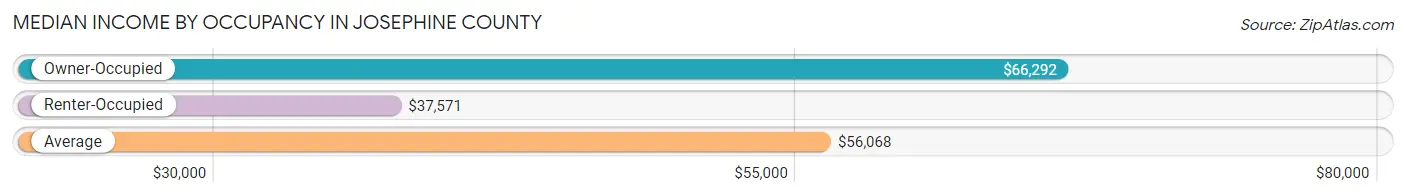
| Occupancy Type | # Households | Median Income |
| Owner-Occupied | 25,565 (70.6%) | $66,292 |
| Renter-Occupied | 10,645 (29.4%) | $37,571 |
| Average | 36,210 (100.0%) | $56,068 |
Occupancy by Householder Income Bracket in Josephine County
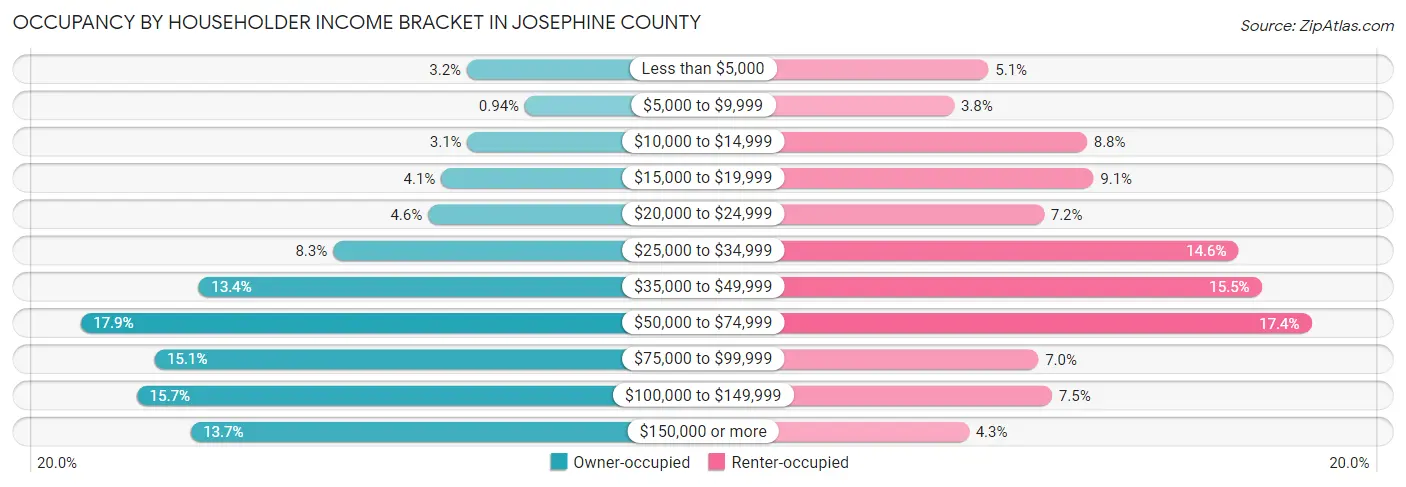
| Income Bracket | Owner-occupied | Renter-occupied |
| Less than $5,000 | 806 (3.2%) | 539 (5.1%) |
| $5,000 to $9,999 | 241 (0.9%) | 399 (3.7%) |
| $10,000 to $14,999 | 801 (3.1%) | 938 (8.8%) |
| $15,000 to $19,999 | 1,057 (4.1%) | 964 (9.1%) |
| $20,000 to $24,999 | 1,184 (4.6%) | 763 (7.2%) |
| $25,000 to $34,999 | 2,110 (8.3%) | 1,552 (14.6%) |
| $35,000 to $49,999 | 3,421 (13.4%) | 1,646 (15.5%) |
| $50,000 to $74,999 | 4,570 (17.9%) | 1,848 (17.4%) |
| $75,000 to $99,999 | 3,853 (15.1%) | 741 (7.0%) |
| $100,000 to $149,999 | 4,022 (15.7%) | 796 (7.5%) |
| $150,000 or more | 3,500 (13.7%) | 459 (4.3%) |
| Total | 25,565 (100.0%) | 10,645 (100.0%) |
Monthly Housing Cost Tiers in Josephine County
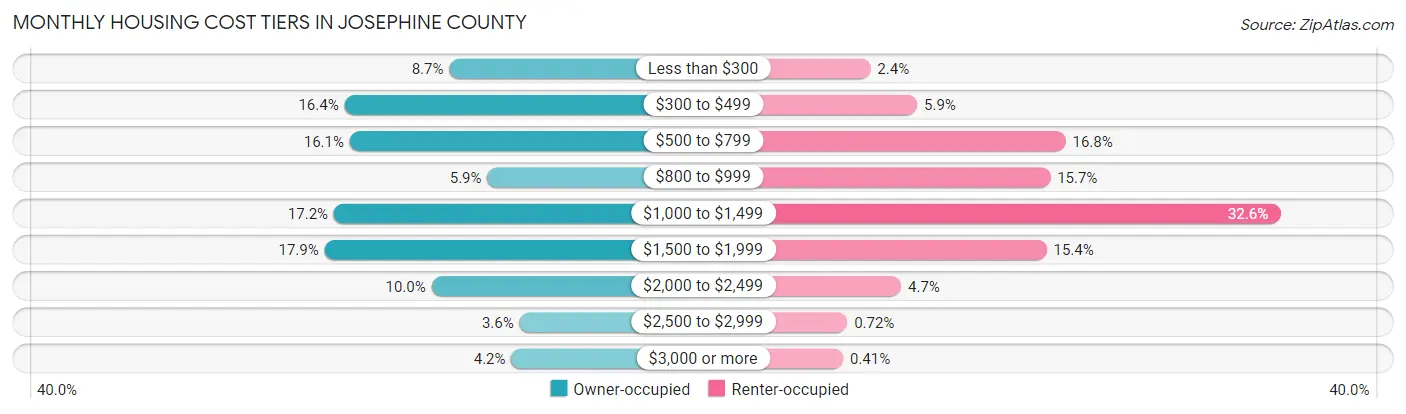
| Monthly Cost | Owner-occupied | Renter-occupied |
| Less than $300 | 2,229 (8.7%) | 259 (2.4%) |
| $300 to $499 | 4,204 (16.4%) | 625 (5.9%) |
| $500 to $799 | 4,104 (16.1%) | 1,788 (16.8%) |
| $800 to $999 | 1,513 (5.9%) | 1,668 (15.7%) |
| $1,000 to $1,499 | 4,403 (17.2%) | 3,469 (32.6%) |
| $1,500 to $1,999 | 4,578 (17.9%) | 1,639 (15.4%) |
| $2,000 to $2,499 | 2,564 (10.0%) | 499 (4.7%) |
| $2,500 to $2,999 | 908 (3.5%) | 77 (0.7%) |
| $3,000 or more | 1,062 (4.2%) | 44 (0.4%) |
| Total | 25,565 (100.0%) | 10,645 (100.0%) |
Physical Housing Characteristics in Josephine County
Housing Structures in Josephine County
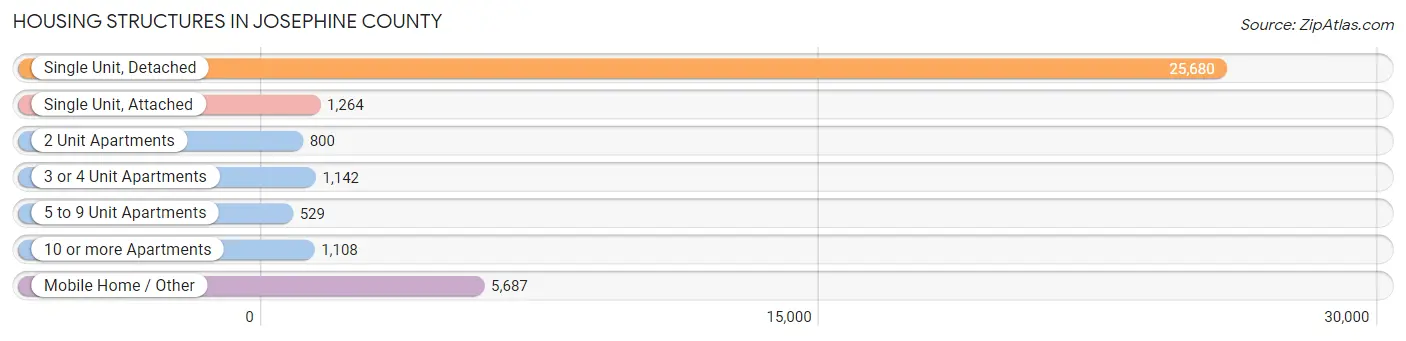
| Structure Type | # Housing Units | % Housing Units |
| Single Unit, Detached | 25,680 | 70.9% |
| Single Unit, Attached | 1,264 | 3.5% |
| 2 Unit Apartments | 800 | 2.2% |
| 3 or 4 Unit Apartments | 1,142 | 3.2% |
| 5 to 9 Unit Apartments | 529 | 1.5% |
| 10 or more Apartments | 1,108 | 3.1% |
| Mobile Home / Other | 5,687 | 15.7% |
| Total | 36,210 | 100.0% |
Housing Structures by Occupancy in Josephine County
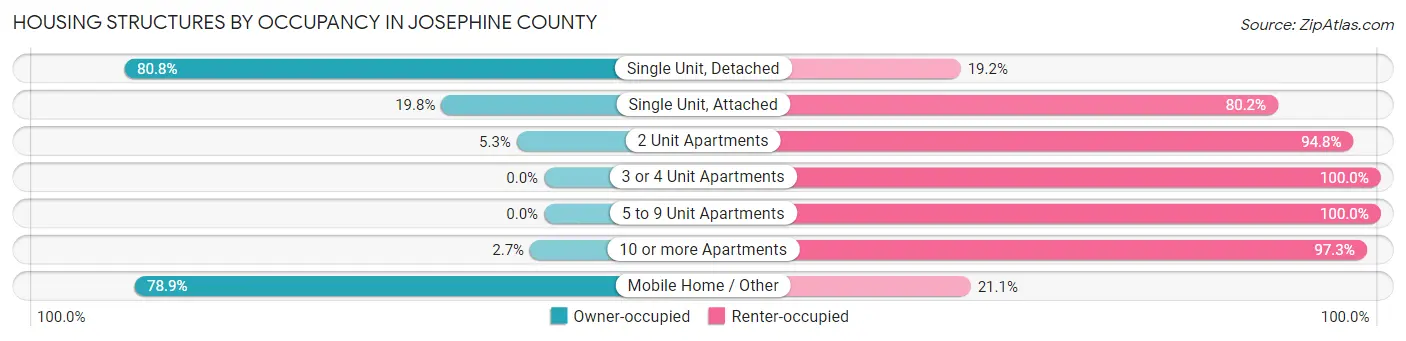
| Structure Type | Owner-occupied | Renter-occupied |
| Single Unit, Detached | 20,756 (80.8%) | 4,924 (19.2%) |
| Single Unit, Attached | 250 (19.8%) | 1,014 (80.2%) |
| 2 Unit Apartments | 42 (5.2%) | 758 (94.8%) |
| 3 or 4 Unit Apartments | 0 (0.0%) | 1,142 (100.0%) |
| 5 to 9 Unit Apartments | 0 (0.0%) | 529 (100.0%) |
| 10 or more Apartments | 30 (2.7%) | 1,078 (97.3%) |
| Mobile Home / Other | 4,487 (78.9%) | 1,200 (21.1%) |
| Total | 25,565 (70.6%) | 10,645 (29.4%) |
Housing Structures by Number of Rooms in Josephine County
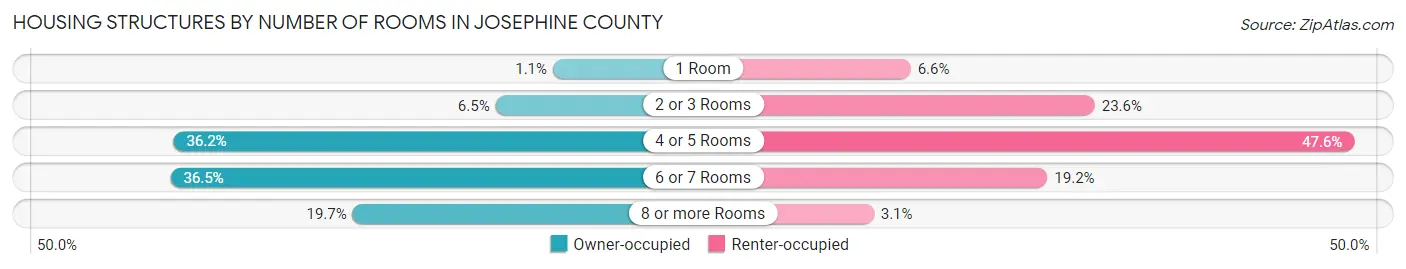
| Number of Rooms | Owner-occupied | Renter-occupied |
| 1 Room | 292 (1.1%) | 697 (6.6%) |
| 2 or 3 Rooms | 1,648 (6.5%) | 2,509 (23.6%) |
| 4 or 5 Rooms | 9,261 (36.2%) | 5,063 (47.6%) |
| 6 or 7 Rooms | 9,335 (36.5%) | 2,043 (19.2%) |
| 8 or more Rooms | 5,029 (19.7%) | 333 (3.1%) |
| Total | 25,565 (100.0%) | 10,645 (100.0%) |
Housing Structure by Heating Type in Josephine County
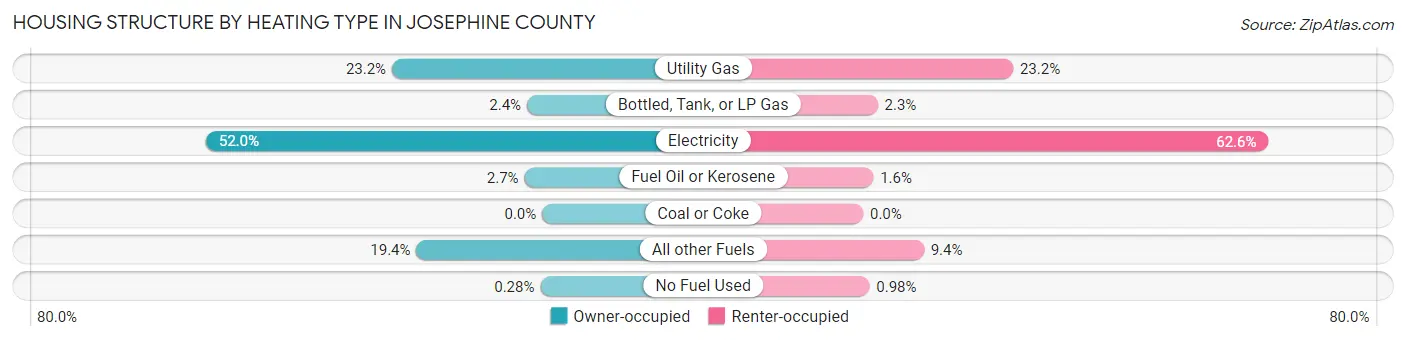
| Heating Type | Owner-occupied | Renter-occupied |
| Utility Gas | 5,934 (23.2%) | 2,468 (23.2%) |
| Bottled, Tank, or LP Gas | 602 (2.4%) | 240 (2.2%) |
| Electricity | 13,289 (52.0%) | 6,668 (62.6%) |
| Fuel Oil or Kerosene | 697 (2.7%) | 167 (1.6%) |
| Coal or Coke | 0 (0.0%) | 0 (0.0%) |
| All other Fuels | 4,971 (19.4%) | 998 (9.4%) |
| No Fuel Used | 72 (0.3%) | 104 (1.0%) |
| Total | 25,565 (100.0%) | 10,645 (100.0%) |
Household Vehicle Usage in Josephine County
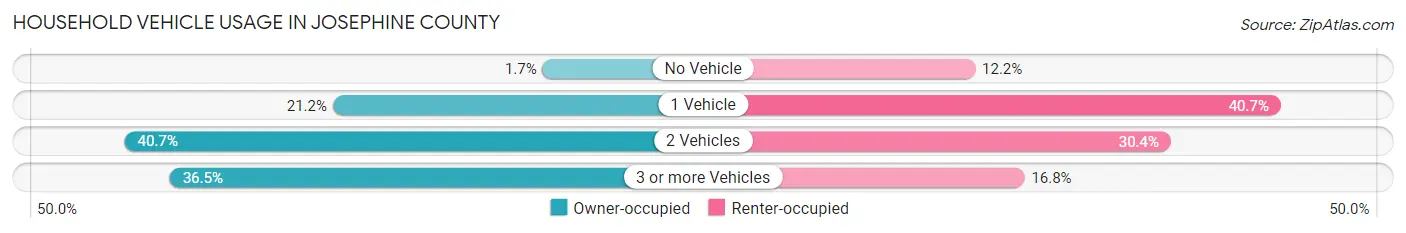
| Vehicles per Household | Owner-occupied | Renter-occupied |
| No Vehicle | 423 (1.7%) | 1,293 (12.1%) |
| 1 Vehicle | 5,427 (21.2%) | 4,330 (40.7%) |
| 2 Vehicles | 10,397 (40.7%) | 3,238 (30.4%) |
| 3 or more Vehicles | 9,318 (36.4%) | 1,784 (16.8%) |
| Total | 25,565 (100.0%) | 10,645 (100.0%) |
Real Estate & Mortgages in Josephine County
Real Estate and Mortgage Overview in Josephine County
| Characteristic | Without Mortgage | With Mortgage |
| Housing Units | 10,621 | 14,944 |
| Median Property Value | $335,300 | $363,400 |
| Median Household Income | $49,003 | $2,683 |
| Monthly Housing Costs | $451 | $1,053 |
| Real Estate Taxes | $1,798 | $271 |
Property Value by Mortgage Status in Josephine County
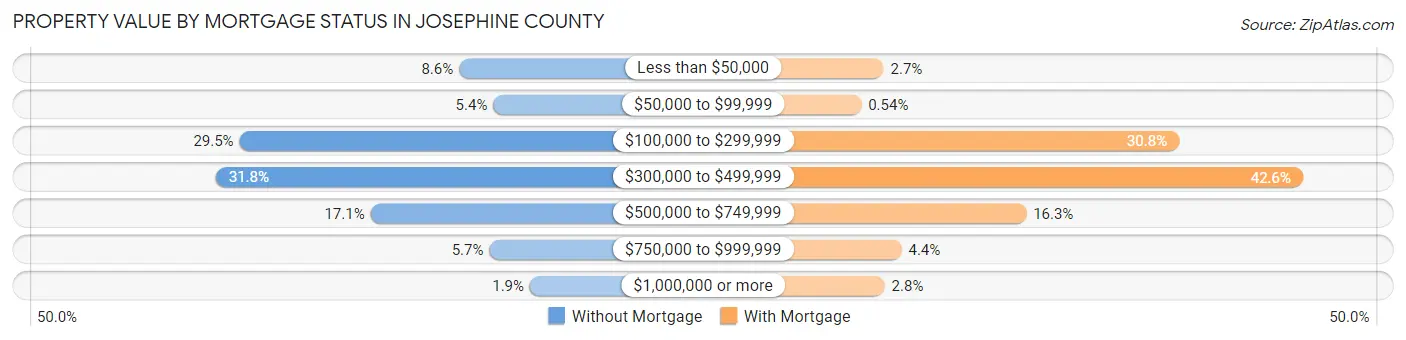
| Property Value | Without Mortgage | With Mortgage |
| Less than $50,000 | 916 (8.6%) | 399 (2.7%) |
| $50,000 to $99,999 | 570 (5.4%) | 80 (0.5%) |
| $100,000 to $299,999 | 3,137 (29.5%) | 4,603 (30.8%) |
| $300,000 to $499,999 | 3,376 (31.8%) | 6,365 (42.6%) |
| $500,000 to $749,999 | 1,812 (17.1%) | 2,428 (16.3%) |
| $750,000 to $999,999 | 610 (5.7%) | 655 (4.4%) |
| $1,000,000 or more | 200 (1.9%) | 414 (2.8%) |
| Total | 10,621 (100.0%) | 14,944 (100.0%) |
Household Income by Mortgage Status in Josephine County
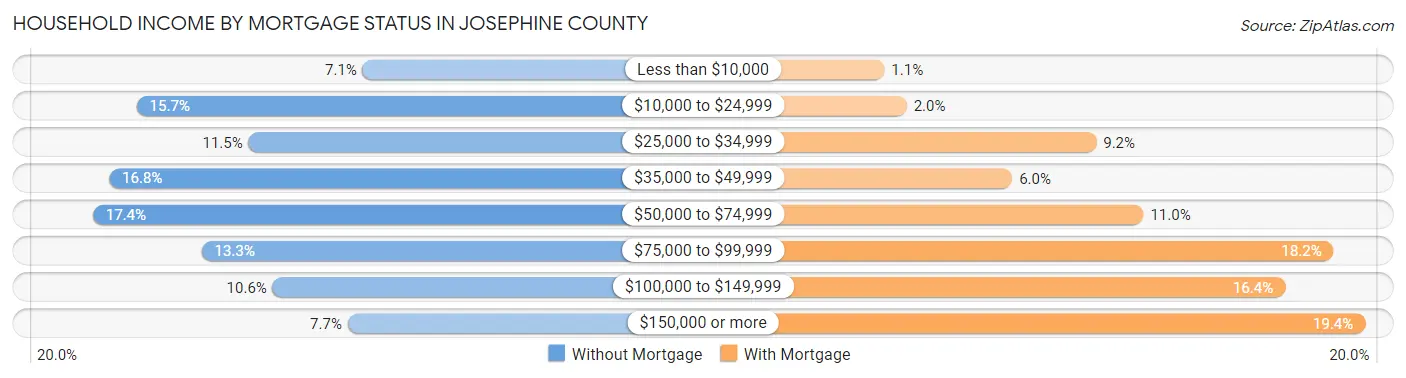
| Household Income | Without Mortgage | With Mortgage |
| Less than $10,000 | 756 (7.1%) | 164 (1.1%) |
| $10,000 to $24,999 | 1,671 (15.7%) | 291 (1.9%) |
| $25,000 to $34,999 | 1,218 (11.5%) | 1,371 (9.2%) |
| $35,000 to $49,999 | 1,782 (16.8%) | 892 (6.0%) |
| $50,000 to $74,999 | 1,848 (17.4%) | 1,639 (11.0%) |
| $75,000 to $99,999 | 1,408 (13.3%) | 2,722 (18.2%) |
| $100,000 to $149,999 | 1,121 (10.5%) | 2,445 (16.4%) |
| $150,000 or more | 817 (7.7%) | 2,901 (19.4%) |
| Total | 10,621 (100.0%) | 14,944 (100.0%) |
Property Value to Household Income Ratio in Josephine County
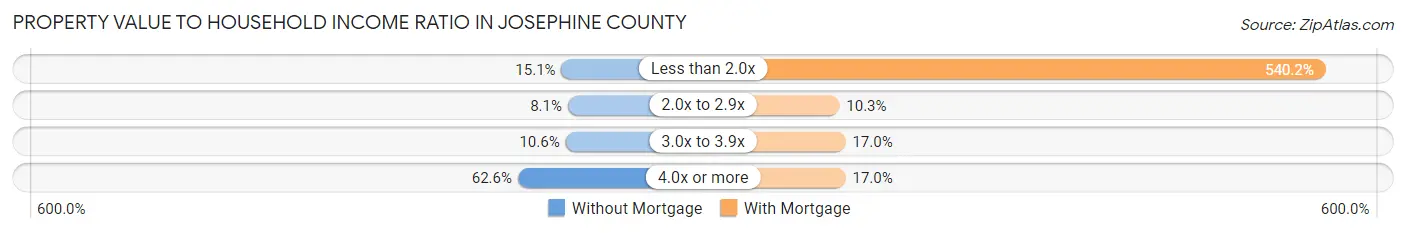
| Value-to-Income Ratio | Without Mortgage | With Mortgage |
| Less than 2.0x | 1,598 (15.0%) | 80,730 (540.2%) |
| 2.0x to 2.9x | 856 (8.1%) | 1,534 (10.3%) |
| 3.0x to 3.9x | 1,130 (10.6%) | 2,536 (17.0%) |
| 4.0x or more | 6,649 (62.6%) | 2,546 (17.0%) |
| Total | 10,621 (100.0%) | 14,944 (100.0%) |
Real Estate Taxes by Mortgage Status in Josephine County
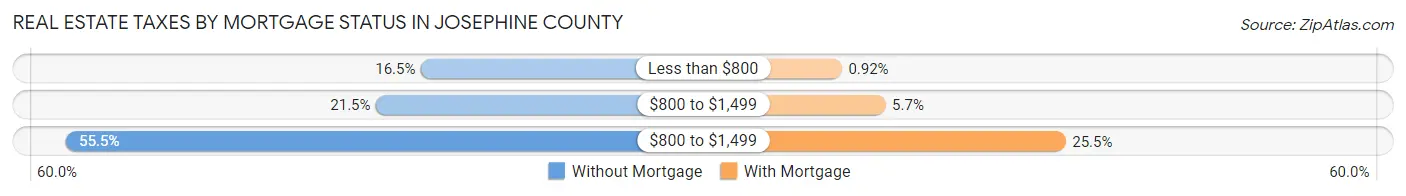
| Property Taxes | Without Mortgage | With Mortgage |
| Less than $800 | 1,756 (16.5%) | 137 (0.9%) |
| $800 to $1,499 | 2,278 (21.4%) | 853 (5.7%) |
| $800 to $1,499 | 5,889 (55.4%) | 3,803 (25.5%) |
| Total | 10,621 (100.0%) | 14,944 (100.0%) |
Health & Disability in Josephine County
Health Insurance Coverage by Age in Josephine County
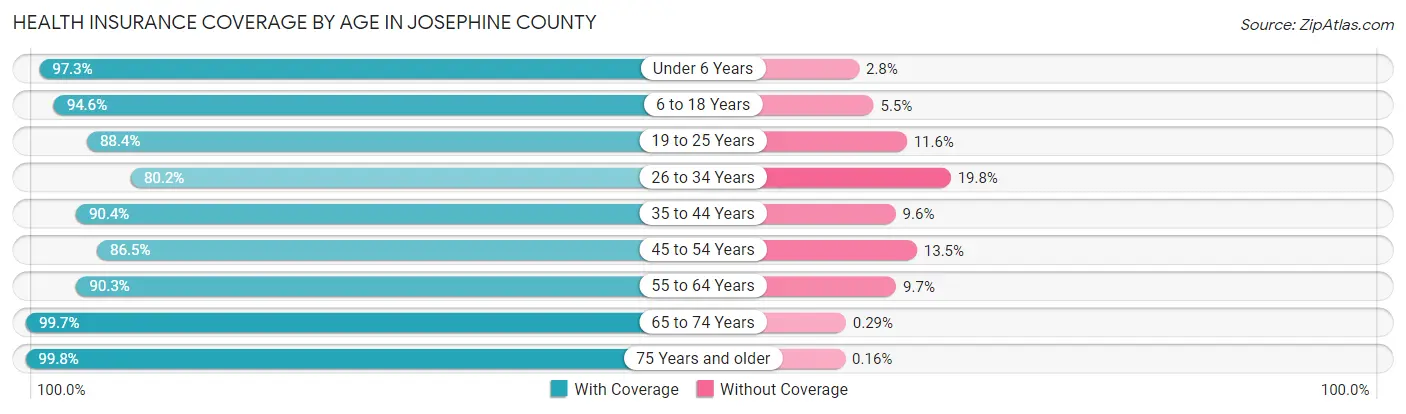
| Age Bracket | With Coverage | Without Coverage |
| Under 6 Years | 4,777 (97.3%) | 135 (2.8%) |
| 6 to 18 Years | 12,195 (94.6%) | 703 (5.4%) |
| 19 to 25 Years | 4,692 (88.4%) | 618 (11.6%) |
| 26 to 34 Years | 6,971 (80.2%) | 1,725 (19.8%) |
| 35 to 44 Years | 8,776 (90.4%) | 930 (9.6%) |
| 45 to 54 Years | 8,401 (86.5%) | 1,315 (13.5%) |
| 55 to 64 Years | 11,766 (90.3%) | 1,260 (9.7%) |
| 65 to 74 Years | 13,384 (99.7%) | 39 (0.3%) |
| 75 Years and older | 9,611 (99.8%) | 15 (0.2%) |
| Total | 80,573 (92.3%) | 6,740 (7.7%) |
Health Insurance Coverage by Citizenship Status in Josephine County
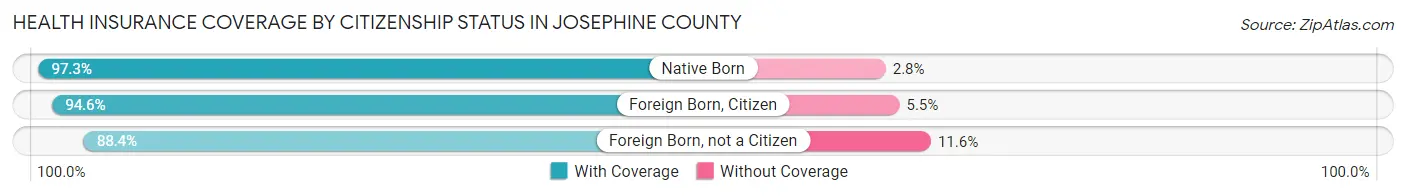
| Citizenship Status | With Coverage | Without Coverage |
| Native Born | 4,777 (97.3%) | 135 (2.8%) |
| Foreign Born, Citizen | 12,195 (94.6%) | 703 (5.4%) |
| Foreign Born, not a Citizen | 4,692 (88.4%) | 618 (11.6%) |
Health Insurance Coverage by Household Income in Josephine County
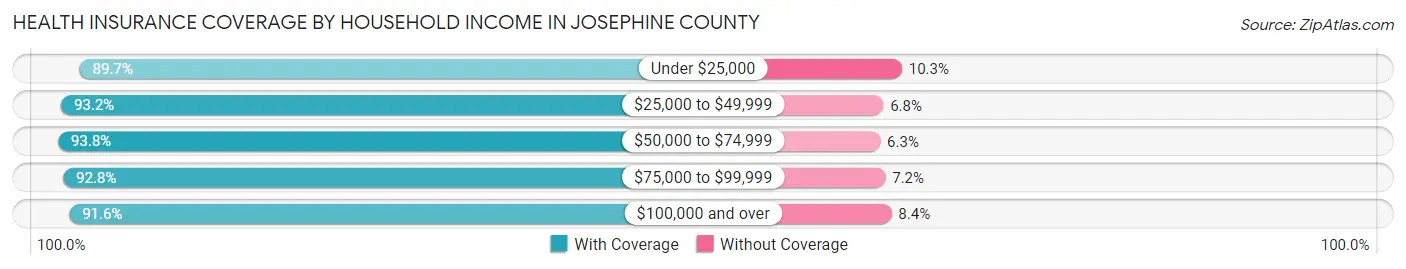
| Household Income | With Coverage | Without Coverage |
| Under $25,000 | 11,087 (89.7%) | 1,273 (10.3%) |
| $25,000 to $49,999 | 17,477 (93.2%) | 1,280 (6.8%) |
| $50,000 to $74,999 | 15,468 (93.8%) | 1,032 (6.2%) |
| $75,000 to $99,999 | 11,317 (92.8%) | 880 (7.2%) |
| $100,000 and over | 24,578 (91.6%) | 2,242 (8.4%) |
Public vs Private Health Insurance Coverage by Age in Josephine County
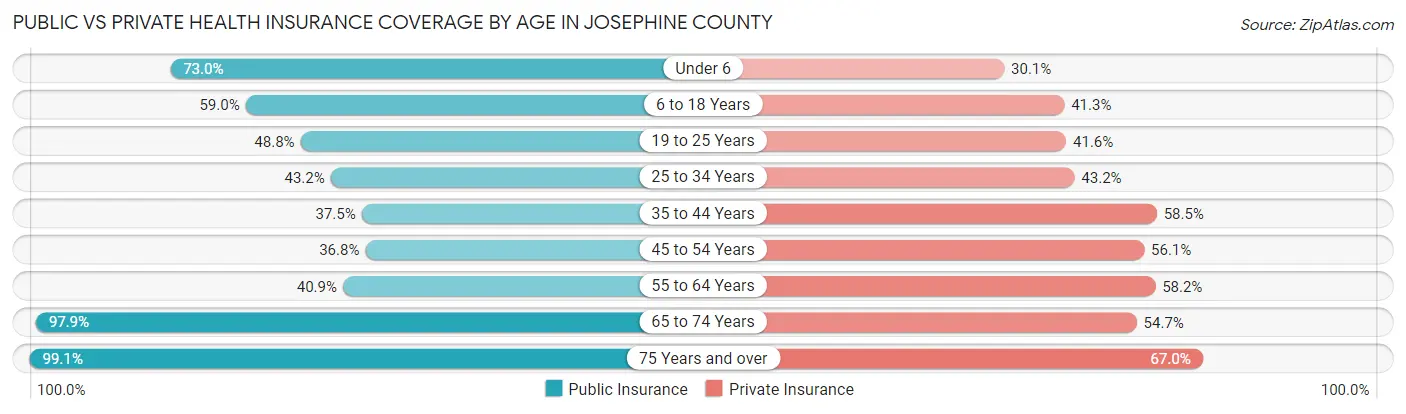
| Age Bracket | Public Insurance | Private Insurance |
| Under 6 | 3,584 (73.0%) | 1,480 (30.1%) |
| 6 to 18 Years | 7,610 (59.0%) | 5,325 (41.3%) |
| 19 to 25 Years | 2,592 (48.8%) | 2,211 (41.6%) |
| 25 to 34 Years | 3,758 (43.2%) | 3,755 (43.2%) |
| 35 to 44 Years | 3,636 (37.5%) | 5,673 (58.5%) |
| 45 to 54 Years | 3,573 (36.8%) | 5,452 (56.1%) |
| 55 to 64 Years | 5,331 (40.9%) | 7,577 (58.2%) |
| 65 to 74 Years | 13,144 (97.9%) | 7,346 (54.7%) |
| 75 Years and over | 9,538 (99.1%) | 6,447 (67.0%) |
| Total | 52,766 (60.4%) | 45,266 (51.8%) |
Disability Status by Sex by Age in Josephine County
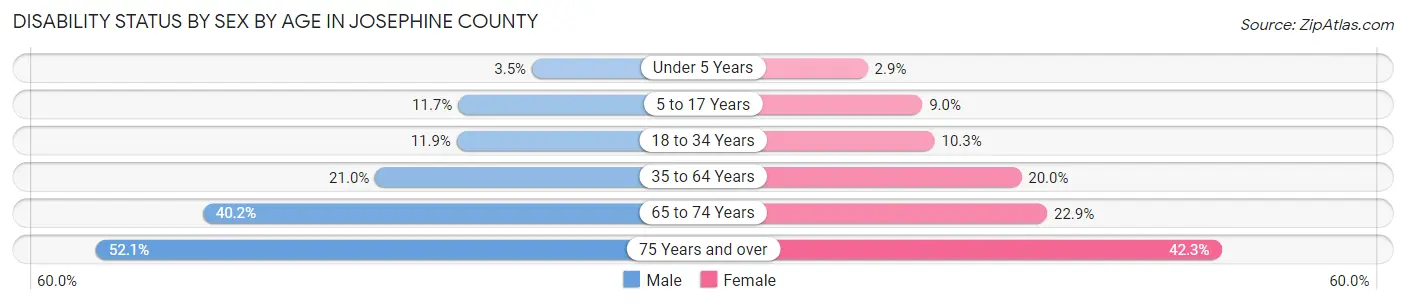
| Age Bracket | Male | Female |
| Under 5 Years | 72 (3.5%) | 59 (2.9%) |
| 5 to 17 Years | 753 (11.7%) | 557 (9.0%) |
| 18 to 34 Years | 919 (11.9%) | 758 (10.3%) |
| 35 to 64 Years | 3,315 (21.0%) | 3,325 (20.0%) |
| 65 to 74 Years | 2,532 (40.2%) | 1,627 (22.9%) |
| 75 Years and over | 2,232 (52.1%) | 2,257 (42.3%) |
Disability Class by Sex by Age in Josephine County
Disability Class: Hearing Difficulty
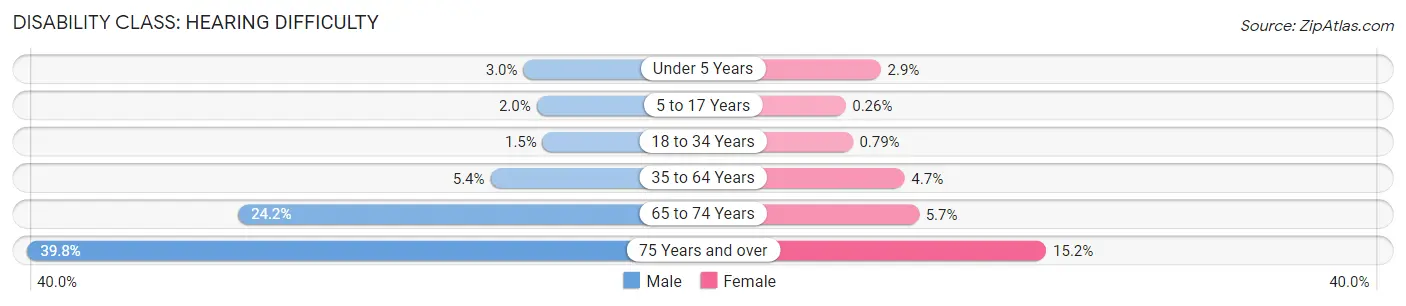
| Age Bracket | Male | Female |
| Under 5 Years | 61 (3.0%) | 59 (2.9%) |
| 5 to 17 Years | 128 (2.0%) | 16 (0.3%) |
| 18 to 34 Years | 119 (1.5%) | 58 (0.8%) |
| 35 to 64 Years | 857 (5.4%) | 774 (4.6%) |
| 65 to 74 Years | 1,523 (24.1%) | 406 (5.7%) |
| 75 Years and over | 1,706 (39.8%) | 810 (15.2%) |
Disability Class: Vision Difficulty
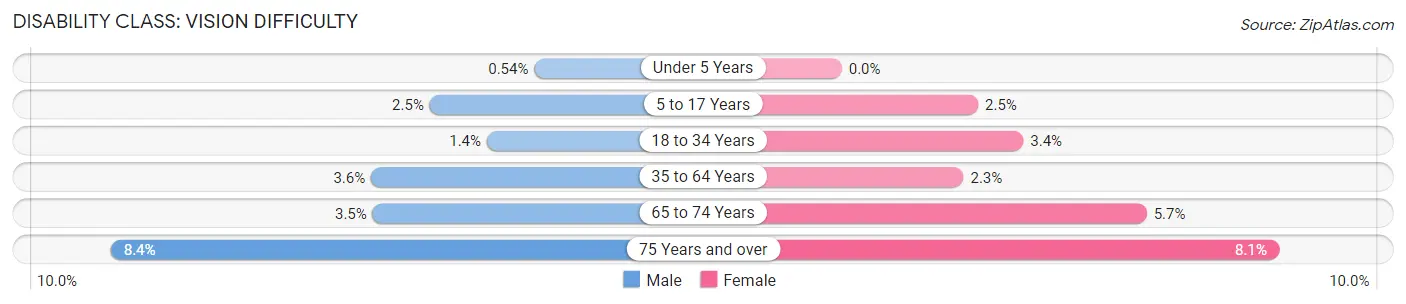
| Age Bracket | Male | Female |
| Under 5 Years | 11 (0.5%) | 0 (0.0%) |
| 5 to 17 Years | 159 (2.5%) | 157 (2.5%) |
| 18 to 34 Years | 110 (1.4%) | 247 (3.4%) |
| 35 to 64 Years | 565 (3.6%) | 376 (2.3%) |
| 65 to 74 Years | 223 (3.5%) | 403 (5.7%) |
| 75 Years and over | 360 (8.4%) | 433 (8.1%) |
Disability Class: Cognitive Difficulty
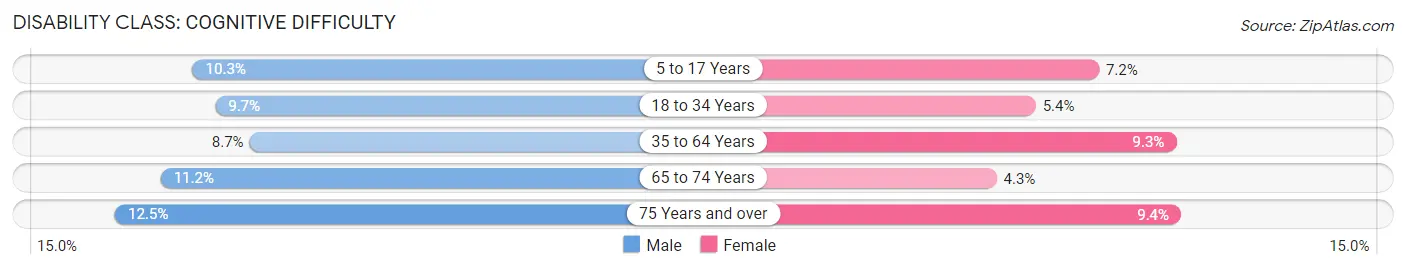
| Age Bracket | Male | Female |
| 5 to 17 Years | 663 (10.3%) | 445 (7.2%) |
| 18 to 34 Years | 750 (9.7%) | 396 (5.4%) |
| 35 to 64 Years | 1,382 (8.7%) | 1,548 (9.3%) |
| 65 to 74 Years | 707 (11.2%) | 307 (4.3%) |
| 75 Years and over | 535 (12.5%) | 504 (9.4%) |
Disability Class: Ambulatory Difficulty
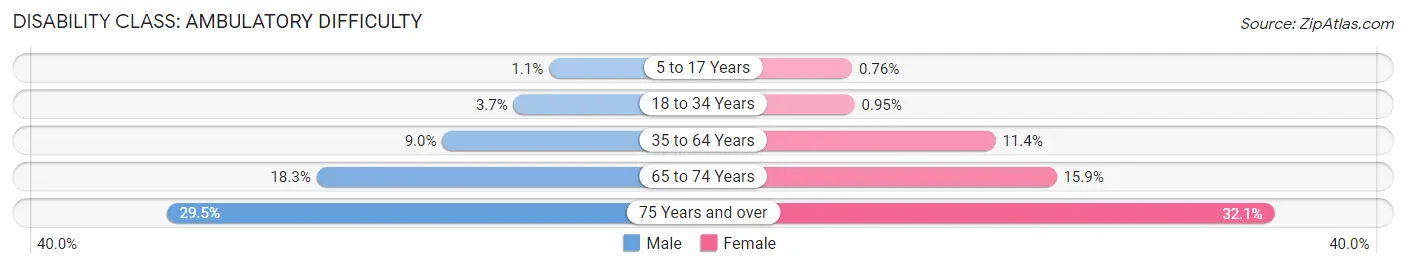
| Age Bracket | Male | Female |
| 5 to 17 Years | 68 (1.1%) | 47 (0.8%) |
| 18 to 34 Years | 286 (3.7%) | 70 (0.9%) |
| 35 to 64 Years | 1,421 (9.0%) | 1,898 (11.4%) |
| 65 to 74 Years | 1,156 (18.3%) | 1,134 (15.9%) |
| 75 Years and over | 1,263 (29.5%) | 1,715 (32.1%) |
Disability Class: Self-Care Difficulty
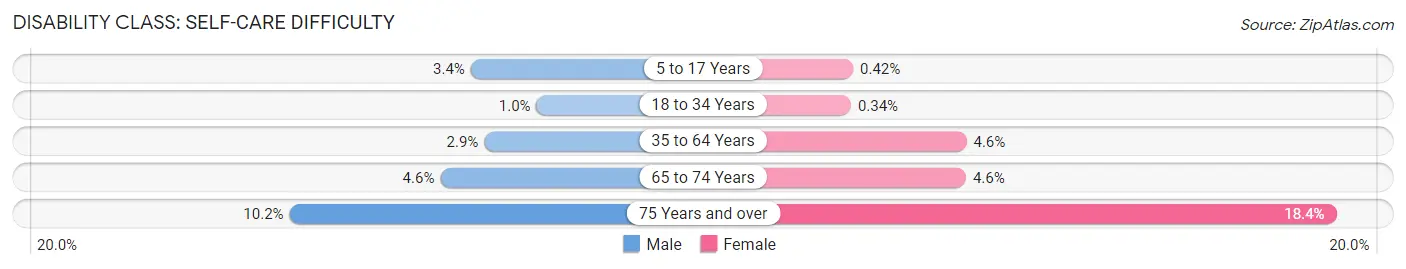
| Age Bracket | Male | Female |
| 5 to 17 Years | 221 (3.4%) | 26 (0.4%) |
| 18 to 34 Years | 77 (1.0%) | 25 (0.3%) |
| 35 to 64 Years | 465 (2.9%) | 770 (4.6%) |
| 65 to 74 Years | 288 (4.6%) | 328 (4.6%) |
| 75 Years and over | 436 (10.2%) | 980 (18.4%) |
Technology Access in Josephine County
Computing Device Access in Josephine County
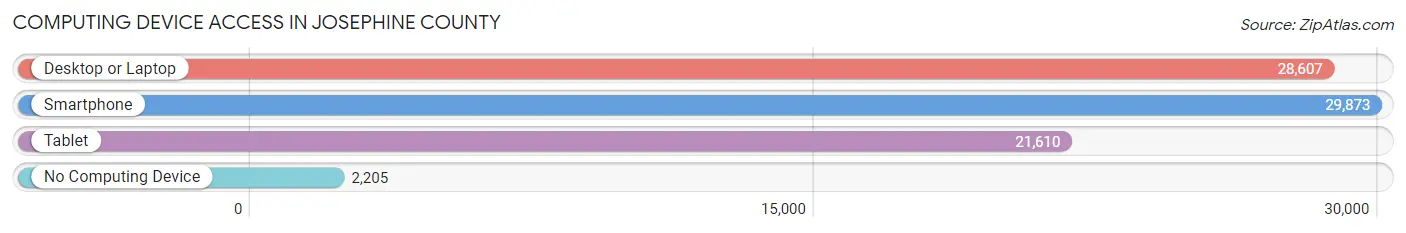
| Device Type | # Households | % Households |
| Desktop or Laptop | 28,607 | 79.0% |
| Smartphone | 29,873 | 82.5% |
| Tablet | 21,610 | 59.7% |
| No Computing Device | 2,205 | 6.1% |
| Total | 36,210 | 100.0% |
Internet Access in Josephine County
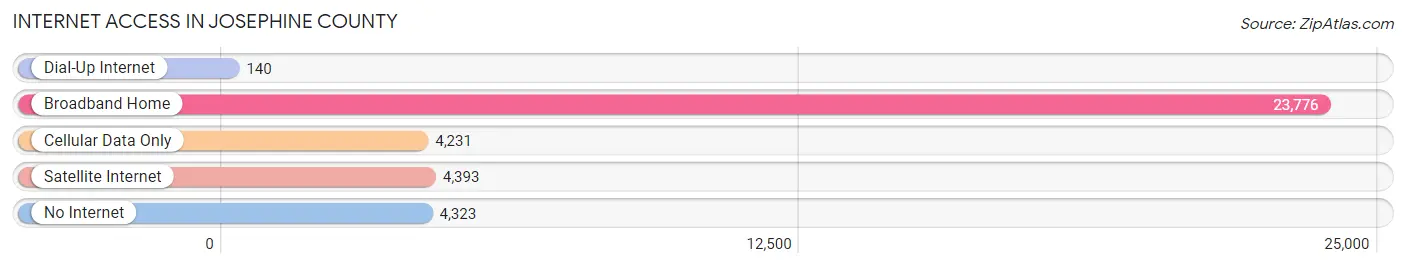
| Internet Type | # Households | % Households |
| Dial-Up Internet | 140 | 0.4% |
| Broadband Home | 23,776 | 65.7% |
| Cellular Data Only | 4,231 | 11.7% |
| Satellite Internet | 4,393 | 12.1% |
| No Internet | 4,323 | 11.9% |
| Total | 36,210 | 100.0% |
Josephine County Summary
Josephine County is located in the southwestern corner of Oregon, and is bordered by Curry County to the west, Jackson County to the north, and California to the south. The county is named after Josephine Rollins, the daughter of an early settler. The county seat is Grants Pass, and the largest city is Cave Junction.
Geography
Josephine County covers an area of 2,621 square miles, making it the fifth largest county in Oregon. The county is located in the Klamath Mountains region of the state, and is characterized by rugged terrain and steep canyons. The highest point in the county is Red Mountain, which has an elevation of 4,912 feet. The county is home to several rivers, including the Rogue, Illinois, and Applegate.
The climate of Josephine County is generally mild, with warm summers and cool winters. The average annual temperature is around 50 degrees Fahrenheit. The county receives an average of 40 inches of precipitation per year, with most of it falling in the winter months.
Economy
Josephine County has a diverse economy, with a mix of agriculture, manufacturing, and tourism. Agriculture is the largest sector of the economy, with the county producing a variety of crops, including hay, potatoes, and apples. The county is also home to several wineries and vineyards.
Manufacturing is another important sector of the economy, with the county home to several factories that produce wood products, electronics, and automotive parts. Tourism is also an important part of the economy, with the county home to several popular attractions, including the Oregon Caves National Monument and the Rogue River.
Demographics
As of the 2010 census, Josephine County had a population of 82,713. The population is fairly evenly split between men and women, with 50.3% male and 49.7% female. The median age of the population is 43.7 years.
The racial makeup of the county is 87.3% White, 1.3% African American, 1.2% Native American, 1.2% Asian, 0.2% Pacific Islander, and 8.8% from other races. The largest ancestry groups in the county are German (25.3%), English (17.2%), Irish (14.2%), and American (10.2%).
The median household income in Josephine County is $41,945, and the median family income is $50,945. The county has a poverty rate of 16.3%, and the unemployment rate is 8.2%.
Conclusion
Josephine County is a diverse and vibrant county located in the southwestern corner of Oregon. The county is home to a mix of agriculture, manufacturing, and tourism, and has a population of 82,713. The county is characterized by rugged terrain and steep canyons, and has a mild climate with warm summers and cool winters. The median household income in the county is $41,945, and the unemployment rate is 8.2%.
Common Questions
What is the Total Population of Josephine County?
Total Population of Josephine County is 87,994.
What is the Total Male Population of Josephine County?
Total Male Population of Josephine County is 43,101.
What is the Total Female Population of Josephine County?
Total Female Population of Josephine County is 44,893.
What is the Ratio of Males per 100 Females in Josephine County?
There are 96.01 Males per 100 Females in Josephine County.
What is the Ratio of Females per 100 Males in Josephine County?
There are 104.16 Females per 100 Males in Josephine County.
What is the Median Population Age in Josephine County?
Median Population Age in Josephine County is 47.4 Years.
What is the Average Family Size in Josephine County
Average Family Size in Josephine County is 2.9 People.
What is the Average Household Size in Josephine County
Average Household Size in Josephine County is 2.4 People.
What is Per Capita Income in Josephine County?
Per Capita income in Josephine County is $32,159.
What is the Median Family Income in Josephine County?
Median Family Income in Josephine County is $66,158.
What is the Median Household income in Josephine County?
Median Household Income in Josephine County is $56,068.
What is Income or Wage Gap in Josephine County?
Income or Wage Gap in Josephine County is 27.4%.
Women in Josephine County earn 72.6 cents for every dollar earned by a man.
What is Family Income Deficit in Josephine County?
Family Income Deficit in Josephine County is $10,553.
Families that are below poverty line in Josephine County earn $10,553 less on average than the poverty threshold level.
What is Inequality or Gini Index in Josephine County?
Inequality or Gini Index in Josephine County is 0.47.
How Large is the Labor Force in Josephine County?
There are 36,426 People in the Labor Forcein in Josephine County.
What is the Percentage of People in the Labor Force in Josephine County?
49.7% of People are in the Labor Force in Josephine County.
What is the Unemployment Rate in Josephine County?
Unemployment Rate in Josephine County is 8.1%.