Jackson County, OR
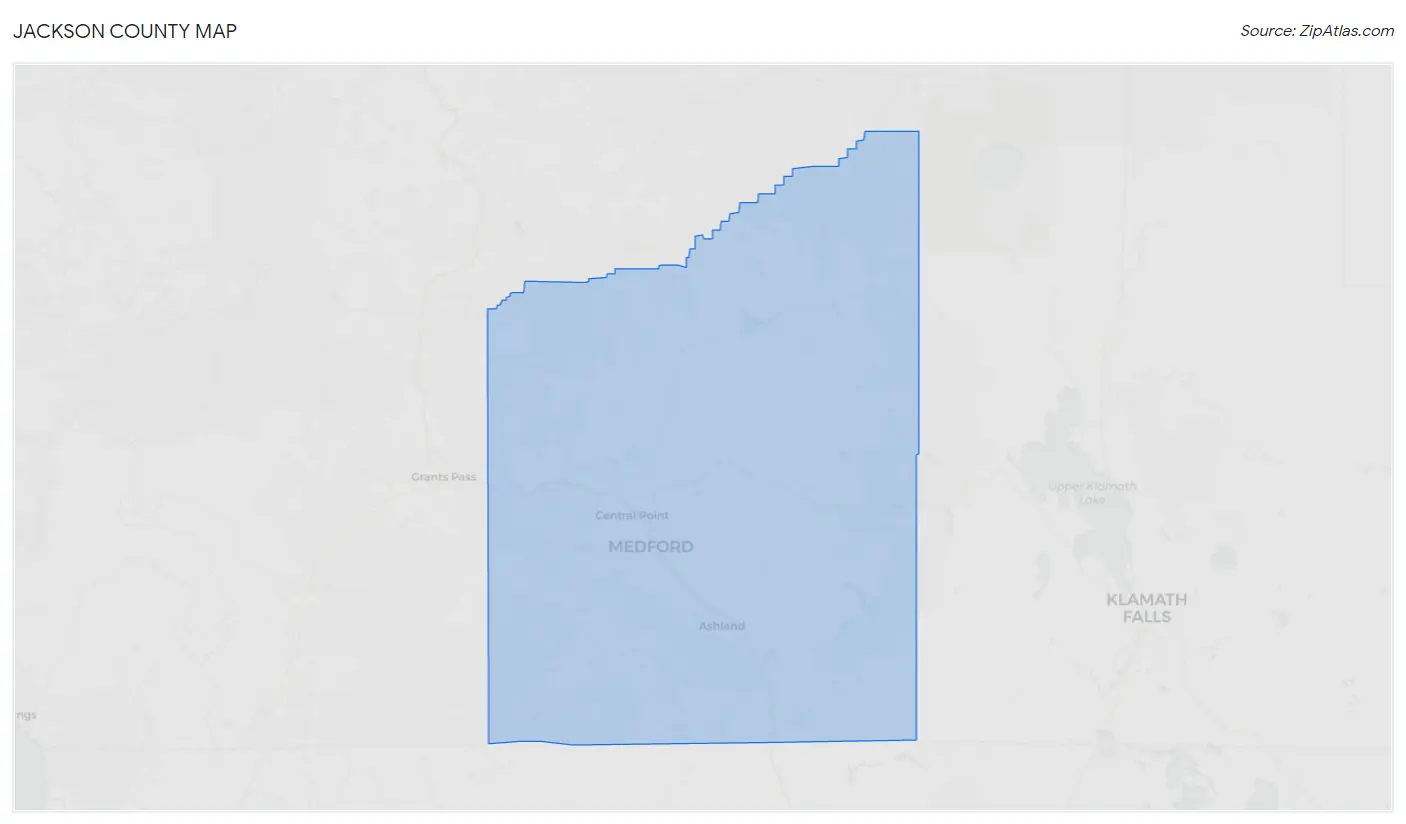
Jackson County Map
Jackson County Overview
222,604
TOTAL POPULATION
109,360
MALE POPULATION
113,244
FEMALE POPULATION
96.57
MALES / 100 FEMALES
103.55
FEMALES / 100 MALES
42.3
MEDIAN AGE
3.0
AVG FAMILY SIZE
2.4
AVG HOUSEHOLD SIZE
$36,538
PER CAPITA INCOME
$83,081
AVG FAMILY INCOME
$67,690
AVG HOUSEHOLD INCOME
26.4%
WAGE / INCOME GAP [ % ]
73.6¢/ $1
WAGE / INCOME GAP [ $ ]
$10,195
FAMILY INCOME DEFICIT
0.46
INEQUALITY / GINI INDEX
105,066
LABOR FORCE [ PEOPLE ]
57.6%
PERCENT IN LABOR FORCE
5.5%
UNEMPLOYMENT RATE
Race in Jackson County
The most populous races in Jackson County are White / Caucasian (189,637 | 85.2%), Hispanic or Latino (31,198 | 14.0%), and Two or more Races (18,742 | 8.4%).
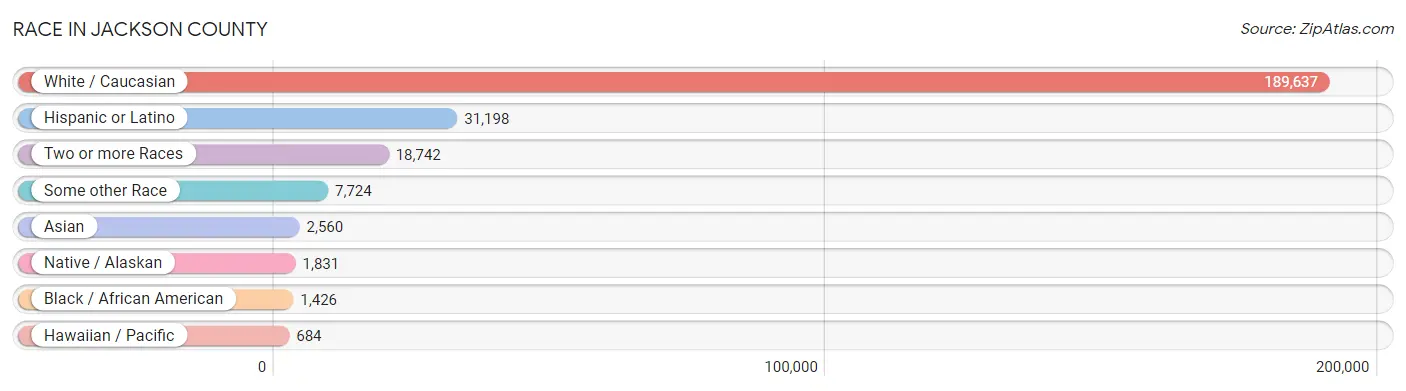
| Race | # Population | % Population |
| Asian | 2,560 | 1.1% |
| Black / African American | 1,426 | 0.6% |
| Hawaiian / Pacific | 684 | 0.3% |
| Hispanic or Latino | 31,198 | 14.0% |
| Native / Alaskan | 1,831 | 0.8% |
| White / Caucasian | 189,637 | 85.2% |
| Two or more Races | 18,742 | 8.4% |
| Some other Race | 7,724 | 3.5% |
| Total | 222,604 | 100.0% |
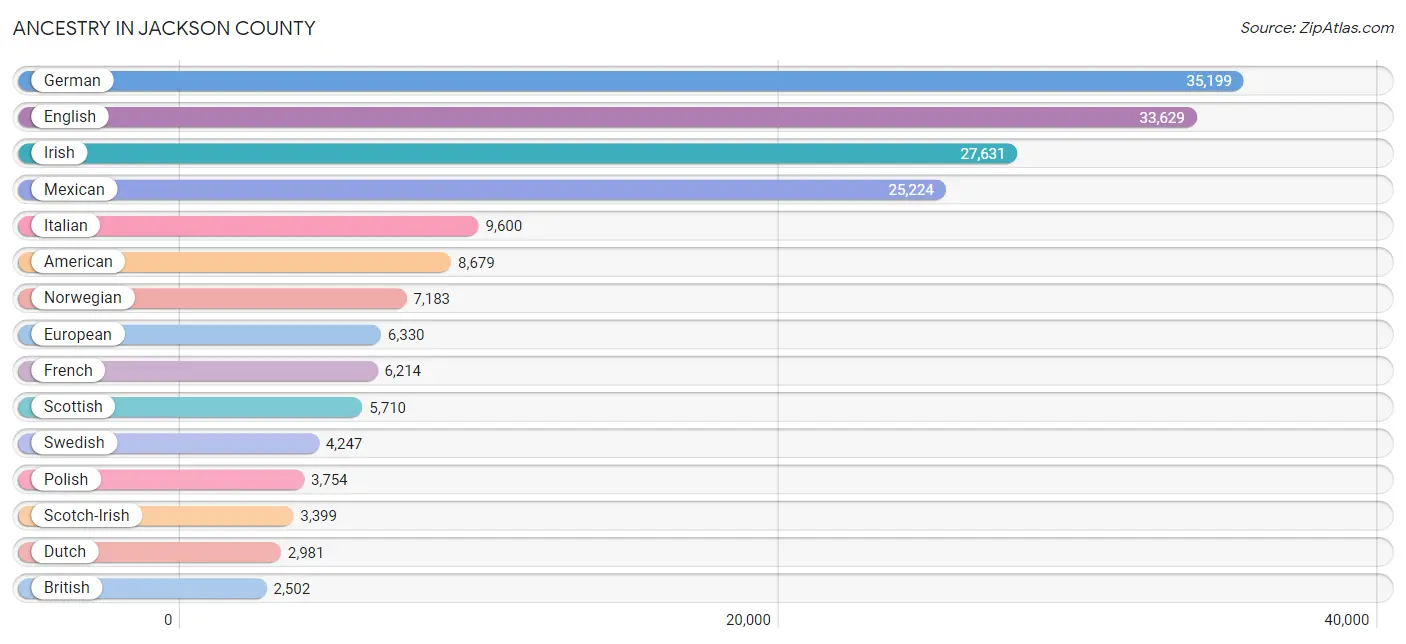
Ancestry in Jackson County
The most populous ancestries reported in Jackson County are German (35,199 | 15.8%), English (33,629 | 15.1%), Irish (27,631 | 12.4%), Mexican (25,224 | 11.3%), and Italian (9,600 | 4.3%), together accounting for 59.0% of all Jackson County residents.
| Ancestry | # Population | % Population |
| Afghan | 56 | 0.0% |
| African | 398 | 0.2% |
| Alaska Native | 146 | 0.1% |
| Alsatian | 13 | 0.0% |
| American | 8,679 | 3.9% |
| Apache | 268 | 0.1% |
| Arab | 321 | 0.1% |
| Argentinean | 54 | 0.0% |
| Armenian | 172 | 0.1% |
| Australian | 72 | 0.0% |
| Austrian | 681 | 0.3% |
| Basque | 98 | 0.0% |
| Belgian | 163 | 0.1% |
| Belizean | 15 | 0.0% |
| Bhutanese | 1,240 | 0.6% |
| Blackfeet | 360 | 0.2% |
| Brazilian | 208 | 0.1% |
| British | 2,502 | 1.1% |
| British West Indian | 54 | 0.0% |
| Bulgarian | 6 | 0.0% |
| Burmese | 594 | 0.3% |
| Cajun | 32 | 0.0% |
| Canadian | 791 | 0.4% |
| Celtic | 43 | 0.0% |
| Central American | 1,520 | 0.7% |
| Central American Indian | 194 | 0.1% |
| Cherokee | 1,616 | 0.7% |
| Chickasaw | 55 | 0.0% |
| Chilean | 33 | 0.0% |
| Chinese | 24 | 0.0% |
| Chippewa | 96 | 0.0% |
| Choctaw | 501 | 0.2% |
| Colombian | 146 | 0.1% |
| Comanche | 3 | 0.0% |
| Costa Rican | 372 | 0.2% |
| Cree | 23 | 0.0% |
| Creek | 128 | 0.1% |
| Croatian | 350 | 0.2% |
| Cuban | 209 | 0.1% |
| Czech | 881 | 0.4% |
| Czechoslovakian | 520 | 0.2% |
| Danish | 1,483 | 0.7% |
| Delaware | 21 | 0.0% |
| Dominican | 75 | 0.0% |
| Dutch | 2,981 | 1.3% |
| Eastern European | 1,109 | 0.5% |
| Ecuadorian | 16 | 0.0% |
| Egyptian | 30 | 0.0% |
| English | 33,629 | 15.1% |
| Estonian | 6 | 0.0% |
| Ethiopian | 23 | 0.0% |
| European | 6,330 | 2.8% |
| Finnish | 895 | 0.4% |
| French | 6,214 | 2.8% |
| French American Indian | 114 | 0.1% |
| French Canadian | 1,143 | 0.5% |
| German | 35,199 | 15.8% |
| German Russian | 22 | 0.0% |
| Ghanaian | 24 | 0.0% |
| Greek | 727 | 0.3% |
| Guamanian / Chamorro | 218 | 0.1% |
| Guatemalan | 415 | 0.2% |
| Honduran | 134 | 0.1% |
| Hungarian | 863 | 0.4% |
| Icelander | 128 | 0.1% |
| Indian (Asian) | 1,156 | 0.5% |
| Inupiat | 20 | 0.0% |
| Iranian | 172 | 0.1% |
| Irish | 27,631 | 12.4% |
| Iroquois | 125 | 0.1% |
| Israeli | 5 | 0.0% |
| Italian | 9,600 | 4.3% |
| Jamaican | 150 | 0.1% |
| Japanese | 13 | 0.0% |
| Jordanian | 7 | 0.0% |
| Korean | 2,222 | 1.0% |
| Laotian | 105 | 0.1% |
| Latvian | 47 | 0.0% |
| Lebanese | 65 | 0.0% |
| Lithuanian | 240 | 0.1% |
| Lumbee | 24 | 0.0% |
| Malaysian | 4 | 0.0% |
| Maltese | 1 | 0.0% |
| Mexican | 25,224 | 11.3% |
| Mexican American Indian | 479 | 0.2% |
| Moroccan | 12 | 0.0% |
| Native Hawaiian | 606 | 0.3% |
| Navajo | 25 | 0.0% |
| Nepalese | 11 | 0.0% |
| New Zealander | 14 | 0.0% |
| Nicaraguan | 48 | 0.0% |
| Nigerian | 18 | 0.0% |
| Northern European | 884 | 0.4% |
| Norwegian | 7,183 | 3.2% |
| Paiute | 26 | 0.0% |
| Pakistani | 202 | 0.1% |
| Panamanian | 46 | 0.0% |
| Paraguayan | 113 | 0.1% |
| Pennsylvania German | 42 | 0.0% |
| Peruvian | 117 | 0.1% |
| Polish | 3,754 | 1.7% |
| Portuguese | 1,164 | 0.5% |
| Potawatomi | 205 | 0.1% |
| Pueblo | 30 | 0.0% |
| Puerto Rican | 818 | 0.4% |
| Puget Sound Salish | 8 | 0.0% |
| Romanian | 456 | 0.2% |
| Russian | 1,999 | 0.9% |
| Salvadoran | 505 | 0.2% |
| Samoan | 368 | 0.2% |
| Scandinavian | 1,324 | 0.6% |
| Scotch-Irish | 3,399 | 1.5% |
| Scottish | 5,710 | 2.6% |
| Serbian | 5 | 0.0% |
| Sioux | 92 | 0.0% |
| Slavic | 82 | 0.0% |
| Slovak | 150 | 0.1% |
| Slovene | 89 | 0.0% |
| Somali | 11 | 0.0% |
| South American | 589 | 0.3% |
| South American Indian | 23 | 0.0% |
| Spaniard | 1,099 | 0.5% |
| Spanish | 1,107 | 0.5% |
| Spanish American | 80 | 0.0% |
| Sri Lankan | 276 | 0.1% |
| Subsaharan African | 550 | 0.3% |
| Swedish | 4,247 | 1.9% |
| Swiss | 1,059 | 0.5% |
| Thai | 97 | 0.0% |
| Tlingit-Haida | 33 | 0.0% |
| Tongan | 68 | 0.0% |
| Turkish | 165 | 0.1% |
| U.S. Virgin Islander | 10 | 0.0% |
| Ukrainian | 407 | 0.2% |
| Venezuelan | 110 | 0.1% |
| Welsh | 2,269 | 1.0% |
| West Indian | 34 | 0.0% |
| Yaqui | 20 | 0.0% |
| Yugoslavian | 111 | 0.1% | View All 139 Rows |
Immigrants in Jackson County
The most numerous immigrant groups reported in Jackson County came from Latin America (7,152 | 3.2%), Central America (6,618 | 3.0%), Mexico (6,146 | 2.8%), Europe (2,346 | 1.1%), and Asia (2,061 | 0.9%), together accounting for 10.9% of all Jackson County residents.

| Immigration Origin | # Population | % Population |
| Afghanistan | 8 | 0.0% |
| Africa | 165 | 0.1% |
| Argentina | 27 | 0.0% |
| Asia | 2,061 | 0.9% |
| Australia | 187 | 0.1% |
| Austria | 21 | 0.0% |
| Belgium | 24 | 0.0% |
| Belize | 15 | 0.0% |
| Bosnia and Herzegovina | 1 | 0.0% |
| Brazil | 169 | 0.1% |
| Canada | 676 | 0.3% |
| Caribbean | 70 | 0.0% |
| Central America | 6,618 | 3.0% |
| Chile | 33 | 0.0% |
| China | 378 | 0.2% |
| Colombia | 25 | 0.0% |
| Costa Rica | 193 | 0.1% |
| Croatia | 73 | 0.0% |
| Cuba | 44 | 0.0% |
| Czechoslovakia | 93 | 0.0% |
| Denmark | 27 | 0.0% |
| Dominican Republic | 16 | 0.0% |
| Eastern Africa | 79 | 0.0% |
| Eastern Asia | 673 | 0.3% |
| Eastern Europe | 797 | 0.4% |
| Ecuador | 37 | 0.0% |
| El Salvador | 110 | 0.1% |
| England | 275 | 0.1% |
| Ethiopia | 23 | 0.0% |
| Europe | 2,346 | 1.1% |
| France | 23 | 0.0% |
| Germany | 536 | 0.2% |
| Ghana | 24 | 0.0% |
| Guatemala | 93 | 0.0% |
| Honduras | 61 | 0.0% |
| Hong Kong | 15 | 0.0% |
| Hungary | 22 | 0.0% |
| India | 91 | 0.0% |
| Indonesia | 43 | 0.0% |
| Iran | 93 | 0.0% |
| Ireland | 26 | 0.0% |
| Israel | 45 | 0.0% |
| Italy | 68 | 0.0% |
| Jamaica | 10 | 0.0% |
| Japan | 161 | 0.1% |
| Jordan | 7 | 0.0% |
| Kazakhstan | 24 | 0.0% |
| Korea | 134 | 0.1% |
| Latin America | 7,152 | 3.2% |
| Latvia | 19 | 0.0% |
| Mexico | 6,146 | 2.8% |
| Nepal | 44 | 0.0% |
| Netherlands | 31 | 0.0% |
| Nigeria | 28 | 0.0% |
| Northern Africa | 10 | 0.0% |
| Northern Europe | 559 | 0.3% |
| Norway | 12 | 0.0% |
| Oceania | 292 | 0.1% |
| Peru | 66 | 0.0% |
| Philippines | 601 | 0.3% |
| Poland | 68 | 0.0% |
| Romania | 293 | 0.1% |
| Russia | 162 | 0.1% |
| Scotland | 51 | 0.0% |
| Somalia | 11 | 0.0% |
| South Africa | 4 | 0.0% |
| South America | 464 | 0.2% |
| South Central Asia | 260 | 0.1% |
| South Eastern Asia | 929 | 0.4% |
| Southern Europe | 85 | 0.0% |
| Spain | 17 | 0.0% |
| Sweden | 2 | 0.0% |
| Switzerland | 43 | 0.0% |
| Taiwan | 2 | 0.0% |
| Thailand | 102 | 0.1% |
| Turkey | 70 | 0.0% |
| Ukraine | 54 | 0.0% |
| Venezuela | 82 | 0.0% |
| Vietnam | 166 | 0.1% |
| Western Africa | 67 | 0.0% |
| Western Asia | 199 | 0.1% |
| Western Europe | 678 | 0.3% |
| Zimbabwe | 34 | 0.0% | View All 83 Rows |
Sex and Age in Jackson County
Sex and Age in Jackson County
The most populous age groups in Jackson County are 35 to 39 Years (7,722 | 7.1%) for men and 65 to 69 Years (8,765 | 7.7%) for women.
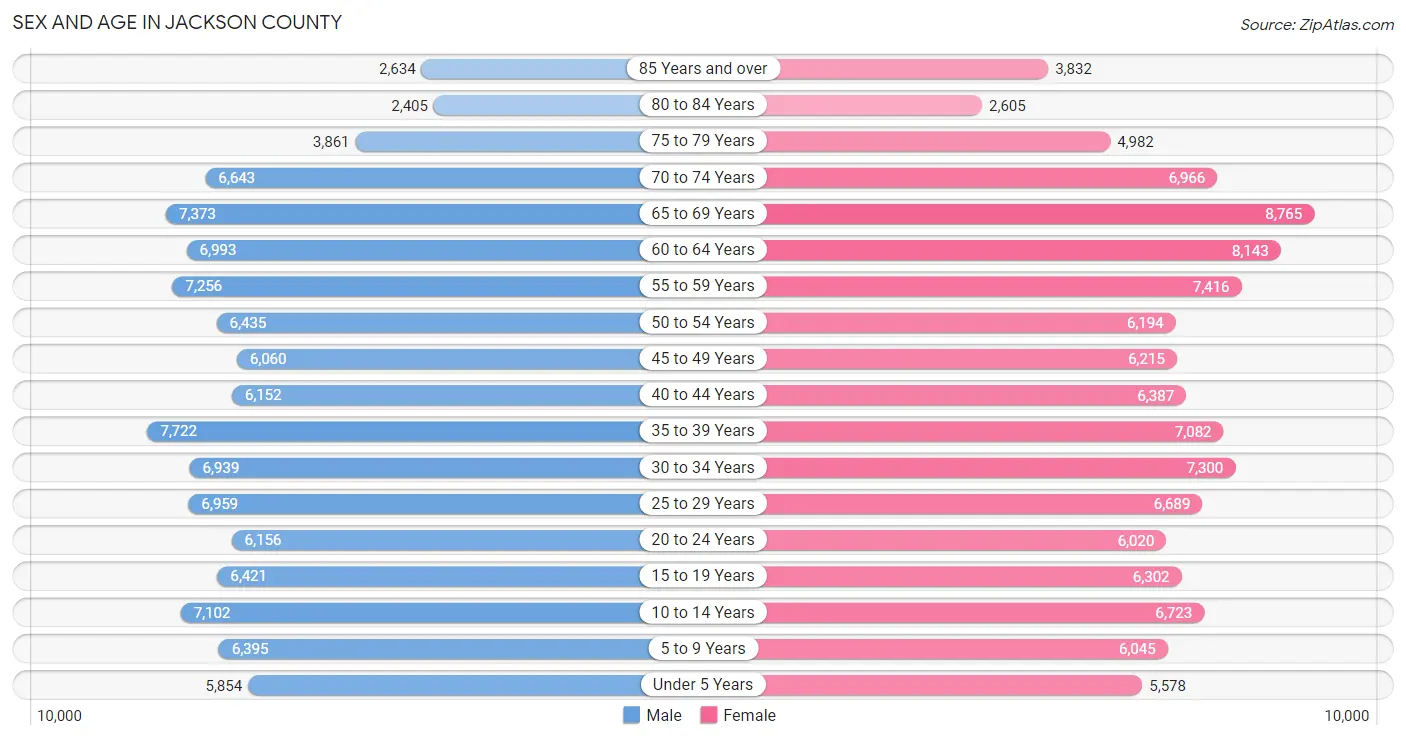
| Age Bracket | Male | Female |
| Under 5 Years | 5,854 (5.3%) | 5,578 (4.9%) |
| 5 to 9 Years | 6,395 (5.9%) | 6,045 (5.3%) |
| 10 to 14 Years | 7,102 (6.5%) | 6,723 (5.9%) |
| 15 to 19 Years | 6,421 (5.9%) | 6,302 (5.6%) |
| 20 to 24 Years | 6,156 (5.6%) | 6,020 (5.3%) |
| 25 to 29 Years | 6,959 (6.4%) | 6,689 (5.9%) |
| 30 to 34 Years | 6,939 (6.4%) | 7,300 (6.5%) |
| 35 to 39 Years | 7,722 (7.1%) | 7,082 (6.2%) |
| 40 to 44 Years | 6,152 (5.6%) | 6,387 (5.6%) |
| 45 to 49 Years | 6,060 (5.5%) | 6,215 (5.5%) |
| 50 to 54 Years | 6,435 (5.9%) | 6,194 (5.5%) |
| 55 to 59 Years | 7,256 (6.6%) | 7,416 (6.6%) |
| 60 to 64 Years | 6,993 (6.4%) | 8,143 (7.2%) |
| 65 to 69 Years | 7,373 (6.7%) | 8,765 (7.7%) |
| 70 to 74 Years | 6,643 (6.1%) | 6,966 (6.1%) |
| 75 to 79 Years | 3,861 (3.5%) | 4,982 (4.4%) |
| 80 to 84 Years | 2,405 (2.2%) | 2,605 (2.3%) |
| 85 Years and over | 2,634 (2.4%) | 3,832 (3.4%) |
| Total | 109,360 (100.0%) | 113,244 (100.0%) |
Families and Households in Jackson County
Median Family Size in Jackson County
The median family size in Jackson County is 2.97 persons per family, with single female/mother families (8,612 | 15.3%) accounting for the largest median family size of 3.02 persons per family. On the other hand, single male/father families (4,290 | 7.6%) represent the smallest median family size with 2.76 persons per family.
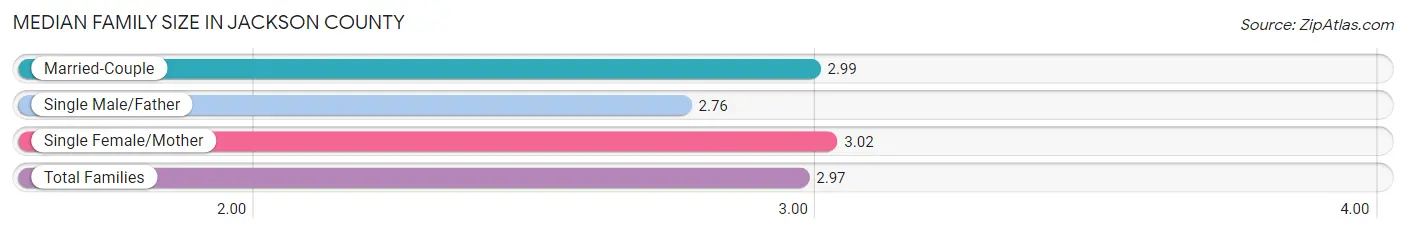
| Family Type | # Families | Family Size |
| Married-Couple | 43,452 (77.1%) | 2.99 |
| Single Male/Father | 4,290 (7.6%) | 2.76 |
| Single Female/Mother | 8,612 (15.3%) | 3.02 |
| Total Families | 56,354 (100.0%) | 2.97 |
Median Household Size in Jackson County
The median household size in Jackson County is 2.43 persons per household, with single female/mother households (8,612 | 9.6%) accounting for the largest median household size of 3.37 persons per household. non-family households (33,522 | 37.3%) represent the smallest median household size with 1.30 persons per household.
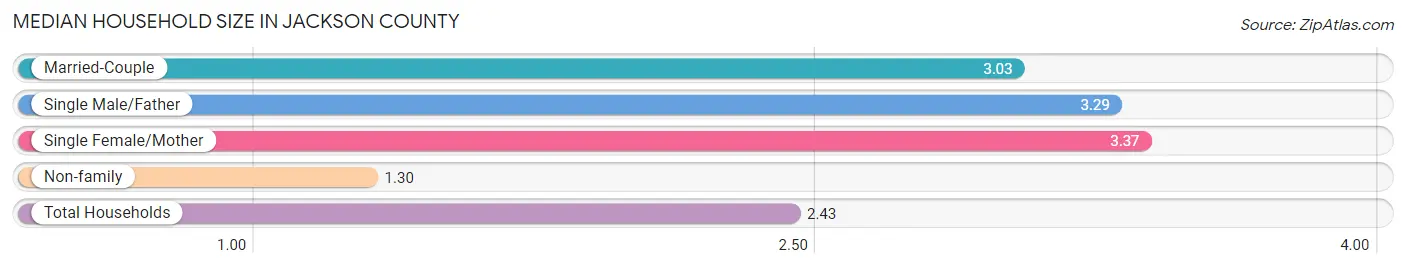
| Household Type | # Households | Household Size |
| Married-Couple | 43,452 (48.3%) | 3.03 |
| Single Male/Father | 4,290 (4.8%) | 3.29 |
| Single Female/Mother | 8,612 (9.6%) | 3.37 |
| Non-family | 33,522 (37.3%) | 1.30 |
| Total Households | 89,876 (100.0%) | 2.43 |
Household Size by Marriage Status in Jackson County
Out of a total of 89,876 households in Jackson County, 56,354 (62.7%) are family households, while 33,522 (37.3%) are nonfamily households. The most numerous type of family households are 2-person households, comprising 27,614, and the most common type of nonfamily households are 1-person households, comprising 25,977.
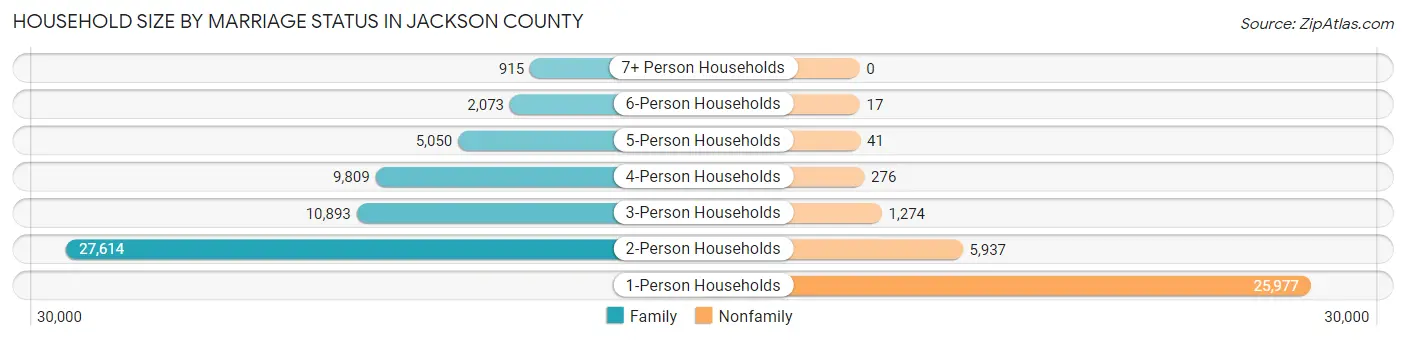
| Household Size | Family Households | Nonfamily Households |
| 1-Person Households | - | 25,977 (28.9%) |
| 2-Person Households | 27,614 (30.7%) | 5,937 (6.6%) |
| 3-Person Households | 10,893 (12.1%) | 1,274 (1.4%) |
| 4-Person Households | 9,809 (10.9%) | 276 (0.3%) |
| 5-Person Households | 5,050 (5.6%) | 41 (0.1%) |
| 6-Person Households | 2,073 (2.3%) | 17 (0.0%) |
| 7+ Person Households | 915 (1.0%) | 0 (0.0%) |
| Total | 56,354 (62.7%) | 33,522 (37.3%) |
Female Fertility in Jackson County
Fertility by Age in Jackson County
Average fertility rate in Jackson County is 55.0 births per 1,000 women. Women in the age bracket of 20 to 34 years have the highest fertility rate with 106.0 births per 1,000 women. Women in the age bracket of 20 to 34 years acount for 80.9% of all women with births.
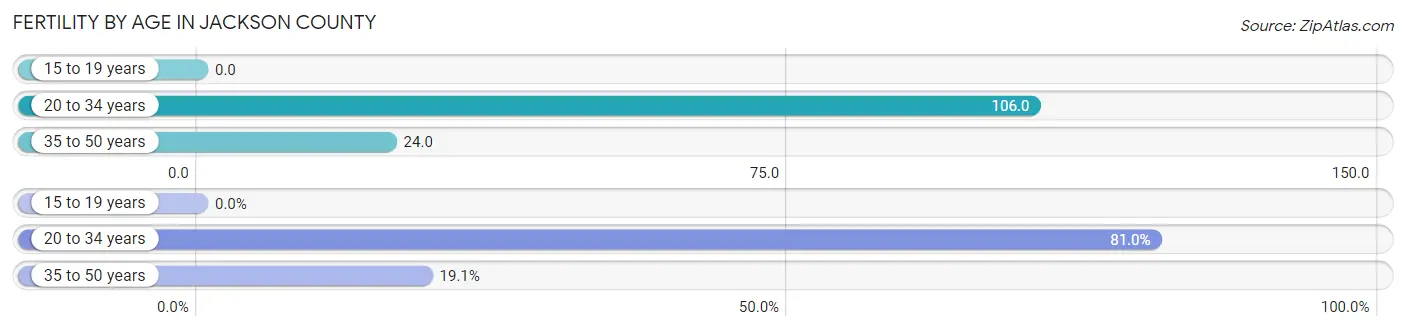
| Age Bracket | Women with Births | Births / 1,000 Women |
| 15 to 19 years | 0 (0.0%) | 0.0 |
| 20 to 34 years | 2,125 (80.9%) | 106.0 |
| 35 to 50 years | 500 (19.1%) | 24.0 |
| Total | 2,625 (100.0%) | 55.0 |
Fertility by Age by Marriage Status in Jackson County
80.6% of women with births (2,625) in Jackson County are married. The highest percentage of unmarried women with births falls into 20 to 34 years age bracket with 23.3% of them unmarried at the time of birth, while the lowest percentage of unmarried women with births belong to 35 to 50 years age bracket with 2.6% of them unmarried.
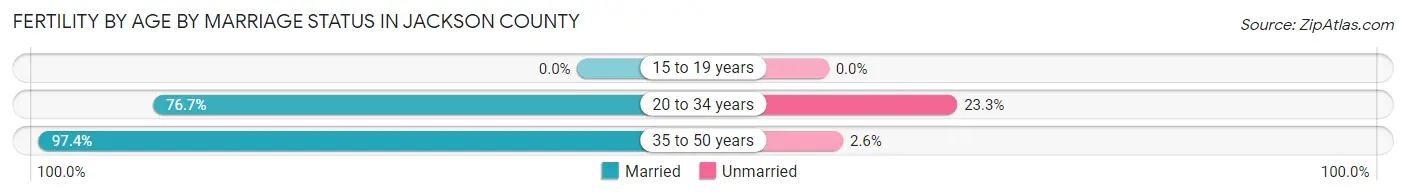
| Age Bracket | Married | Unmarried |
| 15 to 19 years | 0 (0.0%) | 0 (0.0%) |
| 20 to 34 years | 1,630 (76.7%) | 495 (23.3%) |
| 35 to 50 years | 487 (97.4%) | 13 (2.6%) |
| Total | 2,116 (80.6%) | 509 (19.4%) |
Fertility by Education in Jackson County
Average fertility rate in Jackson County is 55.0 births per 1,000 women. Women with the education attainment of graduate degree have the highest fertility rate of 69.0 births per 1,000 women, while women with the education attainment of less than high school have the lowest fertility at 37.0 births per 1,000 women. Women with the education attainment of college or associate's degree represent 42.9% of all women with births.
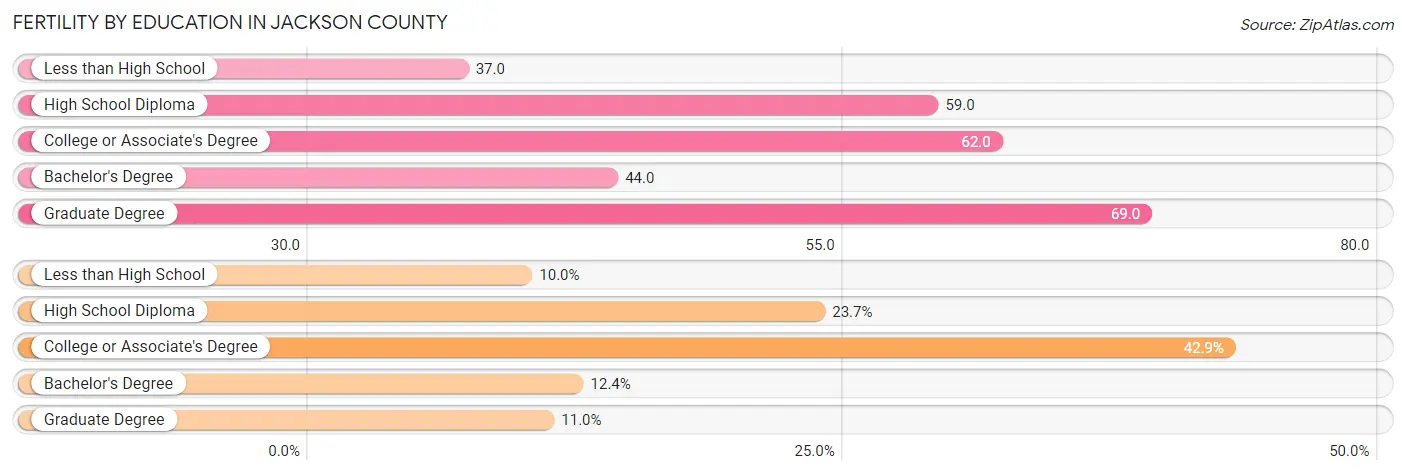
| Educational Attainment | Women with Births | Births / 1,000 Women |
| Less than High School | 262 (10.0%) | 37.0 |
| High School Diploma | 622 (23.7%) | 59.0 |
| College or Associate's Degree | 1,127 (42.9%) | 62.0 |
| Bachelor's Degree | 325 (12.4%) | 44.0 |
| Graduate Degree | 289 (11.0%) | 69.0 |
| Total | 2,625 (100.0%) | 55.0 |
Fertility by Education by Marriage Status in Jackson County
19.4% of women with births in Jackson County are unmarried. Women with the educational attainment of graduate degree are most likely to be married with 99.0% of them married at childbirth, while women with the educational attainment of less than high school are least likely to be married with 38.2% of them unmarried at childbirth.
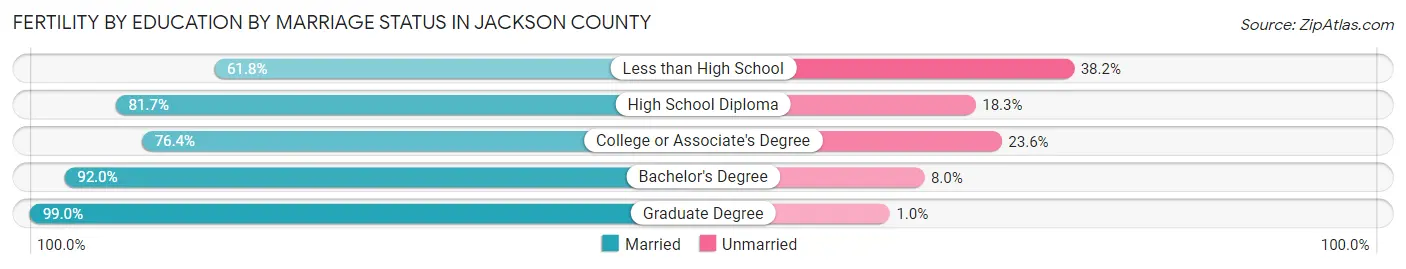
| Educational Attainment | Married | Unmarried |
| Less than High School | 162 (61.8%) | 100 (38.2%) |
| High School Diploma | 508 (81.7%) | 114 (18.3%) |
| College or Associate's Degree | 861 (76.4%) | 266 (23.6%) |
| Bachelor's Degree | 299 (92.0%) | 26 (8.0%) |
| Graduate Degree | 286 (99.0%) | 3 (1.0%) |
| Total | 2,116 (80.6%) | 509 (19.4%) |
Income in Jackson County
Income Overview in Jackson County
Per Capita Income in Jackson County is $36,538, while median incomes of families and households are $83,081 and $67,690 respectively.
| Characteristic | Number | Measure |
| Per Capita Income | 222,604 | $36,538 |
| Median Family Income | 56,354 | $83,081 |
| Mean Family Income | 56,354 | $104,815 |
| Median Household Income | 89,876 | $67,690 |
| Mean Household Income | 89,876 | $89,037 |
| Income Deficit | 56,354 | $10,195 |
| Wage / Income Gap (%) | 222,604 | 26.44% |
| Wage / Income Gap ($) | 222,604 | 73.56¢ per $1 |
| Gini / Inequality Index | 222,604 | 0.46 |
Earnings by Sex in Jackson County
Average Earnings in Jackson County are $37,199, $43,464 for men and $31,974 for women, a difference of 26.4%.
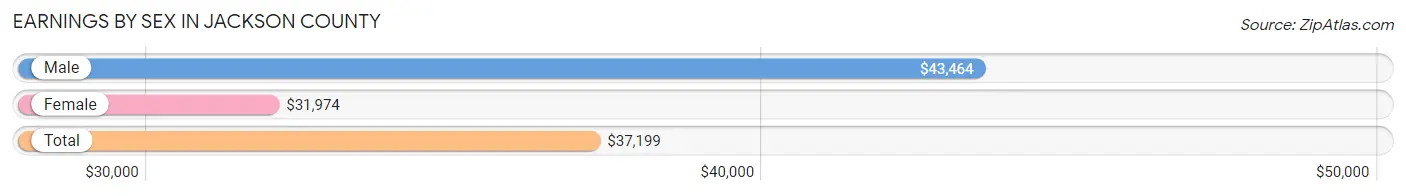
| Sex | Number | Average Earnings |
| Male | 57,534 (51.8%) | $43,464 |
| Female | 53,607 (48.2%) | $31,974 |
| Total | 111,141 (100.0%) | $37,199 |
Earnings by Sex by Income Bracket in Jackson County
The most common earnings brackets in Jackson County are $100,000+ for men (7,871 | 13.7%) and $25,000 to $29,999 for women (4,189 | 7.8%).
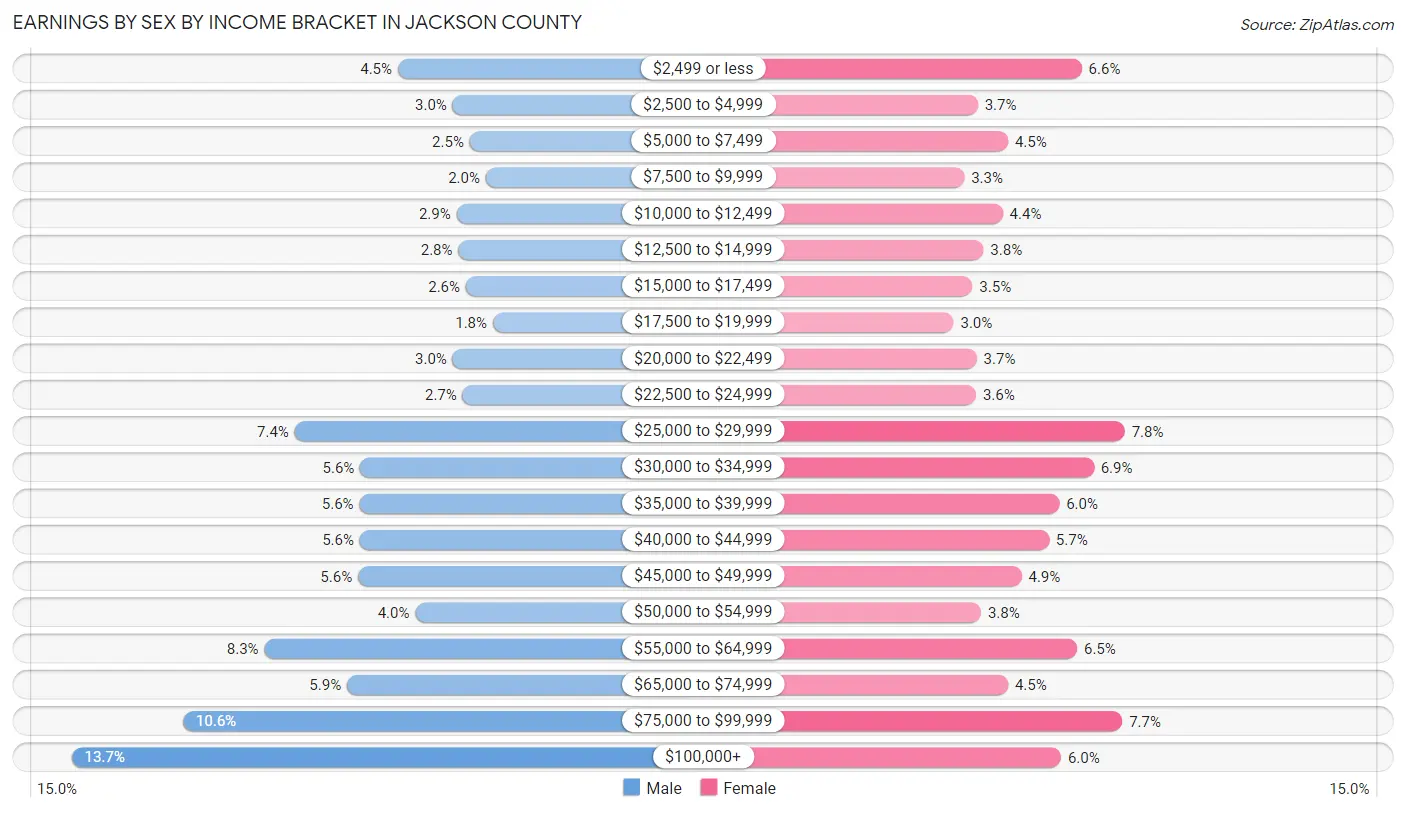
| Income | Male | Female |
| $2,499 or less | 2,592 (4.5%) | 3,539 (6.6%) |
| $2,500 to $4,999 | 1,706 (3.0%) | 1,973 (3.7%) |
| $5,000 to $7,499 | 1,435 (2.5%) | 2,429 (4.5%) |
| $7,500 to $9,999 | 1,174 (2.0%) | 1,770 (3.3%) |
| $10,000 to $12,499 | 1,644 (2.9%) | 2,346 (4.4%) |
| $12,500 to $14,999 | 1,618 (2.8%) | 2,059 (3.8%) |
| $15,000 to $17,499 | 1,495 (2.6%) | 1,892 (3.5%) |
| $17,500 to $19,999 | 1,056 (1.8%) | 1,610 (3.0%) |
| $20,000 to $22,499 | 1,706 (3.0%) | 1,958 (3.6%) |
| $22,500 to $24,999 | 1,549 (2.7%) | 1,944 (3.6%) |
| $25,000 to $29,999 | 4,261 (7.4%) | 4,189 (7.8%) |
| $30,000 to $34,999 | 3,206 (5.6%) | 3,722 (6.9%) |
| $35,000 to $39,999 | 3,217 (5.6%) | 3,200 (6.0%) |
| $40,000 to $44,999 | 3,213 (5.6%) | 3,046 (5.7%) |
| $45,000 to $49,999 | 3,240 (5.6%) | 2,631 (4.9%) |
| $50,000 to $54,999 | 2,314 (4.0%) | 2,023 (3.8%) |
| $55,000 to $64,999 | 4,752 (8.3%) | 3,471 (6.5%) |
| $65,000 to $74,999 | 3,417 (5.9%) | 2,428 (4.5%) |
| $75,000 to $99,999 | 6,068 (10.5%) | 4,150 (7.7%) |
| $100,000+ | 7,871 (13.7%) | 3,227 (6.0%) |
| Total | 57,534 (100.0%) | 53,607 (100.0%) |
Earnings by Sex by Educational Attainment in Jackson County
Average earnings in Jackson County are $47,396 for men and $36,107 for women, a difference of 23.8%. Men with an educational attainment of graduate degree enjoy the highest average annual earnings of $87,688, while those with less than high school education earn the least with $37,927. Women with an educational attainment of graduate degree earn the most with the average annual earnings of $65,411, while those with less than high school education have the smallest earnings of $26,239.
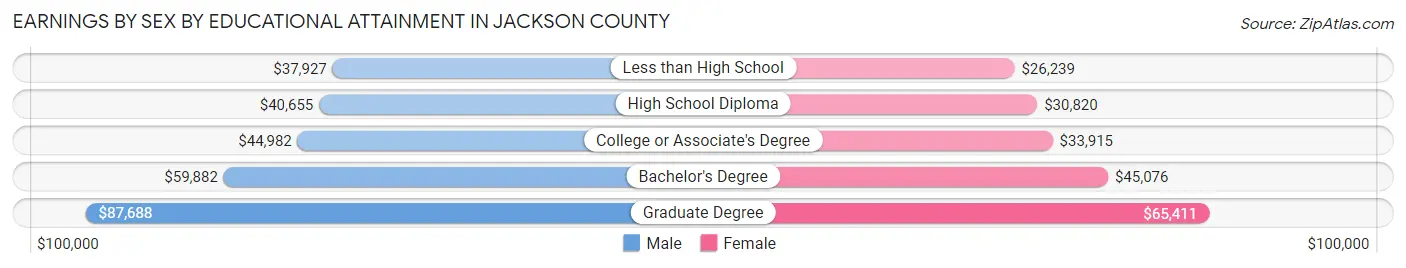
| Educational Attainment | Male Income | Female Income |
| Less than High School | $37,927 | $26,239 |
| High School Diploma | $40,655 | $30,820 |
| College or Associate's Degree | $44,982 | $33,915 |
| Bachelor's Degree | $59,882 | $45,076 |
| Graduate Degree | $87,688 | $65,411 |
| Total | $47,396 | $36,107 |
Family Income in Jackson County
Family Income Brackets in Jackson County
According to the Jackson County family income data, there are 11,271 families falling into the $100,000 to $149,999 income range, which is the most common income bracket and makes up 20.0% of all families. Conversely, the $10,000 to $14,999 income bracket is the least frequent group with only 564 families (1.0%) belonging to this category.
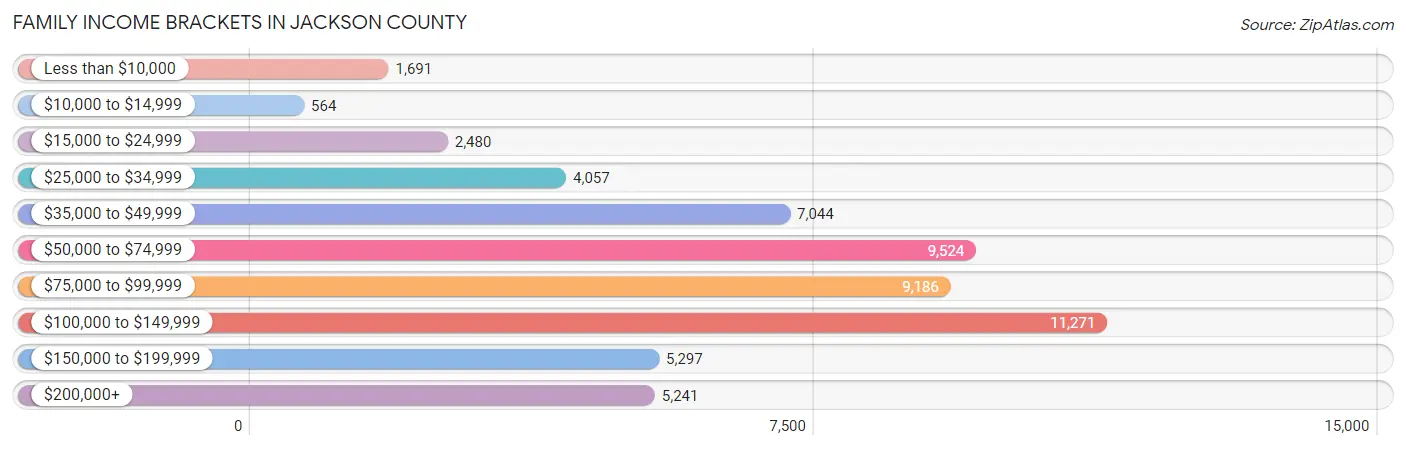
| Income Bracket | # Families | % Families |
| Less than $10,000 | 1,691 | 3.0% |
| $10,000 to $14,999 | 564 | 1.0% |
| $15,000 to $24,999 | 2,480 | 4.4% |
| $25,000 to $34,999 | 4,057 | 7.2% |
| $35,000 to $49,999 | 7,044 | 12.5% |
| $50,000 to $74,999 | 9,524 | 16.9% |
| $75,000 to $99,999 | 9,186 | 16.3% |
| $100,000 to $149,999 | 11,271 | 20.0% |
| $150,000 to $199,999 | 5,297 | 9.4% |
| $200,000+ | 5,241 | 9.3% |
Family Income by Famaliy Size in Jackson County
7+ person families (722 | 1.3%) account for the highest median family income in Jackson County with $137,105 per family, while 2-person families (30,029 | 53.3%) have the highest median income of $38,752 per family member.
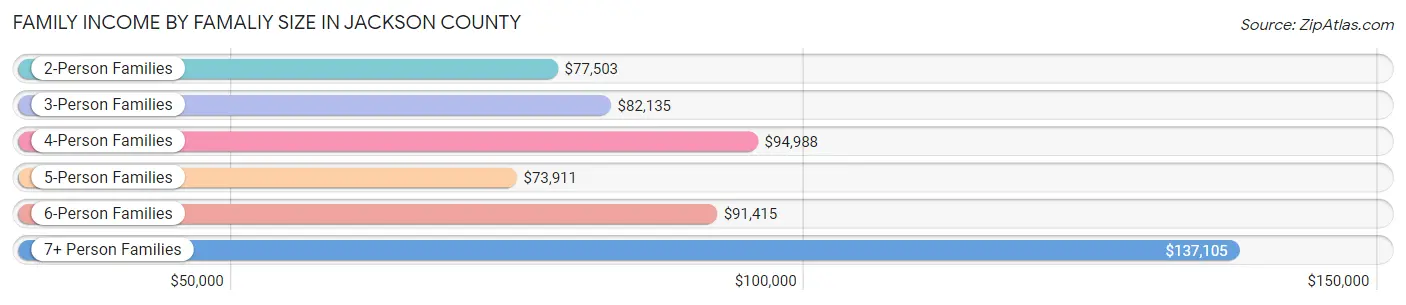
| Income Bracket | # Families | Median Income |
| 2-Person Families | 30,029 (53.3%) | $77,503 |
| 3-Person Families | 10,477 (18.6%) | $82,135 |
| 4-Person Families | 9,415 (16.7%) | $94,988 |
| 5-Person Families | 4,101 (7.3%) | $73,911 |
| 6-Person Families | 1,610 (2.9%) | $91,415 |
| 7+ Person Families | 722 (1.3%) | $137,105 |
| Total | 56,354 (100.0%) | $83,081 |
Family Income by Number of Earners in Jackson County
The median family income in Jackson County is $83,081, with families comprising 3+ earners (4,781) having the highest median family income of $129,044, while families with no earners (11,117) have the lowest median family income of $52,021, accounting for 8.5% and 19.7% of families, respectively.
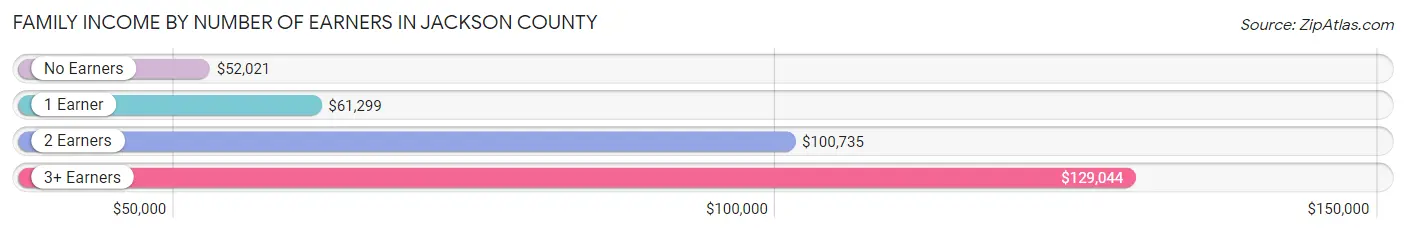
| Number of Earners | # Families | Median Income |
| No Earners | 11,117 (19.7%) | $52,021 |
| 1 Earner | 18,532 (32.9%) | $61,299 |
| 2 Earners | 21,924 (38.9%) | $100,735 |
| 3+ Earners | 4,781 (8.5%) | $129,044 |
| Total | 56,354 (100.0%) | $83,081 |
Household Income in Jackson County
Household Income Brackets in Jackson County
With 15,459 households falling in the category, the $50,000 to $74,999 income range is the most frequent in Jackson County, accounting for 17.2% of all households. In contrast, only 3,415 households (3.8%) fall into the $10,000 to $14,999 income bracket, making it the least populous group.
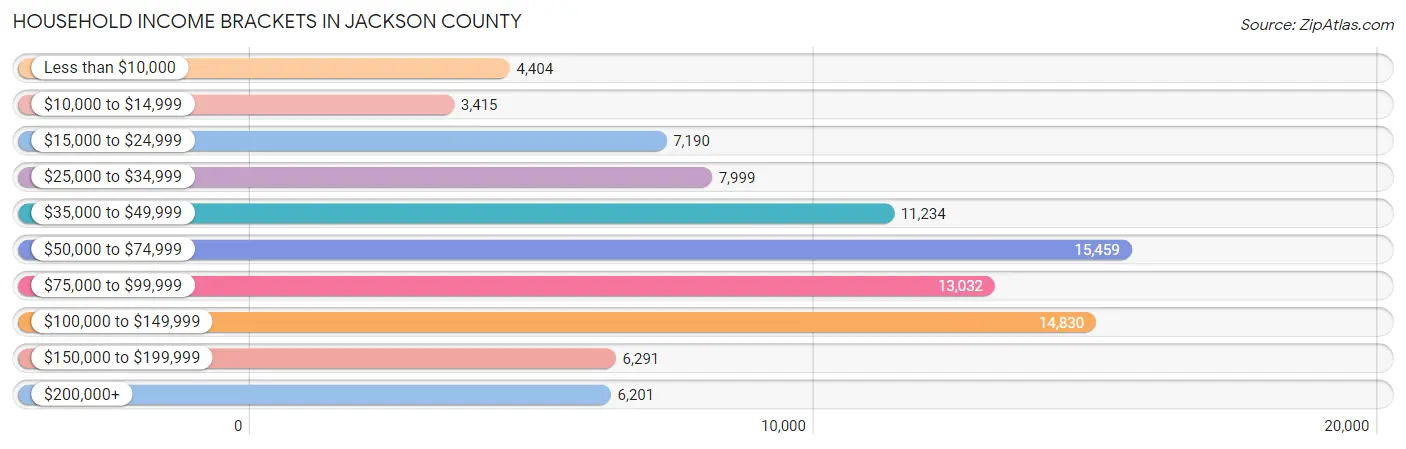
| Income Bracket | # Households | % Households |
| Less than $10,000 | 4,404 | 4.9% |
| $10,000 to $14,999 | 3,415 | 3.8% |
| $15,000 to $24,999 | 7,190 | 8.0% |
| $25,000 to $34,999 | 7,999 | 8.9% |
| $35,000 to $49,999 | 11,234 | 12.5% |
| $50,000 to $74,999 | 15,459 | 17.2% |
| $75,000 to $99,999 | 13,032 | 14.5% |
| $100,000 to $149,999 | 14,830 | 16.5% |
| $150,000 to $199,999 | 6,291 | 7.0% |
| $200,000+ | 6,201 | 6.9% |
Household Income by Householder Age in Jackson County
The median household income in Jackson County is $67,690, with the highest median household income of $84,930 found in the 45 to 64 years age bracket for the primary householder. A total of 29,630 households (33.0%) fall into this category. Meanwhile, the 15 to 24 years age bracket for the primary householder has the lowest median household income of $39,796, with 3,343 households (3.7%) in this group.
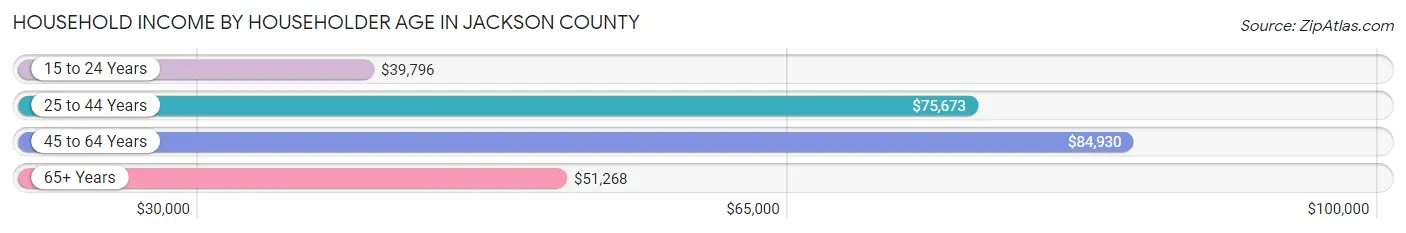
| Income Bracket | # Households | Median Income |
| 15 to 24 Years | 3,343 (3.7%) | $39,796 |
| 25 to 44 Years | 25,335 (28.2%) | $75,673 |
| 45 to 64 Years | 29,630 (33.0%) | $84,930 |
| 65+ Years | 31,568 (35.1%) | $51,268 |
| Total | 89,876 (100.0%) | $67,690 |
Poverty in Jackson County
Income Below Poverty by Sex and Age in Jackson County
With 12.1% poverty level for males and 14.4% for females among the residents of Jackson County, 18 to 24 year old males and 18 to 24 year old females are the most vulnerable to poverty, with 1,710 males (20.3%) and 1,919 females (24.1%) in their respective age groups living below the poverty level.
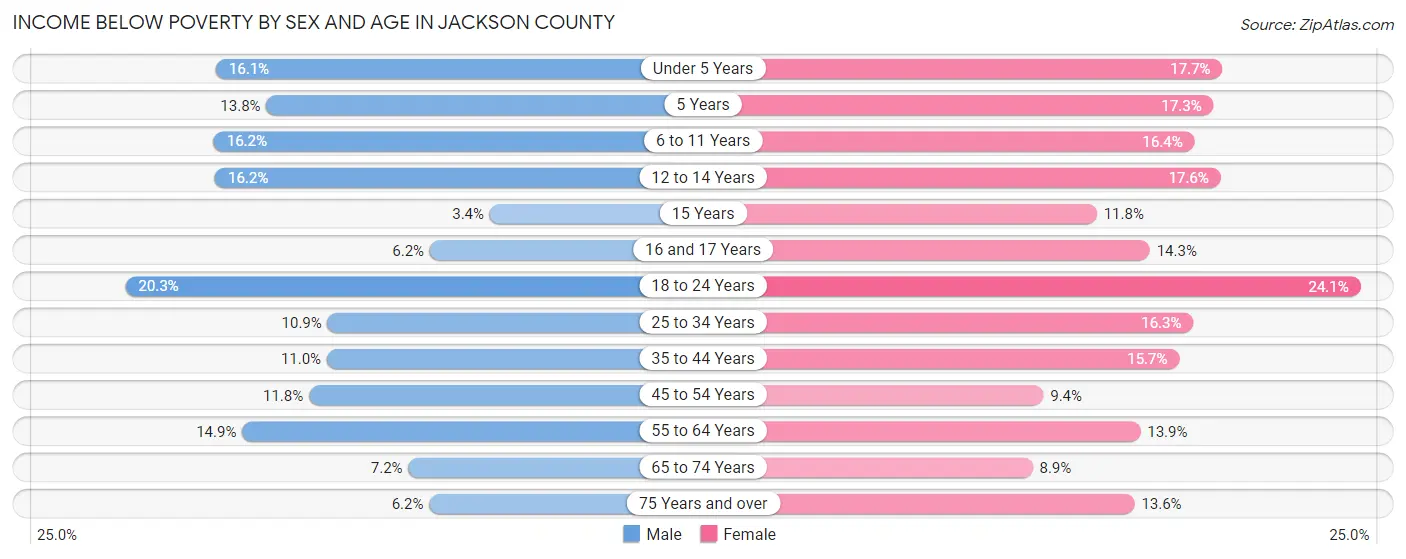
| Age Bracket | Male | Female |
| Under 5 Years | 928 (16.1%) | 906 (17.7%) |
| 5 Years | 174 (13.8%) | 149 (17.2%) |
| 6 to 11 Years | 1,354 (16.2%) | 1,246 (16.4%) |
| 12 to 14 Years | 598 (16.2%) | 712 (17.6%) |
| 15 Years | 39 (3.4%) | 160 (11.8%) |
| 16 and 17 Years | 169 (6.2%) | 344 (14.3%) |
| 18 to 24 Years | 1,710 (20.3%) | 1,919 (24.1%) |
| 25 to 34 Years | 1,506 (10.9%) | 2,278 (16.3%) |
| 35 to 44 Years | 1,509 (11.0%) | 2,105 (15.7%) |
| 45 to 54 Years | 1,471 (11.8%) | 1,158 (9.3%) |
| 55 to 64 Years | 2,110 (14.9%) | 2,145 (13.9%) |
| 65 to 74 Years | 1,001 (7.2%) | 1,390 (8.8%) |
| 75 Years and over | 543 (6.2%) | 1,506 (13.6%) |
| Total | 13,112 (12.1%) | 16,018 (14.4%) |
Income Above Poverty by Sex and Age in Jackson County
According to the poverty statistics in Jackson County, males aged 15 years and females aged 65 to 74 years are the age groups that are most secure financially, with 96.6% of males and 91.1% of females in these age groups living above the poverty line.
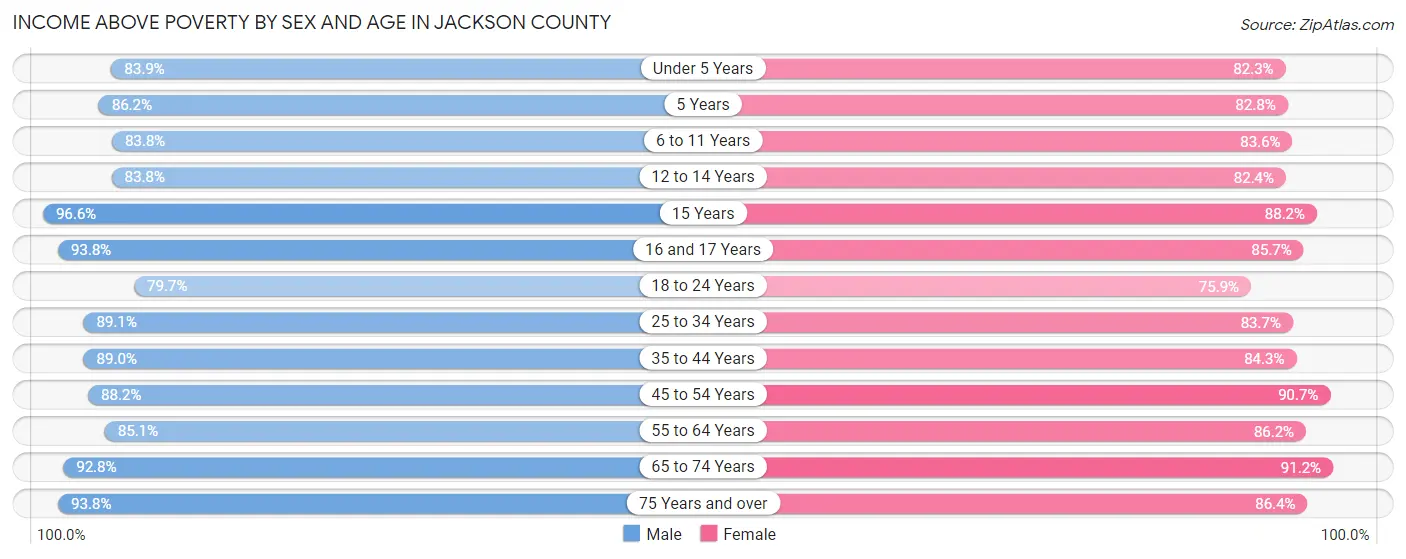
| Age Bracket | Male | Female |
| Under 5 Years | 4,829 (83.9%) | 4,225 (82.3%) |
| 5 Years | 1,089 (86.2%) | 715 (82.8%) |
| 6 to 11 Years | 6,995 (83.8%) | 6,365 (83.6%) |
| 12 to 14 Years | 3,103 (83.8%) | 3,337 (82.4%) |
| 15 Years | 1,105 (96.6%) | 1,193 (88.2%) |
| 16 and 17 Years | 2,563 (93.8%) | 2,064 (85.7%) |
| 18 to 24 Years | 6,704 (79.7%) | 6,053 (75.9%) |
| 25 to 34 Years | 12,257 (89.1%) | 11,689 (83.7%) |
| 35 to 44 Years | 12,249 (89.0%) | 11,334 (84.3%) |
| 45 to 54 Years | 10,999 (88.2%) | 11,227 (90.6%) |
| 55 to 64 Years | 12,054 (85.1%) | 13,346 (86.2%) |
| 65 to 74 Years | 12,916 (92.8%) | 14,320 (91.1%) |
| 75 Years and over | 8,182 (93.8%) | 9,586 (86.4%) |
| Total | 95,045 (87.9%) | 95,454 (85.6%) |
Income Below Poverty Among Married-Couple Families in Jackson County
The poverty statistics for married-couple families in Jackson County show that 4.7% or 2,047 of the total 43,452 families live below the poverty line. Families with 3 or 4 children have the highest poverty rate of 13.5%, comprising of 507 families. On the other hand, families with no children have the lowest poverty rate of 2.8%, which includes 765 families.
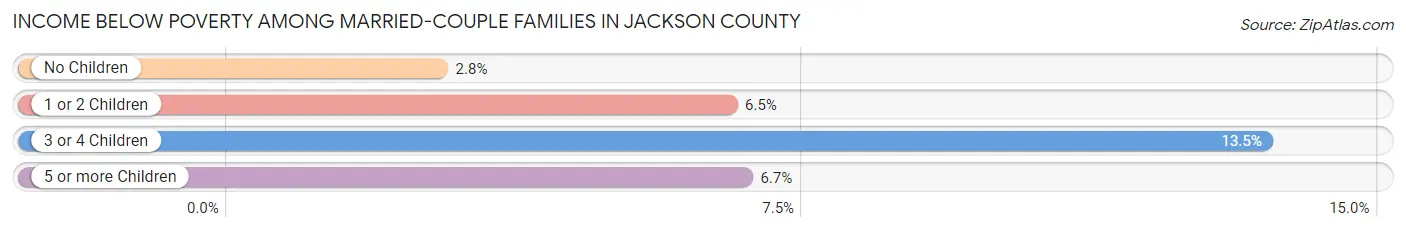
| Children | Above Poverty | Below Poverty |
| No Children | 27,077 (97.3%) | 765 (2.8%) |
| 1 or 2 Children | 10,779 (93.5%) | 753 (6.5%) |
| 3 or 4 Children | 3,244 (86.5%) | 507 (13.5%) |
| 5 or more Children | 305 (93.3%) | 22 (6.7%) |
| Total | 41,405 (95.3%) | 2,047 (4.7%) |
Income Below Poverty Among Single-Parent Households in Jackson County
According to the poverty data in Jackson County, 10.5% or 450 single-father households and 21.9% or 1,887 single-mother households are living below the poverty line. Among single-father households, those with 3 or 4 children have the highest poverty rate, with 115 households (29.4%) experiencing poverty. Likewise, among single-mother households, those with 5 or more children have the highest poverty rate, with 37 households (100.0%) falling below the poverty line.
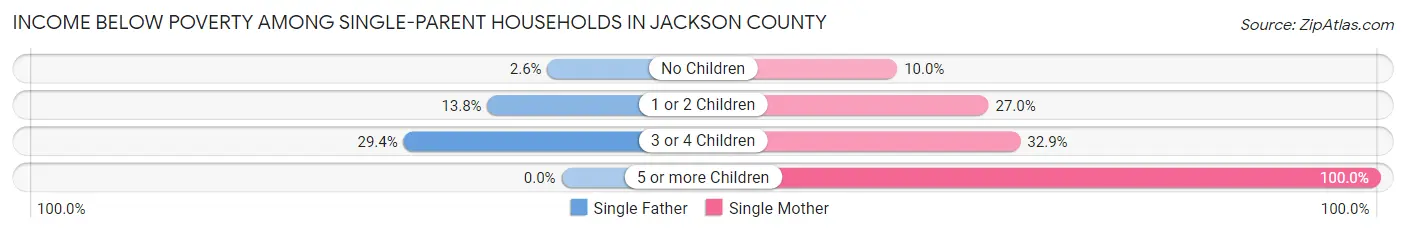
| Children | Single Father | Single Mother |
| No Children | 47 (2.6%) | 294 (10.0%) |
| 1 or 2 Children | 288 (13.8%) | 1,346 (27.0%) |
| 3 or 4 Children | 115 (29.4%) | 210 (32.9%) |
| 5 or more Children | 0 (0.0%) | 37 (100.0%) |
| Total | 450 (10.5%) | 1,887 (21.9%) |
Income Below Poverty Among Married-Couple vs Single-Parent Households in Jackson County
The poverty data for Jackson County shows that 2,047 of the married-couple family households (4.7%) and 2,337 of the single-parent households (18.1%) are living below the poverty level. Within the married-couple family households, those with 3 or 4 children have the highest poverty rate, with 507 households (13.5%) falling below the poverty line. Among the single-parent households, those with 5 or more children have the highest poverty rate, with 37 household (82.2%) living below poverty.
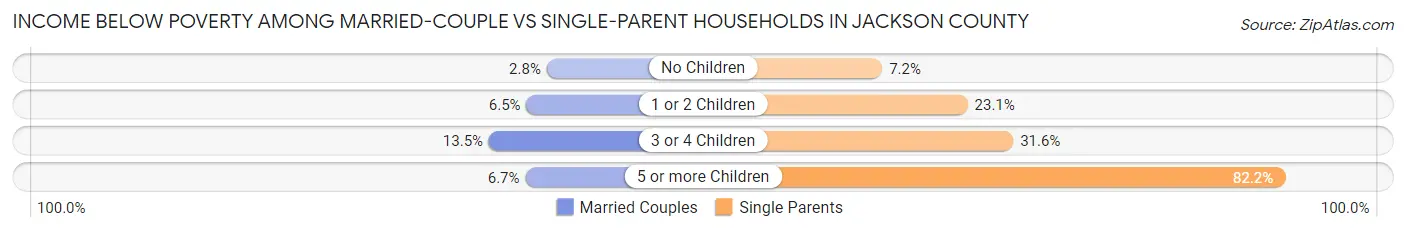
| Children | Married-Couple Families | Single-Parent Households |
| No Children | 765 (2.8%) | 341 (7.2%) |
| 1 or 2 Children | 753 (6.5%) | 1,634 (23.1%) |
| 3 or 4 Children | 507 (13.5%) | 325 (31.6%) |
| 5 or more Children | 22 (6.7%) | 37 (82.2%) |
| Total | 2,047 (4.7%) | 2,337 (18.1%) |
Employment Characteristics in Jackson County
Employment by Class of Employer in Jackson County
Among the 97,138 employed individuals in Jackson County, private company employees (60,369 | 62.2%), not-for-profit organizations (11,911 | 12.3%), and self-employed (not incorporated) (8,684 | 8.9%) make up the most common classes of employment.
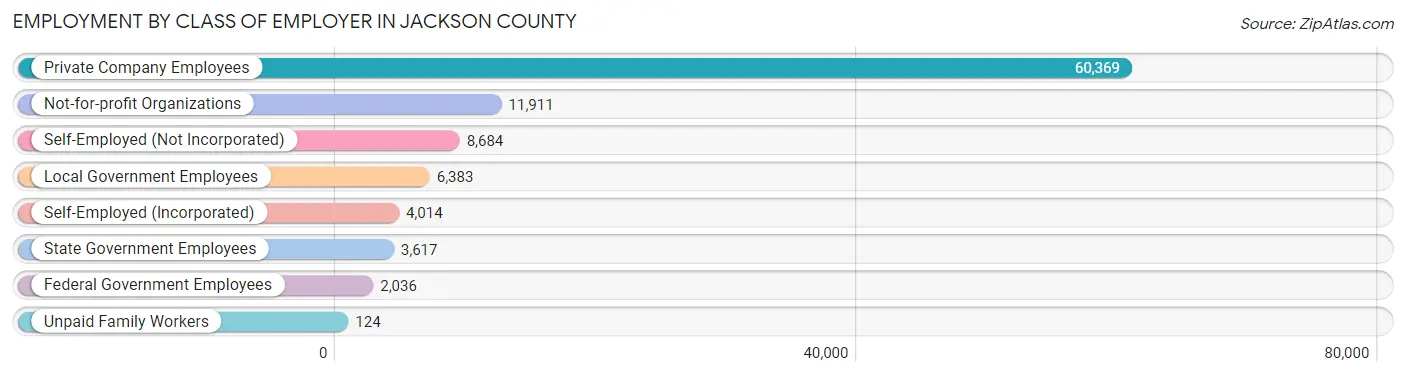
| Employer Class | # Employees | % Employees |
| Private Company Employees | 60,369 | 62.2% |
| Self-Employed (Incorporated) | 4,014 | 4.1% |
| Self-Employed (Not Incorporated) | 8,684 | 8.9% |
| Not-for-profit Organizations | 11,911 | 12.3% |
| Local Government Employees | 6,383 | 6.6% |
| State Government Employees | 3,617 | 3.7% |
| Federal Government Employees | 2,036 | 2.1% |
| Unpaid Family Workers | 124 | 0.1% |
| Total | 97,138 | 100.0% |
Employment Status by Age in Jackson County
According to the labor force statistics for Jackson County, out of the total population over 16 years of age (182,407), 57.6% or 105,066 individuals are in the labor force, with 5.5% or 5,779 of them unemployed. The age group with the highest labor force participation rate is 25 to 29 years, with 83.1% or 11,341 individuals in the labor force. Within the labor force, the 16 to 19 years age range has the highest percentage of unemployed individuals, with 14.0% or 655 of them being unemployed.
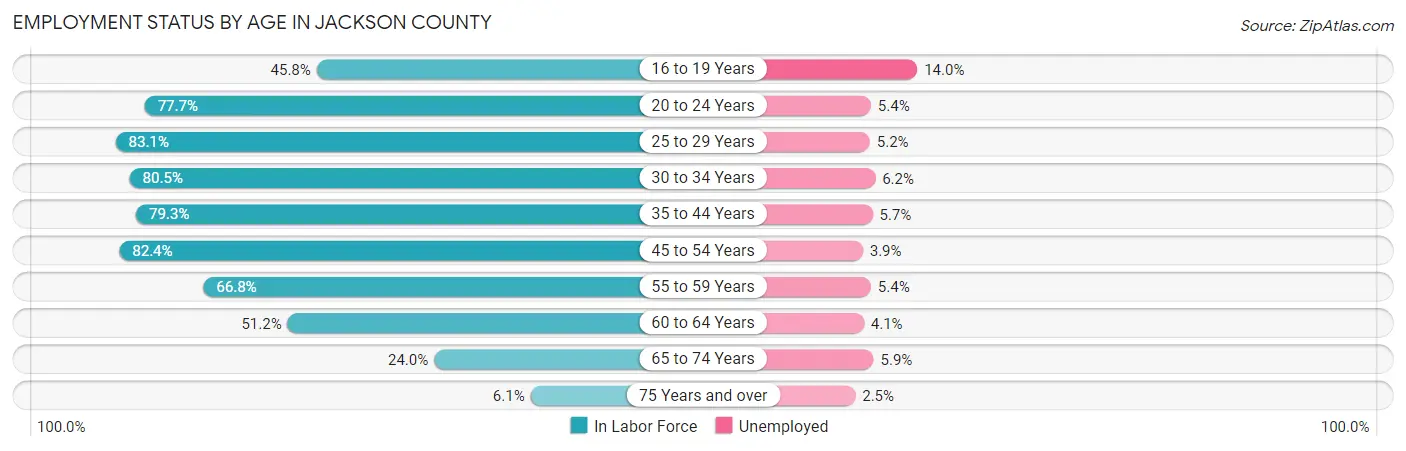
| Age Bracket | In Labor Force | Unemployed |
| 16 to 19 Years | 4,682 (45.8%) | 655 (14.0%) |
| 20 to 24 Years | 9,461 (77.7%) | 511 (5.4%) |
| 25 to 29 Years | 11,341 (83.1%) | 590 (5.2%) |
| 30 to 34 Years | 11,462 (80.5%) | 711 (6.2%) |
| 35 to 44 Years | 21,683 (79.3%) | 1,236 (5.7%) |
| 45 to 54 Years | 20,521 (82.4%) | 800 (3.9%) |
| 55 to 59 Years | 9,801 (66.8%) | 529 (5.4%) |
| 60 to 64 Years | 7,750 (51.2%) | 318 (4.1%) |
| 65 to 74 Years | 7,139 (24.0%) | 421 (5.9%) |
| 75 Years and over | 1,239 (6.1%) | 31 (2.5%) |
| Total | 105,066 (57.6%) | 5,779 (5.5%) |
Employment Status by Educational Attainment in Jackson County
According to labor force statistics for Jackson County, 75.1% of individuals (82,566) out of the total population between 25 and 64 years of age (109,942) are in the labor force, with 5.1% or 4,211 of them being unemployed. The group with the highest labor force participation rate are those with the educational attainment of bachelor's degree or higher, with 81.1% or 25,392 individuals in the labor force. Within the labor force, individuals with high school diploma education have the highest percentage of unemployment, with 6.9% or 1,452 of them being unemployed.
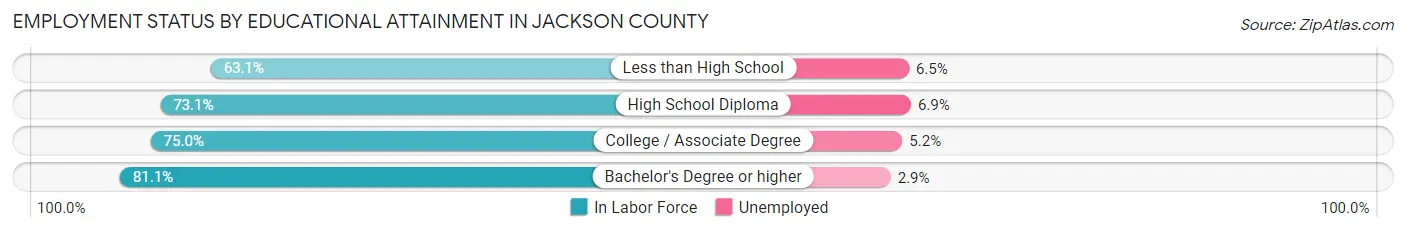
| Educational Attainment | In Labor Force | Unemployed |
| Less than High School | 6,817 (63.1%) | 702 (6.5%) |
| High School Diploma | 21,049 (73.1%) | 1,987 (6.9%) |
| College / Associate Degree | 29,276 (75.0%) | 2,030 (5.2%) |
| Bachelor's Degree or higher | 25,392 (81.1%) | 908 (2.9%) |
| Total | 82,566 (75.1%) | 5,607 (5.1%) |
Employment Occupations by Sex in Jackson County
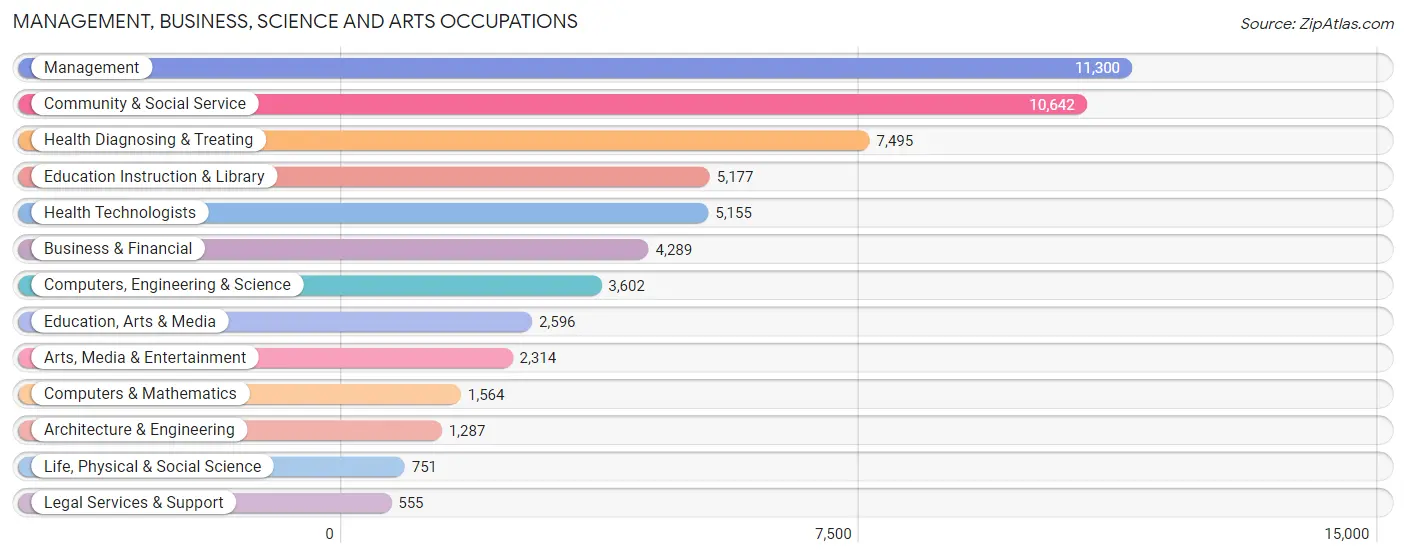
Management, Business, Science and Arts Occupations
The most common Management, Business, Science and Arts occupations in Jackson County are Management (11,300 | 11.4%), Community & Social Service (10,642 | 10.7%), Health Diagnosing & Treating (7,495 | 7.6%), Education Instruction & Library (5,177 | 5.2%), and Health Technologists (5,155 | 5.2%).
Management, Business, Science and Arts Occupations by Sex
Within the Management, Business, Science and Arts occupations in Jackson County, the most male-oriented occupations are Architecture & Engineering (85.2%), Computers, Engineering & Science (77.5%), and Computers & Mathematics (77.2%), while the most female-oriented occupations are Education Instruction & Library (78.9%), Education, Arts & Media (69.4%), and Health Diagnosing & Treating (69.0%).
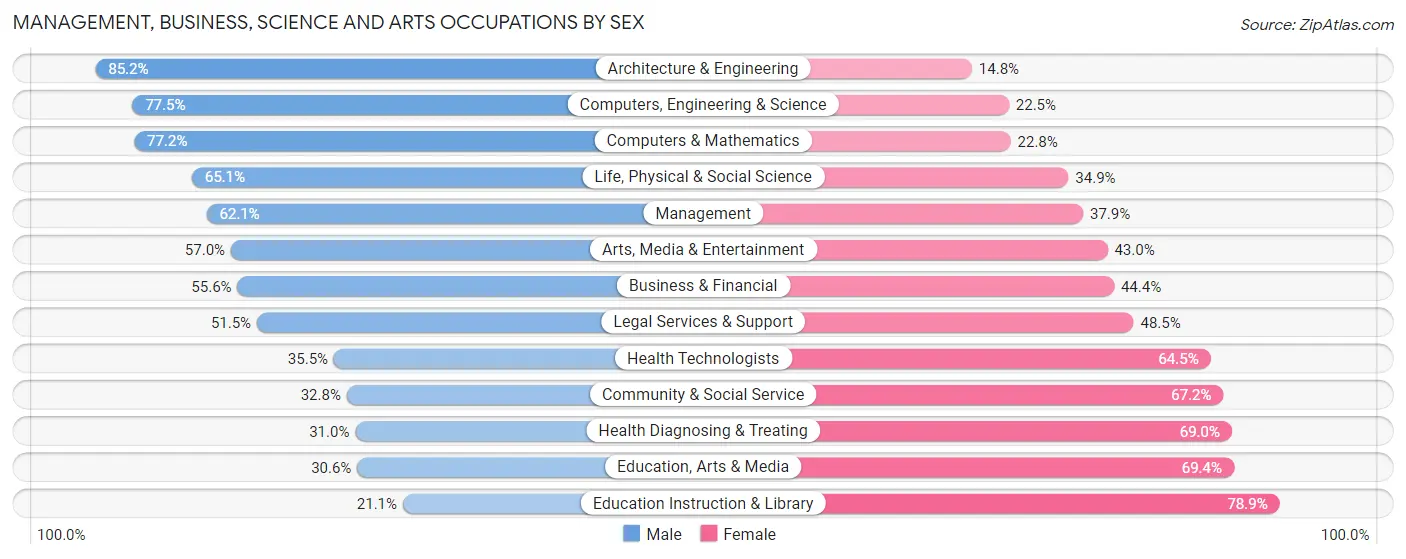
| Occupation | Male | Female |
| Management | 7,013 (62.1%) | 4,287 (37.9%) |
| Business & Financial | 2,385 (55.6%) | 1,904 (44.4%) |
| Computers, Engineering & Science | 2,793 (77.5%) | 809 (22.5%) |
| Computers & Mathematics | 1,207 (77.2%) | 357 (22.8%) |
| Architecture & Engineering | 1,097 (85.2%) | 190 (14.8%) |
| Life, Physical & Social Science | 489 (65.1%) | 262 (34.9%) |
| Community & Social Service | 3,491 (32.8%) | 7,151 (67.2%) |
| Education, Arts & Media | 795 (30.6%) | 1,801 (69.4%) |
| Legal Services & Support | 286 (51.5%) | 269 (48.5%) |
| Education Instruction & Library | 1,092 (21.1%) | 4,085 (78.9%) |
| Arts, Media & Entertainment | 1,318 (57.0%) | 996 (43.0%) |
| Health Diagnosing & Treating | 2,326 (31.0%) | 5,169 (69.0%) |
| Health Technologists | 1,829 (35.5%) | 3,326 (64.5%) |
| Total (Category) | 18,008 (48.2%) | 19,320 (51.8%) |
| Total (Overall) | 51,253 (51.7%) | 47,942 (48.3%) |
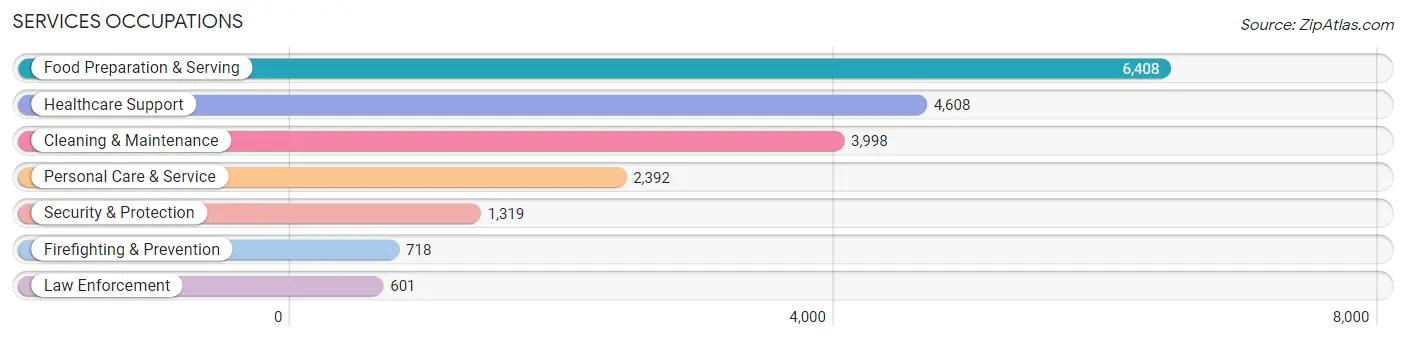
Services Occupations
The most common Services occupations in Jackson County are Food Preparation & Serving (6,408 | 6.5%), Healthcare Support (4,608 | 4.6%), Cleaning & Maintenance (3,998 | 4.0%), Personal Care & Service (2,392 | 2.4%), and Security & Protection (1,319 | 1.3%).
Services Occupations by Sex
Within the Services occupations in Jackson County, the most male-oriented occupations are Law Enforcement (95.0%), Security & Protection (91.4%), and Firefighting & Prevention (88.3%), while the most female-oriented occupations are Healthcare Support (90.6%), Personal Care & Service (85.6%), and Food Preparation & Serving (59.4%).
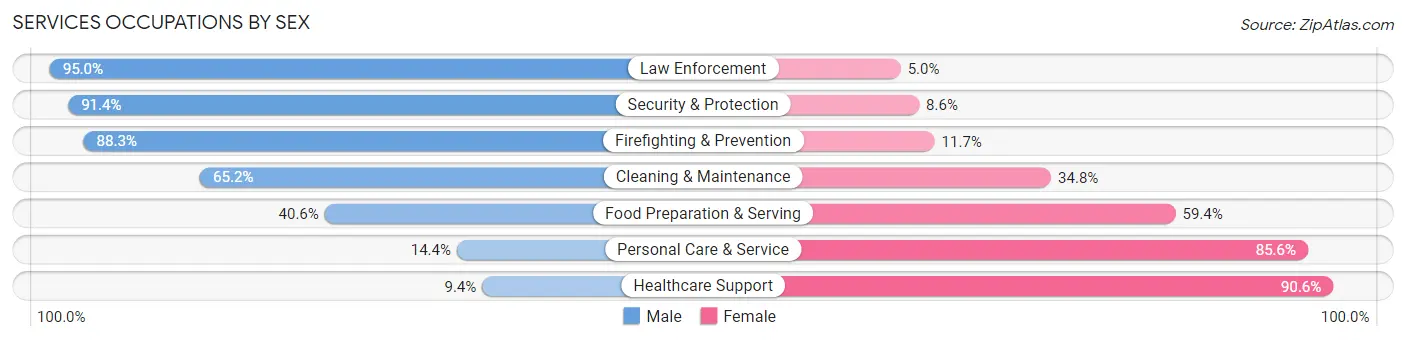
| Occupation | Male | Female |
| Healthcare Support | 433 (9.4%) | 4,175 (90.6%) |
| Security & Protection | 1,205 (91.4%) | 114 (8.6%) |
| Firefighting & Prevention | 634 (88.3%) | 84 (11.7%) |
| Law Enforcement | 571 (95.0%) | 30 (5.0%) |
| Food Preparation & Serving | 2,601 (40.6%) | 3,807 (59.4%) |
| Cleaning & Maintenance | 2,608 (65.2%) | 1,390 (34.8%) |
| Personal Care & Service | 345 (14.4%) | 2,047 (85.6%) |
| Total (Category) | 7,192 (38.4%) | 11,533 (61.6%) |
| Total (Overall) | 51,253 (51.7%) | 47,942 (48.3%) |
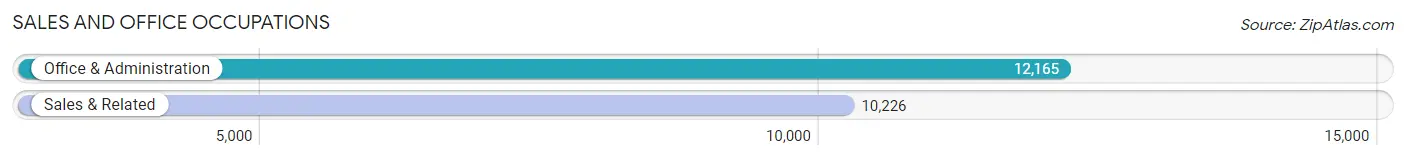
Sales and Office Occupations
The most common Sales and Office occupations in Jackson County are Office & Administration (12,165 | 12.3%), and Sales & Related (10,226 | 10.3%).
Sales and Office Occupations by Sex
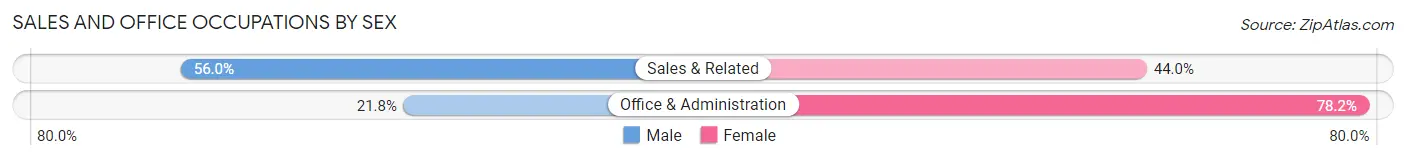
| Occupation | Male | Female |
| Sales & Related | 5,722 (56.0%) | 4,504 (44.0%) |
| Office & Administration | 2,654 (21.8%) | 9,511 (78.2%) |
| Total (Category) | 8,376 (37.4%) | 14,015 (62.6%) |
| Total (Overall) | 51,253 (51.7%) | 47,942 (48.3%) |
Natural Resources, Construction and Maintenance Occupations
The most common Natural Resources, Construction and Maintenance occupations in Jackson County are Construction & Extraction (3,874 | 3.9%), Installation, Maintenance & Repair (2,899 | 2.9%), and Farming, Fishing & Forestry (1,492 | 1.5%).
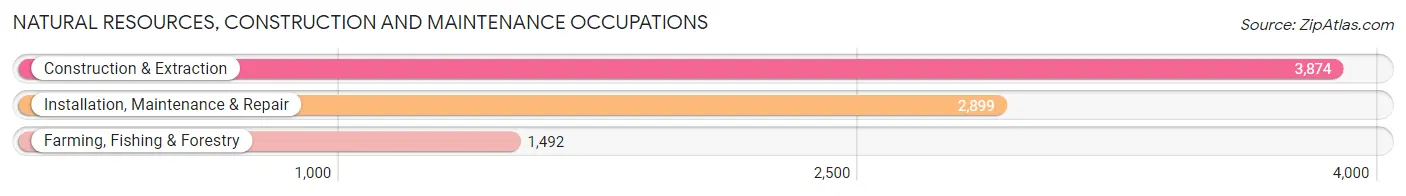
Natural Resources, Construction and Maintenance Occupations by Sex
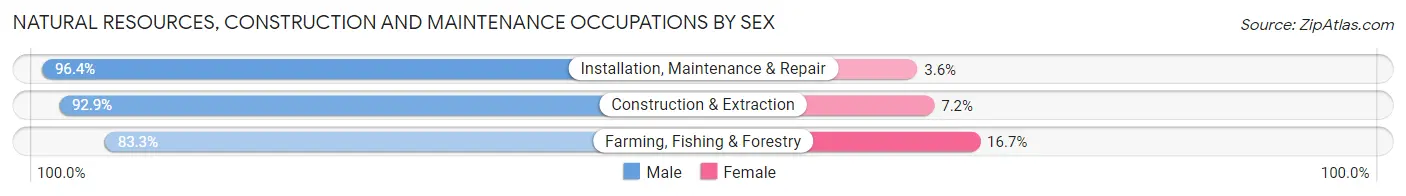
| Occupation | Male | Female |
| Farming, Fishing & Forestry | 1,243 (83.3%) | 249 (16.7%) |
| Construction & Extraction | 3,597 (92.8%) | 277 (7.1%) |
| Installation, Maintenance & Repair | 2,794 (96.4%) | 105 (3.6%) |
| Total (Category) | 7,634 (92.4%) | 631 (7.6%) |
| Total (Overall) | 51,253 (51.7%) | 47,942 (48.3%) |
Production, Transportation and Moving Occupations
The most common Production, Transportation and Moving occupations in Jackson County are Production (5,393 | 5.4%), Material Moving (3,895 | 3.9%), and Transportation (3,198 | 3.2%).
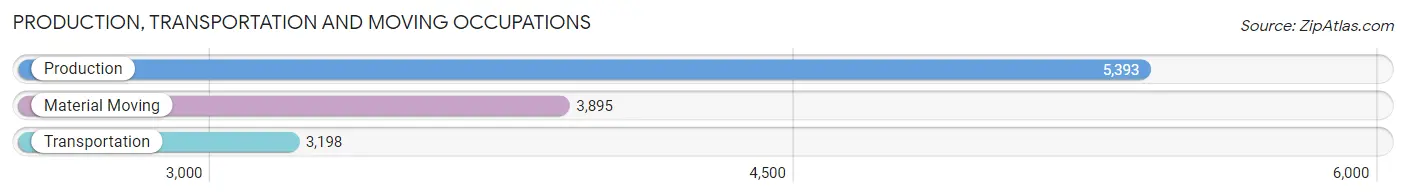
Production, Transportation and Moving Occupations by Sex
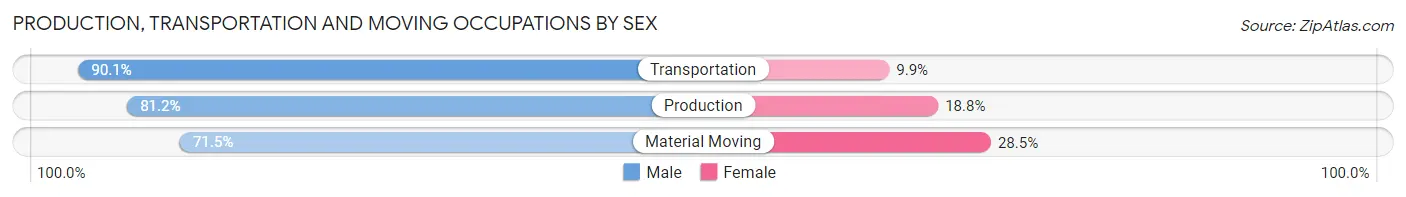
| Occupation | Male | Female |
| Production | 4,377 (81.2%) | 1,016 (18.8%) |
| Transportation | 2,882 (90.1%) | 316 (9.9%) |
| Material Moving | 2,784 (71.5%) | 1,111 (28.5%) |
| Total (Category) | 10,043 (80.4%) | 2,443 (19.6%) |
| Total (Overall) | 51,253 (51.7%) | 47,942 (48.3%) |
Employment Industries by Sex in Jackson County
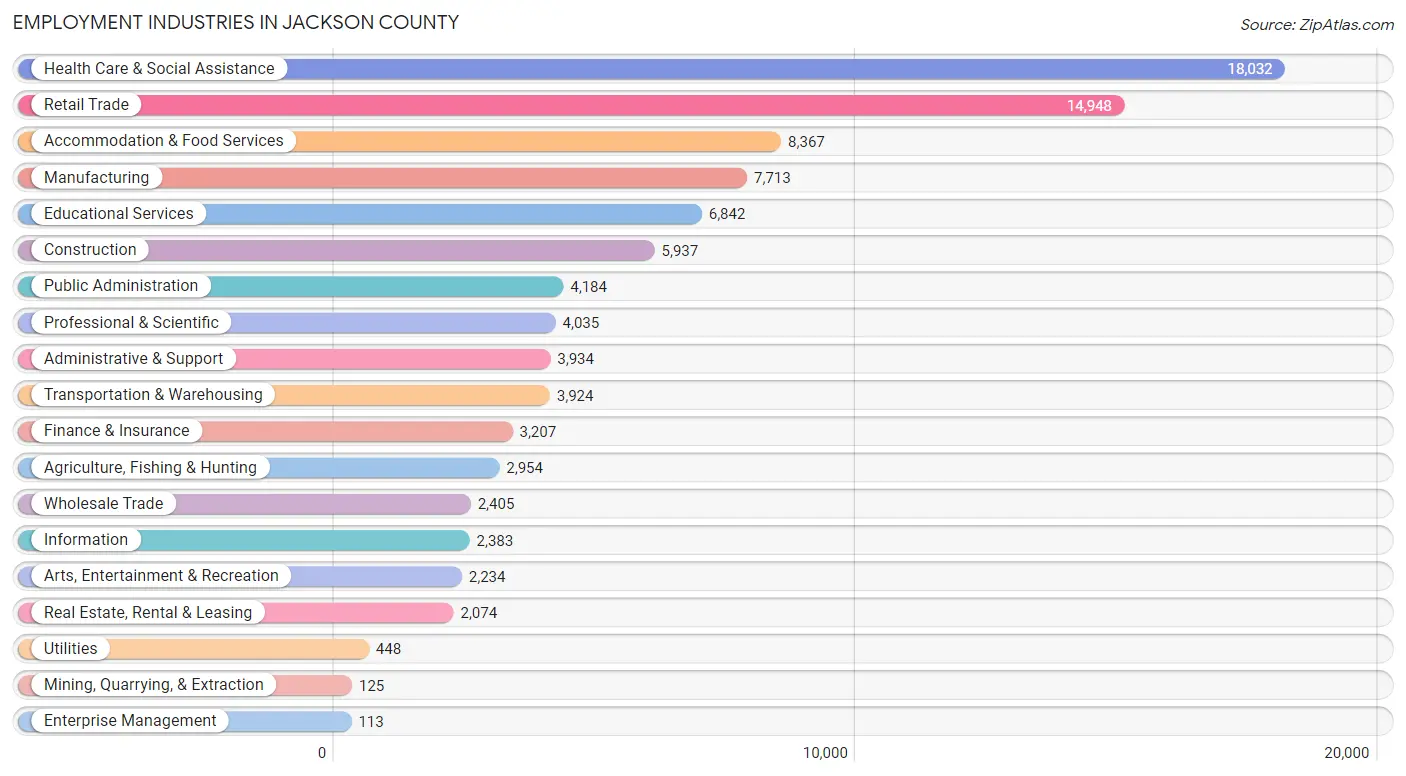
Employment Industries in Jackson County
The major employment industries in Jackson County include Health Care & Social Assistance (18,032 | 18.2%), Retail Trade (14,948 | 15.1%), Accommodation & Food Services (8,367 | 8.4%), Manufacturing (7,713 | 7.8%), and Educational Services (6,842 | 6.9%).
Employment Industries by Sex in Jackson County
The Jackson County industries that see more men than women are Mining, Quarrying, & Extraction (100.0%), Construction (84.9%), and Utilities (78.6%), whereas the industries that tend to have a higher number of women are Health Care & Social Assistance (76.7%), Educational Services (73.4%), and Accommodation & Food Services (57.5%).
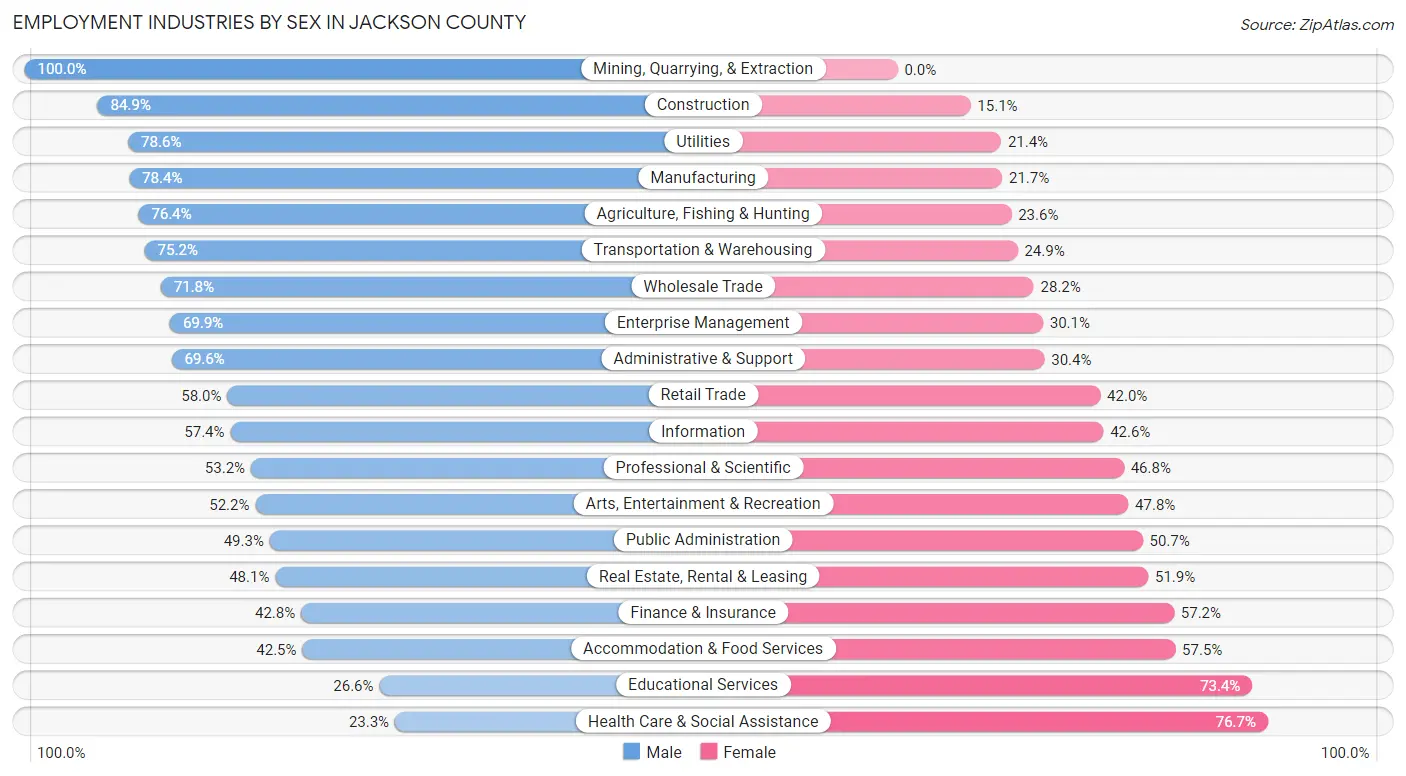
| Industry | Male | Female |
| Agriculture, Fishing & Hunting | 2,258 (76.4%) | 696 (23.6%) |
| Mining, Quarrying, & Extraction | 125 (100.0%) | 0 (0.0%) |
| Construction | 5,040 (84.9%) | 897 (15.1%) |
| Manufacturing | 6,043 (78.3%) | 1,670 (21.6%) |
| Wholesale Trade | 1,727 (71.8%) | 678 (28.2%) |
| Retail Trade | 8,676 (58.0%) | 6,272 (42.0%) |
| Transportation & Warehousing | 2,949 (75.1%) | 975 (24.8%) |
| Utilities | 352 (78.6%) | 96 (21.4%) |
| Information | 1,368 (57.4%) | 1,015 (42.6%) |
| Finance & Insurance | 1,372 (42.8%) | 1,835 (57.2%) |
| Real Estate, Rental & Leasing | 998 (48.1%) | 1,076 (51.9%) |
| Professional & Scientific | 2,145 (53.2%) | 1,890 (46.8%) |
| Enterprise Management | 79 (69.9%) | 34 (30.1%) |
| Administrative & Support | 2,738 (69.6%) | 1,196 (30.4%) |
| Educational Services | 1,818 (26.6%) | 5,024 (73.4%) |
| Health Care & Social Assistance | 4,208 (23.3%) | 13,824 (76.7%) |
| Arts, Entertainment & Recreation | 1,167 (52.2%) | 1,067 (47.8%) |
| Accommodation & Food Services | 3,557 (42.5%) | 4,810 (57.5%) |
| Public Administration | 2,061 (49.3%) | 2,123 (50.7%) |
| Total | 51,253 (51.7%) | 47,942 (48.3%) |
Education in Jackson County
School Enrollment in Jackson County
The most common levels of schooling among the 46,637 students in Jackson County are middle school (10,657 | 22.9%), elementary school (10,138 | 21.7%), and high school (10,101 | 21.7%).
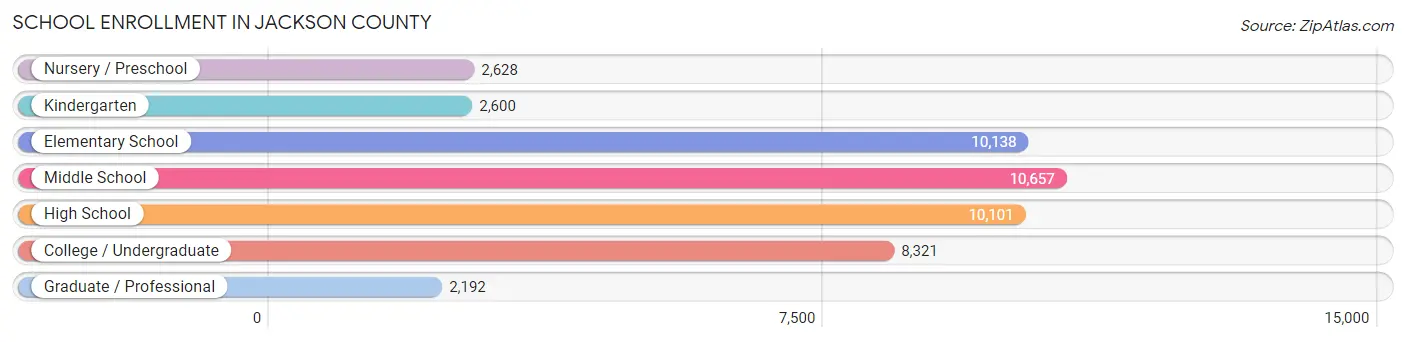
| School Level | # Students | % Students |
| Nursery / Preschool | 2,628 | 5.6% |
| Kindergarten | 2,600 | 5.6% |
| Elementary School | 10,138 | 21.7% |
| Middle School | 10,657 | 22.9% |
| High School | 10,101 | 21.7% |
| College / Undergraduate | 8,321 | 17.8% |
| Graduate / Professional | 2,192 | 4.7% |
| Total | 46,637 | 100.0% |
School Enrollment by Age by Funding Source in Jackson County
Out of a total of 46,637 students who are enrolled in schools in Jackson County, 7,275 (15.6%) attend a private institution, while the remaining 39,362 (84.4%) are enrolled in public schools. The age group of 3 to 4 year olds has the highest likelihood of being enrolled in private schools, with 1,140 (56.9% in the age bracket) enrolled. Conversely, the age group of 20 to 24 year olds has the lowest likelihood of being enrolled in a private school, with 3,225 (92.2% in the age bracket) attending a public institution.
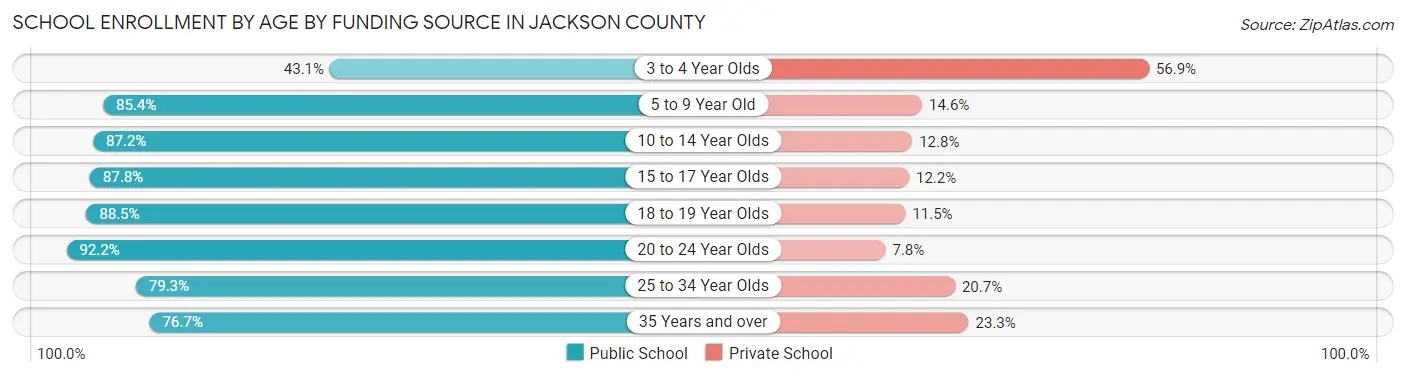
| Age Bracket | Public School | Private School |
| 3 to 4 Year Olds | 865 (43.1%) | 1,140 (56.9%) |
| 5 to 9 Year Old | 10,037 (85.4%) | 1,719 (14.6%) |
| 10 to 14 Year Olds | 11,746 (87.2%) | 1,720 (12.8%) |
| 15 to 17 Year Olds | 6,346 (87.8%) | 879 (12.2%) |
| 18 to 19 Year Olds | 2,968 (88.5%) | 386 (11.5%) |
| 20 to 24 Year Olds | 3,225 (92.2%) | 273 (7.8%) |
| 25 to 34 Year Olds | 1,996 (79.3%) | 522 (20.7%) |
| 35 Years and over | 2,160 (76.7%) | 655 (23.3%) |
| Total | 39,362 (84.4%) | 7,275 (15.6%) |
Educational Attainment by Field of Study in Jackson County
Business (6,959 | 13.2%), science & technology (5,958 | 11.3%), education (5,778 | 10.9%), social sciences (5,572 | 10.5%), and bio, nature & agricultural (4,629 | 8.7%) are the most common fields of study among 52,917 individuals in Jackson County who have obtained a bachelor's degree or higher.
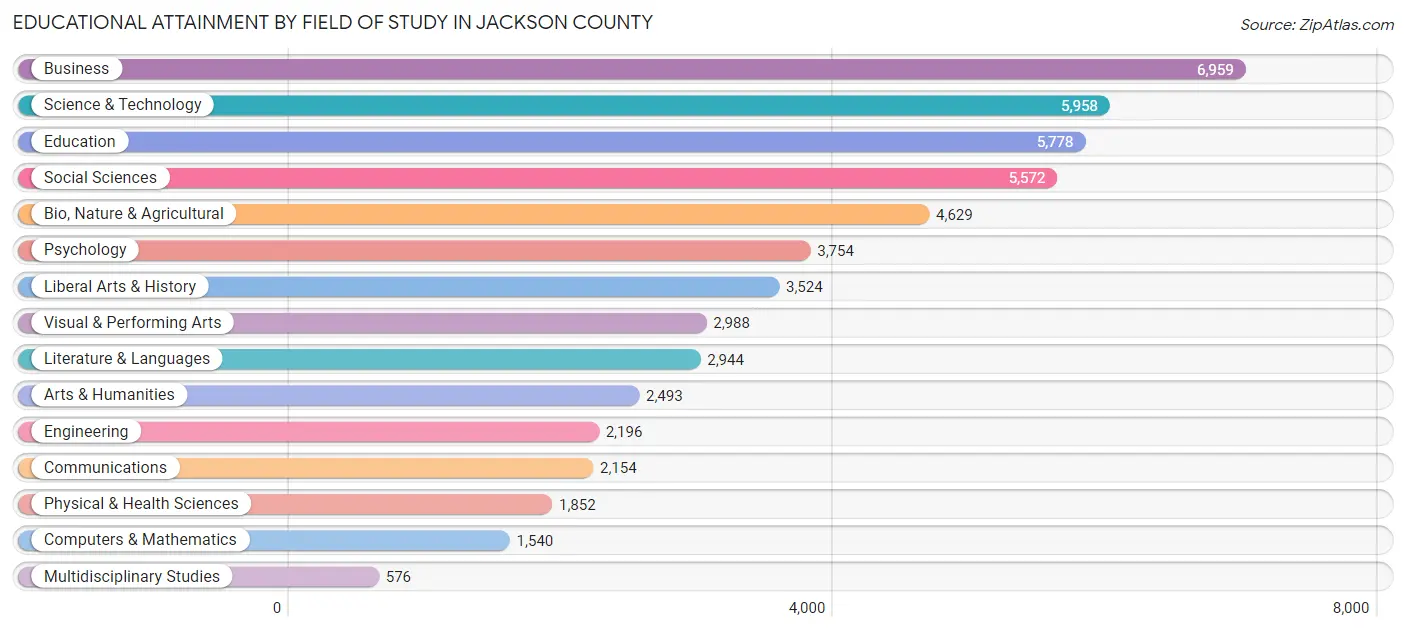
| Field of Study | # Graduates | % Graduates |
| Computers & Mathematics | 1,540 | 2.9% |
| Bio, Nature & Agricultural | 4,629 | 8.7% |
| Physical & Health Sciences | 1,852 | 3.5% |
| Psychology | 3,754 | 7.1% |
| Social Sciences | 5,572 | 10.5% |
| Engineering | 2,196 | 4.2% |
| Multidisciplinary Studies | 576 | 1.1% |
| Science & Technology | 5,958 | 11.3% |
| Business | 6,959 | 13.2% |
| Education | 5,778 | 10.9% |
| Literature & Languages | 2,944 | 5.6% |
| Liberal Arts & History | 3,524 | 6.7% |
| Visual & Performing Arts | 2,988 | 5.7% |
| Communications | 2,154 | 4.1% |
| Arts & Humanities | 2,493 | 4.7% |
| Total | 52,917 | 100.0% |
Transportation & Commute in Jackson County
Vehicle Availability by Sex in Jackson County
The most prevalent vehicle ownership categories in Jackson County are males with 2 vehicles (19,553, accounting for 39.0%) and females with 2 vehicles (18,522, making up 42.1%).
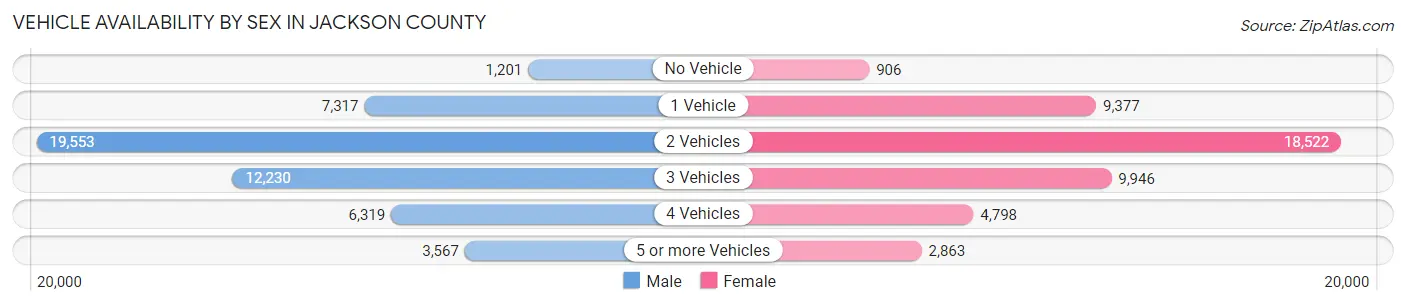
| Vehicles Available | Male | Female |
| No Vehicle | 1,201 (2.4%) | 906 (1.9%) |
| 1 Vehicle | 7,317 (14.6%) | 9,377 (20.2%) |
| 2 Vehicles | 19,553 (39.0%) | 18,522 (39.9%) |
| 3 Vehicles | 12,230 (24.4%) | 9,946 (21.4%) |
| 4 Vehicles | 6,319 (12.6%) | 4,798 (10.3%) |
| 5 or more Vehicles | 3,567 (7.1%) | 2,863 (6.2%) |
| Total | 50,187 (100.0%) | 46,412 (100.0%) |
Commute Time in Jackson County
The most frequently occuring commute durations in Jackson County are 15 to 19 minutes (18,732 commuters, 21.7%), 10 to 14 minutes (18,126 commuters, 21.0%), and 20 to 24 minutes (12,915 commuters, 15.0%).
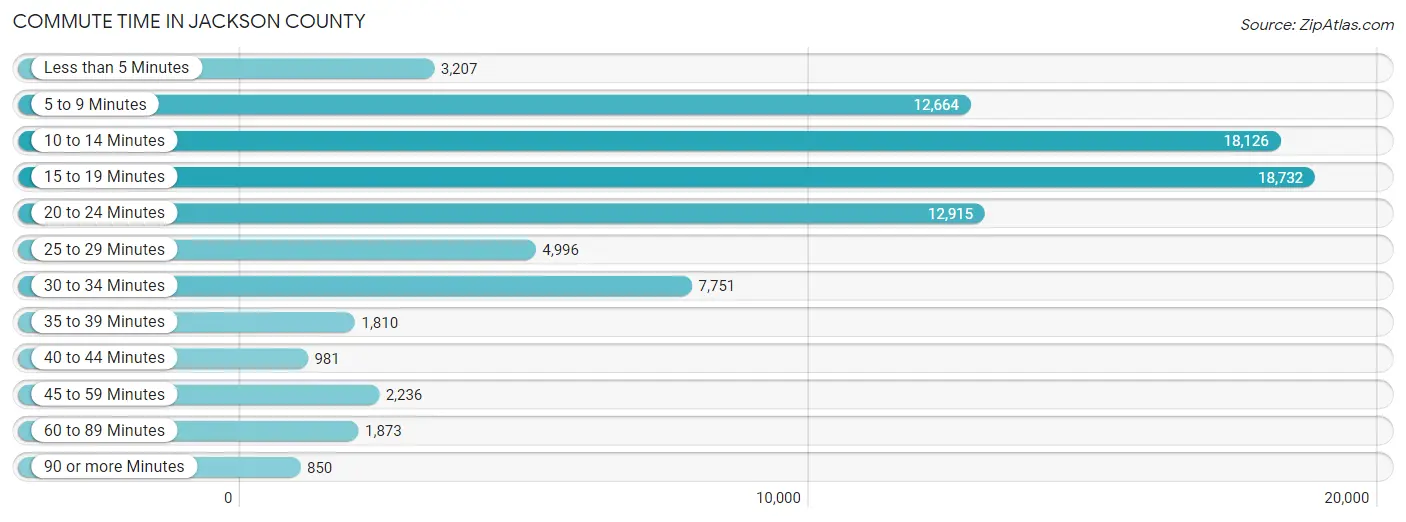
| Commute Time | # Commuters | % Commuters |
| Less than 5 Minutes | 3,207 | 3.7% |
| 5 to 9 Minutes | 12,664 | 14.7% |
| 10 to 14 Minutes | 18,126 | 21.0% |
| 15 to 19 Minutes | 18,732 | 21.7% |
| 20 to 24 Minutes | 12,915 | 15.0% |
| 25 to 29 Minutes | 4,996 | 5.8% |
| 30 to 34 Minutes | 7,751 | 9.0% |
| 35 to 39 Minutes | 1,810 | 2.1% |
| 40 to 44 Minutes | 981 | 1.1% |
| 45 to 59 Minutes | 2,236 | 2.6% |
| 60 to 89 Minutes | 1,873 | 2.2% |
| 90 or more Minutes | 850 | 1.0% |
Commute Time by Sex in Jackson County
The most common commute times in Jackson County are 10 to 14 minutes (10,074 commuters, 22.3%) for males and 15 to 19 minutes (9,136 commuters, 22.3%) for females.
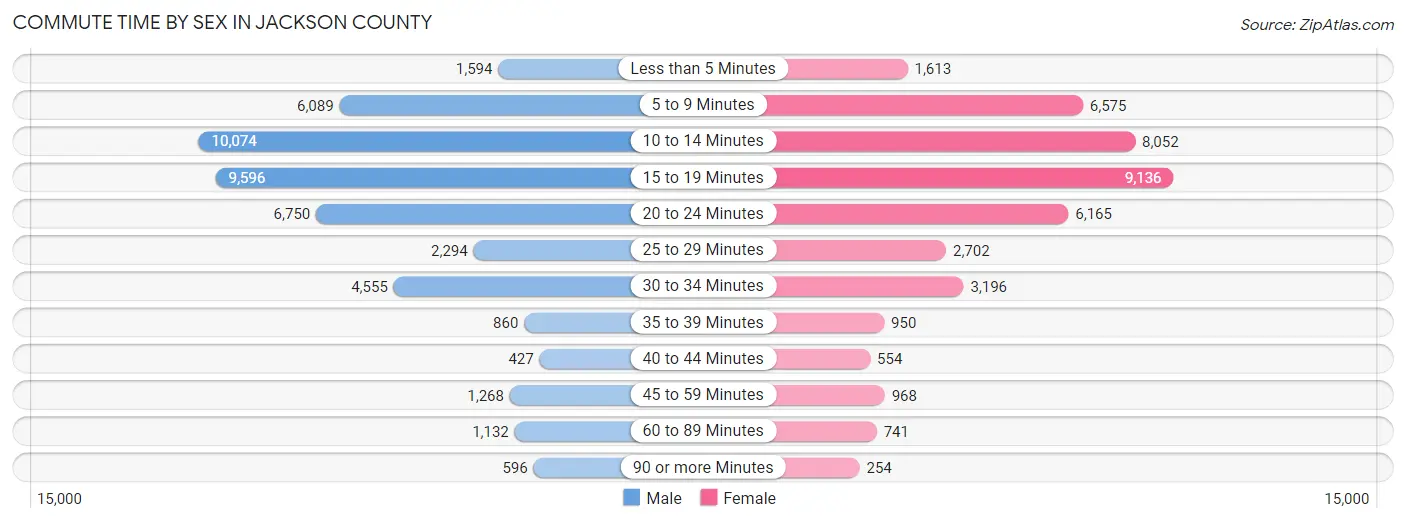
| Commute Time | Male | Female |
| Less than 5 Minutes | 1,594 (3.5%) | 1,613 (3.9%) |
| 5 to 9 Minutes | 6,089 (13.5%) | 6,575 (16.1%) |
| 10 to 14 Minutes | 10,074 (22.3%) | 8,052 (19.7%) |
| 15 to 19 Minutes | 9,596 (21.2%) | 9,136 (22.3%) |
| 20 to 24 Minutes | 6,750 (14.9%) | 6,165 (15.1%) |
| 25 to 29 Minutes | 2,294 (5.1%) | 2,702 (6.6%) |
| 30 to 34 Minutes | 4,555 (10.1%) | 3,196 (7.8%) |
| 35 to 39 Minutes | 860 (1.9%) | 950 (2.3%) |
| 40 to 44 Minutes | 427 (0.9%) | 554 (1.3%) |
| 45 to 59 Minutes | 1,268 (2.8%) | 968 (2.4%) |
| 60 to 89 Minutes | 1,132 (2.5%) | 741 (1.8%) |
| 90 or more Minutes | 596 (1.3%) | 254 (0.6%) |
Time of Departure to Work by Sex in Jackson County
The most frequent times of departure to work in Jackson County are 6:30 AM to 6:59 AM (5,714, 12.6%) for males and 7:30 AM to 7:59 AM (7,709, 18.9%) for females.
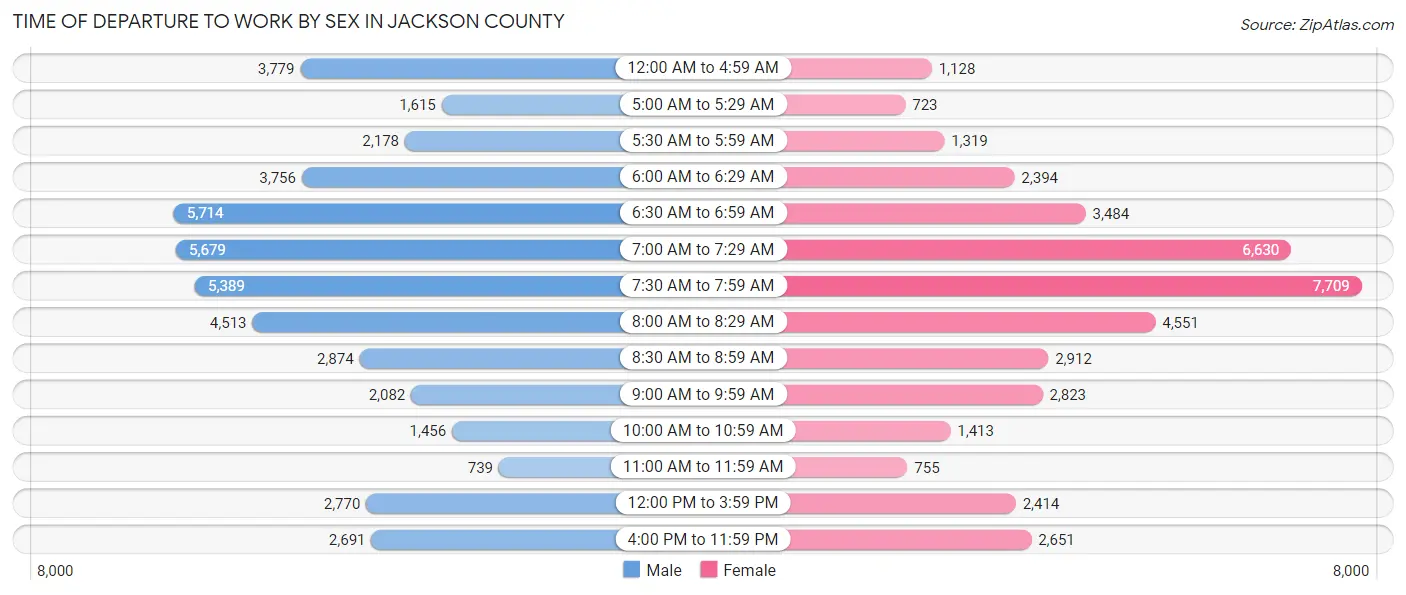
| Time of Departure | Male | Female |
| 12:00 AM to 4:59 AM | 3,779 (8.4%) | 1,128 (2.8%) |
| 5:00 AM to 5:29 AM | 1,615 (3.6%) | 723 (1.8%) |
| 5:30 AM to 5:59 AM | 2,178 (4.8%) | 1,319 (3.2%) |
| 6:00 AM to 6:29 AM | 3,756 (8.3%) | 2,394 (5.9%) |
| 6:30 AM to 6:59 AM | 5,714 (12.6%) | 3,484 (8.5%) |
| 7:00 AM to 7:29 AM | 5,679 (12.6%) | 6,630 (16.2%) |
| 7:30 AM to 7:59 AM | 5,389 (11.9%) | 7,709 (18.9%) |
| 8:00 AM to 8:29 AM | 4,513 (10.0%) | 4,551 (11.1%) |
| 8:30 AM to 8:59 AM | 2,874 (6.4%) | 2,912 (7.1%) |
| 9:00 AM to 9:59 AM | 2,082 (4.6%) | 2,823 (6.9%) |
| 10:00 AM to 10:59 AM | 1,456 (3.2%) | 1,413 (3.5%) |
| 11:00 AM to 11:59 AM | 739 (1.6%) | 755 (1.8%) |
| 12:00 PM to 3:59 PM | 2,770 (6.1%) | 2,414 (5.9%) |
| 4:00 PM to 11:59 PM | 2,691 (5.9%) | 2,651 (6.5%) |
| Total | 45,235 (100.0%) | 40,906 (100.0%) |
Housing Occupancy in Jackson County
Occupancy by Ownership in Jackson County
Of the total 89,876 dwellings in Jackson County, owner-occupied units account for 58,451 (65.0%), while renter-occupied units make up 31,425 (35.0%).
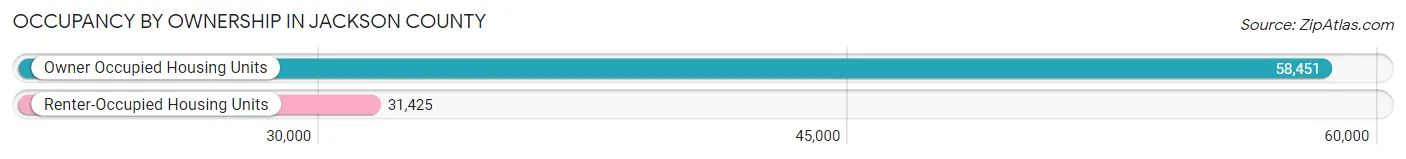
| Occupancy | # Housing Units | % Housing Units |
| Owner Occupied Housing Units | 58,451 | 65.0% |
| Renter-Occupied Housing Units | 31,425 | 35.0% |
| Total Occupied Housing Units | 89,876 | 100.0% |
Occupancy by Household Size in Jackson County
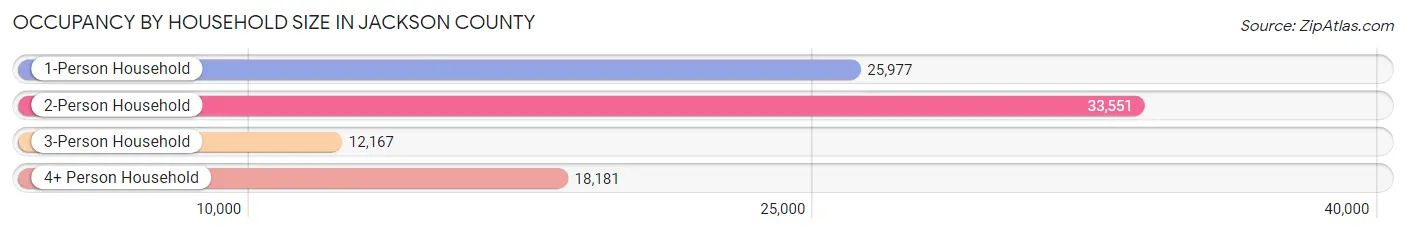
| Household Size | # Housing Units | % Housing Units |
| 1-Person Household | 25,977 | 28.9% |
| 2-Person Household | 33,551 | 37.3% |
| 3-Person Household | 12,167 | 13.5% |
| 4+ Person Household | 18,181 | 20.2% |
| Total Housing Units | 89,876 | 100.0% |
Occupancy by Ownership by Household Size in Jackson County
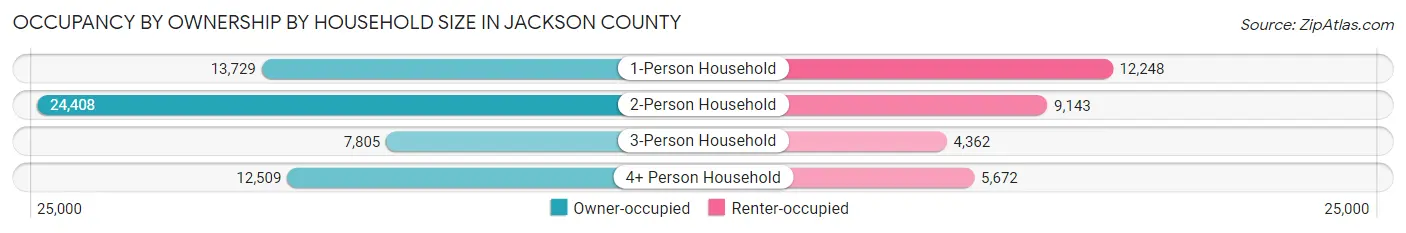
| Household Size | Owner-occupied | Renter-occupied |
| 1-Person Household | 13,729 (52.8%) | 12,248 (47.1%) |
| 2-Person Household | 24,408 (72.8%) | 9,143 (27.3%) |
| 3-Person Household | 7,805 (64.1%) | 4,362 (35.8%) |
| 4+ Person Household | 12,509 (68.8%) | 5,672 (31.2%) |
| Total Housing Units | 58,451 (65.0%) | 31,425 (35.0%) |
Occupancy by Educational Attainment in Jackson County
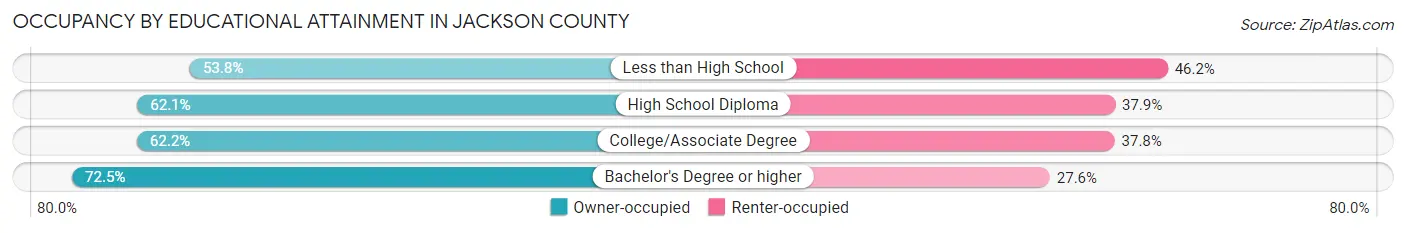
| Household Size | Owner-occupied | Renter-occupied |
| Less than High School | 3,042 (53.8%) | 2,617 (46.2%) |
| High School Diploma | 11,910 (62.1%) | 7,266 (37.9%) |
| College/Associate Degree | 21,933 (62.2%) | 13,341 (37.8%) |
| Bachelor's Degree or higher | 21,566 (72.5%) | 8,201 (27.6%) |
Occupancy by Age of Householder in Jackson County
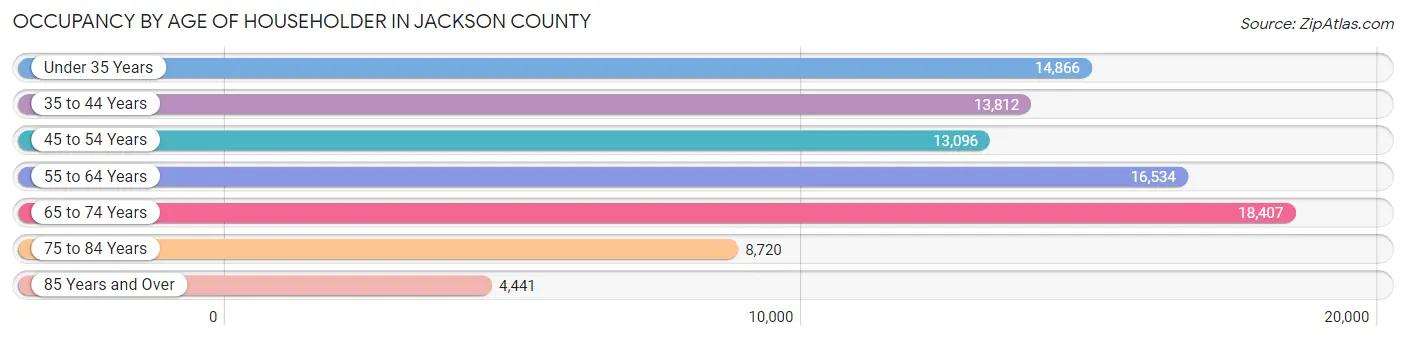
| Age Bracket | # Households | % Households |
| Under 35 Years | 14,866 | 16.5% |
| 35 to 44 Years | 13,812 | 15.4% |
| 45 to 54 Years | 13,096 | 14.6% |
| 55 to 64 Years | 16,534 | 18.4% |
| 65 to 74 Years | 18,407 | 20.5% |
| 75 to 84 Years | 8,720 | 9.7% |
| 85 Years and Over | 4,441 | 4.9% |
| Total | 89,876 | 100.0% |
Housing Finances in Jackson County
Median Income by Occupancy in Jackson County
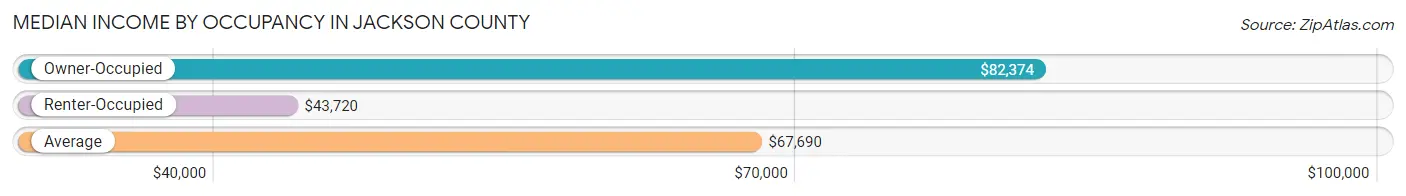
| Occupancy Type | # Households | Median Income |
| Owner-Occupied | 58,451 (65.0%) | $82,374 |
| Renter-Occupied | 31,425 (35.0%) | $43,720 |
| Average | 89,876 (100.0%) | $67,690 |
Occupancy by Householder Income Bracket in Jackson County
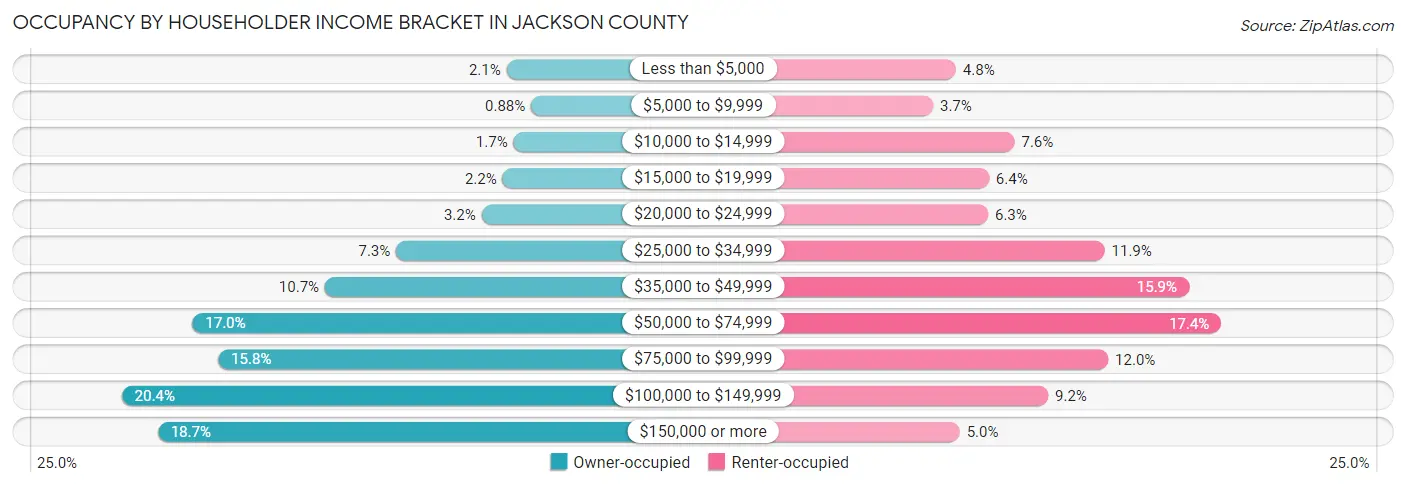
| Income Bracket | Owner-occupied | Renter-occupied |
| Less than $5,000 | 1,199 (2.1%) | 1,503 (4.8%) |
| $5,000 to $9,999 | 516 (0.9%) | 1,161 (3.7%) |
| $10,000 to $14,999 | 1,007 (1.7%) | 2,379 (7.6%) |
| $15,000 to $19,999 | 1,310 (2.2%) | 1,994 (6.4%) |
| $20,000 to $24,999 | 1,893 (3.2%) | 1,982 (6.3%) |
| $25,000 to $34,999 | 4,272 (7.3%) | 3,727 (11.9%) |
| $35,000 to $49,999 | 6,257 (10.7%) | 4,987 (15.9%) |
| $50,000 to $74,999 | 9,945 (17.0%) | 5,470 (17.4%) |
| $75,000 to $99,999 | 9,231 (15.8%) | 3,780 (12.0%) |
| $100,000 to $149,999 | 11,913 (20.4%) | 2,882 (9.2%) |
| $150,000 or more | 10,908 (18.7%) | 1,560 (5.0%) |
| Total | 58,451 (100.0%) | 31,425 (100.0%) |
Monthly Housing Cost Tiers in Jackson County
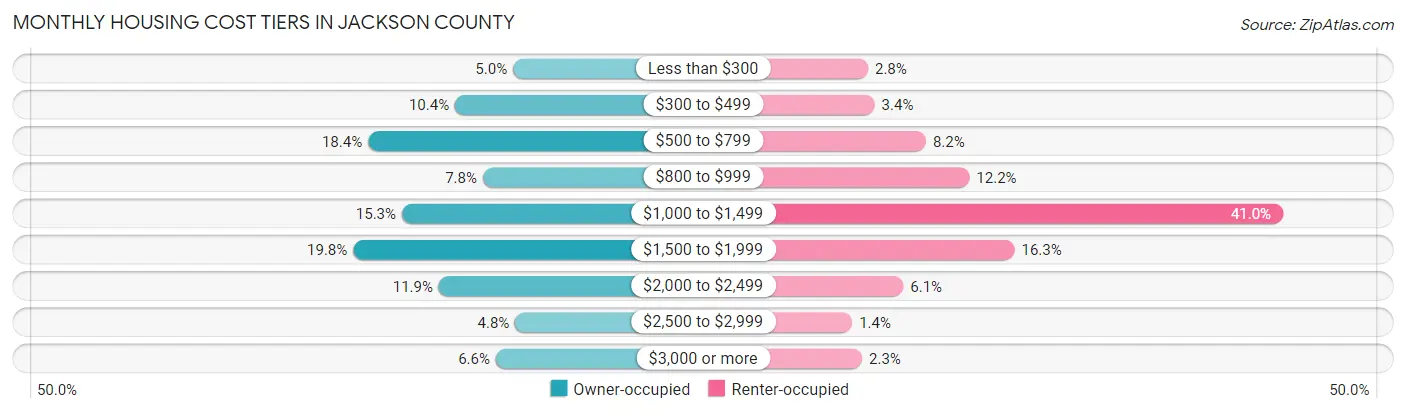
| Monthly Cost | Owner-occupied | Renter-occupied |
| Less than $300 | 2,946 (5.0%) | 885 (2.8%) |
| $300 to $499 | 6,068 (10.4%) | 1,079 (3.4%) |
| $500 to $799 | 10,751 (18.4%) | 2,561 (8.2%) |
| $800 to $999 | 4,573 (7.8%) | 3,818 (12.1%) |
| $1,000 to $1,499 | 8,927 (15.3%) | 12,886 (41.0%) |
| $1,500 to $1,999 | 11,550 (19.8%) | 5,126 (16.3%) |
| $2,000 to $2,499 | 6,938 (11.9%) | 1,909 (6.1%) |
| $2,500 to $2,999 | 2,830 (4.8%) | 428 (1.4%) |
| $3,000 or more | 3,868 (6.6%) | 713 (2.3%) |
| Total | 58,451 (100.0%) | 31,425 (100.0%) |
Physical Housing Characteristics in Jackson County
Housing Structures in Jackson County
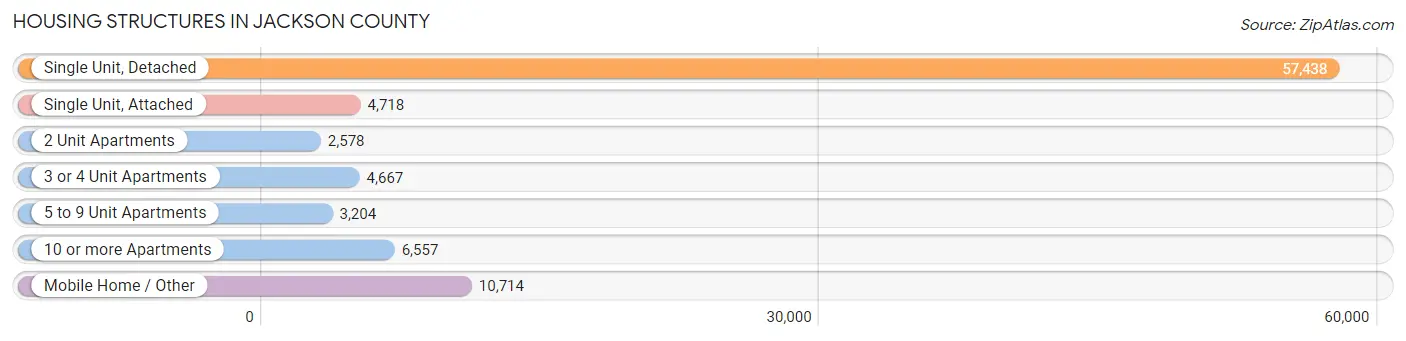
| Structure Type | # Housing Units | % Housing Units |
| Single Unit, Detached | 57,438 | 63.9% |
| Single Unit, Attached | 4,718 | 5.2% |
| 2 Unit Apartments | 2,578 | 2.9% |
| 3 or 4 Unit Apartments | 4,667 | 5.2% |
| 5 to 9 Unit Apartments | 3,204 | 3.6% |
| 10 or more Apartments | 6,557 | 7.3% |
| Mobile Home / Other | 10,714 | 11.9% |
| Total | 89,876 | 100.0% |
Housing Structures by Occupancy in Jackson County
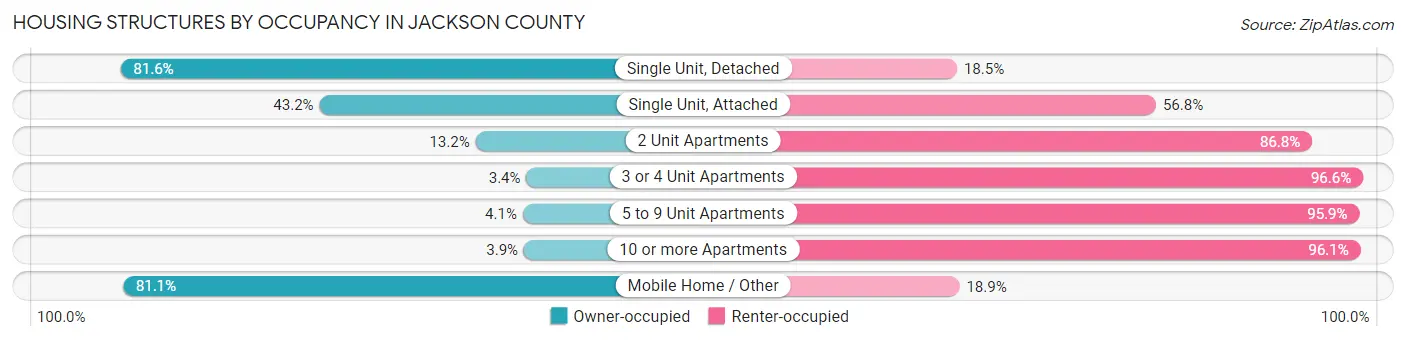
| Structure Type | Owner-occupied | Renter-occupied |
| Single Unit, Detached | 46,843 (81.6%) | 10,595 (18.4%) |
| Single Unit, Attached | 2,040 (43.2%) | 2,678 (56.8%) |
| 2 Unit Apartments | 340 (13.2%) | 2,238 (86.8%) |
| 3 or 4 Unit Apartments | 158 (3.4%) | 4,509 (96.6%) |
| 5 to 9 Unit Apartments | 131 (4.1%) | 3,073 (95.9%) |
| 10 or more Apartments | 253 (3.9%) | 6,304 (96.1%) |
| Mobile Home / Other | 8,686 (81.1%) | 2,028 (18.9%) |
| Total | 58,451 (65.0%) | 31,425 (35.0%) |
Housing Structures by Number of Rooms in Jackson County
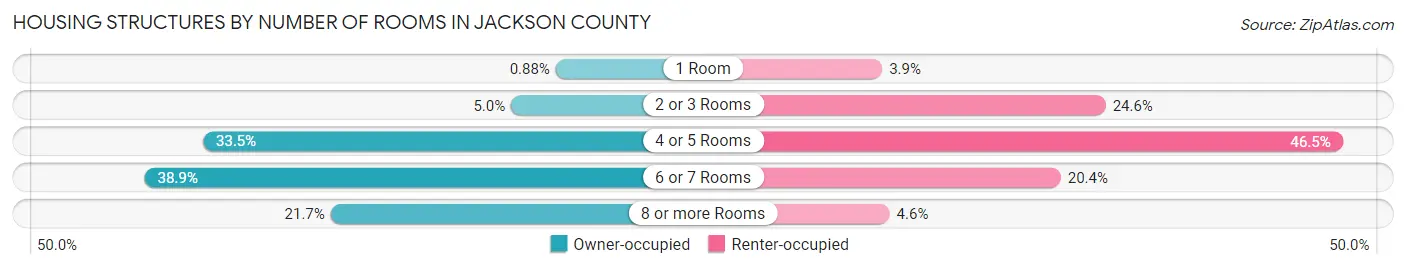
| Number of Rooms | Owner-occupied | Renter-occupied |
| 1 Room | 512 (0.9%) | 1,230 (3.9%) |
| 2 or 3 Rooms | 2,931 (5.0%) | 7,724 (24.6%) |
| 4 or 5 Rooms | 19,589 (33.5%) | 14,608 (46.5%) |
| 6 or 7 Rooms | 22,736 (38.9%) | 6,419 (20.4%) |
| 8 or more Rooms | 12,683 (21.7%) | 1,444 (4.6%) |
| Total | 58,451 (100.0%) | 31,425 (100.0%) |
Housing Structure by Heating Type in Jackson County
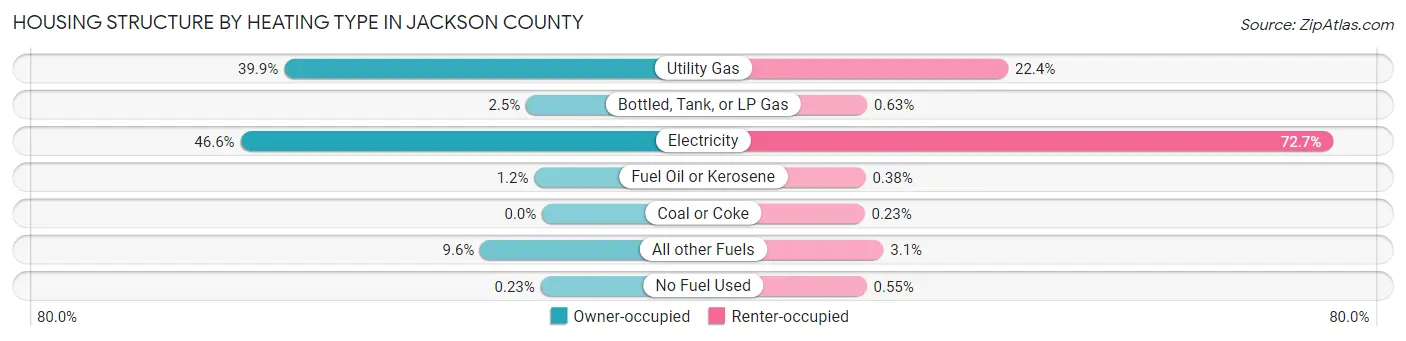
| Heating Type | Owner-occupied | Renter-occupied |
| Utility Gas | 23,314 (39.9%) | 7,042 (22.4%) |
| Bottled, Tank, or LP Gas | 1,445 (2.5%) | 198 (0.6%) |
| Electricity | 27,260 (46.6%) | 22,833 (72.7%) |
| Fuel Oil or Kerosene | 702 (1.2%) | 119 (0.4%) |
| Coal or Coke | 0 (0.0%) | 73 (0.2%) |
| All other Fuels | 5,596 (9.6%) | 987 (3.1%) |
| No Fuel Used | 134 (0.2%) | 173 (0.5%) |
| Total | 58,451 (100.0%) | 31,425 (100.0%) |
Household Vehicle Usage in Jackson County
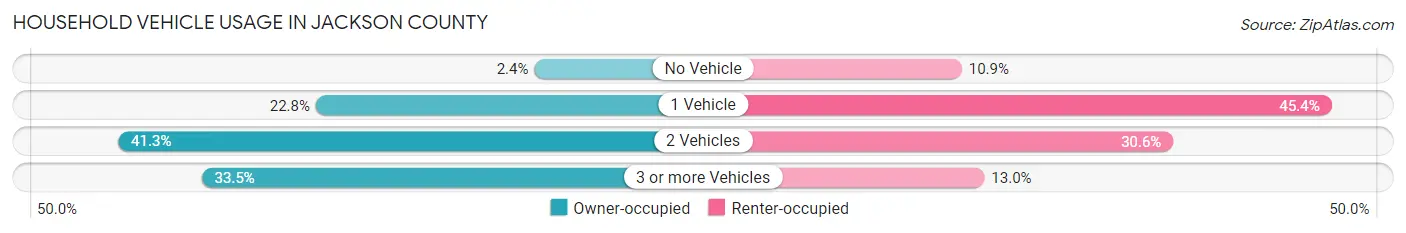
| Vehicles per Household | Owner-occupied | Renter-occupied |
| No Vehicle | 1,413 (2.4%) | 3,430 (10.9%) |
| 1 Vehicle | 13,338 (22.8%) | 14,273 (45.4%) |
| 2 Vehicles | 24,123 (41.3%) | 9,629 (30.6%) |
| 3 or more Vehicles | 19,577 (33.5%) | 4,093 (13.0%) |
| Total | 58,451 (100.0%) | 31,425 (100.0%) |
Real Estate & Mortgages in Jackson County
Real Estate and Mortgage Overview in Jackson County
| Characteristic | Without Mortgage | With Mortgage |
| Housing Units | 23,182 | 35,269 |
| Median Property Value | $346,200 | $380,300 |
| Median Household Income | $58,755 | $8,364 |
| Monthly Housing Costs | $581 | $3,811 |
| Real Estate Taxes | $2,846 | $427 |
Property Value by Mortgage Status in Jackson County
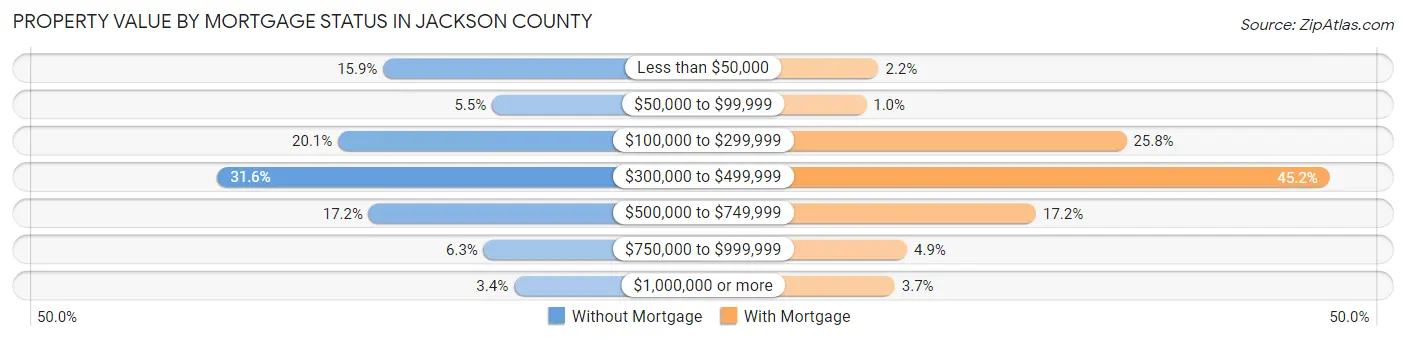
| Property Value | Without Mortgage | With Mortgage |
| Less than $50,000 | 3,675 (15.9%) | 773 (2.2%) |
| $50,000 to $99,999 | 1,271 (5.5%) | 359 (1.0%) |
| $100,000 to $299,999 | 4,668 (20.1%) | 9,099 (25.8%) |
| $300,000 to $499,999 | 7,335 (31.6%) | 15,925 (45.2%) |
| $500,000 to $749,999 | 3,991 (17.2%) | 6,064 (17.2%) |
| $750,000 to $999,999 | 1,455 (6.3%) | 1,730 (4.9%) |
| $1,000,000 or more | 787 (3.4%) | 1,319 (3.7%) |
| Total | 23,182 (100.0%) | 35,269 (100.0%) |
Household Income by Mortgage Status in Jackson County
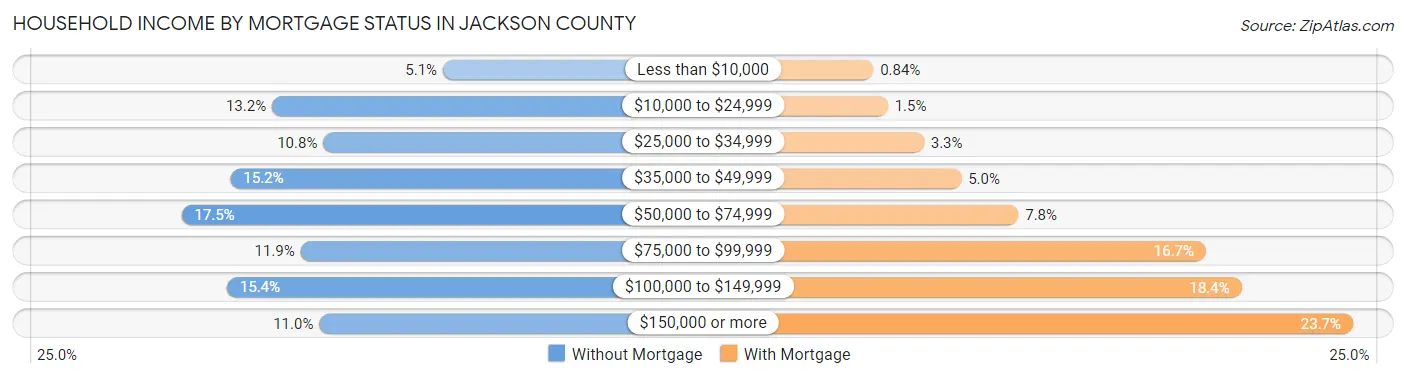
| Household Income | Without Mortgage | With Mortgage |
| Less than $10,000 | 1,177 (5.1%) | 296 (0.8%) |
| $10,000 to $24,999 | 3,065 (13.2%) | 538 (1.5%) |
| $25,000 to $34,999 | 2,498 (10.8%) | 1,145 (3.3%) |
| $35,000 to $49,999 | 3,523 (15.2%) | 1,774 (5.0%) |
| $50,000 to $74,999 | 4,063 (17.5%) | 2,734 (7.7%) |
| $75,000 to $99,999 | 2,750 (11.9%) | 5,882 (16.7%) |
| $100,000 to $149,999 | 3,562 (15.4%) | 6,481 (18.4%) |
| $150,000 or more | 2,544 (11.0%) | 8,351 (23.7%) |
| Total | 23,182 (100.0%) | 35,269 (100.0%) |
Property Value to Household Income Ratio in Jackson County
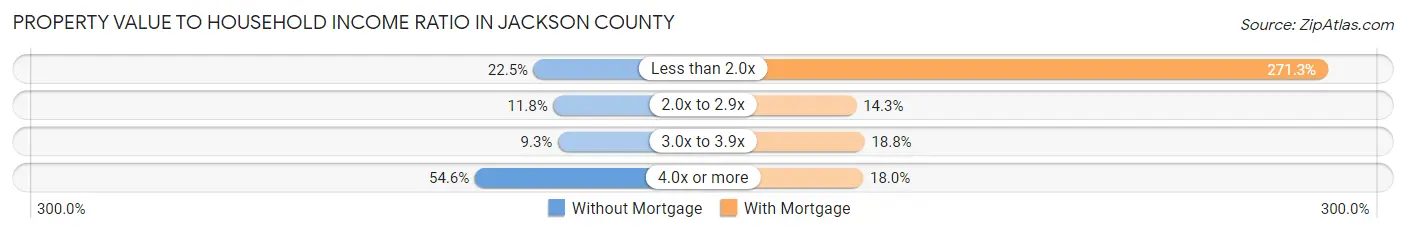
| Value-to-Income Ratio | Without Mortgage | With Mortgage |
| Less than 2.0x | 5,216 (22.5%) | 95,680 (271.3%) |
| 2.0x to 2.9x | 2,742 (11.8%) | 5,055 (14.3%) |
| 3.0x to 3.9x | 2,150 (9.3%) | 6,635 (18.8%) |
| 4.0x or more | 12,649 (54.6%) | 6,360 (18.0%) |
| Total | 23,182 (100.0%) | 35,269 (100.0%) |
Real Estate Taxes by Mortgage Status in Jackson County
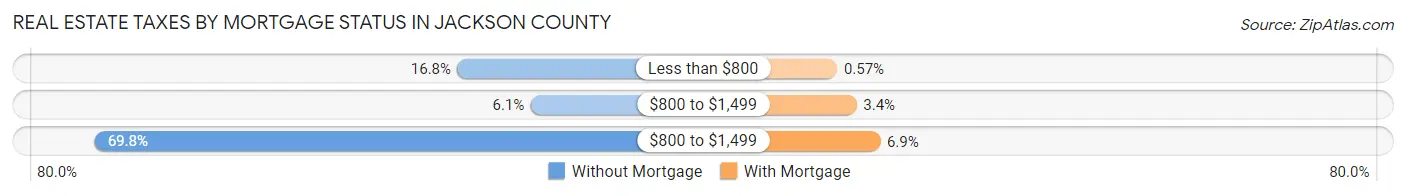
| Property Taxes | Without Mortgage | With Mortgage |
| Less than $800 | 3,903 (16.8%) | 202 (0.6%) |
| $800 to $1,499 | 1,418 (6.1%) | 1,203 (3.4%) |
| $800 to $1,499 | 16,169 (69.8%) | 2,421 (6.9%) |
| Total | 23,182 (100.0%) | 35,269 (100.0%) |
Health & Disability in Jackson County
Health Insurance Coverage by Age in Jackson County
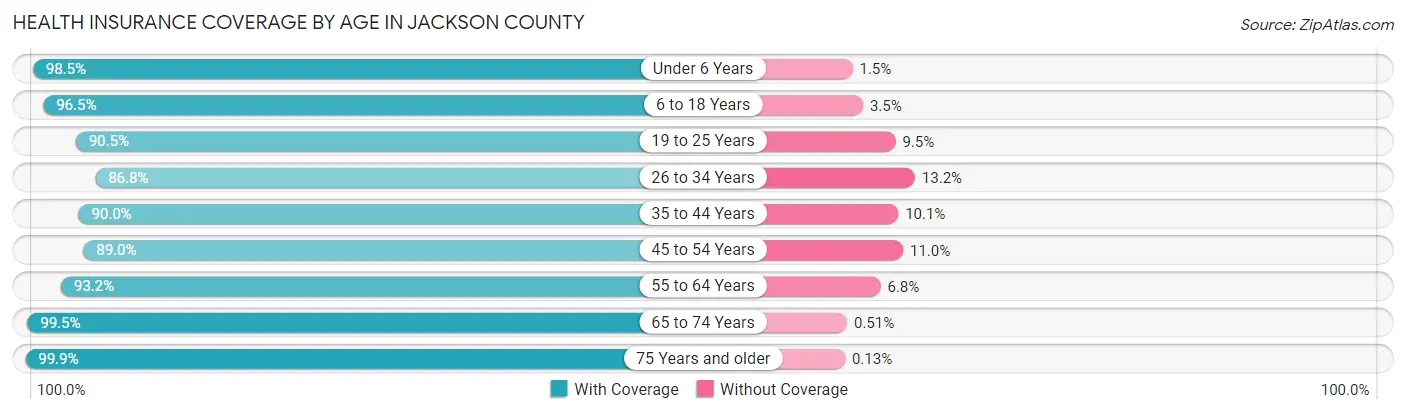
| Age Bracket | With Coverage | Without Coverage |
| Under 6 Years | 13,406 (98.5%) | 209 (1.5%) |
| 6 to 18 Years | 33,482 (96.5%) | 1,208 (3.5%) |
| 19 to 25 Years | 14,991 (90.5%) | 1,581 (9.5%) |
| 26 to 34 Years | 22,040 (86.8%) | 3,344 (13.2%) |
| 35 to 44 Years | 24,420 (89.9%) | 2,728 (10.1%) |
| 45 to 54 Years | 22,129 (89.0%) | 2,723 (11.0%) |
| 55 to 64 Years | 27,649 (93.2%) | 2,006 (6.8%) |
| 65 to 74 Years | 29,476 (99.5%) | 151 (0.5%) |
| 75 Years and older | 19,791 (99.9%) | 26 (0.1%) |
| Total | 207,384 (93.7%) | 13,976 (6.3%) |
Health Insurance Coverage by Citizenship Status in Jackson County
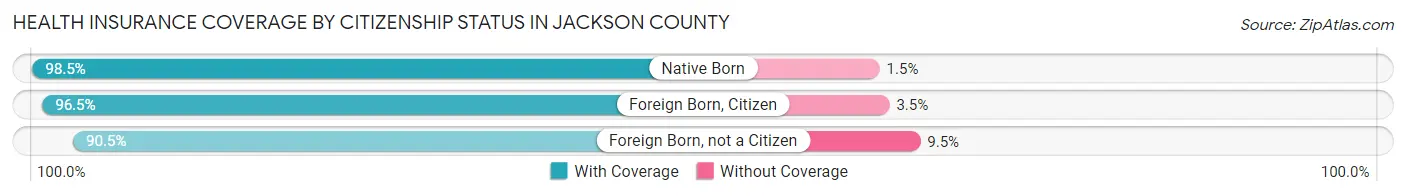
| Citizenship Status | With Coverage | Without Coverage |
| Native Born | 13,406 (98.5%) | 209 (1.5%) |
| Foreign Born, Citizen | 33,482 (96.5%) | 1,208 (3.5%) |
| Foreign Born, not a Citizen | 14,991 (90.5%) | 1,581 (9.5%) |
Health Insurance Coverage by Household Income in Jackson County
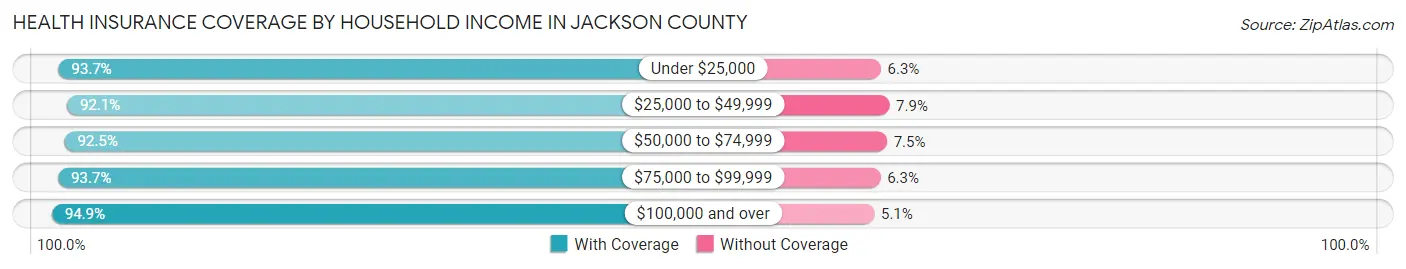
| Household Income | With Coverage | Without Coverage |
| Under $25,000 | 21,998 (93.7%) | 1,490 (6.3%) |
| $25,000 to $49,999 | 36,963 (92.1%) | 3,186 (7.9%) |
| $50,000 to $74,999 | 34,015 (92.5%) | 2,752 (7.5%) |
| $75,000 to $99,999 | 32,655 (93.7%) | 2,181 (6.3%) |
| $100,000 and over | 78,852 (94.9%) | 4,240 (5.1%) |
Public vs Private Health Insurance Coverage by Age in Jackson County
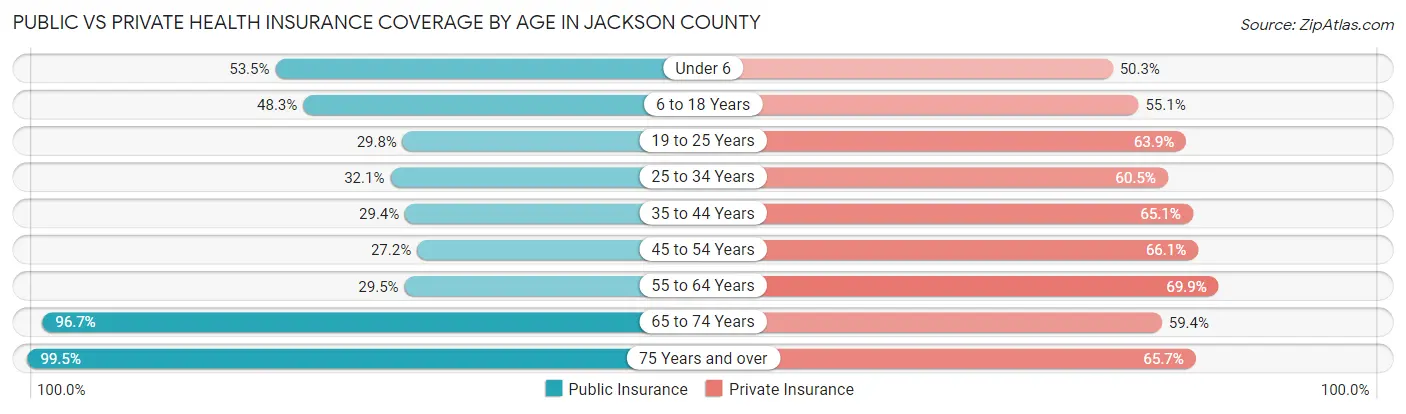
| Age Bracket | Public Insurance | Private Insurance |
| Under 6 | 7,278 (53.5%) | 6,846 (50.3%) |
| 6 to 18 Years | 16,756 (48.3%) | 19,103 (55.1%) |
| 19 to 25 Years | 4,942 (29.8%) | 10,591 (63.9%) |
| 25 to 34 Years | 8,157 (32.1%) | 15,353 (60.5%) |
| 35 to 44 Years | 7,973 (29.4%) | 17,679 (65.1%) |
| 45 to 54 Years | 6,753 (27.2%) | 16,429 (66.1%) |
| 55 to 64 Years | 8,749 (29.5%) | 20,737 (69.9%) |
| 65 to 74 Years | 28,645 (96.7%) | 17,594 (59.4%) |
| 75 Years and over | 19,709 (99.5%) | 13,013 (65.7%) |
| Total | 108,962 (49.2%) | 137,345 (62.1%) |
Disability Status by Sex by Age in Jackson County
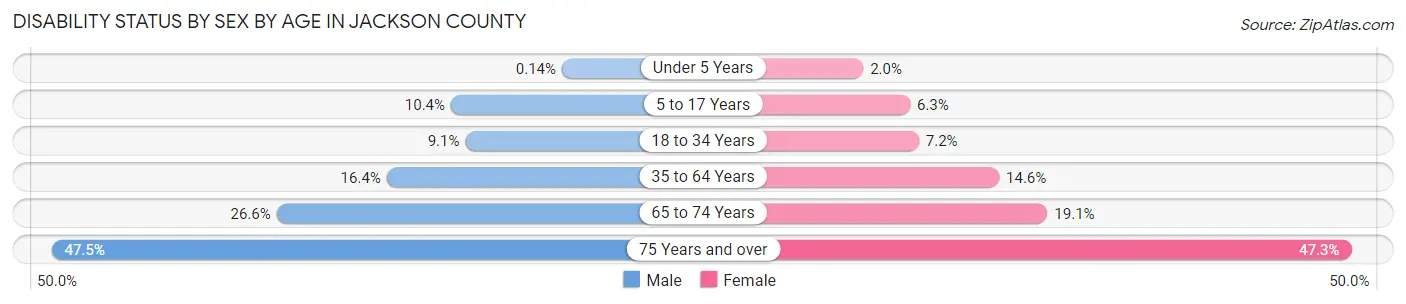
| Age Bracket | Male | Female |
| Under 5 Years | 8 (0.1%) | 111 (2.0%) |
| 5 to 17 Years | 1,815 (10.4%) | 1,046 (6.3%) |
| 18 to 34 Years | 2,036 (9.1%) | 1,610 (7.1%) |
| 35 to 64 Years | 6,616 (16.4%) | 6,031 (14.6%) |
| 65 to 74 Years | 3,705 (26.6%) | 2,997 (19.1%) |
| 75 Years and over | 4,144 (47.5%) | 5,244 (47.3%) |
Disability Class by Sex by Age in Jackson County
Disability Class: Hearing Difficulty
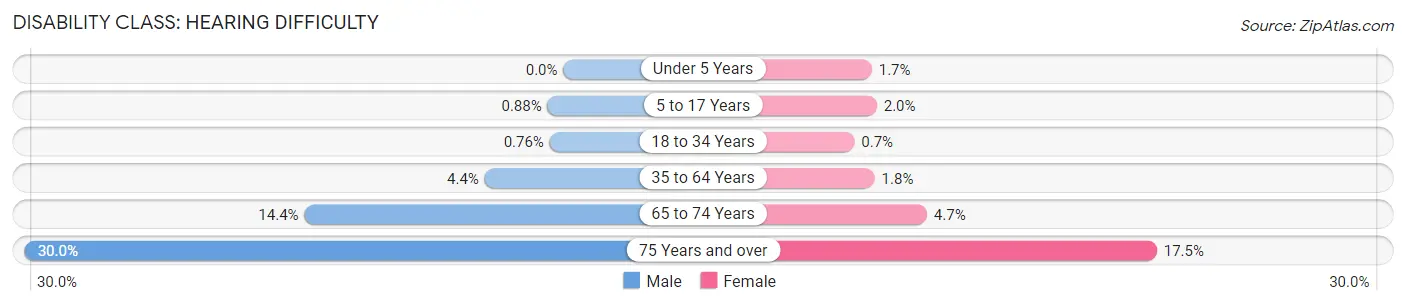
| Age Bracket | Male | Female |
| Under 5 Years | 0 (0.0%) | 93 (1.7%) |
| 5 to 17 Years | 153 (0.9%) | 322 (1.9%) |
| 18 to 34 Years | 171 (0.8%) | 157 (0.7%) |
| 35 to 64 Years | 1,767 (4.4%) | 758 (1.8%) |
| 65 to 74 Years | 2,007 (14.4%) | 745 (4.7%) |
| 75 Years and over | 2,617 (30.0%) | 1,946 (17.5%) |
Disability Class: Vision Difficulty
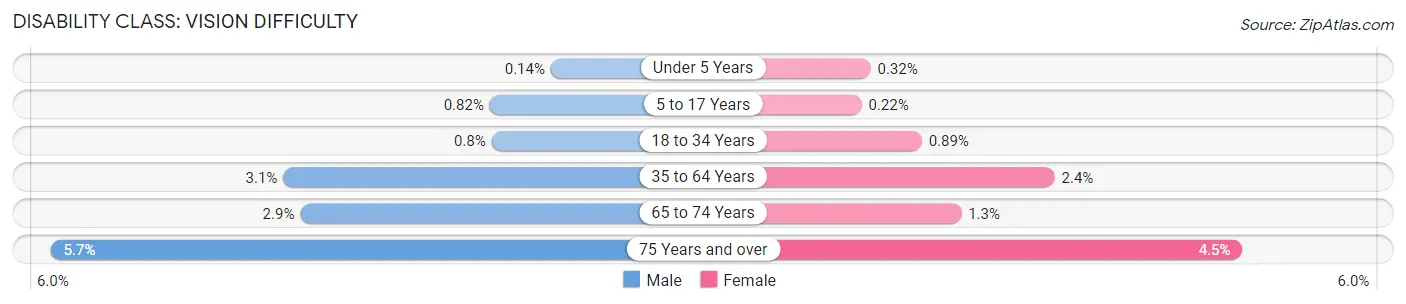
| Age Bracket | Male | Female |
| Under 5 Years | 8 (0.1%) | 18 (0.3%) |
| 5 to 17 Years | 143 (0.8%) | 36 (0.2%) |
| 18 to 34 Years | 180 (0.8%) | 200 (0.9%) |
| 35 to 64 Years | 1,259 (3.1%) | 978 (2.4%) |
| 65 to 74 Years | 408 (2.9%) | 209 (1.3%) |
| 75 Years and over | 498 (5.7%) | 495 (4.5%) |
Disability Class: Cognitive Difficulty
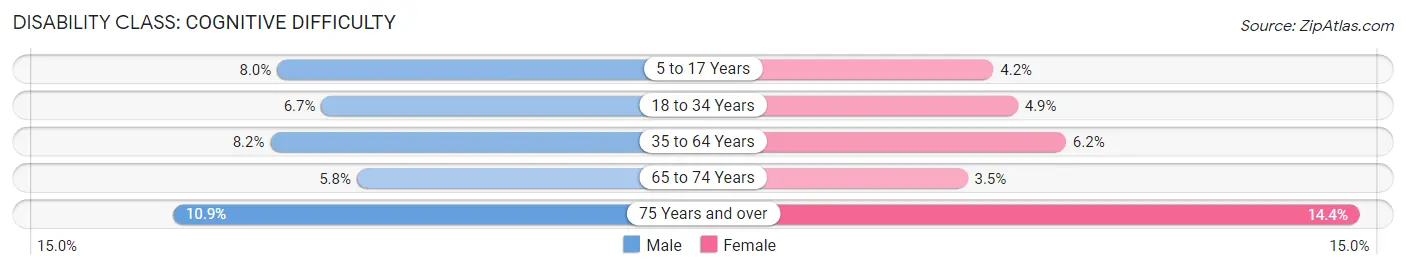
| Age Bracket | Male | Female |
| 5 to 17 Years | 1,386 (8.0%) | 697 (4.2%) |
| 18 to 34 Years | 1,508 (6.7%) | 1,104 (4.9%) |
| 35 to 64 Years | 3,292 (8.2%) | 2,576 (6.2%) |
| 65 to 74 Years | 800 (5.8%) | 550 (3.5%) |
| 75 Years and over | 948 (10.9%) | 1,600 (14.4%) |
Disability Class: Ambulatory Difficulty
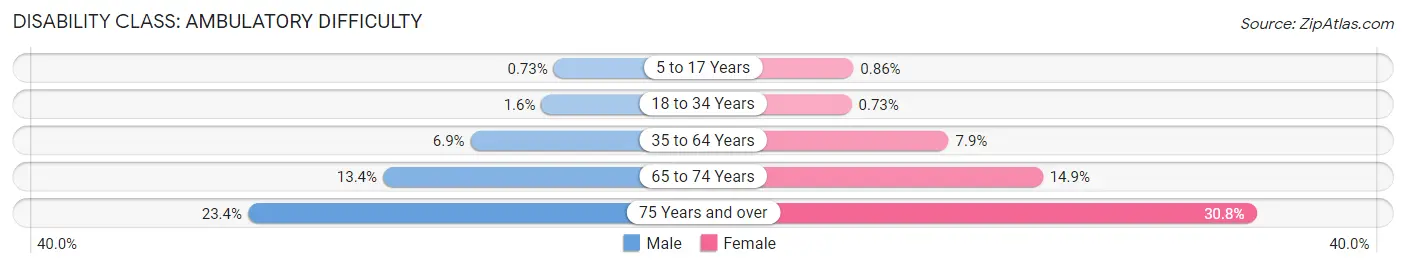
| Age Bracket | Male | Female |
| 5 to 17 Years | 127 (0.7%) | 142 (0.9%) |
| 18 to 34 Years | 368 (1.6%) | 164 (0.7%) |
| 35 to 64 Years | 2,782 (6.9%) | 3,277 (7.9%) |
| 65 to 74 Years | 1,865 (13.4%) | 2,344 (14.9%) |
| 75 Years and over | 2,044 (23.4%) | 3,413 (30.8%) |
Disability Class: Self-Care Difficulty
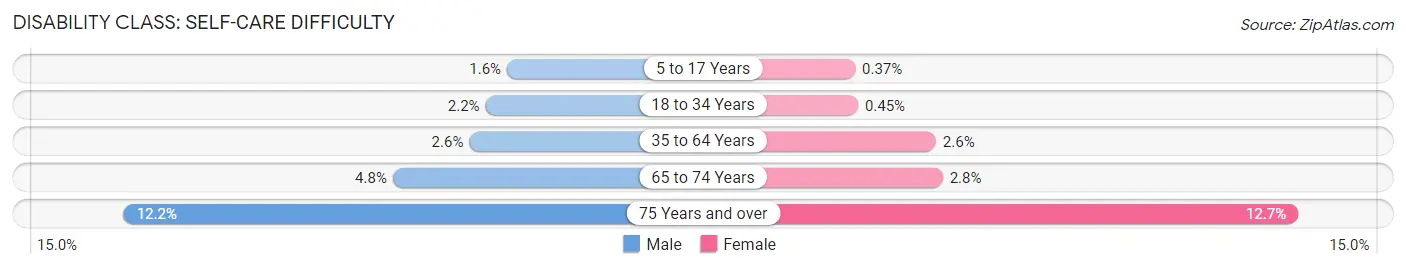
| Age Bracket | Male | Female |
| 5 to 17 Years | 273 (1.6%) | 61 (0.4%) |
| 18 to 34 Years | 486 (2.2%) | 101 (0.4%) |
| 35 to 64 Years | 1,055 (2.6%) | 1,081 (2.6%) |
| 65 to 74 Years | 661 (4.8%) | 441 (2.8%) |
| 75 Years and over | 1,068 (12.2%) | 1,409 (12.7%) |
Technology Access in Jackson County
Computing Device Access in Jackson County
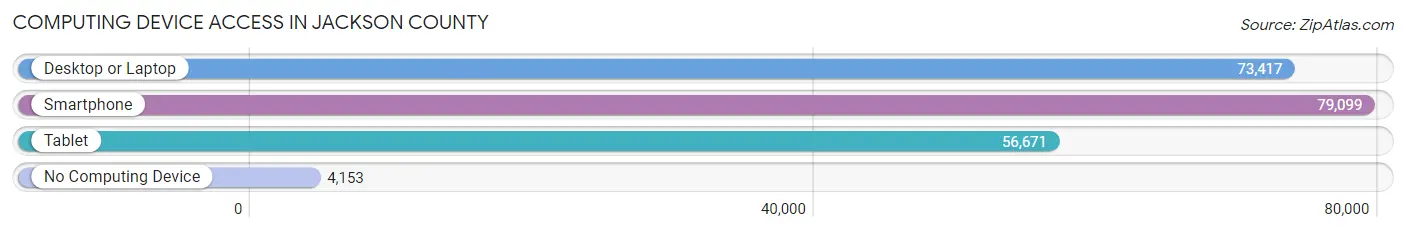
| Device Type | # Households | % Households |
| Desktop or Laptop | 73,417 | 81.7% |
| Smartphone | 79,099 | 88.0% |
| Tablet | 56,671 | 63.0% |
| No Computing Device | 4,153 | 4.6% |
| Total | 89,876 | 100.0% |
Internet Access in Jackson County
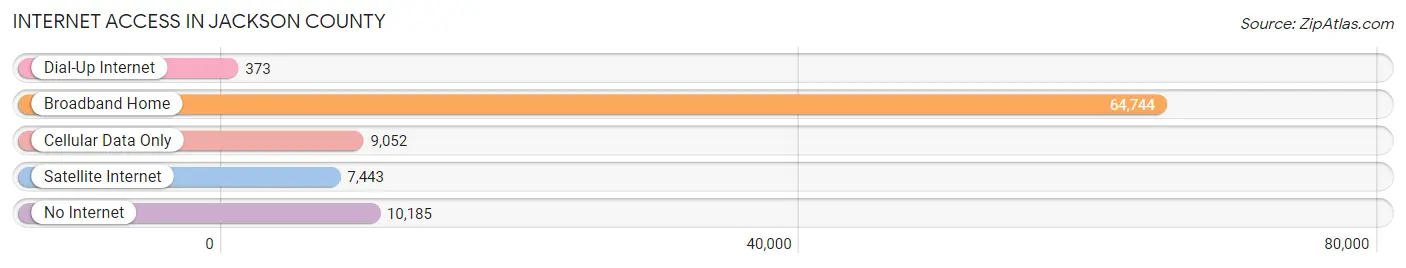
| Internet Type | # Households | % Households |
| Dial-Up Internet | 373 | 0.4% |
| Broadband Home | 64,744 | 72.0% |
| Cellular Data Only | 9,052 | 10.1% |
| Satellite Internet | 7,443 | 8.3% |
| No Internet | 10,185 | 11.3% |
| Total | 89,876 | 100.0% |
Jackson County Summary
Jackson County is located in the southwestern corner of Oregon, and is bordered by Josephine County to the north, Douglas County to the east, and California to the south and west. The county seat is Medford, and the largest city is also Medford. The county was named after Andrew Jackson, the seventh president of the United States.
History
The first inhabitants of Jackson County were Native Americans, including the Takelma, Shasta, and Rogue River tribes. The first European settlers arrived in the area in the mid-1800s, and the county was officially established in 1852. The county was initially part of the Oregon Territory, and then became part of the state of Oregon in 1859.
The county experienced rapid growth in the late 1800s and early 1900s, due to the discovery of gold in the area. This led to an influx of miners and other settlers, and the county’s population grew rapidly. The county also experienced a boom in the timber industry, and the area became known for its lumber production.
Geography
Jackson County covers an area of 2,801 square miles, and is located in the Rogue Valley region of Oregon. The county is mostly mountainous, with the Cascade Range to the east and the Siskiyou Mountains to the west. The highest point in the county is Mount McLoughlin, which has an elevation of 9,495 feet.
The county is home to several rivers, including the Rogue River, Applegate River, and Illinois River. The county also contains several lakes, including Howard Prairie Lake, Hyatt Lake, and Emigrant Lake.
Economy
The economy of Jackson County is largely based on agriculture, forestry, and tourism. The county is home to several wineries, and is known for its production of pears, apples, and other fruits. The county is also home to several timber companies, and is a major producer of lumber.
The county is also home to several manufacturing companies, including Rogue Valley Door, which produces doors and windows, and Pacific Steel, which produces steel products. The county is also home to several technology companies, including Lithia Motors, which is a Fortune 500 company.
Demographics
As of the 2010 census, Jackson County had a population of 203,206. The population is largely white (83.3%), with smaller percentages of Hispanic (7.2%), Asian (3.2%), and African American (2.2%) residents. The median household income is $45,837, and the median age is 38.
Jackson County is home to several colleges and universities, including Southern Oregon University, Rogue Community College, and Oregon Institute of Technology. The county is also home to several museums, including the Southern Oregon Historical Society and the Hanley Farm Museum.
Common Questions
What is the Total Population of Jackson County?
Total Population of Jackson County is 222,604.
What is the Total Male Population of Jackson County?
Total Male Population of Jackson County is 109,360.
What is the Total Female Population of Jackson County?
Total Female Population of Jackson County is 113,244.
What is the Ratio of Males per 100 Females in Jackson County?
There are 96.57 Males per 100 Females in Jackson County.
What is the Ratio of Females per 100 Males in Jackson County?
There are 103.55 Females per 100 Males in Jackson County.
What is the Median Population Age in Jackson County?
Median Population Age in Jackson County is 42.3 Years.
What is the Average Family Size in Jackson County
Average Family Size in Jackson County is 3.0 People.
What is the Average Household Size in Jackson County
Average Household Size in Jackson County is 2.4 People.
What is Per Capita Income in Jackson County?
Per Capita income in Jackson County is $36,538.
What is the Median Family Income in Jackson County?
Median Family Income in Jackson County is $83,081.
What is the Median Household income in Jackson County?
Median Household Income in Jackson County is $67,690.
What is Income or Wage Gap in Jackson County?
Income or Wage Gap in Jackson County is 26.4%.
Women in Jackson County earn 73.6 cents for every dollar earned by a man.
What is Family Income Deficit in Jackson County?
Family Income Deficit in Jackson County is $10,195.
Families that are below poverty line in Jackson County earn $10,195 less on average than the poverty threshold level.
What is Inequality or Gini Index in Jackson County?
Inequality or Gini Index in Jackson County is 0.46.
How Large is the Labor Force in Jackson County?
There are 105,066 People in the Labor Forcein in Jackson County.
What is the Percentage of People in the Labor Force in Jackson County?
57.6% of People are in the Labor Force in Jackson County.
What is the Unemployment Rate in Jackson County?
Unemployment Rate in Jackson County is 5.5%.