Hood River County, OR
Hood River County Map
Hood River County Overview
23,965
TOTAL POPULATION
11,919
MALE POPULATION
12,046
FEMALE POPULATION
98.95
MALES / 100 FEMALES
101.07
FEMALES / 100 MALES
40.2
MEDIAN AGE
3.1
AVG FAMILY SIZE
2.5
AVG HOUSEHOLD SIZE
$43,333
PER CAPITA INCOME
$98,112
AVG FAMILY INCOME
$80,254
AVG HOUSEHOLD INCOME
22.5%
WAGE / INCOME GAP [ % ]
77.5¢/ $1
WAGE / INCOME GAP [ $ ]
0.45
INEQUALITY / GINI INDEX
13,314
LABOR FORCE [ PEOPLE ]
69.4%
PERCENT IN LABOR FORCE
3.3%
UNEMPLOYMENT RATE
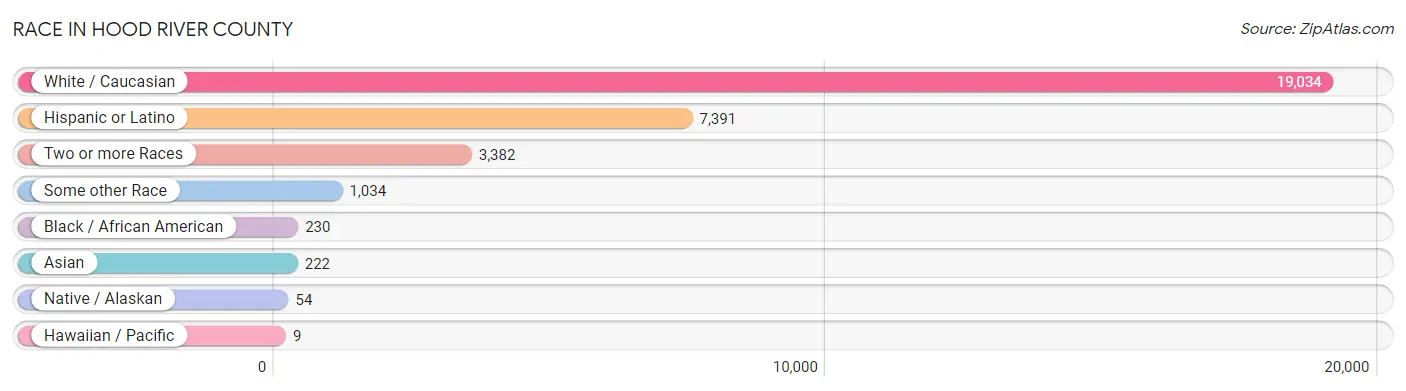
Race in Hood River County
The most populous races in Hood River County are White / Caucasian (19,034 | 79.4%), Hispanic or Latino (7,391 | 30.8%), and Two or more Races (3,382 | 14.1%).
| Race | # Population | % Population |
| Asian | 222 | 0.9% |
| Black / African American | 230 | 1.0% |
| Hawaiian / Pacific | 9 | 0.0% |
| Hispanic or Latino | 7,391 | 30.8% |
| Native / Alaskan | 54 | 0.2% |
| White / Caucasian | 19,034 | 79.4% |
| Two or more Races | 3,382 | 14.1% |
| Some other Race | 1,034 | 4.3% |
| Total | 23,965 | 100.0% |
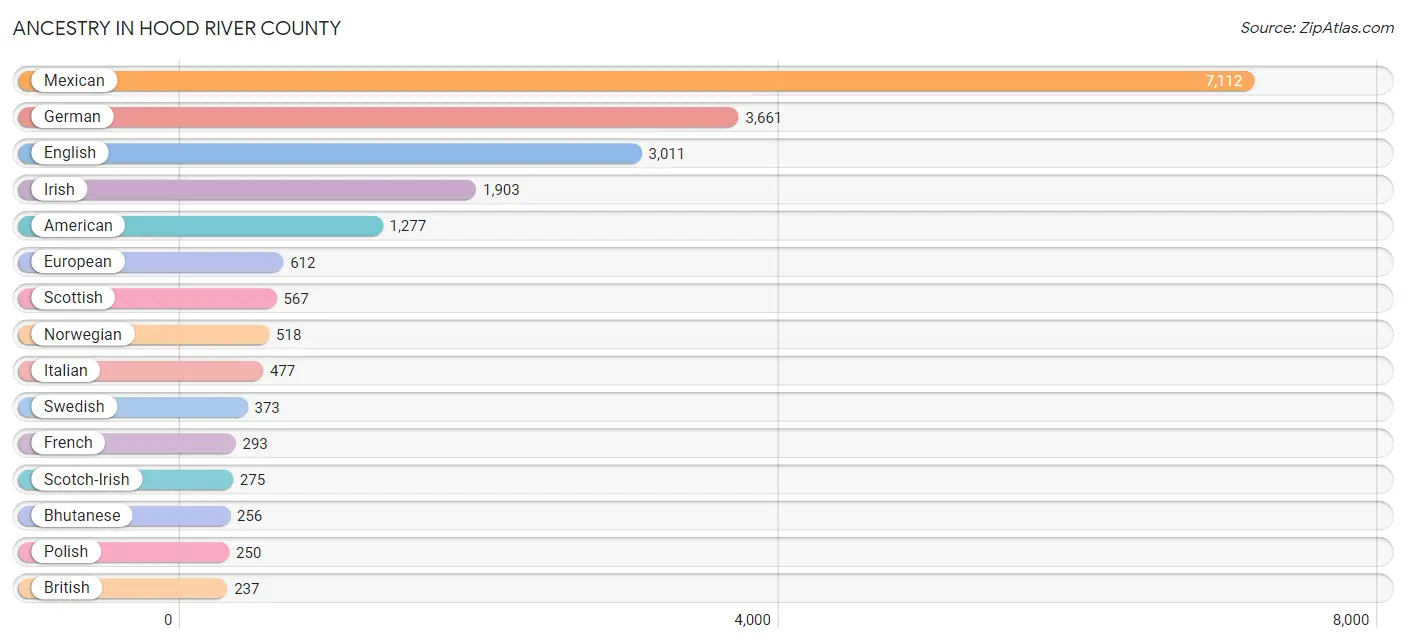
Ancestry in Hood River County
The most populous ancestries reported in Hood River County are Mexican (7,112 | 29.7%), German (3,661 | 15.3%), English (3,011 | 12.6%), Irish (1,903 | 7.9%), and American (1,277 | 5.3%), together accounting for 70.8% of all Hood River County residents.
| Ancestry | # Population | % Population |
| African | 48 | 0.2% |
| American | 1,277 | 5.3% |
| Apache | 16 | 0.1% |
| Arab | 131 | 0.5% |
| Armenian | 18 | 0.1% |
| Australian | 67 | 0.3% |
| Austrian | 155 | 0.6% |
| Basque | 25 | 0.1% |
| Belgian | 17 | 0.1% |
| Bhutanese | 256 | 1.1% |
| Blackfeet | 26 | 0.1% |
| Bolivian | 13 | 0.1% |
| Brazilian | 37 | 0.2% |
| British | 237 | 1.0% |
| Burmese | 217 | 0.9% |
| Cajun | 22 | 0.1% |
| Canadian | 6 | 0.0% |
| Central American | 61 | 0.3% |
| Central American Indian | 9 | 0.0% |
| Cherokee | 167 | 0.7% |
| Chilean | 10 | 0.0% |
| Choctaw | 28 | 0.1% |
| Colombian | 50 | 0.2% |
| Croatian | 36 | 0.2% |
| Czech | 113 | 0.5% |
| Danish | 215 | 0.9% |
| Dutch | 150 | 0.6% |
| Eastern European | 52 | 0.2% |
| Egyptian | 93 | 0.4% |
| English | 3,011 | 12.6% |
| European | 612 | 2.5% |
| Finnish | 43 | 0.2% |
| French | 293 | 1.2% |
| French Canadian | 131 | 0.5% |
| German | 3,661 | 15.3% |
| Greek | 46 | 0.2% |
| Guatemalan | 14 | 0.1% |
| Hungarian | 1 | 0.0% |
| Icelander | 14 | 0.1% |
| Indian (Asian) | 28 | 0.1% |
| Iranian | 7 | 0.0% |
| Irish | 1,903 | 7.9% |
| Iroquois | 6 | 0.0% |
| Israeli | 6 | 0.0% |
| Italian | 477 | 2.0% |
| Korean | 109 | 0.4% |
| Latvian | 20 | 0.1% |
| Lebanese | 5 | 0.0% |
| Lithuanian | 49 | 0.2% |
| Mexican | 7,112 | 29.7% |
| Mexican American Indian | 28 | 0.1% |
| Native Hawaiian | 9 | 0.0% |
| Northern European | 205 | 0.9% |
| Norwegian | 518 | 2.2% |
| Peruvian | 71 | 0.3% |
| Polish | 250 | 1.0% |
| Portuguese | 43 | 0.2% |
| Puerto Rican | 4 | 0.0% |
| Romanian | 54 | 0.2% |
| Russian | 143 | 0.6% |
| Salvadoran | 47 | 0.2% |
| Scandinavian | 42 | 0.2% |
| Scotch-Irish | 275 | 1.1% |
| Scottish | 567 | 2.4% |
| Sioux | 21 | 0.1% |
| Slavic | 3 | 0.0% |
| Slovak | 13 | 0.1% |
| Slovene | 40 | 0.2% |
| South American | 191 | 0.8% |
| Spanish | 23 | 0.1% |
| Sri Lankan | 15 | 0.1% |
| Subsaharan African | 48 | 0.2% |
| Swedish | 373 | 1.6% |
| Swiss | 61 | 0.3% |
| Syrian | 19 | 0.1% |
| Thai | 20 | 0.1% |
| Ukrainian | 63 | 0.3% |
| Venezuelan | 47 | 0.2% |
| Welsh | 97 | 0.4% | View All 79 Rows |
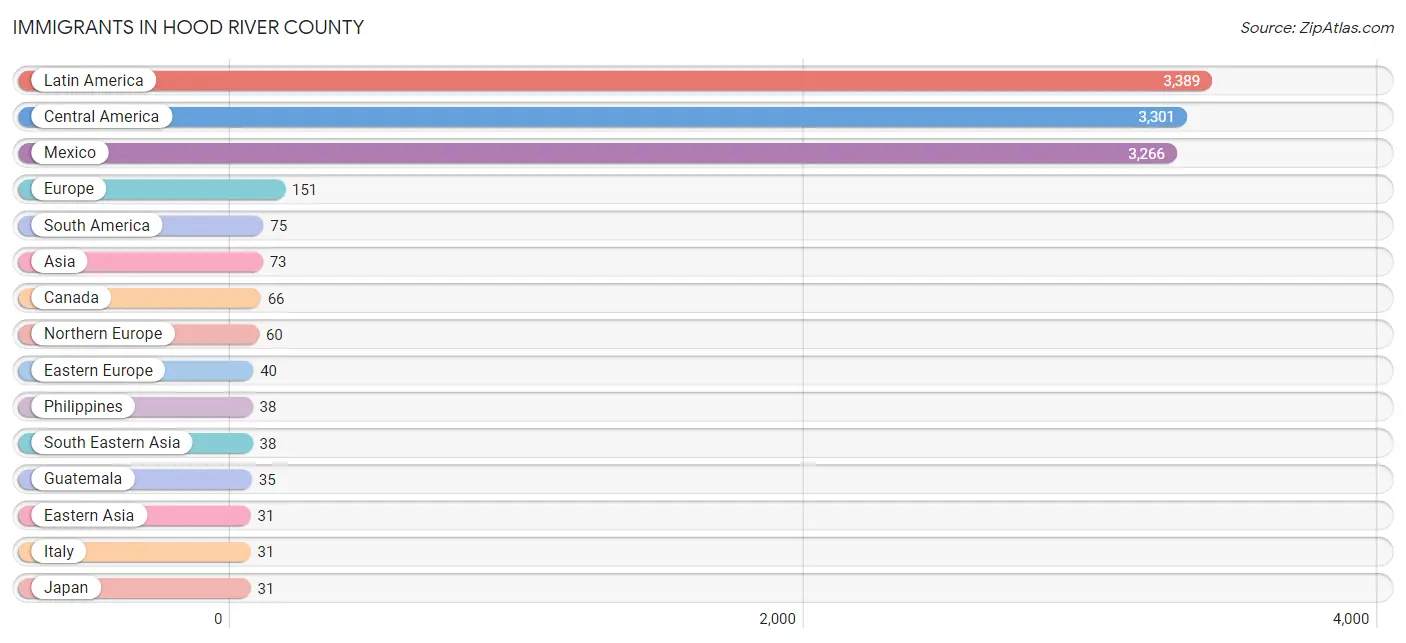
Immigrants in Hood River County
The most numerous immigrant groups reported in Hood River County came from Latin America (3,389 | 14.1%), Central America (3,301 | 13.8%), Mexico (3,266 | 13.6%), Europe (151 | 0.6%), and South America (75 | 0.3%), together accounting for 42.5% of all Hood River County residents.
| Immigration Origin | # Population | % Population |
| Asia | 73 | 0.3% |
| Bolivia | 13 | 0.1% |
| Canada | 66 | 0.3% |
| Caribbean | 13 | 0.1% |
| Central America | 3,301 | 13.8% |
| Chile | 29 | 0.1% |
| Colombia | 5 | 0.0% |
| Denmark | 4 | 0.0% |
| Eastern Asia | 31 | 0.1% |
| Eastern Europe | 40 | 0.2% |
| England | 12 | 0.1% |
| Europe | 151 | 0.6% |
| Germany | 5 | 0.0% |
| Guatemala | 35 | 0.2% |
| Iran | 4 | 0.0% |
| Italy | 31 | 0.1% |
| Jamaica | 13 | 0.1% |
| Japan | 31 | 0.1% |
| Latin America | 3,389 | 14.1% |
| Mexico | 3,266 | 13.6% |
| Netherlands | 15 | 0.1% |
| Northern Europe | 60 | 0.3% |
| Peru | 5 | 0.0% |
| Philippines | 38 | 0.2% |
| Romania | 25 | 0.1% |
| Russia | 15 | 0.1% |
| South America | 75 | 0.3% |
| South Central Asia | 4 | 0.0% |
| South Eastern Asia | 38 | 0.2% |
| Southern Europe | 31 | 0.1% |
| Venezuela | 23 | 0.1% |
| Western Europe | 20 | 0.1% | View All 32 Rows |
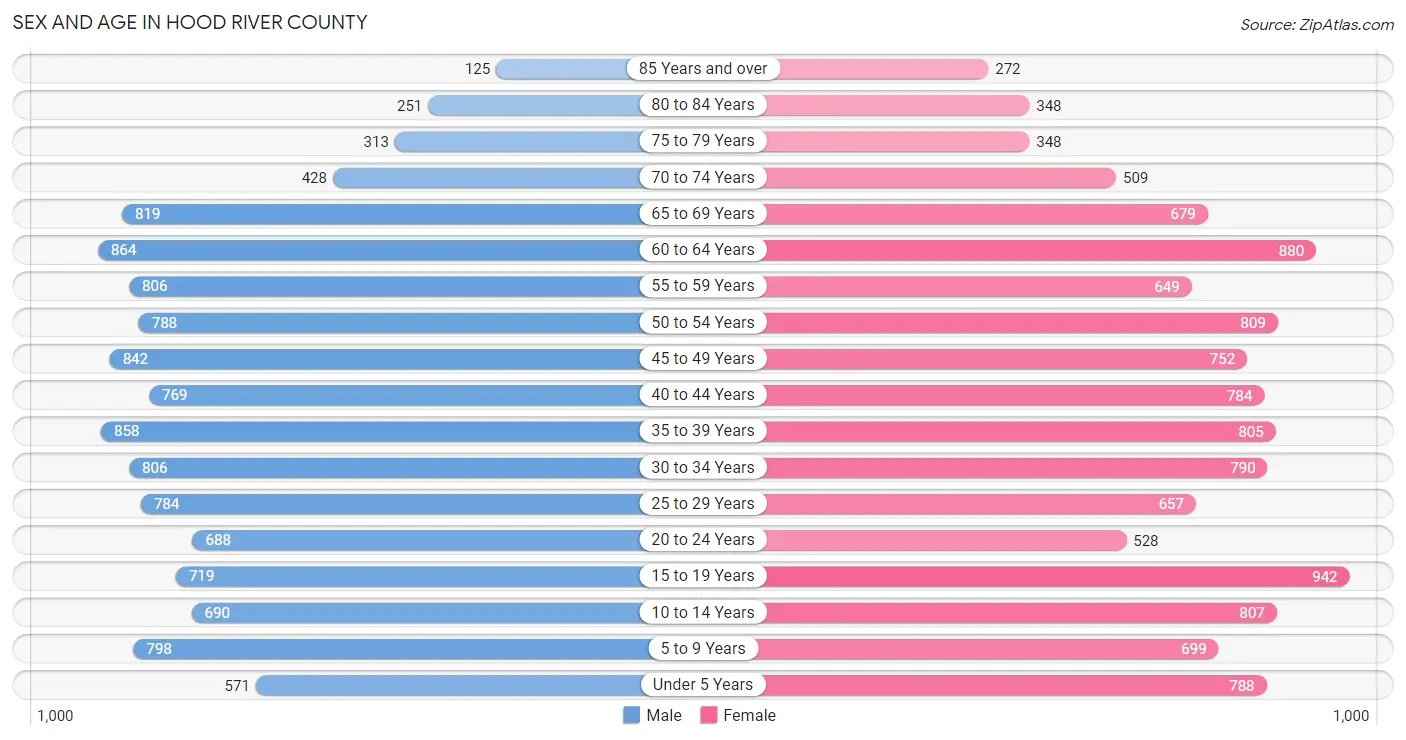
Sex and Age in Hood River County
Sex and Age in Hood River County
The most populous age groups in Hood River County are 60 to 64 Years (864 | 7.2%) for men and 15 to 19 Years (942 | 7.8%) for women.
| Age Bracket | Male | Female |
| Under 5 Years | 571 (4.8%) | 788 (6.5%) |
| 5 to 9 Years | 798 (6.7%) | 699 (5.8%) |
| 10 to 14 Years | 690 (5.8%) | 807 (6.7%) |
| 15 to 19 Years | 719 (6.0%) | 942 (7.8%) |
| 20 to 24 Years | 688 (5.8%) | 528 (4.4%) |
| 25 to 29 Years | 784 (6.6%) | 657 (5.4%) |
| 30 to 34 Years | 806 (6.8%) | 790 (6.6%) |
| 35 to 39 Years | 858 (7.2%) | 805 (6.7%) |
| 40 to 44 Years | 769 (6.5%) | 784 (6.5%) |
| 45 to 49 Years | 842 (7.1%) | 752 (6.2%) |
| 50 to 54 Years | 788 (6.6%) | 809 (6.7%) |
| 55 to 59 Years | 806 (6.8%) | 649 (5.4%) |
| 60 to 64 Years | 864 (7.2%) | 880 (7.3%) |
| 65 to 69 Years | 819 (6.9%) | 679 (5.6%) |
| 70 to 74 Years | 428 (3.6%) | 509 (4.2%) |
| 75 to 79 Years | 313 (2.6%) | 348 (2.9%) |
| 80 to 84 Years | 251 (2.1%) | 348 (2.9%) |
| 85 Years and over | 125 (1.1%) | 272 (2.3%) |
| Total | 11,919 (100.0%) | 12,046 (100.0%) |
Families and Households in Hood River County
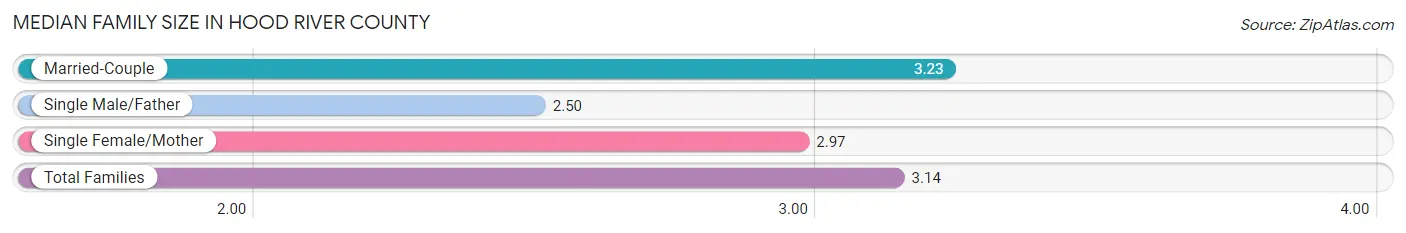
Median Family Size in Hood River County
The median family size in Hood River County is 3.14 persons per family, with married-couple families (4,495 | 78.1%) accounting for the largest median family size of 3.23 persons per family. On the other hand, single male/father families (390 | 6.8%) represent the smallest median family size with 2.50 persons per family.
| Family Type | # Families | Family Size |
| Married-Couple | 4,495 (78.1%) | 3.23 |
| Single Male/Father | 390 (6.8%) | 2.50 |
| Single Female/Mother | 872 (15.1%) | 2.97 |
| Total Families | 5,757 (100.0%) | 3.14 |
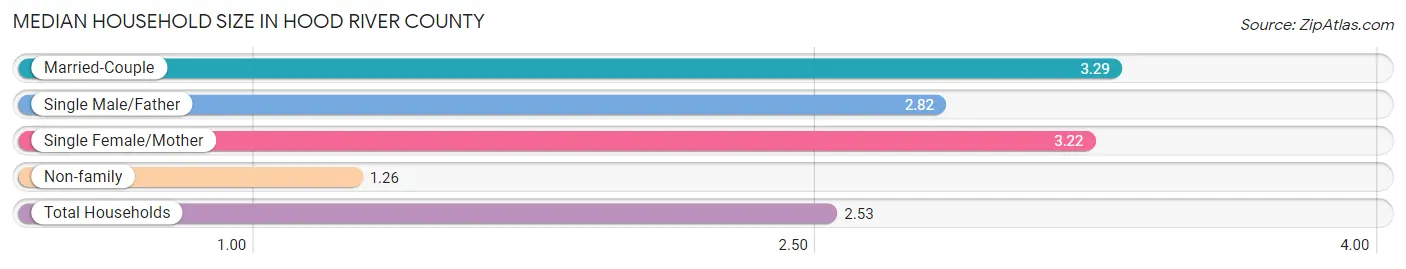
Median Household Size in Hood River County
The median household size in Hood River County is 2.53 persons per household, with married-couple households (4,495 | 49.7%) accounting for the largest median household size of 3.29 persons per household. non-family households (3,282 | 36.3%) represent the smallest median household size with 1.26 persons per household.
| Household Type | # Households | Household Size |
| Married-Couple | 4,495 (49.7%) | 3.29 |
| Single Male/Father | 390 (4.3%) | 2.82 |
| Single Female/Mother | 872 (9.7%) | 3.22 |
| Non-family | 3,282 (36.3%) | 1.26 |
| Total Households | 9,039 (100.0%) | 2.53 |
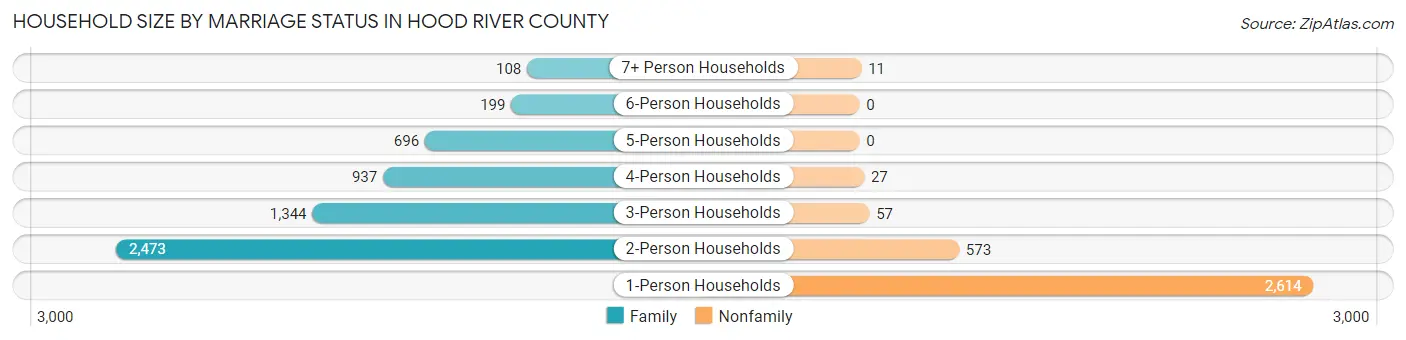
Household Size by Marriage Status in Hood River County
Out of a total of 9,039 households in Hood River County, 5,757 (63.7%) are family households, while 3,282 (36.3%) are nonfamily households. The most numerous type of family households are 2-person households, comprising 2,473, and the most common type of nonfamily households are 1-person households, comprising 2,614.
| Household Size | Family Households | Nonfamily Households |
| 1-Person Households | - | 2,614 (28.9%) |
| 2-Person Households | 2,473 (27.4%) | 573 (6.3%) |
| 3-Person Households | 1,344 (14.9%) | 57 (0.6%) |
| 4-Person Households | 937 (10.4%) | 27 (0.3%) |
| 5-Person Households | 696 (7.7%) | 0 (0.0%) |
| 6-Person Households | 199 (2.2%) | 0 (0.0%) |
| 7+ Person Households | 108 (1.2%) | 11 (0.1%) |
| Total | 5,757 (63.7%) | 3,282 (36.3%) |
Female Fertility in Hood River County
Fertility by Age in Hood River County
Average fertility rate in Hood River County is 52.0 births per 1,000 women. Women in the age bracket of 20 to 34 years have the highest fertility rate with 92.0 births per 1,000 women. Women in the age bracket of 20 to 34 years acount for 63.9% of all women with births.
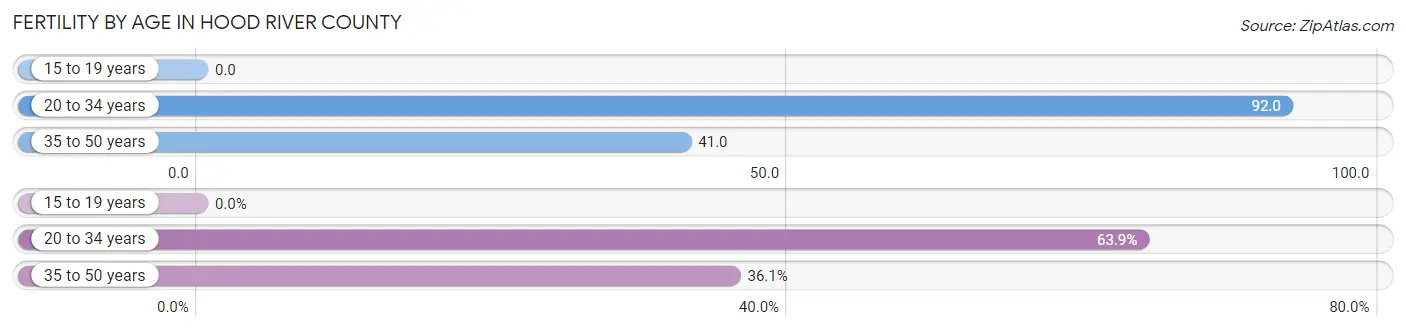
| Age Bracket | Women with Births | Births / 1,000 Women |
| 15 to 19 years | 0 (0.0%) | 0.0 |
| 20 to 34 years | 182 (63.9%) | 92.0 |
| 35 to 50 years | 103 (36.1%) | 41.0 |
| Total | 285 (100.0%) | 52.0 |
Fertility by Age by Marriage Status in Hood River County
68.1% of women with births (285) in Hood River County are married. The highest percentage of unmarried women with births falls into 20 to 34 years age bracket with 40.7% of them unmarried at the time of birth, while the lowest percentage of unmarried women with births belong to 35 to 50 years age bracket with 16.5% of them unmarried.
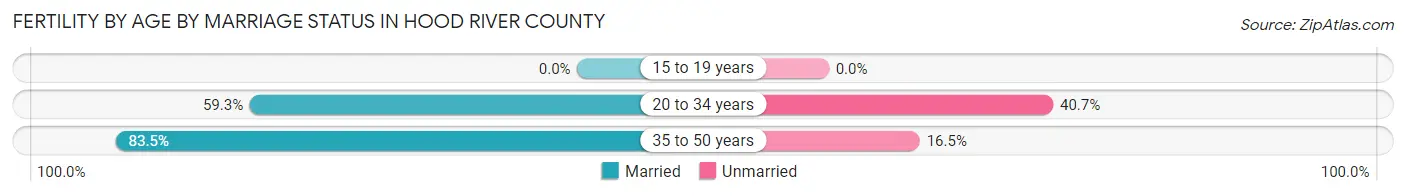
| Age Bracket | Married | Unmarried |
| 15 to 19 years | 0 (0.0%) | 0 (0.0%) |
| 20 to 34 years | 108 (59.3%) | 74 (40.7%) |
| 35 to 50 years | 86 (83.5%) | 17 (16.5%) |
| Total | 194 (68.1%) | 91 (31.9%) |
Fertility by Education in Hood River County
Average fertility rate in Hood River County is 52.0 births per 1,000 women. Women with the education attainment of graduate degree have the highest fertility rate of 130.0 births per 1,000 women, while women with the education attainment of high school diploma have the lowest fertility at 4.0 births per 1,000 women. Women with the education attainment of graduate degree represent 37.2% of all women with births.
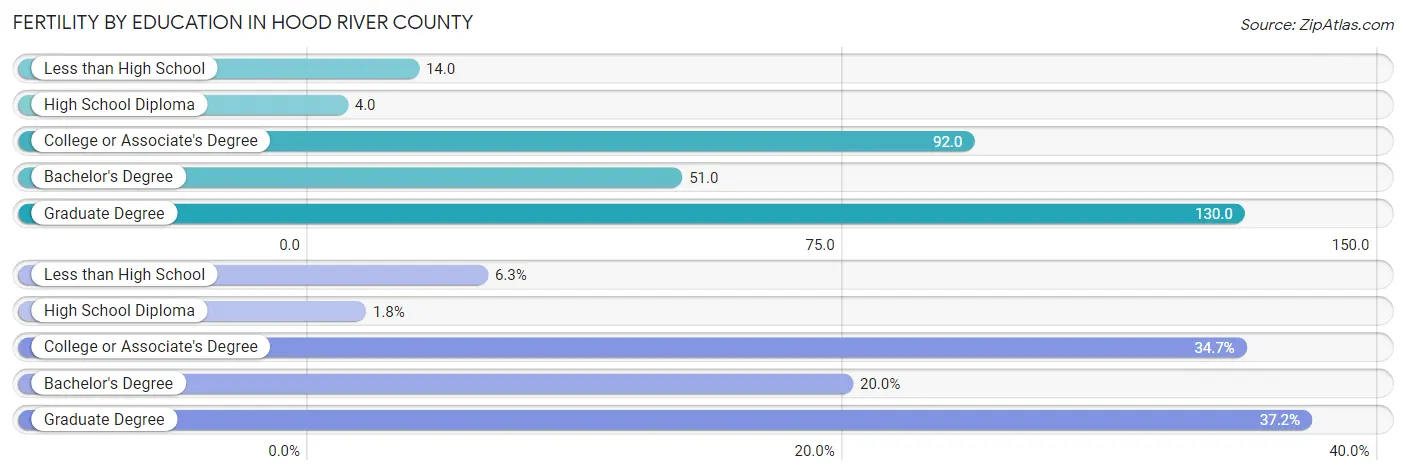
| Educational Attainment | Women with Births | Births / 1,000 Women |
| Less than High School | 18 (6.3%) | 14.0 |
| High School Diploma | 5 (1.8%) | 4.0 |
| College or Associate's Degree | 99 (34.7%) | 92.0 |
| Bachelor's Degree | 57 (20.0%) | 51.0 |
| Graduate Degree | 106 (37.2%) | 130.0 |
| Total | 285 (100.0%) | 52.0 |
Fertility by Education by Marriage Status in Hood River County
31.9% of women with births in Hood River County are unmarried. Women with the educational attainment of bachelor's degree are most likely to be married with 100.0% of them married at childbirth, while women with the educational attainment of high school diploma are least likely to be married with 100.0% of them unmarried at childbirth.
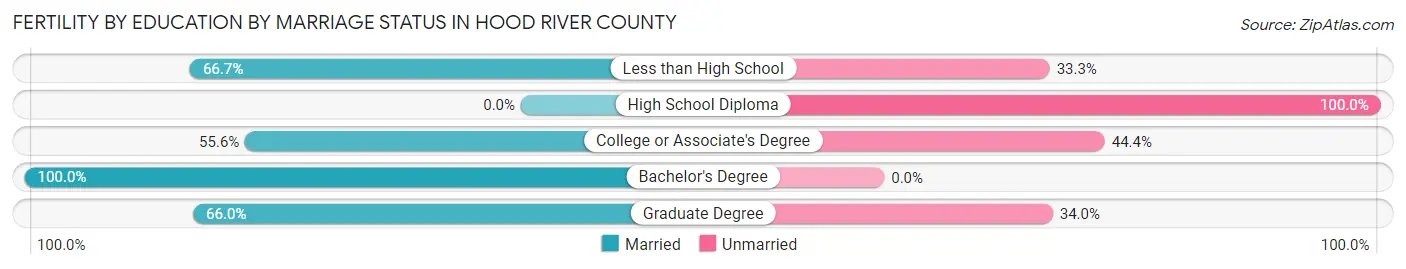
| Educational Attainment | Married | Unmarried |
| Less than High School | 12 (66.7%) | 6 (33.3%) |
| High School Diploma | 0 (0.0%) | 5 (100.0%) |
| College or Associate's Degree | 55 (55.6%) | 44 (44.4%) |
| Bachelor's Degree | 57 (100.0%) | 0 (0.0%) |
| Graduate Degree | 70 (66.0%) | 36 (34.0%) |
| Total | 194 (68.1%) | 91 (31.9%) |
Income in Hood River County
Income Overview in Hood River County
Per Capita Income in Hood River County is $43,333, while median incomes of families and households are $98,112 and $80,254 respectively.
| Characteristic | Number | Measure |
| Per Capita Income | 23,965 | $43,333 |
| Median Family Income | 5,757 | $98,112 |
| Mean Family Income | 5,757 | $128,236 |
| Median Household Income | 9,039 | $80,254 |
| Mean Household Income | 9,039 | $112,036 |
| Income Deficit | 5,757 | $0 |
| Wage / Income Gap (%) | 23,965 | 22.52% |
| Wage / Income Gap ($) | 23,965 | 77.48¢ per $1 |
| Gini / Inequality Index | 23,965 | 0.45 |
Earnings by Sex in Hood River County
Average Earnings in Hood River County are $39,066, $44,200 for men and $34,247 for women, a difference of 22.5%.

| Sex | Number | Average Earnings |
| Male | 7,453 (53.8%) | $44,200 |
| Female | 6,408 (46.2%) | $34,247 |
| Total | 13,861 (100.0%) | $39,066 |
Earnings by Sex by Income Bracket in Hood River County
The most common earnings brackets in Hood River County are $100,000+ for men (1,458 | 19.6%) and $25,000 to $29,999 for women (598 | 9.3%).
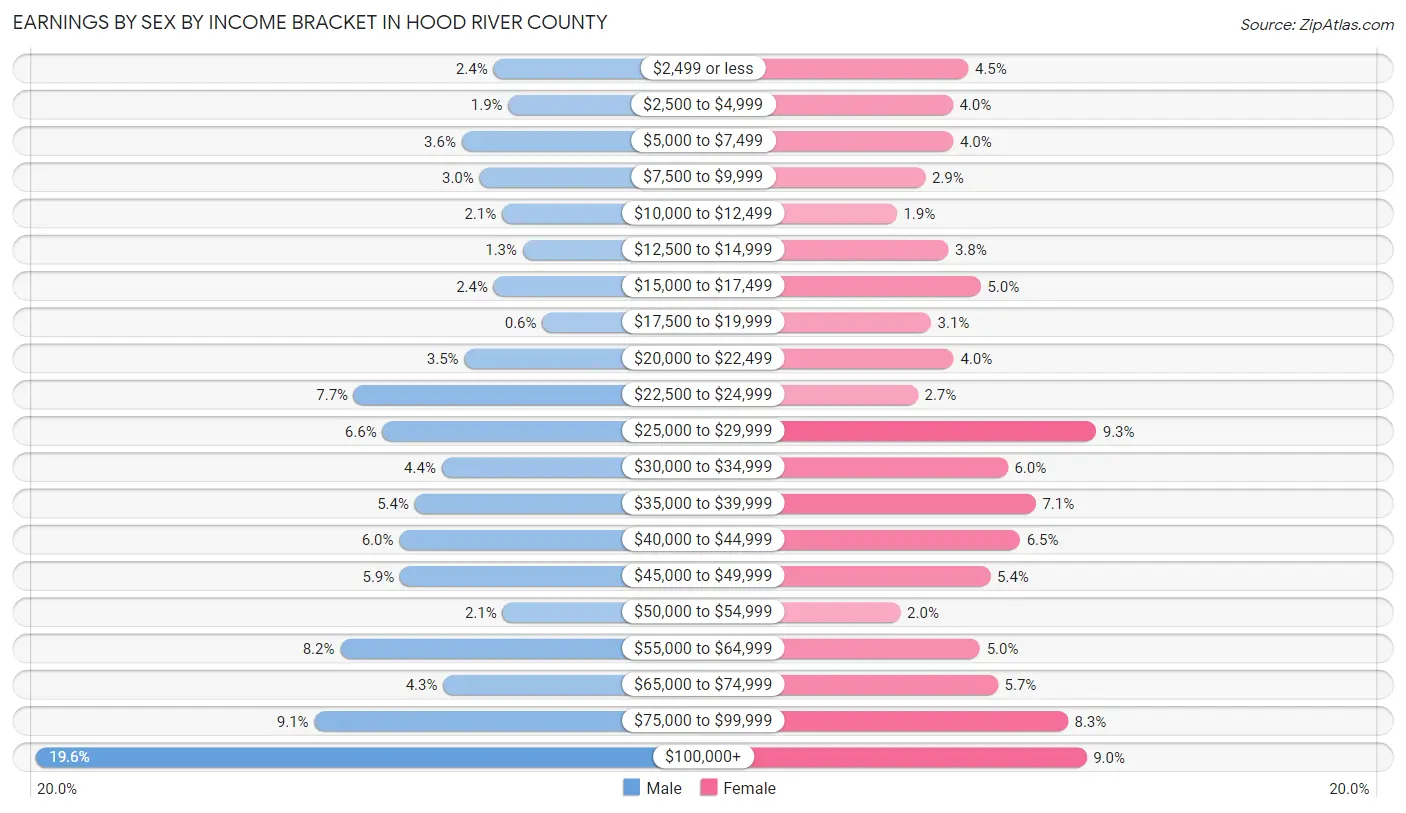
| Income | Male | Female |
| $2,499 or less | 181 (2.4%) | 291 (4.5%) |
| $2,500 to $4,999 | 139 (1.9%) | 254 (4.0%) |
| $5,000 to $7,499 | 270 (3.6%) | 255 (4.0%) |
| $7,500 to $9,999 | 220 (2.9%) | 188 (2.9%) |
| $10,000 to $12,499 | 157 (2.1%) | 119 (1.9%) |
| $12,500 to $14,999 | 99 (1.3%) | 243 (3.8%) |
| $15,000 to $17,499 | 180 (2.4%) | 321 (5.0%) |
| $17,500 to $19,999 | 45 (0.6%) | 201 (3.1%) |
| $20,000 to $22,499 | 262 (3.5%) | 256 (4.0%) |
| $22,500 to $24,999 | 571 (7.7%) | 170 (2.6%) |
| $25,000 to $29,999 | 491 (6.6%) | 598 (9.3%) |
| $30,000 to $34,999 | 326 (4.4%) | 386 (6.0%) |
| $35,000 to $39,999 | 401 (5.4%) | 453 (7.1%) |
| $40,000 to $44,999 | 444 (6.0%) | 415 (6.5%) |
| $45,000 to $49,999 | 442 (5.9%) | 344 (5.4%) |
| $50,000 to $54,999 | 156 (2.1%) | 128 (2.0%) |
| $55,000 to $64,999 | 609 (8.2%) | 319 (5.0%) |
| $65,000 to $74,999 | 321 (4.3%) | 362 (5.7%) |
| $75,000 to $99,999 | 681 (9.1%) | 530 (8.3%) |
| $100,000+ | 1,458 (19.6%) | 575 (9.0%) |
| Total | 7,453 (100.0%) | 6,408 (100.0%) |
Earnings by Sex by Educational Attainment in Hood River County
Average earnings in Hood River County are $49,737 for men and $38,235 for women, a difference of 23.1%. Men with an educational attainment of graduate degree enjoy the highest average annual earnings of $94,031, while those with less than high school education earn the least with $35,149. Women with an educational attainment of graduate degree earn the most with the average annual earnings of $68,846, while those with less than high school education have the smallest earnings of $26,051.
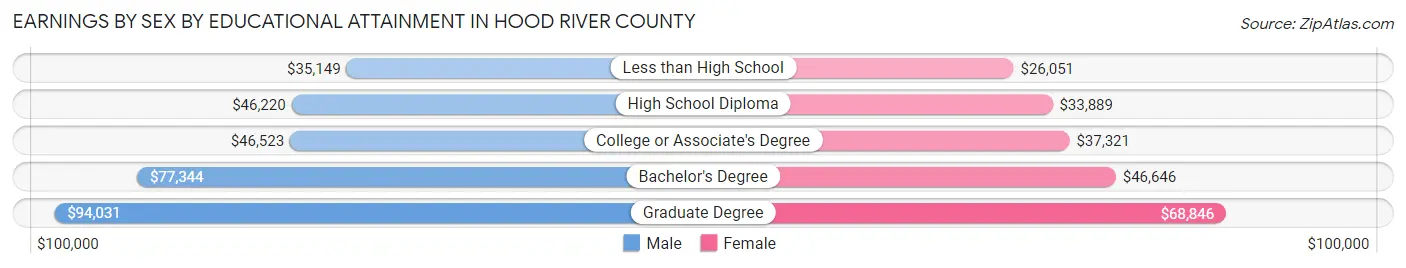
| Educational Attainment | Male Income | Female Income |
| Less than High School | $35,149 | $26,051 |
| High School Diploma | $46,220 | $33,889 |
| College or Associate's Degree | $46,523 | $37,321 |
| Bachelor's Degree | $77,344 | $46,646 |
| Graduate Degree | $94,031 | $68,846 |
| Total | $49,737 | $38,235 |
Family Income in Hood River County
Family Income Brackets in Hood River County
According to the Hood River County family income data, there are 1,169 families falling into the $100,000 to $149,999 income range, which is the most common income bracket and makes up 20.3% of all families. Conversely, the $10,000 to $14,999 income bracket is the least frequent group with only 46 families (0.8%) belonging to this category.
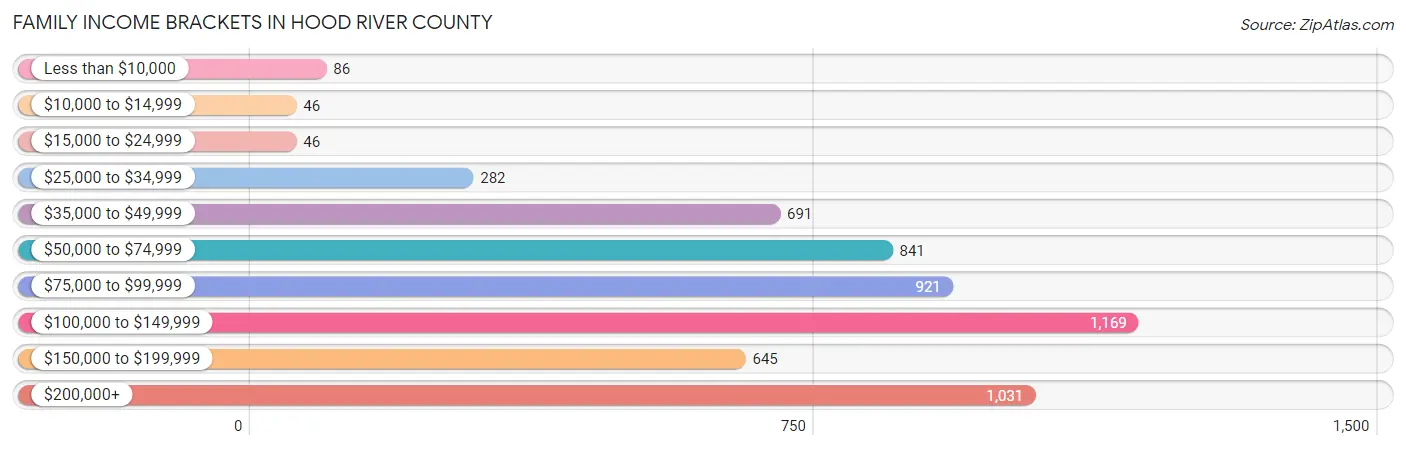
| Income Bracket | # Families | % Families |
| Less than $10,000 | 86 | 1.5% |
| $10,000 to $14,999 | 46 | 0.8% |
| $15,000 to $24,999 | 46 | 0.8% |
| $25,000 to $34,999 | 282 | 4.9% |
| $35,000 to $49,999 | 691 | 12.0% |
| $50,000 to $74,999 | 841 | 14.6% |
| $75,000 to $99,999 | 921 | 16.0% |
| $100,000 to $149,999 | 1,169 | 20.3% |
| $150,000 to $199,999 | 645 | 11.2% |
| $200,000+ | 1,031 | 17.9% |
Family Income by Famaliy Size in Hood River County
6-person families (150 | 2.6%) account for the highest median family income in Hood River County with $172,917 per family, while 2-person families (2,663 | 46.3%) have the highest median income of $40,866 per family member.
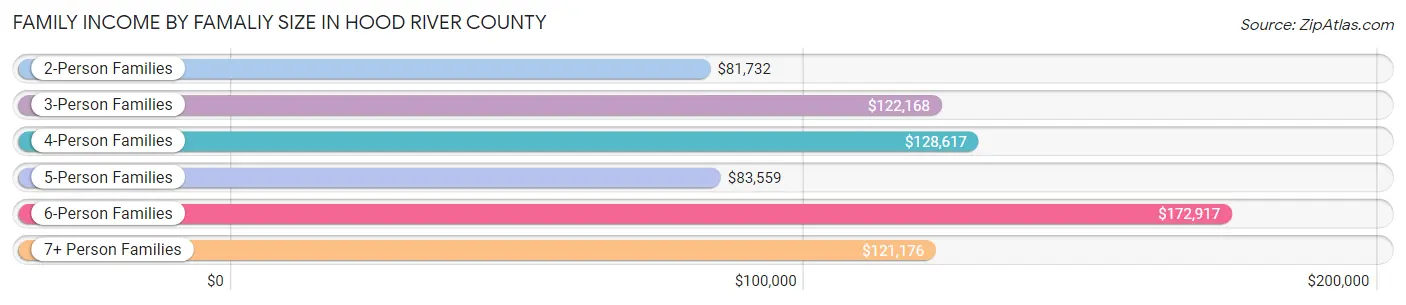
| Income Bracket | # Families | Median Income |
| 2-Person Families | 2,663 (46.3%) | $81,732 |
| 3-Person Families | 1,371 (23.8%) | $122,168 |
| 4-Person Families | 849 (14.7%) | $128,617 |
| 5-Person Families | 634 (11.0%) | $83,559 |
| 6-Person Families | 150 (2.6%) | $172,917 |
| 7+ Person Families | 90 (1.6%) | $121,176 |
| Total | 5,757 (100.0%) | $98,112 |
Family Income by Number of Earners in Hood River County
The median family income in Hood River County is $98,112, with families comprising 2 earners (2,562) having the highest median family income of $127,796, while families with 1 earner (1,590) have the lowest median family income of $61,959, accounting for 44.5% and 27.6% of families, respectively.
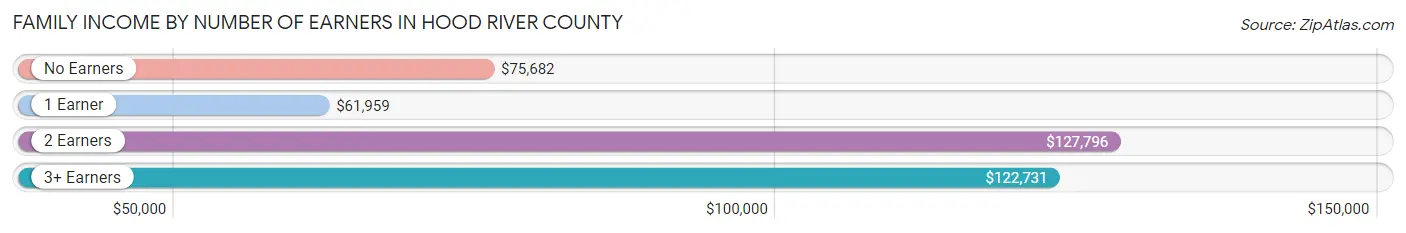
| Number of Earners | # Families | Median Income |
| No Earners | 628 (10.9%) | $75,682 |
| 1 Earner | 1,590 (27.6%) | $61,959 |
| 2 Earners | 2,562 (44.5%) | $127,796 |
| 3+ Earners | 977 (17.0%) | $122,731 |
| Total | 5,757 (100.0%) | $98,112 |
Household Income in Hood River County
Household Income Brackets in Hood River County
With 1,573 households falling in the category, the $100,000 to $149,999 income range is the most frequent in Hood River County, accounting for 17.4% of all households. In contrast, only 226 households (2.5%) fall into the less than $10,000 income bracket, making it the least populous group.
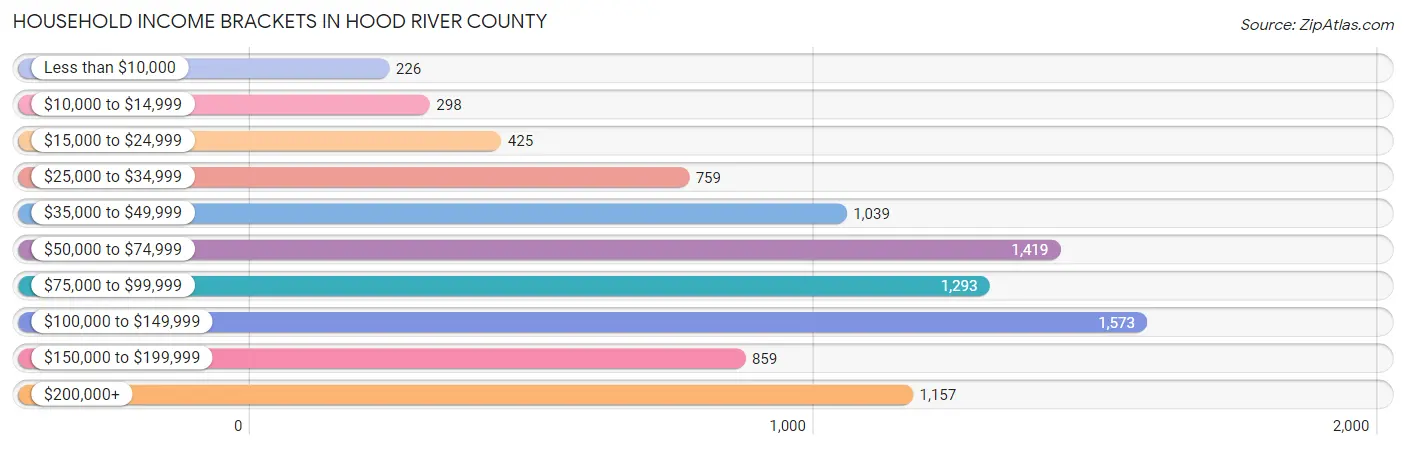
| Income Bracket | # Households | % Households |
| Less than $10,000 | 226 | 2.5% |
| $10,000 to $14,999 | 298 | 3.3% |
| $15,000 to $24,999 | 425 | 4.7% |
| $25,000 to $34,999 | 759 | 8.4% |
| $35,000 to $49,999 | 1,039 | 11.5% |
| $50,000 to $74,999 | 1,419 | 15.7% |
| $75,000 to $99,999 | 1,293 | 14.3% |
| $100,000 to $149,999 | 1,573 | 17.4% |
| $150,000 to $199,999 | 859 | 9.5% |
| $200,000+ | 1,157 | 12.8% |
Household Income by Householder Age in Hood River County
The median household income in Hood River County is $80,254, with the highest median household income of $94,688 found in the 25 to 44 years age bracket for the primary householder. A total of 2,769 households (30.6%) fall into this category. Meanwhile, the 15 to 24 years age bracket for the primary householder has the lowest median household income of $41,357, with 164 households (1.8%) in this group.
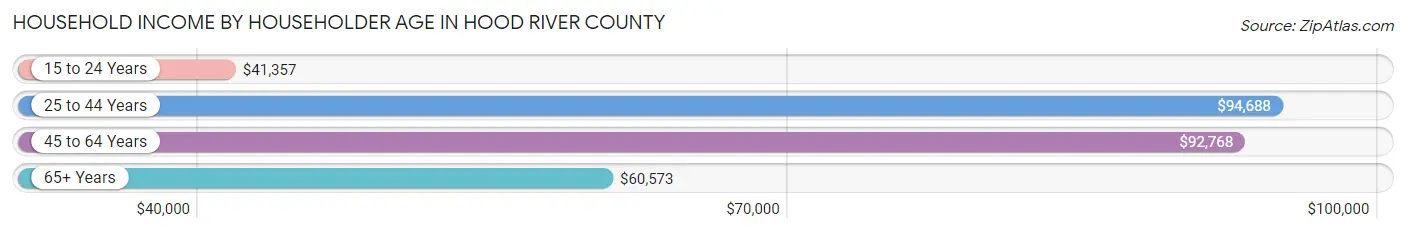
| Income Bracket | # Households | Median Income |
| 15 to 24 Years | 164 (1.8%) | $41,357 |
| 25 to 44 Years | 2,769 (30.6%) | $94,688 |
| 45 to 64 Years | 3,569 (39.5%) | $92,768 |
| 65+ Years | 2,537 (28.1%) | $60,573 |
| Total | 9,039 (100.0%) | $80,254 |
Poverty in Hood River County
Income Below Poverty by Sex and Age in Hood River County
With 6.1% poverty level for males and 7.0% for females among the residents of Hood River County, 15 year old males and 18 to 24 year old females are the most vulnerable to poverty, with 22 males (13.5%) and 155 females (17.9%) in their respective age groups living below the poverty level.
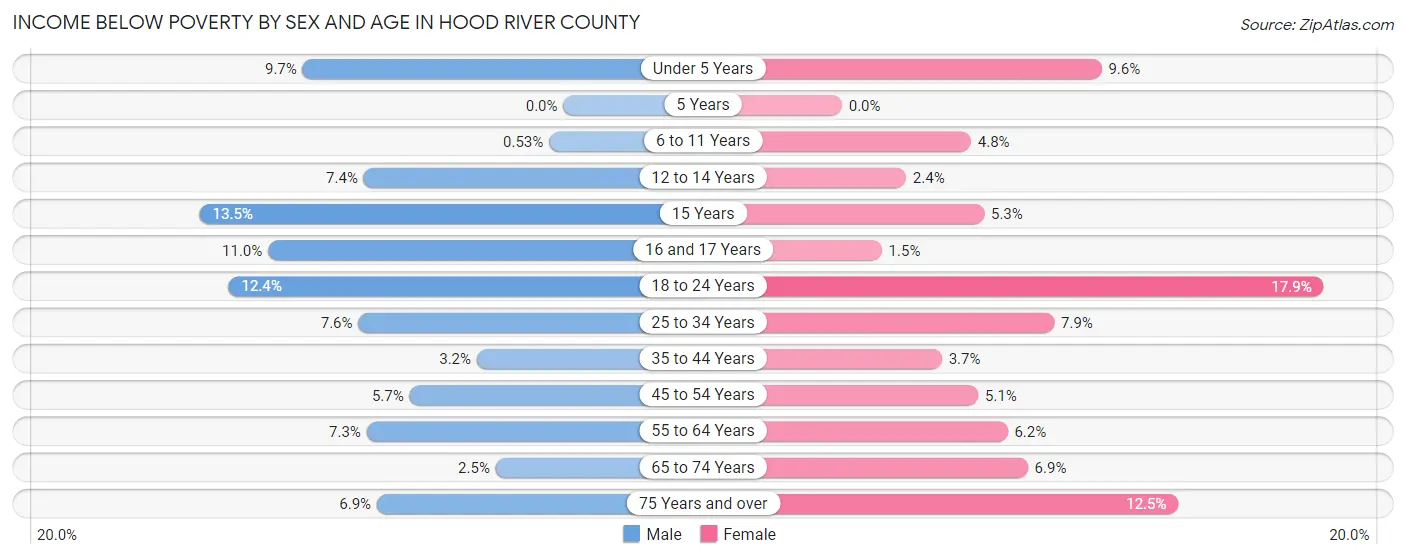
| Age Bracket | Male | Female |
| Under 5 Years | 54 (9.7%) | 70 (9.6%) |
| 5 Years | 0 (0.0%) | 0 (0.0%) |
| 6 to 11 Years | 5 (0.5%) | 36 (4.8%) |
| 12 to 14 Years | 28 (7.4%) | 12 (2.4%) |
| 15 Years | 22 (13.5%) | 14 (5.3%) |
| 16 and 17 Years | 33 (11.0%) | 5 (1.5%) |
| 18 to 24 Years | 117 (12.4%) | 155 (17.9%) |
| 25 to 34 Years | 121 (7.6%) | 114 (7.9%) |
| 35 to 44 Years | 52 (3.2%) | 59 (3.7%) |
| 45 to 54 Years | 93 (5.7%) | 79 (5.1%) |
| 55 to 64 Years | 121 (7.3%) | 94 (6.1%) |
| 65 to 74 Years | 31 (2.5%) | 82 (6.9%) |
| 75 Years and over | 47 (6.9%) | 114 (12.5%) |
| Total | 724 (6.1%) | 834 (7.0%) |
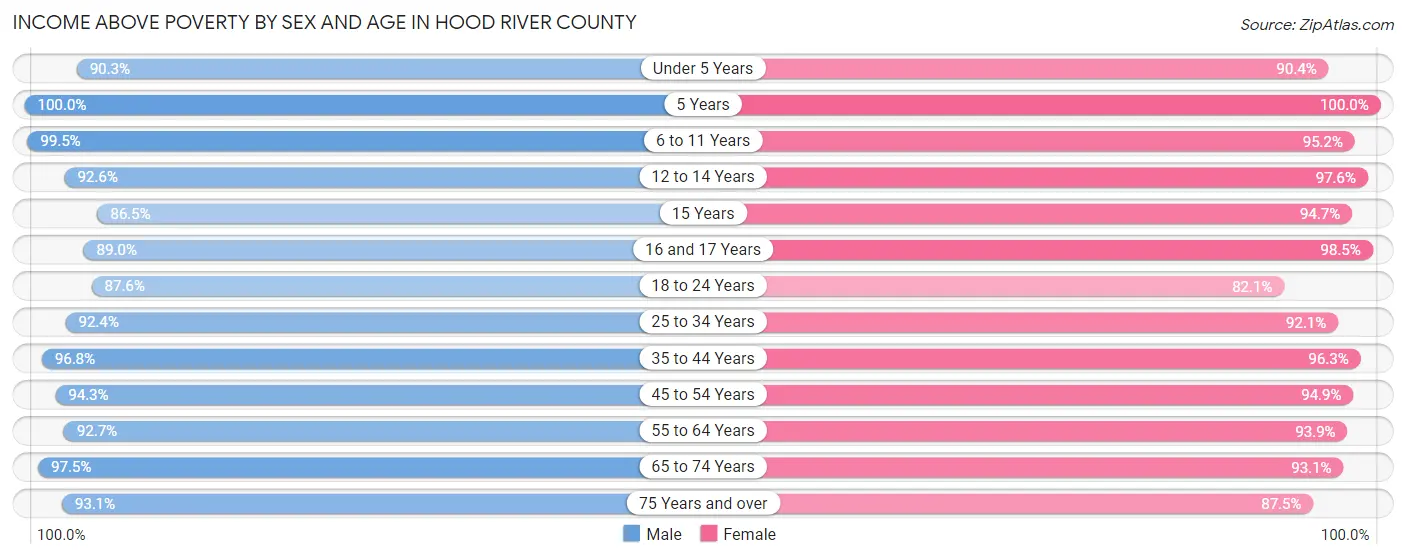
Income Above Poverty by Sex and Age in Hood River County
According to the poverty statistics in Hood River County, males aged 5 years and females aged 5 years are the age groups that are most secure financially, with 100.0% of males and 100.0% of females in these age groups living above the poverty line.
| Age Bracket | Male | Female |
| Under 5 Years | 504 (90.3%) | 656 (90.4%) |
| 5 Years | 151 (100.0%) | 199 (100.0%) |
| 6 to 11 Years | 940 (99.5%) | 715 (95.2%) |
| 12 to 14 Years | 350 (92.6%) | 492 (97.6%) |
| 15 Years | 141 (86.5%) | 251 (94.7%) |
| 16 and 17 Years | 268 (89.0%) | 333 (98.5%) |
| 18 to 24 Years | 824 (87.6%) | 712 (82.1%) |
| 25 to 34 Years | 1,469 (92.4%) | 1,333 (92.1%) |
| 35 to 44 Years | 1,569 (96.8%) | 1,530 (96.3%) |
| 45 to 54 Years | 1,537 (94.3%) | 1,482 (94.9%) |
| 55 to 64 Years | 1,537 (92.7%) | 1,435 (93.9%) |
| 65 to 74 Years | 1,203 (97.5%) | 1,106 (93.1%) |
| 75 Years and over | 632 (93.1%) | 799 (87.5%) |
| Total | 11,125 (93.9%) | 11,043 (93.0%) |
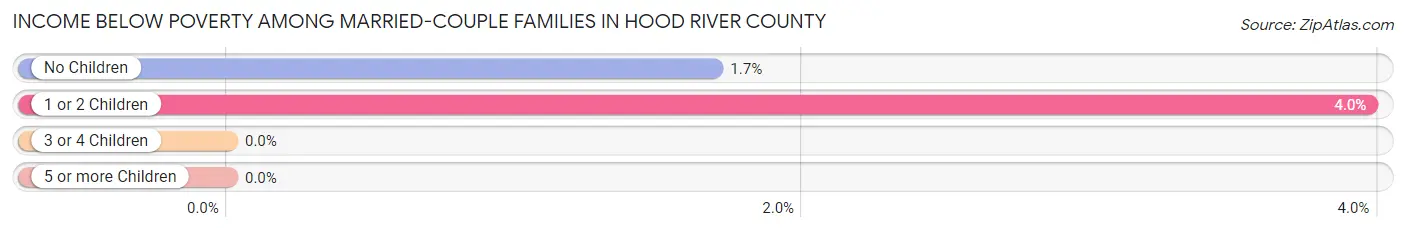
Income Below Poverty Among Married-Couple Families in Hood River County
The poverty statistics for married-couple families in Hood River County show that 2.3% or 103 of the total 4,495 families live below the poverty line. Families with 1 or 2 children have the highest poverty rate of 4.0%, comprising of 61 families. On the other hand, families with 3 or 4 children have the lowest poverty rate of 0.0%, which includes 0 families.
| Children | Above Poverty | Below Poverty |
| No Children | 2,450 (98.3%) | 42 (1.7%) |
| 1 or 2 Children | 1,475 (96.0%) | 61 (4.0%) |
| 3 or 4 Children | 455 (100.0%) | 0 (0.0%) |
| 5 or more Children | 12 (100.0%) | 0 (0.0%) |
| Total | 4,392 (97.7%) | 103 (2.3%) |
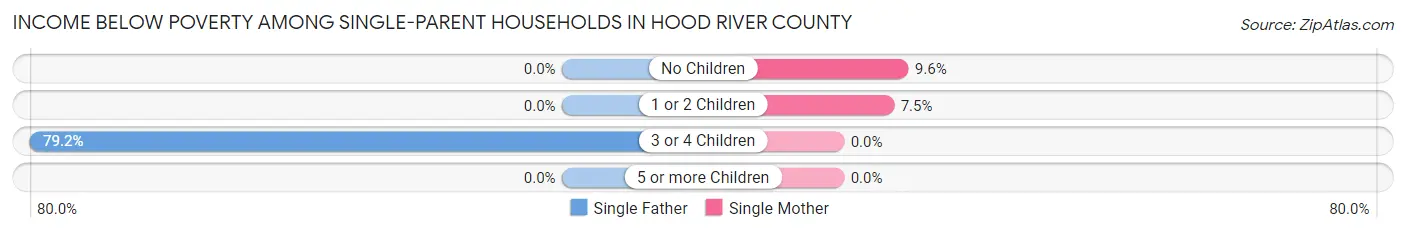
Income Below Poverty Among Single-Parent Households in Hood River County
According to the poverty data in Hood River County, 4.9% or 19 single-father households and 7.9% or 69 single-mother households are living below the poverty line. Among single-father households, those with 3 or 4 children have the highest poverty rate, with 19 households (79.2%) experiencing poverty. Likewise, among single-mother households, those with no children have the highest poverty rate, with 18 households (9.6%) falling below the poverty line.
| Children | Single Father | Single Mother |
| No Children | 0 (0.0%) | 18 (9.6%) |
| 1 or 2 Children | 0 (0.0%) | 51 (7.5%) |
| 3 or 4 Children | 19 (79.2%) | 0 (0.0%) |
| 5 or more Children | 0 (0.0%) | 0 (0.0%) |
| Total | 19 (4.9%) | 69 (7.9%) |
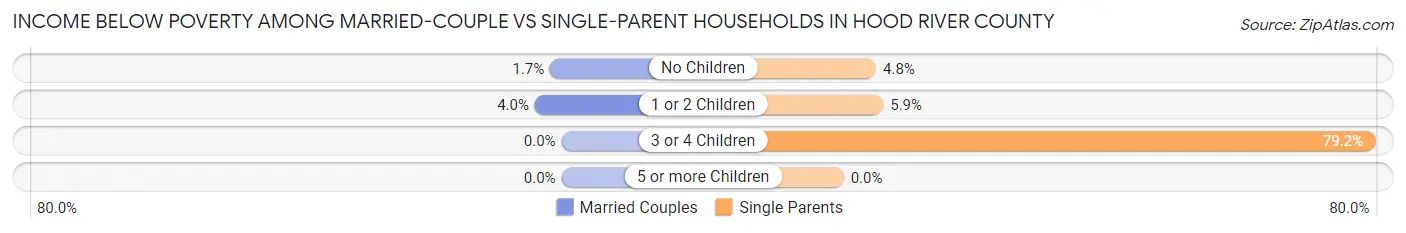
Income Below Poverty Among Married-Couple vs Single-Parent Households in Hood River County
The poverty data for Hood River County shows that 103 of the married-couple family households (2.3%) and 88 of the single-parent households (7.0%) are living below the poverty level. Within the married-couple family households, those with 1 or 2 children have the highest poverty rate, with 61 households (4.0%) falling below the poverty line. Among the single-parent households, those with 3 or 4 children have the highest poverty rate, with 19 household (79.2%) living below poverty.
| Children | Married-Couple Families | Single-Parent Households |
| No Children | 42 (1.7%) | 18 (4.8%) |
| 1 or 2 Children | 61 (4.0%) | 51 (5.9%) |
| 3 or 4 Children | 0 (0.0%) | 19 (79.2%) |
| 5 or more Children | 0 (0.0%) | 0 (0.0%) |
| Total | 103 (2.3%) | 88 (7.0%) |
Employment Characteristics in Hood River County
Employment by Class of Employer in Hood River County
Among the 12,605 employed individuals in Hood River County, private company employees (7,596 | 60.3%), not-for-profit organizations (1,549 | 12.3%), and self-employed (incorporated) (1,122 | 8.9%) make up the most common classes of employment.
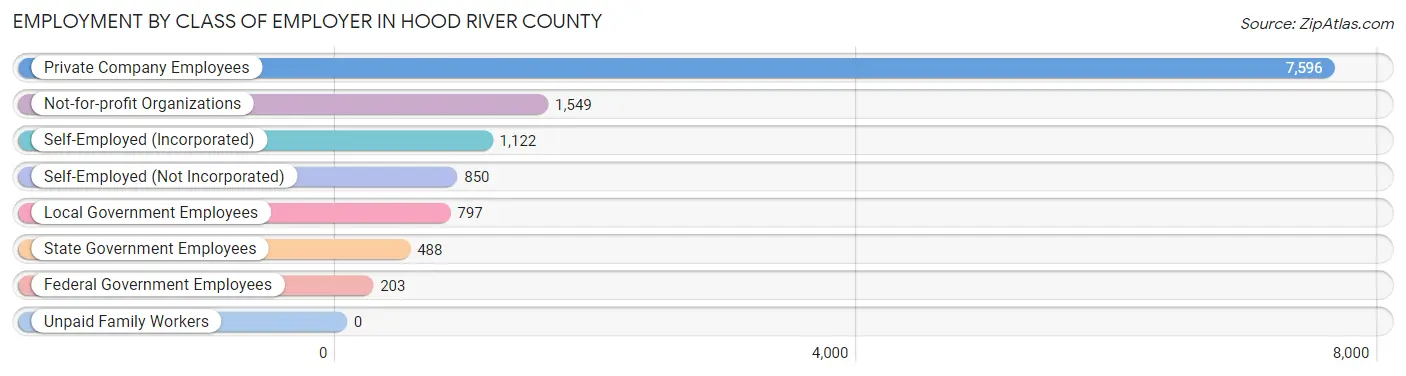
| Employer Class | # Employees | % Employees |
| Private Company Employees | 7,596 | 60.3% |
| Self-Employed (Incorporated) | 1,122 | 8.9% |
| Self-Employed (Not Incorporated) | 850 | 6.7% |
| Not-for-profit Organizations | 1,549 | 12.3% |
| Local Government Employees | 797 | 6.3% |
| State Government Employees | 488 | 3.9% |
| Federal Government Employees | 203 | 1.6% |
| Unpaid Family Workers | 0 | 0.0% |
| Total | 12,605 | 100.0% |
Employment Status by Age in Hood River County
According to the labor force statistics for Hood River County, out of the total population over 16 years of age (19,184), 69.4% or 13,314 individuals are in the labor force, with 3.3% or 439 of them unemployed. The age group with the highest labor force participation rate is 30 to 34 years, with 93.7% or 1,495 individuals in the labor force. Within the labor force, the 60 to 64 years age range has the highest percentage of unemployed individuals, with 11.1% or 127 of them being unemployed.
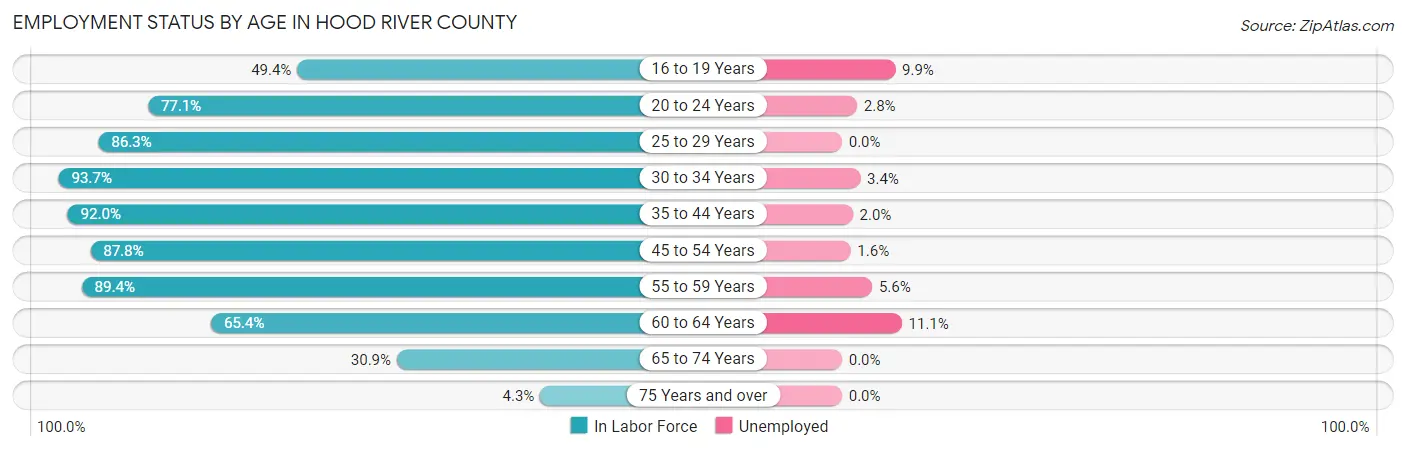
| Age Bracket | In Labor Force | Unemployed |
| 16 to 19 Years | 609 (49.4%) | 60 (9.9%) |
| 20 to 24 Years | 938 (77.1%) | 26 (2.8%) |
| 25 to 29 Years | 1,244 (86.3%) | 0 (0.0%) |
| 30 to 34 Years | 1,495 (93.7%) | 51 (3.4%) |
| 35 to 44 Years | 2,959 (92.0%) | 59 (2.0%) |
| 45 to 54 Years | 2,802 (87.8%) | 45 (1.6%) |
| 55 to 59 Years | 1,301 (89.4%) | 73 (5.6%) |
| 60 to 64 Years | 1,141 (65.4%) | 127 (11.1%) |
| 65 to 74 Years | 752 (30.9%) | 0 (0.0%) |
| 75 Years and over | 71 (4.3%) | 0 (0.0%) |
| Total | 13,314 (69.4%) | 439 (3.3%) |
Employment Status by Educational Attainment in Hood River County
According to labor force statistics for Hood River County, 86.5% of individuals (10,936) out of the total population between 25 and 64 years of age (12,643) are in the labor force, with 3.3% or 361 of them being unemployed. The group with the highest labor force participation rate are those with the educational attainment of bachelor's degree or higher, with 89.8% or 4,557 individuals in the labor force. Within the labor force, individuals with less than high school education have the highest percentage of unemployment, with 6.0% or 106 of them being unemployed.
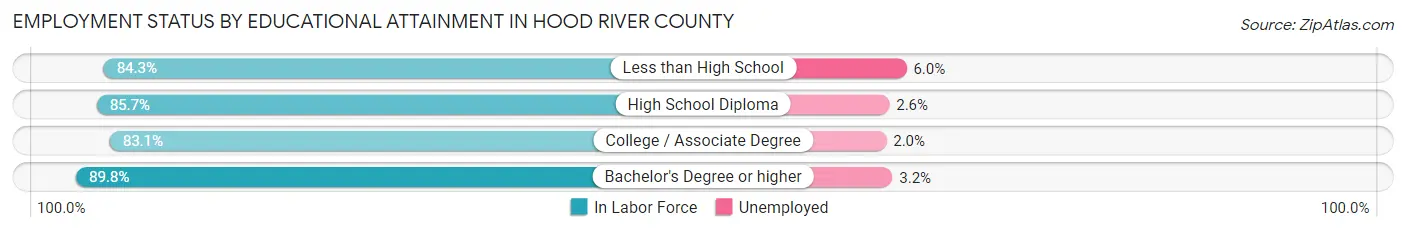
| Educational Attainment | In Labor Force | Unemployed |
| Less than High School | 1,763 (84.3%) | 125 (6.0%) |
| High School Diploma | 2,219 (85.7%) | 67 (2.6%) |
| College / Associate Degree | 2,400 (83.1%) | 58 (2.0%) |
| Bachelor's Degree or higher | 4,557 (89.8%) | 162 (3.2%) |
| Total | 10,936 (86.5%) | 417 (3.3%) |
Employment Occupations by Sex in Hood River County
Management, Business, Science and Arts Occupations
The most common Management, Business, Science and Arts occupations in Hood River County are Management (1,618 | 12.6%), Health Diagnosing & Treating (1,137 | 8.8%), Community & Social Service (1,112 | 8.6%), Health Technologists (981 | 7.6%), and Computers, Engineering & Science (752 | 5.9%).
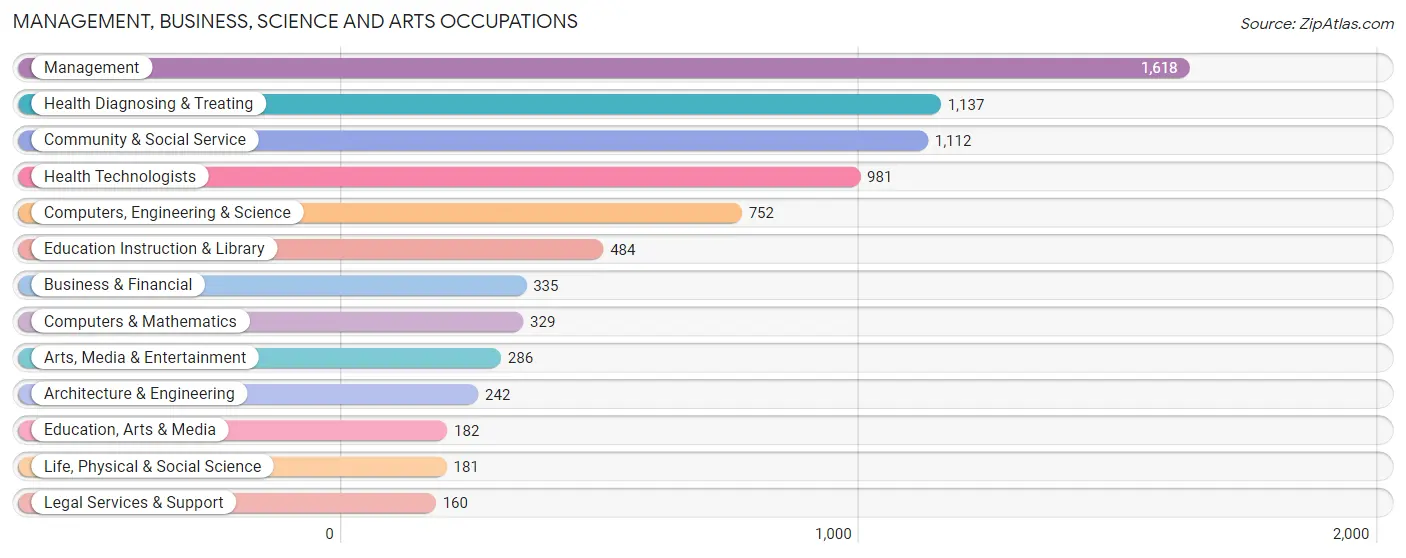
Management, Business, Science and Arts Occupations by Sex
Within the Management, Business, Science and Arts occupations in Hood River County, the most male-oriented occupations are Architecture & Engineering (76.4%), Computers & Mathematics (72.3%), and Computers, Engineering & Science (70.6%), while the most female-oriented occupations are Education Instruction & Library (82.0%), Community & Social Service (67.7%), and Legal Services & Support (66.9%).
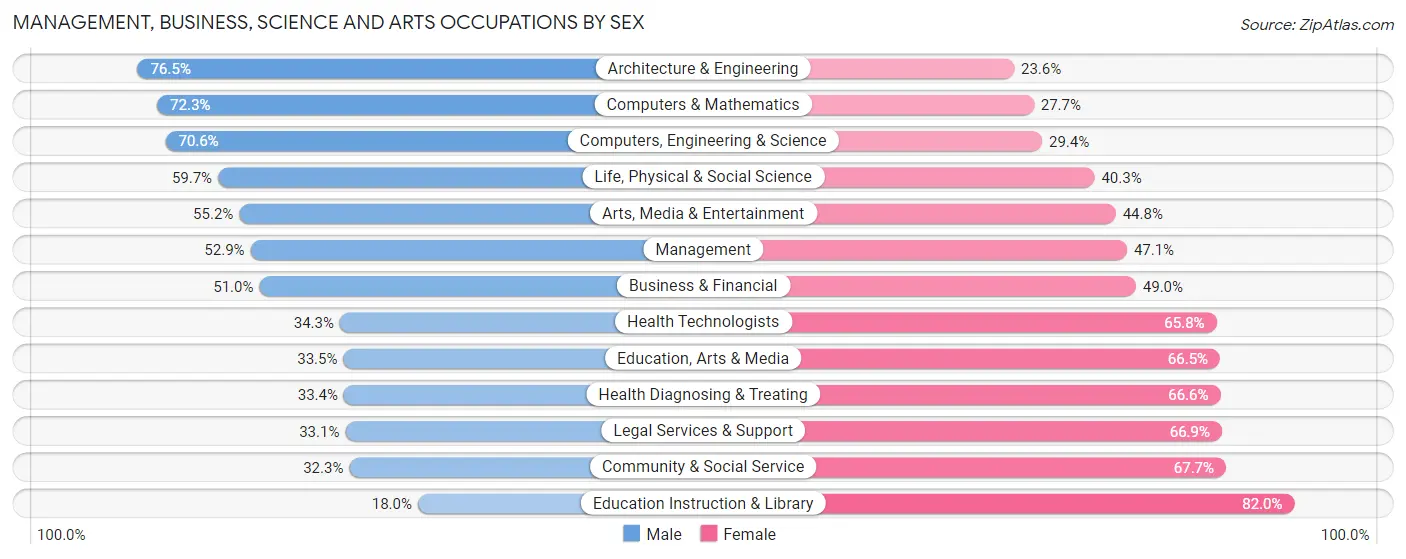
| Occupation | Male | Female |
| Management | 856 (52.9%) | 762 (47.1%) |
| Business & Financial | 171 (51.0%) | 164 (49.0%) |
| Computers, Engineering & Science | 531 (70.6%) | 221 (29.4%) |
| Computers & Mathematics | 238 (72.3%) | 91 (27.7%) |
| Architecture & Engineering | 185 (76.4%) | 57 (23.5%) |
| Life, Physical & Social Science | 108 (59.7%) | 73 (40.3%) |
| Community & Social Service | 359 (32.3%) | 753 (67.7%) |
| Education, Arts & Media | 61 (33.5%) | 121 (66.5%) |
| Legal Services & Support | 53 (33.1%) | 107 (66.9%) |
| Education Instruction & Library | 87 (18.0%) | 397 (82.0%) |
| Arts, Media & Entertainment | 158 (55.2%) | 128 (44.8%) |
| Health Diagnosing & Treating | 380 (33.4%) | 757 (66.6%) |
| Health Technologists | 336 (34.3%) | 645 (65.7%) |
| Total (Category) | 2,297 (46.4%) | 2,657 (53.6%) |
| Total (Overall) | 6,951 (54.1%) | 5,904 (45.9%) |
Services Occupations
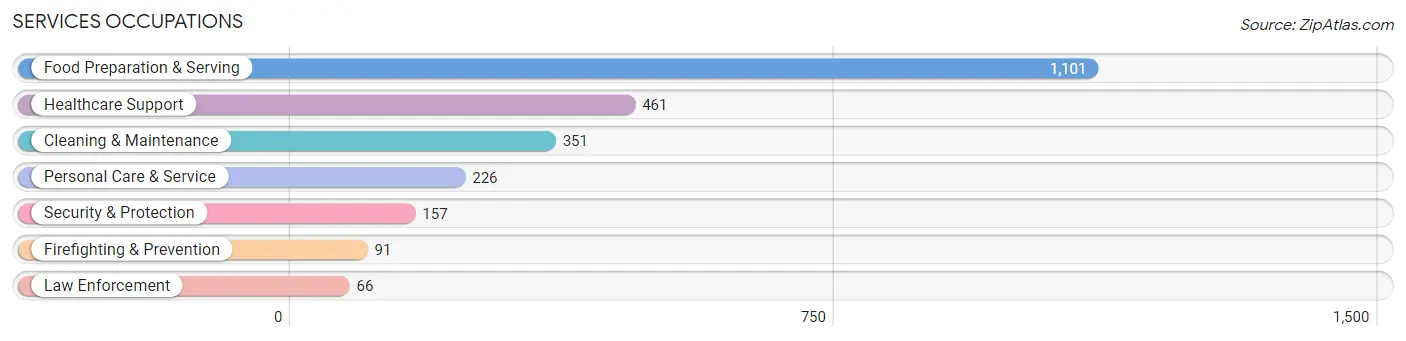
The most common Services occupations in Hood River County are Food Preparation & Serving (1,101 | 8.6%), Healthcare Support (461 | 3.6%), Cleaning & Maintenance (351 | 2.7%), Personal Care & Service (226 | 1.8%), and Security & Protection (157 | 1.2%).
Services Occupations by Sex
Within the Services occupations in Hood River County, the most male-oriented occupations are Law Enforcement (100.0%), Security & Protection (86.6%), and Firefighting & Prevention (76.9%), while the most female-oriented occupations are Healthcare Support (86.8%), Personal Care & Service (65.5%), and Food Preparation & Serving (53.9%).
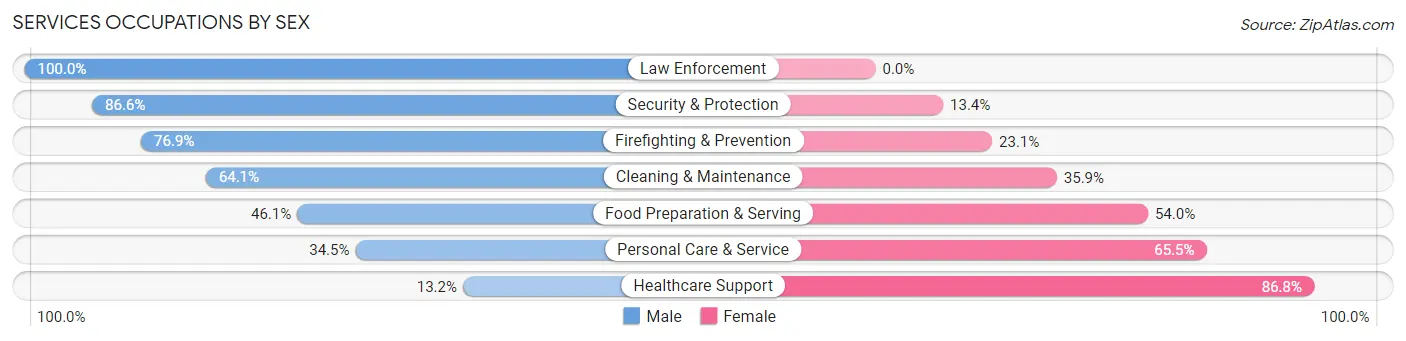
| Occupation | Male | Female |
| Healthcare Support | 61 (13.2%) | 400 (86.8%) |
| Security & Protection | 136 (86.6%) | 21 (13.4%) |
| Firefighting & Prevention | 70 (76.9%) | 21 (23.1%) |
| Law Enforcement | 66 (100.0%) | 0 (0.0%) |
| Food Preparation & Serving | 507 (46.1%) | 594 (53.9%) |
| Cleaning & Maintenance | 225 (64.1%) | 126 (35.9%) |
| Personal Care & Service | 78 (34.5%) | 148 (65.5%) |
| Total (Category) | 1,007 (43.9%) | 1,289 (56.1%) |
| Total (Overall) | 6,951 (54.1%) | 5,904 (45.9%) |
Sales and Office Occupations
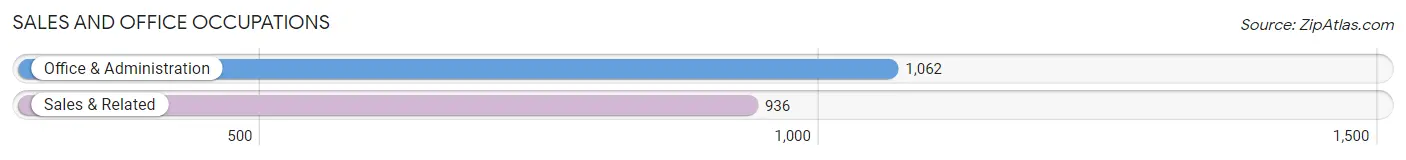
The most common Sales and Office occupations in Hood River County are Office & Administration (1,062 | 8.3%), and Sales & Related (936 | 7.3%).
Sales and Office Occupations by Sex
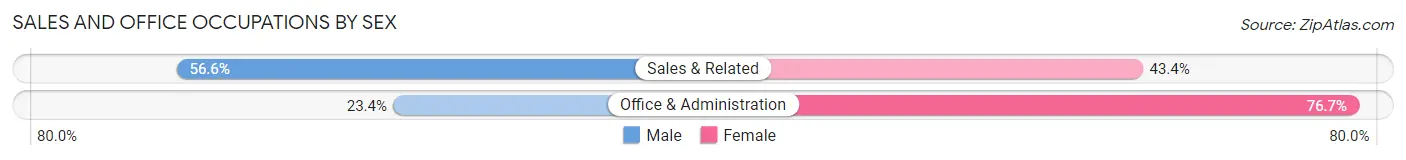
| Occupation | Male | Female |
| Sales & Related | 530 (56.6%) | 406 (43.4%) |
| Office & Administration | 248 (23.4%) | 814 (76.6%) |
| Total (Category) | 778 (38.9%) | 1,220 (61.1%) |
| Total (Overall) | 6,951 (54.1%) | 5,904 (45.9%) |
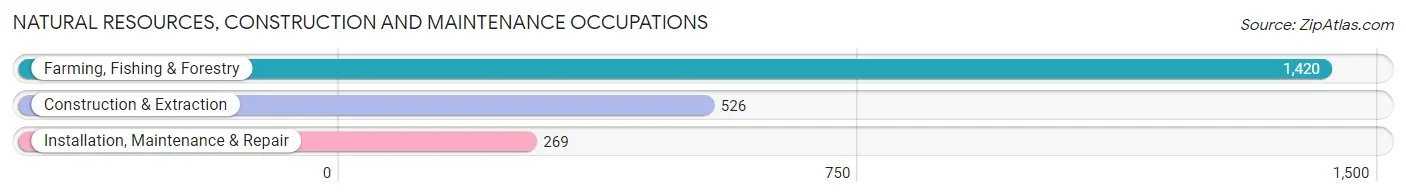
Natural Resources, Construction and Maintenance Occupations
The most common Natural Resources, Construction and Maintenance occupations in Hood River County are Farming, Fishing & Forestry (1,420 | 11.1%), Construction & Extraction (526 | 4.1%), and Installation, Maintenance & Repair (269 | 2.1%).
Natural Resources, Construction and Maintenance Occupations by Sex
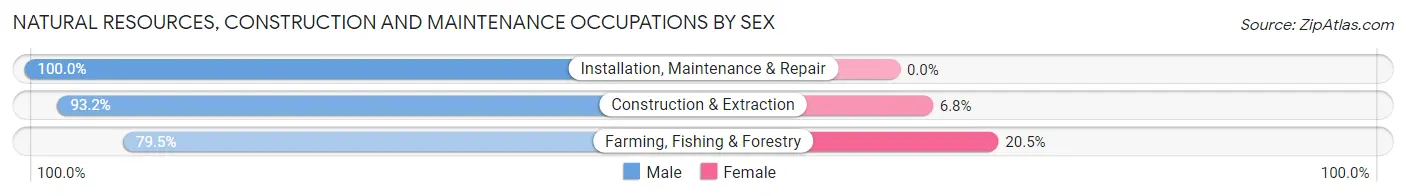
| Occupation | Male | Female |
| Farming, Fishing & Forestry | 1,129 (79.5%) | 291 (20.5%) |
| Construction & Extraction | 490 (93.2%) | 36 (6.8%) |
| Installation, Maintenance & Repair | 269 (100.0%) | 0 (0.0%) |
| Total (Category) | 1,888 (85.2%) | 327 (14.8%) |
| Total (Overall) | 6,951 (54.1%) | 5,904 (45.9%) |
Production, Transportation and Moving Occupations
The most common Production, Transportation and Moving occupations in Hood River County are Production (635 | 4.9%), Material Moving (412 | 3.2%), and Transportation (345 | 2.7%).
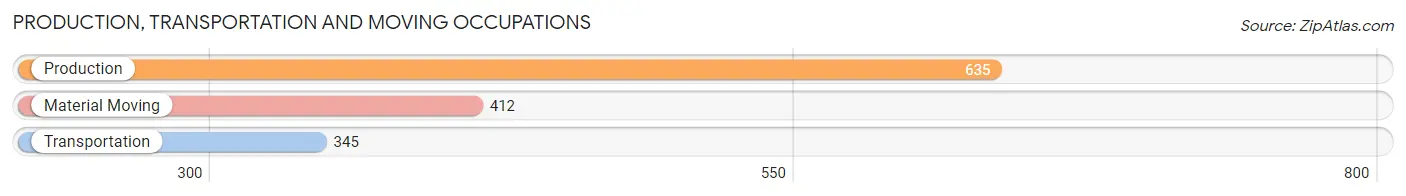
Production, Transportation and Moving Occupations by Sex
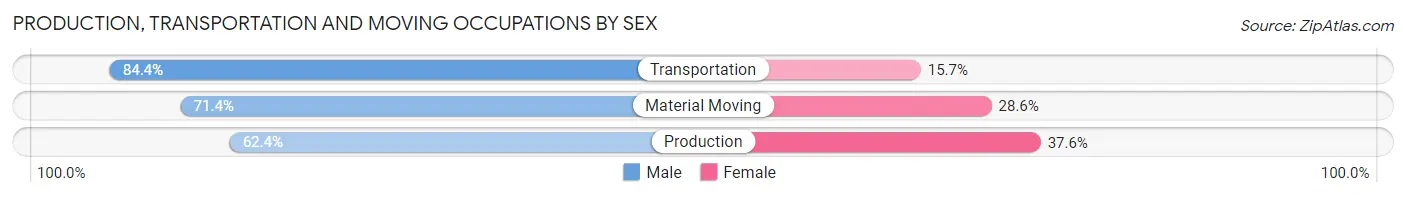
| Occupation | Male | Female |
| Production | 396 (62.4%) | 239 (37.6%) |
| Transportation | 291 (84.4%) | 54 (15.7%) |
| Material Moving | 294 (71.4%) | 118 (28.6%) |
| Total (Category) | 981 (70.5%) | 411 (29.5%) |
| Total (Overall) | 6,951 (54.1%) | 5,904 (45.9%) |
Employment Industries by Sex in Hood River County
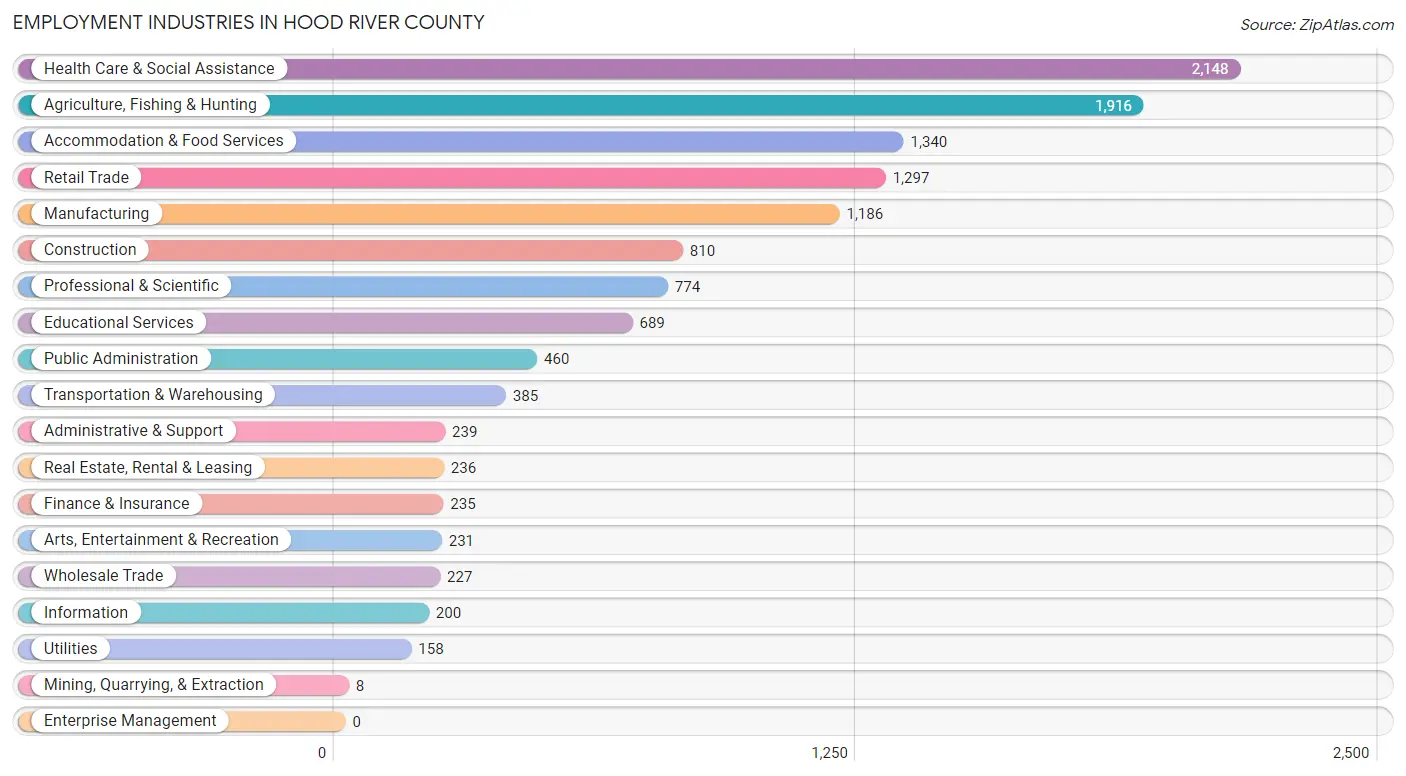
Employment Industries in Hood River County
The major employment industries in Hood River County include Health Care & Social Assistance (2,148 | 16.7%), Agriculture, Fishing & Hunting (1,916 | 14.9%), Accommodation & Food Services (1,340 | 10.4%), Retail Trade (1,297 | 10.1%), and Manufacturing (1,186 | 9.2%).
Employment Industries by Sex in Hood River County
The Hood River County industries that see more men than women are Mining, Quarrying, & Extraction (100.0%), Construction (81.5%), and Transportation & Warehousing (79.7%), whereas the industries that tend to have a higher number of women are Educational Services (80.7%), Health Care & Social Assistance (72.2%), and Real Estate, Rental & Leasing (62.7%).
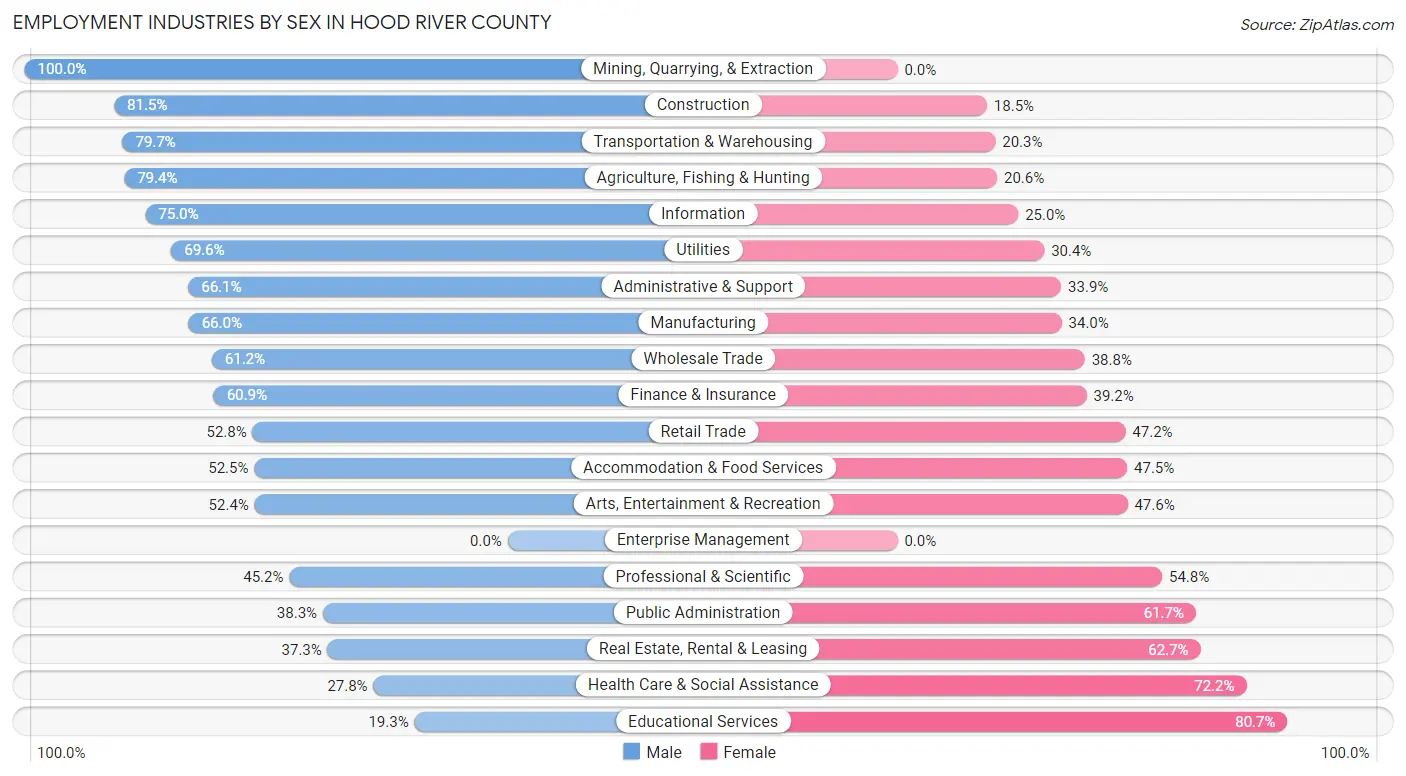
| Industry | Male | Female |
| Agriculture, Fishing & Hunting | 1,521 (79.4%) | 395 (20.6%) |
| Mining, Quarrying, & Extraction | 8 (100.0%) | 0 (0.0%) |
| Construction | 660 (81.5%) | 150 (18.5%) |
| Manufacturing | 783 (66.0%) | 403 (34.0%) |
| Wholesale Trade | 139 (61.2%) | 88 (38.8%) |
| Retail Trade | 685 (52.8%) | 612 (47.2%) |
| Transportation & Warehousing | 307 (79.7%) | 78 (20.3%) |
| Utilities | 110 (69.6%) | 48 (30.4%) |
| Information | 150 (75.0%) | 50 (25.0%) |
| Finance & Insurance | 143 (60.9%) | 92 (39.2%) |
| Real Estate, Rental & Leasing | 88 (37.3%) | 148 (62.7%) |
| Professional & Scientific | 350 (45.2%) | 424 (54.8%) |
| Enterprise Management | 0 (0.0%) | 0 (0.0%) |
| Administrative & Support | 158 (66.1%) | 81 (33.9%) |
| Educational Services | 133 (19.3%) | 556 (80.7%) |
| Health Care & Social Assistance | 597 (27.8%) | 1,551 (72.2%) |
| Arts, Entertainment & Recreation | 121 (52.4%) | 110 (47.6%) |
| Accommodation & Food Services | 703 (52.5%) | 637 (47.5%) |
| Public Administration | 176 (38.3%) | 284 (61.7%) |
| Total | 6,951 (54.1%) | 5,904 (45.9%) |
Education in Hood River County
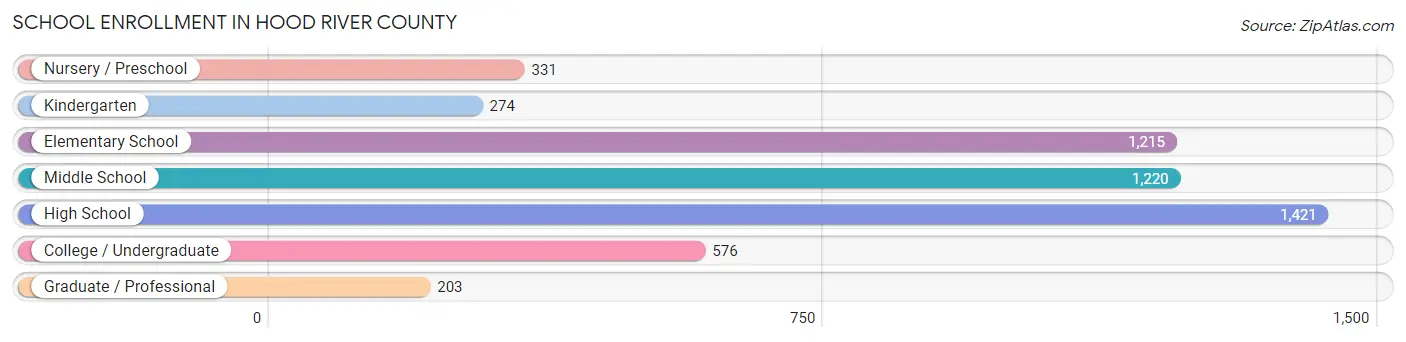
School Enrollment in Hood River County
The most common levels of schooling among the 5,240 students in Hood River County are high school (1,421 | 27.1%), middle school (1,220 | 23.3%), and elementary school (1,215 | 23.2%).
| School Level | # Students | % Students |
| Nursery / Preschool | 331 | 6.3% |
| Kindergarten | 274 | 5.2% |
| Elementary School | 1,215 | 23.2% |
| Middle School | 1,220 | 23.3% |
| High School | 1,421 | 27.1% |
| College / Undergraduate | 576 | 11.0% |
| Graduate / Professional | 203 | 3.9% |
| Total | 5,240 | 100.0% |
School Enrollment by Age by Funding Source in Hood River County
Out of a total of 5,240 students who are enrolled in schools in Hood River County, 870 (16.6%) attend a private institution, while the remaining 4,370 (83.4%) are enrolled in public schools. The age group of 3 to 4 year olds has the highest likelihood of being enrolled in private schools, with 155 (76.0% in the age bracket) enrolled. Conversely, the age group of 18 to 19 year olds has the lowest likelihood of being enrolled in a private school, with 384 (100.0% in the age bracket) attending a public institution.
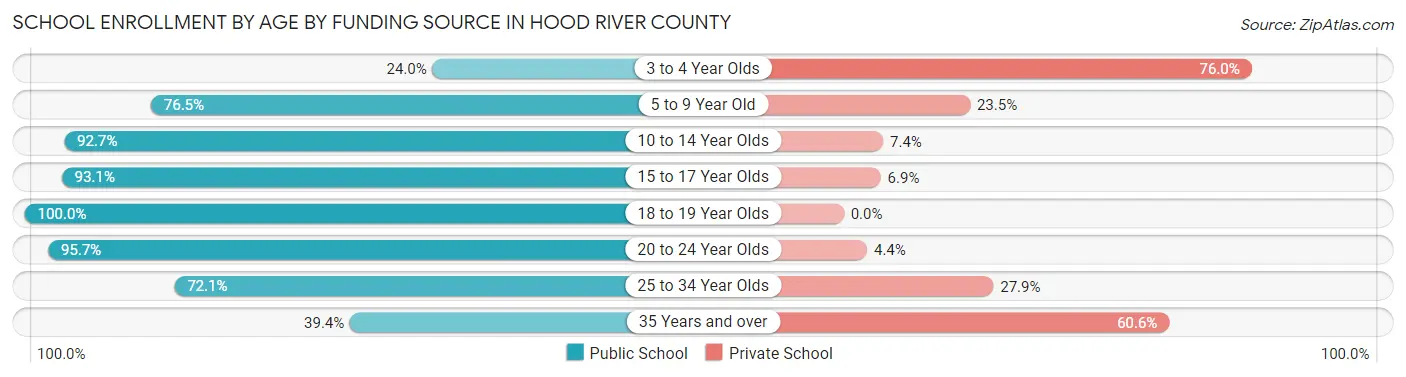
| Age Bracket | Public School | Private School |
| 3 to 4 Year Olds | 49 (24.0%) | 155 (76.0%) |
| 5 to 9 Year Old | 1,069 (76.5%) | 329 (23.5%) |
| 10 to 14 Year Olds | 1,387 (92.6%) | 110 (7.3%) |
| 15 to 17 Year Olds | 986 (93.1%) | 73 (6.9%) |
| 18 to 19 Year Olds | 384 (100.0%) | 0 (0.0%) |
| 20 to 24 Year Olds | 308 (95.7%) | 14 (4.3%) |
| 25 to 34 Year Olds | 88 (72.1%) | 34 (27.9%) |
| 35 Years and over | 100 (39.4%) | 154 (60.6%) |
| Total | 4,370 (83.4%) | 870 (16.6%) |
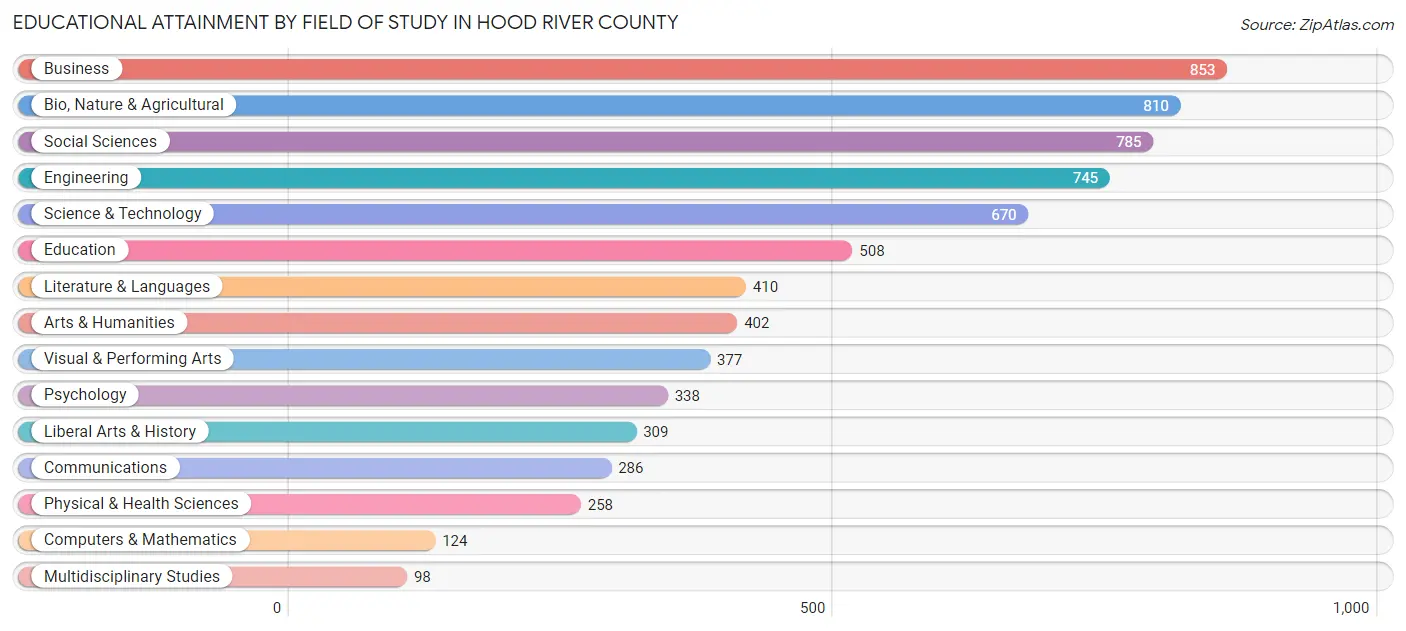
Educational Attainment by Field of Study in Hood River County
Business (853 | 12.2%), bio, nature & agricultural (810 | 11.6%), social sciences (785 | 11.3%), engineering (745 | 10.7%), and science & technology (670 | 9.6%) are the most common fields of study among 6,973 individuals in Hood River County who have obtained a bachelor's degree or higher.
| Field of Study | # Graduates | % Graduates |
| Computers & Mathematics | 124 | 1.8% |
| Bio, Nature & Agricultural | 810 | 11.6% |
| Physical & Health Sciences | 258 | 3.7% |
| Psychology | 338 | 4.9% |
| Social Sciences | 785 | 11.3% |
| Engineering | 745 | 10.7% |
| Multidisciplinary Studies | 98 | 1.4% |
| Science & Technology | 670 | 9.6% |
| Business | 853 | 12.2% |
| Education | 508 | 7.3% |
| Literature & Languages | 410 | 5.9% |
| Liberal Arts & History | 309 | 4.4% |
| Visual & Performing Arts | 377 | 5.4% |
| Communications | 286 | 4.1% |
| Arts & Humanities | 402 | 5.8% |
| Total | 6,973 | 100.0% |
Transportation & Commute in Hood River County
Vehicle Availability by Sex in Hood River County
The most prevalent vehicle ownership categories in Hood River County are males with 2 vehicles (1,926, accounting for 31.3%) and females with 2 vehicles (2,007, making up 34.2%).
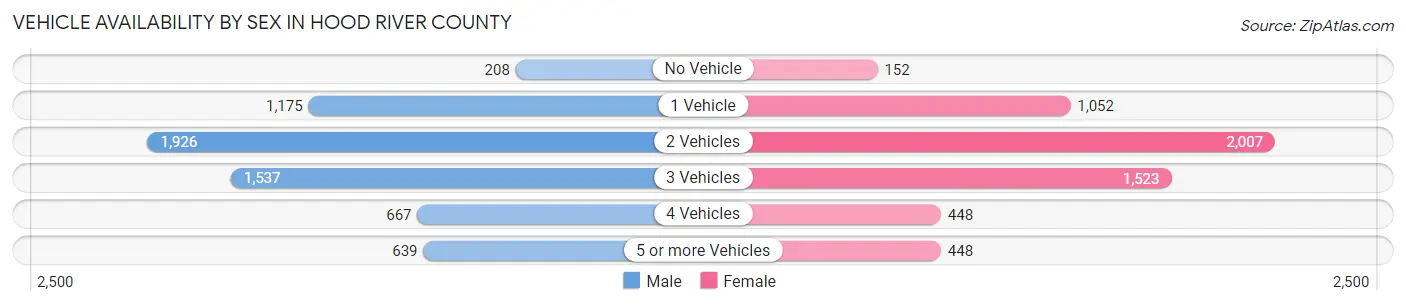
| Vehicles Available | Male | Female |
| No Vehicle | 208 (3.4%) | 152 (2.7%) |
| 1 Vehicle | 1,175 (19.1%) | 1,052 (18.7%) |
| 2 Vehicles | 1,926 (31.3%) | 2,007 (35.6%) |
| 3 Vehicles | 1,537 (25.0%) | 1,523 (27.1%) |
| 4 Vehicles | 667 (10.8%) | 448 (8.0%) |
| 5 or more Vehicles | 639 (10.4%) | 448 (8.0%) |
| Total | 6,152 (100.0%) | 5,630 (100.0%) |
Commute Time in Hood River County
The most frequently occuring commute durations in Hood River County are 5 to 9 minutes (2,849 commuters, 26.8%), 10 to 14 minutes (1,676 commuters, 15.8%), and 15 to 19 minutes (1,657 commuters, 15.6%).
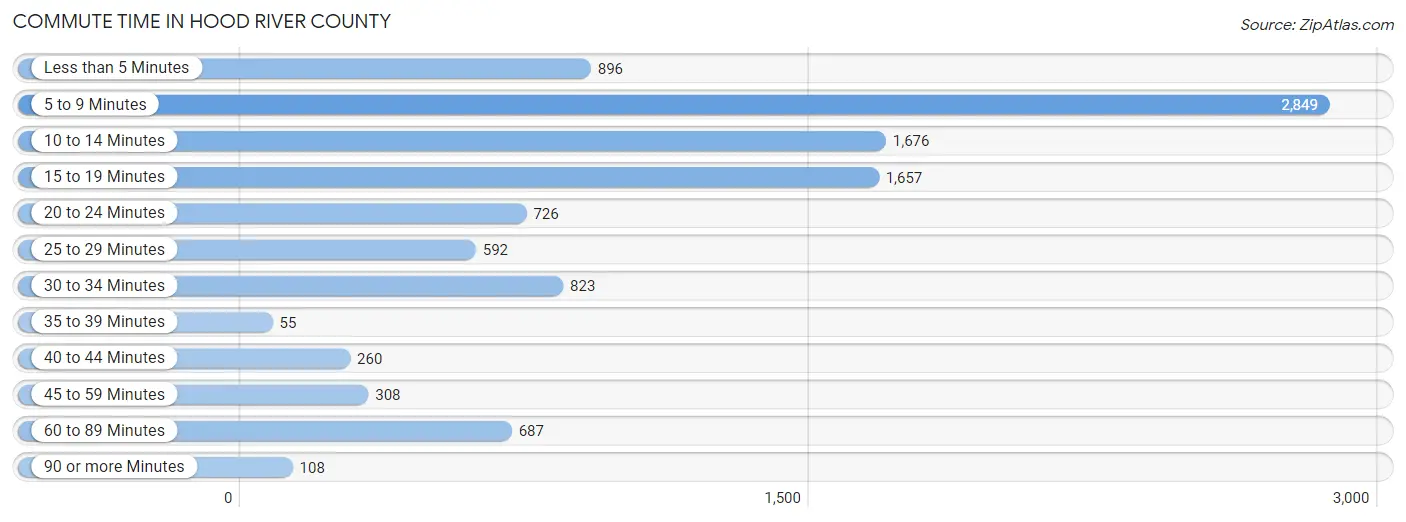
| Commute Time | # Commuters | % Commuters |
| Less than 5 Minutes | 896 | 8.4% |
| 5 to 9 Minutes | 2,849 | 26.8% |
| 10 to 14 Minutes | 1,676 | 15.8% |
| 15 to 19 Minutes | 1,657 | 15.6% |
| 20 to 24 Minutes | 726 | 6.8% |
| 25 to 29 Minutes | 592 | 5.6% |
| 30 to 34 Minutes | 823 | 7.7% |
| 35 to 39 Minutes | 55 | 0.5% |
| 40 to 44 Minutes | 260 | 2.4% |
| 45 to 59 Minutes | 308 | 2.9% |
| 60 to 89 Minutes | 687 | 6.5% |
| 90 or more Minutes | 108 | 1.0% |
Commute Time by Sex in Hood River County
The most common commute times in Hood River County are 5 to 9 minutes (1,485 commuters, 26.2%) for males and 5 to 9 minutes (1,364 commuters, 27.5%) for females.
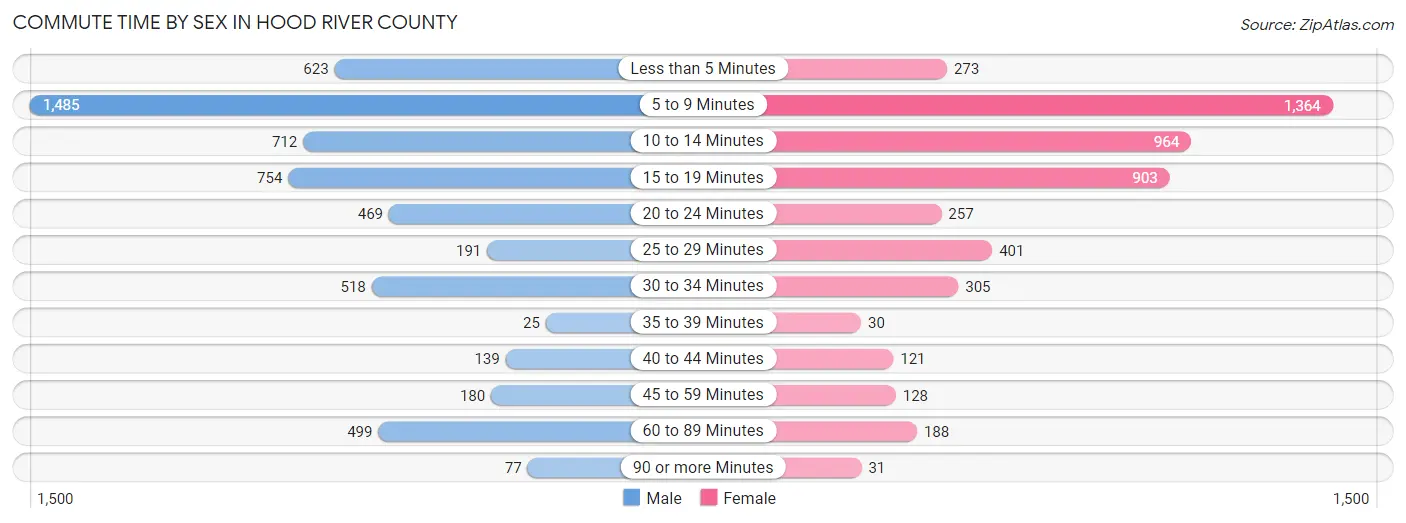
| Commute Time | Male | Female |
| Less than 5 Minutes | 623 (11.0%) | 273 (5.5%) |
| 5 to 9 Minutes | 1,485 (26.2%) | 1,364 (27.5%) |
| 10 to 14 Minutes | 712 (12.6%) | 964 (19.4%) |
| 15 to 19 Minutes | 754 (13.3%) | 903 (18.2%) |
| 20 to 24 Minutes | 469 (8.3%) | 257 (5.2%) |
| 25 to 29 Minutes | 191 (3.4%) | 401 (8.1%) |
| 30 to 34 Minutes | 518 (9.1%) | 305 (6.1%) |
| 35 to 39 Minutes | 25 (0.4%) | 30 (0.6%) |
| 40 to 44 Minutes | 139 (2.5%) | 121 (2.4%) |
| 45 to 59 Minutes | 180 (3.2%) | 128 (2.6%) |
| 60 to 89 Minutes | 499 (8.8%) | 188 (3.8%) |
| 90 or more Minutes | 77 (1.4%) | 31 (0.6%) |
Time of Departure to Work by Sex in Hood River County
The most frequent times of departure to work in Hood River County are 7:30 AM to 7:59 AM (716, 12.6%) for males and 7:30 AM to 7:59 AM (697, 14.0%) for females.
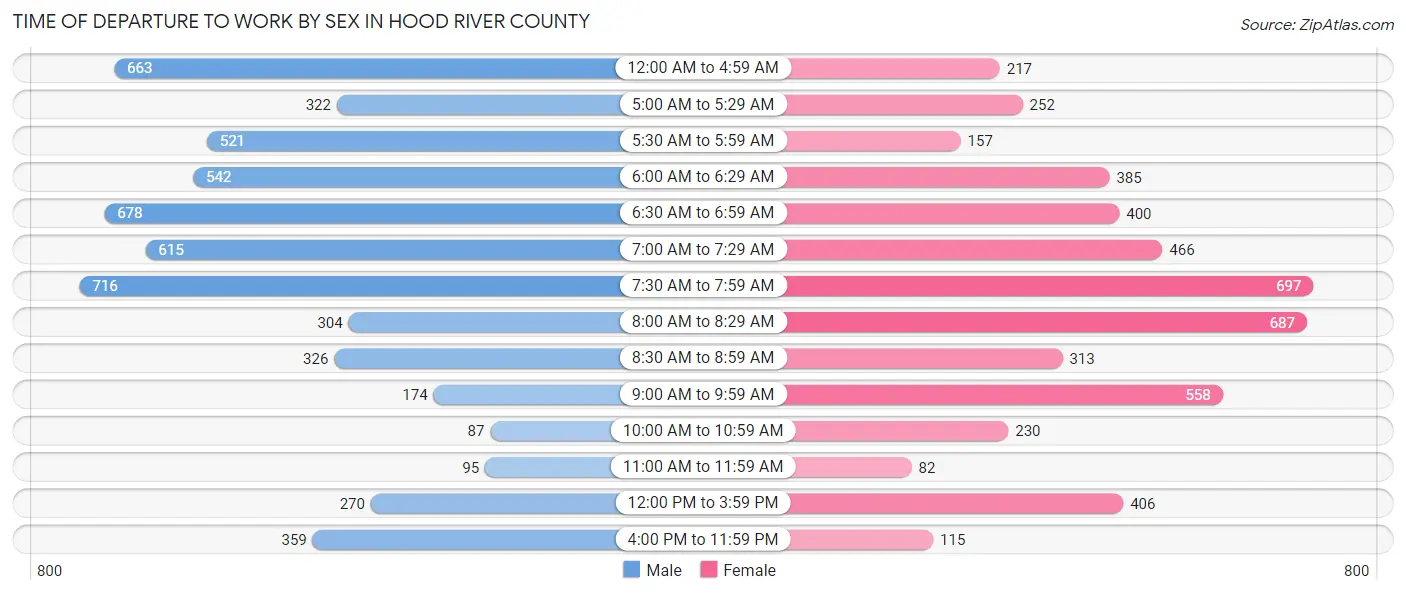
| Time of Departure | Male | Female |
| 12:00 AM to 4:59 AM | 663 (11.7%) | 217 (4.4%) |
| 5:00 AM to 5:29 AM | 322 (5.7%) | 252 (5.1%) |
| 5:30 AM to 5:59 AM | 521 (9.2%) | 157 (3.2%) |
| 6:00 AM to 6:29 AM | 542 (9.6%) | 385 (7.7%) |
| 6:30 AM to 6:59 AM | 678 (11.9%) | 400 (8.1%) |
| 7:00 AM to 7:29 AM | 615 (10.8%) | 466 (9.4%) |
| 7:30 AM to 7:59 AM | 716 (12.6%) | 697 (14.0%) |
| 8:00 AM to 8:29 AM | 304 (5.4%) | 687 (13.8%) |
| 8:30 AM to 8:59 AM | 326 (5.8%) | 313 (6.3%) |
| 9:00 AM to 9:59 AM | 174 (3.1%) | 558 (11.2%) |
| 10:00 AM to 10:59 AM | 87 (1.5%) | 230 (4.6%) |
| 11:00 AM to 11:59 AM | 95 (1.7%) | 82 (1.7%) |
| 12:00 PM to 3:59 PM | 270 (4.8%) | 406 (8.2%) |
| 4:00 PM to 11:59 PM | 359 (6.3%) | 115 (2.3%) |
| Total | 5,672 (100.0%) | 4,965 (100.0%) |
Housing Occupancy in Hood River County
Occupancy by Ownership in Hood River County
Of the total 9,039 dwellings in Hood River County, owner-occupied units account for 6,170 (68.3%), while renter-occupied units make up 2,869 (31.7%).
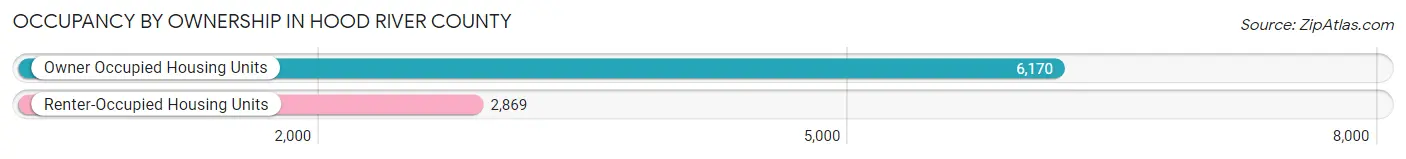
| Occupancy | # Housing Units | % Housing Units |
| Owner Occupied Housing Units | 6,170 | 68.3% |
| Renter-Occupied Housing Units | 2,869 | 31.7% |
| Total Occupied Housing Units | 9,039 | 100.0% |
Occupancy by Household Size in Hood River County
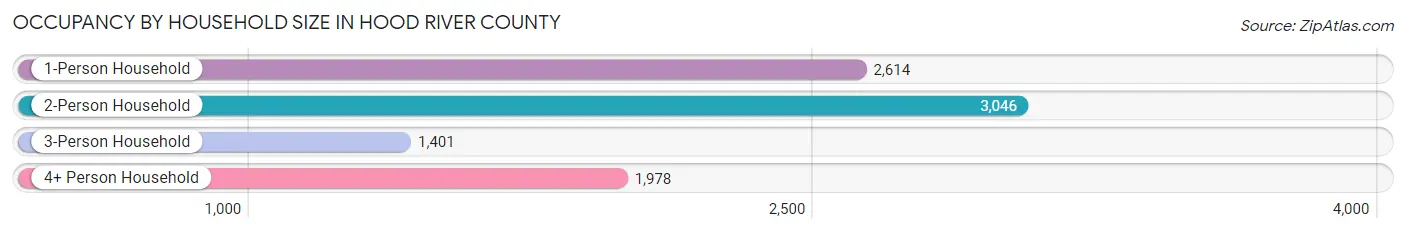
| Household Size | # Housing Units | % Housing Units |
| 1-Person Household | 2,614 | 28.9% |
| 2-Person Household | 3,046 | 33.7% |
| 3-Person Household | 1,401 | 15.5% |
| 4+ Person Household | 1,978 | 21.9% |
| Total Housing Units | 9,039 | 100.0% |
Occupancy by Ownership by Household Size in Hood River County
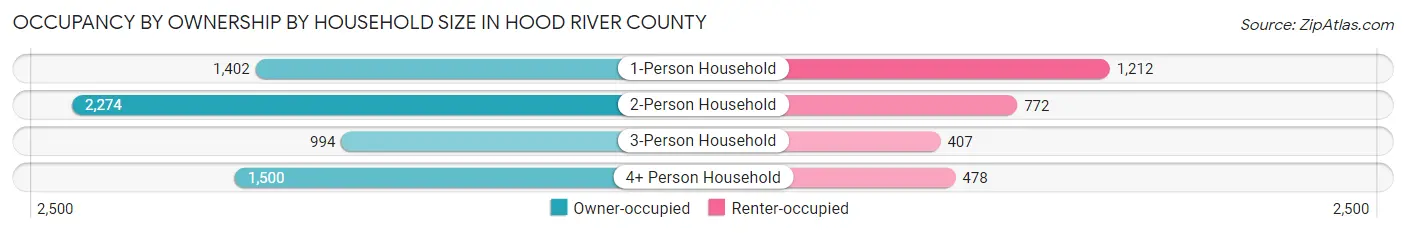
| Household Size | Owner-occupied | Renter-occupied |
| 1-Person Household | 1,402 (53.6%) | 1,212 (46.4%) |
| 2-Person Household | 2,274 (74.7%) | 772 (25.3%) |
| 3-Person Household | 994 (71.0%) | 407 (29.0%) |
| 4+ Person Household | 1,500 (75.8%) | 478 (24.2%) |
| Total Housing Units | 6,170 (68.3%) | 2,869 (31.7%) |
Occupancy by Educational Attainment in Hood River County
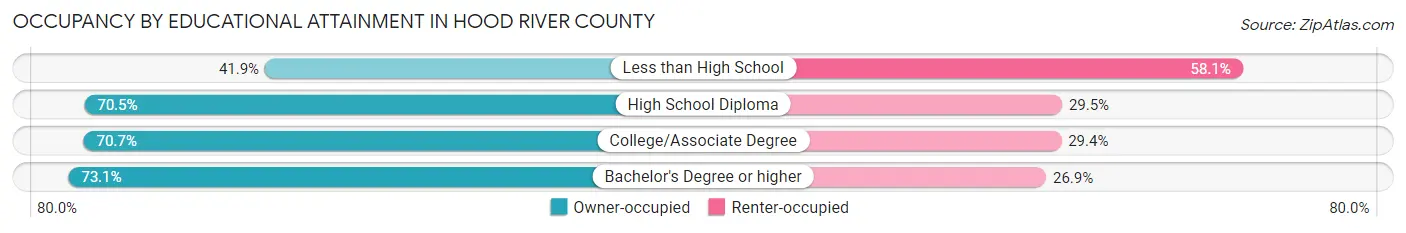
| Household Size | Owner-occupied | Renter-occupied |
| Less than High School | 446 (41.9%) | 619 (58.1%) |
| High School Diploma | 1,273 (70.5%) | 532 (29.5%) |
| College/Associate Degree | 1,639 (70.7%) | 681 (29.3%) |
| Bachelor's Degree or higher | 2,812 (73.1%) | 1,037 (26.9%) |
Occupancy by Age of Householder in Hood River County
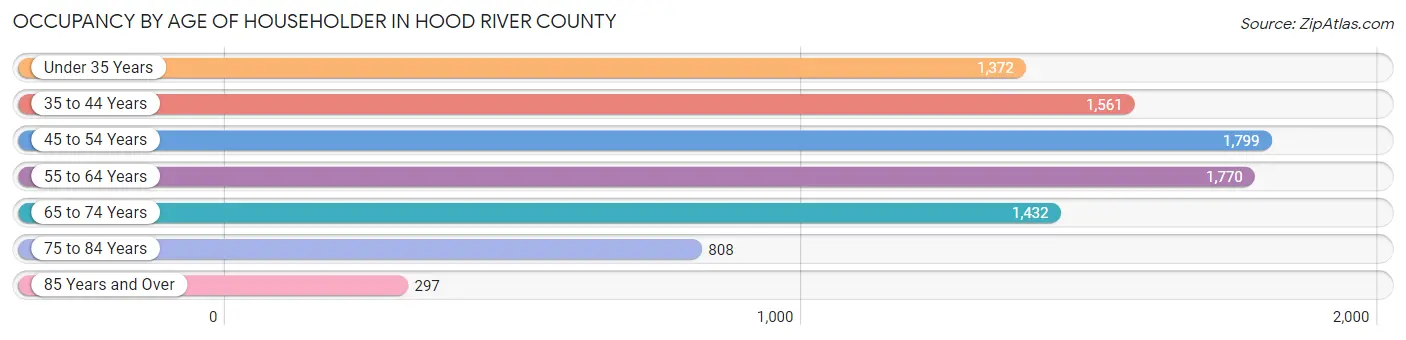
| Age Bracket | # Households | % Households |
| Under 35 Years | 1,372 | 15.2% |
| 35 to 44 Years | 1,561 | 17.3% |
| 45 to 54 Years | 1,799 | 19.9% |
| 55 to 64 Years | 1,770 | 19.6% |
| 65 to 74 Years | 1,432 | 15.8% |
| 75 to 84 Years | 808 | 8.9% |
| 85 Years and Over | 297 | 3.3% |
| Total | 9,039 | 100.0% |
Housing Finances in Hood River County
Median Income by Occupancy in Hood River County
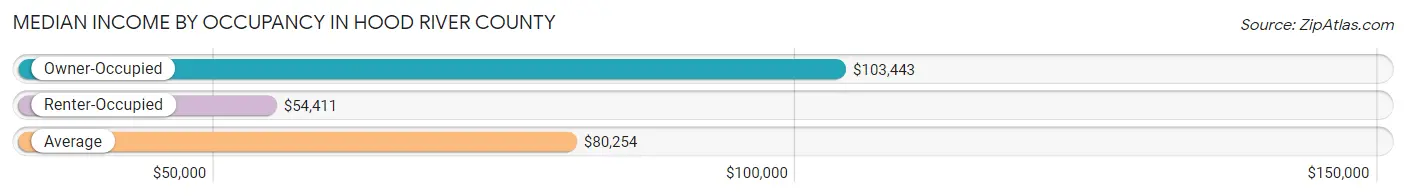
| Occupancy Type | # Households | Median Income |
| Owner-Occupied | 6,170 (68.3%) | $103,443 |
| Renter-Occupied | 2,869 (31.7%) | $54,411 |
| Average | 9,039 (100.0%) | $80,254 |
Occupancy by Householder Income Bracket in Hood River County
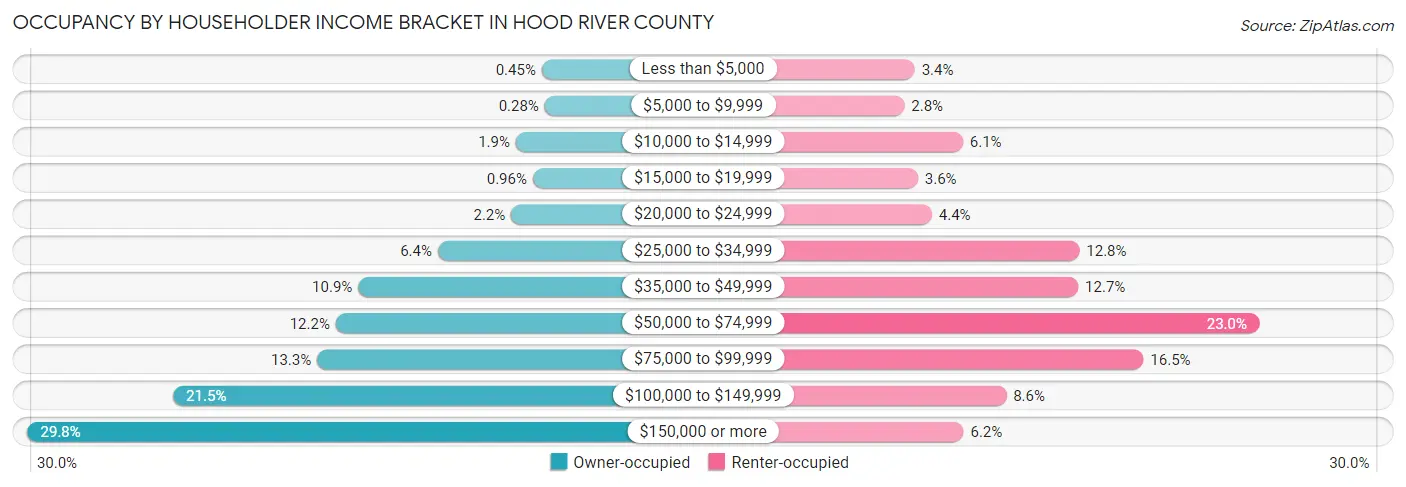
| Income Bracket | Owner-occupied | Renter-occupied |
| Less than $5,000 | 28 (0.4%) | 97 (3.4%) |
| $5,000 to $9,999 | 17 (0.3%) | 80 (2.8%) |
| $10,000 to $14,999 | 119 (1.9%) | 176 (6.1%) |
| $15,000 to $19,999 | 59 (1.0%) | 102 (3.6%) |
| $20,000 to $24,999 | 136 (2.2%) | 125 (4.4%) |
| $25,000 to $34,999 | 394 (6.4%) | 367 (12.8%) |
| $35,000 to $49,999 | 675 (10.9%) | 365 (12.7%) |
| $50,000 to $74,999 | 754 (12.2%) | 661 (23.0%) |
| $75,000 to $99,999 | 820 (13.3%) | 472 (16.5%) |
| $100,000 to $149,999 | 1,327 (21.5%) | 247 (8.6%) |
| $150,000 or more | 1,841 (29.8%) | 177 (6.2%) |
| Total | 6,170 (100.0%) | 2,869 (100.0%) |
Monthly Housing Cost Tiers in Hood River County
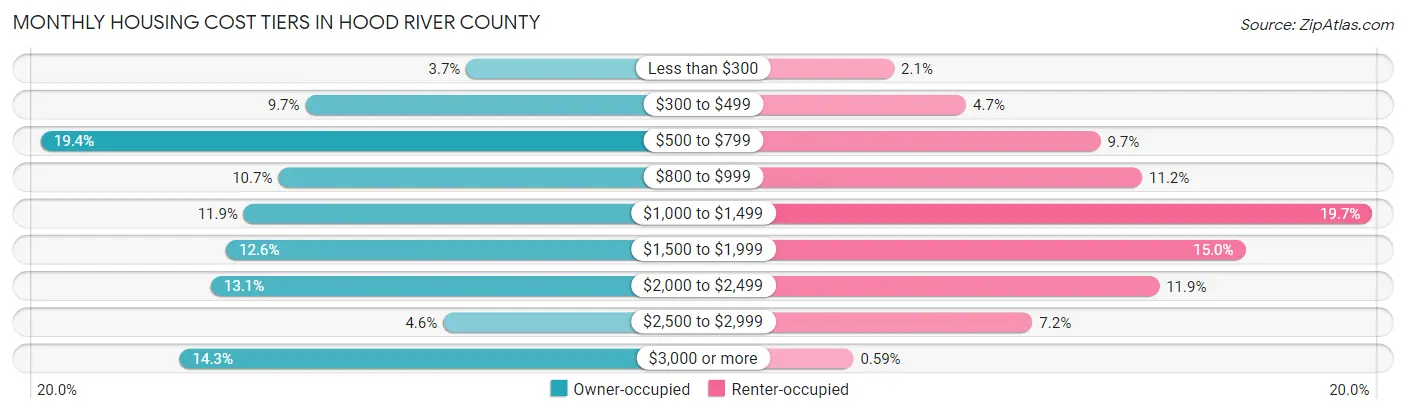
| Monthly Cost | Owner-occupied | Renter-occupied |
| Less than $300 | 231 (3.7%) | 60 (2.1%) |
| $300 to $499 | 596 (9.7%) | 136 (4.7%) |
| $500 to $799 | 1,197 (19.4%) | 278 (9.7%) |
| $800 to $999 | 658 (10.7%) | 322 (11.2%) |
| $1,000 to $1,499 | 736 (11.9%) | 565 (19.7%) |
| $1,500 to $1,999 | 776 (12.6%) | 431 (15.0%) |
| $2,000 to $2,499 | 811 (13.1%) | 340 (11.8%) |
| $2,500 to $2,999 | 283 (4.6%) | 206 (7.2%) |
| $3,000 or more | 882 (14.3%) | 17 (0.6%) |
| Total | 6,170 (100.0%) | 2,869 (100.0%) |
Physical Housing Characteristics in Hood River County
Housing Structures in Hood River County
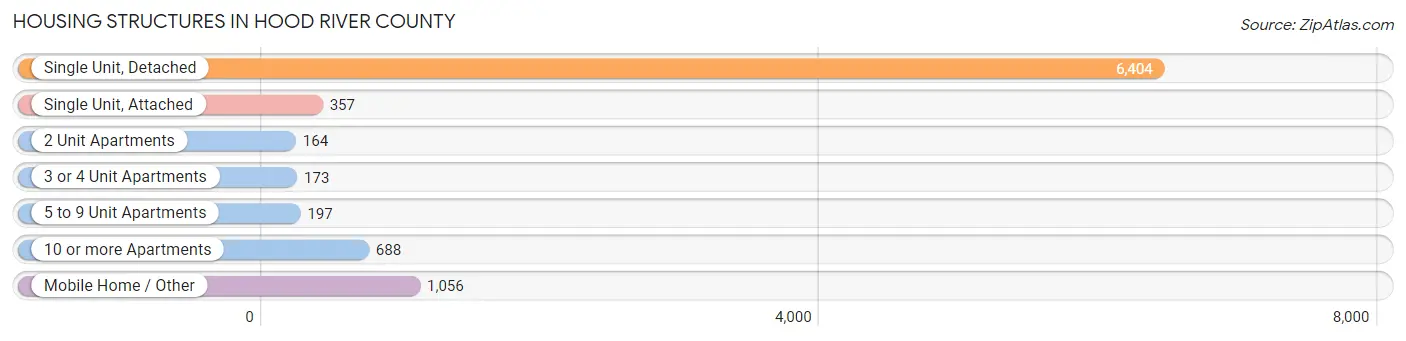
| Structure Type | # Housing Units | % Housing Units |
| Single Unit, Detached | 6,404 | 70.9% |
| Single Unit, Attached | 357 | 4.0% |
| 2 Unit Apartments | 164 | 1.8% |
| 3 or 4 Unit Apartments | 173 | 1.9% |
| 5 to 9 Unit Apartments | 197 | 2.2% |
| 10 or more Apartments | 688 | 7.6% |
| Mobile Home / Other | 1,056 | 11.7% |
| Total | 9,039 | 100.0% |
Housing Structures by Occupancy in Hood River County
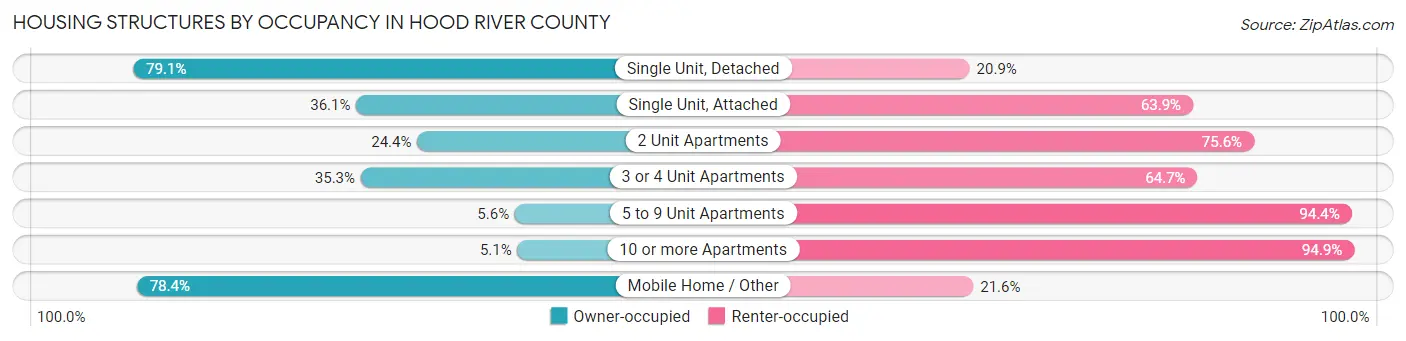
| Structure Type | Owner-occupied | Renter-occupied |
| Single Unit, Detached | 5,066 (79.1%) | 1,338 (20.9%) |
| Single Unit, Attached | 129 (36.1%) | 228 (63.9%) |
| 2 Unit Apartments | 40 (24.4%) | 124 (75.6%) |
| 3 or 4 Unit Apartments | 61 (35.3%) | 112 (64.7%) |
| 5 to 9 Unit Apartments | 11 (5.6%) | 186 (94.4%) |
| 10 or more Apartments | 35 (5.1%) | 653 (94.9%) |
| Mobile Home / Other | 828 (78.4%) | 228 (21.6%) |
| Total | 6,170 (68.3%) | 2,869 (31.7%) |
Housing Structures by Number of Rooms in Hood River County
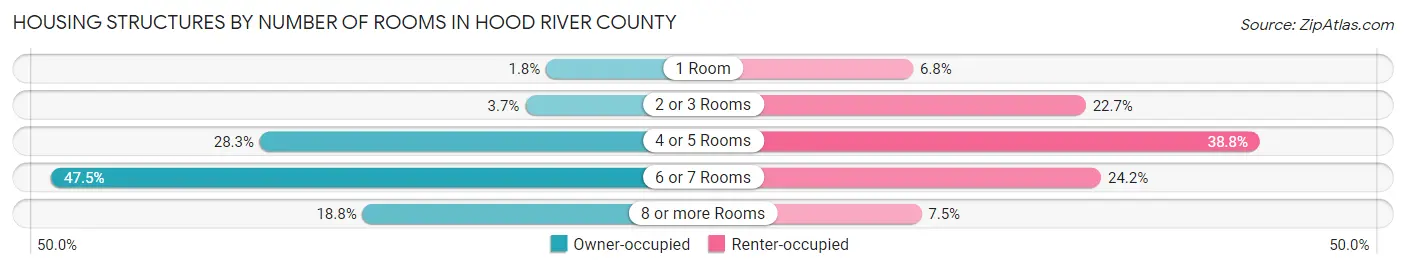
| Number of Rooms | Owner-occupied | Renter-occupied |
| 1 Room | 109 (1.8%) | 194 (6.8%) |
| 2 or 3 Rooms | 228 (3.7%) | 652 (22.7%) |
| 4 or 5 Rooms | 1,743 (28.2%) | 1,114 (38.8%) |
| 6 or 7 Rooms | 2,933 (47.5%) | 693 (24.1%) |
| 8 or more Rooms | 1,157 (18.8%) | 216 (7.5%) |
| Total | 6,170 (100.0%) | 2,869 (100.0%) |
Housing Structure by Heating Type in Hood River County
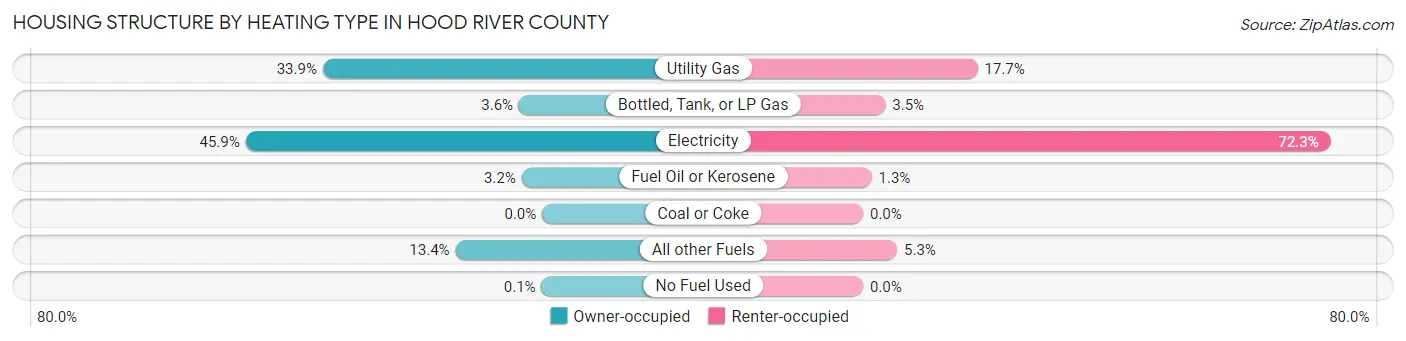
| Heating Type | Owner-occupied | Renter-occupied |
| Utility Gas | 2,092 (33.9%) | 508 (17.7%) |
| Bottled, Tank, or LP Gas | 221 (3.6%) | 99 (3.5%) |
| Electricity | 2,829 (45.9%) | 2,073 (72.3%) |
| Fuel Oil or Kerosene | 195 (3.2%) | 38 (1.3%) |
| Coal or Coke | 0 (0.0%) | 0 (0.0%) |
| All other Fuels | 827 (13.4%) | 151 (5.3%) |
| No Fuel Used | 6 (0.1%) | 0 (0.0%) |
| Total | 6,170 (100.0%) | 2,869 (100.0%) |
Household Vehicle Usage in Hood River County
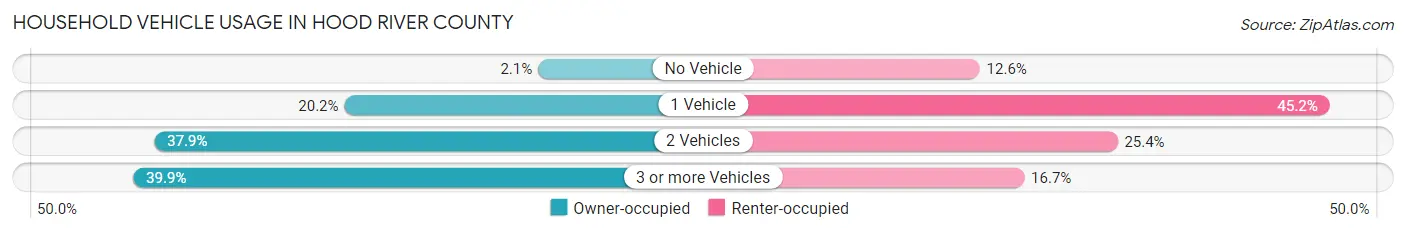
| Vehicles per Household | Owner-occupied | Renter-occupied |
| No Vehicle | 128 (2.1%) | 361 (12.6%) |
| 1 Vehicle | 1,243 (20.2%) | 1,298 (45.2%) |
| 2 Vehicles | 2,339 (37.9%) | 730 (25.4%) |
| 3 or more Vehicles | 2,460 (39.9%) | 480 (16.7%) |
| Total | 6,170 (100.0%) | 2,869 (100.0%) |
Real Estate & Mortgages in Hood River County
Real Estate and Mortgage Overview in Hood River County
| Characteristic | Without Mortgage | With Mortgage |
| Housing Units | 2,700 | 3,470 |
| Median Property Value | $459,300 | $540,600 |
| Median Household Income | $76,367 | $1,390 |
| Monthly Housing Costs | $615 | $871 |
| Real Estate Taxes | $3,112 | $29 |
Property Value by Mortgage Status in Hood River County
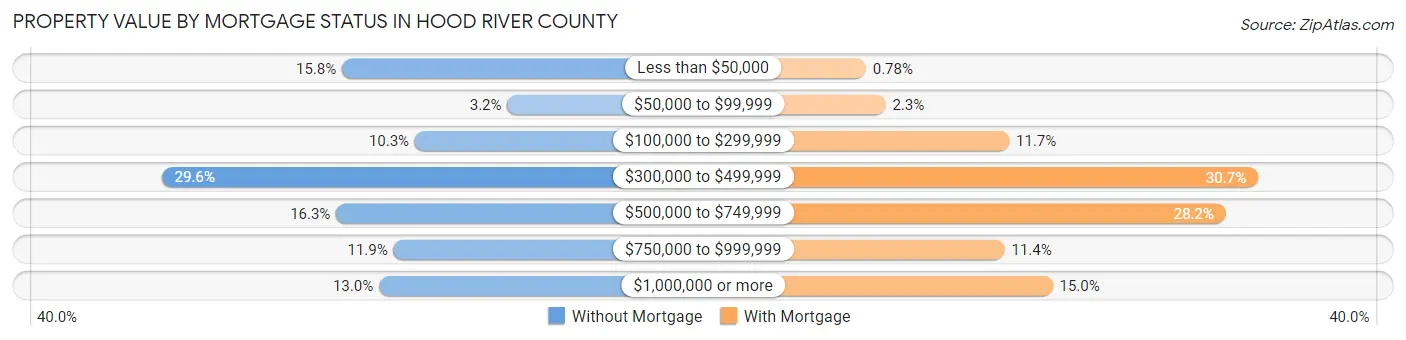
| Property Value | Without Mortgage | With Mortgage |
| Less than $50,000 | 427 (15.8%) | 27 (0.8%) |
| $50,000 to $99,999 | 87 (3.2%) | 79 (2.3%) |
| $100,000 to $299,999 | 277 (10.3%) | 406 (11.7%) |
| $300,000 to $499,999 | 798 (29.6%) | 1,064 (30.7%) |
| $500,000 to $749,999 | 439 (16.3%) | 979 (28.2%) |
| $750,000 to $999,999 | 321 (11.9%) | 394 (11.4%) |
| $1,000,000 or more | 351 (13.0%) | 521 (15.0%) |
| Total | 2,700 (100.0%) | 3,470 (100.0%) |
Household Income by Mortgage Status in Hood River County
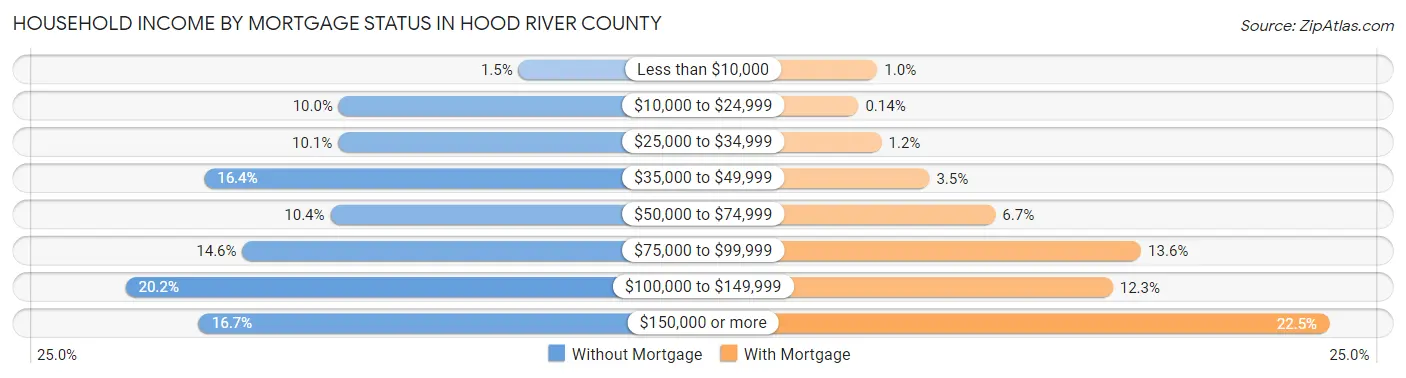
| Household Income | Without Mortgage | With Mortgage |
| Less than $10,000 | 40 (1.5%) | 36 (1.0%) |
| $10,000 to $24,999 | 271 (10.0%) | 5 (0.1%) |
| $25,000 to $34,999 | 272 (10.1%) | 43 (1.2%) |
| $35,000 to $49,999 | 444 (16.4%) | 122 (3.5%) |
| $50,000 to $74,999 | 282 (10.4%) | 231 (6.7%) |
| $75,000 to $99,999 | 395 (14.6%) | 472 (13.6%) |
| $100,000 to $149,999 | 545 (20.2%) | 425 (12.2%) |
| $150,000 or more | 451 (16.7%) | 782 (22.5%) |
| Total | 2,700 (100.0%) | 3,470 (100.0%) |
Property Value to Household Income Ratio in Hood River County
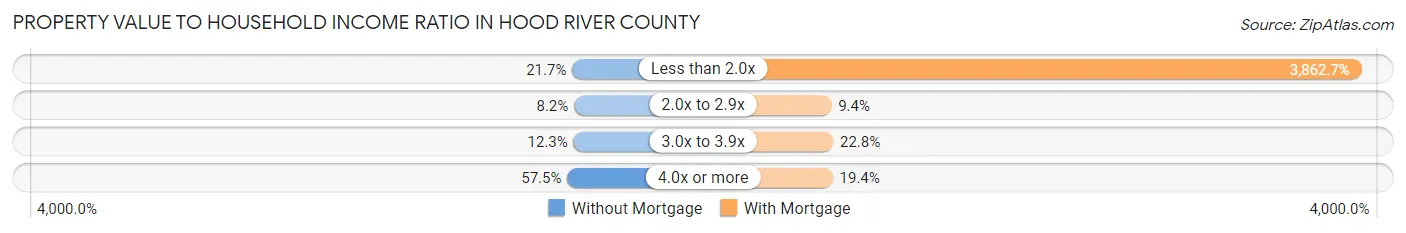
| Value-to-Income Ratio | Without Mortgage | With Mortgage |
| Less than 2.0x | 587 (21.7%) | 134,036 (3,862.7%) |
| 2.0x to 2.9x | 221 (8.2%) | 325 (9.4%) |
| 3.0x to 3.9x | 332 (12.3%) | 791 (22.8%) |
| 4.0x or more | 1,553 (57.5%) | 674 (19.4%) |
| Total | 2,700 (100.0%) | 3,470 (100.0%) |
Real Estate Taxes by Mortgage Status in Hood River County
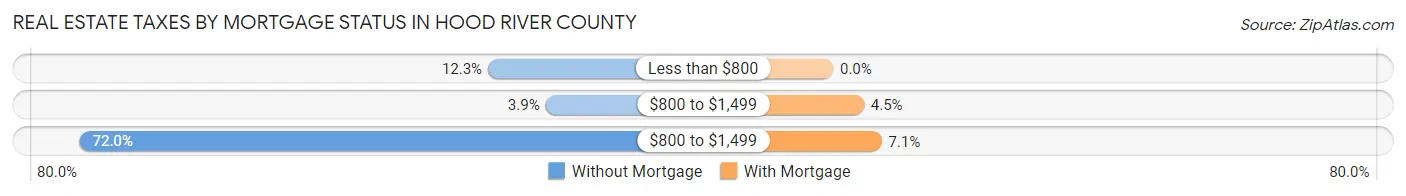
| Property Taxes | Without Mortgage | With Mortgage |
| Less than $800 | 332 (12.3%) | 0 (0.0%) |
| $800 to $1,499 | 105 (3.9%) | 156 (4.5%) |
| $800 to $1,499 | 1,943 (72.0%) | 246 (7.1%) |
| Total | 2,700 (100.0%) | 3,470 (100.0%) |
Health & Disability in Hood River County
Health Insurance Coverage by Age in Hood River County
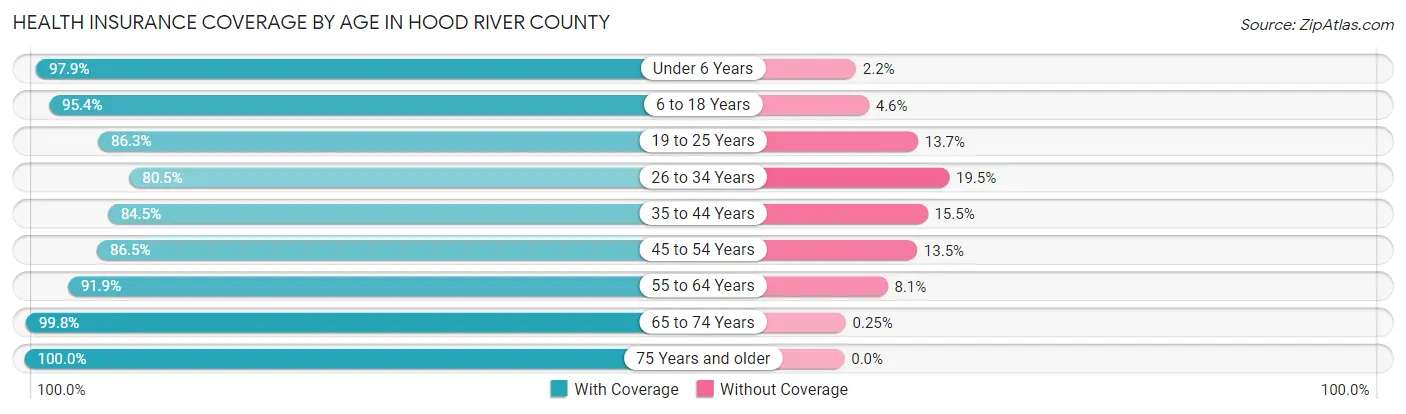
| Age Bracket | With Coverage | Without Coverage |
| Under 6 Years | 1,685 (97.9%) | 37 (2.1%) |
| 6 to 18 Years | 3,822 (95.4%) | 183 (4.6%) |
| 19 to 25 Years | 1,434 (86.3%) | 228 (13.7%) |
| 26 to 34 Years | 2,302 (80.5%) | 559 (19.5%) |
| 35 to 44 Years | 2,712 (84.5%) | 498 (15.5%) |
| 45 to 54 Years | 2,759 (86.5%) | 432 (13.5%) |
| 55 to 64 Years | 2,930 (91.9%) | 257 (8.1%) |
| 65 to 74 Years | 2,416 (99.8%) | 6 (0.3%) |
| 75 Years and older | 1,592 (100.0%) | 0 (0.0%) |
| Total | 21,652 (90.8%) | 2,200 (9.2%) |
Health Insurance Coverage by Citizenship Status in Hood River County
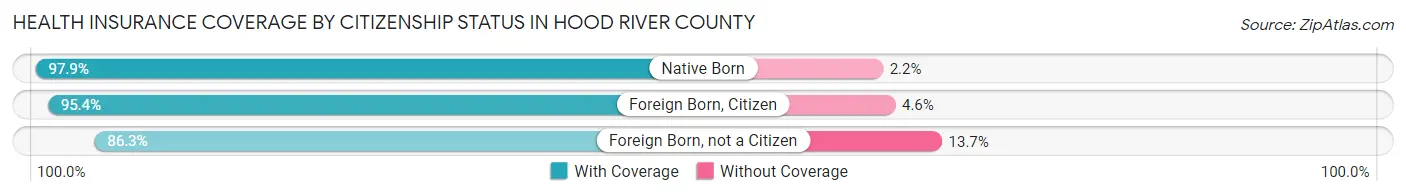
| Citizenship Status | With Coverage | Without Coverage |
| Native Born | 1,685 (97.9%) | 37 (2.1%) |
| Foreign Born, Citizen | 3,822 (95.4%) | 183 (4.6%) |
| Foreign Born, not a Citizen | 1,434 (86.3%) | 228 (13.7%) |
Health Insurance Coverage by Household Income in Hood River County
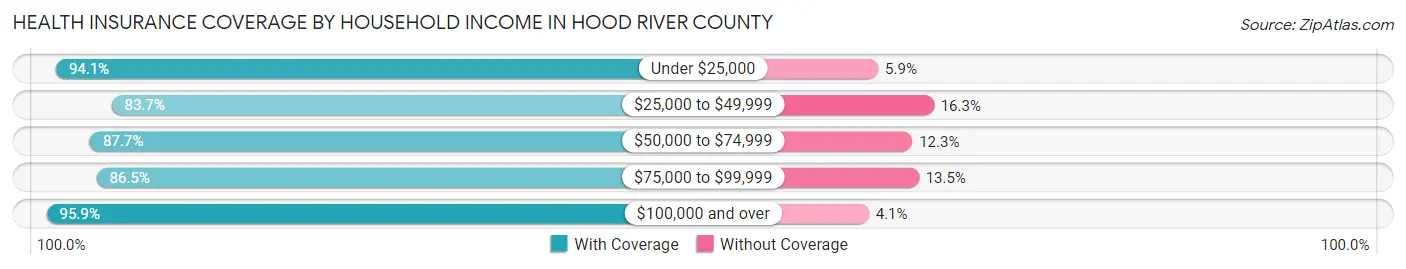
| Household Income | With Coverage | Without Coverage |
| Under $25,000 | 1,105 (94.1%) | 69 (5.9%) |
| $25,000 to $49,999 | 3,278 (83.7%) | 638 (16.3%) |
| $50,000 to $74,999 | 3,019 (87.7%) | 422 (12.3%) |
| $75,000 to $99,999 | 2,704 (86.5%) | 421 (13.5%) |
| $100,000 and over | 10,703 (95.9%) | 459 (4.1%) |
Public vs Private Health Insurance Coverage by Age in Hood River County
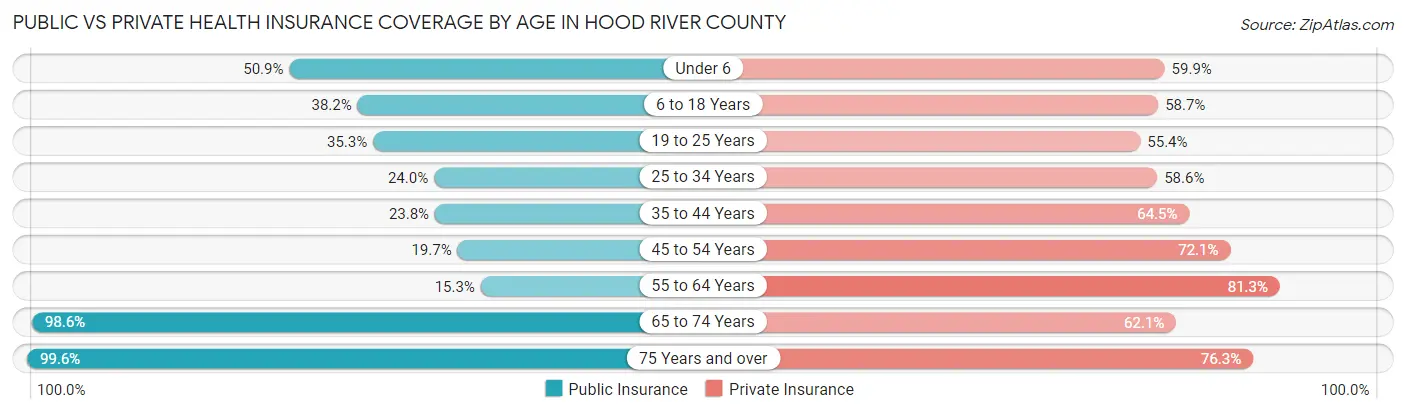
| Age Bracket | Public Insurance | Private Insurance |
| Under 6 | 876 (50.9%) | 1,032 (59.9%) |
| 6 to 18 Years | 1,530 (38.2%) | 2,352 (58.7%) |
| 19 to 25 Years | 587 (35.3%) | 921 (55.4%) |
| 25 to 34 Years | 687 (24.0%) | 1,675 (58.6%) |
| 35 to 44 Years | 765 (23.8%) | 2,070 (64.5%) |
| 45 to 54 Years | 627 (19.7%) | 2,301 (72.1%) |
| 55 to 64 Years | 489 (15.3%) | 2,591 (81.3%) |
| 65 to 74 Years | 2,389 (98.6%) | 1,503 (62.1%) |
| 75 Years and over | 1,585 (99.6%) | 1,215 (76.3%) |
| Total | 9,535 (40.0%) | 15,660 (65.6%) |
Disability Status by Sex by Age in Hood River County
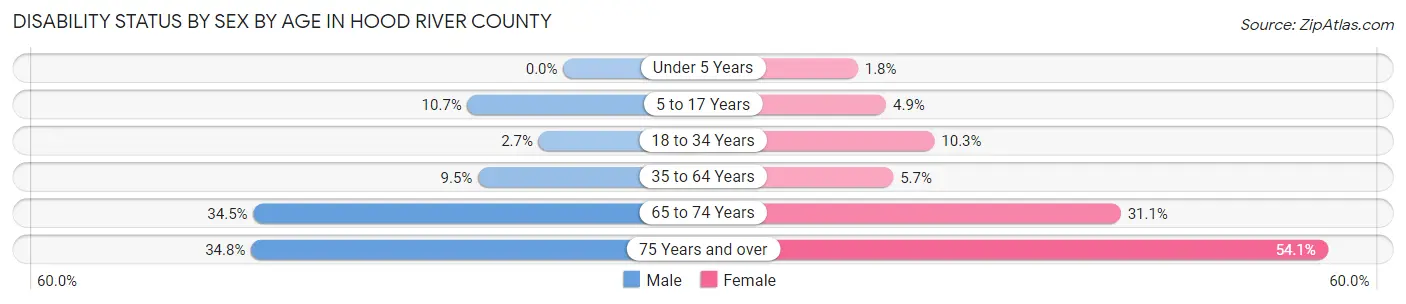
| Age Bracket | Male | Female |
| Under 5 Years | 0 (0.0%) | 14 (1.8%) |
| 5 to 17 Years | 208 (10.7%) | 104 (4.9%) |
| 18 to 34 Years | 69 (2.7%) | 237 (10.3%) |
| 35 to 64 Years | 466 (9.5%) | 268 (5.7%) |
| 65 to 74 Years | 426 (34.5%) | 369 (31.1%) |
| 75 Years and over | 236 (34.8%) | 494 (54.1%) |
Disability Class by Sex by Age in Hood River County
Disability Class: Hearing Difficulty
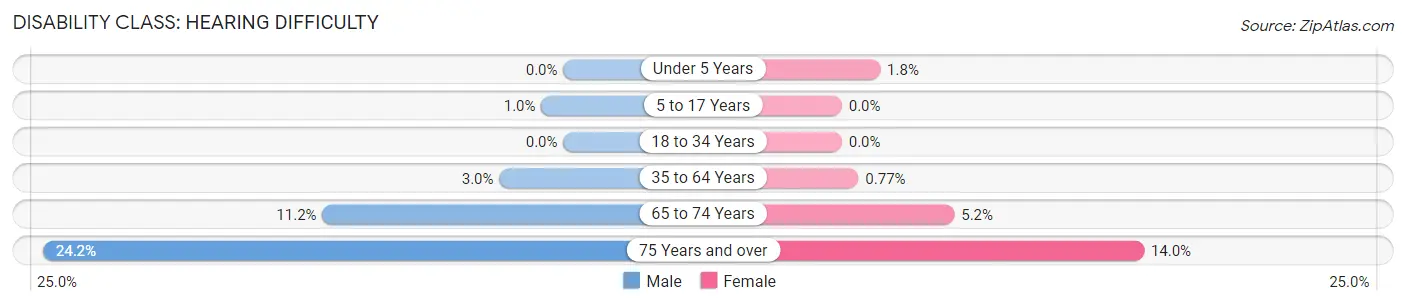
| Age Bracket | Male | Female |
| Under 5 Years | 0 (0.0%) | 14 (1.8%) |
| 5 to 17 Years | 20 (1.0%) | 0 (0.0%) |
| 18 to 34 Years | 0 (0.0%) | 0 (0.0%) |
| 35 to 64 Years | 146 (3.0%) | 36 (0.8%) |
| 65 to 74 Years | 138 (11.2%) | 62 (5.2%) |
| 75 Years and over | 164 (24.1%) | 128 (14.0%) |
Disability Class: Vision Difficulty
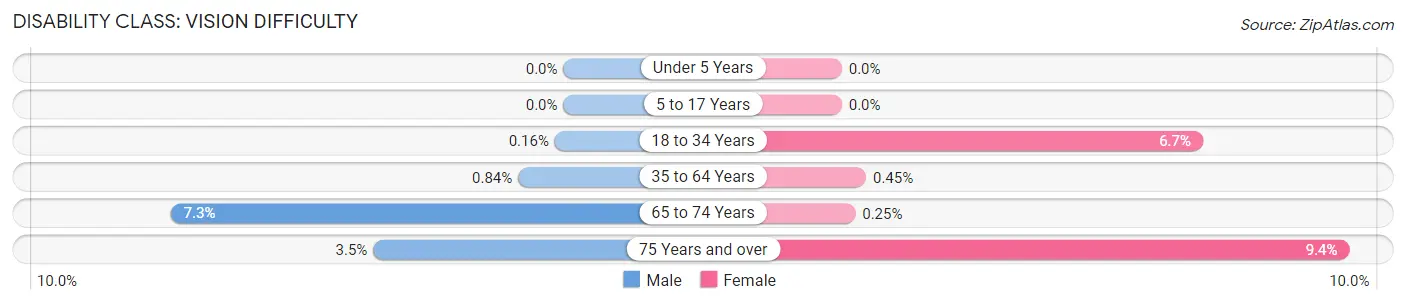
| Age Bracket | Male | Female |
| Under 5 Years | 0 (0.0%) | 0 (0.0%) |
| 5 to 17 Years | 0 (0.0%) | 0 (0.0%) |
| 18 to 34 Years | 4 (0.2%) | 154 (6.7%) |
| 35 to 64 Years | 41 (0.8%) | 21 (0.4%) |
| 65 to 74 Years | 90 (7.3%) | 3 (0.3%) |
| 75 Years and over | 24 (3.5%) | 86 (9.4%) |
Disability Class: Cognitive Difficulty
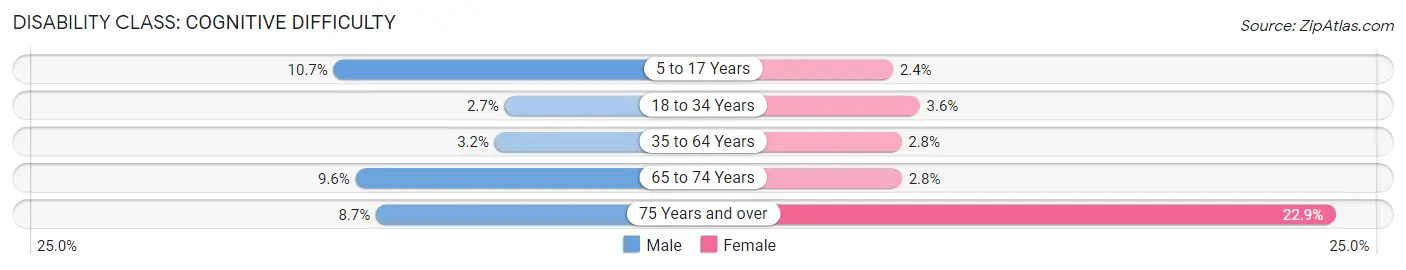
| Age Bracket | Male | Female |
| 5 to 17 Years | 208 (10.7%) | 50 (2.4%) |
| 18 to 34 Years | 69 (2.7%) | 83 (3.6%) |
| 35 to 64 Years | 156 (3.2%) | 129 (2.8%) |
| 65 to 74 Years | 119 (9.6%) | 33 (2.8%) |
| 75 Years and over | 59 (8.7%) | 209 (22.9%) |
Disability Class: Ambulatory Difficulty
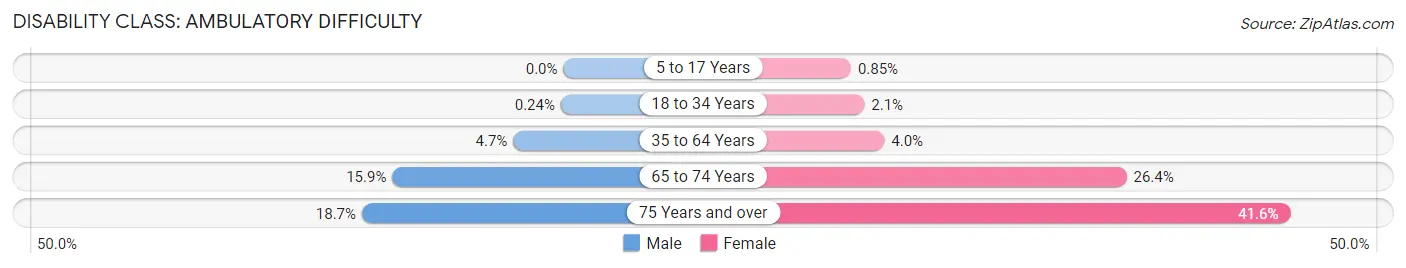
| Age Bracket | Male | Female |
| 5 to 17 Years | 0 (0.0%) | 18 (0.9%) |
| 18 to 34 Years | 6 (0.2%) | 48 (2.1%) |
| 35 to 64 Years | 229 (4.7%) | 185 (4.0%) |
| 65 to 74 Years | 196 (15.9%) | 314 (26.4%) |
| 75 Years and over | 127 (18.7%) | 380 (41.6%) |
Disability Class: Self-Care Difficulty
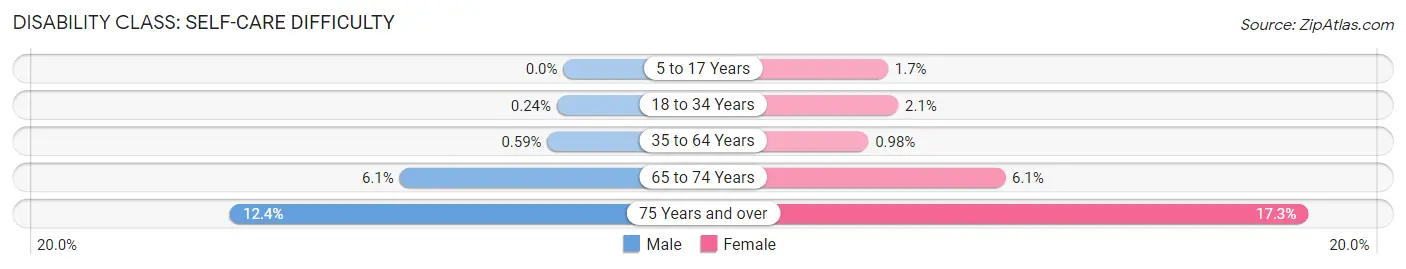
| Age Bracket | Male | Female |
| 5 to 17 Years | 0 (0.0%) | 36 (1.7%) |
| 18 to 34 Years | 6 (0.2%) | 48 (2.1%) |
| 35 to 64 Years | 29 (0.6%) | 46 (1.0%) |
| 65 to 74 Years | 75 (6.1%) | 72 (6.1%) |
| 75 Years and over | 84 (12.4%) | 158 (17.3%) |
Technology Access in Hood River County
Computing Device Access in Hood River County
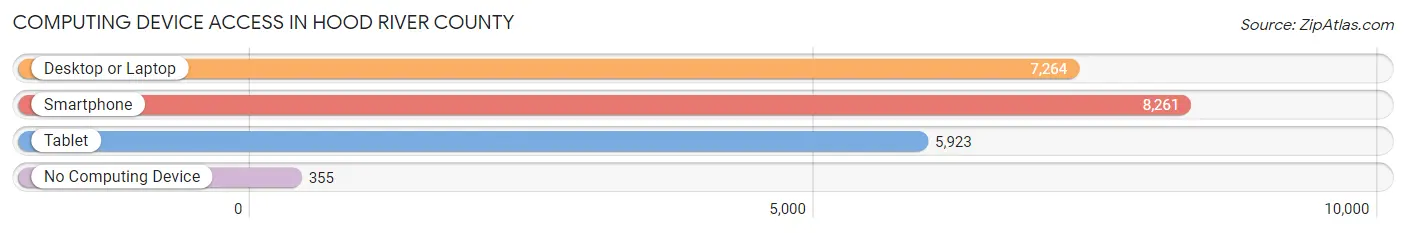
| Device Type | # Households | % Households |
| Desktop or Laptop | 7,264 | 80.4% |
| Smartphone | 8,261 | 91.4% |
| Tablet | 5,923 | 65.5% |
| No Computing Device | 355 | 3.9% |
| Total | 9,039 | 100.0% |
Internet Access in Hood River County
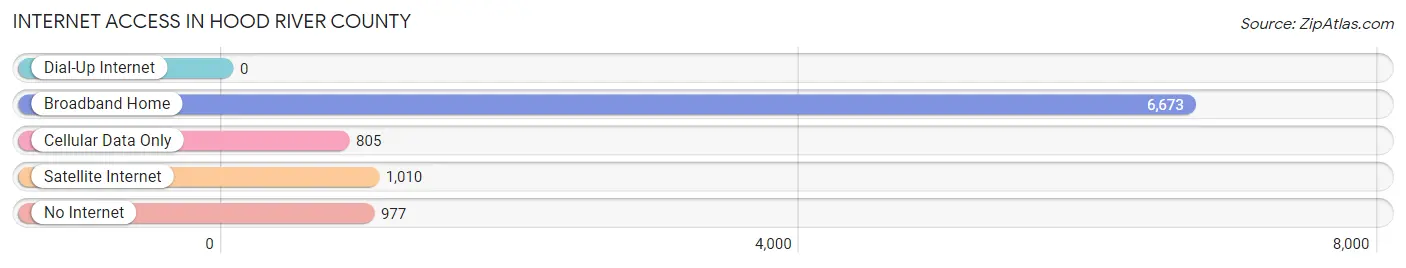
| Internet Type | # Households | % Households |
| Dial-Up Internet | 0 | 0.0% |
| Broadband Home | 6,673 | 73.8% |
| Cellular Data Only | 805 | 8.9% |
| Satellite Internet | 1,010 | 11.2% |
| No Internet | 977 | 10.8% |
| Total | 9,039 | 100.0% |
Hood River County Summary
Hood River County is located in the Columbia River Gorge in the state of Oregon. It is bordered by Wasco County to the north, Multnomah County to the east, and Klickitat County, Washington to the south. The county seat is Hood River, and the county has a population of approximately 22,000 people.
History
Hood River County was created in 1908 from parts of Wasco and Clackamas counties. The county was named after the Hood River, which was named after the British Admiral Samuel Hood. The area was first settled by Native Americans, and the first white settlers arrived in the late 1840s. The first post office was established in 1854.
The county was primarily an agricultural area, with orchards, vineyards, and livestock. The county also had a thriving lumber industry, and the town of Hood River became a major shipping port for the lumber. The county also had a thriving fishing industry, and the town of Cascade Locks was established as a port for the fishing boats.
In the early 1900s, the county began to attract tourists, and the town of Hood River became a popular destination for outdoor recreation. The county also became a popular destination for windsurfing and kiteboarding, and the town of Hood River is now known as the “Windsurfing Capital of the World.”
Geography
Hood River County is located in the Columbia River Gorge, and is bordered by Wasco County to the north, Multnomah County to the east, and Klickitat County, Washington to the south. The county is home to the Columbia River, the Hood River, and the Deschutes River. The county is also home to several mountain ranges, including the Cascade Range, the Columbia River Gorge, and the Mount Hood National Forest.
The county has a total area of 1,072 square miles, of which 1,068 square miles is land and 4 square miles is water. The county has a variety of terrain, ranging from the high mountains of the Cascade Range to the rolling hills of the Columbia River Gorge.
Economy
Hood River County has a diverse economy, with a mix of agriculture, manufacturing, tourism, and technology. The county is home to several large companies, including Hood River Distillers, Full Sail Brewing, and Columbia Gorge Winery.
Agriculture is a major part of the county’s economy, with apples, pears, cherries, and other fruits being grown in the area. The county is also home to several wineries and breweries, and the town of Hood River is a popular destination for wine tasting and craft beer.
Tourism is also a major part of the county’s economy, with the town of Hood River being a popular destination for outdoor recreation, such as windsurfing, kiteboarding, and hiking. The county is also home to several ski resorts, including Mt. Hood Meadows and Timberline Lodge.
Demographics
As of the 2010 census, the population of Hood River County was 22,346. The racial makeup of the county was 87.3% White, 0.7% African American, 1.2% Native American, 1.7% Asian, 0.2% Pacific Islander, 6.2% from other races, and 3.0% from two or more races. Hispanic or Latino of any race were 11.3% of the population.
The median income for a household in the county was $45,837, and the median income for a family was $54,945. The per capita income for the county was $25,945. About 11.2% of families and 15.2% of the population were below the poverty line, including 20.2% of those under age 18 and 8.2% of those age 65 or over.
Common Questions
What is the Total Population of Hood River County?
Total Population of Hood River County is 23,965.
What is the Total Male Population of Hood River County?
Total Male Population of Hood River County is 11,919.
What is the Total Female Population of Hood River County?
Total Female Population of Hood River County is 12,046.
What is the Ratio of Males per 100 Females in Hood River County?
There are 98.95 Males per 100 Females in Hood River County.
What is the Ratio of Females per 100 Males in Hood River County?
There are 101.07 Females per 100 Males in Hood River County.
What is the Median Population Age in Hood River County?
Median Population Age in Hood River County is 40.2 Years.
What is the Average Family Size in Hood River County
Average Family Size in Hood River County is 3.1 People.
What is the Average Household Size in Hood River County
Average Household Size in Hood River County is 2.5 People.
What is Per Capita Income in Hood River County?
Per Capita income in Hood River County is $43,333.
What is the Median Family Income in Hood River County?
Median Family Income in Hood River County is $98,112.
What is the Median Household income in Hood River County?
Median Household Income in Hood River County is $80,254.
What is Income or Wage Gap in Hood River County?
Income or Wage Gap in Hood River County is 22.5%.
Women in Hood River County earn 77.5 cents for every dollar earned by a man.
What is Inequality or Gini Index in Hood River County?
Inequality or Gini Index in Hood River County is 0.45.
How Large is the Labor Force in Hood River County?
There are 13,314 People in the Labor Forcein in Hood River County.
What is the Percentage of People in the Labor Force in Hood River County?
69.4% of People are in the Labor Force in Hood River County.
What is the Unemployment Rate in Hood River County?
Unemployment Rate in Hood River County is 3.3%.