Harney County, OR
Harney County Map
Harney County Overview
7,496
TOTAL POPULATION
3,792
MALE POPULATION
3,704
FEMALE POPULATION
102.38
MALES / 100 FEMALES
97.68
FEMALES / 100 MALES
45.5
MEDIAN AGE
2.9
AVG FAMILY SIZE
2.4
AVG HOUSEHOLD SIZE
$26,910
PER CAPITA INCOME
$57,875
AVG FAMILY INCOME
$45,462
AVG HOUSEHOLD INCOME
12.4%
WAGE / INCOME GAP [ % ]
87.6¢/ $1
WAGE / INCOME GAP [ $ ]
0.43
INEQUALITY / GINI INDEX
3,323
LABOR FORCE [ PEOPLE ]
54.0%
PERCENT IN LABOR FORCE
5.4%
UNEMPLOYMENT RATE
Harney County Area Codes
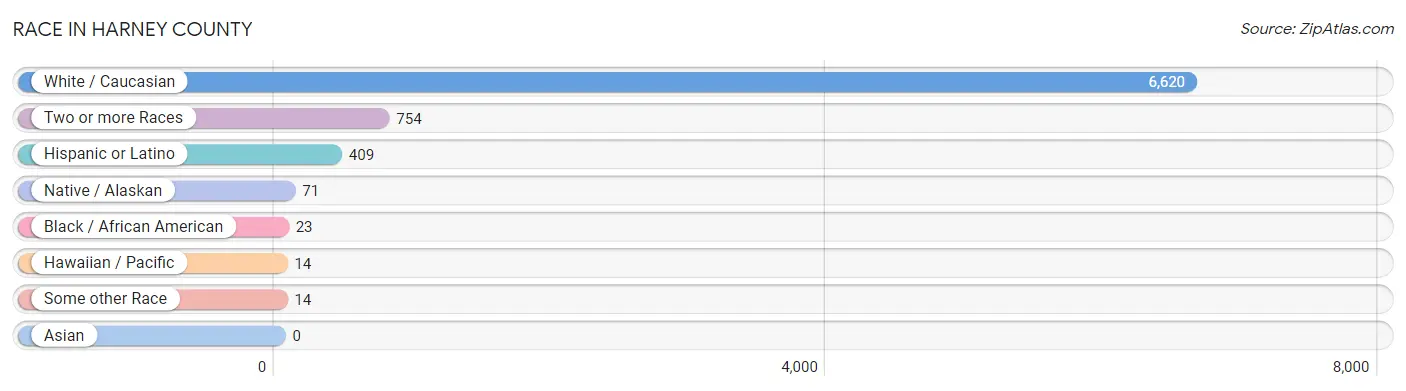
Race in Harney County
The most populous races in Harney County are White / Caucasian (6,620 | 88.3%), Two or more Races (754 | 10.1%), and Hispanic or Latino (409 | 5.5%).
| Race | # Population | % Population |
| Asian | 0 | 0.0% |
| Black / African American | 23 | 0.3% |
| Hawaiian / Pacific | 14 | 0.2% |
| Hispanic or Latino | 409 | 5.5% |
| Native / Alaskan | 71 | 0.9% |
| White / Caucasian | 6,620 | 88.3% |
| Two or more Races | 754 | 10.1% |
| Some other Race | 14 | 0.2% |
| Total | 7,496 | 100.0% |
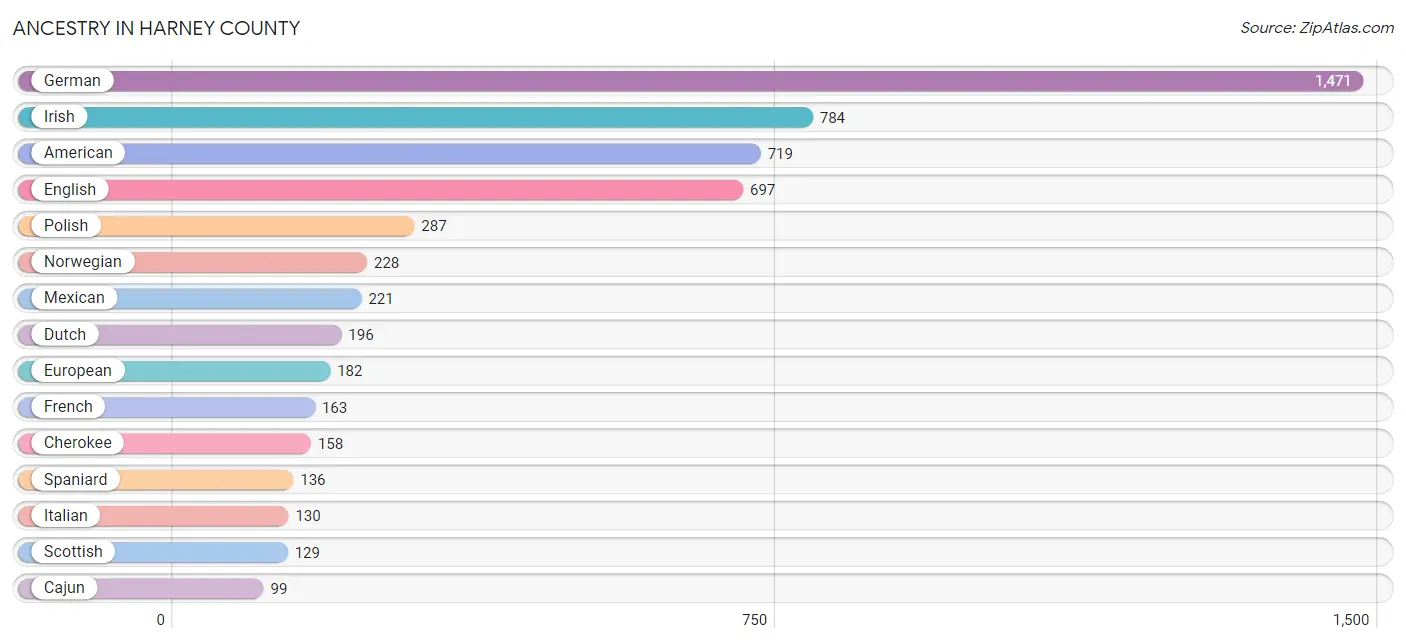
Ancestry in Harney County
The most populous ancestries reported in Harney County are German (1,471 | 19.6%), Irish (784 | 10.5%), American (719 | 9.6%), English (697 | 9.3%), and Polish (287 | 3.8%), together accounting for 52.8% of all Harney County residents.
| Ancestry | # Population | % Population |
| African | 17 | 0.2% |
| American | 719 | 9.6% |
| Basque | 27 | 0.4% |
| Bhutanese | 53 | 0.7% |
| Blackfeet | 6 | 0.1% |
| British | 89 | 1.2% |
| Cajun | 99 | 1.3% |
| Canadian | 41 | 0.5% |
| Cherokee | 158 | 2.1% |
| Cheyenne | 7 | 0.1% |
| Choctaw | 43 | 0.6% |
| Colville | 2 | 0.0% |
| Czech | 20 | 0.3% |
| Danish | 82 | 1.1% |
| Dutch | 196 | 2.6% |
| Eastern European | 3 | 0.0% |
| English | 697 | 9.3% |
| European | 182 | 2.4% |
| Finnish | 43 | 0.6% |
| French | 163 | 2.2% |
| French Canadian | 96 | 1.3% |
| German | 1,471 | 19.6% |
| Greek | 21 | 0.3% |
| Irish | 784 | 10.5% |
| Italian | 130 | 1.7% |
| Korean | 15 | 0.2% |
| Mexican | 221 | 2.9% |
| Native Hawaiian | 86 | 1.1% |
| Northern European | 28 | 0.4% |
| Norwegian | 228 | 3.0% |
| Paiute | 64 | 0.9% |
| Polish | 287 | 3.8% |
| Puerto Rican | 15 | 0.2% |
| Russian | 13 | 0.2% |
| Scandinavian | 30 | 0.4% |
| Scotch-Irish | 67 | 0.9% |
| Scottish | 129 | 1.7% |
| Spaniard | 136 | 1.8% |
| Spanish | 12 | 0.2% |
| Subsaharan African | 17 | 0.2% |
| Swedish | 98 | 1.3% |
| Swiss | 8 | 0.1% |
| Tlingit-Haida | 1 | 0.0% |
| Tsimshian | 1 | 0.0% |
| Welsh | 86 | 1.1% | View All 45 Rows |
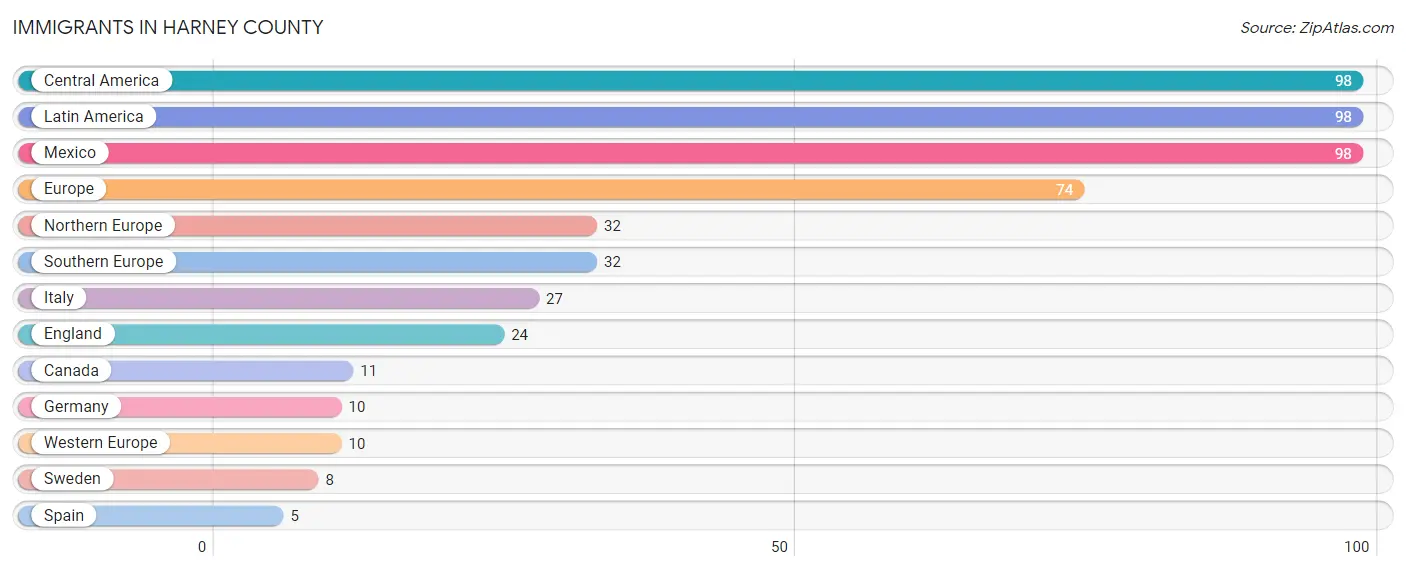
Immigrants in Harney County
The most numerous immigrant groups reported in Harney County came from Central America (98 | 1.3%), Latin America (98 | 1.3%), Mexico (98 | 1.3%), Europe (74 | 1.0%), and Northern Europe (32 | 0.4%), together accounting for 5.3% of all Harney County residents.
| Immigration Origin | # Population | % Population |
| Canada | 11 | 0.2% |
| Central America | 98 | 1.3% |
| England | 24 | 0.3% |
| Europe | 74 | 1.0% |
| Germany | 10 | 0.1% |
| Italy | 27 | 0.4% |
| Latin America | 98 | 1.3% |
| Mexico | 98 | 1.3% |
| Northern Europe | 32 | 0.4% |
| Southern Europe | 32 | 0.4% |
| Spain | 5 | 0.1% |
| Sweden | 8 | 0.1% |
| Western Europe | 10 | 0.1% | View All 13 Rows |
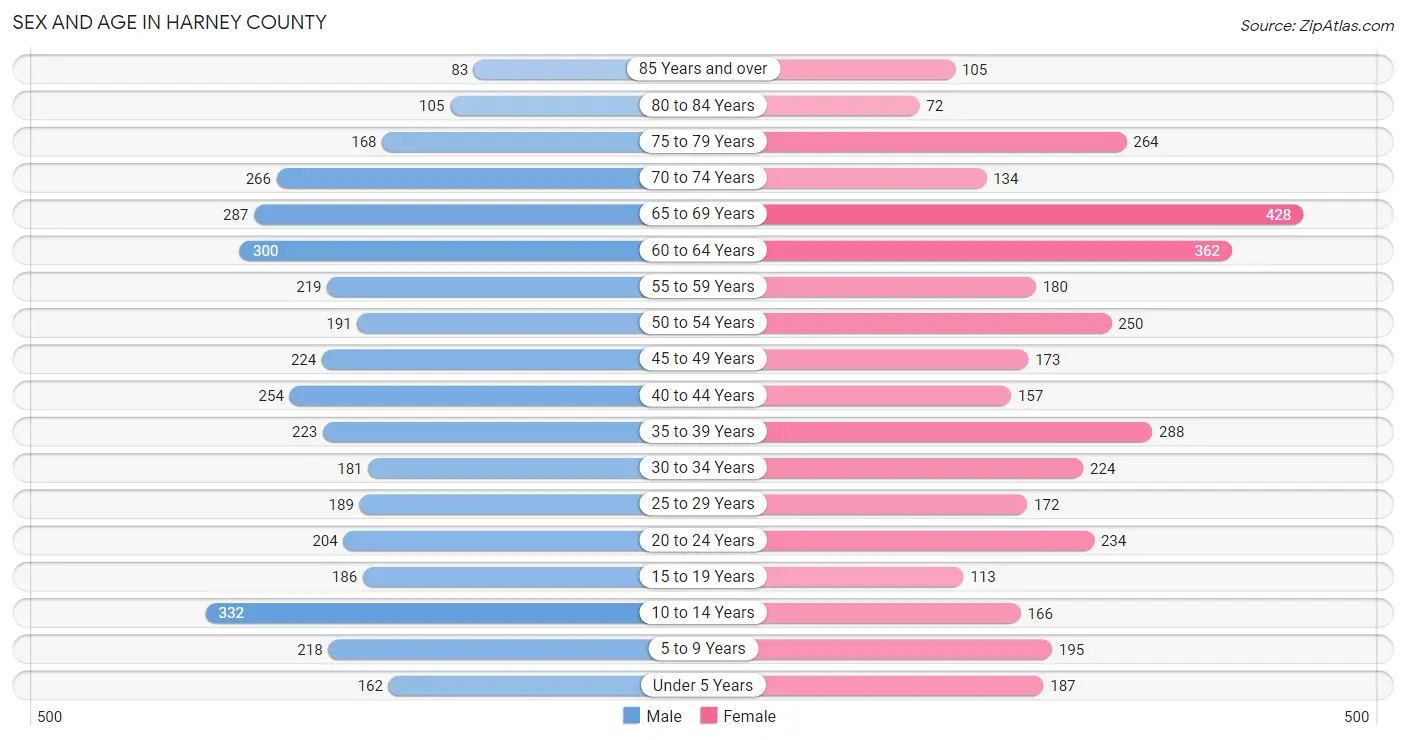
Sex and Age in Harney County
Sex and Age in Harney County
The most populous age groups in Harney County are 10 to 14 Years (332 | 8.8%) for men and 65 to 69 Years (428 | 11.6%) for women.
| Age Bracket | Male | Female |
| Under 5 Years | 162 (4.3%) | 187 (5.1%) |
| 5 to 9 Years | 218 (5.8%) | 195 (5.3%) |
| 10 to 14 Years | 332 (8.8%) | 166 (4.5%) |
| 15 to 19 Years | 186 (4.9%) | 113 (3.0%) |
| 20 to 24 Years | 204 (5.4%) | 234 (6.3%) |
| 25 to 29 Years | 189 (5.0%) | 172 (4.6%) |
| 30 to 34 Years | 181 (4.8%) | 224 (6.0%) |
| 35 to 39 Years | 223 (5.9%) | 288 (7.8%) |
| 40 to 44 Years | 254 (6.7%) | 157 (4.2%) |
| 45 to 49 Years | 224 (5.9%) | 173 (4.7%) |
| 50 to 54 Years | 191 (5.0%) | 250 (6.8%) |
| 55 to 59 Years | 219 (5.8%) | 180 (4.9%) |
| 60 to 64 Years | 300 (7.9%) | 362 (9.8%) |
| 65 to 69 Years | 287 (7.6%) | 428 (11.6%) |
| 70 to 74 Years | 266 (7.0%) | 134 (3.6%) |
| 75 to 79 Years | 168 (4.4%) | 264 (7.1%) |
| 80 to 84 Years | 105 (2.8%) | 72 (1.9%) |
| 85 Years and over | 83 (2.2%) | 105 (2.8%) |
| Total | 3,792 (100.0%) | 3,704 (100.0%) |
Families and Households in Harney County
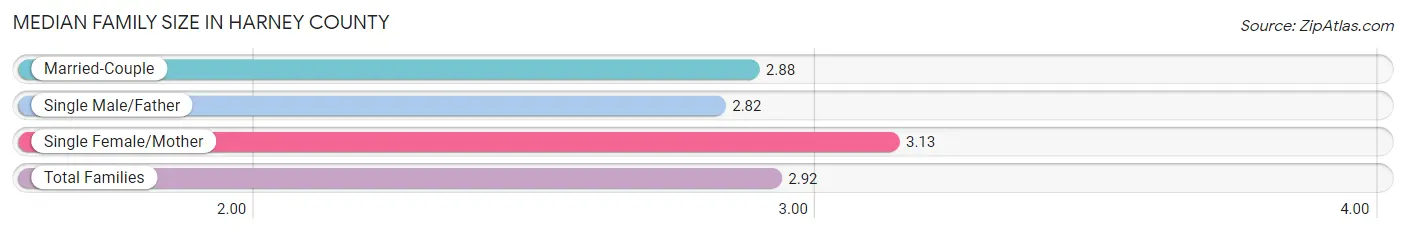
Median Family Size in Harney County
The median family size in Harney County is 2.92 persons per family, with single female/mother families (345 | 17.2%) accounting for the largest median family size of 3.13 persons per family. On the other hand, single male/father families (84 | 4.2%) represent the smallest median family size with 2.82 persons per family.
| Family Type | # Families | Family Size |
| Married-Couple | 1,578 (78.6%) | 2.88 |
| Single Male/Father | 84 (4.2%) | 2.82 |
| Single Female/Mother | 345 (17.2%) | 3.13 |
| Total Families | 2,007 (100.0%) | 2.92 |
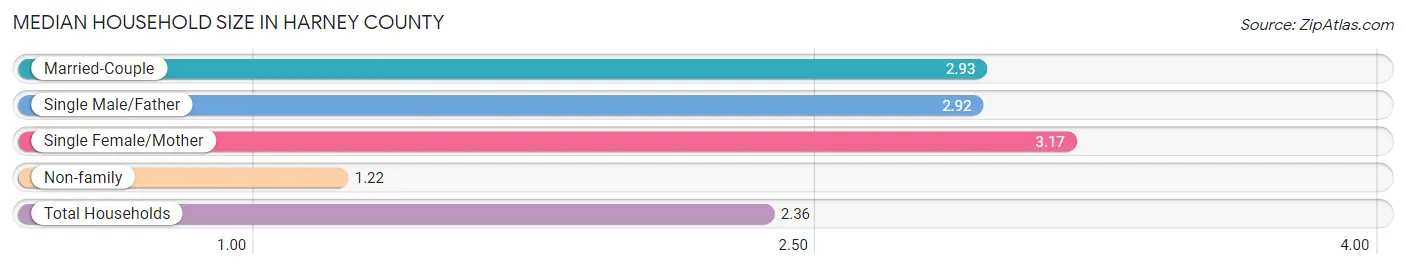
Median Household Size in Harney County
The median household size in Harney County is 2.36 persons per household, with single female/mother households (345 | 11.1%) accounting for the largest median household size of 3.17 persons per household. non-family households (1,095 | 35.3%) represent the smallest median household size with 1.22 persons per household.
| Household Type | # Households | Household Size |
| Married-Couple | 1,578 (50.9%) | 2.93 |
| Single Male/Father | 84 (2.7%) | 2.92 |
| Single Female/Mother | 345 (11.1%) | 3.17 |
| Non-family | 1,095 (35.3%) | 1.22 |
| Total Households | 3,102 (100.0%) | 2.36 |
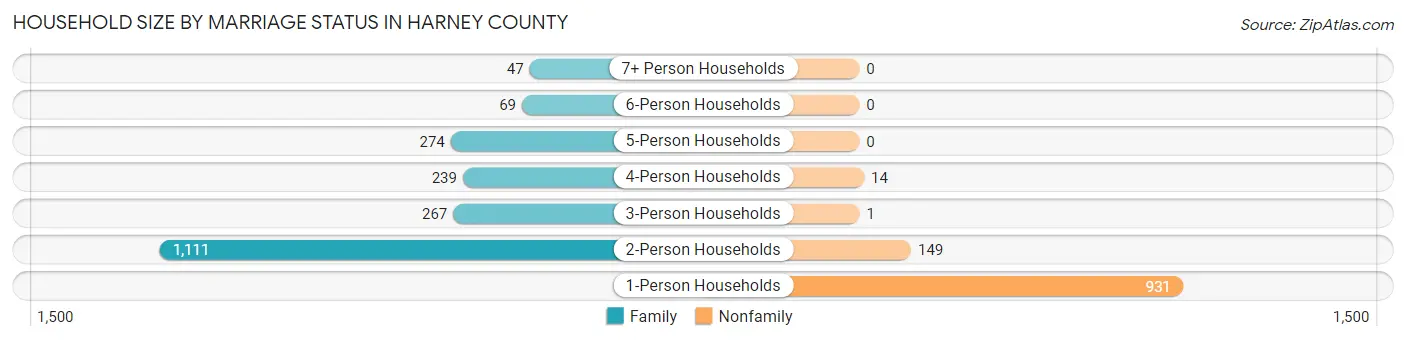
Household Size by Marriage Status in Harney County
Out of a total of 3,102 households in Harney County, 2,007 (64.7%) are family households, while 1,095 (35.3%) are nonfamily households. The most numerous type of family households are 2-person households, comprising 1,111, and the most common type of nonfamily households are 1-person households, comprising 931.
| Household Size | Family Households | Nonfamily Households |
| 1-Person Households | - | 931 (30.0%) |
| 2-Person Households | 1,111 (35.8%) | 149 (4.8%) |
| 3-Person Households | 267 (8.6%) | 1 (0.0%) |
| 4-Person Households | 239 (7.7%) | 14 (0.4%) |
| 5-Person Households | 274 (8.8%) | 0 (0.0%) |
| 6-Person Households | 69 (2.2%) | 0 (0.0%) |
| 7+ Person Households | 47 (1.5%) | 0 (0.0%) |
| Total | 2,007 (64.7%) | 1,095 (35.3%) |
Female Fertility in Harney County
Fertility by Age in Harney County
Average fertility rate in Harney County is 69.0 births per 1,000 women. Women in the age bracket of 20 to 34 years have the highest fertility rate with 92.0 births per 1,000 women. Women in the age bracket of 20 to 34 years acount for 57.4% of all women with births.
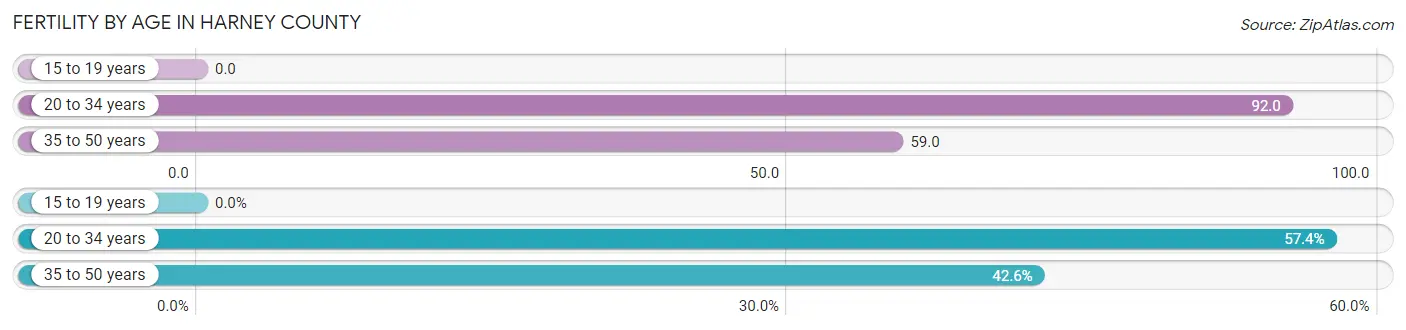
| Age Bracket | Women with Births | Births / 1,000 Women |
| 15 to 19 years | 0 (0.0%) | 0.0 |
| 20 to 34 years | 58 (57.4%) | 92.0 |
| 35 to 50 years | 43 (42.6%) | 59.0 |
| Total | 101 (100.0%) | 69.0 |
Fertility by Age by Marriage Status in Harney County
96.0% of women with births (101) in Harney County are married. The highest percentage of unmarried women with births falls into 20 to 34 years age bracket with 6.9% of them unmarried at the time of birth, while the lowest percentage of unmarried women with births belong to 35 to 50 years age bracket with 0.0% of them unmarried.
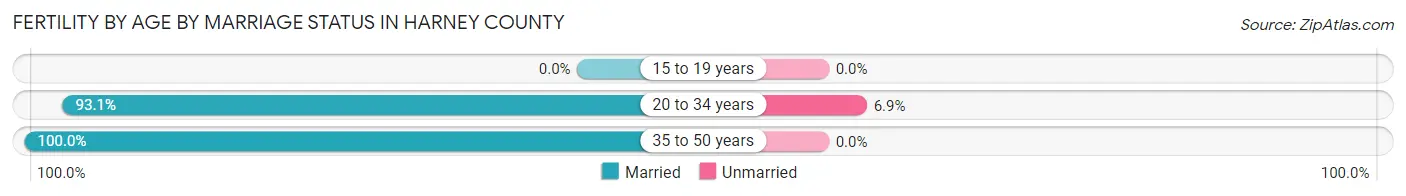
| Age Bracket | Married | Unmarried |
| 15 to 19 years | 0 (0.0%) | 0 (0.0%) |
| 20 to 34 years | 54 (93.1%) | 4 (6.9%) |
| 35 to 50 years | 43 (100.0%) | 0 (0.0%) |
| Total | 97 (96.0%) | 4 (4.0%) |
Fertility by Education in Harney County
Average fertility rate in Harney County is 69.0 births per 1,000 women. Women with the education attainment of graduate degree have the highest fertility rate of 111.0 births per 1,000 women, while women with the education attainment of high school diploma have the lowest fertility at 5.0 births per 1,000 women. Women with the education attainment of college or associate's degree represent 59.4% of all women with births.
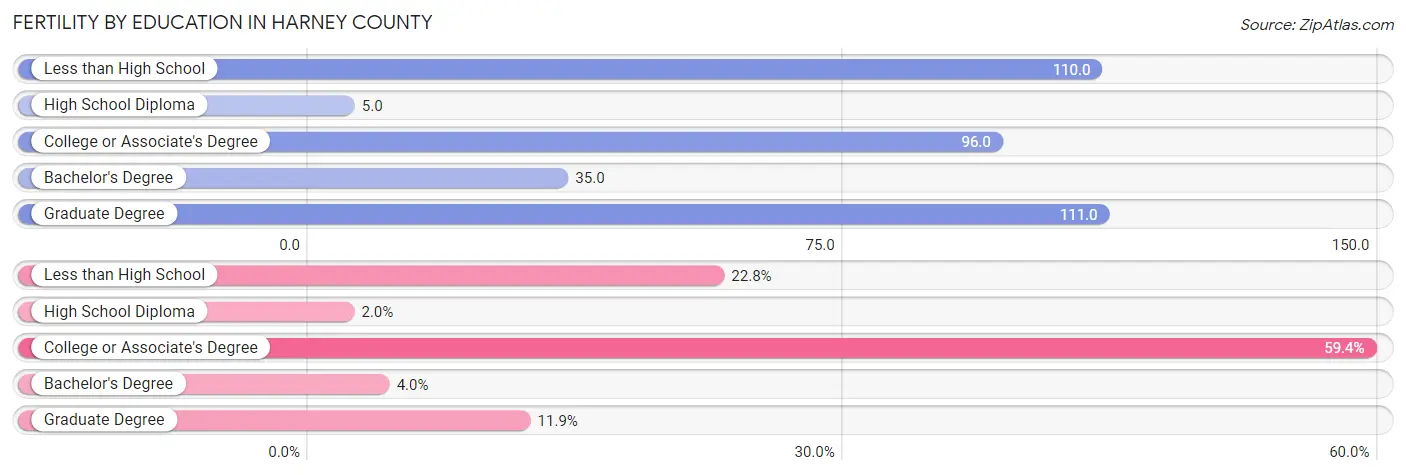
| Educational Attainment | Women with Births | Births / 1,000 Women |
| Less than High School | 23 (22.8%) | 110.0 |
| High School Diploma | 2 (2.0%) | 5.0 |
| College or Associate's Degree | 60 (59.4%) | 96.0 |
| Bachelor's Degree | 4 (4.0%) | 35.0 |
| Graduate Degree | 12 (11.9%) | 111.0 |
| Total | 101 (100.0%) | 69.0 |
Fertility by Education by Marriage Status in Harney County
4.0% of women with births in Harney County are unmarried. Women with the educational attainment of less than high school are most likely to be married with 100.0% of them married at childbirth, while women with the educational attainment of college or associate's degree are least likely to be married with 6.7% of them unmarried at childbirth.
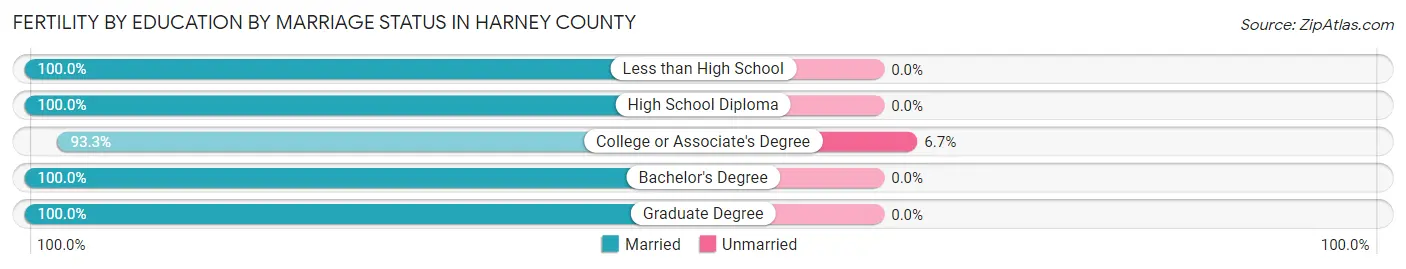
| Educational Attainment | Married | Unmarried |
| Less than High School | 23 (100.0%) | 0 (0.0%) |
| High School Diploma | 2 (100.0%) | 0 (0.0%) |
| College or Associate's Degree | 56 (93.3%) | 4 (6.7%) |
| Bachelor's Degree | 4 (100.0%) | 0 (0.0%) |
| Graduate Degree | 12 (100.0%) | 0 (0.0%) |
| Total | 97 (96.0%) | 4 (4.0%) |
Income in Harney County
Income Overview in Harney County
Per Capita Income in Harney County is $26,910, while median incomes of families and households are $57,875 and $45,462 respectively.
| Characteristic | Number | Measure |
| Per Capita Income | 7,496 | $26,910 |
| Median Family Income | 2,007 | $57,875 |
| Mean Family Income | 2,007 | $76,550 |
| Median Household Income | 3,102 | $45,462 |
| Mean Household Income | 3,102 | $63,828 |
| Income Deficit | 2,007 | $0 |
| Wage / Income Gap (%) | 7,496 | 12.36% |
| Wage / Income Gap ($) | 7,496 | 87.64¢ per $1 |
| Gini / Inequality Index | 7,496 | 0.43 |
Earnings by Sex in Harney County
Average Earnings in Harney County are $26,949, $28,775 for men and $25,217 for women, a difference of 12.4%.
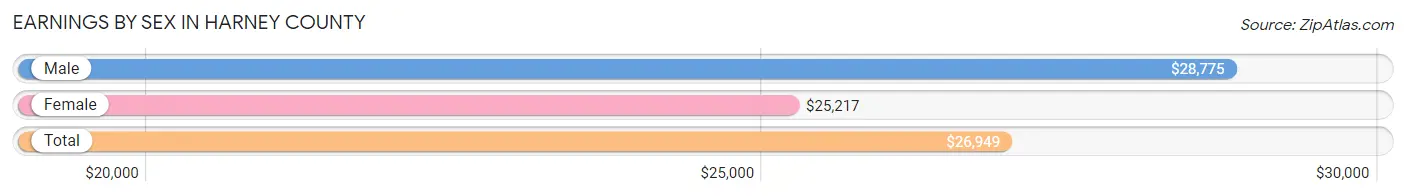
| Sex | Number | Average Earnings |
| Male | 1,871 (52.3%) | $28,775 |
| Female | 1,703 (47.6%) | $25,217 |
| Total | 3,574 (100.0%) | $26,949 |
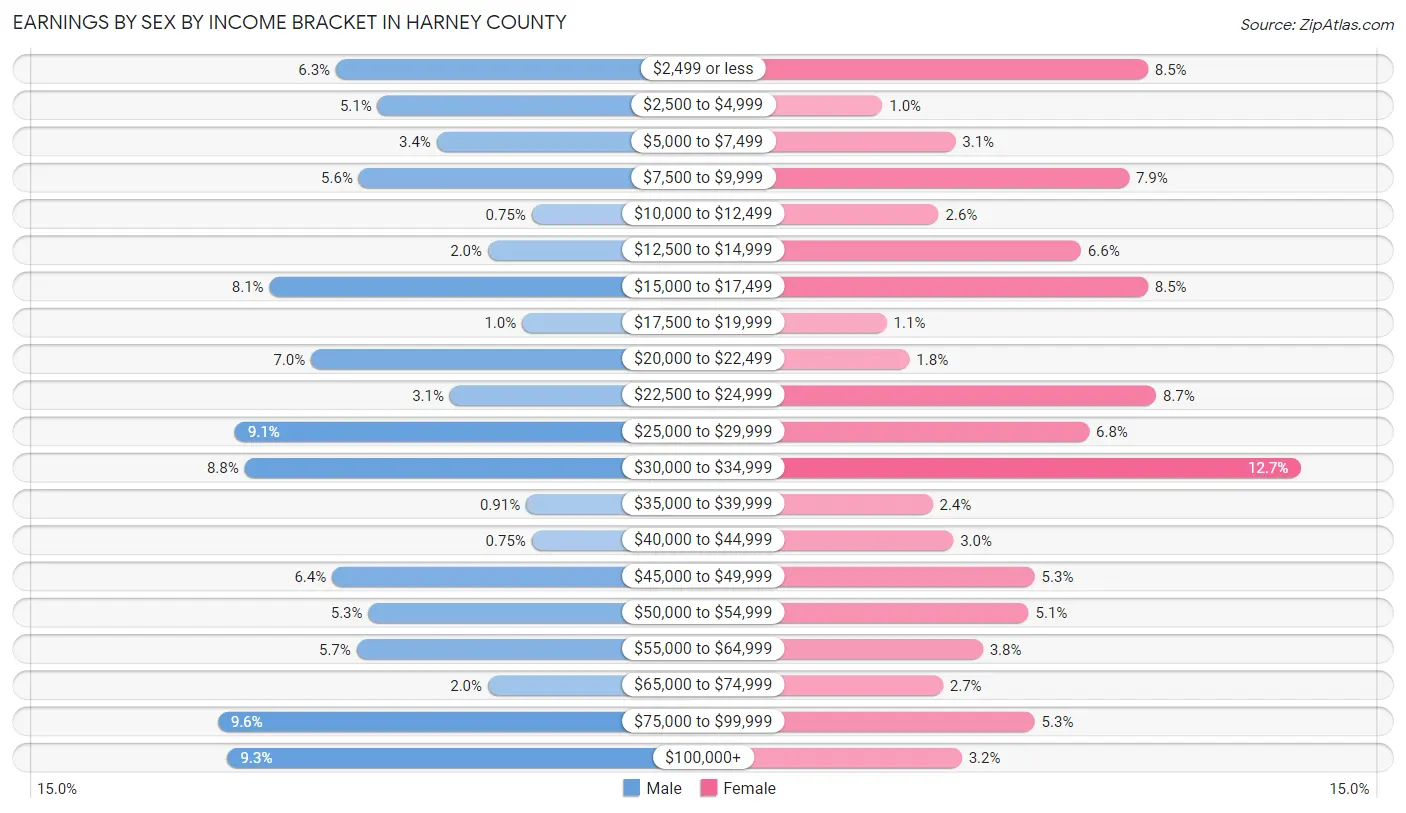
Earnings by Sex by Income Bracket in Harney County
The most common earnings brackets in Harney County are $75,000 to $99,999 for men (179 | 9.6%) and $30,000 to $34,999 for women (217 | 12.7%).
| Income | Male | Female |
| $2,499 or less | 117 (6.2%) | 144 (8.5%) |
| $2,500 to $4,999 | 95 (5.1%) | 17 (1.0%) |
| $5,000 to $7,499 | 64 (3.4%) | 52 (3.0%) |
| $7,500 to $9,999 | 105 (5.6%) | 135 (7.9%) |
| $10,000 to $12,499 | 14 (0.7%) | 44 (2.6%) |
| $12,500 to $14,999 | 37 (2.0%) | 112 (6.6%) |
| $15,000 to $17,499 | 152 (8.1%) | 144 (8.5%) |
| $17,500 to $19,999 | 19 (1.0%) | 19 (1.1%) |
| $20,000 to $22,499 | 130 (7.0%) | 30 (1.8%) |
| $22,500 to $24,999 | 57 (3.0%) | 148 (8.7%) |
| $25,000 to $29,999 | 170 (9.1%) | 116 (6.8%) |
| $30,000 to $34,999 | 165 (8.8%) | 217 (12.7%) |
| $35,000 to $39,999 | 17 (0.9%) | 41 (2.4%) |
| $40,000 to $44,999 | 14 (0.7%) | 51 (3.0%) |
| $45,000 to $49,999 | 119 (6.4%) | 90 (5.3%) |
| $50,000 to $54,999 | 100 (5.3%) | 87 (5.1%) |
| $55,000 to $64,999 | 106 (5.7%) | 65 (3.8%) |
| $65,000 to $74,999 | 37 (2.0%) | 46 (2.7%) |
| $75,000 to $99,999 | 179 (9.6%) | 90 (5.3%) |
| $100,000+ | 174 (9.3%) | 55 (3.2%) |
| Total | 1,871 (100.0%) | 1,703 (100.0%) |
Earnings by Sex by Educational Attainment in Harney County
Average earnings in Harney County are $32,868 for men and $29,464 for women, a difference of 10.4%. Men with an educational attainment of graduate degree enjoy the highest average annual earnings of $80,417, while those with high school diploma education earn the least with $27,060. Women with an educational attainment of graduate degree earn the most with the average annual earnings of $71,667, while those with high school diploma education have the smallest earnings of $23,611.
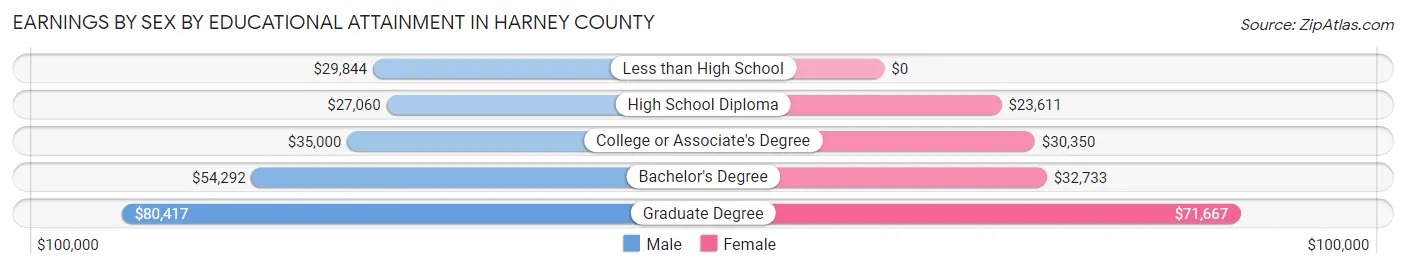
| Educational Attainment | Male Income | Female Income |
| Less than High School | $29,844 | $0 |
| High School Diploma | $27,060 | $23,611 |
| College or Associate's Degree | $35,000 | $30,350 |
| Bachelor's Degree | $54,292 | $32,733 |
| Graduate Degree | $80,417 | $71,667 |
| Total | $32,868 | $29,464 |
Family Income in Harney County
Family Income Brackets in Harney County
According to the Harney County family income data, there are 393 families falling into the $50,000 to $74,999 income range, which is the most common income bracket and makes up 19.6% of all families. Conversely, the $10,000 to $14,999 income bracket is the least frequent group with only 12 families (0.6%) belonging to this category.
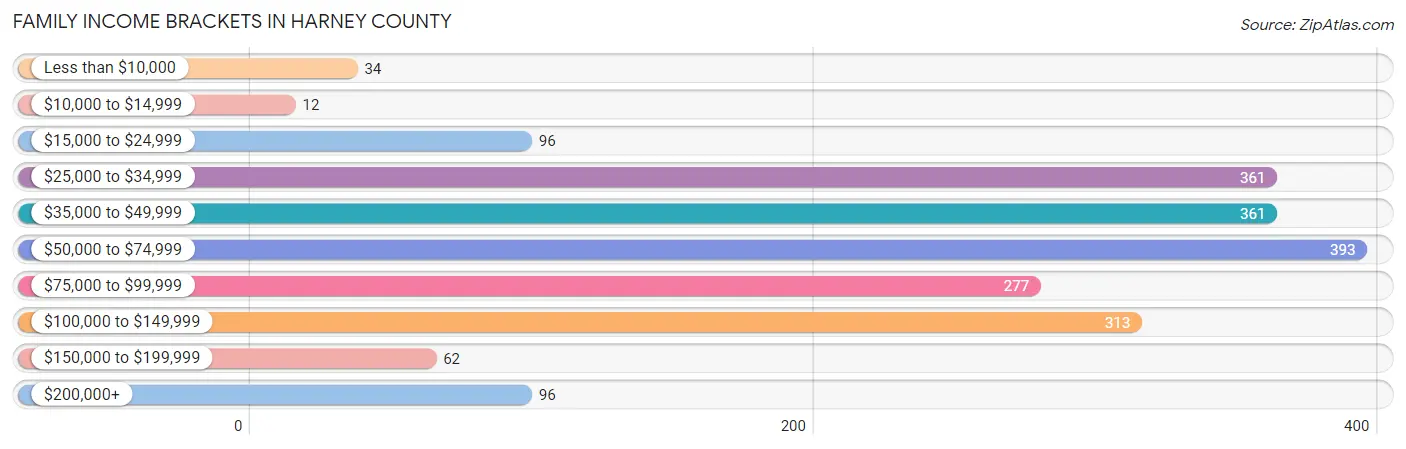
| Income Bracket | # Families | % Families |
| Less than $10,000 | 34 | 1.7% |
| $10,000 to $14,999 | 12 | 0.6% |
| $15,000 to $24,999 | 96 | 4.8% |
| $25,000 to $34,999 | 361 | 18.0% |
| $35,000 to $49,999 | 361 | 18.0% |
| $50,000 to $74,999 | 393 | 19.6% |
| $75,000 to $99,999 | 277 | 13.8% |
| $100,000 to $149,999 | 313 | 15.6% |
| $150,000 to $199,999 | 62 | 3.1% |
| $200,000+ | 96 | 4.8% |
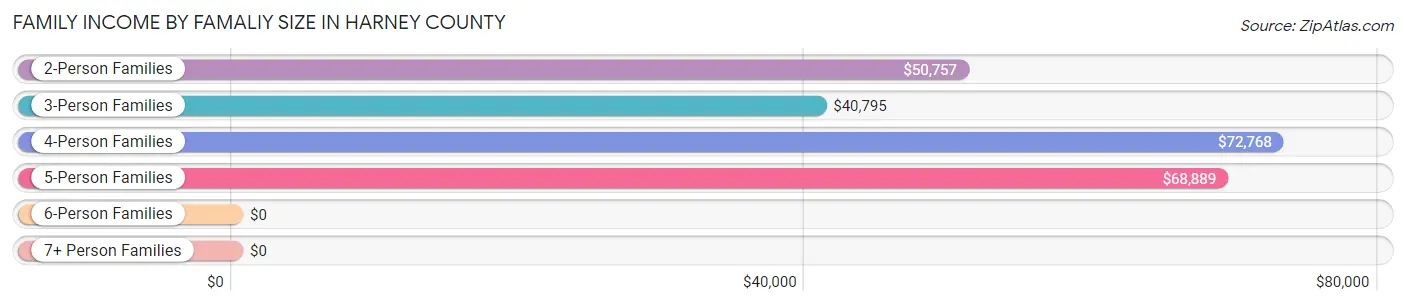
Family Income by Famaliy Size in Harney County
4-person families (283 | 14.1%) account for the highest median family income in Harney County with $72,768 per family, while 2-person families (1,119 | 55.7%) have the highest median income of $25,378 per family member.
| Income Bracket | # Families | Median Income |
| 2-Person Families | 1,119 (55.7%) | $50,757 |
| 3-Person Families | 263 (13.1%) | $40,795 |
| 4-Person Families | 283 (14.1%) | $72,768 |
| 5-Person Families | 226 (11.3%) | $68,889 |
| 6-Person Families | 114 (5.7%) | $0 |
| 7+ Person Families | 2 (0.1%) | $0 |
| Total | 2,007 (100.0%) | $57,875 |
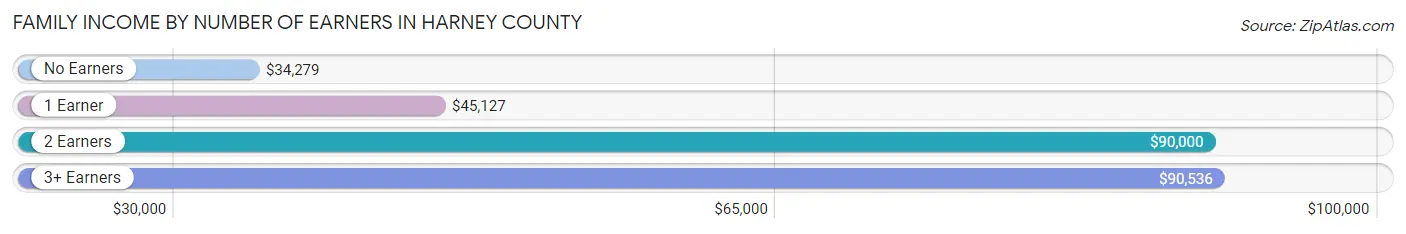
Family Income by Number of Earners in Harney County
The median family income in Harney County is $57,875, with families comprising 3+ earners (141) having the highest median family income of $90,536, while families with no earners (396) have the lowest median family income of $34,279, accounting for 7.0% and 19.7% of families, respectively.
| Number of Earners | # Families | Median Income |
| No Earners | 396 (19.7%) | $34,279 |
| 1 Earner | 662 (33.0%) | $45,127 |
| 2 Earners | 808 (40.3%) | $90,000 |
| 3+ Earners | 141 (7.0%) | $90,536 |
| Total | 2,007 (100.0%) | $57,875 |
Household Income in Harney County
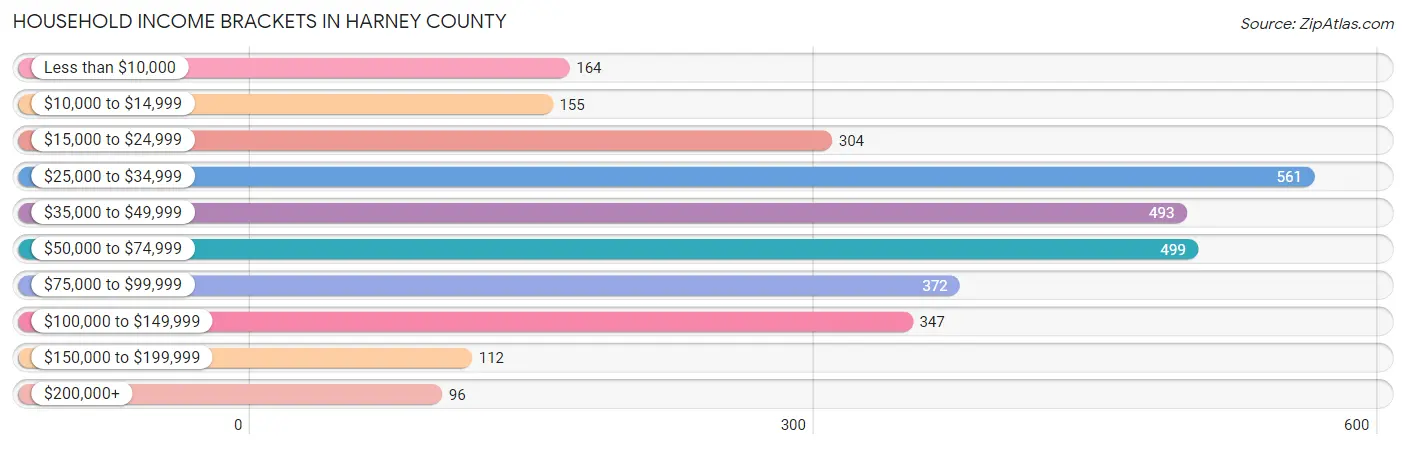
Household Income Brackets in Harney County
With 561 households falling in the category, the $25,000 to $34,999 income range is the most frequent in Harney County, accounting for 18.1% of all households. In contrast, only 96 households (3.1%) fall into the $200,000+ income bracket, making it the least populous group.
| Income Bracket | # Households | % Households |
| Less than $10,000 | 164 | 5.3% |
| $10,000 to $14,999 | 155 | 5.0% |
| $15,000 to $24,999 | 304 | 9.8% |
| $25,000 to $34,999 | 561 | 18.1% |
| $35,000 to $49,999 | 493 | 15.9% |
| $50,000 to $74,999 | 499 | 16.1% |
| $75,000 to $99,999 | 372 | 12.0% |
| $100,000 to $149,999 | 347 | 11.2% |
| $150,000 to $199,999 | 112 | 3.6% |
| $200,000+ | 96 | 3.1% |
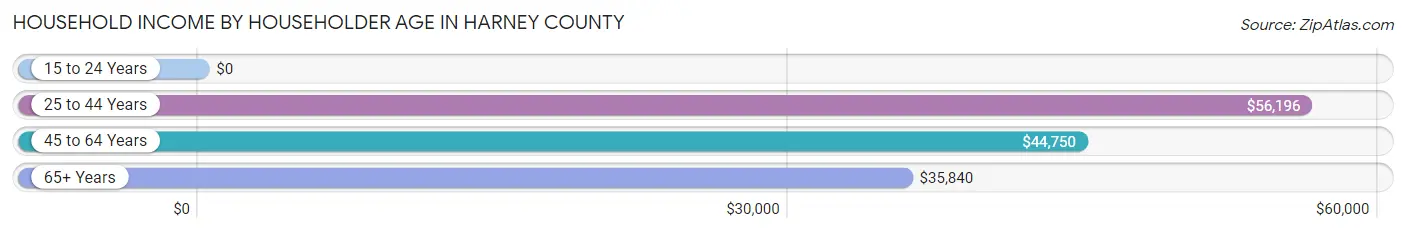
Household Income by Householder Age in Harney County
The median household income in Harney County is $45,462, with the highest median household income of $56,196 found in the 25 to 44 years age bracket for the primary householder. A total of 922 households (29.7%) fall into this category. Meanwhile, the 15 to 24 years age bracket for the primary householder has the lowest median household income of $0, with 7 households (0.2%) in this group.
| Income Bracket | # Households | Median Income |
| 15 to 24 Years | 7 (0.2%) | $0 |
| 25 to 44 Years | 922 (29.7%) | $56,196 |
| 45 to 64 Years | 1,016 (32.8%) | $44,750 |
| 65+ Years | 1,157 (37.3%) | $35,840 |
| Total | 3,102 (100.0%) | $45,462 |
Poverty in Harney County
Income Below Poverty by Sex and Age in Harney County
With 14.4% poverty level for males and 9.9% for females among the residents of Harney County, 5 year old males and 12 to 14 year old females are the most vulnerable to poverty, with 2 males (100.0%) and 21 females (24.4%) in their respective age groups living below the poverty level.
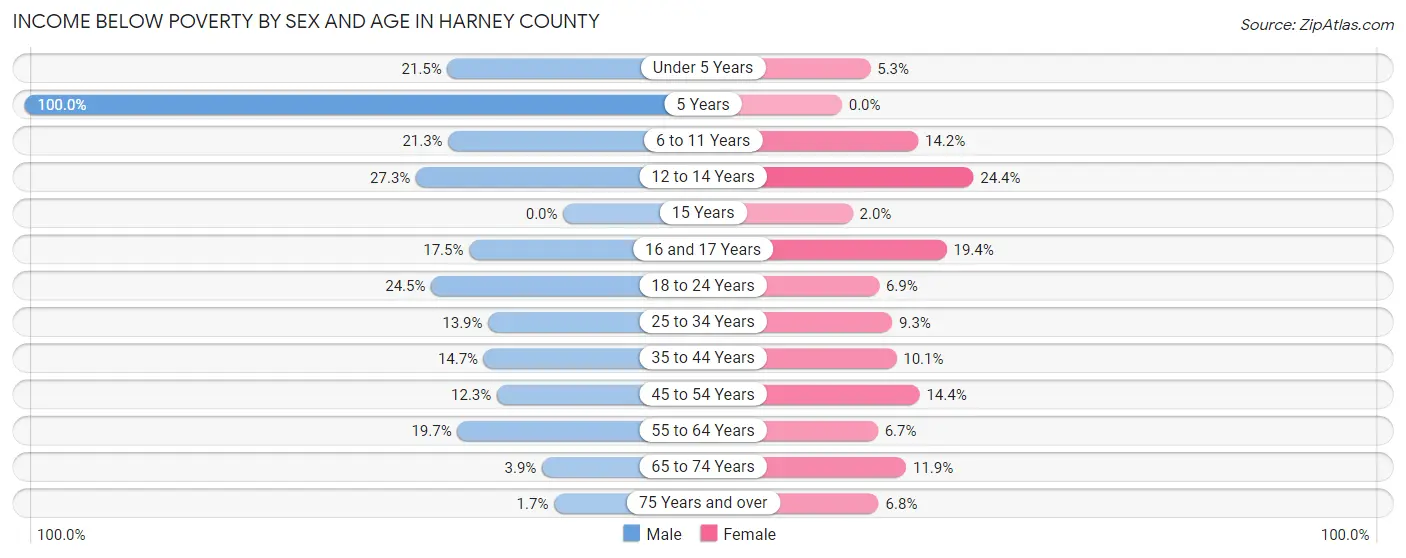
| Age Bracket | Male | Female |
| Under 5 Years | 29 (21.5%) | 9 (5.3%) |
| 5 Years | 2 (100.0%) | 0 (0.0%) |
| 6 to 11 Years | 74 (21.3%) | 31 (14.2%) |
| 12 to 14 Years | 50 (27.3%) | 21 (24.4%) |
| 15 Years | 0 (0.0%) | 1 (2.0%) |
| 16 and 17 Years | 11 (17.5%) | 7 (19.4%) |
| 18 to 24 Years | 63 (24.5%) | 18 (6.9%) |
| 25 to 34 Years | 49 (13.9%) | 37 (9.3%) |
| 35 to 44 Years | 70 (14.7%) | 45 (10.1%) |
| 45 to 54 Years | 51 (12.3%) | 61 (14.4%) |
| 55 to 64 Years | 102 (19.7%) | 36 (6.7%) |
| 65 to 74 Years | 21 (3.9%) | 67 (11.9%) |
| 75 Years and over | 6 (1.7%) | 29 (6.8%) |
| Total | 528 (14.4%) | 362 (9.9%) |
Income Above Poverty by Sex and Age in Harney County
According to the poverty statistics in Harney County, males aged 15 years and females aged 5 years are the age groups that are most secure financially, with 100.0% of males and 100.0% of females in these age groups living above the poverty line.
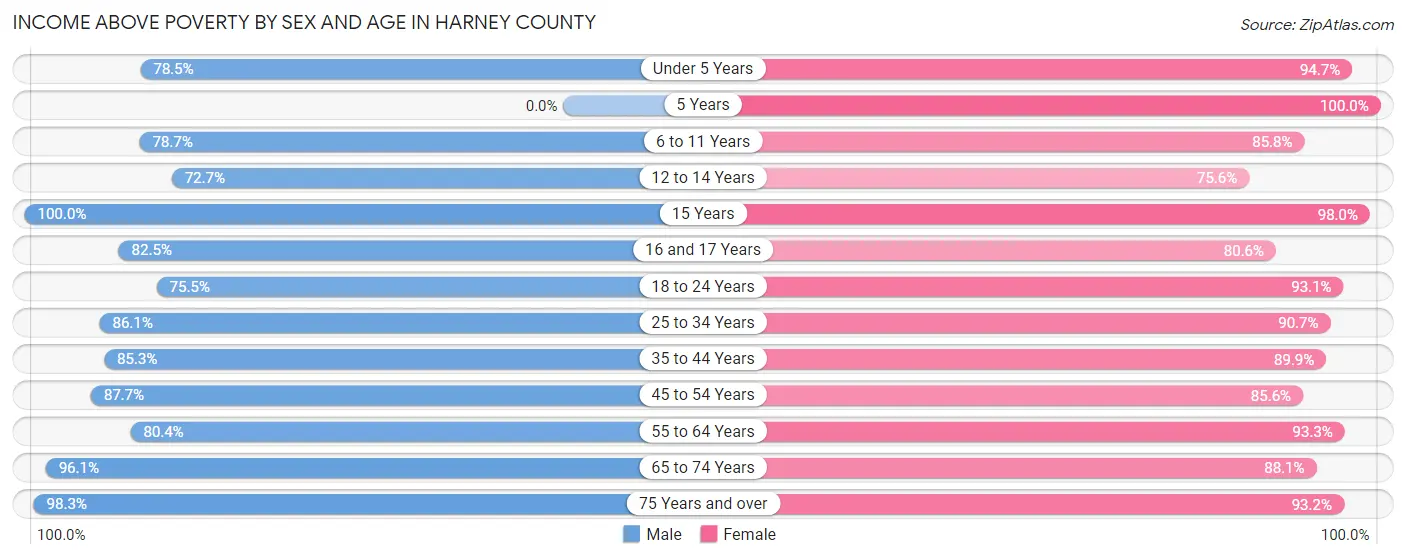
| Age Bracket | Male | Female |
| Under 5 Years | 106 (78.5%) | 161 (94.7%) |
| 5 Years | 0 (0.0%) | 54 (100.0%) |
| 6 to 11 Years | 273 (78.7%) | 188 (85.8%) |
| 12 to 14 Years | 133 (72.7%) | 65 (75.6%) |
| 15 Years | 32 (100.0%) | 49 (98.0%) |
| 16 and 17 Years | 52 (82.5%) | 29 (80.6%) |
| 18 to 24 Years | 194 (75.5%) | 243 (93.1%) |
| 25 to 34 Years | 303 (86.1%) | 359 (90.7%) |
| 35 to 44 Years | 405 (85.3%) | 400 (89.9%) |
| 45 to 54 Years | 364 (87.7%) | 362 (85.6%) |
| 55 to 64 Years | 417 (80.3%) | 504 (93.3%) |
| 65 to 74 Years | 514 (96.1%) | 495 (88.1%) |
| 75 Years and over | 350 (98.3%) | 395 (93.2%) |
| Total | 3,143 (85.6%) | 3,304 (90.1%) |
Income Below Poverty Among Married-Couple Families in Harney County
The poverty statistics for married-couple families in Harney County show that 3.2% or 50 of the total 1,578 families live below the poverty line. Families with 1 or 2 children have the highest poverty rate of 7.0%, comprising of 23 families. On the other hand, families with no children have the lowest poverty rate of 1.1%, which includes 11 families.
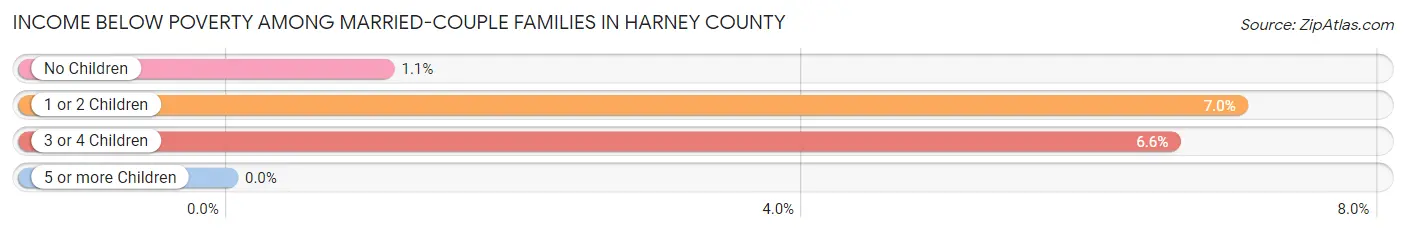
| Children | Above Poverty | Below Poverty |
| No Children | 996 (98.9%) | 11 (1.1%) |
| 1 or 2 Children | 304 (93.0%) | 23 (7.0%) |
| 3 or 4 Children | 228 (93.4%) | 16 (6.6%) |
| 5 or more Children | 0 (0.0%) | 0 (0.0%) |
| Total | 1,528 (96.8%) | 50 (3.2%) |
Income Below Poverty Among Single-Parent Households in Harney County
According to the poverty data in Harney County, 4.8% or 4 single-father households and 8.4% or 29 single-mother households are living below the poverty line. Among single-father households, those with 1 or 2 children have the highest poverty rate, with 4 households (8.7%) experiencing poverty. Likewise, among single-mother households, those with 5 or more children have the highest poverty rate, with 3 households (60.0%) falling below the poverty line.
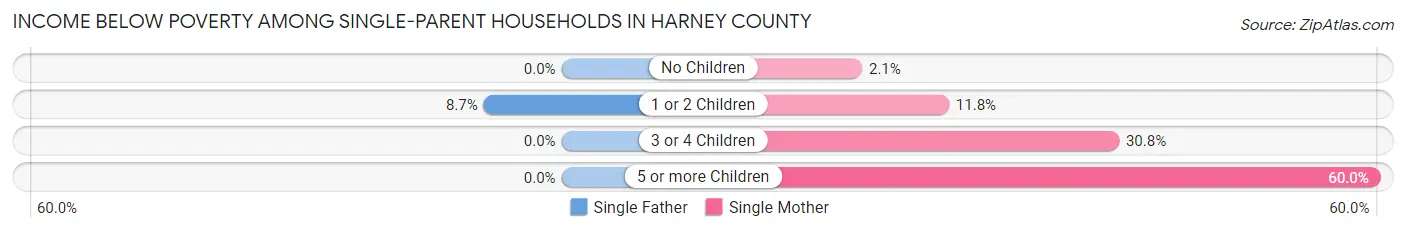
| Children | Single Father | Single Mother |
| No Children | 0 (0.0%) | 4 (2.1%) |
| 1 or 2 Children | 4 (8.7%) | 14 (11.8%) |
| 3 or 4 Children | 0 (0.0%) | 8 (30.8%) |
| 5 or more Children | 0 (0.0%) | 3 (60.0%) |
| Total | 4 (4.8%) | 29 (8.4%) |
Income Below Poverty Among Married-Couple vs Single-Parent Households in Harney County
The poverty data for Harney County shows that 50 of the married-couple family households (3.2%) and 33 of the single-parent households (7.7%) are living below the poverty level. Within the married-couple family households, those with 1 or 2 children have the highest poverty rate, with 23 households (7.0%) falling below the poverty line. Among the single-parent households, those with 5 or more children have the highest poverty rate, with 3 household (60.0%) living below poverty.
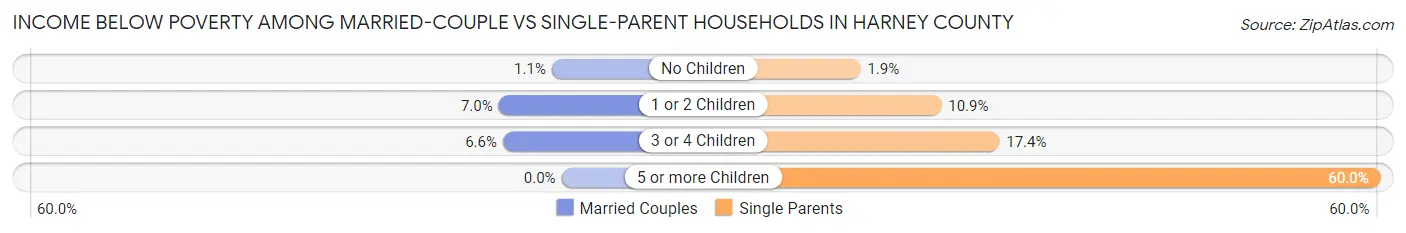
| Children | Married-Couple Families | Single-Parent Households |
| No Children | 11 (1.1%) | 4 (1.9%) |
| 1 or 2 Children | 23 (7.0%) | 18 (10.9%) |
| 3 or 4 Children | 16 (6.6%) | 8 (17.4%) |
| 5 or more Children | 0 (0.0%) | 3 (60.0%) |
| Total | 50 (3.2%) | 33 (7.7%) |
Employment Characteristics in Harney County
Employment by Class of Employer in Harney County
Among the 3,124 employed individuals in Harney County, private company employees (1,627 | 52.1%), self-employed (not incorporated) (452 | 14.5%), and state government employees (301 | 9.6%) make up the most common classes of employment.
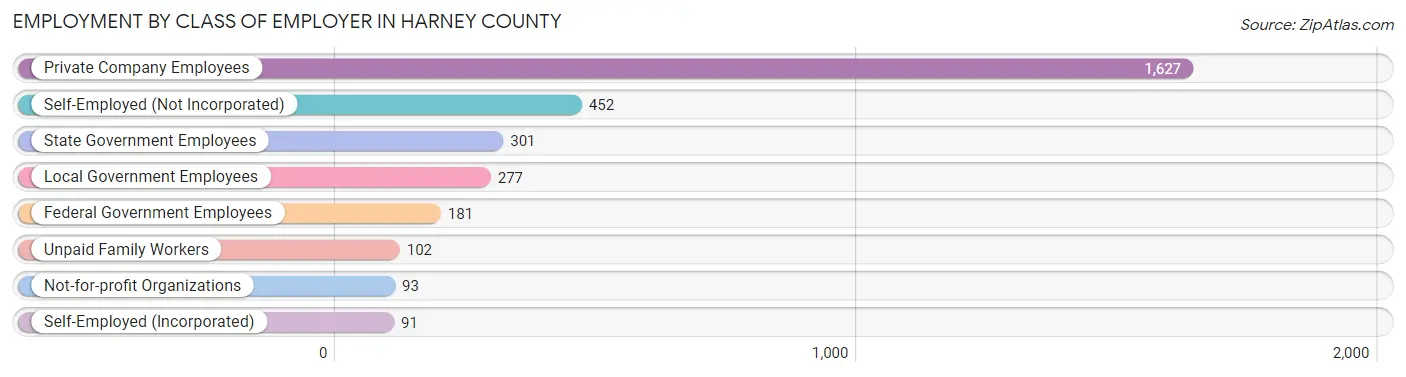
| Employer Class | # Employees | % Employees |
| Private Company Employees | 1,627 | 52.1% |
| Self-Employed (Incorporated) | 91 | 2.9% |
| Self-Employed (Not Incorporated) | 452 | 14.5% |
| Not-for-profit Organizations | 93 | 3.0% |
| Local Government Employees | 277 | 8.9% |
| State Government Employees | 301 | 9.6% |
| Federal Government Employees | 181 | 5.8% |
| Unpaid Family Workers | 102 | 3.3% |
| Total | 3,124 | 100.0% |
Employment Status by Age in Harney County
According to the labor force statistics for Harney County, out of the total population over 16 years of age (6,154), 54.0% or 3,323 individuals are in the labor force, with 5.4% or 179 of them unemployed. The age group with the highest labor force participation rate is 30 to 34 years, with 92.6% or 375 individuals in the labor force. Within the labor force, the 16 to 19 years age range has the highest percentage of unemployed individuals, with 22.4% or 13 of them being unemployed.
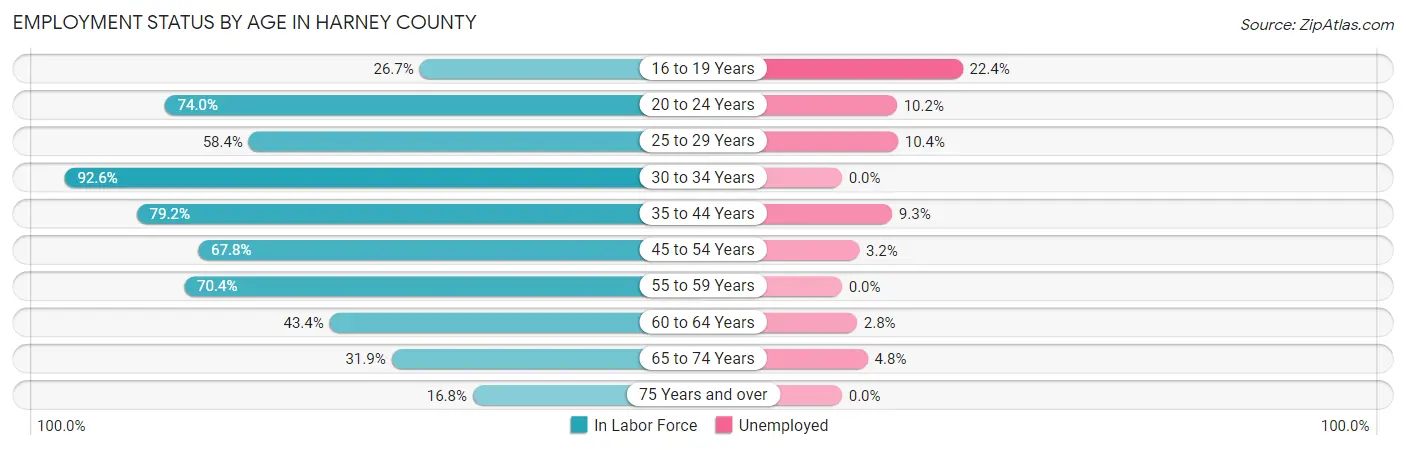
| Age Bracket | In Labor Force | Unemployed |
| 16 to 19 Years | 58 (26.7%) | 13 (22.4%) |
| 20 to 24 Years | 324 (74.0%) | 33 (10.2%) |
| 25 to 29 Years | 211 (58.4%) | 22 (10.4%) |
| 30 to 34 Years | 375 (92.6%) | 0 (0.0%) |
| 35 to 44 Years | 730 (79.2%) | 68 (9.3%) |
| 45 to 54 Years | 568 (67.8%) | 18 (3.2%) |
| 55 to 59 Years | 281 (70.4%) | 0 (0.0%) |
| 60 to 64 Years | 287 (43.4%) | 8 (2.8%) |
| 65 to 74 Years | 356 (31.9%) | 17 (4.8%) |
| 75 Years and over | 134 (16.8%) | 0 (0.0%) |
| Total | 3,323 (54.0%) | 179 (5.4%) |
Employment Status by Educational Attainment in Harney County
According to labor force statistics for Harney County, 68.4% of individuals (2,454) out of the total population between 25 and 64 years of age (3,587) are in the labor force, with 4.7% or 115 of them being unemployed. The group with the highest labor force participation rate are those with the educational attainment of bachelor's degree or higher, with 81.4% or 390 individuals in the labor force. Within the labor force, individuals with less than high school education have the highest percentage of unemployment, with 22.7% or 27 of them being unemployed.
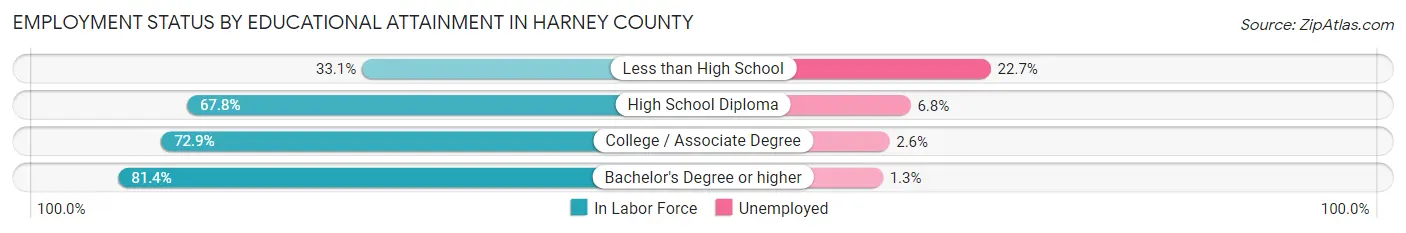
| Educational Attainment | In Labor Force | Unemployed |
| Less than High School | 119 (33.1%) | 81 (22.7%) |
| High School Diploma | 808 (67.8%) | 81 (6.8%) |
| College / Associate Degree | 1,135 (72.9%) | 40 (2.6%) |
| Bachelor's Degree or higher | 390 (81.4%) | 6 (1.3%) |
| Total | 2,454 (68.4%) | 169 (4.7%) |
Employment Occupations by Sex in Harney County
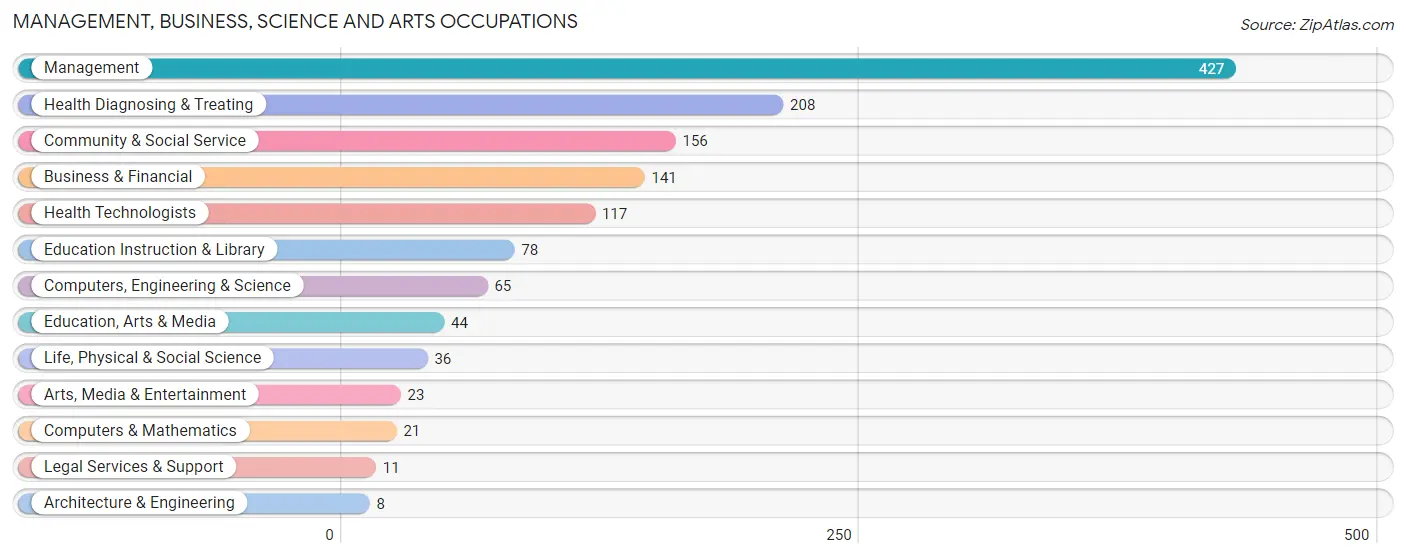
Management, Business, Science and Arts Occupations
The most common Management, Business, Science and Arts occupations in Harney County are Management (427 | 13.6%), Health Diagnosing & Treating (208 | 6.6%), Community & Social Service (156 | 5.0%), Business & Financial (141 | 4.5%), and Health Technologists (117 | 3.7%).
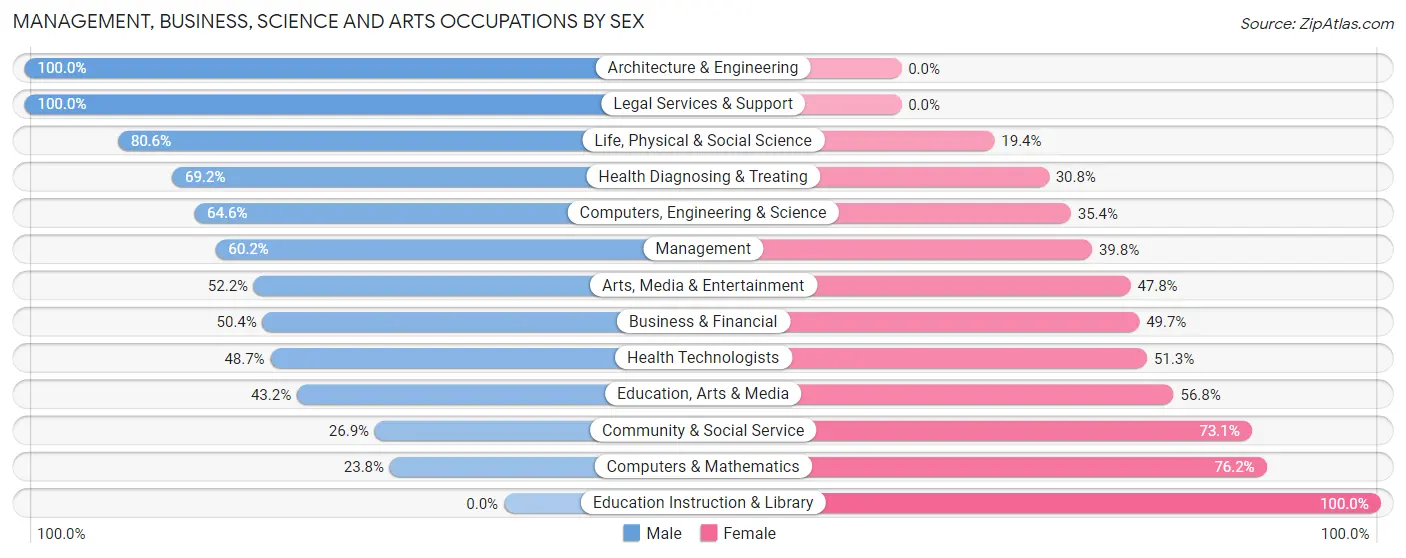
Management, Business, Science and Arts Occupations by Sex
Within the Management, Business, Science and Arts occupations in Harney County, the most male-oriented occupations are Architecture & Engineering (100.0%), Legal Services & Support (100.0%), and Life, Physical & Social Science (80.6%), while the most female-oriented occupations are Education Instruction & Library (100.0%), Computers & Mathematics (76.2%), and Community & Social Service (73.1%).
| Occupation | Male | Female |
| Management | 257 (60.2%) | 170 (39.8%) |
| Business & Financial | 71 (50.3%) | 70 (49.6%) |
| Computers, Engineering & Science | 42 (64.6%) | 23 (35.4%) |
| Computers & Mathematics | 5 (23.8%) | 16 (76.2%) |
| Architecture & Engineering | 8 (100.0%) | 0 (0.0%) |
| Life, Physical & Social Science | 29 (80.6%) | 7 (19.4%) |
| Community & Social Service | 42 (26.9%) | 114 (73.1%) |
| Education, Arts & Media | 19 (43.2%) | 25 (56.8%) |
| Legal Services & Support | 11 (100.0%) | 0 (0.0%) |
| Education Instruction & Library | 0 (0.0%) | 78 (100.0%) |
| Arts, Media & Entertainment | 12 (52.2%) | 11 (47.8%) |
| Health Diagnosing & Treating | 144 (69.2%) | 64 (30.8%) |
| Health Technologists | 57 (48.7%) | 60 (51.3%) |
| Total (Category) | 556 (55.8%) | 441 (44.2%) |
| Total (Overall) | 1,669 (53.1%) | 1,476 (46.9%) |
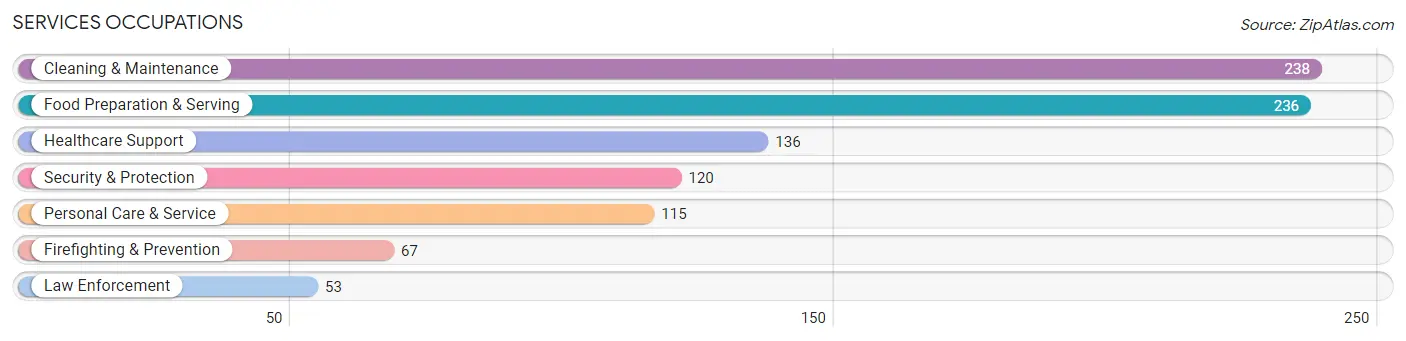
Services Occupations
The most common Services occupations in Harney County are Cleaning & Maintenance (238 | 7.6%), Food Preparation & Serving (236 | 7.5%), Healthcare Support (136 | 4.3%), Security & Protection (120 | 3.8%), and Personal Care & Service (115 | 3.7%).
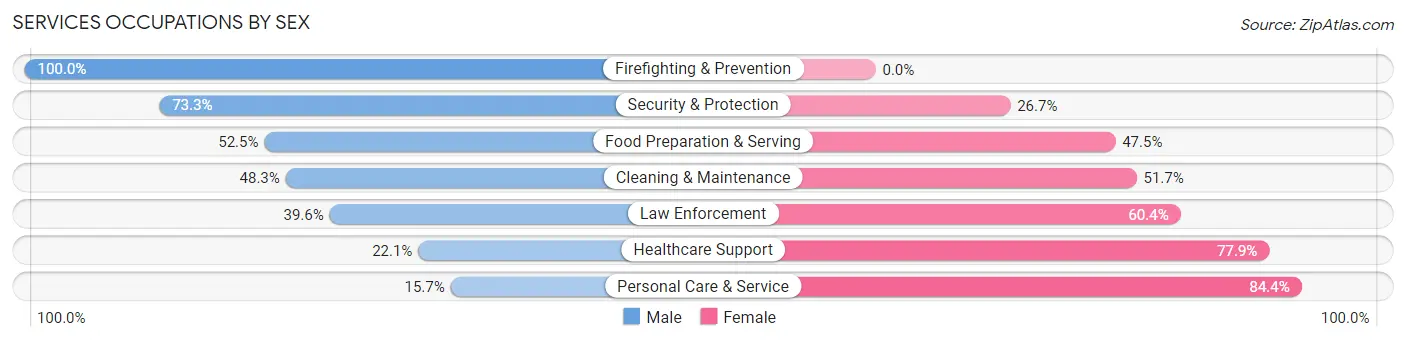
Services Occupations by Sex
Within the Services occupations in Harney County, the most male-oriented occupations are Firefighting & Prevention (100.0%), Security & Protection (73.3%), and Food Preparation & Serving (52.5%), while the most female-oriented occupations are Personal Care & Service (84.4%), Healthcare Support (77.9%), and Law Enforcement (60.4%).
| Occupation | Male | Female |
| Healthcare Support | 30 (22.1%) | 106 (77.9%) |
| Security & Protection | 88 (73.3%) | 32 (26.7%) |
| Firefighting & Prevention | 67 (100.0%) | 0 (0.0%) |
| Law Enforcement | 21 (39.6%) | 32 (60.4%) |
| Food Preparation & Serving | 124 (52.5%) | 112 (47.5%) |
| Cleaning & Maintenance | 115 (48.3%) | 123 (51.7%) |
| Personal Care & Service | 18 (15.7%) | 97 (84.4%) |
| Total (Category) | 375 (44.4%) | 470 (55.6%) |
| Total (Overall) | 1,669 (53.1%) | 1,476 (46.9%) |
Sales and Office Occupations
The most common Sales and Office occupations in Harney County are Office & Administration (389 | 12.4%), and Sales & Related (101 | 3.2%).
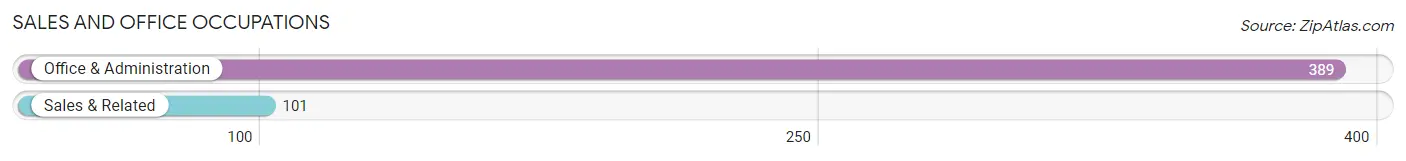
Sales and Office Occupations by Sex
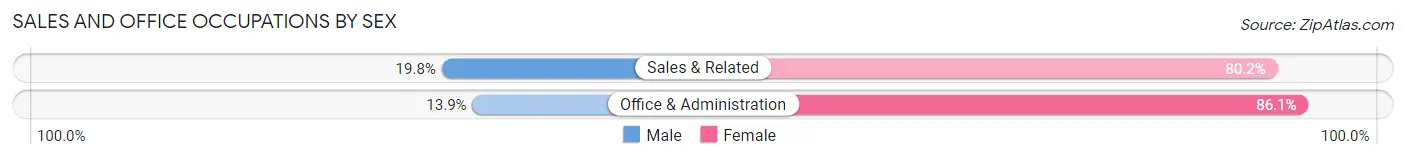
| Occupation | Male | Female |
| Sales & Related | 20 (19.8%) | 81 (80.2%) |
| Office & Administration | 54 (13.9%) | 335 (86.1%) |
| Total (Category) | 74 (15.1%) | 416 (84.9%) |
| Total (Overall) | 1,669 (53.1%) | 1,476 (46.9%) |
Natural Resources, Construction and Maintenance Occupations
The most common Natural Resources, Construction and Maintenance occupations in Harney County are Farming, Fishing & Forestry (176 | 5.6%), Construction & Extraction (132 | 4.2%), and Installation, Maintenance & Repair (33 | 1.1%).
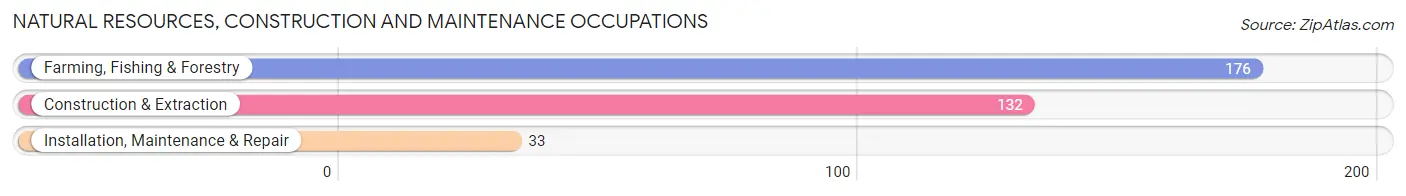
Natural Resources, Construction and Maintenance Occupations by Sex
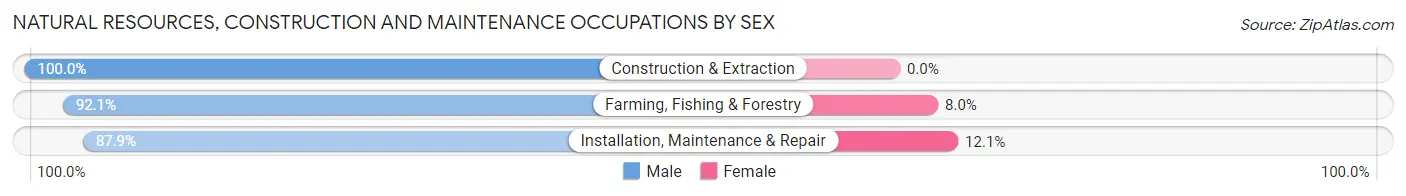
| Occupation | Male | Female |
| Farming, Fishing & Forestry | 162 (92.0%) | 14 (8.0%) |
| Construction & Extraction | 132 (100.0%) | 0 (0.0%) |
| Installation, Maintenance & Repair | 29 (87.9%) | 4 (12.1%) |
| Total (Category) | 323 (94.7%) | 18 (5.3%) |
| Total (Overall) | 1,669 (53.1%) | 1,476 (46.9%) |
Production, Transportation and Moving Occupations
The most common Production, Transportation and Moving occupations in Harney County are Transportation (230 | 7.3%), Production (154 | 4.9%), and Material Moving (88 | 2.8%).
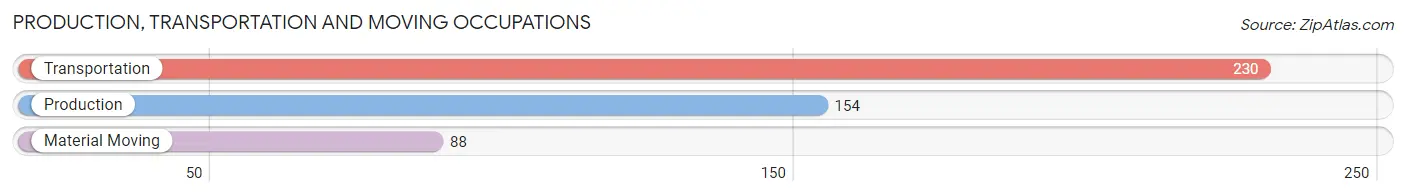
Production, Transportation and Moving Occupations by Sex
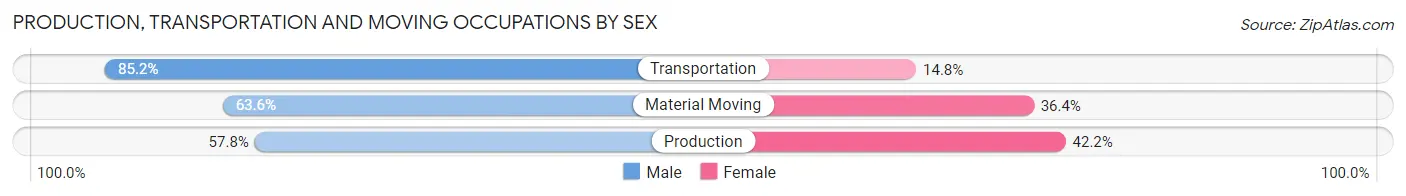
| Occupation | Male | Female |
| Production | 89 (57.8%) | 65 (42.2%) |
| Transportation | 196 (85.2%) | 34 (14.8%) |
| Material Moving | 56 (63.6%) | 32 (36.4%) |
| Total (Category) | 341 (72.3%) | 131 (27.8%) |
| Total (Overall) | 1,669 (53.1%) | 1,476 (46.9%) |
Employment Industries by Sex in Harney County
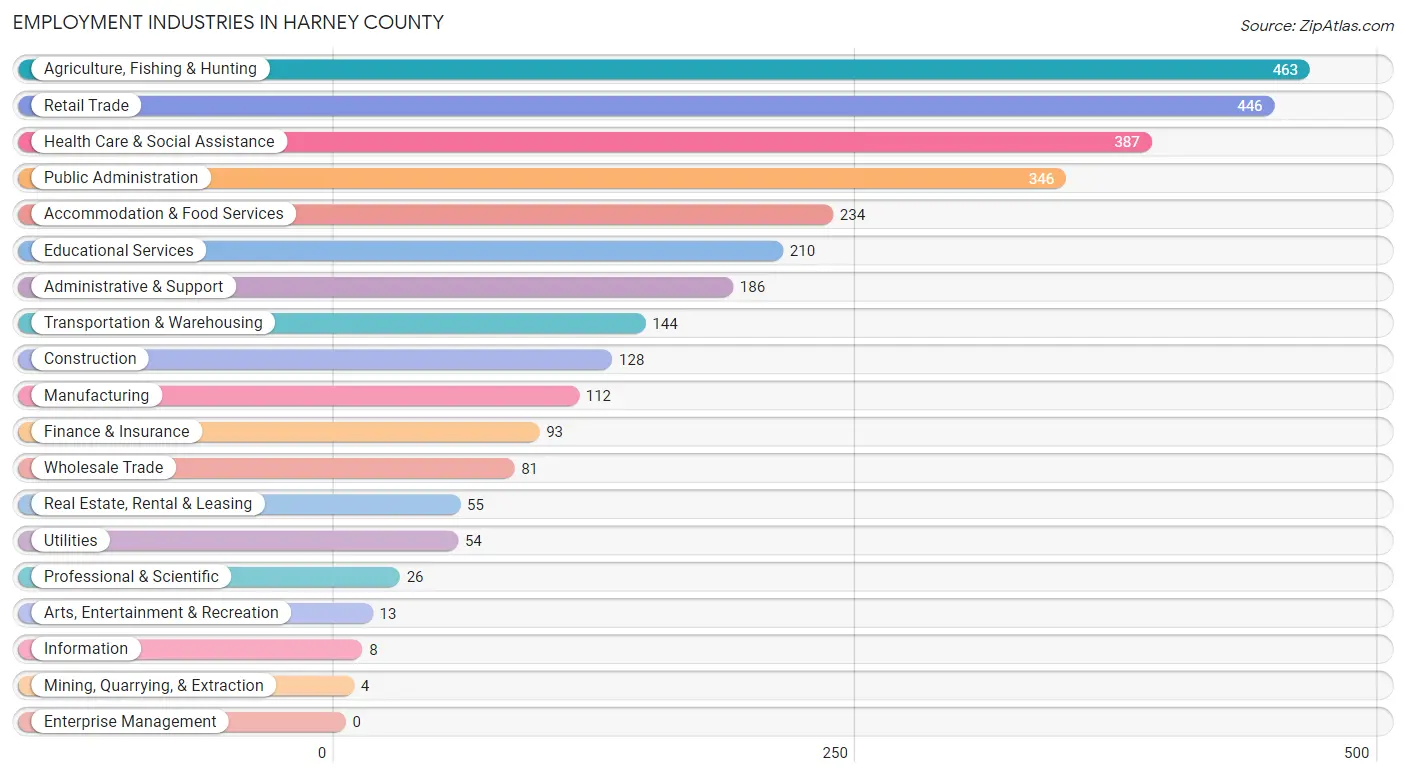
Employment Industries in Harney County
The major employment industries in Harney County include Agriculture, Fishing & Hunting (463 | 14.7%), Retail Trade (446 | 14.2%), Health Care & Social Assistance (387 | 12.3%), Public Administration (346 | 11.0%), and Accommodation & Food Services (234 | 7.4%).
Employment Industries by Sex in Harney County
The Harney County industries that see more men than women are Mining, Quarrying, & Extraction (100.0%), Information (100.0%), and Construction (99.2%), whereas the industries that tend to have a higher number of women are Real Estate, Rental & Leasing (100.0%), Finance & Insurance (81.7%), and Educational Services (80.9%).
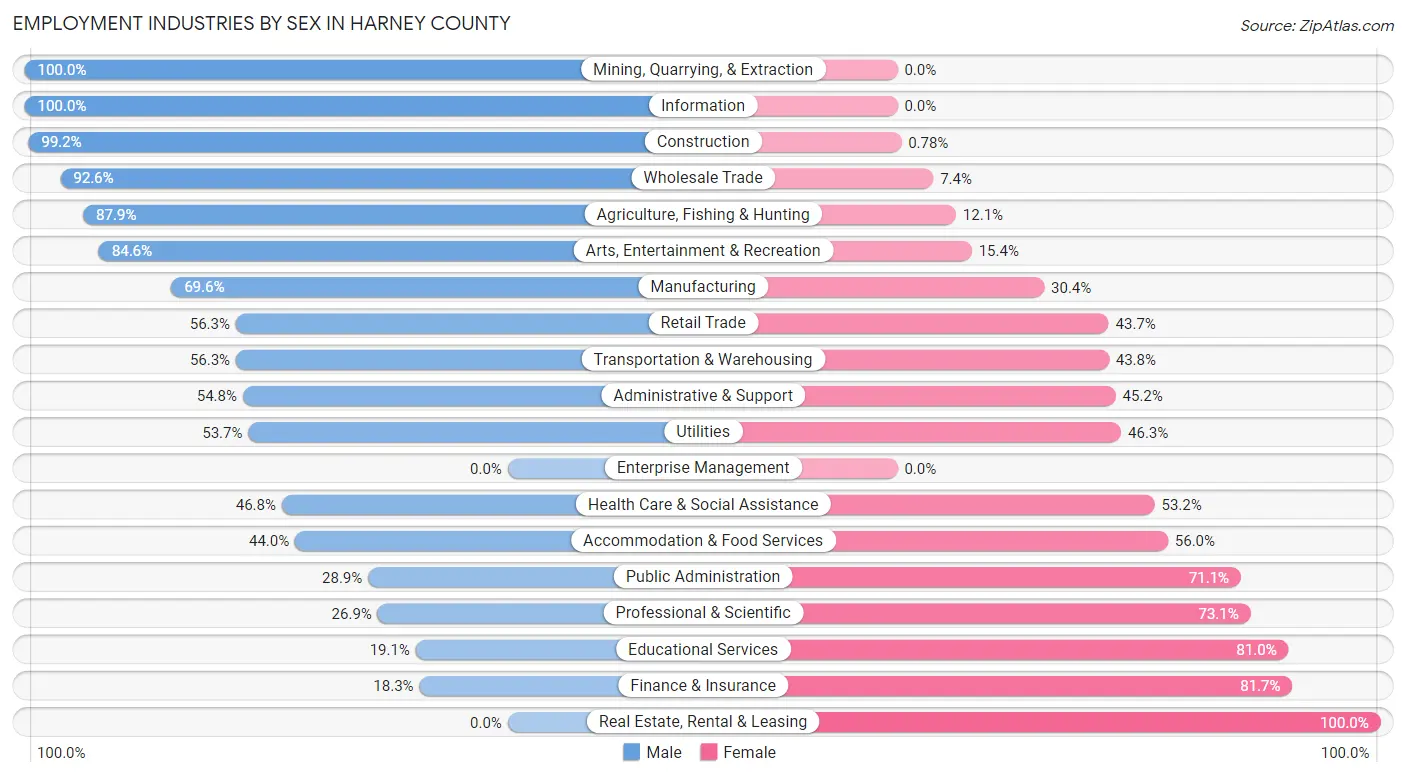
| Industry | Male | Female |
| Agriculture, Fishing & Hunting | 407 (87.9%) | 56 (12.1%) |
| Mining, Quarrying, & Extraction | 4 (100.0%) | 0 (0.0%) |
| Construction | 127 (99.2%) | 1 (0.8%) |
| Manufacturing | 78 (69.6%) | 34 (30.4%) |
| Wholesale Trade | 75 (92.6%) | 6 (7.4%) |
| Retail Trade | 251 (56.3%) | 195 (43.7%) |
| Transportation & Warehousing | 81 (56.2%) | 63 (43.8%) |
| Utilities | 29 (53.7%) | 25 (46.3%) |
| Information | 8 (100.0%) | 0 (0.0%) |
| Finance & Insurance | 17 (18.3%) | 76 (81.7%) |
| Real Estate, Rental & Leasing | 0 (0.0%) | 55 (100.0%) |
| Professional & Scientific | 7 (26.9%) | 19 (73.1%) |
| Enterprise Management | 0 (0.0%) | 0 (0.0%) |
| Administrative & Support | 102 (54.8%) | 84 (45.2%) |
| Educational Services | 40 (19.1%) | 170 (80.9%) |
| Health Care & Social Assistance | 181 (46.8%) | 206 (53.2%) |
| Arts, Entertainment & Recreation | 11 (84.6%) | 2 (15.4%) |
| Accommodation & Food Services | 103 (44.0%) | 131 (56.0%) |
| Public Administration | 100 (28.9%) | 246 (71.1%) |
| Total | 1,669 (53.1%) | 1,476 (46.9%) |
Education in Harney County
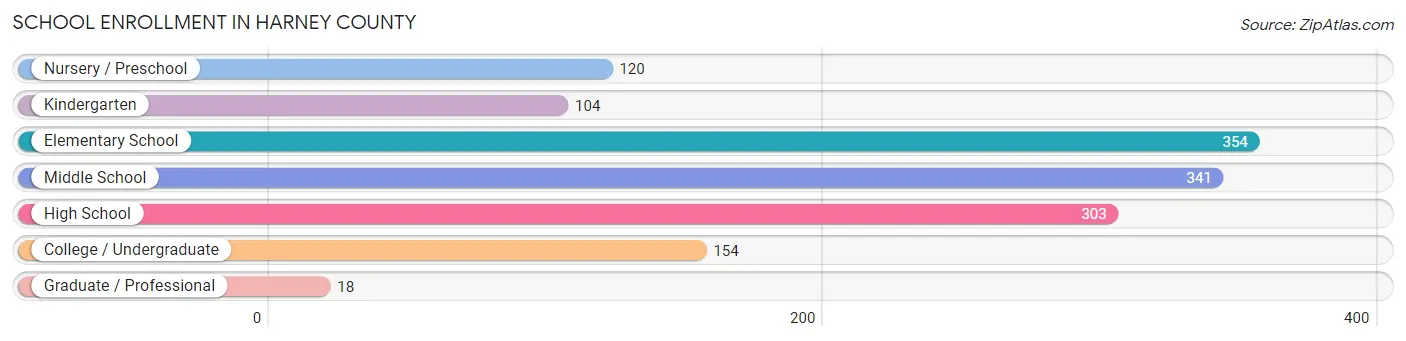
School Enrollment in Harney County
The most common levels of schooling among the 1,394 students in Harney County are elementary school (354 | 25.4%), middle school (341 | 24.5%), and high school (303 | 21.7%).
| School Level | # Students | % Students |
| Nursery / Preschool | 120 | 8.6% |
| Kindergarten | 104 | 7.5% |
| Elementary School | 354 | 25.4% |
| Middle School | 341 | 24.5% |
| High School | 303 | 21.7% |
| College / Undergraduate | 154 | 11.1% |
| Graduate / Professional | 18 | 1.3% |
| Total | 1,394 | 100.0% |
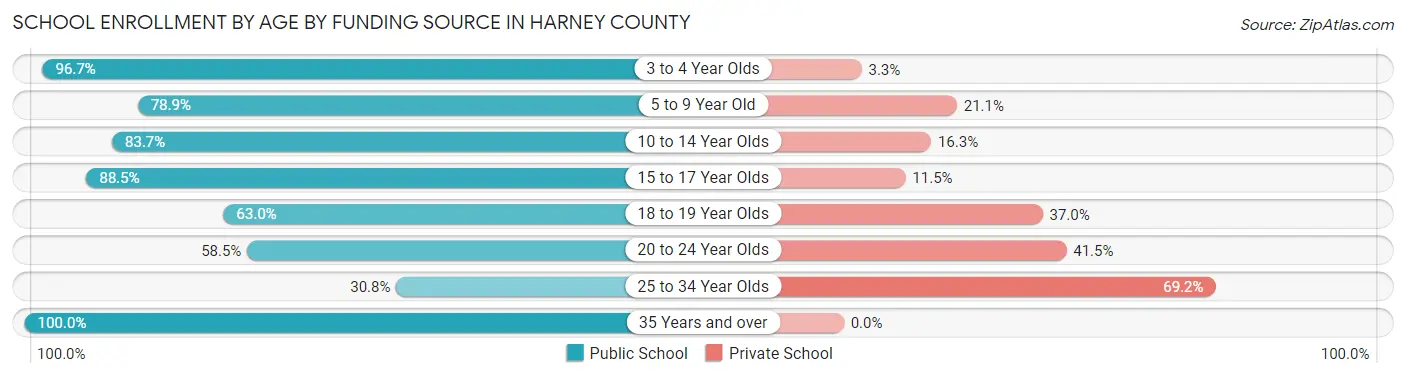
School Enrollment by Age by Funding Source in Harney County
Out of a total of 1,394 students who are enrolled in schools in Harney County, 272 (19.5%) attend a private institution, while the remaining 1,122 (80.5%) are enrolled in public schools. The age group of 25 to 34 year olds has the highest likelihood of being enrolled in private schools, with 9 (69.2% in the age bracket) enrolled. Conversely, the age group of 35 years and over has the lowest likelihood of being enrolled in a private school, with 15 (100.0% in the age bracket) attending a public institution.
| Age Bracket | Public School | Private School |
| 3 to 4 Year Olds | 87 (96.7%) | 3 (3.3%) |
| 5 to 9 Year Old | 326 (78.9%) | 87 (21.1%) |
| 10 to 14 Year Olds | 407 (83.7%) | 79 (16.3%) |
| 15 to 17 Year Olds | 177 (88.5%) | 23 (11.5%) |
| 18 to 19 Year Olds | 34 (63.0%) | 20 (37.0%) |
| 20 to 24 Year Olds | 72 (58.5%) | 51 (41.5%) |
| 25 to 34 Year Olds | 4 (30.8%) | 9 (69.2%) |
| 35 Years and over | 15 (100.0%) | 0 (0.0%) |
| Total | 1,122 (80.5%) | 272 (19.5%) |
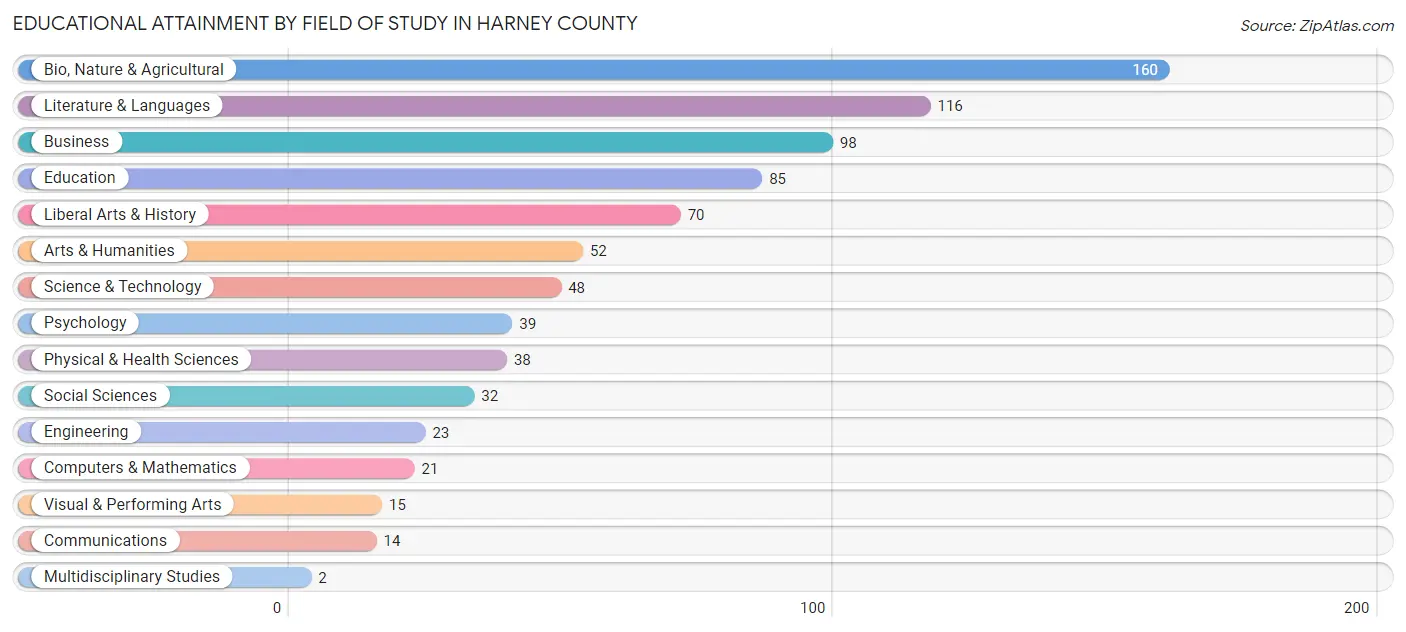
Educational Attainment by Field of Study in Harney County
Bio, nature & agricultural (160 | 19.7%), literature & languages (116 | 14.3%), business (98 | 12.0%), education (85 | 10.5%), and liberal arts & history (70 | 8.6%) are the most common fields of study among 813 individuals in Harney County who have obtained a bachelor's degree or higher.
| Field of Study | # Graduates | % Graduates |
| Computers & Mathematics | 21 | 2.6% |
| Bio, Nature & Agricultural | 160 | 19.7% |
| Physical & Health Sciences | 38 | 4.7% |
| Psychology | 39 | 4.8% |
| Social Sciences | 32 | 3.9% |
| Engineering | 23 | 2.8% |
| Multidisciplinary Studies | 2 | 0.3% |
| Science & Technology | 48 | 5.9% |
| Business | 98 | 12.0% |
| Education | 85 | 10.5% |
| Literature & Languages | 116 | 14.3% |
| Liberal Arts & History | 70 | 8.6% |
| Visual & Performing Arts | 15 | 1.8% |
| Communications | 14 | 1.7% |
| Arts & Humanities | 52 | 6.4% |
| Total | 813 | 100.0% |
Transportation & Commute in Harney County
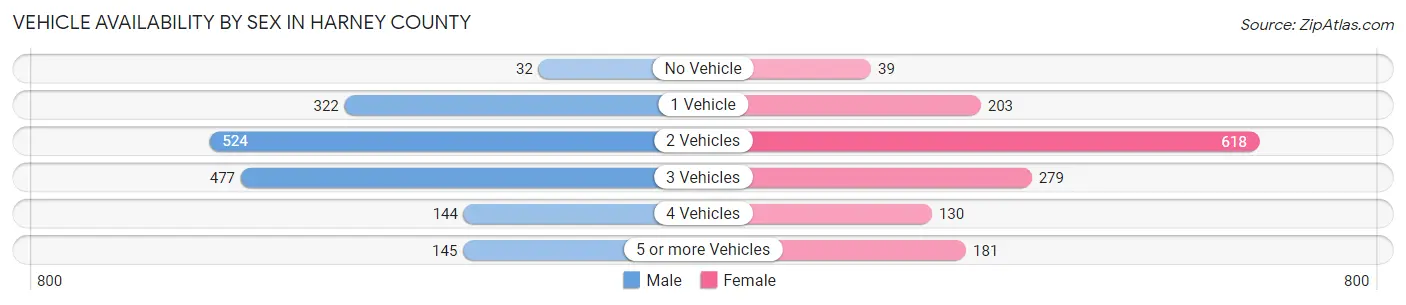
Vehicle Availability by Sex in Harney County
The most prevalent vehicle ownership categories in Harney County are males with 2 vehicles (524, accounting for 31.9%) and females with 2 vehicles (618, making up 36.1%).
| Vehicles Available | Male | Female |
| No Vehicle | 32 (1.9%) | 39 (2.7%) |
| 1 Vehicle | 322 (19.6%) | 203 (14.0%) |
| 2 Vehicles | 524 (31.9%) | 618 (42.6%) |
| 3 Vehicles | 477 (29.0%) | 279 (19.2%) |
| 4 Vehicles | 144 (8.8%) | 130 (9.0%) |
| 5 or more Vehicles | 145 (8.8%) | 181 (12.5%) |
| Total | 1,644 (100.0%) | 1,450 (100.0%) |
Commute Time in Harney County
The most frequently occuring commute durations in Harney County are 5 to 9 minutes (1,047 commuters, 37.3%), 10 to 14 minutes (537 commuters, 19.1%), and less than 5 minutes (373 commuters, 13.3%).
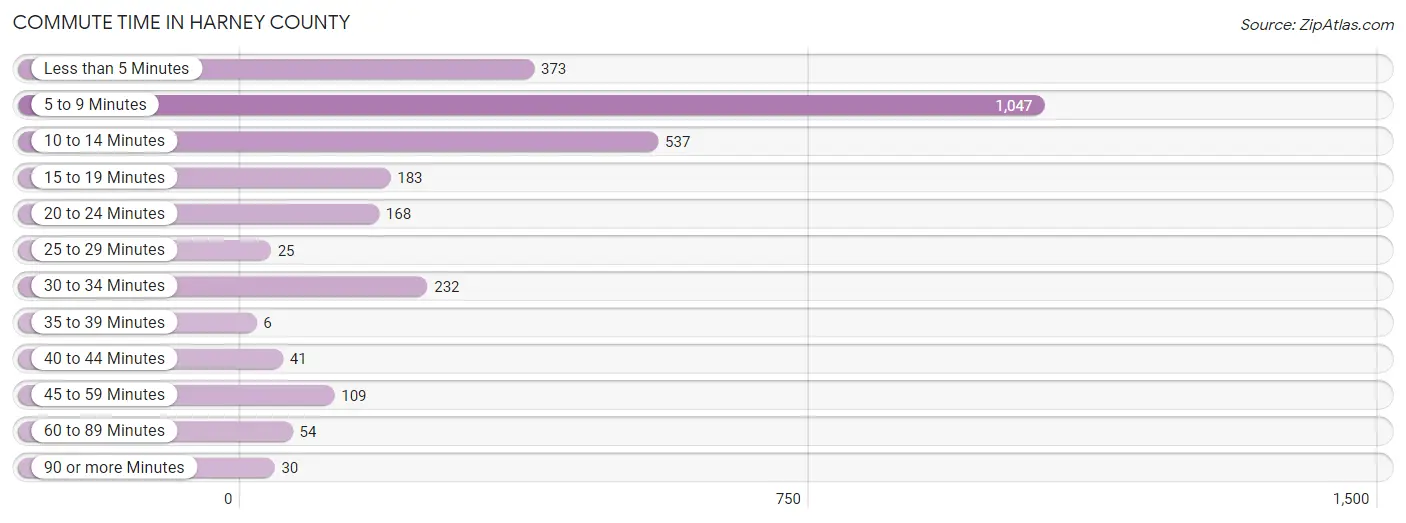
| Commute Time | # Commuters | % Commuters |
| Less than 5 Minutes | 373 | 13.3% |
| 5 to 9 Minutes | 1,047 | 37.3% |
| 10 to 14 Minutes | 537 | 19.1% |
| 15 to 19 Minutes | 183 | 6.5% |
| 20 to 24 Minutes | 168 | 6.0% |
| 25 to 29 Minutes | 25 | 0.9% |
| 30 to 34 Minutes | 232 | 8.3% |
| 35 to 39 Minutes | 6 | 0.2% |
| 40 to 44 Minutes | 41 | 1.5% |
| 45 to 59 Minutes | 109 | 3.9% |
| 60 to 89 Minutes | 54 | 1.9% |
| 90 or more Minutes | 30 | 1.1% |
Commute Time by Sex in Harney County
The most common commute times in Harney County are 5 to 9 minutes (577 commuters, 37.9%) for males and 5 to 9 minutes (470 commuters, 36.6%) for females.
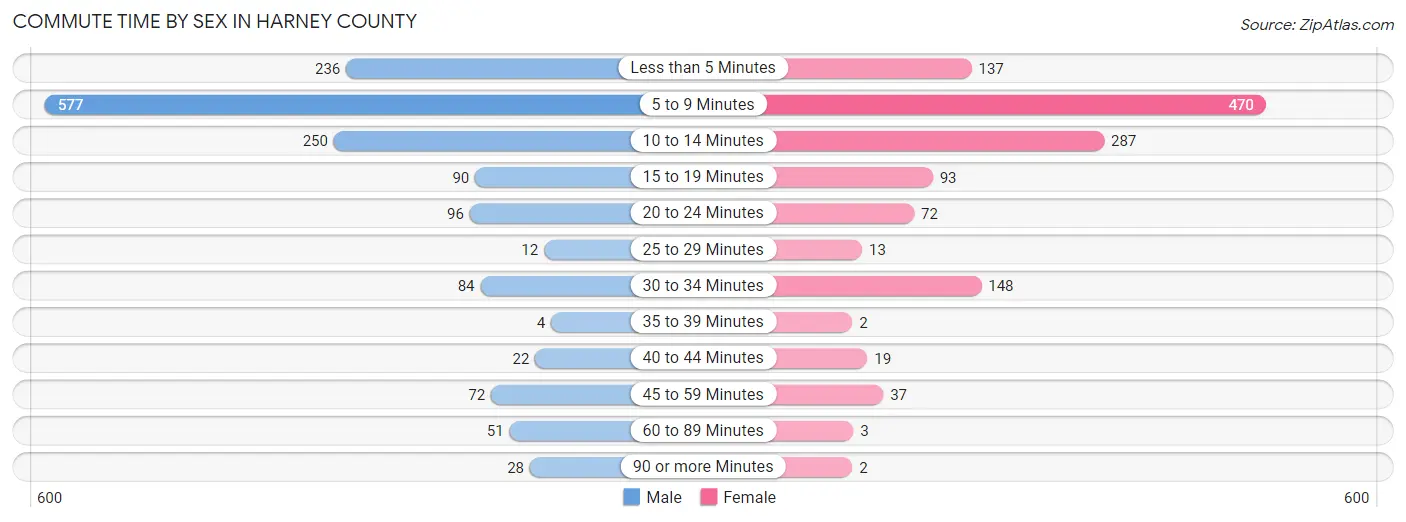
| Commute Time | Male | Female |
| Less than 5 Minutes | 236 (15.5%) | 137 (10.7%) |
| 5 to 9 Minutes | 577 (37.9%) | 470 (36.6%) |
| 10 to 14 Minutes | 250 (16.4%) | 287 (22.4%) |
| 15 to 19 Minutes | 90 (5.9%) | 93 (7.2%) |
| 20 to 24 Minutes | 96 (6.3%) | 72 (5.6%) |
| 25 to 29 Minutes | 12 (0.8%) | 13 (1.0%) |
| 30 to 34 Minutes | 84 (5.5%) | 148 (11.5%) |
| 35 to 39 Minutes | 4 (0.3%) | 2 (0.2%) |
| 40 to 44 Minutes | 22 (1.5%) | 19 (1.5%) |
| 45 to 59 Minutes | 72 (4.7%) | 37 (2.9%) |
| 60 to 89 Minutes | 51 (3.4%) | 3 (0.2%) |
| 90 or more Minutes | 28 (1.8%) | 2 (0.2%) |
Time of Departure to Work by Sex in Harney County
The most frequent times of departure to work in Harney County are 7:30 AM to 7:59 AM (280, 18.4%) for males and 7:00 AM to 7:29 AM (200, 15.6%) for females.
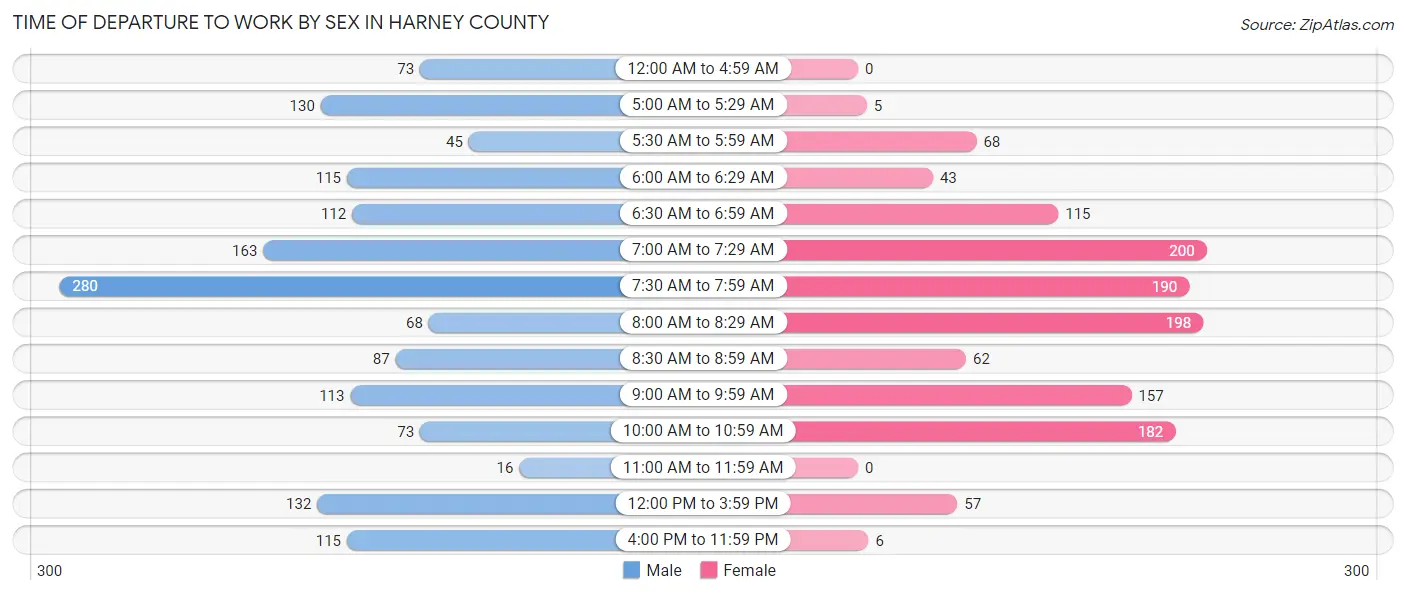
| Time of Departure | Male | Female |
| 12:00 AM to 4:59 AM | 73 (4.8%) | 0 (0.0%) |
| 5:00 AM to 5:29 AM | 130 (8.5%) | 5 (0.4%) |
| 5:30 AM to 5:59 AM | 45 (3.0%) | 68 (5.3%) |
| 6:00 AM to 6:29 AM | 115 (7.6%) | 43 (3.4%) |
| 6:30 AM to 6:59 AM | 112 (7.4%) | 115 (9.0%) |
| 7:00 AM to 7:29 AM | 163 (10.7%) | 200 (15.6%) |
| 7:30 AM to 7:59 AM | 280 (18.4%) | 190 (14.8%) |
| 8:00 AM to 8:29 AM | 68 (4.5%) | 198 (15.4%) |
| 8:30 AM to 8:59 AM | 87 (5.7%) | 62 (4.8%) |
| 9:00 AM to 9:59 AM | 113 (7.4%) | 157 (12.2%) |
| 10:00 AM to 10:59 AM | 73 (4.8%) | 182 (14.2%) |
| 11:00 AM to 11:59 AM | 16 (1.1%) | 0 (0.0%) |
| 12:00 PM to 3:59 PM | 132 (8.7%) | 57 (4.4%) |
| 4:00 PM to 11:59 PM | 115 (7.6%) | 6 (0.5%) |
| Total | 1,522 (100.0%) | 1,283 (100.0%) |
Housing Occupancy in Harney County
Occupancy by Ownership in Harney County
Of the total 3,102 dwellings in Harney County, owner-occupied units account for 2,144 (69.1%), while renter-occupied units make up 958 (30.9%).
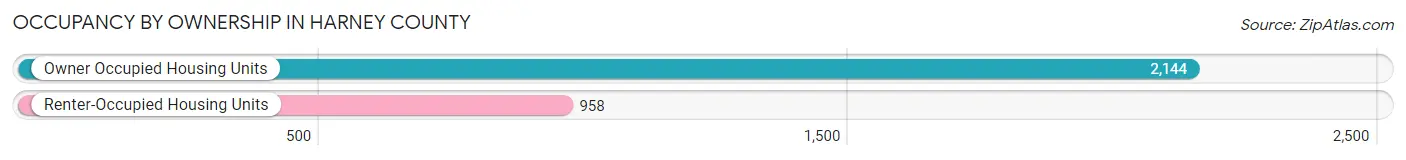
| Occupancy | # Housing Units | % Housing Units |
| Owner Occupied Housing Units | 2,144 | 69.1% |
| Renter-Occupied Housing Units | 958 | 30.9% |
| Total Occupied Housing Units | 3,102 | 100.0% |
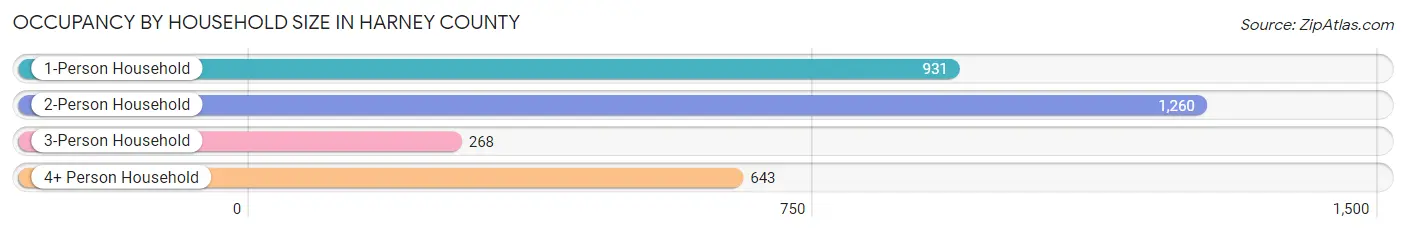
Occupancy by Household Size in Harney County
| Household Size | # Housing Units | % Housing Units |
| 1-Person Household | 931 | 30.0% |
| 2-Person Household | 1,260 | 40.6% |
| 3-Person Household | 268 | 8.6% |
| 4+ Person Household | 643 | 20.7% |
| Total Housing Units | 3,102 | 100.0% |
Occupancy by Ownership by Household Size in Harney County
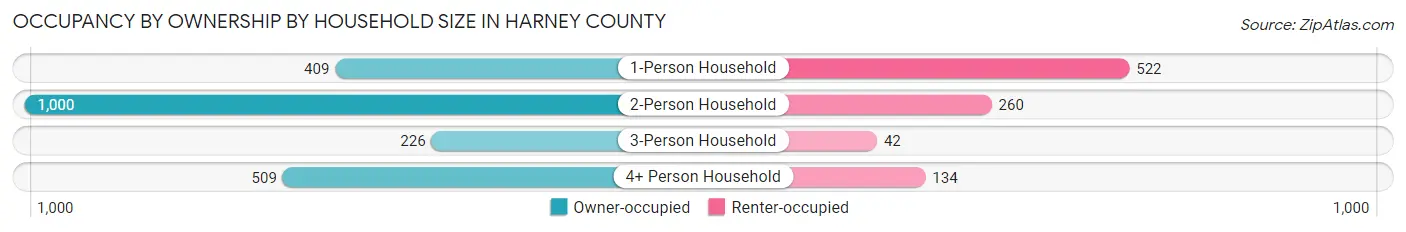
| Household Size | Owner-occupied | Renter-occupied |
| 1-Person Household | 409 (43.9%) | 522 (56.1%) |
| 2-Person Household | 1,000 (79.4%) | 260 (20.6%) |
| 3-Person Household | 226 (84.3%) | 42 (15.7%) |
| 4+ Person Household | 509 (79.2%) | 134 (20.8%) |
| Total Housing Units | 2,144 (69.1%) | 958 (30.9%) |
Occupancy by Educational Attainment in Harney County
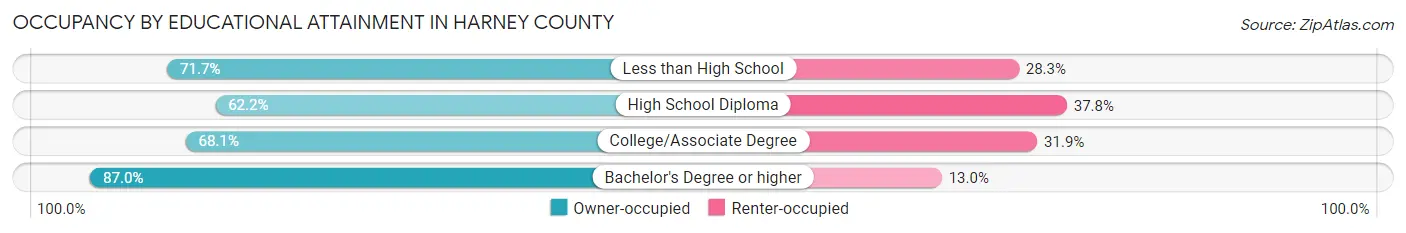
| Household Size | Owner-occupied | Renter-occupied |
| Less than High School | 203 (71.7%) | 80 (28.3%) |
| High School Diploma | 724 (62.2%) | 440 (37.8%) |
| College/Associate Degree | 802 (68.1%) | 376 (31.9%) |
| Bachelor's Degree or higher | 415 (87.0%) | 62 (13.0%) |
Occupancy by Age of Householder in Harney County
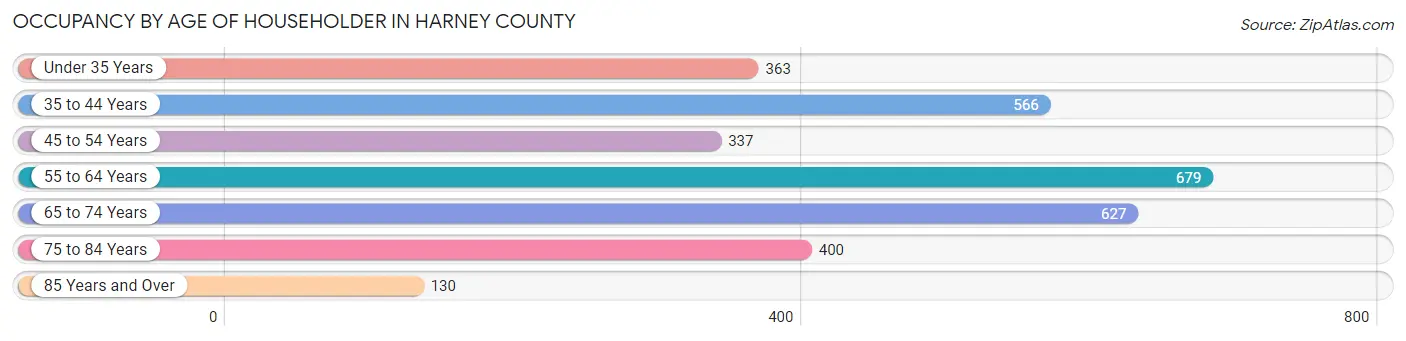
| Age Bracket | # Households | % Households |
| Under 35 Years | 363 | 11.7% |
| 35 to 44 Years | 566 | 18.2% |
| 45 to 54 Years | 337 | 10.9% |
| 55 to 64 Years | 679 | 21.9% |
| 65 to 74 Years | 627 | 20.2% |
| 75 to 84 Years | 400 | 12.9% |
| 85 Years and Over | 130 | 4.2% |
| Total | 3,102 | 100.0% |
Housing Finances in Harney County
Median Income by Occupancy in Harney County
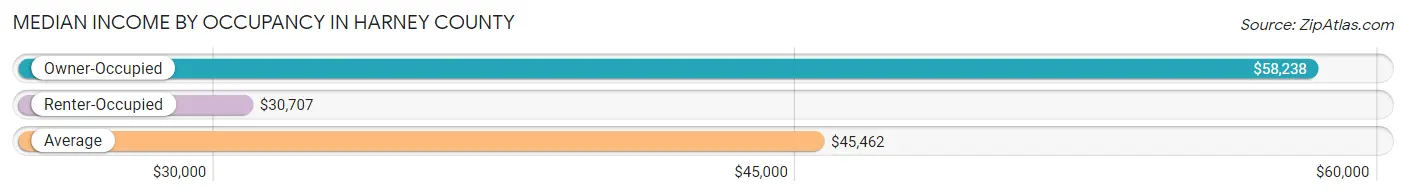
| Occupancy Type | # Households | Median Income |
| Owner-Occupied | 2,144 (69.1%) | $58,238 |
| Renter-Occupied | 958 (30.9%) | $30,707 |
| Average | 3,102 (100.0%) | $45,462 |
Occupancy by Householder Income Bracket in Harney County
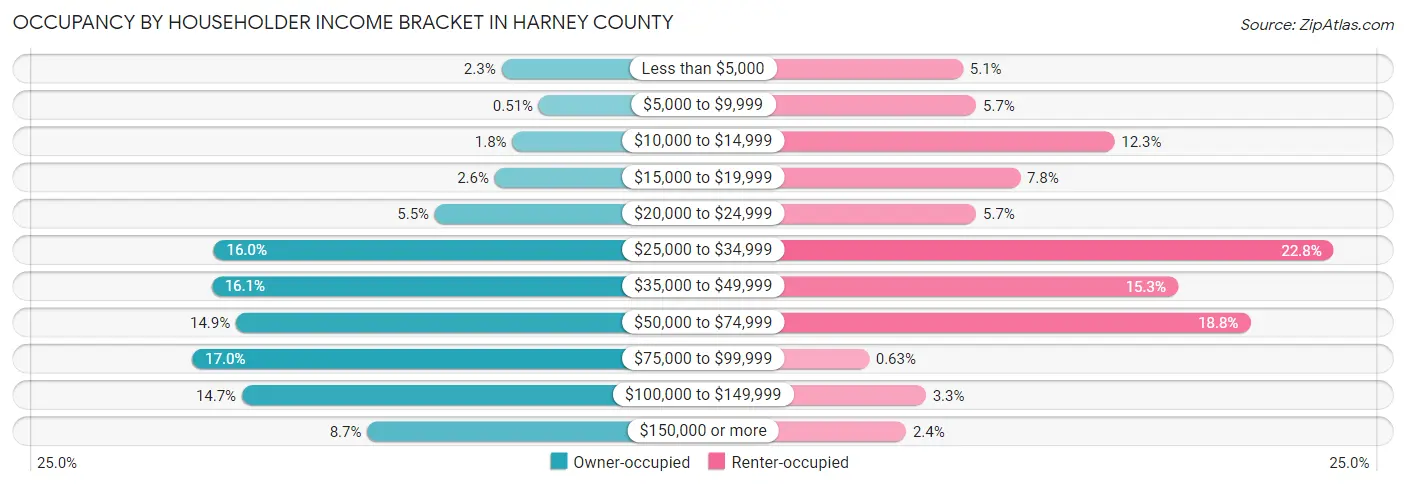
| Income Bracket | Owner-occupied | Renter-occupied |
| Less than $5,000 | 49 (2.3%) | 49 (5.1%) |
| $5,000 to $9,999 | 11 (0.5%) | 55 (5.7%) |
| $10,000 to $14,999 | 38 (1.8%) | 118 (12.3%) |
| $15,000 to $19,999 | 56 (2.6%) | 75 (7.8%) |
| $20,000 to $24,999 | 117 (5.5%) | 55 (5.7%) |
| $25,000 to $34,999 | 343 (16.0%) | 218 (22.8%) |
| $35,000 to $49,999 | 345 (16.1%) | 147 (15.3%) |
| $50,000 to $74,999 | 320 (14.9%) | 180 (18.8%) |
| $75,000 to $99,999 | 365 (17.0%) | 6 (0.6%) |
| $100,000 to $149,999 | 314 (14.6%) | 32 (3.3%) |
| $150,000 or more | 186 (8.7%) | 23 (2.4%) |
| Total | 2,144 (100.0%) | 958 (100.0%) |
Monthly Housing Cost Tiers in Harney County
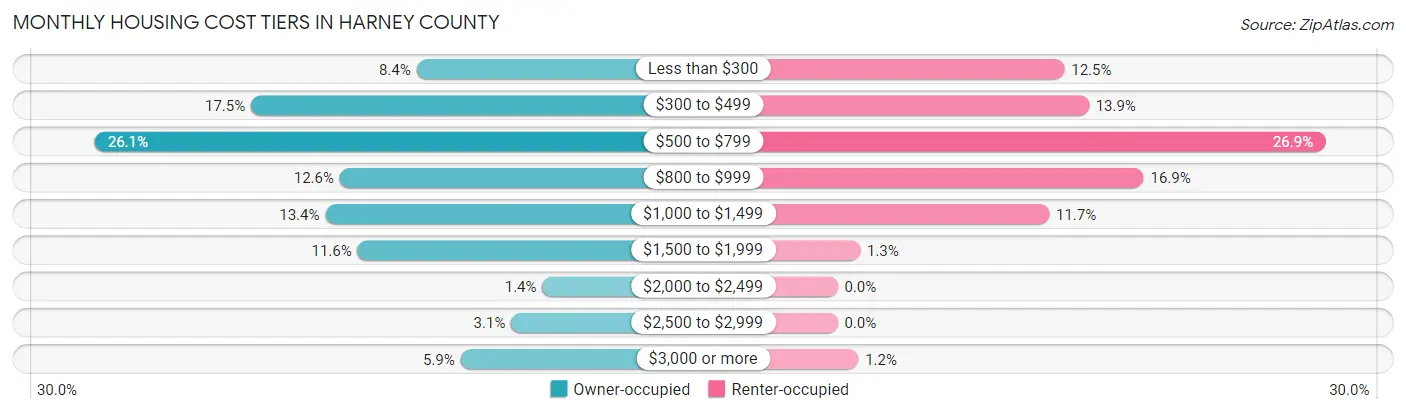
| Monthly Cost | Owner-occupied | Renter-occupied |
| Less than $300 | 179 (8.4%) | 120 (12.5%) |
| $300 to $499 | 375 (17.5%) | 133 (13.9%) |
| $500 to $799 | 560 (26.1%) | 258 (26.9%) |
| $800 to $999 | 270 (12.6%) | 162 (16.9%) |
| $1,000 to $1,499 | 287 (13.4%) | 112 (11.7%) |
| $1,500 to $1,999 | 249 (11.6%) | 12 (1.3%) |
| $2,000 to $2,499 | 30 (1.4%) | 0 (0.0%) |
| $2,500 to $2,999 | 67 (3.1%) | 0 (0.0%) |
| $3,000 or more | 127 (5.9%) | 11 (1.1%) |
| Total | 2,144 (100.0%) | 958 (100.0%) |
Physical Housing Characteristics in Harney County
Housing Structures in Harney County
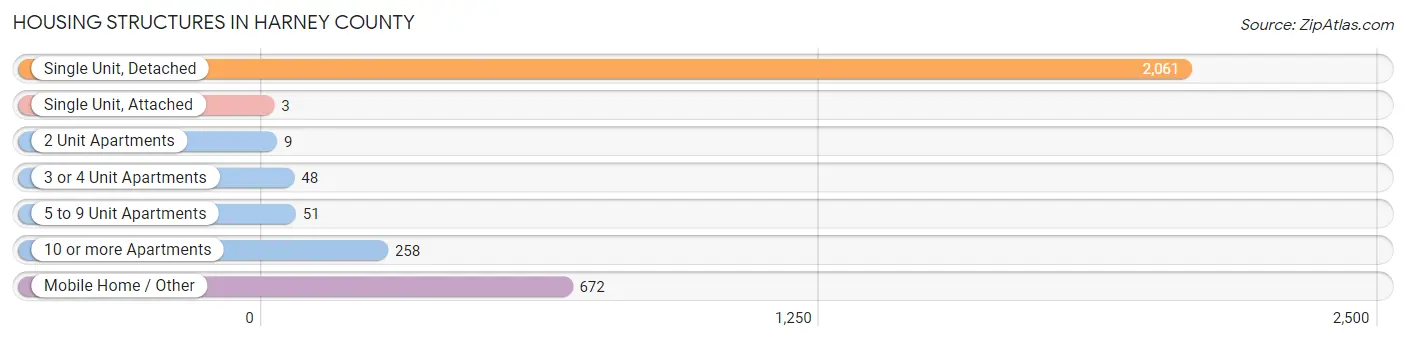
| Structure Type | # Housing Units | % Housing Units |
| Single Unit, Detached | 2,061 | 66.4% |
| Single Unit, Attached | 3 | 0.1% |
| 2 Unit Apartments | 9 | 0.3% |
| 3 or 4 Unit Apartments | 48 | 1.5% |
| 5 to 9 Unit Apartments | 51 | 1.6% |
| 10 or more Apartments | 258 | 8.3% |
| Mobile Home / Other | 672 | 21.7% |
| Total | 3,102 | 100.0% |
Housing Structures by Occupancy in Harney County
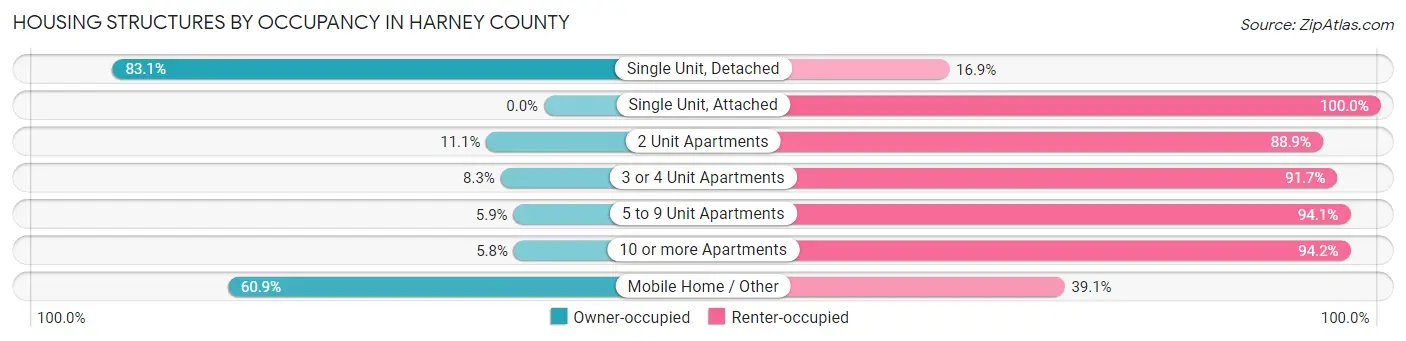
| Structure Type | Owner-occupied | Renter-occupied |
| Single Unit, Detached | 1,712 (83.1%) | 349 (16.9%) |
| Single Unit, Attached | 0 (0.0%) | 3 (100.0%) |
| 2 Unit Apartments | 1 (11.1%) | 8 (88.9%) |
| 3 or 4 Unit Apartments | 4 (8.3%) | 44 (91.7%) |
| 5 to 9 Unit Apartments | 3 (5.9%) | 48 (94.1%) |
| 10 or more Apartments | 15 (5.8%) | 243 (94.2%) |
| Mobile Home / Other | 409 (60.9%) | 263 (39.1%) |
| Total | 2,144 (69.1%) | 958 (30.9%) |
Housing Structures by Number of Rooms in Harney County
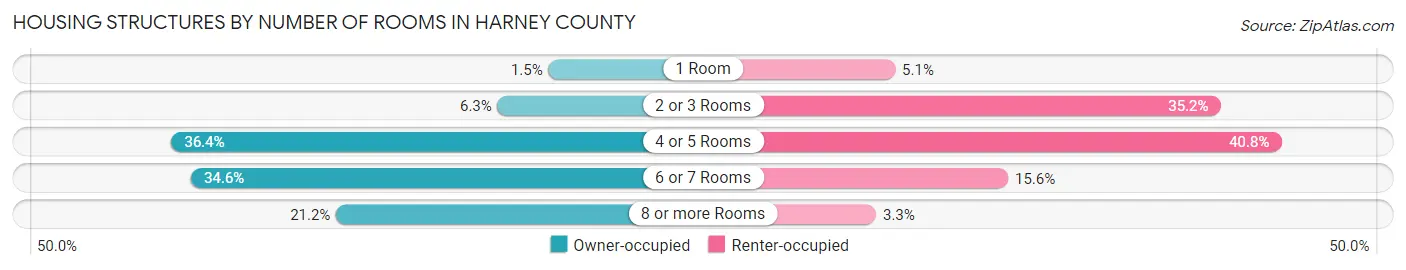
| Number of Rooms | Owner-occupied | Renter-occupied |
| 1 Room | 33 (1.5%) | 49 (5.1%) |
| 2 or 3 Rooms | 134 (6.2%) | 337 (35.2%) |
| 4 or 5 Rooms | 781 (36.4%) | 391 (40.8%) |
| 6 or 7 Rooms | 742 (34.6%) | 149 (15.5%) |
| 8 or more Rooms | 454 (21.2%) | 32 (3.3%) |
| Total | 2,144 (100.0%) | 958 (100.0%) |
Housing Structure by Heating Type in Harney County
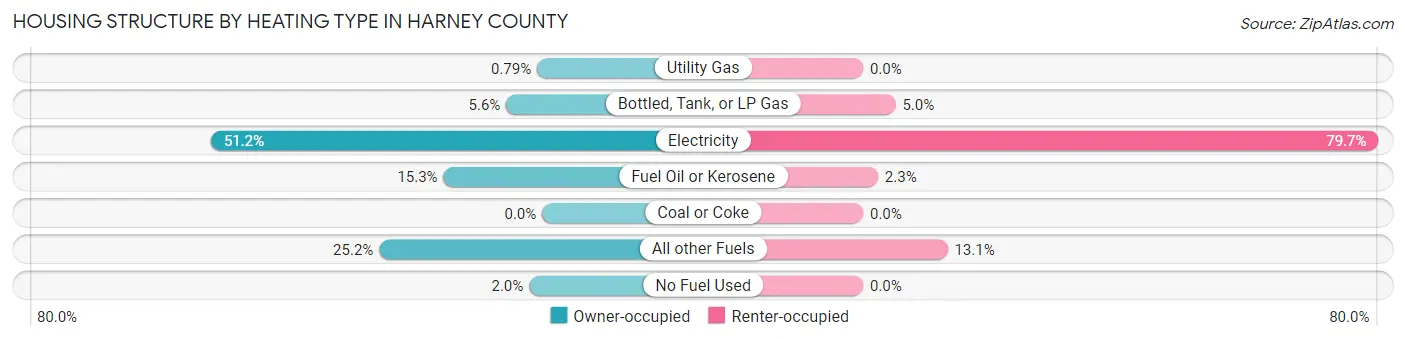
| Heating Type | Owner-occupied | Renter-occupied |
| Utility Gas | 17 (0.8%) | 0 (0.0%) |
| Bottled, Tank, or LP Gas | 119 (5.6%) | 48 (5.0%) |
| Electricity | 1,098 (51.2%) | 763 (79.6%) |
| Fuel Oil or Kerosene | 327 (15.2%) | 22 (2.3%) |
| Coal or Coke | 0 (0.0%) | 0 (0.0%) |
| All other Fuels | 540 (25.2%) | 125 (13.1%) |
| No Fuel Used | 43 (2.0%) | 0 (0.0%) |
| Total | 2,144 (100.0%) | 958 (100.0%) |
Household Vehicle Usage in Harney County
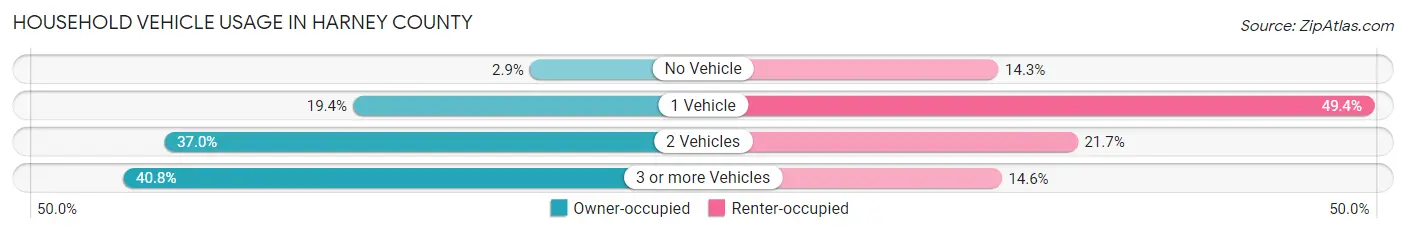
| Vehicles per Household | Owner-occupied | Renter-occupied |
| No Vehicle | 61 (2.9%) | 137 (14.3%) |
| 1 Vehicle | 415 (19.4%) | 473 (49.4%) |
| 2 Vehicles | 793 (37.0%) | 208 (21.7%) |
| 3 or more Vehicles | 875 (40.8%) | 140 (14.6%) |
| Total | 2,144 (100.0%) | 958 (100.0%) |
Real Estate & Mortgages in Harney County
Real Estate and Mortgage Overview in Harney County
| Characteristic | Without Mortgage | With Mortgage |
| Housing Units | 882 | 1,262 |
| Median Property Value | $152,900 | $196,200 |
| Median Household Income | $46,290 | $127 |
| Monthly Housing Costs | $474 | $125 |
| Real Estate Taxes | $1,456 | $2 |
Property Value by Mortgage Status in Harney County
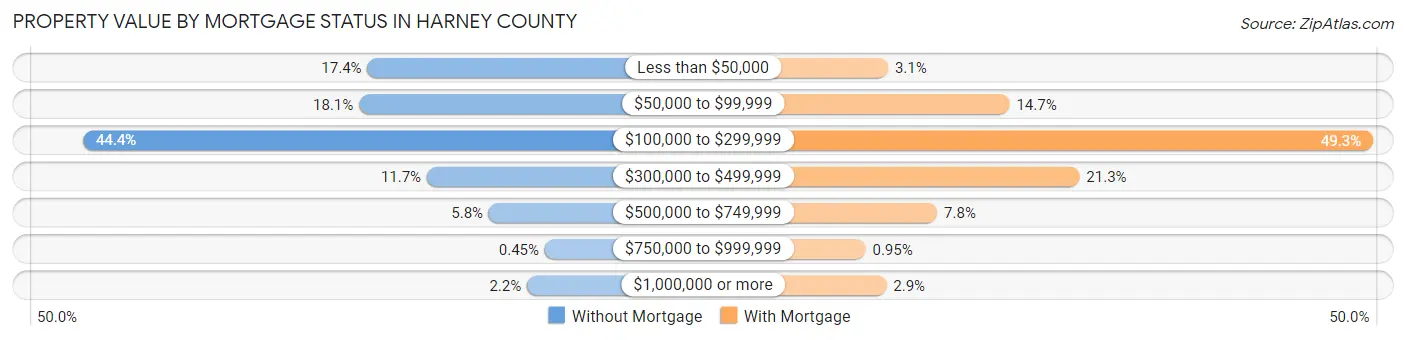
| Property Value | Without Mortgage | With Mortgage |
| Less than $50,000 | 153 (17.3%) | 39 (3.1%) |
| $50,000 to $99,999 | 160 (18.1%) | 185 (14.7%) |
| $100,000 to $299,999 | 392 (44.4%) | 622 (49.3%) |
| $300,000 to $499,999 | 103 (11.7%) | 269 (21.3%) |
| $500,000 to $749,999 | 51 (5.8%) | 98 (7.8%) |
| $750,000 to $999,999 | 4 (0.4%) | 12 (0.9%) |
| $1,000,000 or more | 19 (2.1%) | 37 (2.9%) |
| Total | 882 (100.0%) | 1,262 (100.0%) |
Household Income by Mortgage Status in Harney County
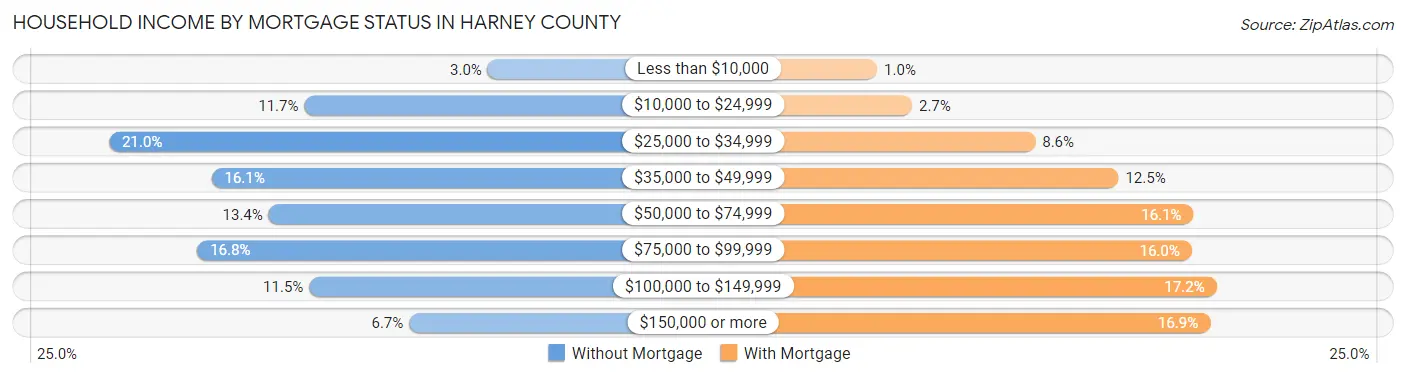
| Household Income | Without Mortgage | With Mortgage |
| Less than $10,000 | 26 (2.9%) | 13 (1.0%) |
| $10,000 to $24,999 | 103 (11.7%) | 34 (2.7%) |
| $25,000 to $34,999 | 185 (21.0%) | 108 (8.6%) |
| $35,000 to $49,999 | 142 (16.1%) | 158 (12.5%) |
| $50,000 to $74,999 | 118 (13.4%) | 203 (16.1%) |
| $75,000 to $99,999 | 148 (16.8%) | 202 (16.0%) |
| $100,000 to $149,999 | 101 (11.5%) | 217 (17.2%) |
| $150,000 or more | 59 (6.7%) | 213 (16.9%) |
| Total | 882 (100.0%) | 1,262 (100.0%) |
Property Value to Household Income Ratio in Harney County
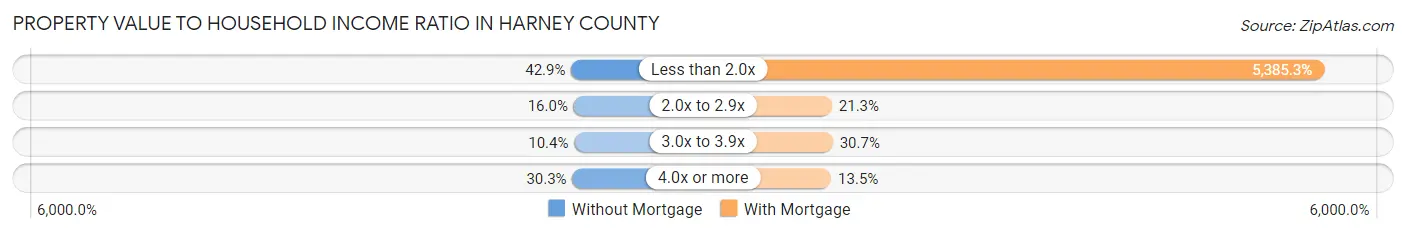
| Value-to-Income Ratio | Without Mortgage | With Mortgage |
| Less than 2.0x | 378 (42.9%) | 67,963 (5,385.3%) |
| 2.0x to 2.9x | 141 (16.0%) | 269 (21.3%) |
| 3.0x to 3.9x | 92 (10.4%) | 387 (30.7%) |
| 4.0x or more | 267 (30.3%) | 170 (13.5%) |
| Total | 882 (100.0%) | 1,262 (100.0%) |
Real Estate Taxes by Mortgage Status in Harney County
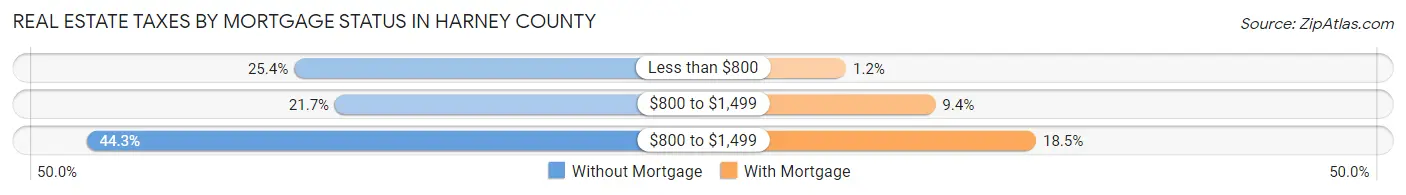
| Property Taxes | Without Mortgage | With Mortgage |
| Less than $800 | 224 (25.4%) | 15 (1.2%) |
| $800 to $1,499 | 191 (21.7%) | 118 (9.3%) |
| $800 to $1,499 | 391 (44.3%) | 234 (18.5%) |
| Total | 882 (100.0%) | 1,262 (100.0%) |
Health & Disability in Harney County
Health Insurance Coverage by Age in Harney County
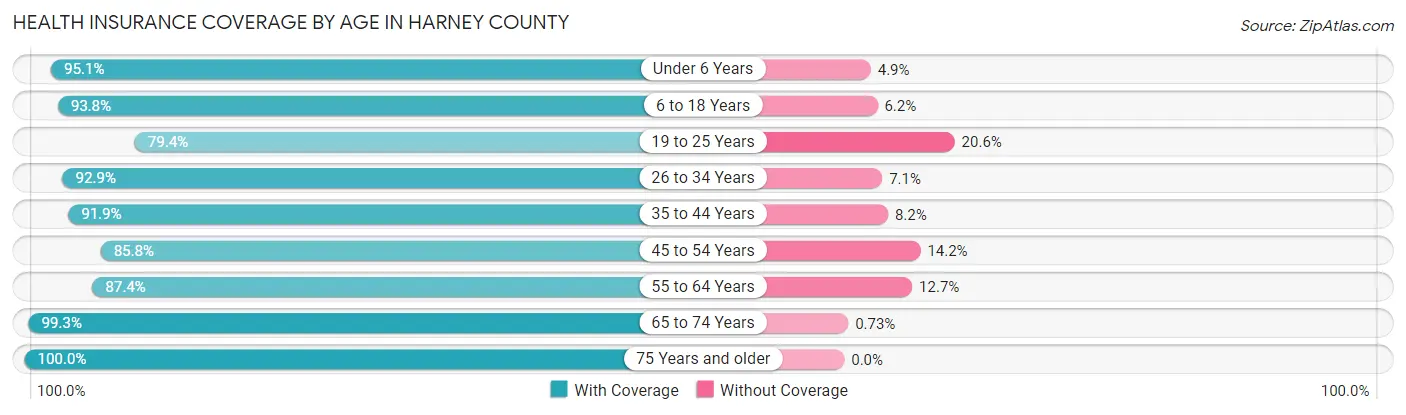
| Age Bracket | With Coverage | Without Coverage |
| Under 6 Years | 385 (95.1%) | 20 (4.9%) |
| 6 to 18 Years | 1,016 (93.8%) | 67 (6.2%) |
| 19 to 25 Years | 436 (79.4%) | 113 (20.6%) |
| 26 to 34 Years | 617 (92.9%) | 47 (7.1%) |
| 35 to 44 Years | 845 (91.8%) | 75 (8.2%) |
| 45 to 54 Years | 719 (85.8%) | 119 (14.2%) |
| 55 to 64 Years | 925 (87.4%) | 134 (12.7%) |
| 65 to 74 Years | 1,089 (99.3%) | 8 (0.7%) |
| 75 Years and older | 780 (100.0%) | 0 (0.0%) |
| Total | 6,812 (92.1%) | 583 (7.9%) |
Health Insurance Coverage by Citizenship Status in Harney County
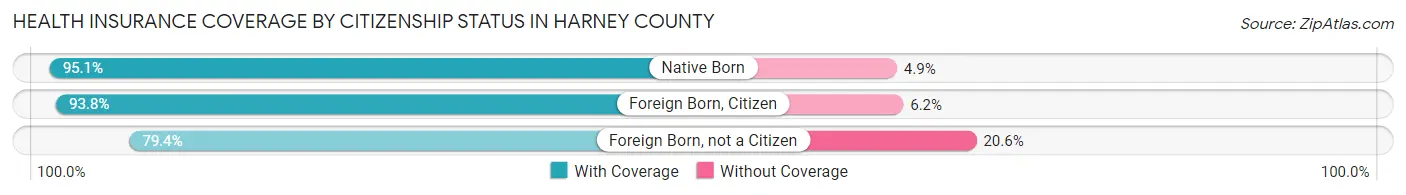
| Citizenship Status | With Coverage | Without Coverage |
| Native Born | 385 (95.1%) | 20 (4.9%) |
| Foreign Born, Citizen | 1,016 (93.8%) | 67 (6.2%) |
| Foreign Born, not a Citizen | 436 (79.4%) | 113 (20.6%) |
Health Insurance Coverage by Household Income in Harney County
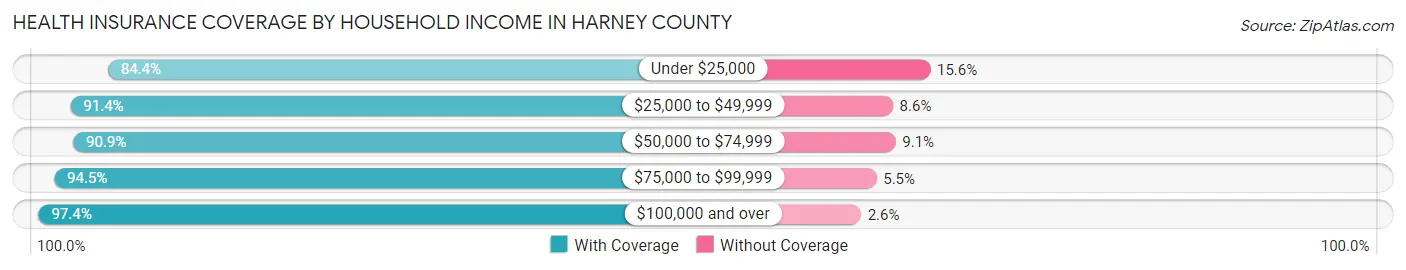
| Household Income | With Coverage | Without Coverage |
| Under $25,000 | 774 (84.4%) | 143 (15.6%) |
| $25,000 to $49,999 | 2,096 (91.4%) | 197 (8.6%) |
| $50,000 to $74,999 | 1,308 (90.9%) | 131 (9.1%) |
| $75,000 to $99,999 | 1,026 (94.5%) | 60 (5.5%) |
| $100,000 and over | 1,531 (97.4%) | 41 (2.6%) |
Public vs Private Health Insurance Coverage by Age in Harney County
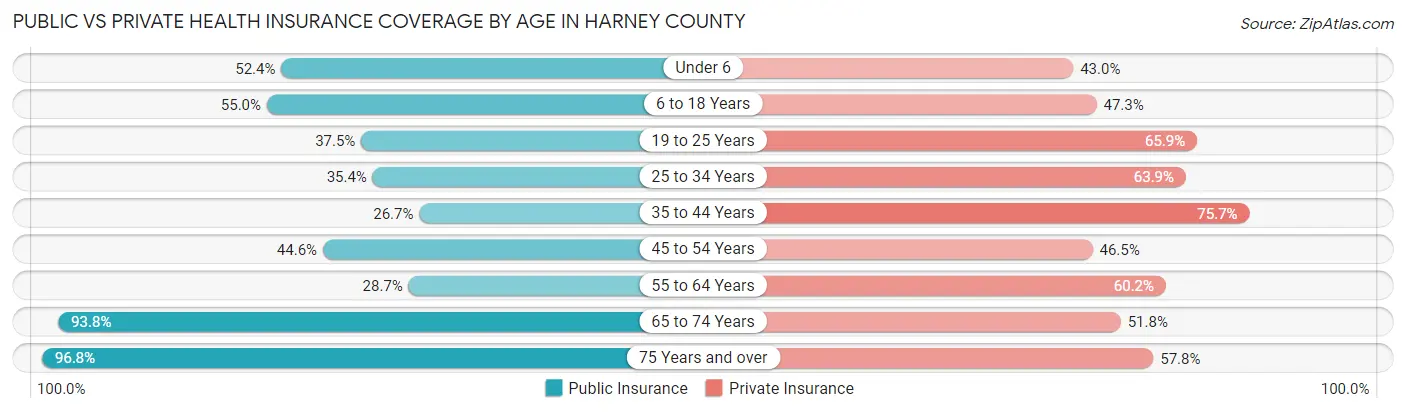
| Age Bracket | Public Insurance | Private Insurance |
| Under 6 | 212 (52.3%) | 174 (43.0%) |
| 6 to 18 Years | 596 (55.0%) | 512 (47.3%) |
| 19 to 25 Years | 206 (37.5%) | 362 (65.9%) |
| 25 to 34 Years | 235 (35.4%) | 424 (63.9%) |
| 35 to 44 Years | 246 (26.7%) | 696 (75.6%) |
| 45 to 54 Years | 374 (44.6%) | 390 (46.5%) |
| 55 to 64 Years | 304 (28.7%) | 637 (60.2%) |
| 65 to 74 Years | 1,029 (93.8%) | 568 (51.8%) |
| 75 Years and over | 755 (96.8%) | 451 (57.8%) |
| Total | 3,957 (53.5%) | 4,214 (57.0%) |
Disability Status by Sex by Age in Harney County
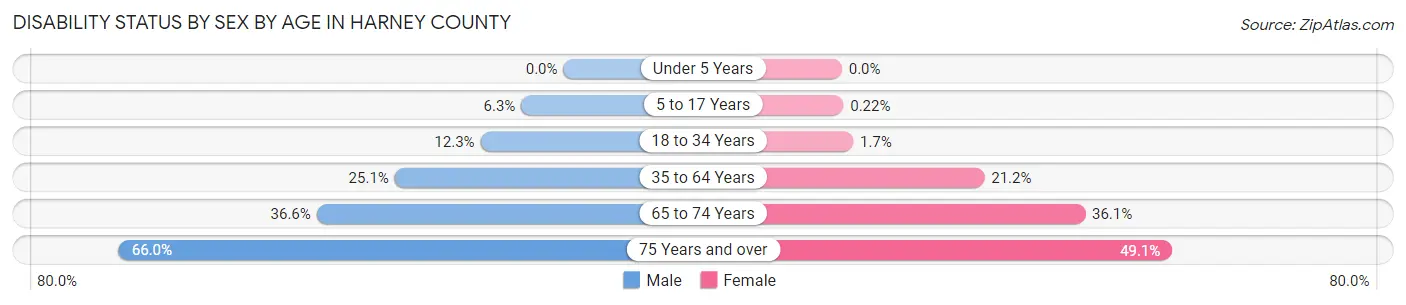
| Age Bracket | Male | Female |
| Under 5 Years | 0 (0.0%) | 0 (0.0%) |
| 5 to 17 Years | 40 (6.3%) | 1 (0.2%) |
| 18 to 34 Years | 75 (12.3%) | 11 (1.7%) |
| 35 to 64 Years | 353 (25.1%) | 298 (21.2%) |
| 65 to 74 Years | 196 (36.6%) | 203 (36.1%) |
| 75 Years and over | 235 (66.0%) | 208 (49.1%) |
Disability Class by Sex by Age in Harney County
Disability Class: Hearing Difficulty
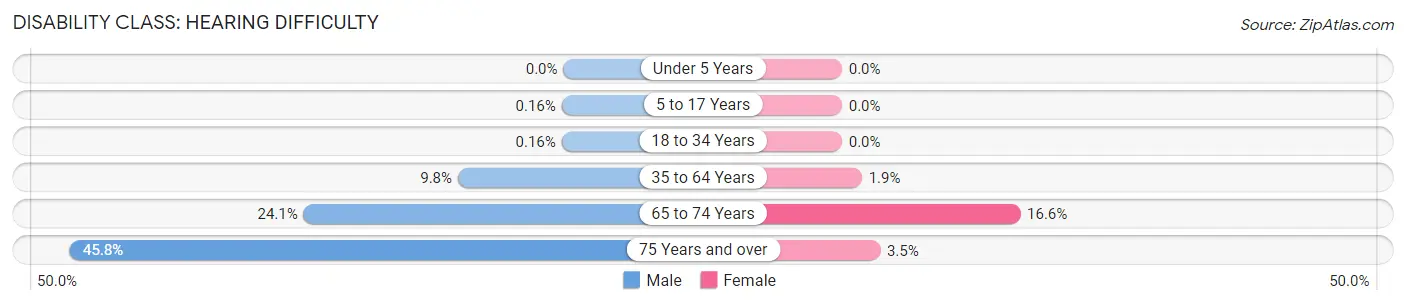
| Age Bracket | Male | Female |
| Under 5 Years | 0 (0.0%) | 0 (0.0%) |
| 5 to 17 Years | 1 (0.2%) | 0 (0.0%) |
| 18 to 34 Years | 1 (0.2%) | 0 (0.0%) |
| 35 to 64 Years | 138 (9.8%) | 26 (1.8%) |
| 65 to 74 Years | 129 (24.1%) | 93 (16.6%) |
| 75 Years and over | 163 (45.8%) | 15 (3.5%) |
Disability Class: Vision Difficulty
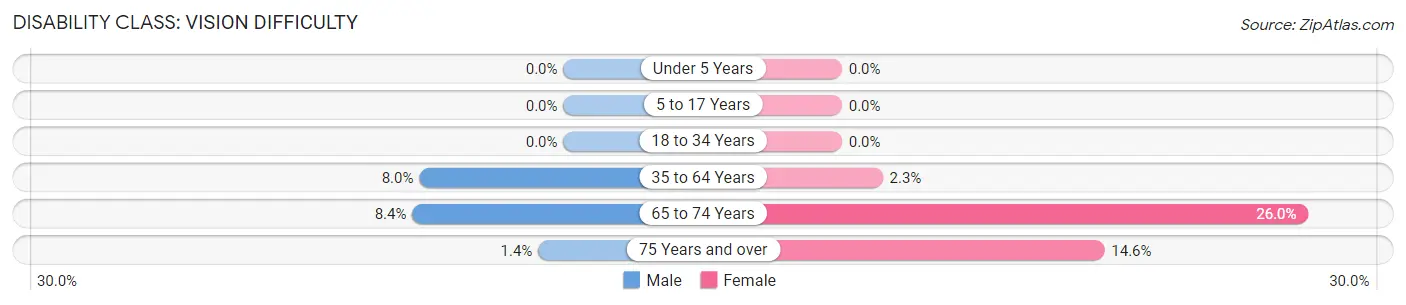
| Age Bracket | Male | Female |
| Under 5 Years | 0 (0.0%) | 0 (0.0%) |
| 5 to 17 Years | 0 (0.0%) | 0 (0.0%) |
| 18 to 34 Years | 0 (0.0%) | 0 (0.0%) |
| 35 to 64 Years | 113 (8.0%) | 32 (2.3%) |
| 65 to 74 Years | 45 (8.4%) | 146 (26.0%) |
| 75 Years and over | 5 (1.4%) | 62 (14.6%) |
Disability Class: Cognitive Difficulty
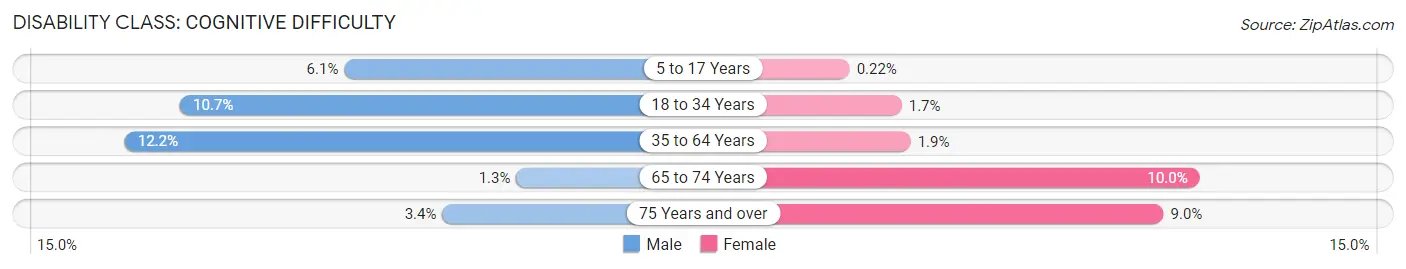
| Age Bracket | Male | Female |
| 5 to 17 Years | 39 (6.1%) | 1 (0.2%) |
| 18 to 34 Years | 65 (10.7%) | 11 (1.7%) |
| 35 to 64 Years | 172 (12.2%) | 27 (1.9%) |
| 65 to 74 Years | 7 (1.3%) | 56 (10.0%) |
| 75 Years and over | 12 (3.4%) | 38 (9.0%) |
Disability Class: Ambulatory Difficulty
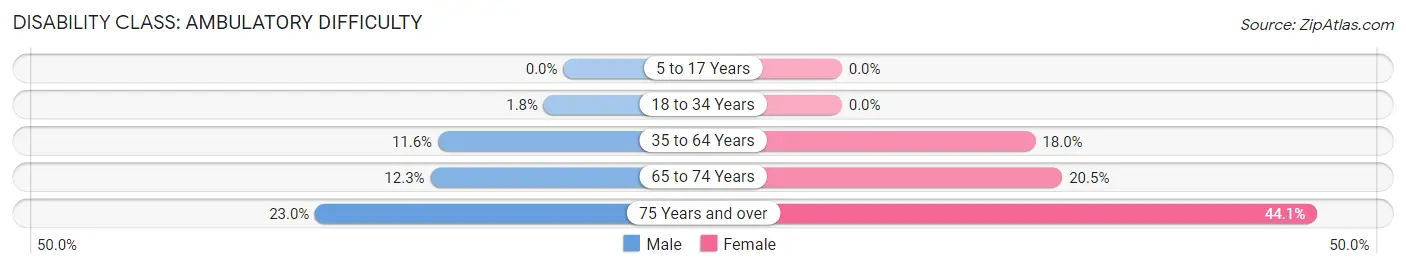
| Age Bracket | Male | Female |
| 5 to 17 Years | 0 (0.0%) | 0 (0.0%) |
| 18 to 34 Years | 11 (1.8%) | 0 (0.0%) |
| 35 to 64 Years | 164 (11.6%) | 253 (18.0%) |
| 65 to 74 Years | 66 (12.3%) | 115 (20.5%) |
| 75 Years and over | 82 (23.0%) | 187 (44.1%) |
Disability Class: Self-Care Difficulty
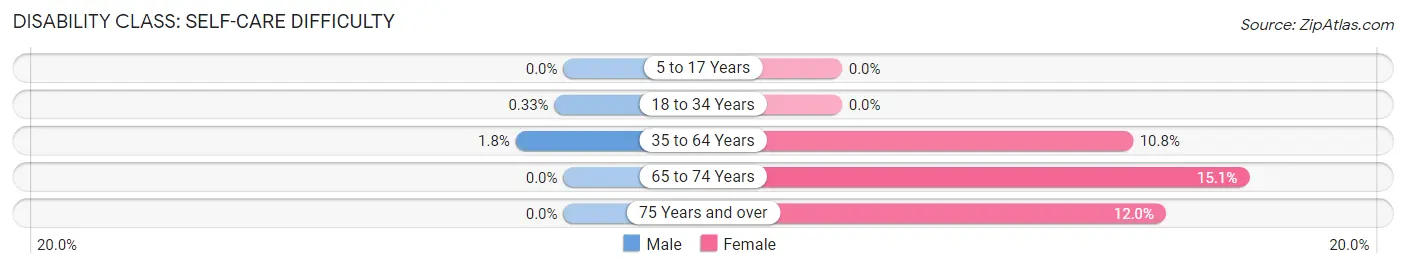
| Age Bracket | Male | Female |
| 5 to 17 Years | 0 (0.0%) | 0 (0.0%) |
| 18 to 34 Years | 2 (0.3%) | 0 (0.0%) |
| 35 to 64 Years | 25 (1.8%) | 152 (10.8%) |
| 65 to 74 Years | 0 (0.0%) | 85 (15.1%) |
| 75 Years and over | 0 (0.0%) | 51 (12.0%) |
Technology Access in Harney County
Computing Device Access in Harney County
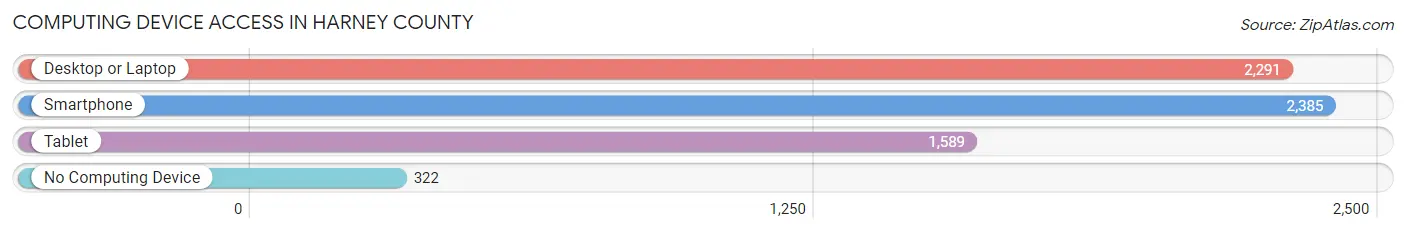
| Device Type | # Households | % Households |
| Desktop or Laptop | 2,291 | 73.9% |
| Smartphone | 2,385 | 76.9% |
| Tablet | 1,589 | 51.2% |
| No Computing Device | 322 | 10.4% |
| Total | 3,102 | 100.0% |
Internet Access in Harney County
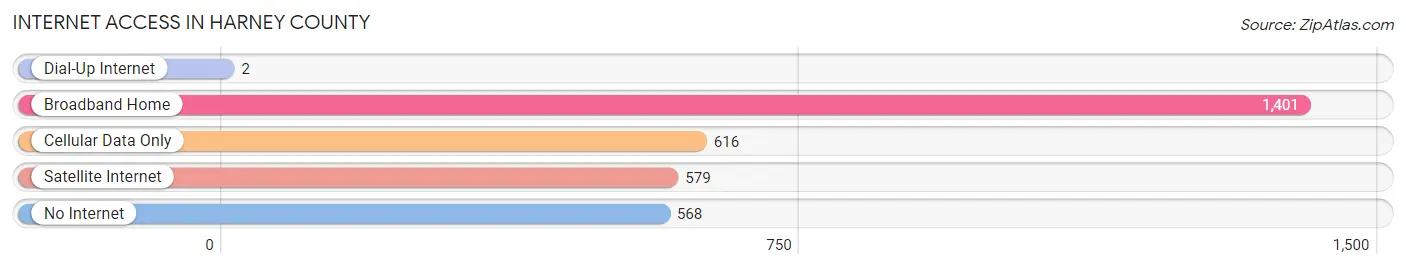
| Internet Type | # Households | % Households |
| Dial-Up Internet | 2 | 0.1% |
| Broadband Home | 1,401 | 45.2% |
| Cellular Data Only | 616 | 19.9% |
| Satellite Internet | 579 | 18.7% |
| No Internet | 568 | 18.3% |
| Total | 3,102 | 100.0% |
Harney County Summary
Harney County is located in the southeastern corner of Oregon, and is the largest county in the state. It is bordered by Grant, Malheur, Lake, and Baker counties. The county seat is Burns, and the largest city is Hines. The county was created in 1889 and named after William S. Harney, a general in the United States Army.
Geography
Harney County is located in the high desert of southeastern Oregon. It is the largest county in the state, covering an area of 10,228 square miles. The county is mostly flat, with elevations ranging from 4,000 to 6,000 feet. The terrain is mostly sagebrush and grassland, with some juniper and pine forests. The county is home to the Steens Mountain, a 9,733-foot peak in the Blue Mountains. The county is also home to the Malheur National Wildlife Refuge, which is a protected area for migratory birds and other wildlife.
The climate of Harney County is semi-arid, with hot summers and cold winters. The average annual precipitation is 8.5 inches, with most of it falling in the winter months.
Economy
The economy of Harney County is largely based on agriculture and ranching. Cattle ranching is the primary agricultural activity, and the county is home to some of the largest cattle ranches in the United States. The county is also home to several large hay farms, as well as some wheat and barley farms.
The county is also home to several timber companies, which harvest timber from the forests of the county. The county is also home to several mining operations, which extract minerals such as gold, silver, and copper.
The county is also home to several tourist attractions, including the Steens Mountain, the Malheur National Wildlife Refuge, and the Alvord Desert.
Demographics
As of the 2010 census, the population of Harney County was 7,422. The population is mostly white (90.2%), with small percentages of Native American (3.2%), Hispanic (2.2%), and Asian (1.2%) populations. The median household income is $37,813, and the median age is 44.
Conclusion
Harney County is a large, rural county in southeastern Oregon. It is home to a variety of industries, including agriculture, ranching, timber, and mining. The county is also home to several tourist attractions, including the Steens Mountain, the Malheur National Wildlife Refuge, and the Alvord Desert. The population of the county is mostly white, with small percentages of Native American, Hispanic, and Asian populations. The median household income is $37,813, and the median age is 44.
Common Questions
What is the Total Population of Harney County?
Total Population of Harney County is 7,496.
What is the Total Male Population of Harney County?
Total Male Population of Harney County is 3,792.
What is the Total Female Population of Harney County?
Total Female Population of Harney County is 3,704.
What is the Ratio of Males per 100 Females in Harney County?
There are 102.38 Males per 100 Females in Harney County.
What is the Ratio of Females per 100 Males in Harney County?
There are 97.68 Females per 100 Males in Harney County.
What is the Median Population Age in Harney County?
Median Population Age in Harney County is 45.5 Years.
What is the Average Family Size in Harney County
Average Family Size in Harney County is 2.9 People.
What is the Average Household Size in Harney County
Average Household Size in Harney County is 2.4 People.
What is Per Capita Income in Harney County?
Per Capita income in Harney County is $26,910.
What is the Median Family Income in Harney County?
Median Family Income in Harney County is $57,875.
What is the Median Household income in Harney County?
Median Household Income in Harney County is $45,462.
What is Income or Wage Gap in Harney County?
Income or Wage Gap in Harney County is 12.4%.
Women in Harney County earn 87.6 cents for every dollar earned by a man.
What is Inequality or Gini Index in Harney County?
Inequality or Gini Index in Harney County is 0.43.
How Large is the Labor Force in Harney County?
There are 3,323 People in the Labor Forcein in Harney County.
What is the Percentage of People in the Labor Force in Harney County?
54.0% of People are in the Labor Force in Harney County.
What is the Unemployment Rate in Harney County?
Unemployment Rate in Harney County is 5.4%.