Grant County, OR
Grant County Map
Grant County Overview
7,237
TOTAL POPULATION
3,672
MALE POPULATION
3,565
FEMALE POPULATION
103.00
MALES / 100 FEMALES
97.09
FEMALES / 100 MALES
51.7
MEDIAN AGE
2.6
AVG FAMILY SIZE
2.1
AVG HOUSEHOLD SIZE
$33,409
PER CAPITA INCOME
$67,003
AVG FAMILY INCOME
$56,045
AVG HOUSEHOLD INCOME
34.6%
WAGE / INCOME GAP [ % ]
65.4¢/ $1
WAGE / INCOME GAP [ $ ]
0.44
INEQUALITY / GINI INDEX
3,181
LABOR FORCE [ PEOPLE ]
51.7%
PERCENT IN LABOR FORCE
7.5%
UNEMPLOYMENT RATE
Grant County Area Codes
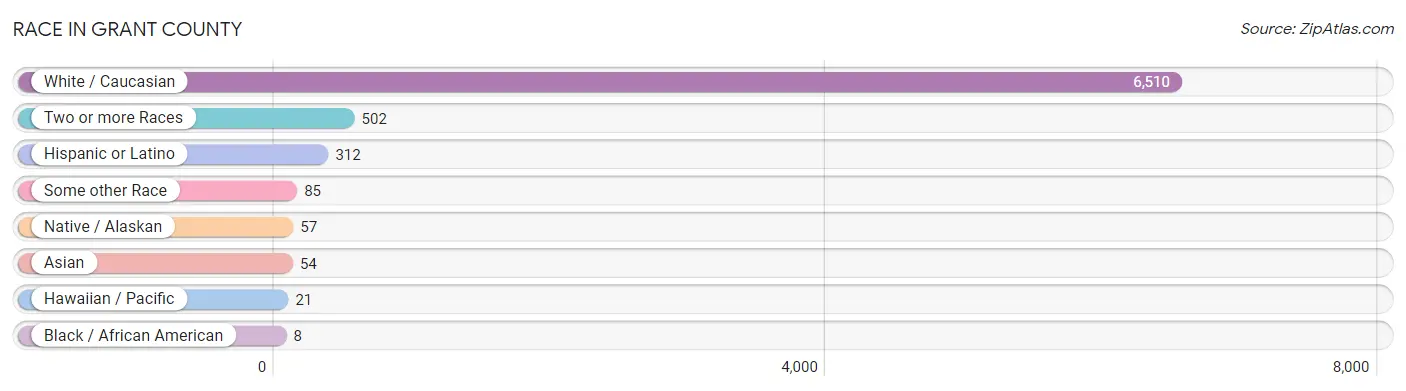
Race in Grant County
The most populous races in Grant County are White / Caucasian (6,510 | 89.9%), Two or more Races (502 | 6.9%), and Hispanic or Latino (312 | 4.3%).
| Race | # Population | % Population |
| Asian | 54 | 0.7% |
| Black / African American | 8 | 0.1% |
| Hawaiian / Pacific | 21 | 0.3% |
| Hispanic or Latino | 312 | 4.3% |
| Native / Alaskan | 57 | 0.8% |
| White / Caucasian | 6,510 | 89.9% |
| Two or more Races | 502 | 6.9% |
| Some other Race | 85 | 1.2% |
| Total | 7,237 | 100.0% |
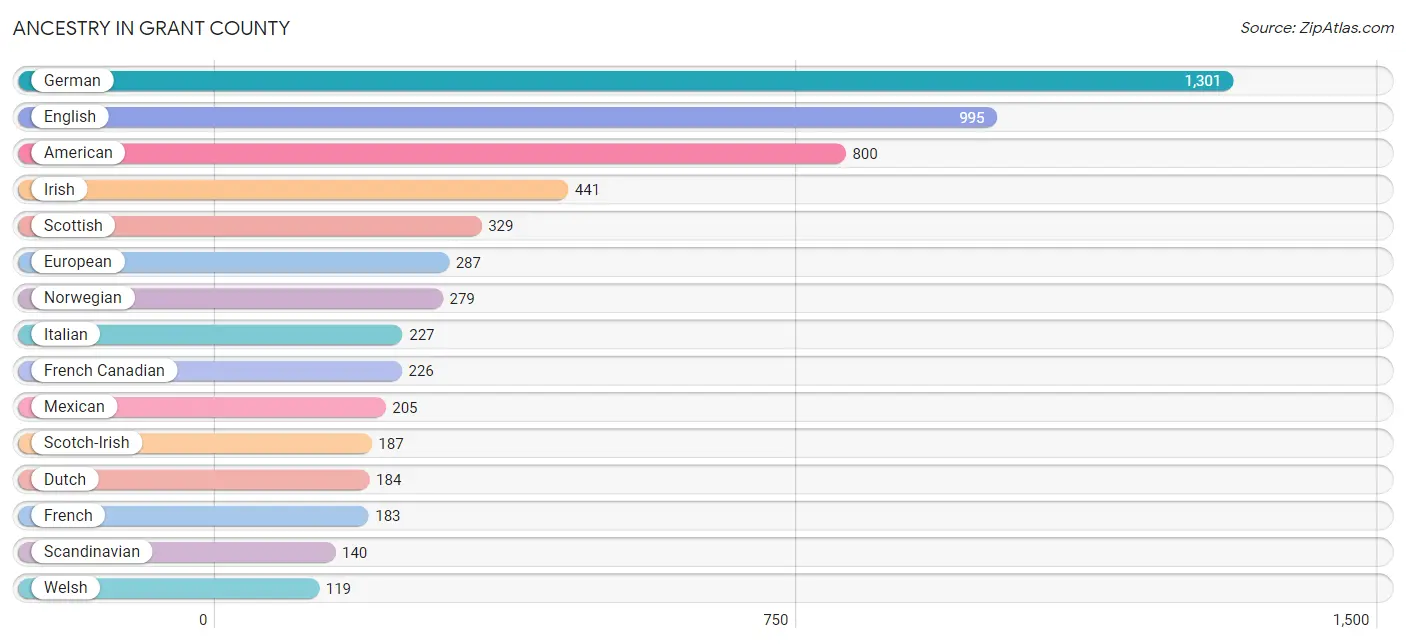
Ancestry in Grant County
The most populous ancestries reported in Grant County are German (1,301 | 18.0%), English (995 | 13.8%), American (800 | 11.1%), Irish (441 | 6.1%), and Scottish (329 | 4.5%), together accounting for 53.4% of all Grant County residents.
| Ancestry | # Population | % Population |
| American | 800 | 11.1% |
| Apache | 1 | 0.0% |
| Armenian | 17 | 0.2% |
| Bhutanese | 8 | 0.1% |
| British | 54 | 0.7% |
| Bulgarian | 8 | 0.1% |
| Burmese | 15 | 0.2% |
| Canadian | 10 | 0.1% |
| Celtic | 3 | 0.0% |
| Cherokee | 44 | 0.6% |
| Chippewa | 4 | 0.1% |
| Choctaw | 5 | 0.1% |
| Croatian | 12 | 0.2% |
| Czech | 32 | 0.4% |
| Danish | 81 | 1.1% |
| Dutch | 184 | 2.5% |
| Eastern European | 71 | 1.0% |
| English | 995 | 13.8% |
| European | 287 | 4.0% |
| Finnish | 36 | 0.5% |
| French | 183 | 2.5% |
| French Canadian | 226 | 3.1% |
| German | 1,301 | 18.0% |
| Greek | 5 | 0.1% |
| Hungarian | 19 | 0.3% |
| Indian (Asian) | 4 | 0.1% |
| Inupiat | 2 | 0.0% |
| Irish | 441 | 6.1% |
| Italian | 227 | 3.1% |
| Lumbee | 3 | 0.0% |
| Mexican | 205 | 2.8% |
| Mexican American Indian | 4 | 0.1% |
| Native Hawaiian | 24 | 0.3% |
| Navajo | 12 | 0.2% |
| Northern European | 11 | 0.2% |
| Norwegian | 279 | 3.9% |
| Pennsylvania German | 1 | 0.0% |
| Polish | 55 | 0.8% |
| Portuguese | 80 | 1.1% |
| Puerto Rican | 9 | 0.1% |
| Puget Sound Salish | 7 | 0.1% |
| Russian | 7 | 0.1% |
| Samoan | 10 | 0.1% |
| Scandinavian | 140 | 1.9% |
| Scotch-Irish | 187 | 2.6% |
| Scottish | 329 | 4.5% |
| Sioux | 8 | 0.1% |
| Slavic | 8 | 0.1% |
| South American | 1 | 0.0% |
| Spaniard | 3 | 0.0% |
| Spanish | 94 | 1.3% |
| Swedish | 106 | 1.5% |
| Swiss | 61 | 0.8% |
| Thai | 34 | 0.5% |
| Tlingit-Haida | 2 | 0.0% |
| Tohono O'Odham | 6 | 0.1% |
| Ukrainian | 4 | 0.1% |
| Uruguayan | 1 | 0.0% |
| Welsh | 119 | 1.6% |
| Yaqui | 4 | 0.1% |
| Yugoslavian | 8 | 0.1% | View All 61 Rows |
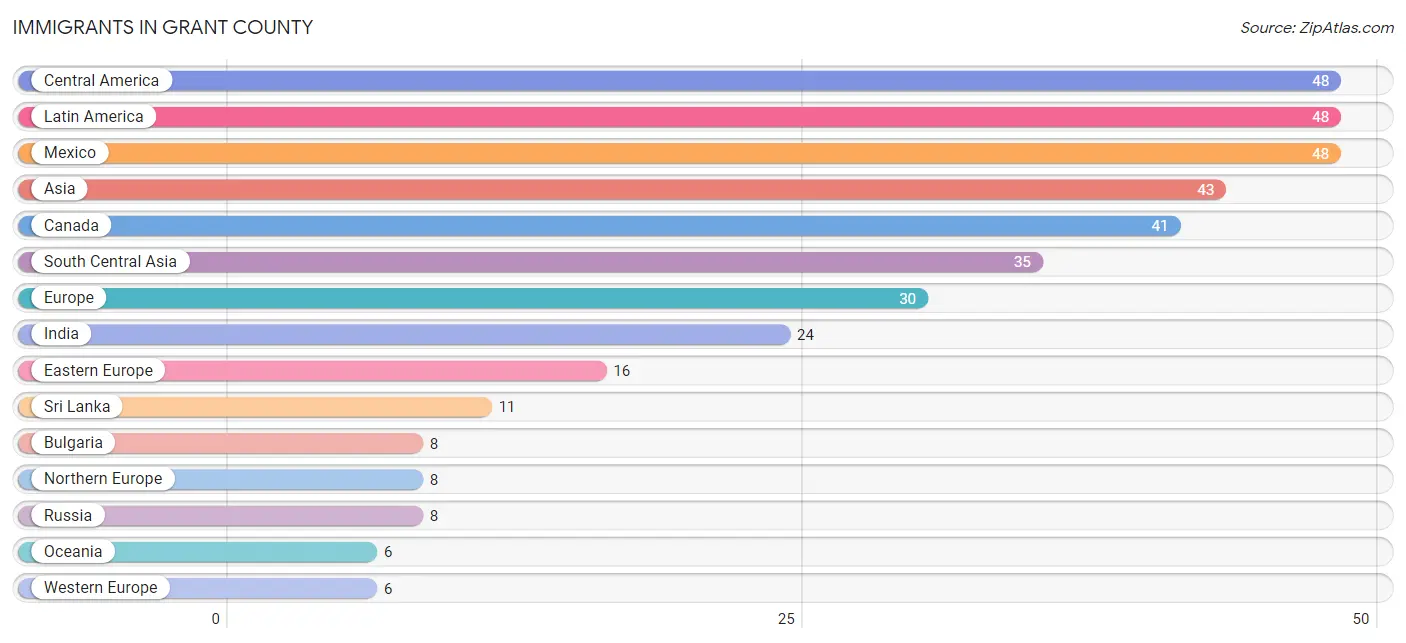
Immigrants in Grant County
The most numerous immigrant groups reported in Grant County came from Central America (48 | 0.7%), Latin America (48 | 0.7%), Mexico (48 | 0.7%), Asia (43 | 0.6%), and Canada (41 | 0.6%), together accounting for 3.1% of all Grant County residents.
| Immigration Origin | # Population | % Population |
| Africa | 3 | 0.0% |
| Asia | 43 | 0.6% |
| Bulgaria | 8 | 0.1% |
| Canada | 41 | 0.6% |
| Central America | 48 | 0.7% |
| China | 2 | 0.0% |
| Eastern Asia | 5 | 0.1% |
| Eastern Europe | 16 | 0.2% |
| England | 4 | 0.1% |
| Europe | 30 | 0.4% |
| France | 3 | 0.0% |
| Germany | 2 | 0.0% |
| Hong Kong | 2 | 0.0% |
| India | 24 | 0.3% |
| Korea | 3 | 0.0% |
| Latin America | 48 | 0.7% |
| Mexico | 48 | 0.7% |
| Netherlands | 1 | 0.0% |
| Northern Europe | 8 | 0.1% |
| Oceania | 6 | 0.1% |
| Russia | 8 | 0.1% |
| Singapore | 3 | 0.0% |
| South Africa | 3 | 0.0% |
| South Central Asia | 35 | 0.5% |
| South Eastern Asia | 3 | 0.0% |
| Sri Lanka | 11 | 0.2% |
| Western Europe | 6 | 0.1% | View All 27 Rows |
Sex and Age in Grant County
Sex and Age in Grant County
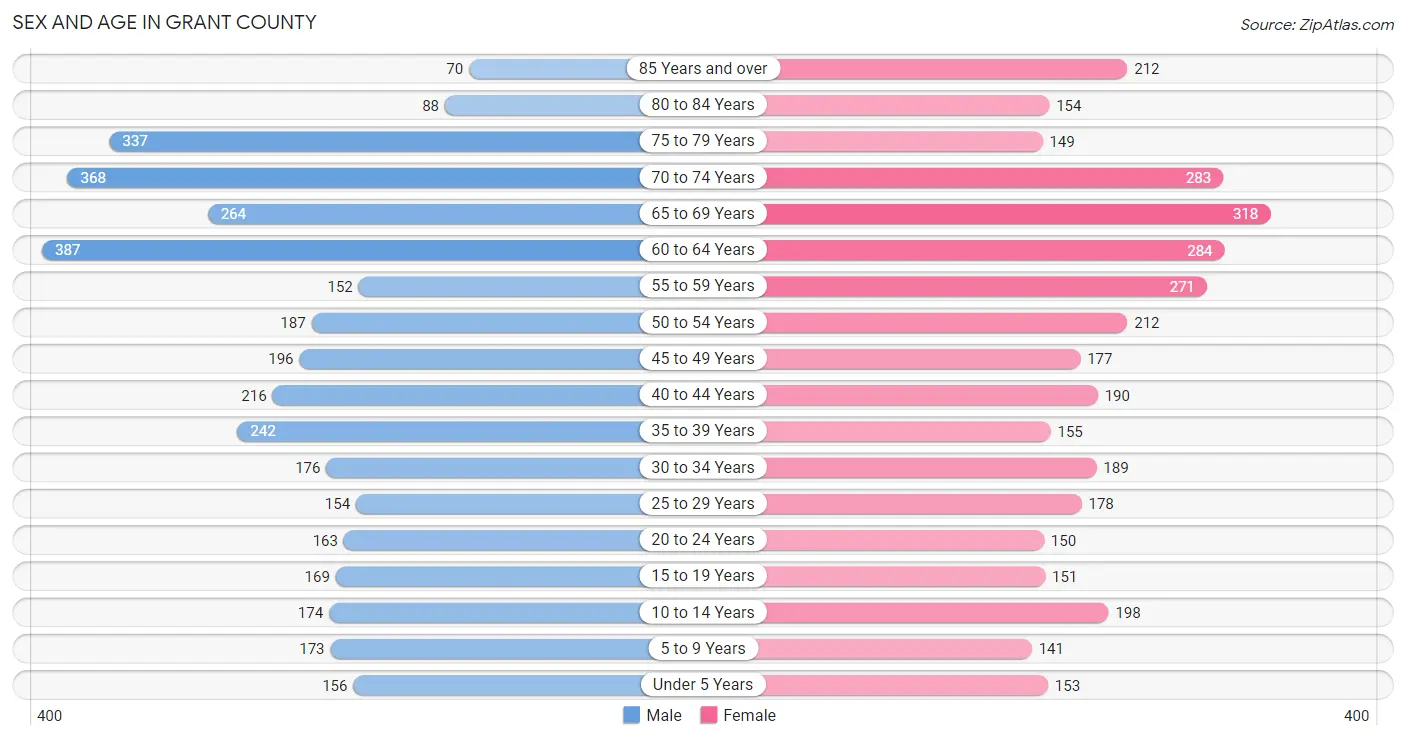
The most populous age groups in Grant County are 60 to 64 Years (387 | 10.5%) for men and 65 to 69 Years (318 | 8.9%) for women.
| Age Bracket | Male | Female |
| Under 5 Years | 156 (4.3%) | 153 (4.3%) |
| 5 to 9 Years | 173 (4.7%) | 141 (4.0%) |
| 10 to 14 Years | 174 (4.7%) | 198 (5.6%) |
| 15 to 19 Years | 169 (4.6%) | 151 (4.2%) |
| 20 to 24 Years | 163 (4.4%) | 150 (4.2%) |
| 25 to 29 Years | 154 (4.2%) | 178 (5.0%) |
| 30 to 34 Years | 176 (4.8%) | 189 (5.3%) |
| 35 to 39 Years | 242 (6.6%) | 155 (4.3%) |
| 40 to 44 Years | 216 (5.9%) | 190 (5.3%) |
| 45 to 49 Years | 196 (5.3%) | 177 (5.0%) |
| 50 to 54 Years | 187 (5.1%) | 212 (5.9%) |
| 55 to 59 Years | 152 (4.1%) | 271 (7.6%) |
| 60 to 64 Years | 387 (10.5%) | 284 (8.0%) |
| 65 to 69 Years | 264 (7.2%) | 318 (8.9%) |
| 70 to 74 Years | 368 (10.0%) | 283 (7.9%) |
| 75 to 79 Years | 337 (9.2%) | 149 (4.2%) |
| 80 to 84 Years | 88 (2.4%) | 154 (4.3%) |
| 85 Years and over | 70 (1.9%) | 212 (5.9%) |
| Total | 3,672 (100.0%) | 3,565 (100.0%) |
Families and Households in Grant County
Median Family Size in Grant County
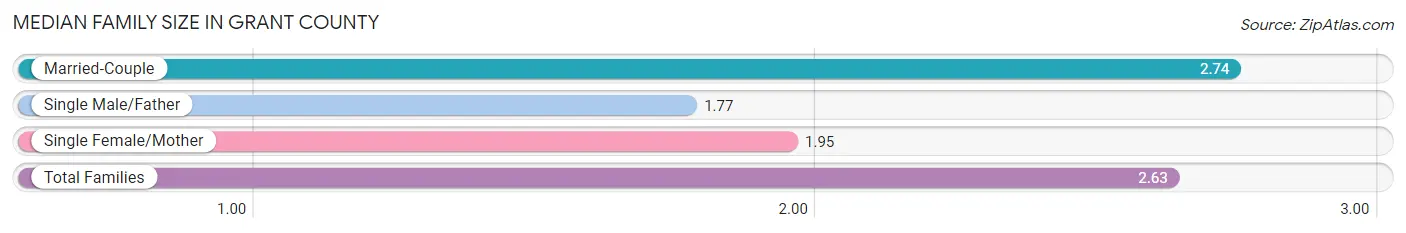
The median family size in Grant County is 2.63 persons per family, with married-couple families (1,699 | 86.2%) accounting for the largest median family size of 2.74 persons per family. On the other hand, single male/father families (86 | 4.4%) represent the smallest median family size with 1.77 persons per family.
| Family Type | # Families | Family Size |
| Married-Couple | 1,699 (86.2%) | 2.74 |
| Single Male/Father | 86 (4.4%) | 1.77 |
| Single Female/Mother | 186 (9.4%) | 1.95 |
| Total Families | 1,971 (100.0%) | 2.63 |
Median Household Size in Grant County
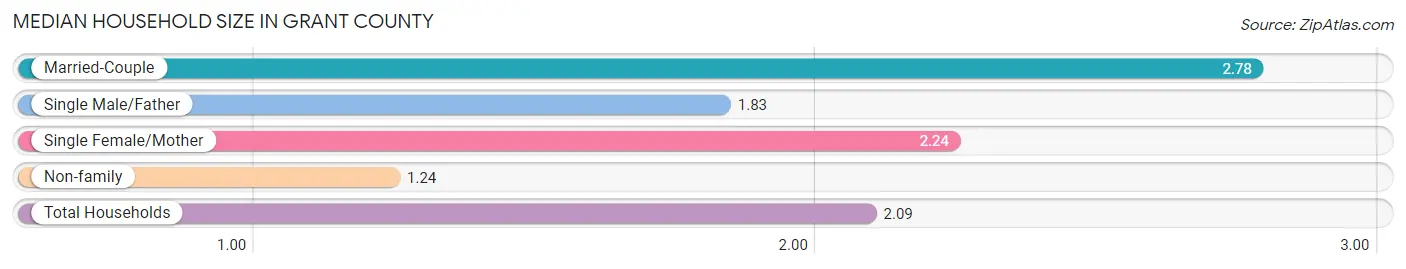
The median household size in Grant County is 2.09 persons per household, with married-couple households (1,699 | 50.4%) accounting for the largest median household size of 2.78 persons per household. non-family households (1,397 | 41.5%) represent the smallest median household size with 1.24 persons per household.
| Household Type | # Households | Household Size |
| Married-Couple | 1,699 (50.4%) | 2.78 |
| Single Male/Father | 86 (2.5%) | 1.83 |
| Single Female/Mother | 186 (5.5%) | 2.24 |
| Non-family | 1,397 (41.5%) | 1.24 |
| Total Households | 3,368 (100.0%) | 2.09 |
Household Size by Marriage Status in Grant County
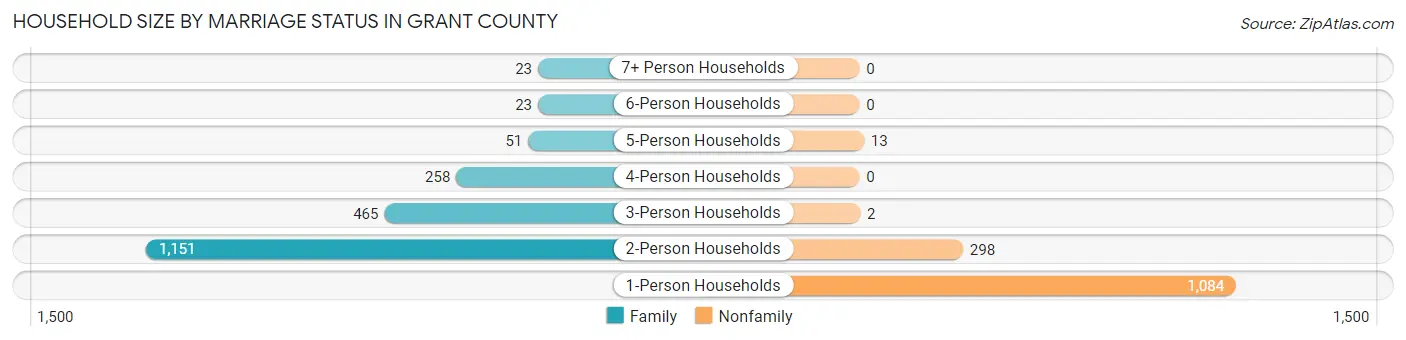
Out of a total of 3,368 households in Grant County, 1,971 (58.5%) are family households, while 1,397 (41.5%) are nonfamily households. The most numerous type of family households are 2-person households, comprising 1,151, and the most common type of nonfamily households are 1-person households, comprising 1,084.
| Household Size | Family Households | Nonfamily Households |
| 1-Person Households | - | 1,084 (32.2%) |
| 2-Person Households | 1,151 (34.2%) | 298 (8.8%) |
| 3-Person Households | 465 (13.8%) | 2 (0.1%) |
| 4-Person Households | 258 (7.7%) | 0 (0.0%) |
| 5-Person Households | 51 (1.5%) | 13 (0.4%) |
| 6-Person Households | 23 (0.7%) | 0 (0.0%) |
| 7+ Person Households | 23 (0.7%) | 0 (0.0%) |
| Total | 1,971 (58.5%) | 1,397 (41.5%) |
Female Fertility in Grant County
Fertility by Age in Grant County
Average fertility rate in Grant County is 57.0 births per 1,000 women. Women in the age bracket of 20 to 34 years have the highest fertility rate with 97.0 births per 1,000 women. Women in the age bracket of 20 to 34 years acount for 72.5% of all women with births.
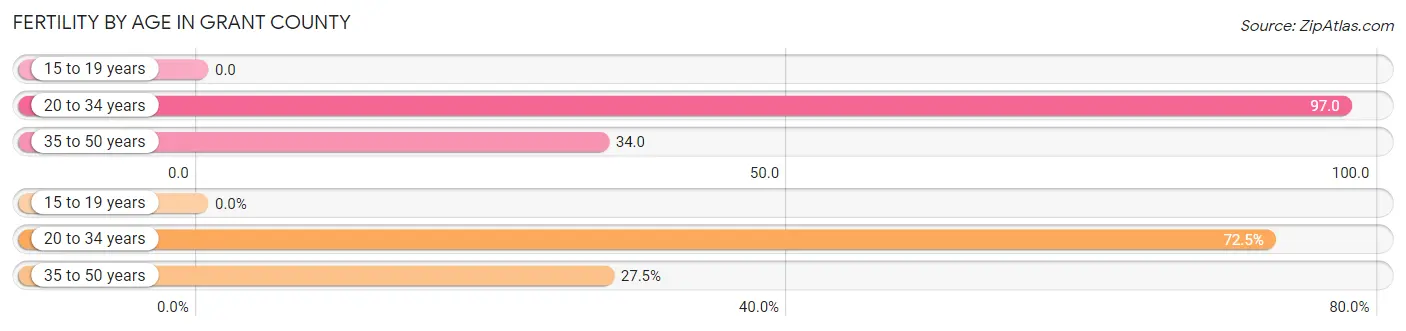
| Age Bracket | Women with Births | Births / 1,000 Women |
| 15 to 19 years | 0 (0.0%) | 0.0 |
| 20 to 34 years | 50 (72.5%) | 97.0 |
| 35 to 50 years | 19 (27.5%) | 34.0 |
| Total | 69 (100.0%) | 57.0 |
Fertility by Age by Marriage Status in Grant County
92.8% of women with births (69) in Grant County are married. The highest percentage of unmarried women with births falls into 20 to 34 years age bracket with 8.0% of them unmarried at the time of birth, while the lowest percentage of unmarried women with births belong to 35 to 50 years age bracket with 5.3% of them unmarried.
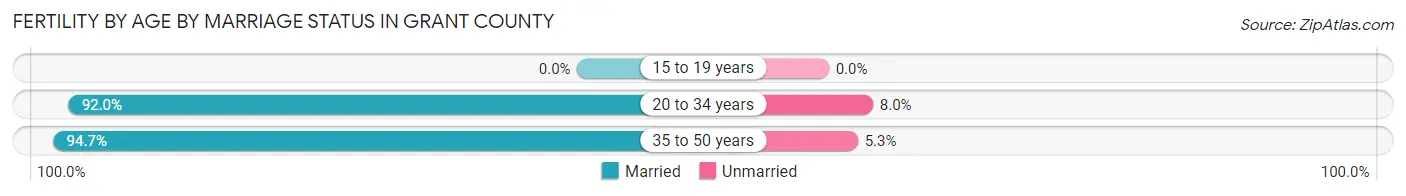
| Age Bracket | Married | Unmarried |
| 15 to 19 years | 0 (0.0%) | 0 (0.0%) |
| 20 to 34 years | 46 (92.0%) | 4 (8.0%) |
| 35 to 50 years | 18 (94.7%) | 1 (5.3%) |
| Total | 64 (92.7%) | 5 (7.2%) |
Fertility by Education in Grant County
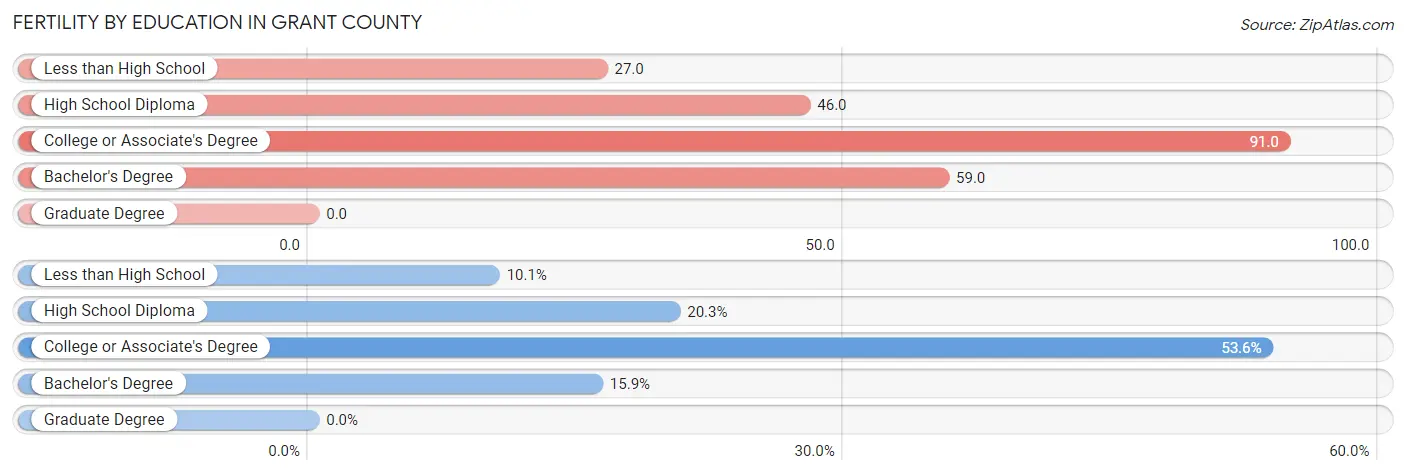
| Educational Attainment | Women with Births | Births / 1,000 Women |
| Less than High School | 7 (10.1%) | 27.0 |
| High School Diploma | 14 (20.3%) | 46.0 |
| College or Associate's Degree | 37 (53.6%) | 91.0 |
| Bachelor's Degree | 11 (15.9%) | 59.0 |
| Graduate Degree | 0 (0.0%) | 0.0 |
| Total | 69 (100.0%) | 57.0 |
Fertility by Education by Marriage Status in Grant County
7.2% of women with births in Grant County are unmarried. Women with the educational attainment of college or associate's degree are most likely to be married with 100.0% of them married at childbirth, while women with the educational attainment of less than high school are least likely to be married with 57.1% of them unmarried at childbirth.
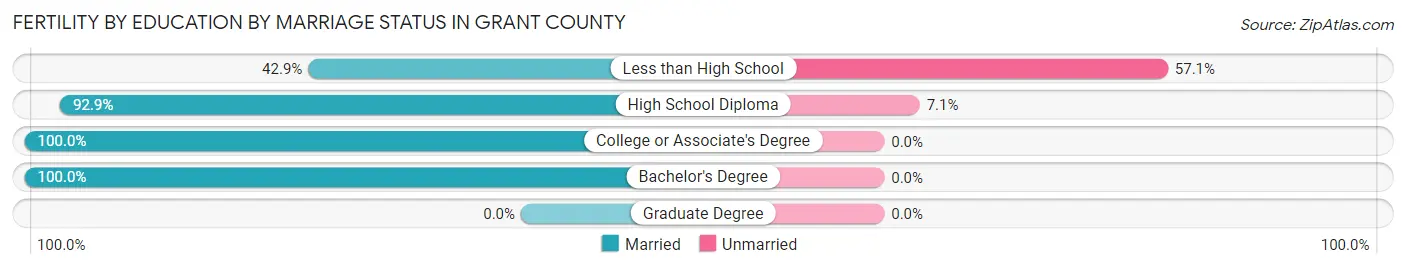
| Educational Attainment | Married | Unmarried |
| Less than High School | 3 (42.9%) | 4 (57.1%) |
| High School Diploma | 13 (92.9%) | 1 (7.1%) |
| College or Associate's Degree | 37 (100.0%) | 0 (0.0%) |
| Bachelor's Degree | 11 (100.0%) | 0 (0.0%) |
| Graduate Degree | 0 (0.0%) | 0 (0.0%) |
| Total | 64 (92.7%) | 5 (7.2%) |
Income in Grant County
Income Overview in Grant County
Per Capita Income in Grant County is $33,409, while median incomes of families and households are $67,003 and $56,045 respectively.
| Characteristic | Number | Measure |
| Per Capita Income | 7,237 | $33,409 |
| Median Family Income | 1,971 | $67,003 |
| Mean Family Income | 1,971 | $89,371 |
| Median Household Income | 3,368 | $56,045 |
| Mean Household Income | 3,368 | $72,405 |
| Income Deficit | 1,971 | $0 |
| Wage / Income Gap (%) | 7,237 | 34.63% |
| Wage / Income Gap ($) | 7,237 | 65.37¢ per $1 |
| Gini / Inequality Index | 7,237 | 0.44 |
Earnings by Sex in Grant County
Average Earnings in Grant County are $34,399, $42,794 for men and $27,974 for women, a difference of 34.6%.
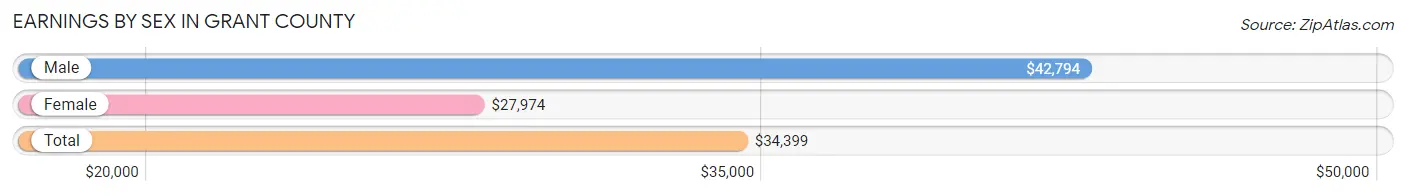
| Sex | Number | Average Earnings |
| Male | 1,842 (52.3%) | $42,794 |
| Female | 1,682 (47.7%) | $27,974 |
| Total | 3,524 (100.0%) | $34,399 |
Earnings by Sex by Income Bracket in Grant County
The most common earnings brackets in Grant County are $75,000 to $99,999 for men (228 | 12.4%) and $35,000 to $39,999 for women (162 | 9.6%).
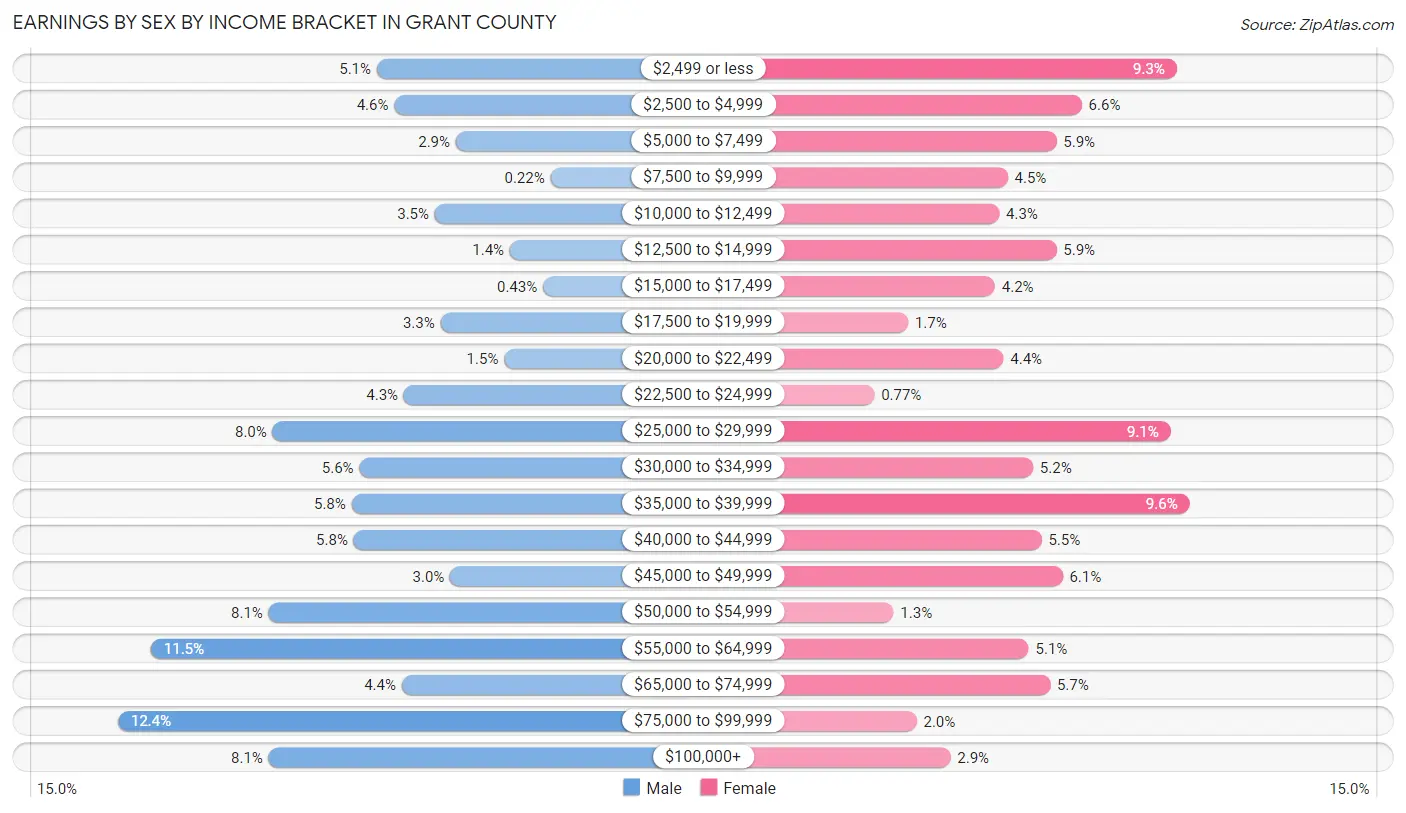
| Income | Male | Female |
| $2,499 or less | 94 (5.1%) | 156 (9.3%) |
| $2,500 to $4,999 | 85 (4.6%) | 111 (6.6%) |
| $5,000 to $7,499 | 53 (2.9%) | 99 (5.9%) |
| $7,500 to $9,999 | 4 (0.2%) | 76 (4.5%) |
| $10,000 to $12,499 | 64 (3.5%) | 72 (4.3%) |
| $12,500 to $14,999 | 25 (1.4%) | 99 (5.9%) |
| $15,000 to $17,499 | 8 (0.4%) | 70 (4.2%) |
| $17,500 to $19,999 | 61 (3.3%) | 29 (1.7%) |
| $20,000 to $22,499 | 28 (1.5%) | 74 (4.4%) |
| $22,500 to $24,999 | 80 (4.3%) | 13 (0.8%) |
| $25,000 to $29,999 | 148 (8.0%) | 153 (9.1%) |
| $30,000 to $34,999 | 103 (5.6%) | 88 (5.2%) |
| $35,000 to $39,999 | 107 (5.8%) | 162 (9.6%) |
| $40,000 to $44,999 | 106 (5.8%) | 92 (5.5%) |
| $45,000 to $49,999 | 56 (3.0%) | 102 (6.1%) |
| $50,000 to $54,999 | 150 (8.1%) | 22 (1.3%) |
| $55,000 to $64,999 | 211 (11.5%) | 86 (5.1%) |
| $65,000 to $74,999 | 81 (4.4%) | 96 (5.7%) |
| $75,000 to $99,999 | 228 (12.4%) | 33 (2.0%) |
| $100,000+ | 150 (8.1%) | 49 (2.9%) |
| Total | 1,842 (100.0%) | 1,682 (100.0%) |
Earnings by Sex by Educational Attainment in Grant County
Average earnings in Grant County are $49,844 for men and $28,640 for women, a difference of 42.5%. Men with an educational attainment of bachelor's degree enjoy the highest average annual earnings of $61,354, while those with graduate degree education earn the least with $33,036. Women with an educational attainment of graduate degree earn the most with the average annual earnings of $59,375, while those with college or associate's degree education have the smallest earnings of $21,389.
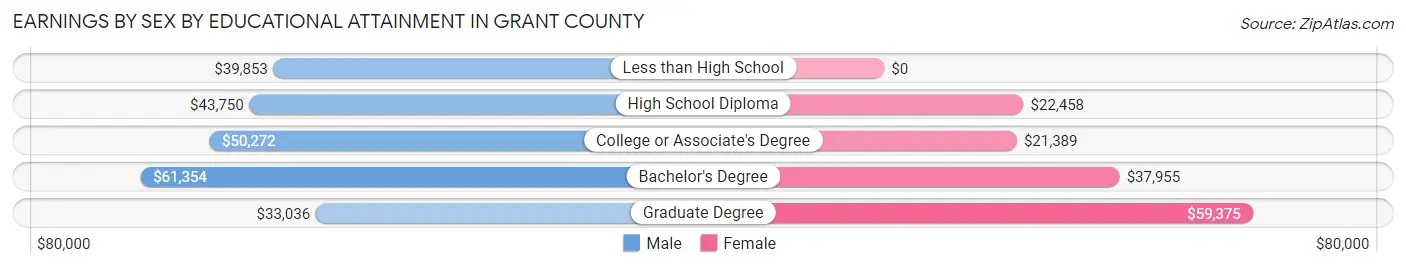
| Educational Attainment | Male Income | Female Income |
| Less than High School | $39,853 | $0 |
| High School Diploma | $43,750 | $22,458 |
| College or Associate's Degree | $50,272 | $21,389 |
| Bachelor's Degree | $61,354 | $37,955 |
| Graduate Degree | $33,036 | $59,375 |
| Total | $49,844 | $28,640 |
Family Income in Grant County
Family Income Brackets in Grant County
According to the Grant County family income data, there are 540 families falling into the $50,000 to $74,999 income range, which is the most common income bracket and makes up 27.4% of all families. Conversely, the less than $10,000 income bracket is the least frequent group with only 47 families (2.4%) belonging to this category.
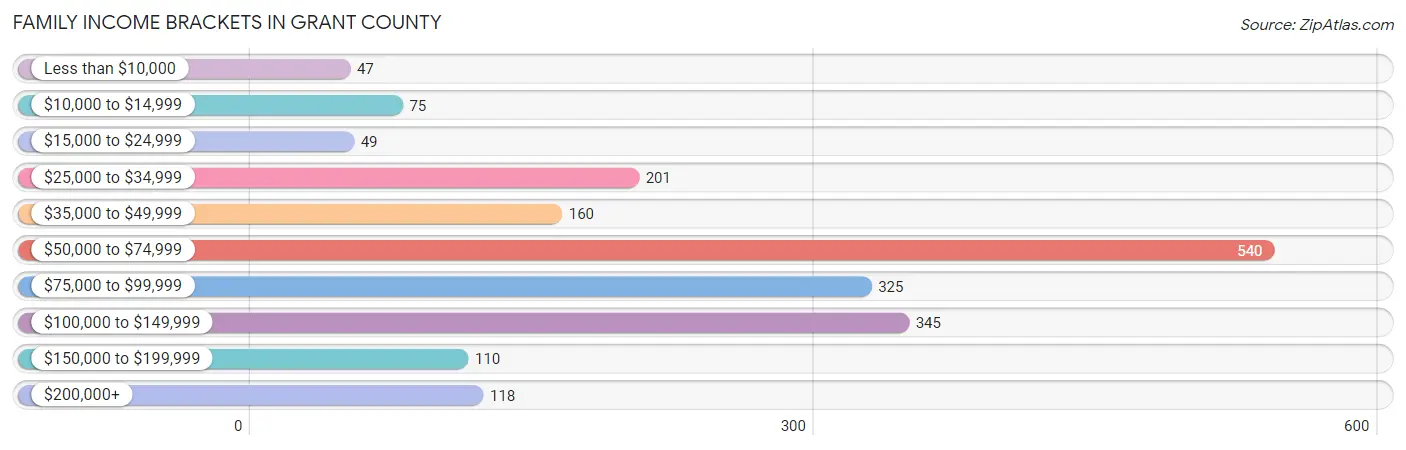
| Income Bracket | # Families | % Families |
| Less than $10,000 | 47 | 2.4% |
| $10,000 to $14,999 | 75 | 3.8% |
| $15,000 to $24,999 | 49 | 2.5% |
| $25,000 to $34,999 | 201 | 10.2% |
| $35,000 to $49,999 | 160 | 8.1% |
| $50,000 to $74,999 | 540 | 27.4% |
| $75,000 to $99,999 | 325 | 16.5% |
| $100,000 to $149,999 | 345 | 17.5% |
| $150,000 to $199,999 | 110 | 5.6% |
| $200,000+ | 118 | 6.0% |
Family Income by Famaliy Size in Grant County
7+ person families (16 | 0.8%) account for the highest median family income in Grant County with $135,000 per family, while 2-person families (1,206 | 61.2%) have the highest median income of $30,758 per family member.
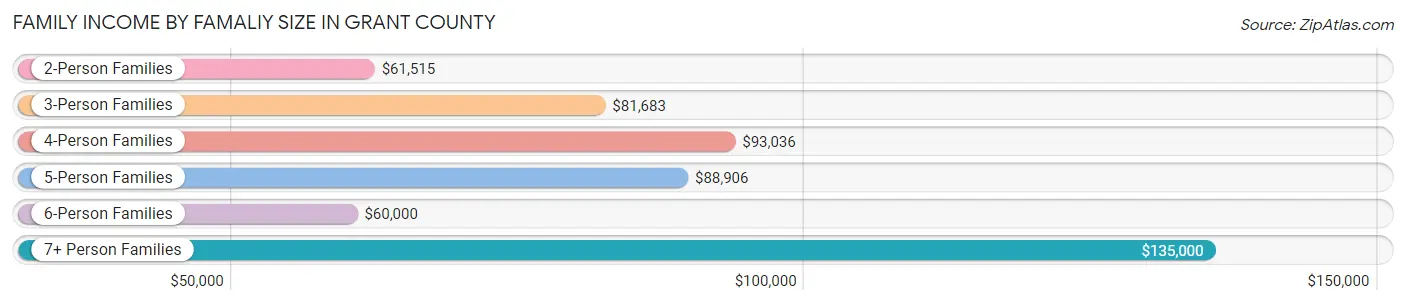
| Income Bracket | # Families | Median Income |
| 2-Person Families | 1,206 (61.2%) | $61,515 |
| 3-Person Families | 415 (21.1%) | $81,683 |
| 4-Person Families | 253 (12.8%) | $93,036 |
| 5-Person Families | 51 (2.6%) | $88,906 |
| 6-Person Families | 30 (1.5%) | $60,000 |
| 7+ Person Families | 16 (0.8%) | $135,000 |
| Total | 1,971 (100.0%) | $67,003 |
Family Income by Number of Earners in Grant County
The median family income in Grant County is $67,003, with families comprising 3+ earners (232) having the highest median family income of $104,052, while families with no earners (517) have the lowest median family income of $52,956, accounting for 11.8% and 26.2% of families, respectively.
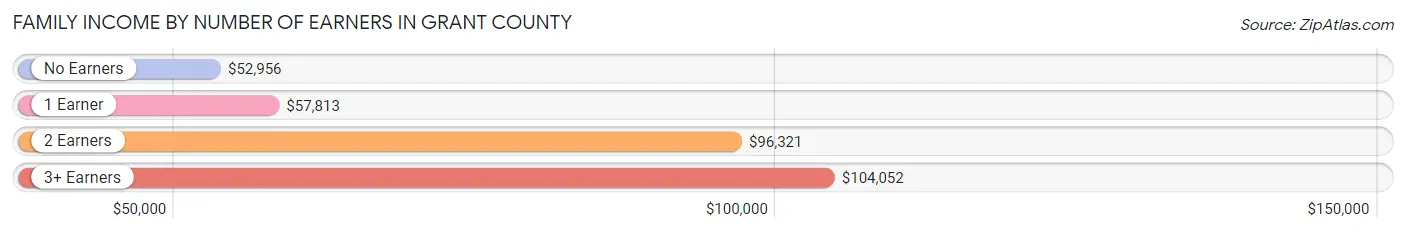
| Number of Earners | # Families | Median Income |
| No Earners | 517 (26.2%) | $52,956 |
| 1 Earner | 491 (24.9%) | $57,813 |
| 2 Earners | 731 (37.1%) | $96,321 |
| 3+ Earners | 232 (11.8%) | $104,052 |
| Total | 1,971 (100.0%) | $67,003 |
Household Income in Grant County
Household Income Brackets in Grant County
With 647 households falling in the category, the $50,000 to $74,999 income range is the most frequent in Grant County, accounting for 19.2% of all households. In contrast, only 125 households (3.7%) fall into the $200,000+ income bracket, making it the least populous group.
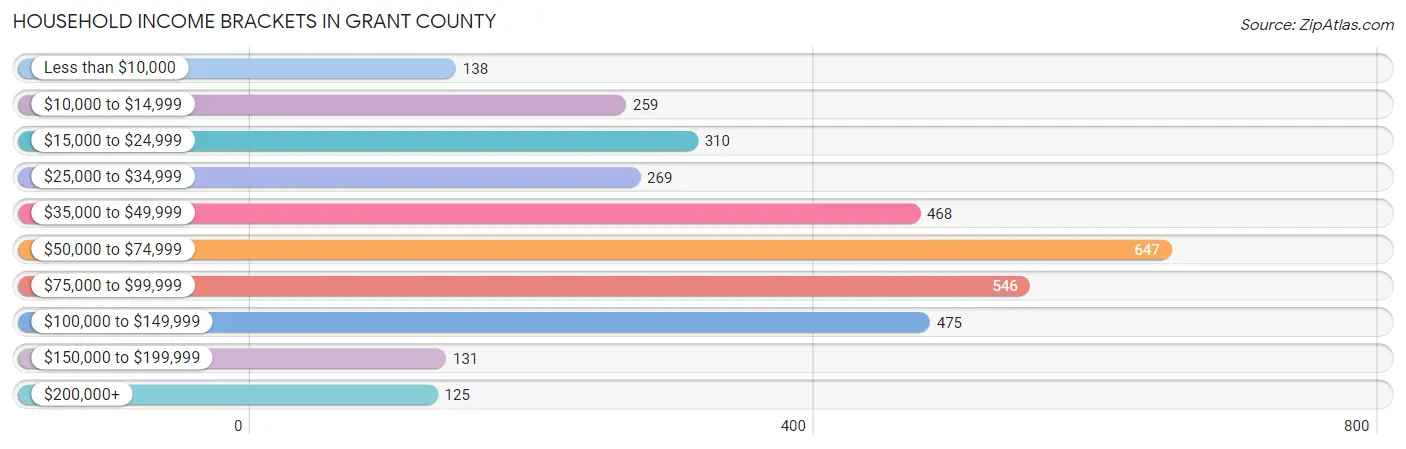
| Income Bracket | # Households | % Households |
| Less than $10,000 | 138 | 4.1% |
| $10,000 to $14,999 | 259 | 7.7% |
| $15,000 to $24,999 | 310 | 9.2% |
| $25,000 to $34,999 | 269 | 8.0% |
| $35,000 to $49,999 | 468 | 13.9% |
| $50,000 to $74,999 | 647 | 19.2% |
| $75,000 to $99,999 | 546 | 16.2% |
| $100,000 to $149,999 | 475 | 14.1% |
| $150,000 to $199,999 | 131 | 3.9% |
| $200,000+ | 125 | 3.7% |
Household Income by Householder Age in Grant County
The median household income in Grant County is $56,045, with the highest median household income of $80,655 found in the 25 to 44 years age bracket for the primary householder. A total of 717 households (21.3%) fall into this category. Meanwhile, the 15 to 24 years age bracket for the primary householder has the lowest median household income of $47,292, with 87 households (2.6%) in this group.
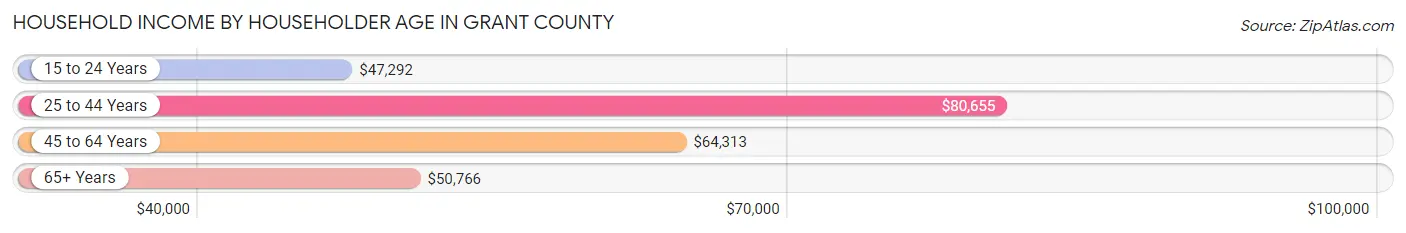
| Income Bracket | # Households | Median Income |
| 15 to 24 Years | 87 (2.6%) | $47,292 |
| 25 to 44 Years | 717 (21.3%) | $80,655 |
| 45 to 64 Years | 1,101 (32.7%) | $64,313 |
| 65+ Years | 1,463 (43.4%) | $50,766 |
| Total | 3,368 (100.0%) | $56,045 |
Poverty in Grant County
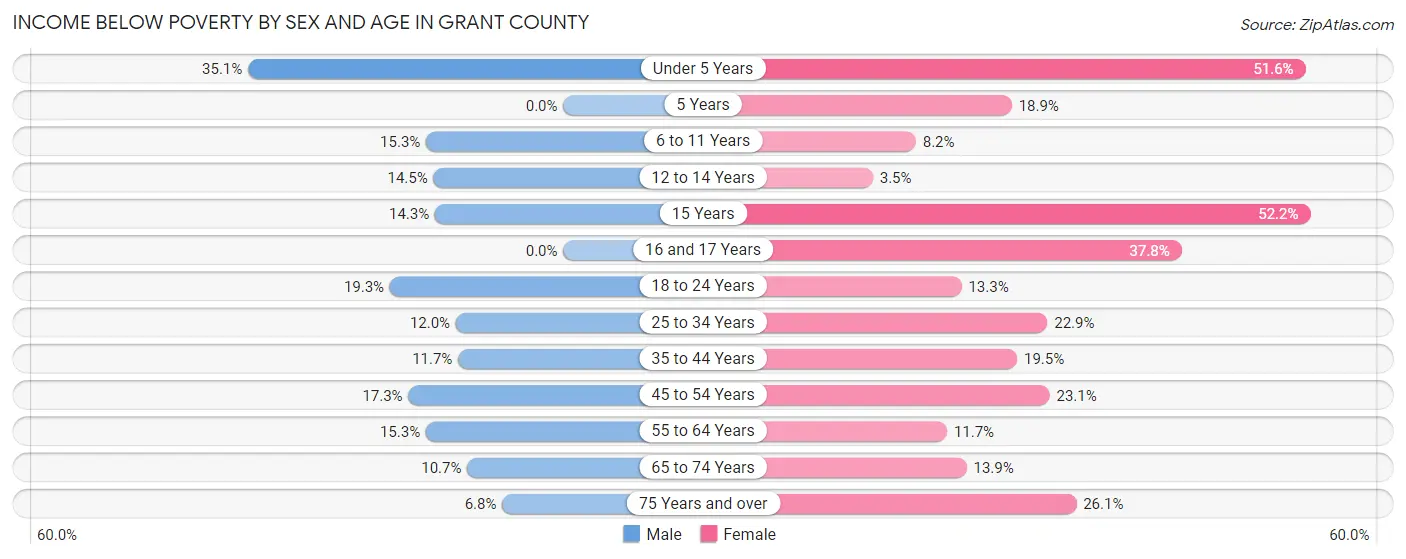
Income Below Poverty by Sex and Age in Grant County
With 13.2% poverty level for males and 19.8% for females among the residents of Grant County, under 5 year old males and 15 year old females are the most vulnerable to poverty, with 46 males (35.1%) and 36 females (52.2%) in their respective age groups living below the poverty level.
| Age Bracket | Male | Female |
| Under 5 Years | 46 (35.1%) | 79 (51.6%) |
| 5 Years | 0 (0.0%) | 7 (18.9%) |
| 6 to 11 Years | 33 (15.3%) | 14 (8.2%) |
| 12 to 14 Years | 12 (14.5%) | 4 (3.5%) |
| 15 Years | 3 (14.3%) | 36 (52.2%) |
| 16 and 17 Years | 0 (0.0%) | 14 (37.8%) |
| 18 to 24 Years | 39 (19.3%) | 26 (13.3%) |
| 25 to 34 Years | 39 (12.0%) | 84 (22.9%) |
| 35 to 44 Years | 52 (11.7%) | 65 (19.5%) |
| 45 to 54 Years | 64 (17.2%) | 90 (23.1%) |
| 55 to 64 Years | 82 (15.3%) | 65 (11.7%) |
| 65 to 74 Years | 67 (10.7%) | 81 (13.9%) |
| 75 Years and over | 33 (6.8%) | 129 (26.1%) |
| Total | 470 (13.2%) | 694 (19.8%) |
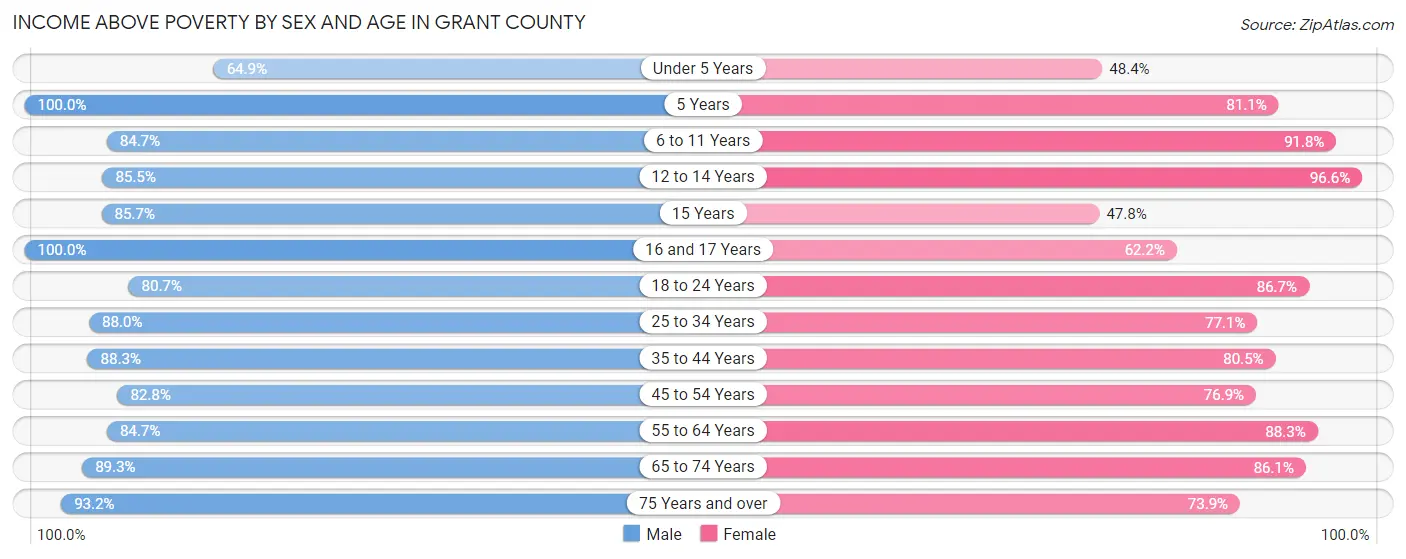
Income Above Poverty by Sex and Age in Grant County
According to the poverty statistics in Grant County, males aged 5 years and females aged 12 to 14 years are the age groups that are most secure financially, with 100.0% of males and 96.6% of females in these age groups living above the poverty line.
| Age Bracket | Male | Female |
| Under 5 Years | 85 (64.9%) | 74 (48.4%) |
| 5 Years | 11 (100.0%) | 30 (81.1%) |
| 6 to 11 Years | 183 (84.7%) | 156 (91.8%) |
| 12 to 14 Years | 71 (85.5%) | 112 (96.6%) |
| 15 Years | 18 (85.7%) | 33 (47.8%) |
| 16 and 17 Years | 109 (100.0%) | 23 (62.2%) |
| 18 to 24 Years | 163 (80.7%) | 169 (86.7%) |
| 25 to 34 Years | 287 (88.0%) | 283 (77.1%) |
| 35 to 44 Years | 392 (88.3%) | 268 (80.5%) |
| 45 to 54 Years | 307 (82.8%) | 299 (76.9%) |
| 55 to 64 Years | 454 (84.7%) | 490 (88.3%) |
| 65 to 74 Years | 559 (89.3%) | 502 (86.1%) |
| 75 Years and over | 452 (93.2%) | 365 (73.9%) |
| Total | 3,091 (86.8%) | 2,804 (80.2%) |
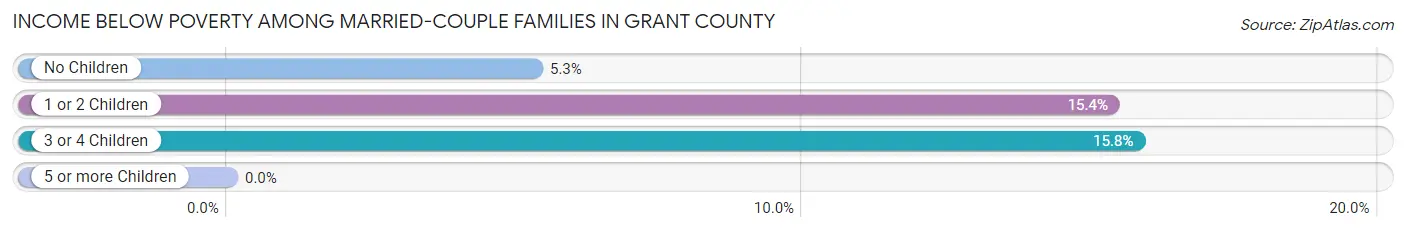
Income Below Poverty Among Married-Couple Families in Grant County
The poverty statistics for married-couple families in Grant County show that 8.1% or 138 of the total 1,699 families live below the poverty line. Families with 3 or 4 children have the highest poverty rate of 15.8%, comprising of 9 families. On the other hand, families with no children have the lowest poverty rate of 5.3%, which includes 65 families.
| Children | Above Poverty | Below Poverty |
| No Children | 1,160 (94.7%) | 65 (5.3%) |
| 1 or 2 Children | 353 (84.7%) | 64 (15.3%) |
| 3 or 4 Children | 48 (84.2%) | 9 (15.8%) |
| 5 or more Children | 0 (0.0%) | 0 (0.0%) |
| Total | 1,561 (91.9%) | 138 (8.1%) |
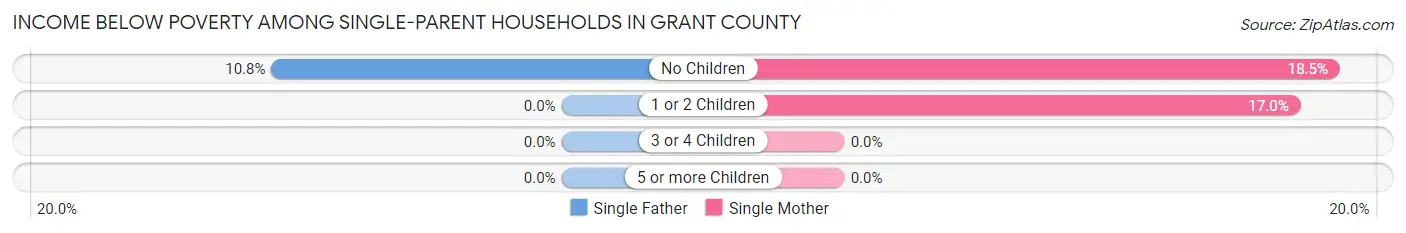
Income Below Poverty Among Single-Parent Households in Grant County
According to the poverty data in Grant County, 9.3% or 8 single-father households and 17.7% or 33 single-mother households are living below the poverty line. Among single-father households, those with no children have the highest poverty rate, with 8 households (10.8%) experiencing poverty. Likewise, among single-mother households, those with no children have the highest poverty rate, with 17 households (18.5%) falling below the poverty line.
| Children | Single Father | Single Mother |
| No Children | 8 (10.8%) | 17 (18.5%) |
| 1 or 2 Children | 0 (0.0%) | 16 (17.0%) |
| 3 or 4 Children | 0 (0.0%) | 0 (0.0%) |
| 5 or more Children | 0 (0.0%) | 0 (0.0%) |
| Total | 8 (9.3%) | 33 (17.7%) |
Income Below Poverty Among Married-Couple vs Single-Parent Households in Grant County
The poverty data for Grant County shows that 138 of the married-couple family households (8.1%) and 41 of the single-parent households (15.1%) are living below the poverty level. Within the married-couple family households, those with 3 or 4 children have the highest poverty rate, with 9 households (15.8%) falling below the poverty line. Among the single-parent households, those with 1 or 2 children have the highest poverty rate, with 16 household (15.1%) living below poverty.
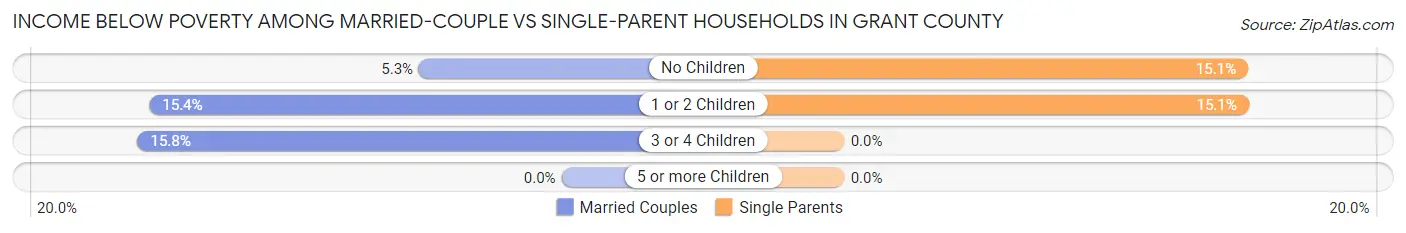
| Children | Married-Couple Families | Single-Parent Households |
| No Children | 65 (5.3%) | 25 (15.1%) |
| 1 or 2 Children | 64 (15.3%) | 16 (15.1%) |
| 3 or 4 Children | 9 (15.8%) | 0 (0.0%) |
| 5 or more Children | 0 (0.0%) | 0 (0.0%) |
| Total | 138 (8.1%) | 41 (15.1%) |
Employment Characteristics in Grant County
Employment by Class of Employer in Grant County
Among the 2,883 employed individuals in Grant County, private company employees (1,332 | 46.2%), self-employed (not incorporated) (375 | 13.0%), and state government employees (282 | 9.8%) make up the most common classes of employment.
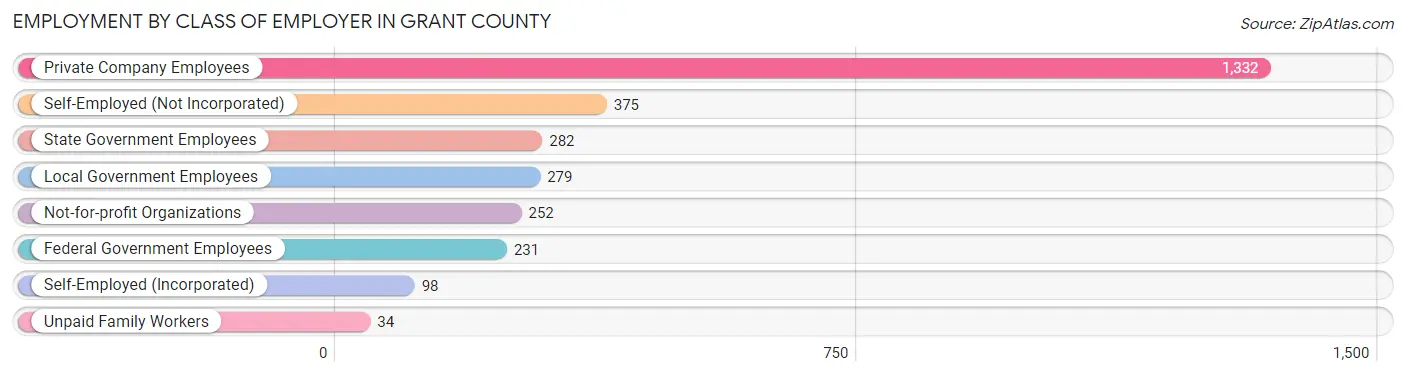
| Employer Class | # Employees | % Employees |
| Private Company Employees | 1,332 | 46.2% |
| Self-Employed (Incorporated) | 98 | 3.4% |
| Self-Employed (Not Incorporated) | 375 | 13.0% |
| Not-for-profit Organizations | 252 | 8.7% |
| Local Government Employees | 279 | 9.7% |
| State Government Employees | 282 | 9.8% |
| Federal Government Employees | 231 | 8.0% |
| Unpaid Family Workers | 34 | 1.2% |
| Total | 2,883 | 100.0% |
Employment Status by Age in Grant County
According to the labor force statistics for Grant County, out of the total population over 16 years of age (6,152), 51.7% or 3,181 individuals are in the labor force, with 7.5% or 239 of them unemployed. The age group with the highest labor force participation rate is 25 to 29 years, with 88.3% or 293 individuals in the labor force. Within the labor force, the 60 to 64 years age range has the highest percentage of unemployed individuals, with 17.1% or 65 of them being unemployed.
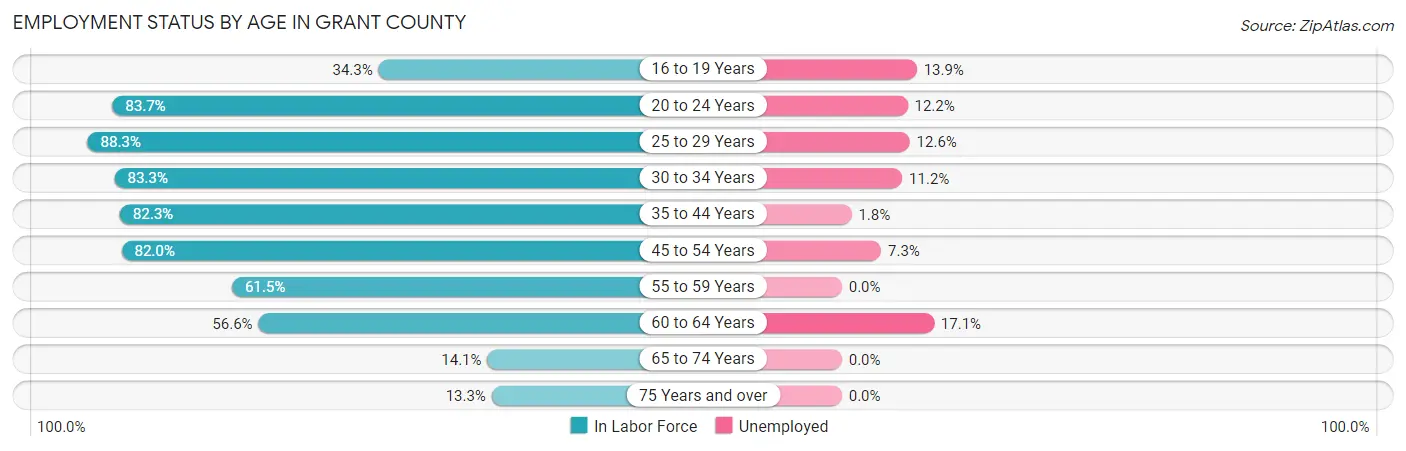
| Age Bracket | In Labor Force | Unemployed |
| 16 to 19 Years | 79 (34.3%) | 11 (13.9%) |
| 20 to 24 Years | 262 (83.7%) | 32 (12.2%) |
| 25 to 29 Years | 293 (88.3%) | 37 (12.6%) |
| 30 to 34 Years | 304 (83.3%) | 34 (11.2%) |
| 35 to 44 Years | 661 (82.3%) | 12 (1.8%) |
| 45 to 54 Years | 633 (82.0%) | 46 (7.3%) |
| 55 to 59 Years | 260 (61.5%) | 0 (0.0%) |
| 60 to 64 Years | 380 (56.6%) | 65 (17.1%) |
| 65 to 74 Years | 174 (14.1%) | 0 (0.0%) |
| 75 Years and over | 134 (13.3%) | 0 (0.0%) |
| Total | 3,181 (51.7%) | 239 (7.5%) |
Employment Status by Educational Attainment in Grant County
According to labor force statistics for Grant County, 75.2% of individuals (2,531) out of the total population between 25 and 64 years of age (3,366) are in the labor force, with 7.7% or 195 of them being unemployed. The group with the highest labor force participation rate are those with the educational attainment of bachelor's degree or higher, with 89.2% or 536 individuals in the labor force. Within the labor force, individuals with less than high school education have the highest percentage of unemployment, with 13.6% or 27 of them being unemployed.
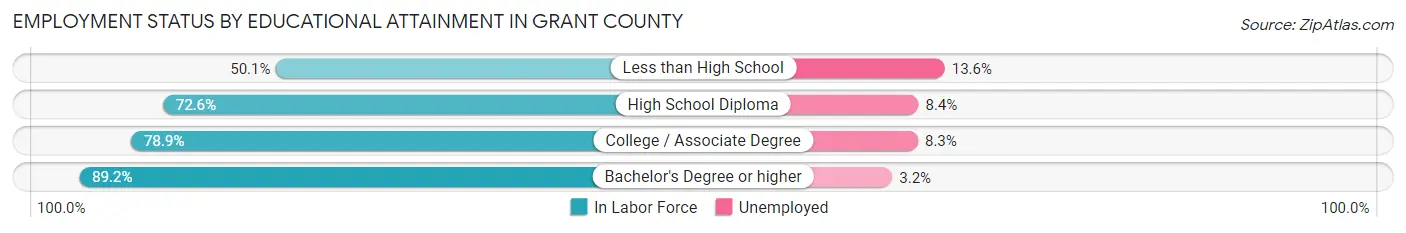
| Educational Attainment | In Labor Force | Unemployed |
| Less than High School | 198 (50.1%) | 54 (13.6%) |
| High School Diploma | 841 (72.6%) | 97 (8.4%) |
| College / Associate Degree | 955 (78.9%) | 101 (8.3%) |
| Bachelor's Degree or higher | 536 (89.2%) | 19 (3.2%) |
| Total | 2,531 (75.2%) | 259 (7.7%) |
Employment Occupations by Sex in Grant County
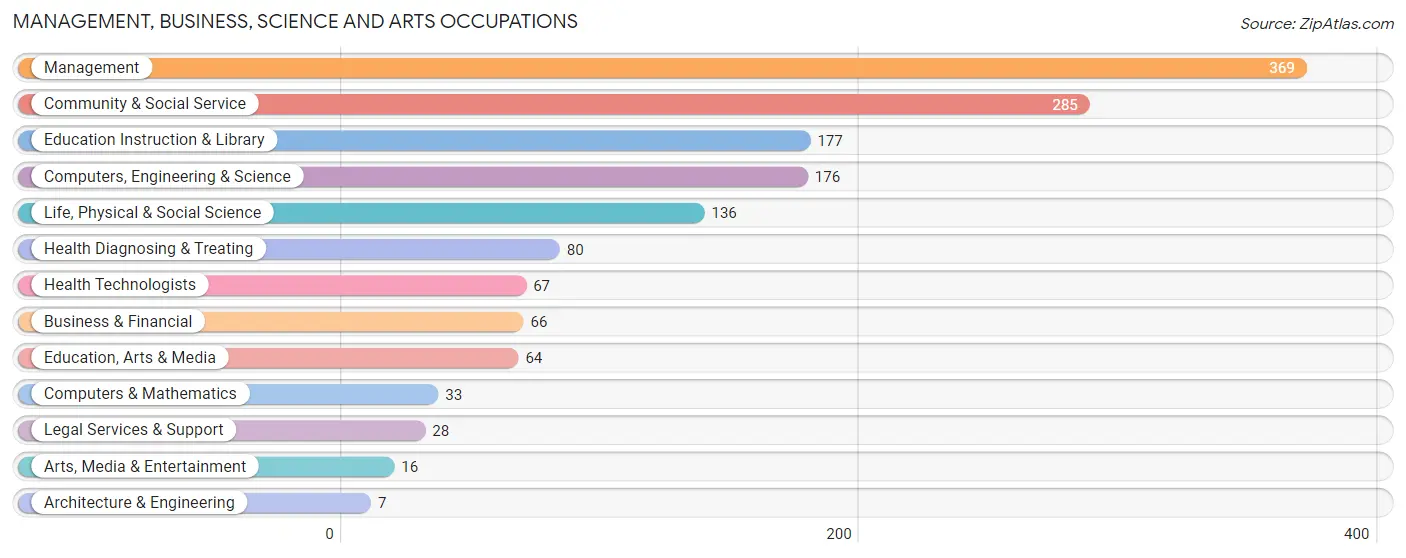
Management, Business, Science and Arts Occupations
The most common Management, Business, Science and Arts occupations in Grant County are Management (369 | 12.5%), Community & Social Service (285 | 9.7%), Education Instruction & Library (177 | 6.0%), Computers, Engineering & Science (176 | 6.0%), and Life, Physical & Social Science (136 | 4.6%).
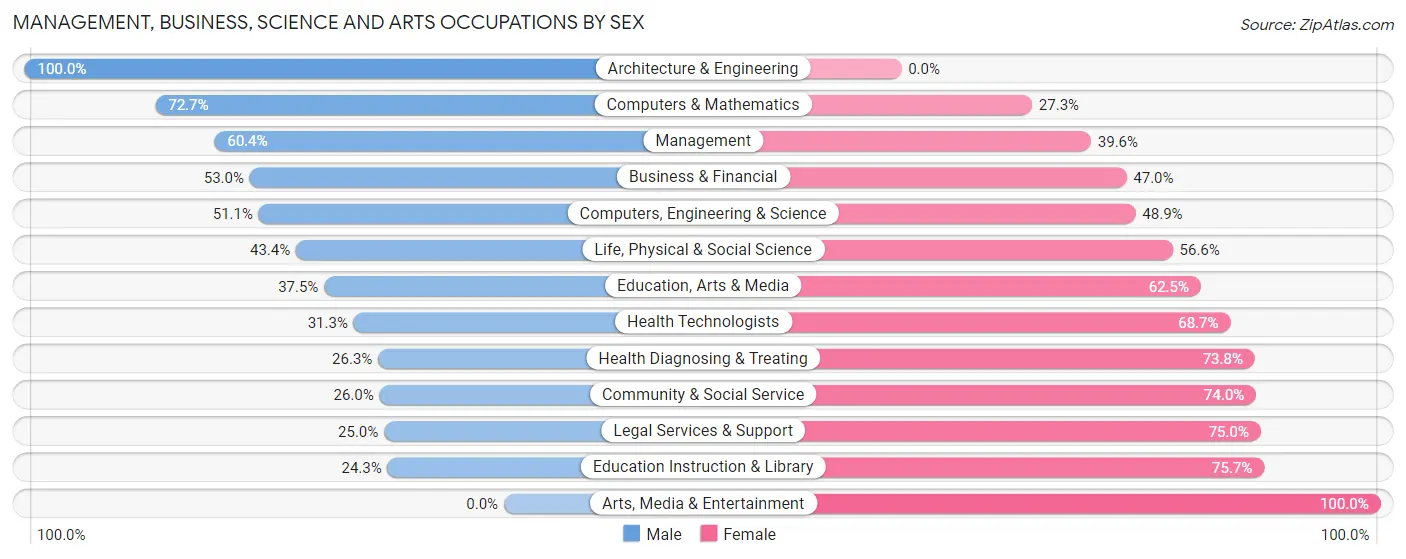
Management, Business, Science and Arts Occupations by Sex
Within the Management, Business, Science and Arts occupations in Grant County, the most male-oriented occupations are Architecture & Engineering (100.0%), Computers & Mathematics (72.7%), and Management (60.4%), while the most female-oriented occupations are Arts, Media & Entertainment (100.0%), Education Instruction & Library (75.7%), and Legal Services & Support (75.0%).
| Occupation | Male | Female |
| Management | 223 (60.4%) | 146 (39.6%) |
| Business & Financial | 35 (53.0%) | 31 (47.0%) |
| Computers, Engineering & Science | 90 (51.1%) | 86 (48.9%) |
| Computers & Mathematics | 24 (72.7%) | 9 (27.3%) |
| Architecture & Engineering | 7 (100.0%) | 0 (0.0%) |
| Life, Physical & Social Science | 59 (43.4%) | 77 (56.6%) |
| Community & Social Service | 74 (26.0%) | 211 (74.0%) |
| Education, Arts & Media | 24 (37.5%) | 40 (62.5%) |
| Legal Services & Support | 7 (25.0%) | 21 (75.0%) |
| Education Instruction & Library | 43 (24.3%) | 134 (75.7%) |
| Arts, Media & Entertainment | 0 (0.0%) | 16 (100.0%) |
| Health Diagnosing & Treating | 21 (26.3%) | 59 (73.8%) |
| Health Technologists | 21 (31.3%) | 46 (68.7%) |
| Total (Category) | 443 (45.4%) | 533 (54.6%) |
| Total (Overall) | 1,500 (51.0%) | 1,443 (49.0%) |
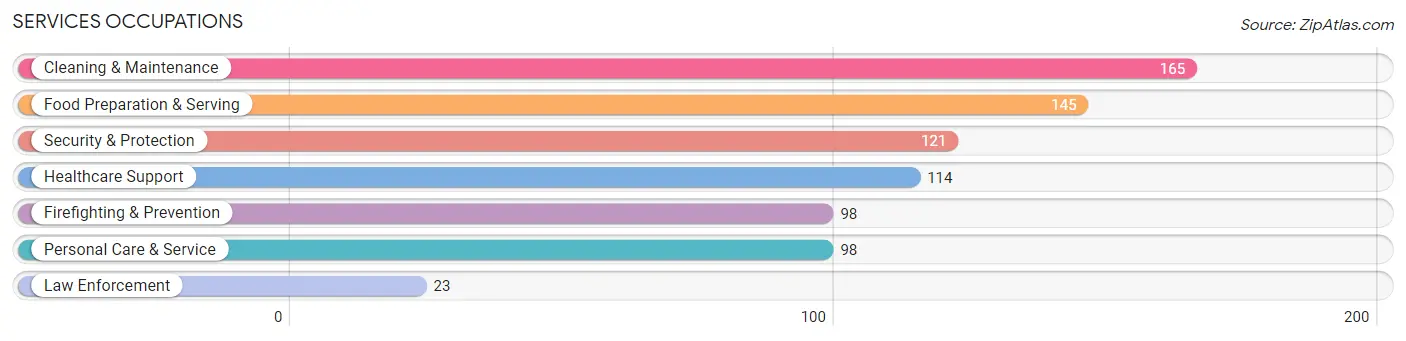
Services Occupations
The most common Services occupations in Grant County are Cleaning & Maintenance (165 | 5.6%), Food Preparation & Serving (145 | 4.9%), Security & Protection (121 | 4.1%), Healthcare Support (114 | 3.9%), and Firefighting & Prevention (98 | 3.3%).
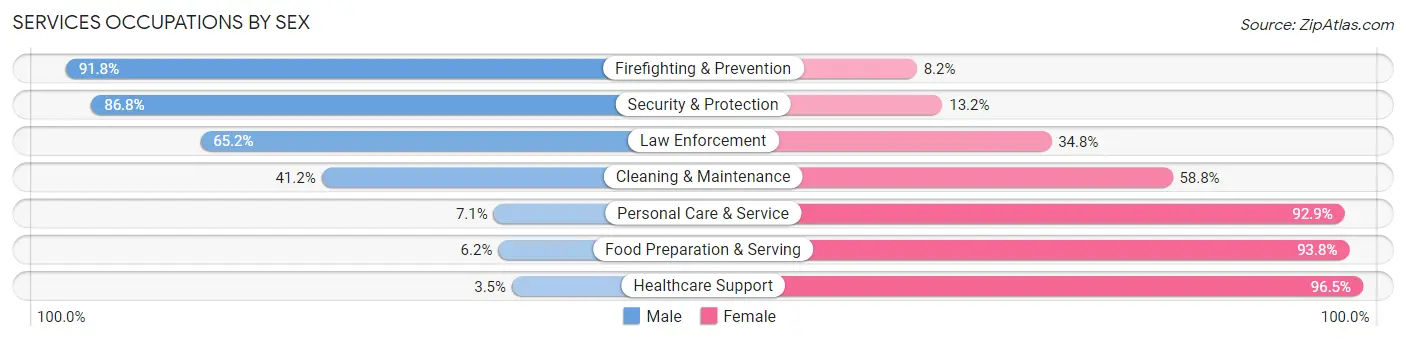
Services Occupations by Sex
Within the Services occupations in Grant County, the most male-oriented occupations are Firefighting & Prevention (91.8%), Security & Protection (86.8%), and Law Enforcement (65.2%), while the most female-oriented occupations are Healthcare Support (96.5%), Food Preparation & Serving (93.8%), and Personal Care & Service (92.9%).
| Occupation | Male | Female |
| Healthcare Support | 4 (3.5%) | 110 (96.5%) |
| Security & Protection | 105 (86.8%) | 16 (13.2%) |
| Firefighting & Prevention | 90 (91.8%) | 8 (8.2%) |
| Law Enforcement | 15 (65.2%) | 8 (34.8%) |
| Food Preparation & Serving | 9 (6.2%) | 136 (93.8%) |
| Cleaning & Maintenance | 68 (41.2%) | 97 (58.8%) |
| Personal Care & Service | 7 (7.1%) | 91 (92.9%) |
| Total (Category) | 193 (30.0%) | 450 (70.0%) |
| Total (Overall) | 1,500 (51.0%) | 1,443 (49.0%) |
Sales and Office Occupations
The most common Sales and Office occupations in Grant County are Sales & Related (298 | 10.1%), and Office & Administration (237 | 8.1%).
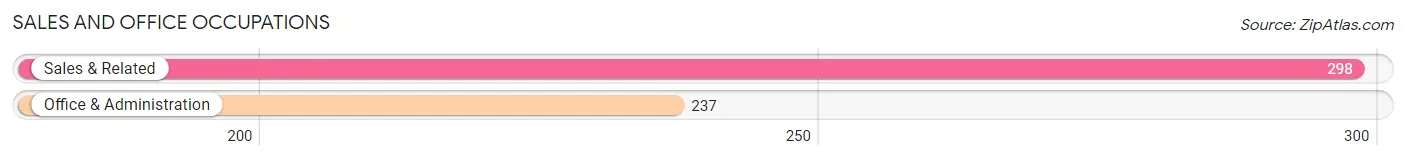
Sales and Office Occupations by Sex
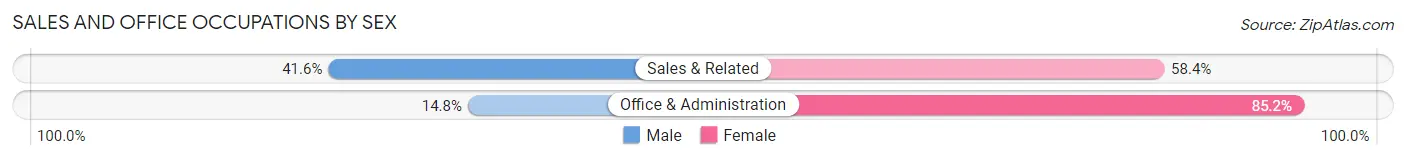
| Occupation | Male | Female |
| Sales & Related | 124 (41.6%) | 174 (58.4%) |
| Office & Administration | 35 (14.8%) | 202 (85.2%) |
| Total (Category) | 159 (29.7%) | 376 (70.3%) |
| Total (Overall) | 1,500 (51.0%) | 1,443 (49.0%) |
Natural Resources, Construction and Maintenance Occupations
The most common Natural Resources, Construction and Maintenance occupations in Grant County are Construction & Extraction (230 | 7.8%), Farming, Fishing & Forestry (175 | 5.9%), and Installation, Maintenance & Repair (132 | 4.5%).
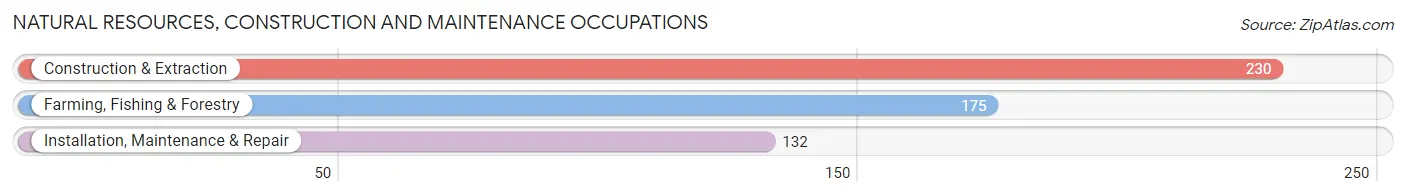
Natural Resources, Construction and Maintenance Occupations by Sex
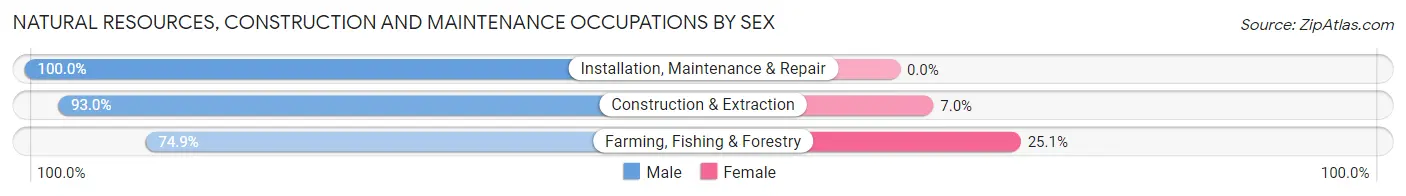
| Occupation | Male | Female |
| Farming, Fishing & Forestry | 131 (74.9%) | 44 (25.1%) |
| Construction & Extraction | 214 (93.0%) | 16 (7.0%) |
| Installation, Maintenance & Repair | 132 (100.0%) | 0 (0.0%) |
| Total (Category) | 477 (88.8%) | 60 (11.2%) |
| Total (Overall) | 1,500 (51.0%) | 1,443 (49.0%) |
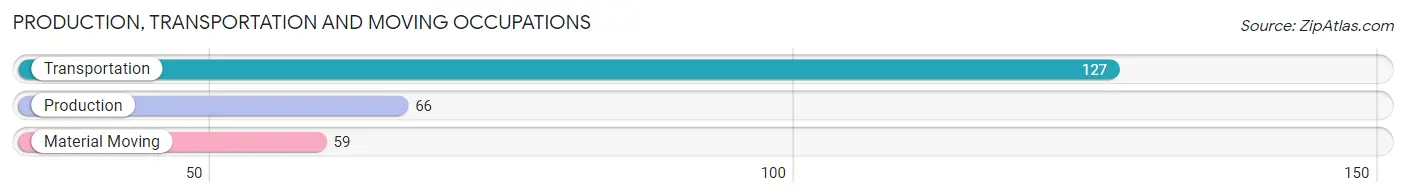
Production, Transportation and Moving Occupations
The most common Production, Transportation and Moving occupations in Grant County are Transportation (127 | 4.3%), Production (66 | 2.2%), and Material Moving (59 | 2.0%).
Production, Transportation and Moving Occupations by Sex
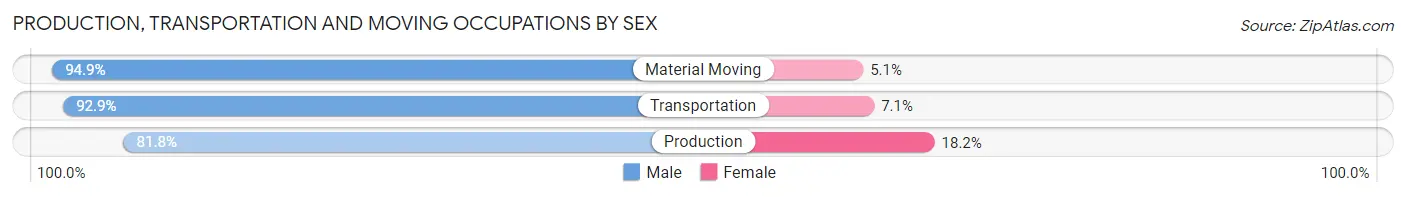
| Occupation | Male | Female |
| Production | 54 (81.8%) | 12 (18.2%) |
| Transportation | 118 (92.9%) | 9 (7.1%) |
| Material Moving | 56 (94.9%) | 3 (5.1%) |
| Total (Category) | 228 (90.5%) | 24 (9.5%) |
| Total (Overall) | 1,500 (51.0%) | 1,443 (49.0%) |
Employment Industries by Sex in Grant County
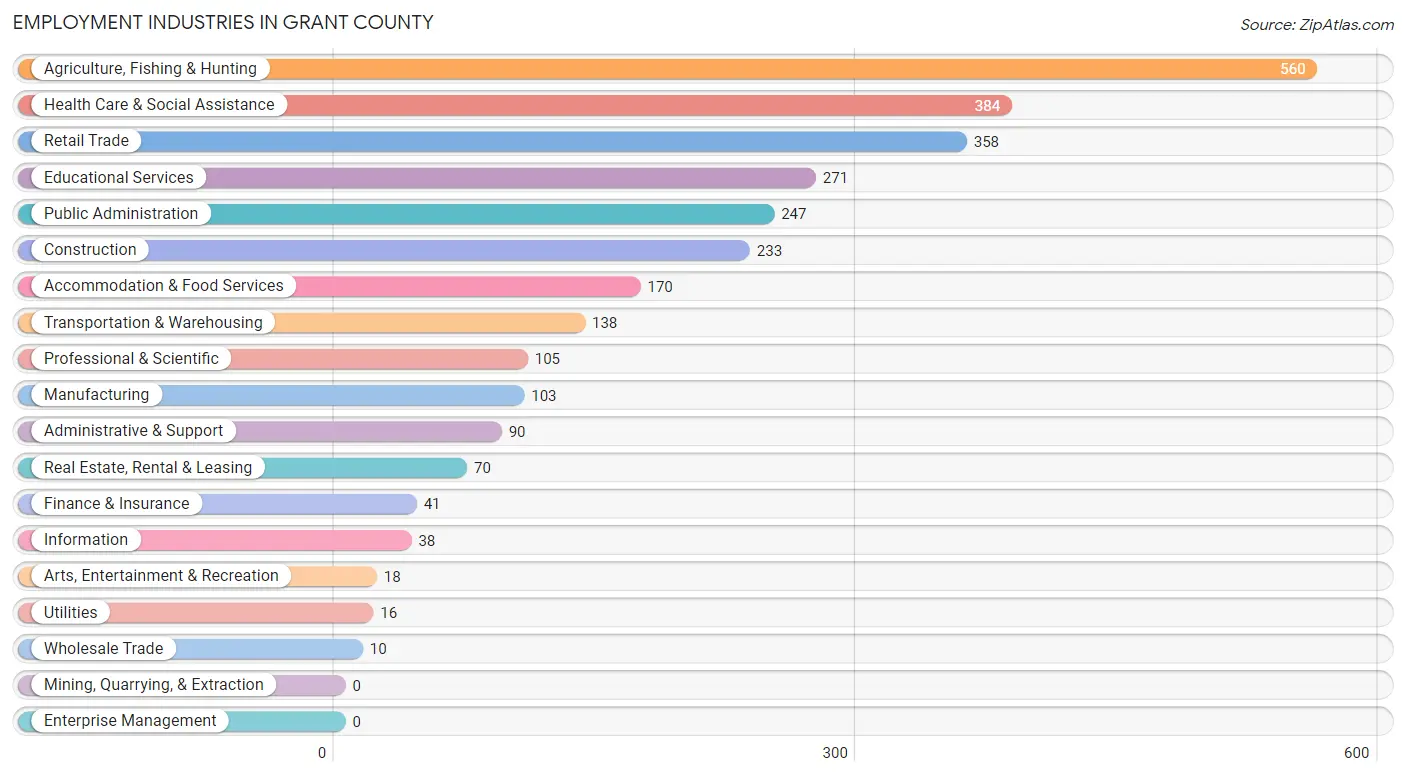
Employment Industries in Grant County
The major employment industries in Grant County include Agriculture, Fishing & Hunting (560 | 19.0%), Health Care & Social Assistance (384 | 13.1%), Retail Trade (358 | 12.2%), Educational Services (271 | 9.2%), and Public Administration (247 | 8.4%).
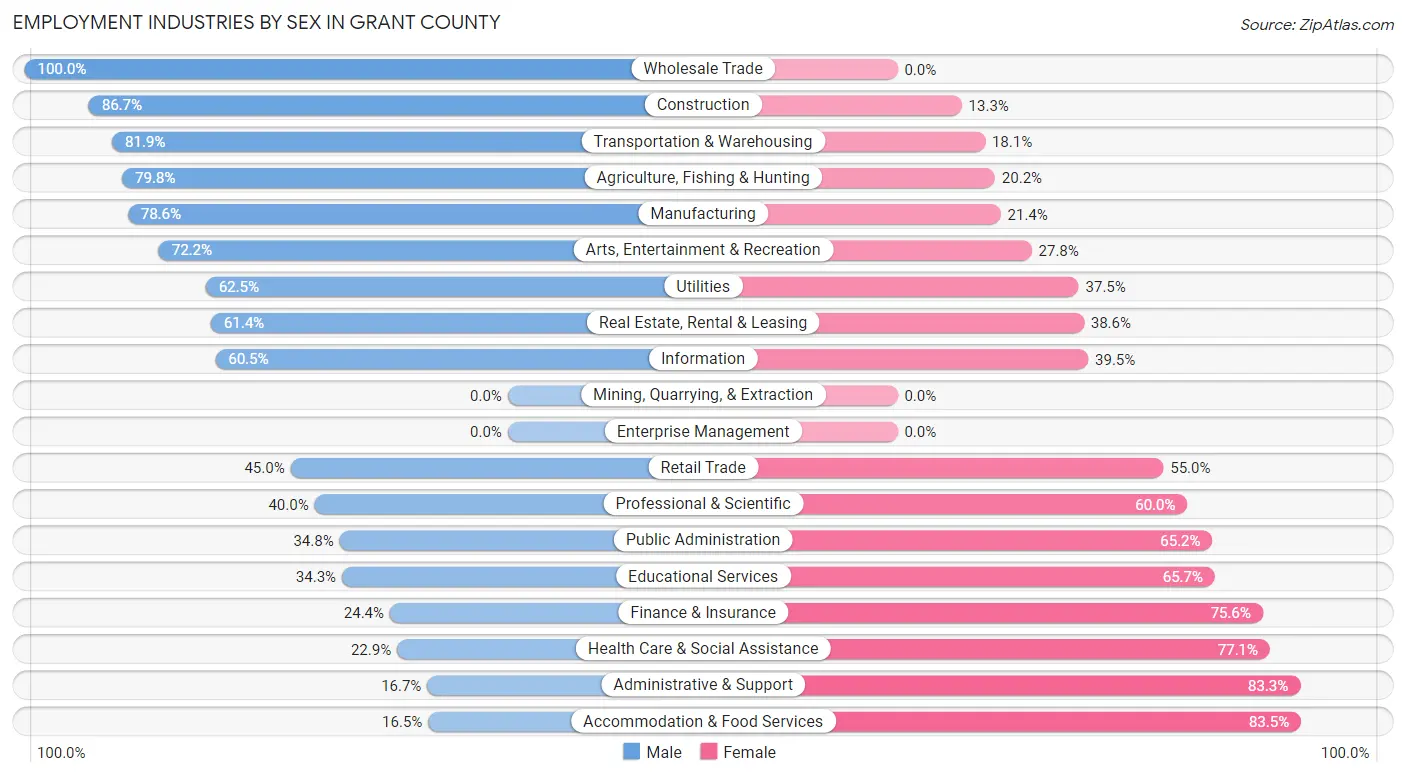
Employment Industries by Sex in Grant County
The Grant County industries that see more men than women are Wholesale Trade (100.0%), Construction (86.7%), and Transportation & Warehousing (81.9%), whereas the industries that tend to have a higher number of women are Accommodation & Food Services (83.5%), Administrative & Support (83.3%), and Health Care & Social Assistance (77.1%).
| Industry | Male | Female |
| Agriculture, Fishing & Hunting | 447 (79.8%) | 113 (20.2%) |
| Mining, Quarrying, & Extraction | 0 (0.0%) | 0 (0.0%) |
| Construction | 202 (86.7%) | 31 (13.3%) |
| Manufacturing | 81 (78.6%) | 22 (21.4%) |
| Wholesale Trade | 10 (100.0%) | 0 (0.0%) |
| Retail Trade | 161 (45.0%) | 197 (55.0%) |
| Transportation & Warehousing | 113 (81.9%) | 25 (18.1%) |
| Utilities | 10 (62.5%) | 6 (37.5%) |
| Information | 23 (60.5%) | 15 (39.5%) |
| Finance & Insurance | 10 (24.4%) | 31 (75.6%) |
| Real Estate, Rental & Leasing | 43 (61.4%) | 27 (38.6%) |
| Professional & Scientific | 42 (40.0%) | 63 (60.0%) |
| Enterprise Management | 0 (0.0%) | 0 (0.0%) |
| Administrative & Support | 15 (16.7%) | 75 (83.3%) |
| Educational Services | 93 (34.3%) | 178 (65.7%) |
| Health Care & Social Assistance | 88 (22.9%) | 296 (77.1%) |
| Arts, Entertainment & Recreation | 13 (72.2%) | 5 (27.8%) |
| Accommodation & Food Services | 28 (16.5%) | 142 (83.5%) |
| Public Administration | 86 (34.8%) | 161 (65.2%) |
| Total | 1,500 (51.0%) | 1,443 (49.0%) |
Education in Grant County
School Enrollment in Grant County
The most common levels of schooling among the 1,182 students in Grant County are high school (382 | 32.3%), elementary school (247 | 20.9%), and middle school (243 | 20.6%).
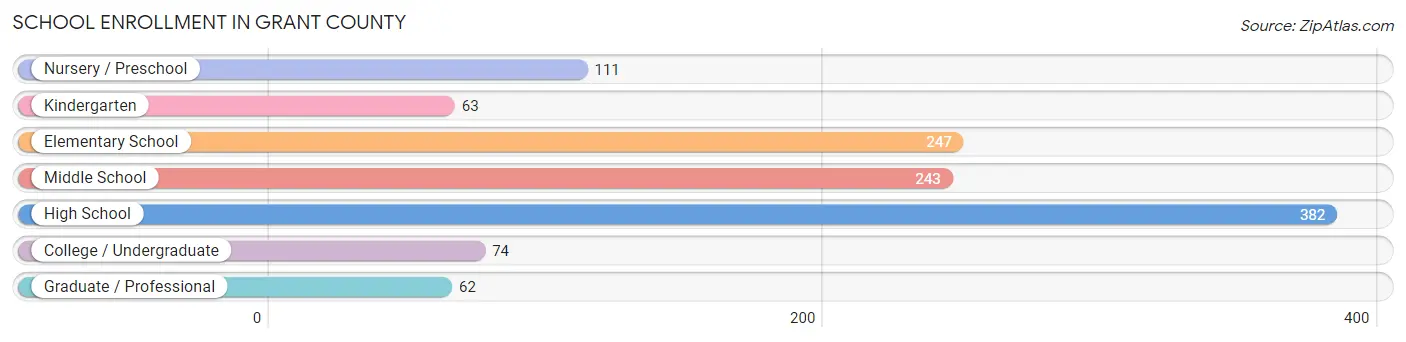
| School Level | # Students | % Students |
| Nursery / Preschool | 111 | 9.4% |
| Kindergarten | 63 | 5.3% |
| Elementary School | 247 | 20.9% |
| Middle School | 243 | 20.6% |
| High School | 382 | 32.3% |
| College / Undergraduate | 74 | 6.3% |
| Graduate / Professional | 62 | 5.2% |
| Total | 1,182 | 100.0% |
School Enrollment by Age by Funding Source in Grant County
Out of a total of 1,182 students who are enrolled in schools in Grant County, 194 (16.4%) attend a private institution, while the remaining 988 (83.6%) are enrolled in public schools. The age group of 35 years and over has the highest likelihood of being enrolled in private schools, with 35 (42.2% in the age bracket) enrolled. Conversely, the age group of 18 to 19 year olds has the lowest likelihood of being enrolled in a private school, with 48 (96.0% in the age bracket) attending a public institution.
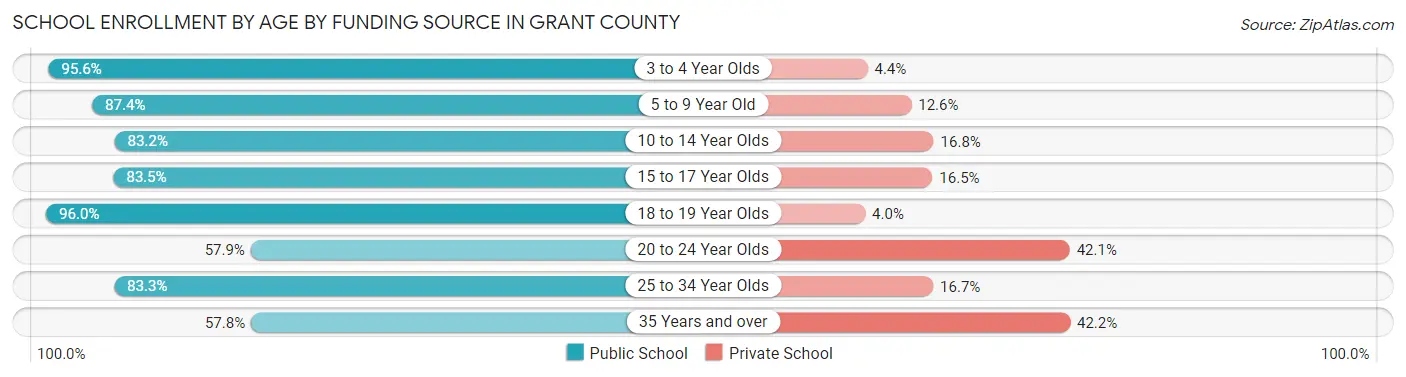
| Age Bracket | Public School | Private School |
| 3 to 4 Year Olds | 86 (95.6%) | 4 (4.4%) |
| 5 to 9 Year Old | 250 (87.4%) | 36 (12.6%) |
| 10 to 14 Year Olds | 303 (83.2%) | 61 (16.8%) |
| 15 to 17 Year Olds | 197 (83.5%) | 39 (16.5%) |
| 18 to 19 Year Olds | 48 (96.0%) | 2 (4.0%) |
| 20 to 24 Year Olds | 11 (57.9%) | 8 (42.1%) |
| 25 to 34 Year Olds | 45 (83.3%) | 9 (16.7%) |
| 35 Years and over | 48 (57.8%) | 35 (42.2%) |
| Total | 988 (83.6%) | 194 (16.4%) |
Educational Attainment by Field of Study in Grant County
Bio, nature & agricultural (235 | 19.8%), education (201 | 17.0%), social sciences (141 | 11.9%), business (124 | 10.5%), and science & technology (119 | 10.0%) are the most common fields of study among 1,185 individuals in Grant County who have obtained a bachelor's degree or higher.
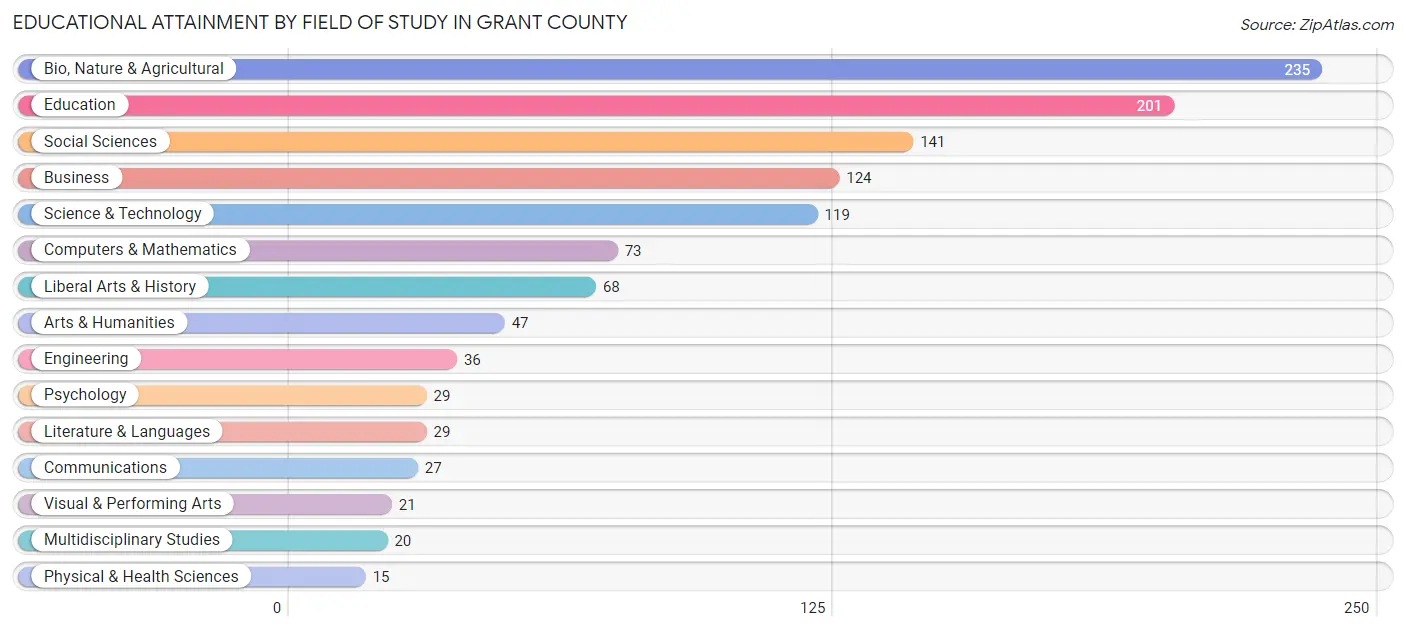
| Field of Study | # Graduates | % Graduates |
| Computers & Mathematics | 73 | 6.2% |
| Bio, Nature & Agricultural | 235 | 19.8% |
| Physical & Health Sciences | 15 | 1.3% |
| Psychology | 29 | 2.5% |
| Social Sciences | 141 | 11.9% |
| Engineering | 36 | 3.0% |
| Multidisciplinary Studies | 20 | 1.7% |
| Science & Technology | 119 | 10.0% |
| Business | 124 | 10.5% |
| Education | 201 | 17.0% |
| Literature & Languages | 29 | 2.5% |
| Liberal Arts & History | 68 | 5.7% |
| Visual & Performing Arts | 21 | 1.8% |
| Communications | 27 | 2.3% |
| Arts & Humanities | 47 | 4.0% |
| Total | 1,185 | 100.0% |
Transportation & Commute in Grant County
Vehicle Availability by Sex in Grant County
The most prevalent vehicle ownership categories in Grant County are males with 2 vehicles (634, accounting for 43.0%) and females with 2 vehicles (515, making up 45.7%).
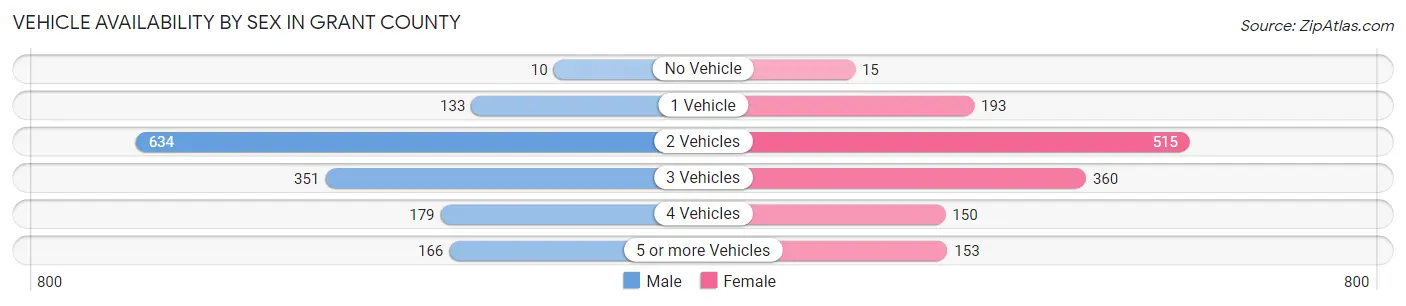
| Vehicles Available | Male | Female |
| No Vehicle | 10 (0.7%) | 15 (1.1%) |
| 1 Vehicle | 133 (9.0%) | 193 (13.9%) |
| 2 Vehicles | 634 (43.0%) | 515 (37.2%) |
| 3 Vehicles | 351 (23.8%) | 360 (26.0%) |
| 4 Vehicles | 179 (12.1%) | 150 (10.8%) |
| 5 or more Vehicles | 166 (11.3%) | 153 (11.0%) |
| Total | 1,473 (100.0%) | 1,386 (100.0%) |
Commute Time in Grant County
The most frequently occuring commute durations in Grant County are 10 to 14 minutes (668 commuters, 25.5%), less than 5 minutes (604 commuters, 23.0%), and 5 to 9 minutes (499 commuters, 19.0%).
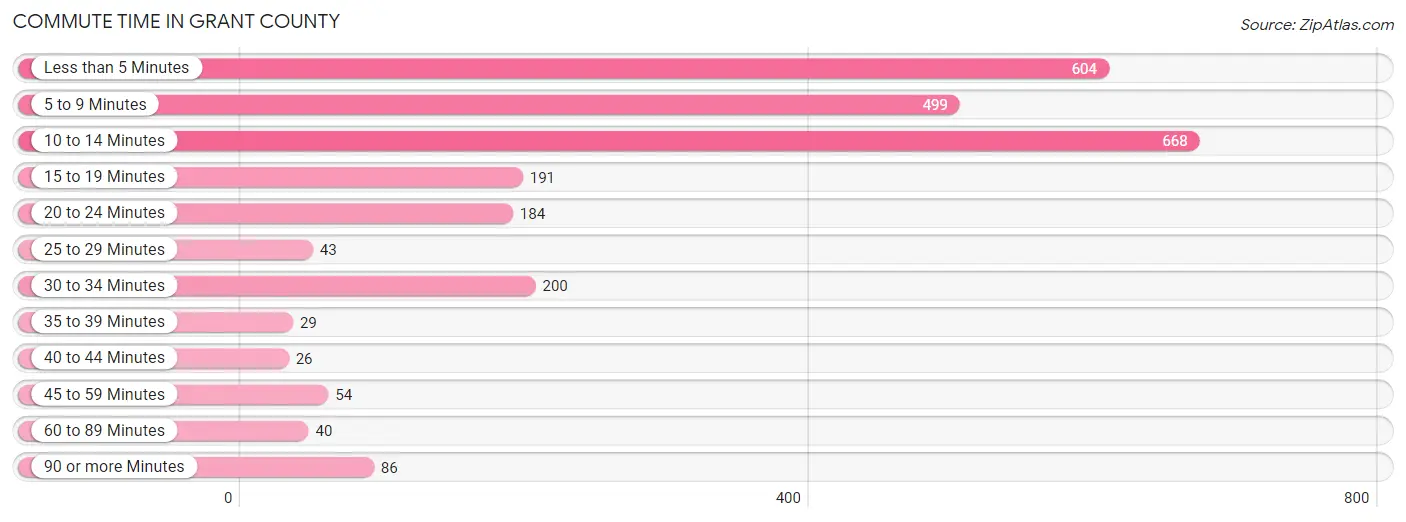
| Commute Time | # Commuters | % Commuters |
| Less than 5 Minutes | 604 | 23.0% |
| 5 to 9 Minutes | 499 | 19.0% |
| 10 to 14 Minutes | 668 | 25.5% |
| 15 to 19 Minutes | 191 | 7.3% |
| 20 to 24 Minutes | 184 | 7.0% |
| 25 to 29 Minutes | 43 | 1.6% |
| 30 to 34 Minutes | 200 | 7.6% |
| 35 to 39 Minutes | 29 | 1.1% |
| 40 to 44 Minutes | 26 | 1.0% |
| 45 to 59 Minutes | 54 | 2.1% |
| 60 to 89 Minutes | 40 | 1.5% |
| 90 or more Minutes | 86 | 3.3% |
Commute Time by Sex in Grant County
The most common commute times in Grant County are 10 to 14 minutes (355 commuters, 26.5%) for males and less than 5 minutes (313 commuters, 24.3%) for females.
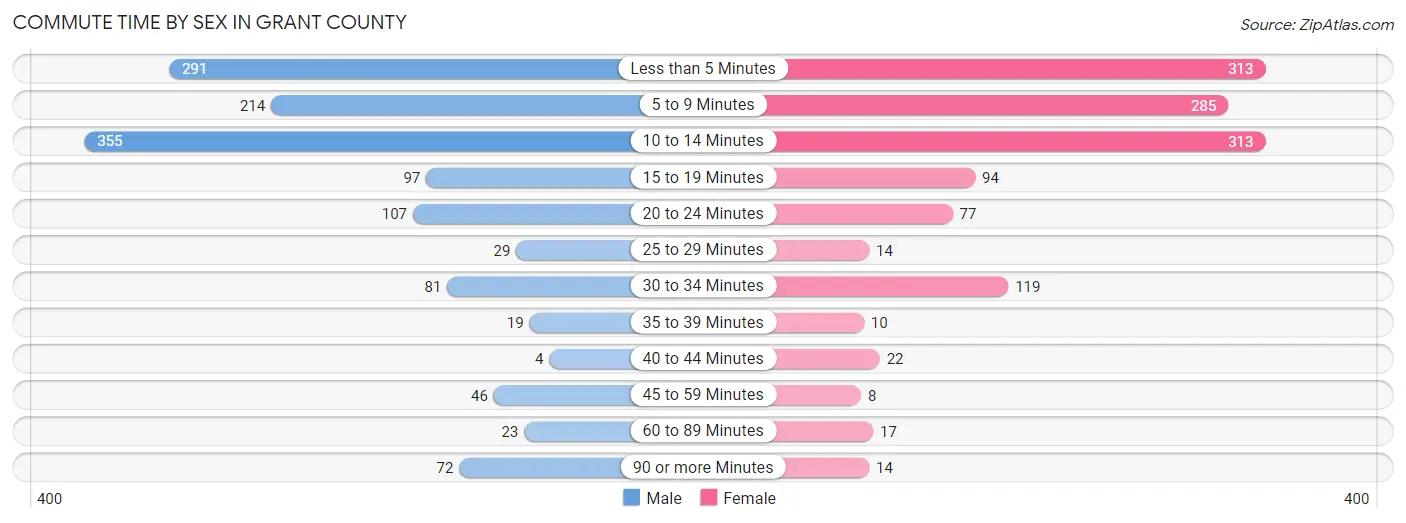
| Commute Time | Male | Female |
| Less than 5 Minutes | 291 (21.7%) | 313 (24.3%) |
| 5 to 9 Minutes | 214 (16.0%) | 285 (22.2%) |
| 10 to 14 Minutes | 355 (26.5%) | 313 (24.3%) |
| 15 to 19 Minutes | 97 (7.2%) | 94 (7.3%) |
| 20 to 24 Minutes | 107 (8.0%) | 77 (6.0%) |
| 25 to 29 Minutes | 29 (2.2%) | 14 (1.1%) |
| 30 to 34 Minutes | 81 (6.0%) | 119 (9.2%) |
| 35 to 39 Minutes | 19 (1.4%) | 10 (0.8%) |
| 40 to 44 Minutes | 4 (0.3%) | 22 (1.7%) |
| 45 to 59 Minutes | 46 (3.4%) | 8 (0.6%) |
| 60 to 89 Minutes | 23 (1.7%) | 17 (1.3%) |
| 90 or more Minutes | 72 (5.4%) | 14 (1.1%) |
Time of Departure to Work by Sex in Grant County
The most frequent times of departure to work in Grant County are 7:00 AM to 7:29 AM (260, 19.4%) for males and 7:30 AM to 7:59 AM (235, 18.3%) for females.
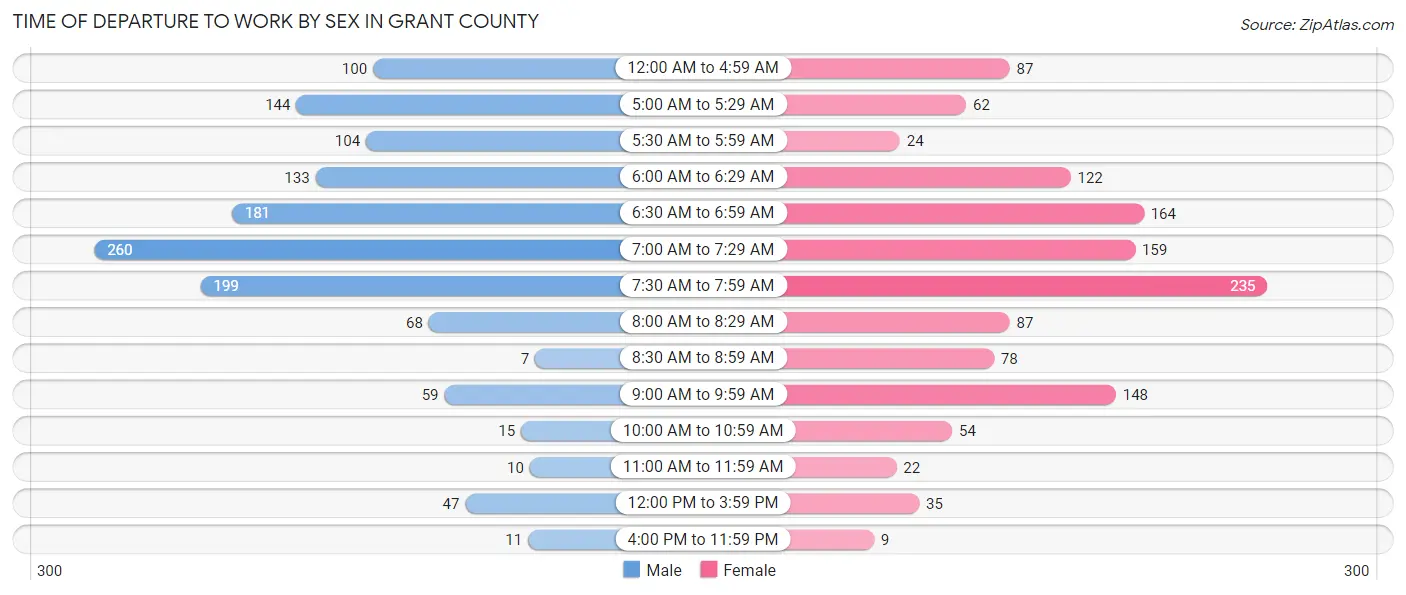
| Time of Departure | Male | Female |
| 12:00 AM to 4:59 AM | 100 (7.5%) | 87 (6.8%) |
| 5:00 AM to 5:29 AM | 144 (10.8%) | 62 (4.8%) |
| 5:30 AM to 5:59 AM | 104 (7.8%) | 24 (1.9%) |
| 6:00 AM to 6:29 AM | 133 (9.9%) | 122 (9.5%) |
| 6:30 AM to 6:59 AM | 181 (13.5%) | 164 (12.8%) |
| 7:00 AM to 7:29 AM | 260 (19.4%) | 159 (12.4%) |
| 7:30 AM to 7:59 AM | 199 (14.9%) | 235 (18.3%) |
| 8:00 AM to 8:29 AM | 68 (5.1%) | 87 (6.8%) |
| 8:30 AM to 8:59 AM | 7 (0.5%) | 78 (6.1%) |
| 9:00 AM to 9:59 AM | 59 (4.4%) | 148 (11.5%) |
| 10:00 AM to 10:59 AM | 15 (1.1%) | 54 (4.2%) |
| 11:00 AM to 11:59 AM | 10 (0.7%) | 22 (1.7%) |
| 12:00 PM to 3:59 PM | 47 (3.5%) | 35 (2.7%) |
| 4:00 PM to 11:59 PM | 11 (0.8%) | 9 (0.7%) |
| Total | 1,338 (100.0%) | 1,286 (100.0%) |
Housing Occupancy in Grant County
Occupancy by Ownership in Grant County
Of the total 3,368 dwellings in Grant County, owner-occupied units account for 2,625 (77.9%), while renter-occupied units make up 743 (22.1%).
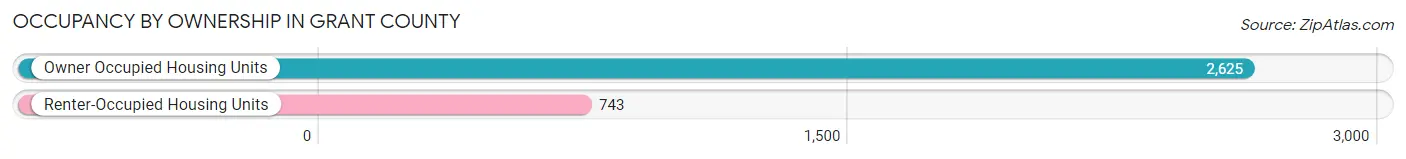
| Occupancy | # Housing Units | % Housing Units |
| Owner Occupied Housing Units | 2,625 | 77.9% |
| Renter-Occupied Housing Units | 743 | 22.1% |
| Total Occupied Housing Units | 3,368 | 100.0% |
Occupancy by Household Size in Grant County
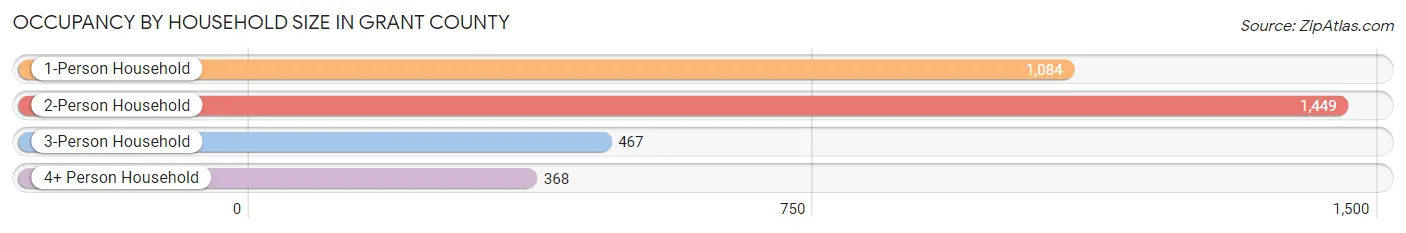
| Household Size | # Housing Units | % Housing Units |
| 1-Person Household | 1,084 | 32.2% |
| 2-Person Household | 1,449 | 43.0% |
| 3-Person Household | 467 | 13.9% |
| 4+ Person Household | 368 | 10.9% |
| Total Housing Units | 3,368 | 100.0% |
Occupancy by Ownership by Household Size in Grant County
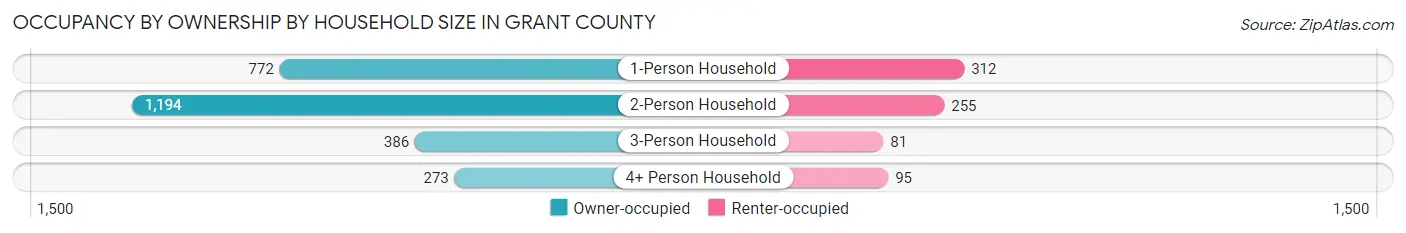
| Household Size | Owner-occupied | Renter-occupied |
| 1-Person Household | 772 (71.2%) | 312 (28.8%) |
| 2-Person Household | 1,194 (82.4%) | 255 (17.6%) |
| 3-Person Household | 386 (82.7%) | 81 (17.3%) |
| 4+ Person Household | 273 (74.2%) | 95 (25.8%) |
| Total Housing Units | 2,625 (77.9%) | 743 (22.1%) |
Occupancy by Educational Attainment in Grant County
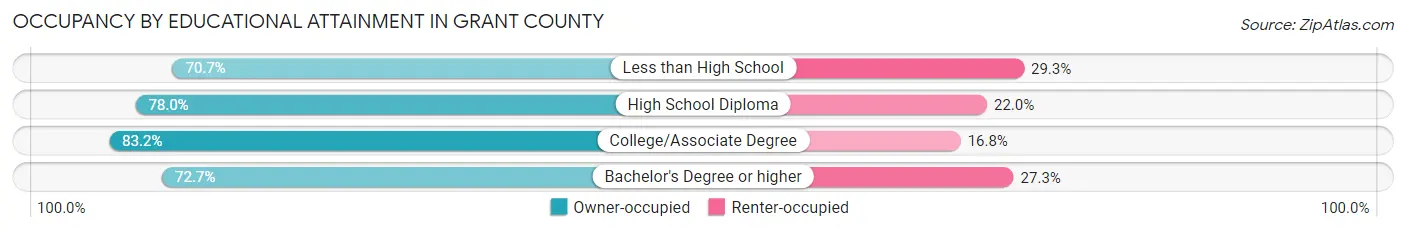
| Household Size | Owner-occupied | Renter-occupied |
| Less than High School | 229 (70.7%) | 95 (29.3%) |
| High School Diploma | 845 (78.0%) | 238 (22.0%) |
| College/Associate Degree | 988 (83.2%) | 199 (16.8%) |
| Bachelor's Degree or higher | 563 (72.7%) | 211 (27.3%) |
Occupancy by Age of Householder in Grant County
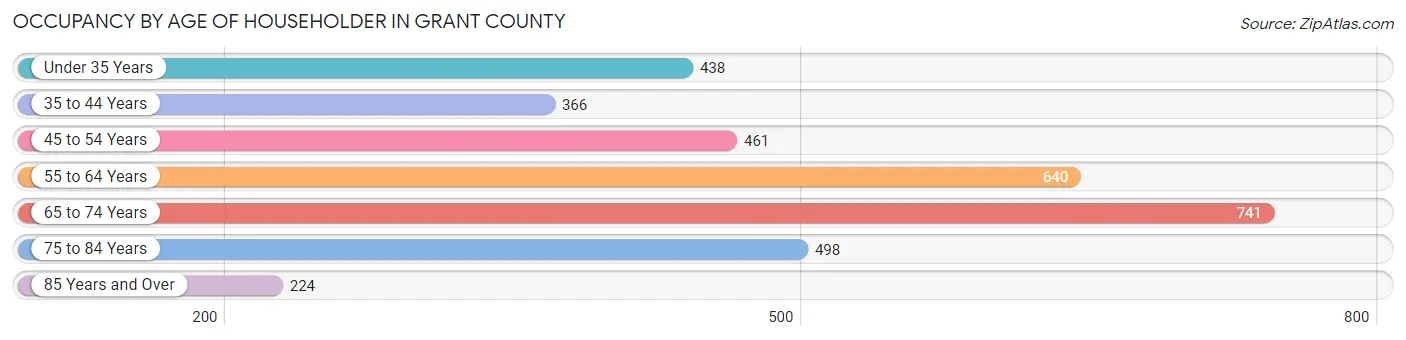
| Age Bracket | # Households | % Households |
| Under 35 Years | 438 | 13.0% |
| 35 to 44 Years | 366 | 10.9% |
| 45 to 54 Years | 461 | 13.7% |
| 55 to 64 Years | 640 | 19.0% |
| 65 to 74 Years | 741 | 22.0% |
| 75 to 84 Years | 498 | 14.8% |
| 85 Years and Over | 224 | 6.7% |
| Total | 3,368 | 100.0% |
Housing Finances in Grant County
Median Income by Occupancy in Grant County
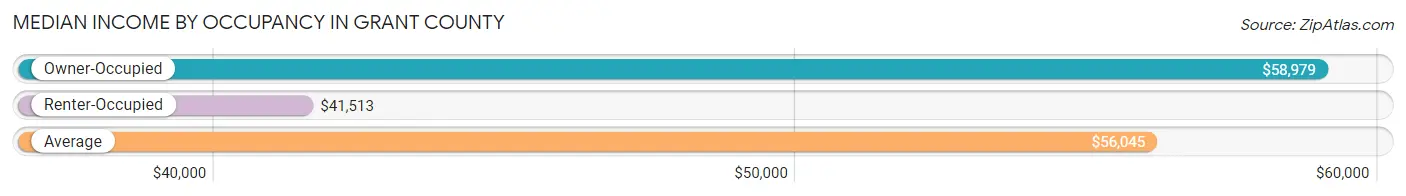
| Occupancy Type | # Households | Median Income |
| Owner-Occupied | 2,625 (77.9%) | $58,979 |
| Renter-Occupied | 743 (22.1%) | $41,513 |
| Average | 3,368 (100.0%) | $56,045 |
Occupancy by Householder Income Bracket in Grant County
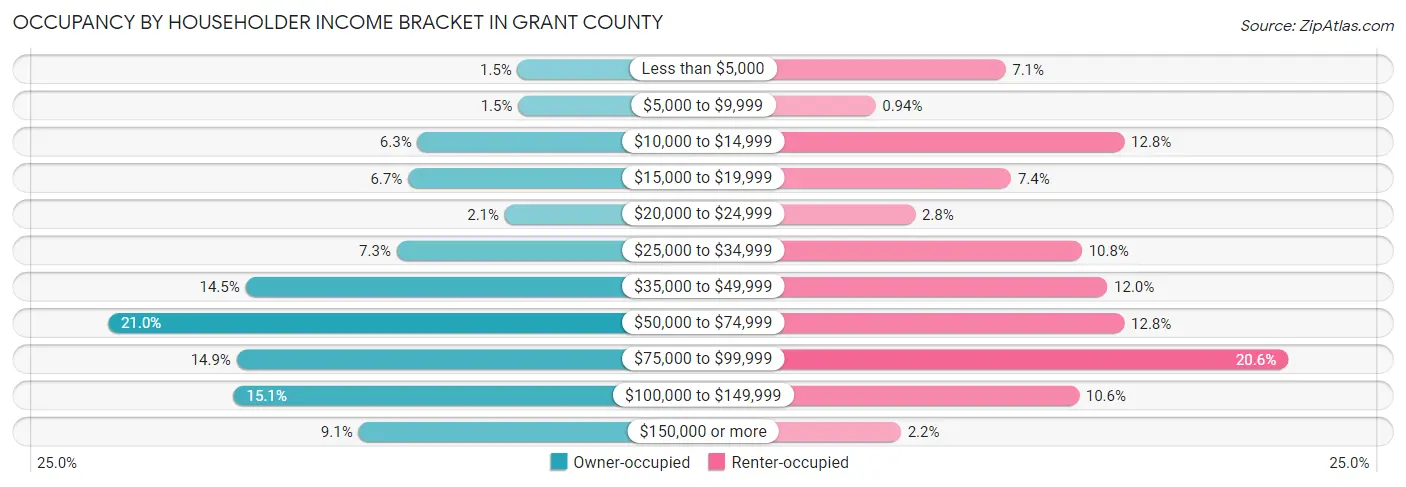
| Income Bracket | Owner-occupied | Renter-occupied |
| Less than $5,000 | 40 (1.5%) | 53 (7.1%) |
| $5,000 to $9,999 | 39 (1.5%) | 7 (0.9%) |
| $10,000 to $14,999 | 165 (6.3%) | 95 (12.8%) |
| $15,000 to $19,999 | 177 (6.7%) | 55 (7.4%) |
| $20,000 to $24,999 | 56 (2.1%) | 21 (2.8%) |
| $25,000 to $34,999 | 191 (7.3%) | 80 (10.8%) |
| $35,000 to $49,999 | 380 (14.5%) | 89 (12.0%) |
| $50,000 to $74,999 | 552 (21.0%) | 95 (12.8%) |
| $75,000 to $99,999 | 391 (14.9%) | 153 (20.6%) |
| $100,000 to $149,999 | 395 (15.0%) | 79 (10.6%) |
| $150,000 or more | 239 (9.1%) | 16 (2.1%) |
| Total | 2,625 (100.0%) | 743 (100.0%) |
Monthly Housing Cost Tiers in Grant County
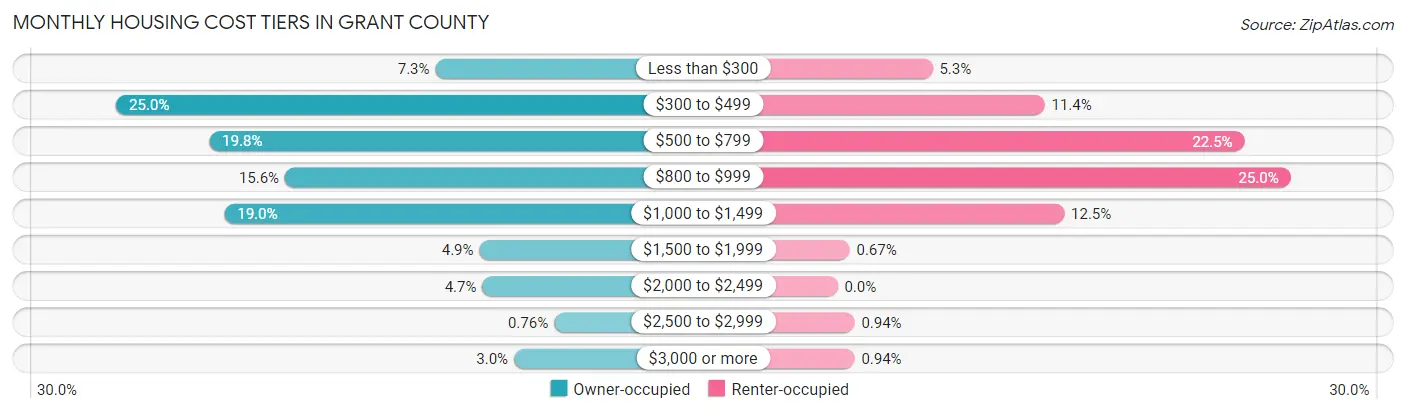
| Monthly Cost | Owner-occupied | Renter-occupied |
| Less than $300 | 192 (7.3%) | 39 (5.2%) |
| $300 to $499 | 655 (24.9%) | 85 (11.4%) |
| $500 to $799 | 520 (19.8%) | 167 (22.5%) |
| $800 to $999 | 410 (15.6%) | 186 (25.0%) |
| $1,000 to $1,499 | 498 (19.0%) | 93 (12.5%) |
| $1,500 to $1,999 | 128 (4.9%) | 5 (0.7%) |
| $2,000 to $2,499 | 124 (4.7%) | 0 (0.0%) |
| $2,500 to $2,999 | 20 (0.8%) | 7 (0.9%) |
| $3,000 or more | 78 (3.0%) | 7 (0.9%) |
| Total | 2,625 (100.0%) | 743 (100.0%) |
Physical Housing Characteristics in Grant County
Housing Structures in Grant County
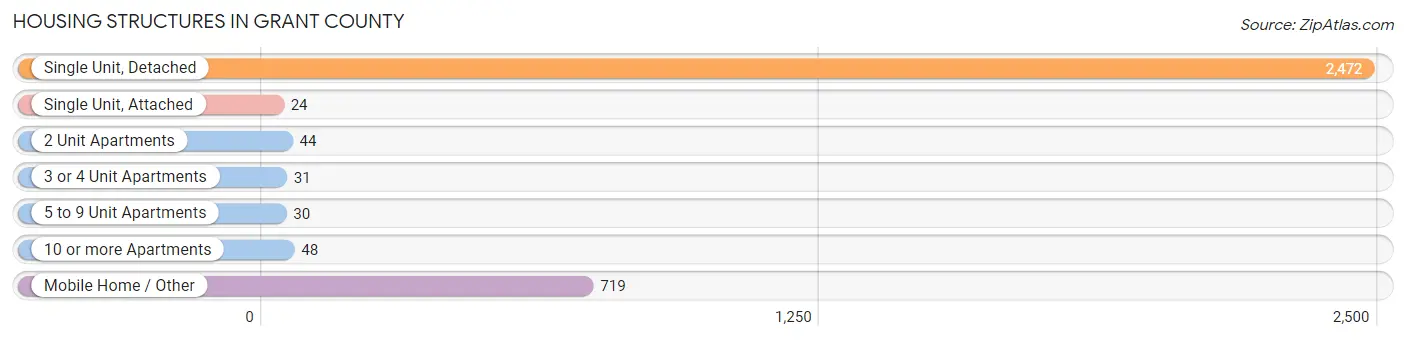
| Structure Type | # Housing Units | % Housing Units |
| Single Unit, Detached | 2,472 | 73.4% |
| Single Unit, Attached | 24 | 0.7% |
| 2 Unit Apartments | 44 | 1.3% |
| 3 or 4 Unit Apartments | 31 | 0.9% |
| 5 to 9 Unit Apartments | 30 | 0.9% |
| 10 or more Apartments | 48 | 1.4% |
| Mobile Home / Other | 719 | 21.3% |
| Total | 3,368 | 100.0% |
Housing Structures by Occupancy in Grant County
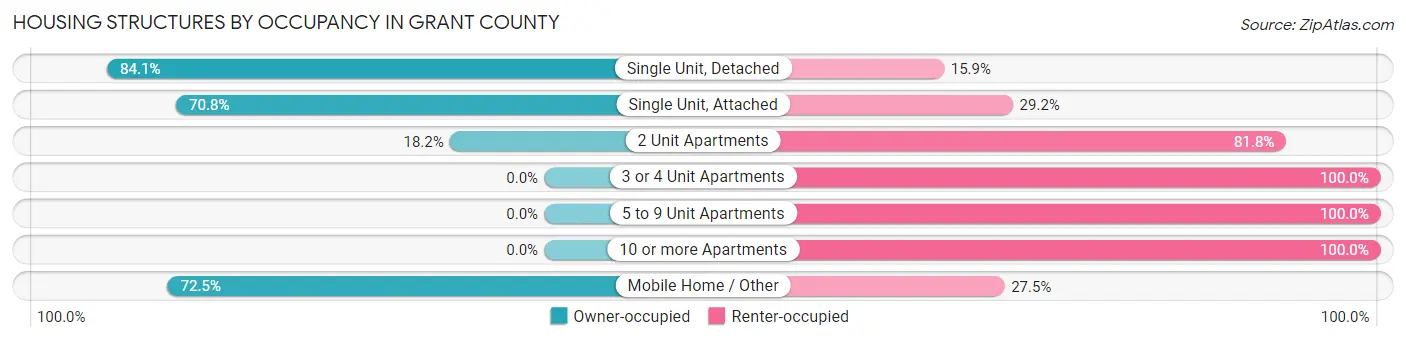
| Structure Type | Owner-occupied | Renter-occupied |
| Single Unit, Detached | 2,079 (84.1%) | 393 (15.9%) |
| Single Unit, Attached | 17 (70.8%) | 7 (29.2%) |
| 2 Unit Apartments | 8 (18.2%) | 36 (81.8%) |
| 3 or 4 Unit Apartments | 0 (0.0%) | 31 (100.0%) |
| 5 to 9 Unit Apartments | 0 (0.0%) | 30 (100.0%) |
| 10 or more Apartments | 0 (0.0%) | 48 (100.0%) |
| Mobile Home / Other | 521 (72.5%) | 198 (27.5%) |
| Total | 2,625 (77.9%) | 743 (22.1%) |
Housing Structures by Number of Rooms in Grant County
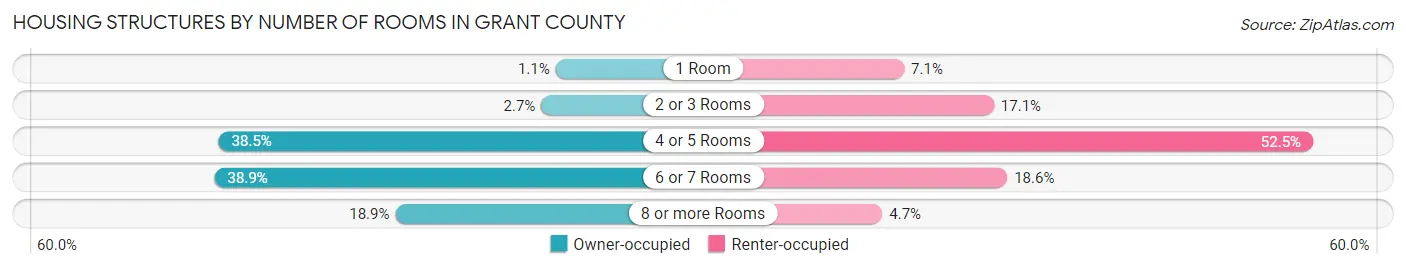
| Number of Rooms | Owner-occupied | Renter-occupied |
| 1 Room | 28 (1.1%) | 53 (7.1%) |
| 2 or 3 Rooms | 70 (2.7%) | 127 (17.1%) |
| 4 or 5 Rooms | 1,010 (38.5%) | 390 (52.5%) |
| 6 or 7 Rooms | 1,022 (38.9%) | 138 (18.6%) |
| 8 or more Rooms | 495 (18.9%) | 35 (4.7%) |
| Total | 2,625 (100.0%) | 743 (100.0%) |
Housing Structure by Heating Type in Grant County
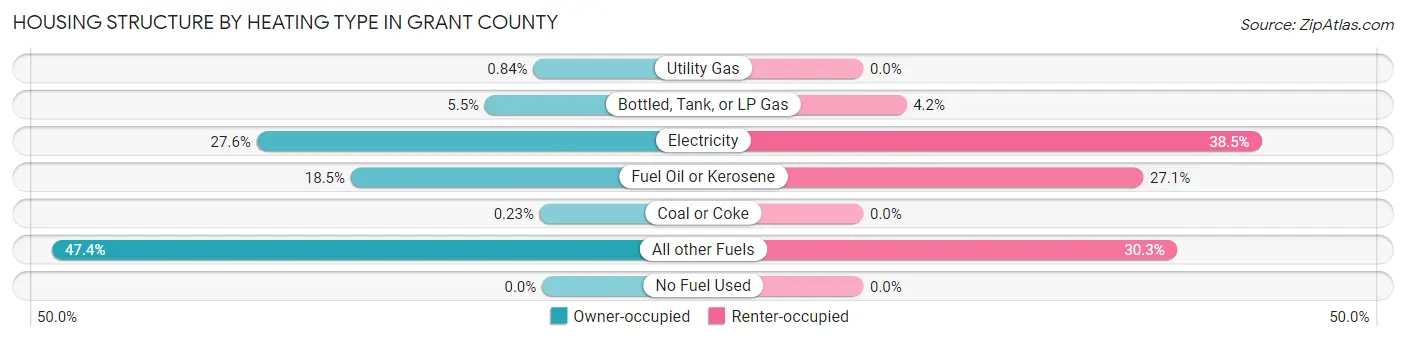
| Heating Type | Owner-occupied | Renter-occupied |
| Utility Gas | 22 (0.8%) | 0 (0.0%) |
| Bottled, Tank, or LP Gas | 145 (5.5%) | 31 (4.2%) |
| Electricity | 724 (27.6%) | 286 (38.5%) |
| Fuel Oil or Kerosene | 485 (18.5%) | 201 (27.1%) |
| Coal or Coke | 6 (0.2%) | 0 (0.0%) |
| All other Fuels | 1,243 (47.3%) | 225 (30.3%) |
| No Fuel Used | 0 (0.0%) | 0 (0.0%) |
| Total | 2,625 (100.0%) | 743 (100.0%) |
Household Vehicle Usage in Grant County
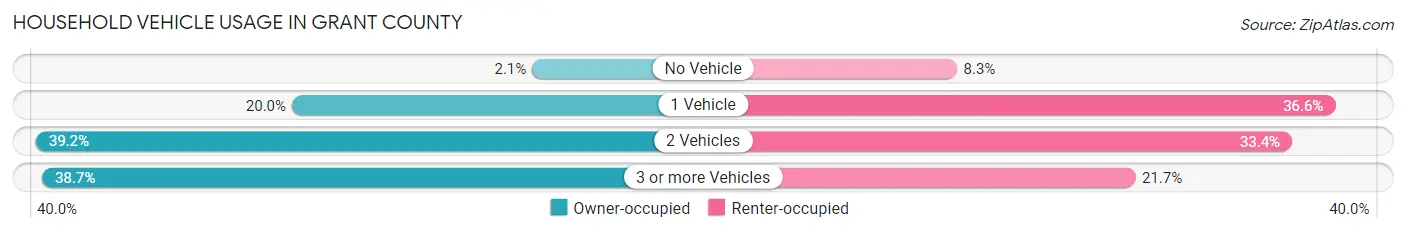
| Vehicles per Household | Owner-occupied | Renter-occupied |
| No Vehicle | 55 (2.1%) | 62 (8.3%) |
| 1 Vehicle | 526 (20.0%) | 272 (36.6%) |
| 2 Vehicles | 1,028 (39.2%) | 248 (33.4%) |
| 3 or more Vehicles | 1,016 (38.7%) | 161 (21.7%) |
| Total | 2,625 (100.0%) | 743 (100.0%) |
Real Estate & Mortgages in Grant County
Real Estate and Mortgage Overview in Grant County
| Characteristic | Without Mortgage | With Mortgage |
| Housing Units | 1,448 | 1,177 |
| Median Property Value | $184,100 | $186,400 |
| Median Household Income | $58,977 | $102 |
| Monthly Housing Costs | $470 | $78 |
| Real Estate Taxes | $1,643 | $35 |
Property Value by Mortgage Status in Grant County
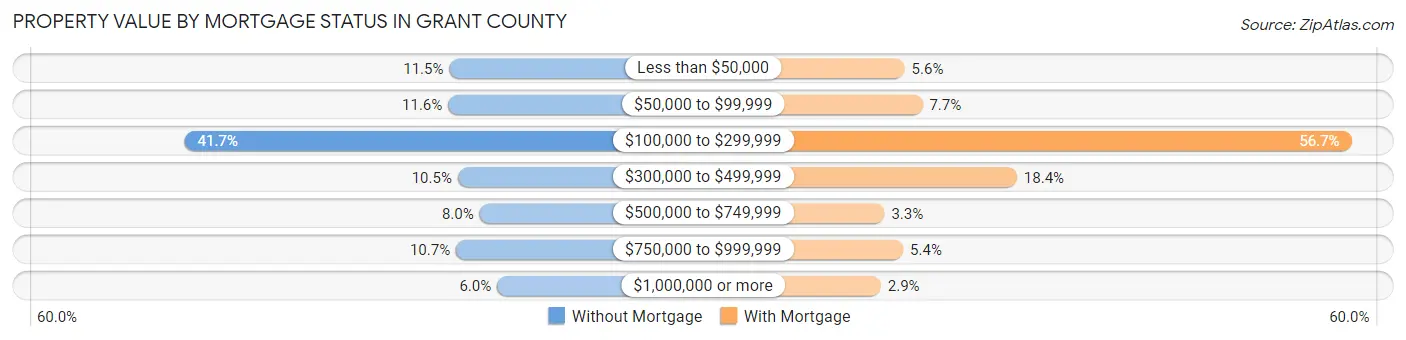
| Property Value | Without Mortgage | With Mortgage |
| Less than $50,000 | 166 (11.5%) | 66 (5.6%) |
| $50,000 to $99,999 | 168 (11.6%) | 90 (7.6%) |
| $100,000 to $299,999 | 604 (41.7%) | 667 (56.7%) |
| $300,000 to $499,999 | 152 (10.5%) | 217 (18.4%) |
| $500,000 to $749,999 | 116 (8.0%) | 39 (3.3%) |
| $750,000 to $999,999 | 155 (10.7%) | 64 (5.4%) |
| $1,000,000 or more | 87 (6.0%) | 34 (2.9%) |
| Total | 1,448 (100.0%) | 1,177 (100.0%) |
Household Income by Mortgage Status in Grant County
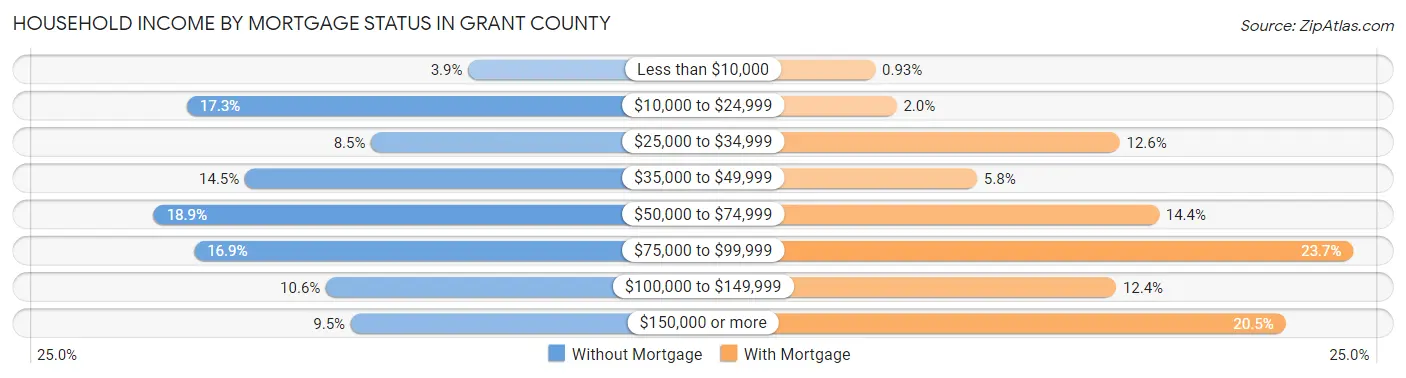
| Household Income | Without Mortgage | With Mortgage |
| Less than $10,000 | 56 (3.9%) | 11 (0.9%) |
| $10,000 to $24,999 | 250 (17.3%) | 23 (1.9%) |
| $25,000 to $34,999 | 123 (8.5%) | 148 (12.6%) |
| $35,000 to $49,999 | 210 (14.5%) | 68 (5.8%) |
| $50,000 to $74,999 | 273 (18.9%) | 170 (14.4%) |
| $75,000 to $99,999 | 245 (16.9%) | 279 (23.7%) |
| $100,000 to $149,999 | 154 (10.6%) | 146 (12.4%) |
| $150,000 or more | 137 (9.5%) | 241 (20.5%) |
| Total | 1,448 (100.0%) | 1,177 (100.0%) |
Property Value to Household Income Ratio in Grant County
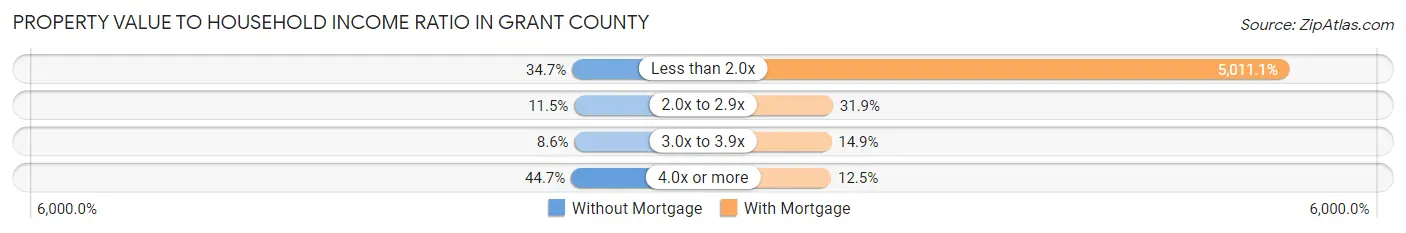
| Value-to-Income Ratio | Without Mortgage | With Mortgage |
| Less than 2.0x | 502 (34.7%) | 58,980 (5,011.1%) |
| 2.0x to 2.9x | 166 (11.5%) | 375 (31.9%) |
| 3.0x to 3.9x | 124 (8.6%) | 175 (14.9%) |
| 4.0x or more | 647 (44.7%) | 147 (12.5%) |
| Total | 1,448 (100.0%) | 1,177 (100.0%) |
Real Estate Taxes by Mortgage Status in Grant County
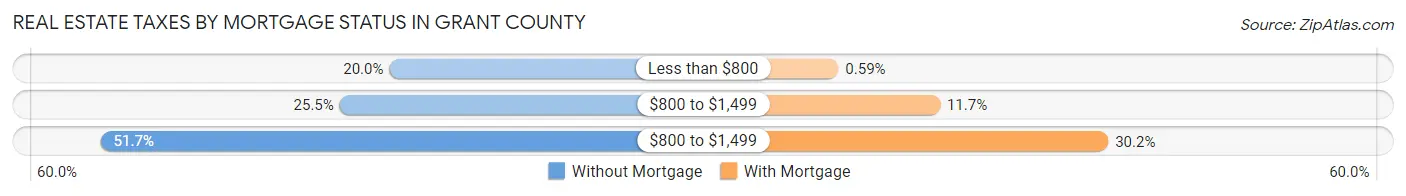
| Property Taxes | Without Mortgage | With Mortgage |
| Less than $800 | 290 (20.0%) | 7 (0.6%) |
| $800 to $1,499 | 369 (25.5%) | 138 (11.7%) |
| $800 to $1,499 | 748 (51.7%) | 355 (30.2%) |
| Total | 1,448 (100.0%) | 1,177 (100.0%) |
Health & Disability in Grant County
Health Insurance Coverage by Age in Grant County
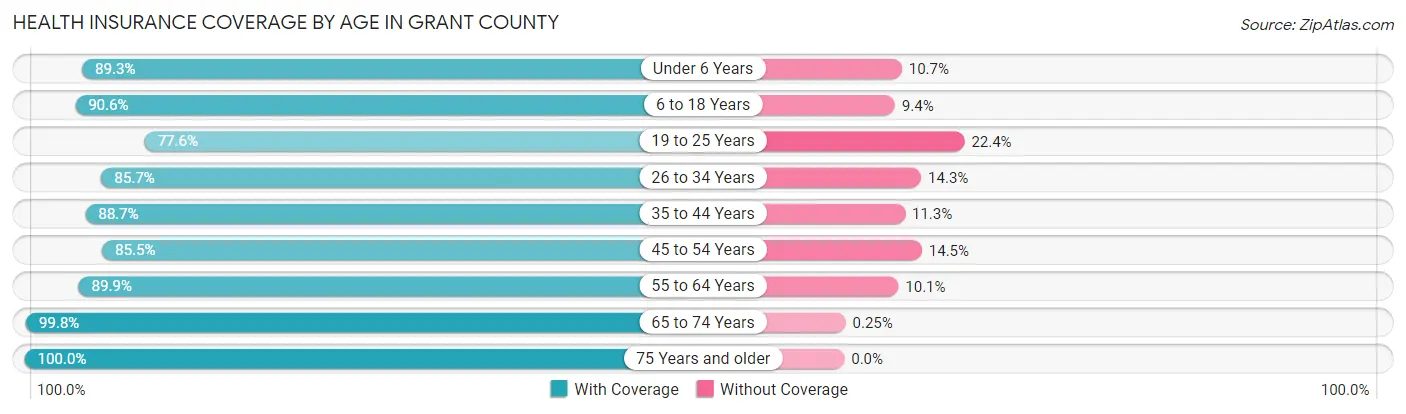
| Age Bracket | With Coverage | Without Coverage |
| Under 6 Years | 333 (89.3%) | 40 (10.7%) |
| 6 to 18 Years | 815 (90.6%) | 85 (9.4%) |
| 19 to 25 Years | 315 (77.6%) | 91 (22.4%) |
| 26 to 34 Years | 550 (85.7%) | 92 (14.3%) |
| 35 to 44 Years | 689 (88.7%) | 88 (11.3%) |
| 45 to 54 Years | 650 (85.5%) | 110 (14.5%) |
| 55 to 64 Years | 981 (89.9%) | 110 (10.1%) |
| 65 to 74 Years | 1,206 (99.8%) | 3 (0.3%) |
| 75 Years and older | 979 (100.0%) | 0 (0.0%) |
| Total | 6,518 (91.3%) | 619 (8.7%) |
Health Insurance Coverage by Citizenship Status in Grant County
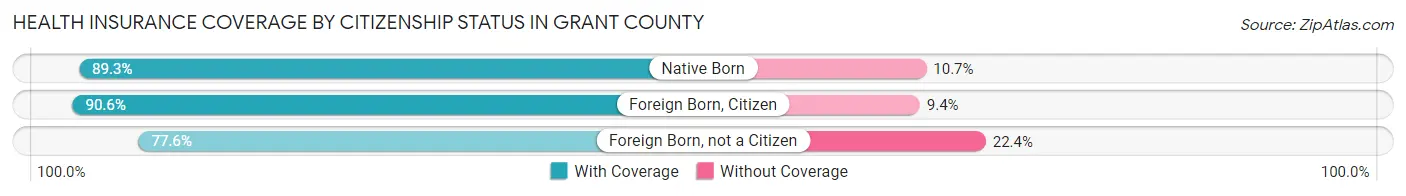
| Citizenship Status | With Coverage | Without Coverage |
| Native Born | 333 (89.3%) | 40 (10.7%) |
| Foreign Born, Citizen | 815 (90.6%) | 85 (9.4%) |
| Foreign Born, not a Citizen | 315 (77.6%) | 91 (22.4%) |
Health Insurance Coverage by Household Income in Grant County
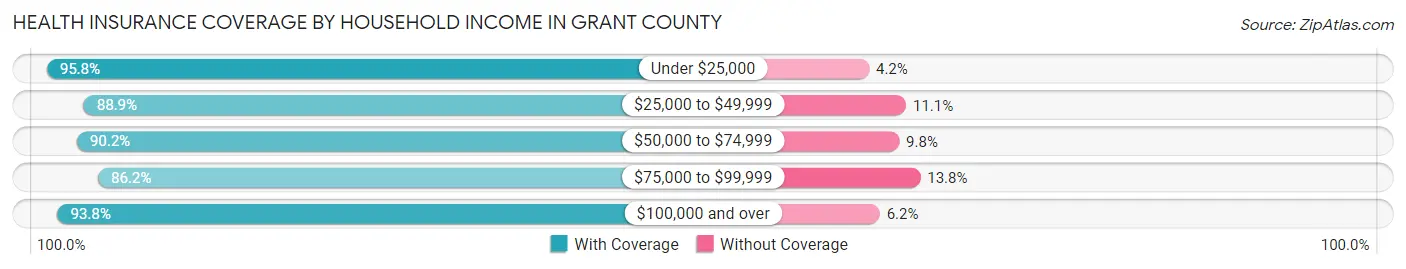
| Household Income | With Coverage | Without Coverage |
| Under $25,000 | 1,104 (95.8%) | 48 (4.2%) |
| $25,000 to $49,999 | 1,169 (88.9%) | 146 (11.1%) |
| $50,000 to $74,999 | 1,232 (90.2%) | 134 (9.8%) |
| $75,000 to $99,999 | 1,027 (86.2%) | 164 (13.8%) |
| $100,000 and over | 1,886 (93.8%) | 124 (6.2%) |
Public vs Private Health Insurance Coverage by Age in Grant County
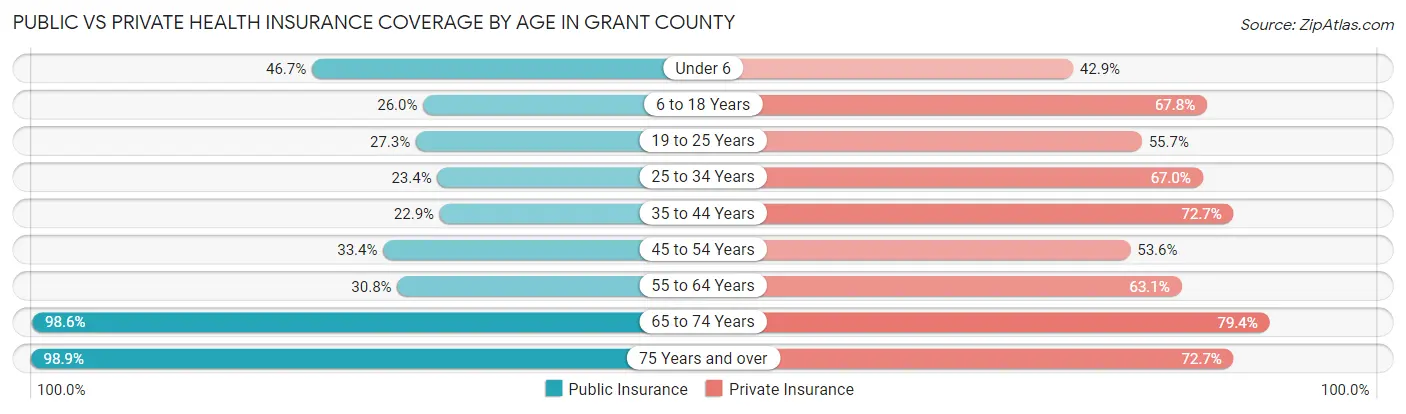
| Age Bracket | Public Insurance | Private Insurance |
| Under 6 | 174 (46.7%) | 160 (42.9%) |
| 6 to 18 Years | 234 (26.0%) | 610 (67.8%) |
| 19 to 25 Years | 111 (27.3%) | 226 (55.7%) |
| 25 to 34 Years | 150 (23.4%) | 430 (67.0%) |
| 35 to 44 Years | 178 (22.9%) | 565 (72.7%) |
| 45 to 54 Years | 254 (33.4%) | 407 (53.5%) |
| 55 to 64 Years | 336 (30.8%) | 688 (63.1%) |
| 65 to 74 Years | 1,192 (98.6%) | 960 (79.4%) |
| 75 Years and over | 968 (98.9%) | 712 (72.7%) |
| Total | 3,597 (50.4%) | 4,758 (66.7%) |
Disability Status by Sex by Age in Grant County
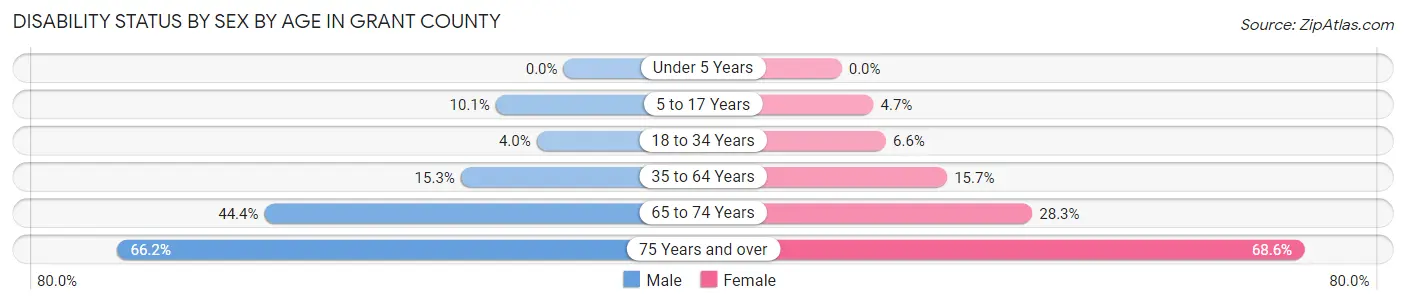
| Age Bracket | Male | Female |
| Under 5 Years | 0 (0.0%) | 0 (0.0%) |
| 5 to 17 Years | 48 (10.1%) | 21 (4.7%) |
| 18 to 34 Years | 21 (4.0%) | 37 (6.6%) |
| 35 to 64 Years | 206 (15.2%) | 200 (15.7%) |
| 65 to 74 Years | 278 (44.4%) | 165 (28.3%) |
| 75 Years and over | 321 (66.2%) | 339 (68.6%) |
Disability Class by Sex by Age in Grant County
Disability Class: Hearing Difficulty
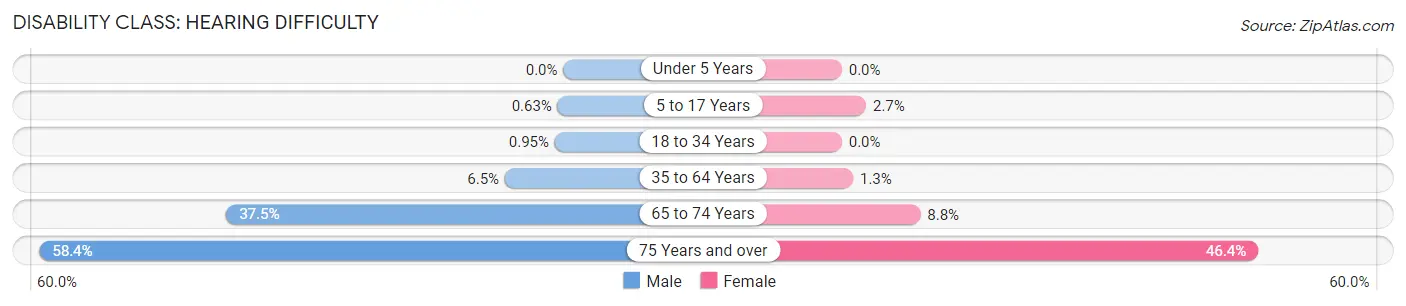
| Age Bracket | Male | Female |
| Under 5 Years | 0 (0.0%) | 0 (0.0%) |
| 5 to 17 Years | 3 (0.6%) | 12 (2.7%) |
| 18 to 34 Years | 5 (0.9%) | 0 (0.0%) |
| 35 to 64 Years | 88 (6.5%) | 16 (1.3%) |
| 65 to 74 Years | 235 (37.5%) | 51 (8.7%) |
| 75 Years and over | 283 (58.4%) | 229 (46.4%) |
Disability Class: Vision Difficulty
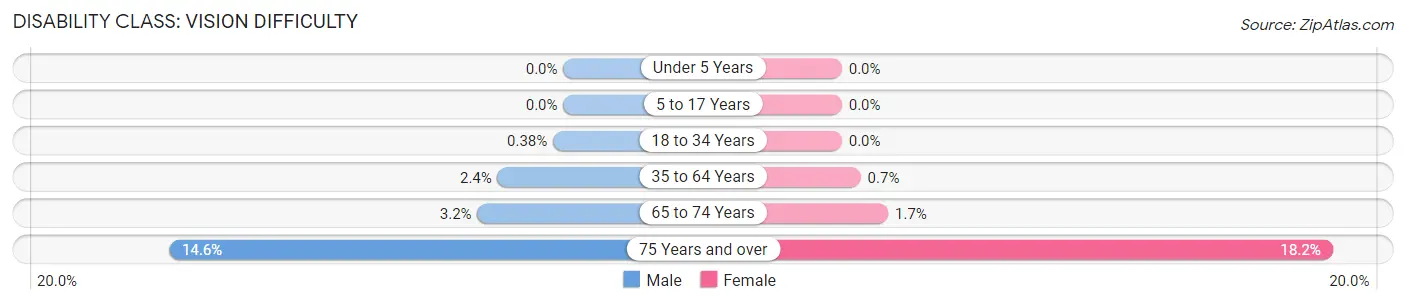
| Age Bracket | Male | Female |
| Under 5 Years | 0 (0.0%) | 0 (0.0%) |
| 5 to 17 Years | 0 (0.0%) | 0 (0.0%) |
| 18 to 34 Years | 2 (0.4%) | 0 (0.0%) |
| 35 to 64 Years | 33 (2.4%) | 9 (0.7%) |
| 65 to 74 Years | 20 (3.2%) | 10 (1.7%) |
| 75 Years and over | 71 (14.6%) | 90 (18.2%) |
Disability Class: Cognitive Difficulty
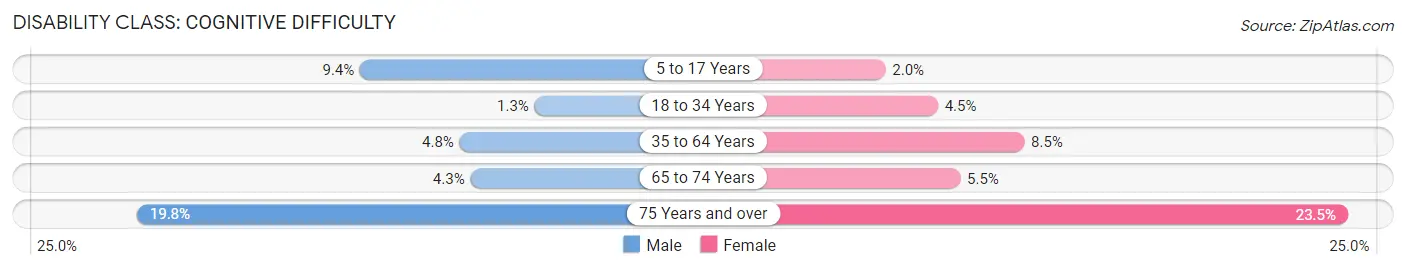
| Age Bracket | Male | Female |
| 5 to 17 Years | 45 (9.4%) | 9 (2.0%) |
| 18 to 34 Years | 7 (1.3%) | 25 (4.4%) |
| 35 to 64 Years | 65 (4.8%) | 108 (8.5%) |
| 65 to 74 Years | 27 (4.3%) | 32 (5.5%) |
| 75 Years and over | 96 (19.8%) | 116 (23.5%) |
Disability Class: Ambulatory Difficulty
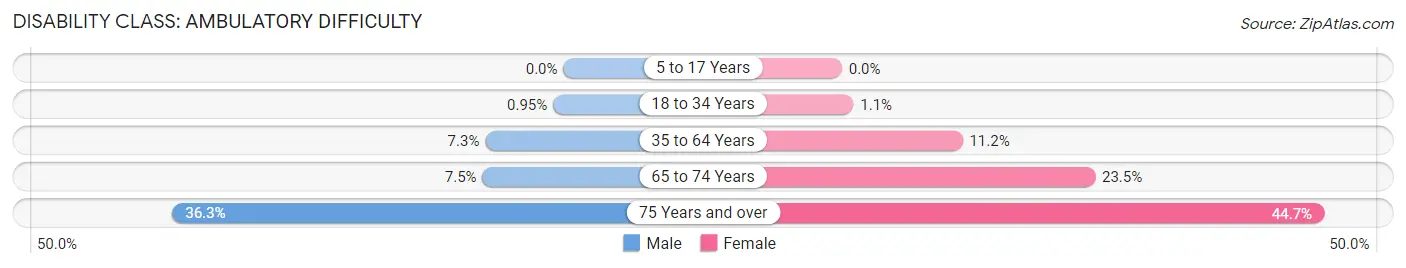
| Age Bracket | Male | Female |
| 5 to 17 Years | 0 (0.0%) | 0 (0.0%) |
| 18 to 34 Years | 5 (0.9%) | 6 (1.1%) |
| 35 to 64 Years | 98 (7.2%) | 143 (11.2%) |
| 65 to 74 Years | 47 (7.5%) | 137 (23.5%) |
| 75 Years and over | 176 (36.3%) | 221 (44.7%) |
Disability Class: Self-Care Difficulty
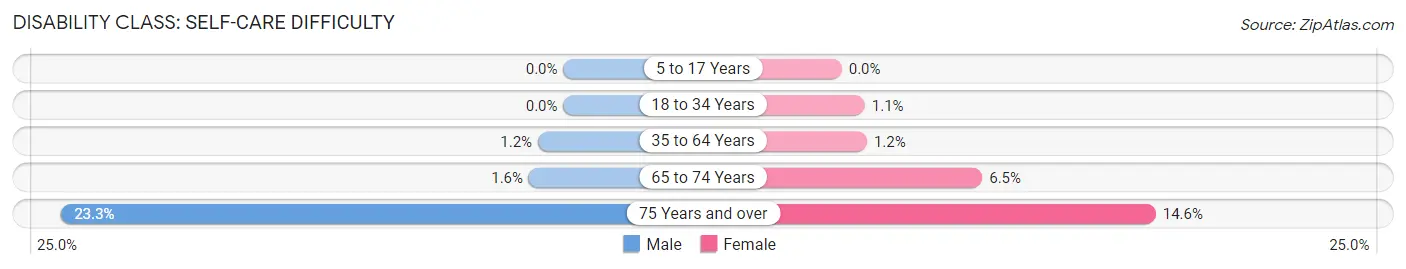
| Age Bracket | Male | Female |
| 5 to 17 Years | 0 (0.0%) | 0 (0.0%) |
| 18 to 34 Years | 0 (0.0%) | 6 (1.1%) |
| 35 to 64 Years | 16 (1.2%) | 15 (1.2%) |
| 65 to 74 Years | 10 (1.6%) | 38 (6.5%) |
| 75 Years and over | 113 (23.3%) | 72 (14.6%) |
Technology Access in Grant County
Computing Device Access in Grant County
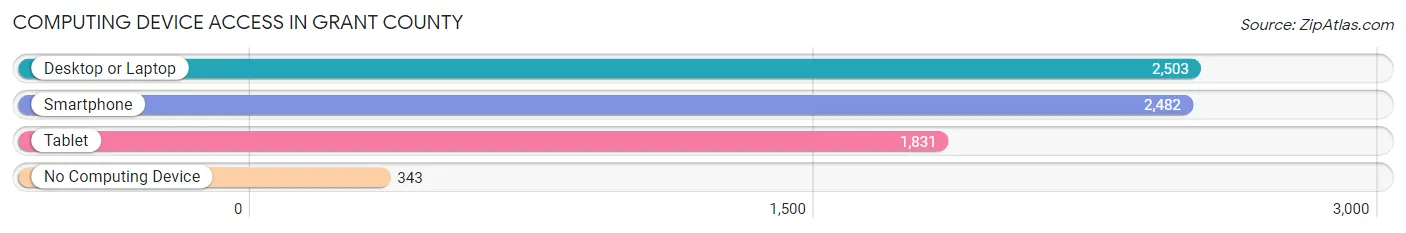
| Device Type | # Households | % Households |
| Desktop or Laptop | 2,503 | 74.3% |
| Smartphone | 2,482 | 73.7% |
| Tablet | 1,831 | 54.4% |
| No Computing Device | 343 | 10.2% |
| Total | 3,368 | 100.0% |
Internet Access in Grant County
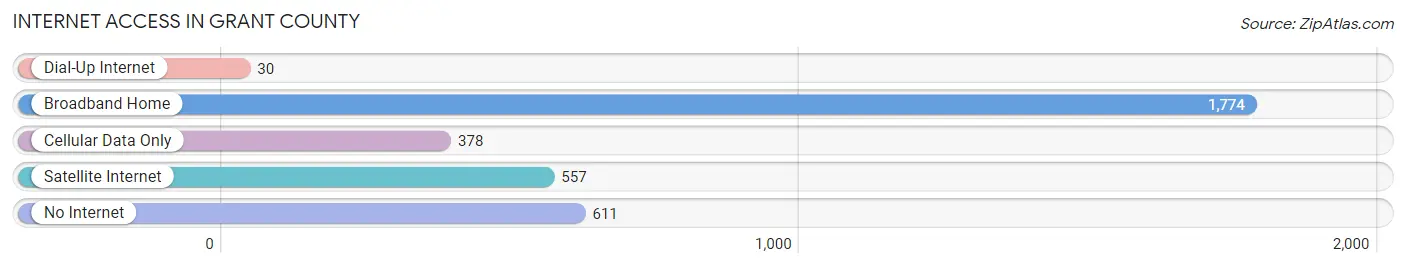
| Internet Type | # Households | % Households |
| Dial-Up Internet | 30 | 0.9% |
| Broadband Home | 1,774 | 52.7% |
| Cellular Data Only | 378 | 11.2% |
| Satellite Internet | 557 | 16.5% |
| No Internet | 611 | 18.1% |
| Total | 3,368 | 100.0% |
Grant County Summary
County History
Grant County is located in the eastern part of Oregon and is the fifth largest county in the state. It was established in 1864 and named after President Ulysses S. Grant. The county was originally inhabited by the Northern Paiute and the Wasco-Wishram tribes. The first settlers arrived in the area in the late 1860s and early 1870s. The county was primarily used for ranching and farming, and the population grew steadily throughout the late 19th and early 20th centuries.
The county experienced a period of rapid growth in the 1950s and 1960s due to the construction of the John Day Dam and the development of the Columbia River Gorge. This period of growth was followed by a period of decline in the 1970s and 1980s due to the closure of several mines and the decline of the timber industry. The county has since experienced a resurgence in population growth due to the development of tourism and recreation in the area.
Geography
Grant County is located in the eastern part of Oregon and is bordered by the states of Washington and Idaho. The county covers an area of 5,945 square miles and is the fifth largest county in the state. The terrain is mostly mountainous and includes the Blue Mountains, the John Day River, and the Columbia River Gorge. The highest point in the county is the summit of Mount Hood at 11,249 feet.
The climate of Grant County is generally dry and semi-arid, with hot summers and cold winters. The average annual precipitation is around 12 inches, with most of it falling in the winter months.
Economy
The economy of Grant County is largely based on agriculture, tourism, and recreation. The county is home to several large farms and ranches, as well as several wineries and vineyards. Tourism and recreation are also important to the economy, with the county being home to several national parks and monuments, as well as numerous outdoor recreation opportunities.
The county is also home to several large industries, including a paper mill, a lumber mill, and a cement plant. The county is also home to several mining operations, including gold, silver, and copper mines.
Demographics
As of the 2010 census, Grant County had a population of 7,445. The population is spread out with a median age of 44.7 years. The racial makeup of the county is 87.3% White, 0.7% African American, 0.7% Native American, 0.3% Asian, 0.1% Pacific Islander, 8.2% from other races, and 2.9% from two or more races.
The largest ancestry groups in the county are German (25.2%), English (17.2%), Irish (14.2%), and American (13.2%). The median household income in the county is $41,945 and the median family income is $50,945. The per capita income in the county is $21,945.
Common Questions
What is the Total Population of Grant County?
Total Population of Grant County is 7,237.
What is the Total Male Population of Grant County?
Total Male Population of Grant County is 3,672.
What is the Total Female Population of Grant County?
Total Female Population of Grant County is 3,565.
What is the Ratio of Males per 100 Females in Grant County?
There are 103.00 Males per 100 Females in Grant County.
What is the Ratio of Females per 100 Males in Grant County?
There are 97.09 Females per 100 Males in Grant County.
What is the Median Population Age in Grant County?
Median Population Age in Grant County is 51.7 Years.
What is the Average Family Size in Grant County
Average Family Size in Grant County is 2.6 People.
What is the Average Household Size in Grant County
Average Household Size in Grant County is 2.1 People.
What is Per Capita Income in Grant County?
Per Capita income in Grant County is $33,409.
What is the Median Family Income in Grant County?
Median Family Income in Grant County is $67,003.
What is the Median Household income in Grant County?
Median Household Income in Grant County is $56,045.
What is Income or Wage Gap in Grant County?
Income or Wage Gap in Grant County is 34.6%.
Women in Grant County earn 65.4 cents for every dollar earned by a man.
What is Inequality or Gini Index in Grant County?
Inequality or Gini Index in Grant County is 0.44.
How Large is the Labor Force in Grant County?
There are 3,181 People in the Labor Forcein in Grant County.
What is the Percentage of People in the Labor Force in Grant County?
51.7% of People are in the Labor Force in Grant County.
What is the Unemployment Rate in Grant County?
Unemployment Rate in Grant County is 7.5%.