Gilliam County, OR
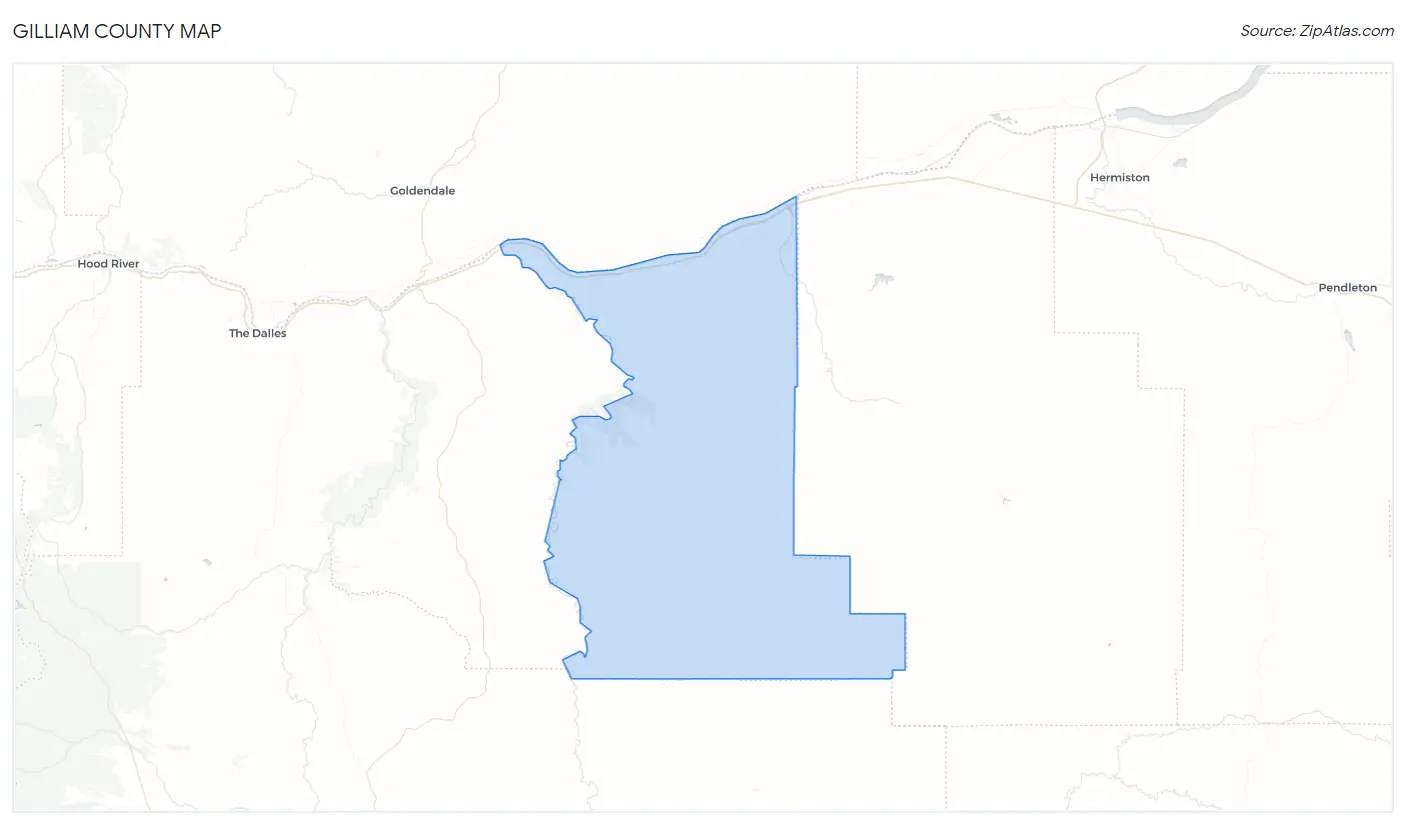
Gilliam County Map
Gilliam County Overview
1,983
TOTAL POPULATION
1,029
MALE POPULATION
954
FEMALE POPULATION
107.86
MALES / 100 FEMALES
92.71
FEMALES / 100 MALES
51.0
MEDIAN AGE
3.1
AVG FAMILY SIZE
2.2
AVG HOUSEHOLD SIZE
$34,042
PER CAPITA INCOME
$72,431
AVG FAMILY INCOME
$58,409
AVG HOUSEHOLD INCOME
26.8%
WAGE / INCOME GAP [ % ]
73.2¢/ $1
WAGE / INCOME GAP [ $ ]
0.46
INEQUALITY / GINI INDEX
856
LABOR FORCE [ PEOPLE ]
51.8%
PERCENT IN LABOR FORCE
6.3%
UNEMPLOYMENT RATE
Gilliam County Area Codes
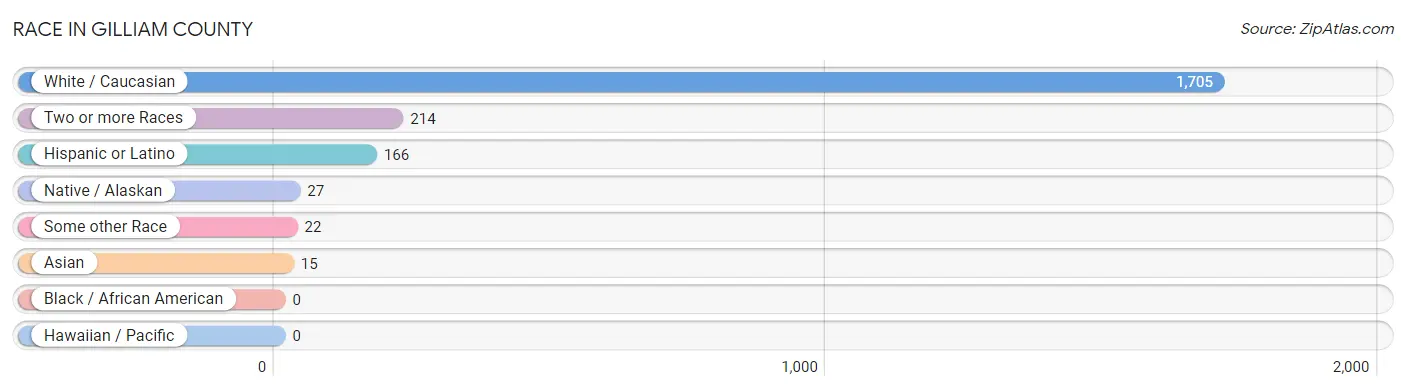
Race in Gilliam County
The most populous races in Gilliam County are White / Caucasian (1,705 | 86.0%), Two or more Races (214 | 10.8%), and Hispanic or Latino (166 | 8.4%).
| Race | # Population | % Population |
| Asian | 15 | 0.8% |
| Black / African American | 0 | 0.0% |
| Hawaiian / Pacific | 0 | 0.0% |
| Hispanic or Latino | 166 | 8.4% |
| Native / Alaskan | 27 | 1.4% |
| White / Caucasian | 1,705 | 86.0% |
| Two or more Races | 214 | 10.8% |
| Some other Race | 22 | 1.1% |
| Total | 1,983 | 100.0% |
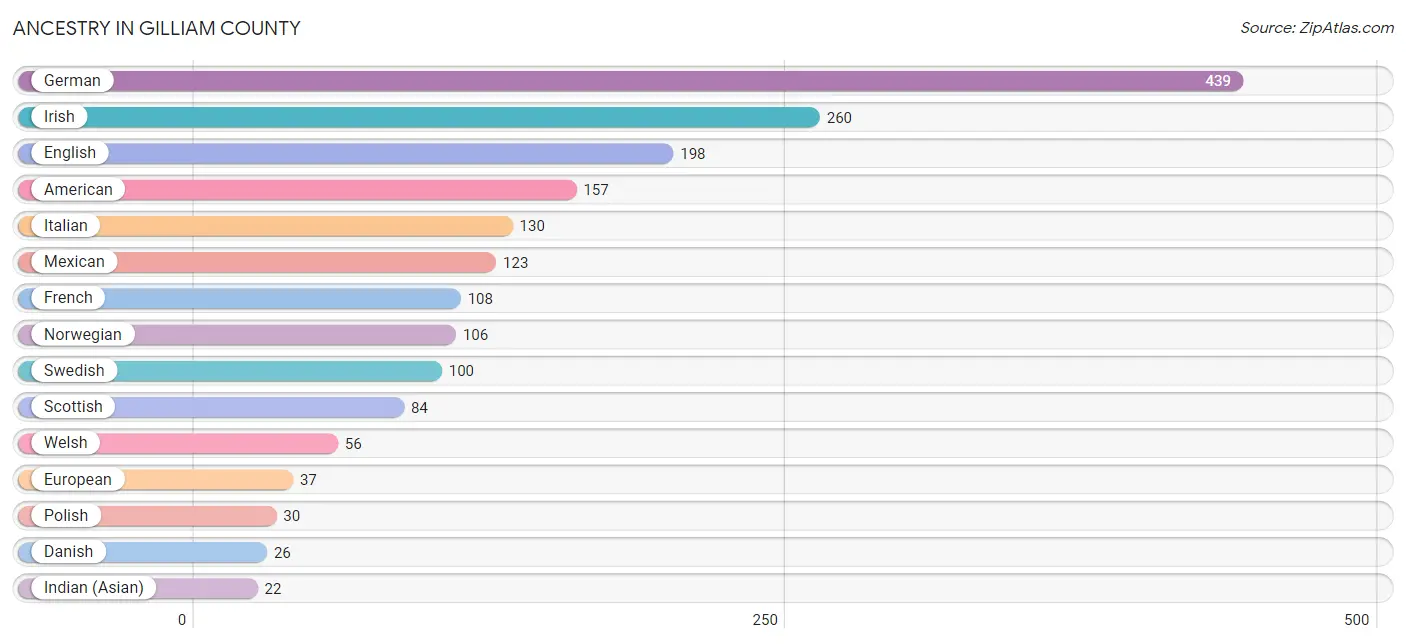
Ancestry in Gilliam County
The most populous ancestries reported in Gilliam County are German (439 | 22.1%), Irish (260 | 13.1%), English (198 | 10.0%), American (157 | 7.9%), and Italian (130 | 6.6%), together accounting for 59.7% of all Gilliam County residents.
| Ancestry | # Population | % Population |
| American | 157 | 7.9% |
| Armenian | 7 | 0.4% |
| Austrian | 7 | 0.4% |
| British | 6 | 0.3% |
| Burmese | 8 | 0.4% |
| Canadian | 6 | 0.3% |
| Central American Indian | 5 | 0.3% |
| Cherokee | 7 | 0.4% |
| Czech | 5 | 0.3% |
| Danish | 26 | 1.3% |
| Dutch | 12 | 0.6% |
| Eastern European | 6 | 0.3% |
| English | 198 | 10.0% |
| European | 37 | 1.9% |
| Finnish | 5 | 0.3% |
| French | 108 | 5.4% |
| French Canadian | 5 | 0.3% |
| German | 439 | 22.1% |
| Indian (Asian) | 22 | 1.1% |
| Irish | 260 | 13.1% |
| Italian | 130 | 6.6% |
| Mexican | 123 | 6.2% |
| Norwegian | 106 | 5.3% |
| Pennsylvania German | 18 | 0.9% |
| Peruvian | 11 | 0.5% |
| Polish | 30 | 1.5% |
| Portuguese | 15 | 0.8% |
| Russian | 18 | 0.9% |
| Scandinavian | 7 | 0.4% |
| Scotch-Irish | 22 | 1.1% |
| Scottish | 84 | 4.2% |
| Sioux | 20 | 1.0% |
| South American | 11 | 0.5% |
| Spanish | 13 | 0.7% |
| Sri Lankan | 2 | 0.1% |
| Swedish | 100 | 5.0% |
| Swiss | 2 | 0.1% |
| Welsh | 56 | 2.8% | View All 38 Rows |
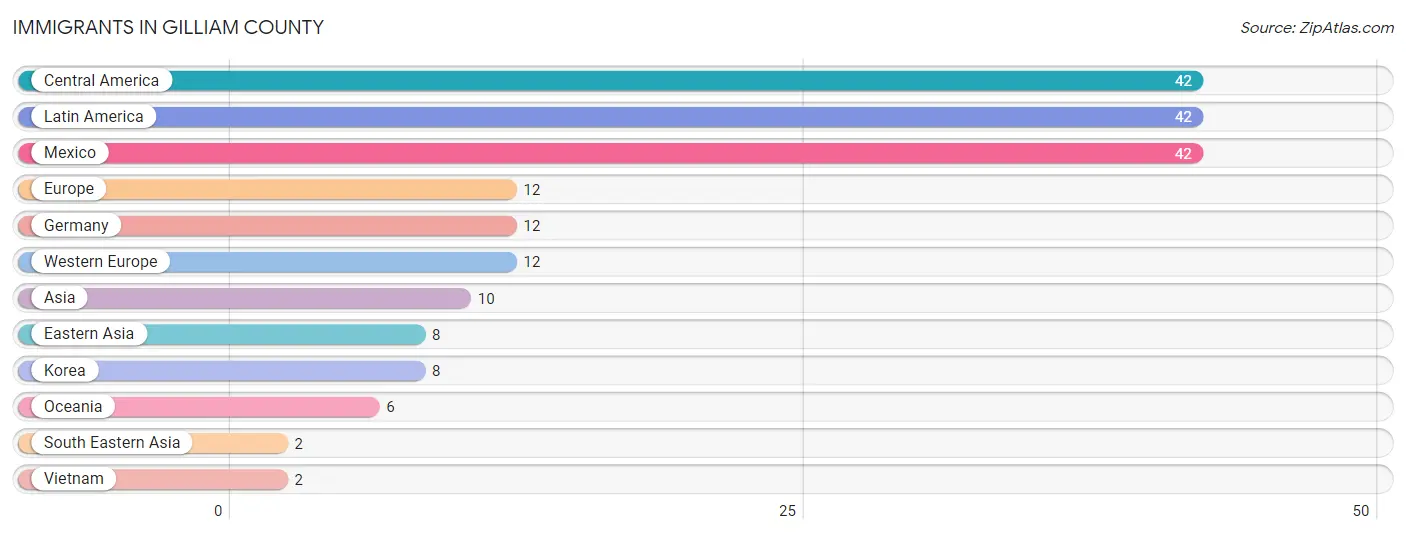
Immigrants in Gilliam County
The most numerous immigrant groups reported in Gilliam County came from Central America (42 | 2.1%), Latin America (42 | 2.1%), Mexico (42 | 2.1%), Europe (12 | 0.6%), and Germany (12 | 0.6%), together accounting for 7.6% of all Gilliam County residents.
| Immigration Origin | # Population | % Population |
| Asia | 10 | 0.5% |
| Central America | 42 | 2.1% |
| Eastern Asia | 8 | 0.4% |
| Europe | 12 | 0.6% |
| Germany | 12 | 0.6% |
| Korea | 8 | 0.4% |
| Latin America | 42 | 2.1% |
| Mexico | 42 | 2.1% |
| Oceania | 6 | 0.3% |
| South Eastern Asia | 2 | 0.1% |
| Vietnam | 2 | 0.1% |
| Western Europe | 12 | 0.6% | View All 12 Rows |
Sex and Age in Gilliam County
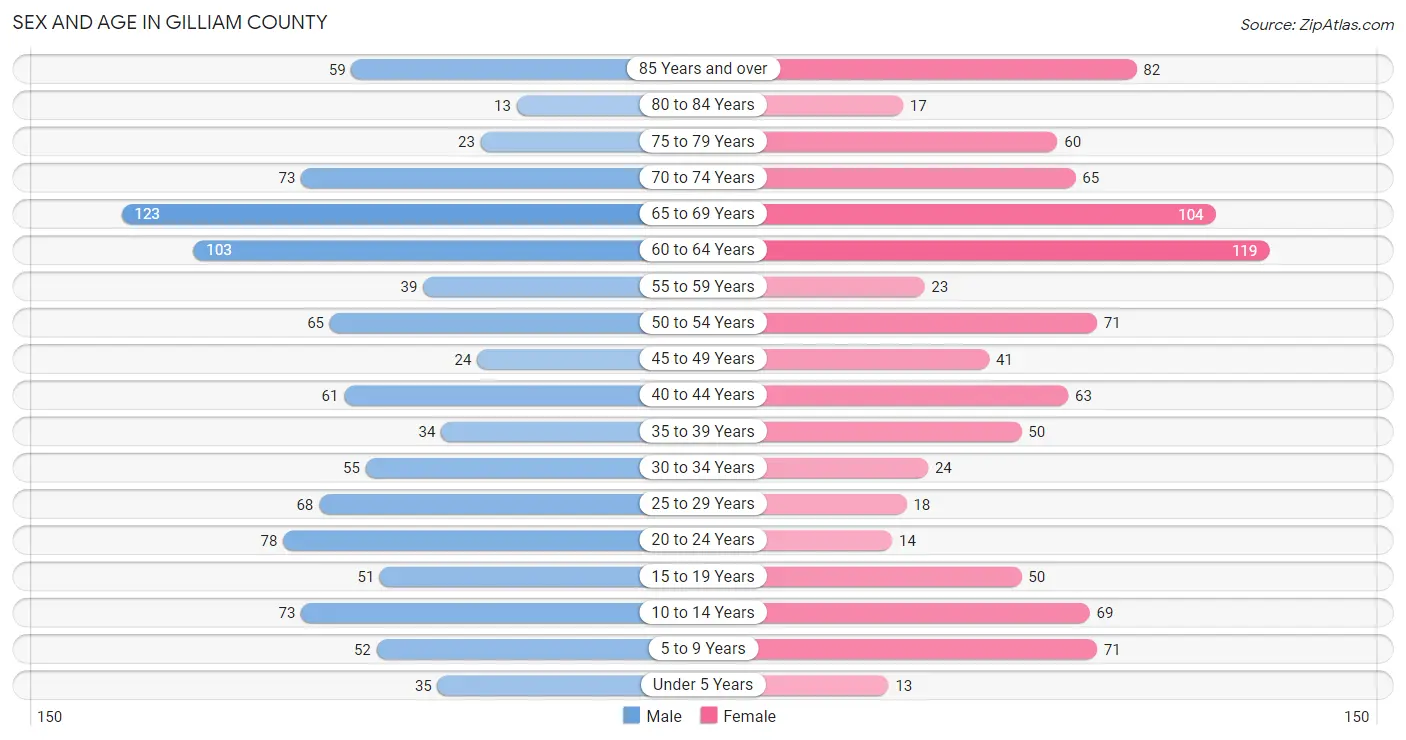
Sex and Age in Gilliam County
The most populous age groups in Gilliam County are 65 to 69 Years (123 | 11.9%) for men and 60 to 64 Years (119 | 12.5%) for women.
| Age Bracket | Male | Female |
| Under 5 Years | 35 (3.4%) | 13 (1.4%) |
| 5 to 9 Years | 52 (5.1%) | 71 (7.4%) |
| 10 to 14 Years | 73 (7.1%) | 69 (7.2%) |
| 15 to 19 Years | 51 (5.0%) | 50 (5.2%) |
| 20 to 24 Years | 78 (7.6%) | 14 (1.5%) |
| 25 to 29 Years | 68 (6.6%) | 18 (1.9%) |
| 30 to 34 Years | 55 (5.3%) | 24 (2.5%) |
| 35 to 39 Years | 34 (3.3%) | 50 (5.2%) |
| 40 to 44 Years | 61 (5.9%) | 63 (6.6%) |
| 45 to 49 Years | 24 (2.3%) | 41 (4.3%) |
| 50 to 54 Years | 65 (6.3%) | 71 (7.4%) |
| 55 to 59 Years | 39 (3.8%) | 23 (2.4%) |
| 60 to 64 Years | 103 (10.0%) | 119 (12.5%) |
| 65 to 69 Years | 123 (11.9%) | 104 (10.9%) |
| 70 to 74 Years | 73 (7.1%) | 65 (6.8%) |
| 75 to 79 Years | 23 (2.2%) | 60 (6.3%) |
| 80 to 84 Years | 13 (1.3%) | 17 (1.8%) |
| 85 Years and over | 59 (5.7%) | 82 (8.6%) |
| Total | 1,029 (100.0%) | 954 (100.0%) |
Families and Households in Gilliam County
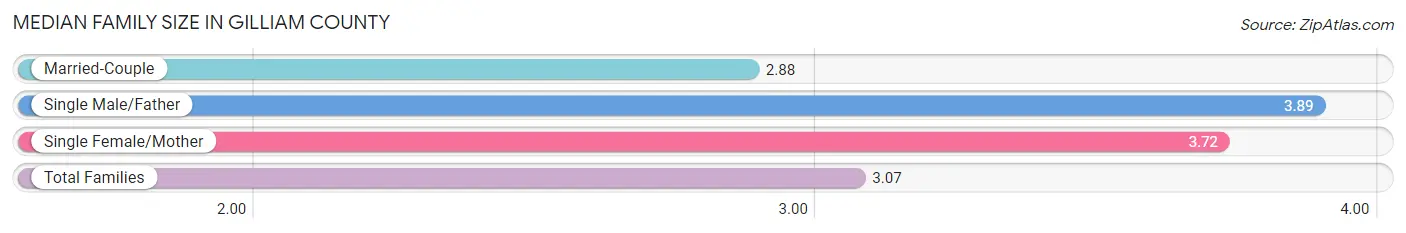
Median Family Size in Gilliam County
The median family size in Gilliam County is 3.07 persons per family, with single male/father families (19 | 4.2%) accounting for the largest median family size of 3.89 persons per family. On the other hand, married-couple families (352 | 78.4%) represent the smallest median family size with 2.88 persons per family.
| Family Type | # Families | Family Size |
| Married-Couple | 352 (78.4%) | 2.88 |
| Single Male/Father | 19 (4.2%) | 3.89 |
| Single Female/Mother | 78 (17.4%) | 3.72 |
| Total Families | 449 (100.0%) | 3.07 |
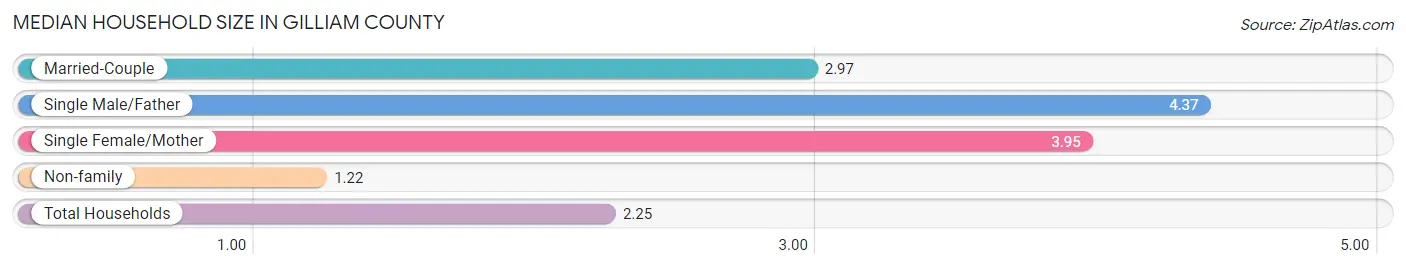
Median Household Size in Gilliam County
The median household size in Gilliam County is 2.25 persons per household, with single male/father households (19 | 2.2%) accounting for the largest median household size of 4.37 persons per household. non-family households (413 | 47.9%) represent the smallest median household size with 1.22 persons per household.
| Household Type | # Households | Household Size |
| Married-Couple | 352 (40.8%) | 2.97 |
| Single Male/Father | 19 (2.2%) | 4.37 |
| Single Female/Mother | 78 (9.0%) | 3.95 |
| Non-family | 413 (47.9%) | 1.22 |
| Total Households | 862 (100.0%) | 2.25 |
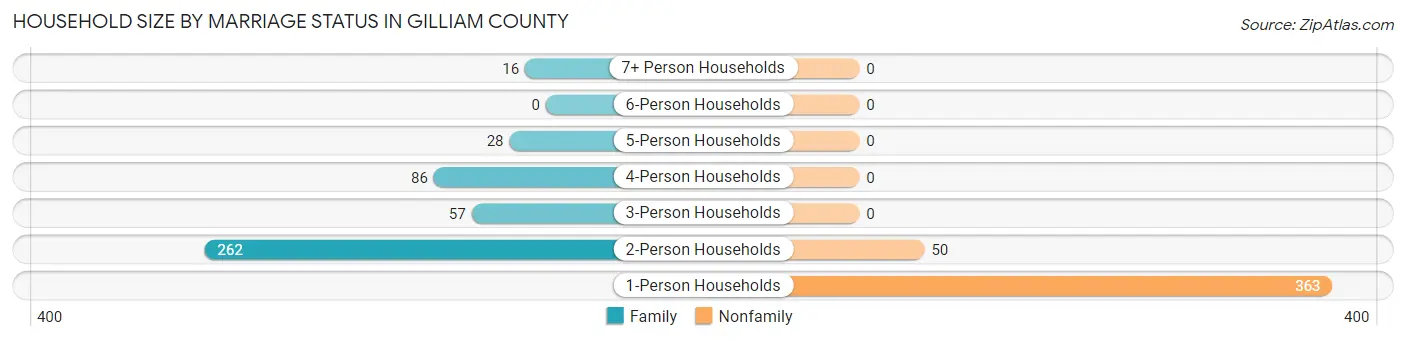
Household Size by Marriage Status in Gilliam County
Out of a total of 862 households in Gilliam County, 449 (52.1%) are family households, while 413 (47.9%) are nonfamily households. The most numerous type of family households are 2-person households, comprising 262, and the most common type of nonfamily households are 1-person households, comprising 363.
| Household Size | Family Households | Nonfamily Households |
| 1-Person Households | - | 363 (42.1%) |
| 2-Person Households | 262 (30.4%) | 50 (5.8%) |
| 3-Person Households | 57 (6.6%) | 0 (0.0%) |
| 4-Person Households | 86 (10.0%) | 0 (0.0%) |
| 5-Person Households | 28 (3.3%) | 0 (0.0%) |
| 6-Person Households | 0 (0.0%) | 0 (0.0%) |
| 7+ Person Households | 16 (1.9%) | 0 (0.0%) |
| Total | 449 (52.1%) | 413 (47.9%) |
Female Fertility in Gilliam County
Fertility by Age in Gilliam County
Average fertility rate in Gilliam County is 35.0 births per 1,000 women. Women in the age bracket of 20 to 34 years have the highest fertility rate with 179.0 births per 1,000 women. Women in the age bracket of 20 to 34 years acount for 100.0% of all women with births.
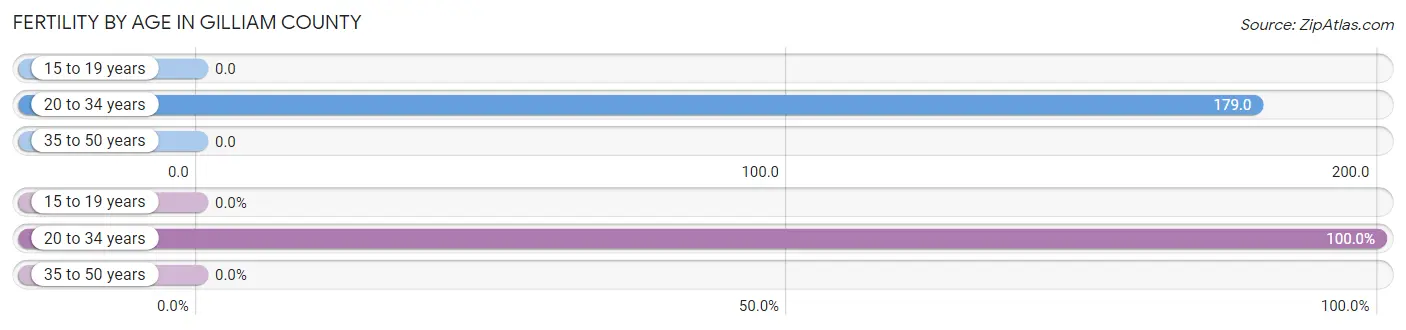
| Age Bracket | Women with Births | Births / 1,000 Women |
| 15 to 19 years | 0 (0.0%) | 0.0 |
| 20 to 34 years | 10 (100.0%) | 179.0 |
| 35 to 50 years | 0 (0.0%) | 0.0 |
| Total | 10 (100.0%) | 35.0 |
Fertility by Age by Marriage Status in Gilliam County
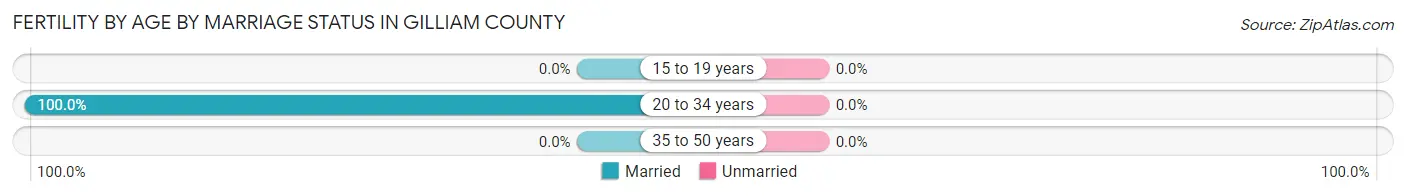
| Age Bracket | Married | Unmarried |
| 15 to 19 years | 0 (0.0%) | 0 (0.0%) |
| 20 to 34 years | 10 (100.0%) | 0 (0.0%) |
| 35 to 50 years | 0 (0.0%) | 0 (0.0%) |
| Total | 10 (100.0%) | 0 (0.0%) |
Fertility by Education in Gilliam County
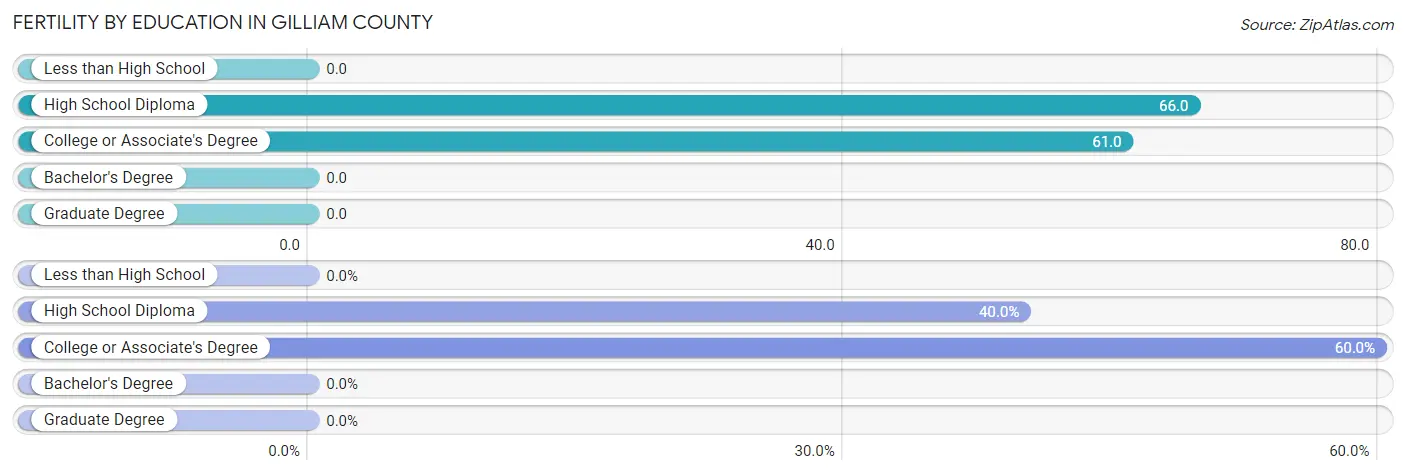
| Educational Attainment | Women with Births | Births / 1,000 Women |
| Less than High School | 0 (0.0%) | 0.0 |
| High School Diploma | 4 (40.0%) | 66.0 |
| College or Associate's Degree | 6 (60.0%) | 61.0 |
| Bachelor's Degree | 0 (0.0%) | 0.0 |
| Graduate Degree | 0 (0.0%) | 0.0 |
| Total | 10 (100.0%) | 35.0 |
Fertility by Education by Marriage Status in Gilliam County
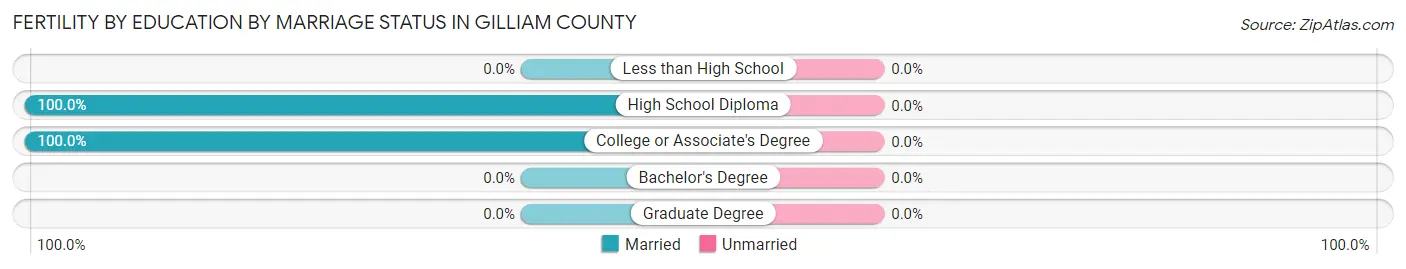
| Educational Attainment | Married | Unmarried |
| Less than High School | 0 (0.0%) | 0 (0.0%) |
| High School Diploma | 4 (100.0%) | 0 (0.0%) |
| College or Associate's Degree | 6 (100.0%) | 0 (0.0%) |
| Bachelor's Degree | 0 (0.0%) | 0 (0.0%) |
| Graduate Degree | 0 (0.0%) | 0 (0.0%) |
| Total | 10 (100.0%) | 0 (0.0%) |
Income in Gilliam County
Income Overview in Gilliam County
Per Capita Income in Gilliam County is $34,042, while median incomes of families and households are $72,431 and $58,409 respectively.
| Characteristic | Number | Measure |
| Per Capita Income | 1,983 | $34,042 |
| Median Family Income | 449 | $72,431 |
| Mean Family Income | 449 | $96,921 |
| Median Household Income | 862 | $58,409 |
| Mean Household Income | 862 | $74,044 |
| Income Deficit | 449 | $0 |
| Wage / Income Gap (%) | 1,983 | 26.78% |
| Wage / Income Gap ($) | 1,983 | 73.22¢ per $1 |
| Gini / Inequality Index | 1,983 | 0.46 |
Earnings by Sex in Gilliam County
Average Earnings in Gilliam County are $40,431, $45,324 for men and $33,188 for women, a difference of 26.8%.
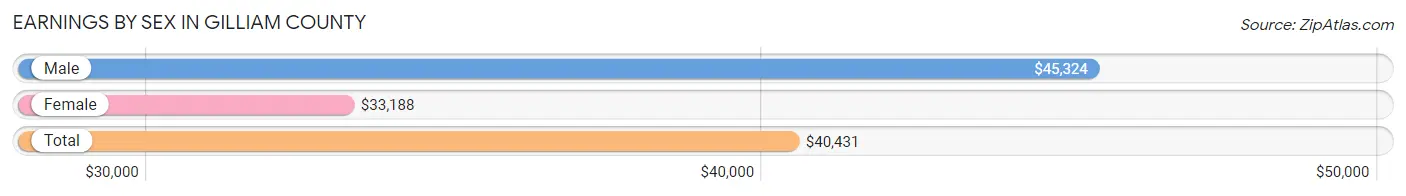
| Sex | Number | Average Earnings |
| Male | 565 (59.1%) | $45,324 |
| Female | 391 (40.9%) | $33,188 |
| Total | 956 (100.0%) | $40,431 |
Earnings by Sex by Income Bracket in Gilliam County
The most common earnings brackets in Gilliam County are $65,000 to $74,999 for men (68 | 12.0%) and $5,000 to $7,499 for women (47 | 12.0%).
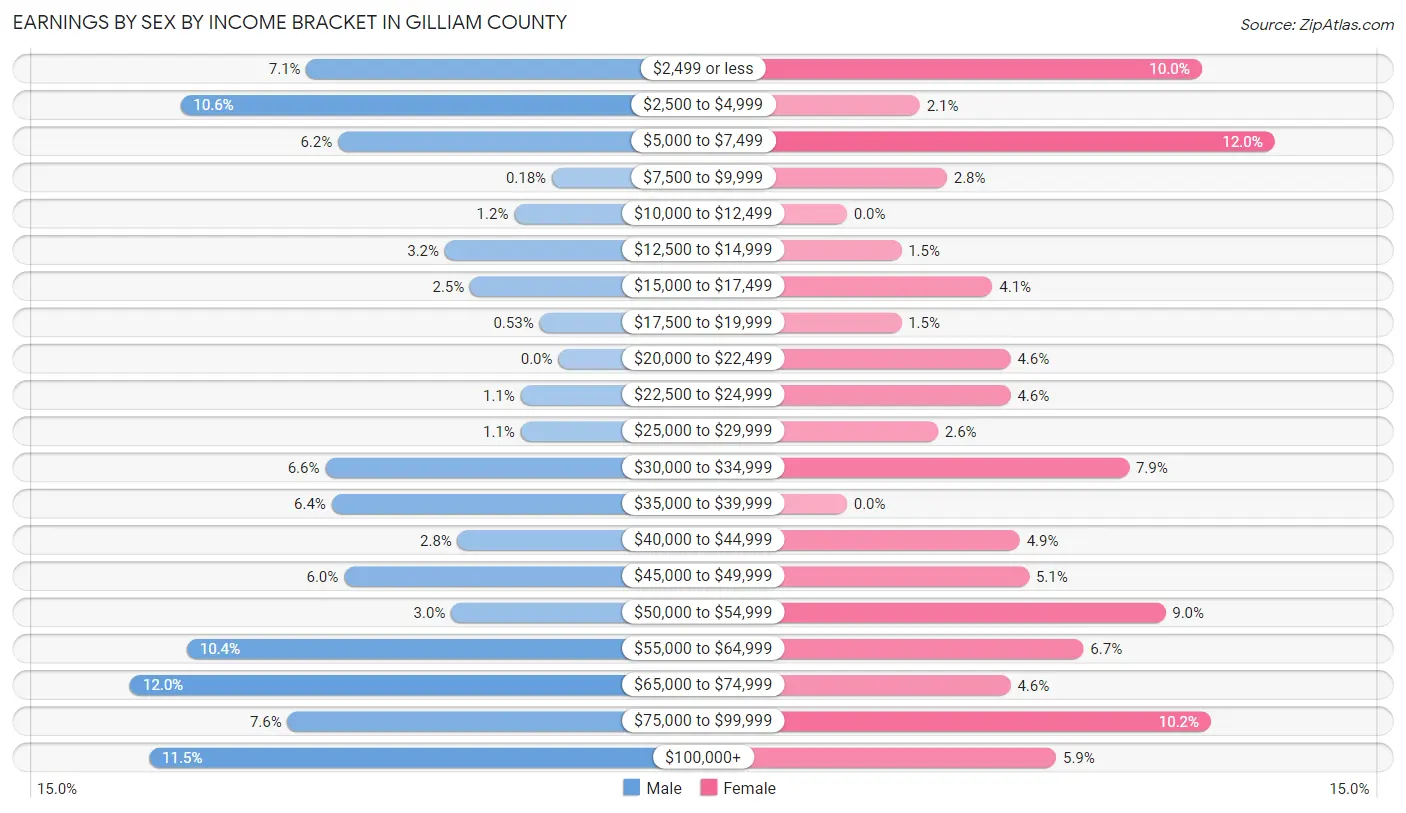
| Income | Male | Female |
| $2,499 or less | 40 (7.1%) | 39 (10.0%) |
| $2,500 to $4,999 | 60 (10.6%) | 8 (2.1%) |
| $5,000 to $7,499 | 35 (6.2%) | 47 (12.0%) |
| $7,500 to $9,999 | 1 (0.2%) | 11 (2.8%) |
| $10,000 to $12,499 | 7 (1.2%) | 0 (0.0%) |
| $12,500 to $14,999 | 18 (3.2%) | 6 (1.5%) |
| $15,000 to $17,499 | 14 (2.5%) | 16 (4.1%) |
| $17,500 to $19,999 | 3 (0.5%) | 6 (1.5%) |
| $20,000 to $22,499 | 0 (0.0%) | 18 (4.6%) |
| $22,500 to $24,999 | 6 (1.1%) | 18 (4.6%) |
| $25,000 to $29,999 | 6 (1.1%) | 10 (2.6%) |
| $30,000 to $34,999 | 37 (6.6%) | 31 (7.9%) |
| $35,000 to $39,999 | 36 (6.4%) | 0 (0.0%) |
| $40,000 to $44,999 | 16 (2.8%) | 19 (4.9%) |
| $45,000 to $49,999 | 34 (6.0%) | 20 (5.1%) |
| $50,000 to $54,999 | 17 (3.0%) | 35 (8.9%) |
| $55,000 to $64,999 | 59 (10.4%) | 26 (6.7%) |
| $65,000 to $74,999 | 68 (12.0%) | 18 (4.6%) |
| $75,000 to $99,999 | 43 (7.6%) | 40 (10.2%) |
| $100,000+ | 65 (11.5%) | 23 (5.9%) |
| Total | 565 (100.0%) | 391 (100.0%) |
Earnings by Sex by Educational Attainment in Gilliam County
Average earnings in Gilliam County are $56,667 for men and $42,917 for women, a difference of 24.3%. Men with an educational attainment of bachelor's degree enjoy the highest average annual earnings of $68,047, while those with high school diploma education earn the least with $46,597. Women with an educational attainment of less than high school earn the most with the average annual earnings of $60,104, while those with high school diploma education have the smallest earnings of $24,904.
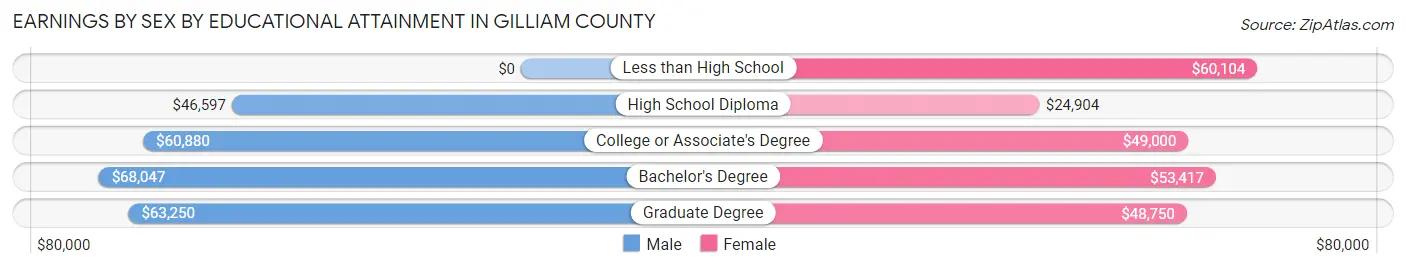
| Educational Attainment | Male Income | Female Income |
| Less than High School | - | - |
| High School Diploma | $46,597 | $24,904 |
| College or Associate's Degree | $60,880 | $49,000 |
| Bachelor's Degree | $68,047 | $53,417 |
| Graduate Degree | $63,250 | $48,750 |
| Total | $56,667 | $42,917 |
Family Income in Gilliam County
Family Income Brackets in Gilliam County
According to the Gilliam County family income data, there are 126 families falling into the $50,000 to $74,999 income range, which is the most common income bracket and makes up 28.1% of all families. Conversely, the less than $10,000 income bracket is the least frequent group with only 5 families (1.1%) belonging to this category.
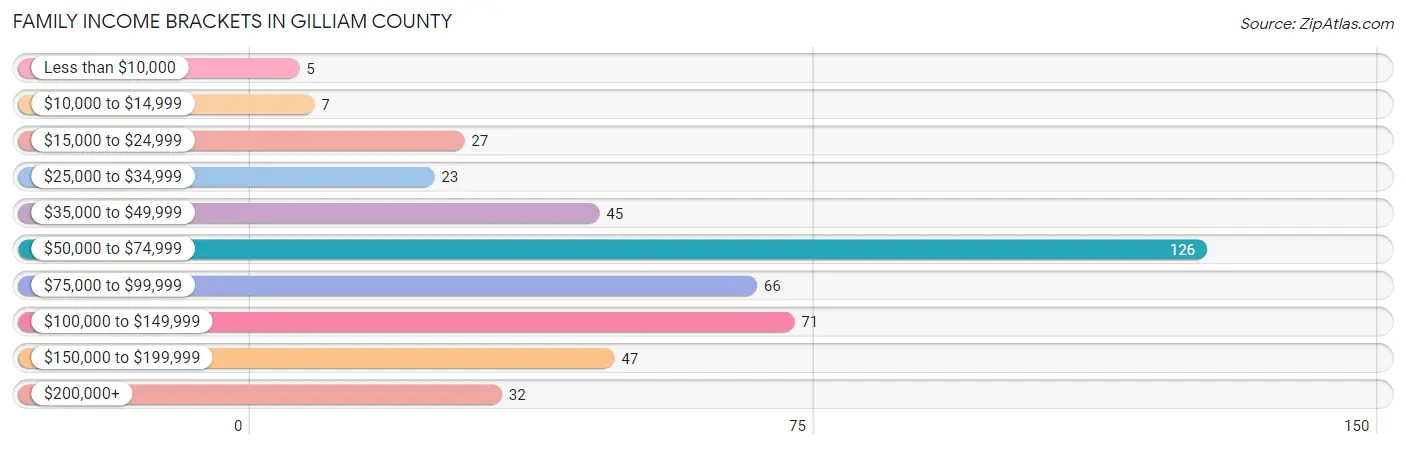
| Income Bracket | # Families | % Families |
| Less than $10,000 | 5 | 1.1% |
| $10,000 to $14,999 | 7 | 1.6% |
| $15,000 to $24,999 | 27 | 6.0% |
| $25,000 to $34,999 | 23 | 5.1% |
| $35,000 to $49,999 | 45 | 10.0% |
| $50,000 to $74,999 | 126 | 28.1% |
| $75,000 to $99,999 | 66 | 14.7% |
| $100,000 to $149,999 | 71 | 15.8% |
| $150,000 to $199,999 | 47 | 10.5% |
| $200,000+ | 32 | 7.1% |
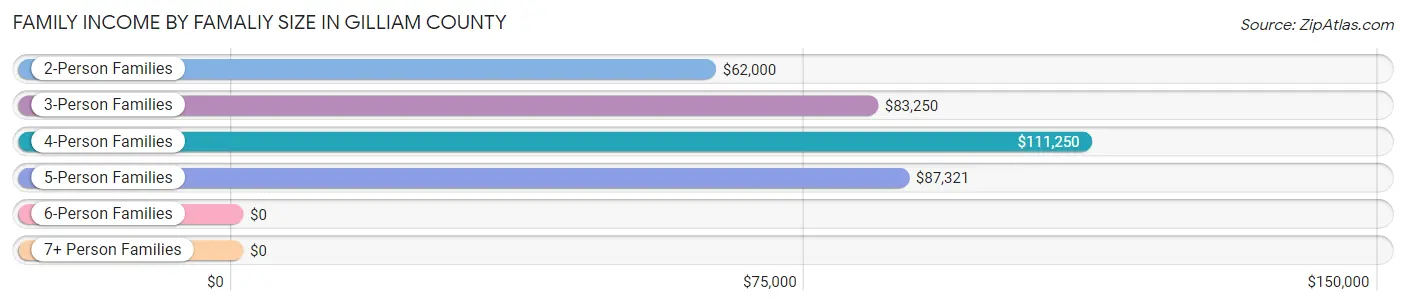
Family Income by Famaliy Size in Gilliam County
4-person families (74 | 16.5%) account for the highest median family income in Gilliam County with $111,250 per family, while 2-person families (262 | 58.4%) have the highest median income of $31,000 per family member.
| Income Bracket | # Families | Median Income |
| 2-Person Families | 262 (58.4%) | $62,000 |
| 3-Person Families | 69 (15.4%) | $83,250 |
| 4-Person Families | 74 (16.5%) | $111,250 |
| 5-Person Families | 35 (7.8%) | $87,321 |
| 6-Person Families | 0 (0.0%) | $0 |
| 7+ Person Families | 9 (2.0%) | $0 |
| Total | 449 (100.0%) | $72,431 |
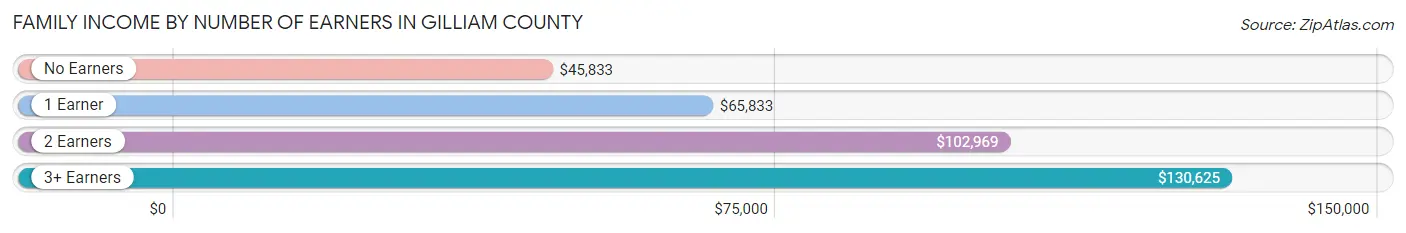
Family Income by Number of Earners in Gilliam County
The median family income in Gilliam County is $72,431, with families comprising 3+ earners (28) having the highest median family income of $130,625, while families with no earners (108) have the lowest median family income of $45,833, accounting for 6.2% and 24.0% of families, respectively.
| Number of Earners | # Families | Median Income |
| No Earners | 108 (24.0%) | $45,833 |
| 1 Earner | 94 (20.9%) | $65,833 |
| 2 Earners | 219 (48.8%) | $102,969 |
| 3+ Earners | 28 (6.2%) | $130,625 |
| Total | 449 (100.0%) | $72,431 |
Household Income in Gilliam County
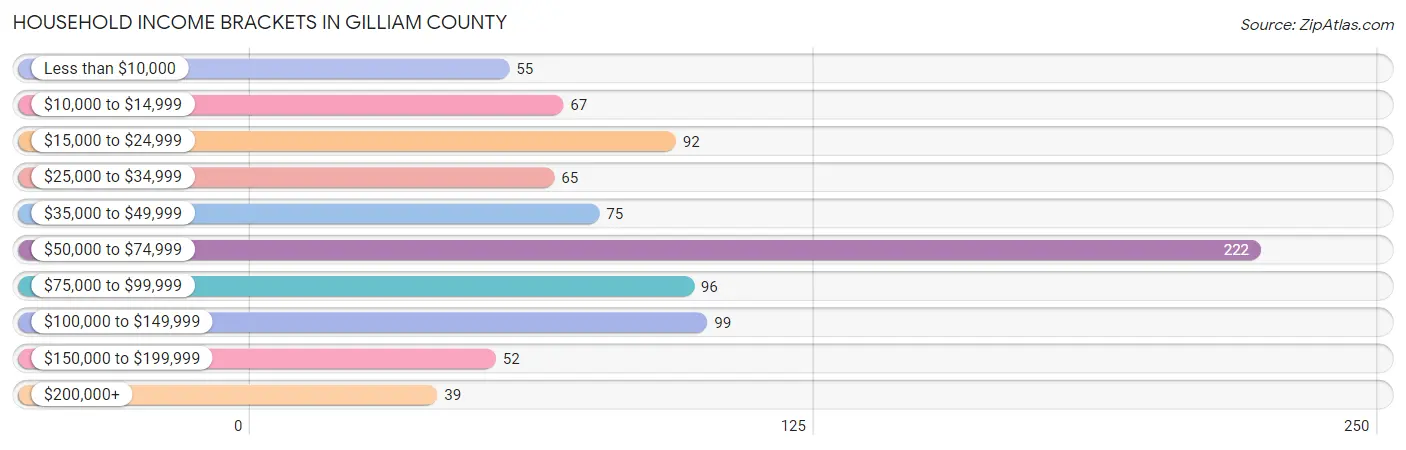
Household Income Brackets in Gilliam County
With 222 households falling in the category, the $50,000 to $74,999 income range is the most frequent in Gilliam County, accounting for 25.8% of all households. In contrast, only 39 households (4.5%) fall into the $200,000+ income bracket, making it the least populous group.
| Income Bracket | # Households | % Households |
| Less than $10,000 | 55 | 6.4% |
| $10,000 to $14,999 | 67 | 7.8% |
| $15,000 to $24,999 | 92 | 10.7% |
| $25,000 to $34,999 | 65 | 7.5% |
| $35,000 to $49,999 | 75 | 8.7% |
| $50,000 to $74,999 | 222 | 25.8% |
| $75,000 to $99,999 | 96 | 11.1% |
| $100,000 to $149,999 | 99 | 11.5% |
| $150,000 to $199,999 | 52 | 6.0% |
| $200,000+ | 39 | 4.5% |
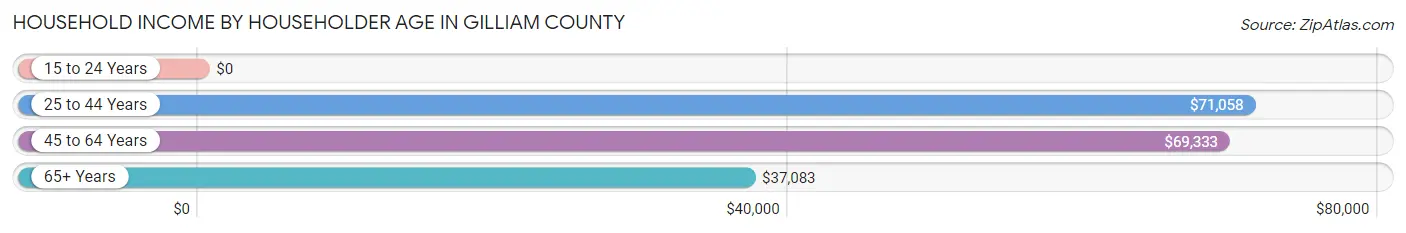
Household Income by Householder Age in Gilliam County
The median household income in Gilliam County is $58,409, with the highest median household income of $71,058 found in the 25 to 44 years age bracket for the primary householder. A total of 153 households (17.7%) fall into this category. Meanwhile, the 15 to 24 years age bracket for the primary householder has the lowest median household income of $0, with 4 households (0.5%) in this group.
| Income Bracket | # Households | Median Income |
| 15 to 24 Years | 4 (0.5%) | $0 |
| 25 to 44 Years | 153 (17.7%) | $71,058 |
| 45 to 64 Years | 302 (35.0%) | $69,333 |
| 65+ Years | 403 (46.8%) | $37,083 |
| Total | 862 (100.0%) | $58,409 |
Poverty in Gilliam County
Income Below Poverty by Sex and Age in Gilliam County
With 9.6% poverty level for males and 16.5% for females among the residents of Gilliam County, 18 to 24 year old males and 18 to 24 year old females are the most vulnerable to poverty, with 35 males (41.2%) and 25 females (64.1%) in their respective age groups living below the poverty level.
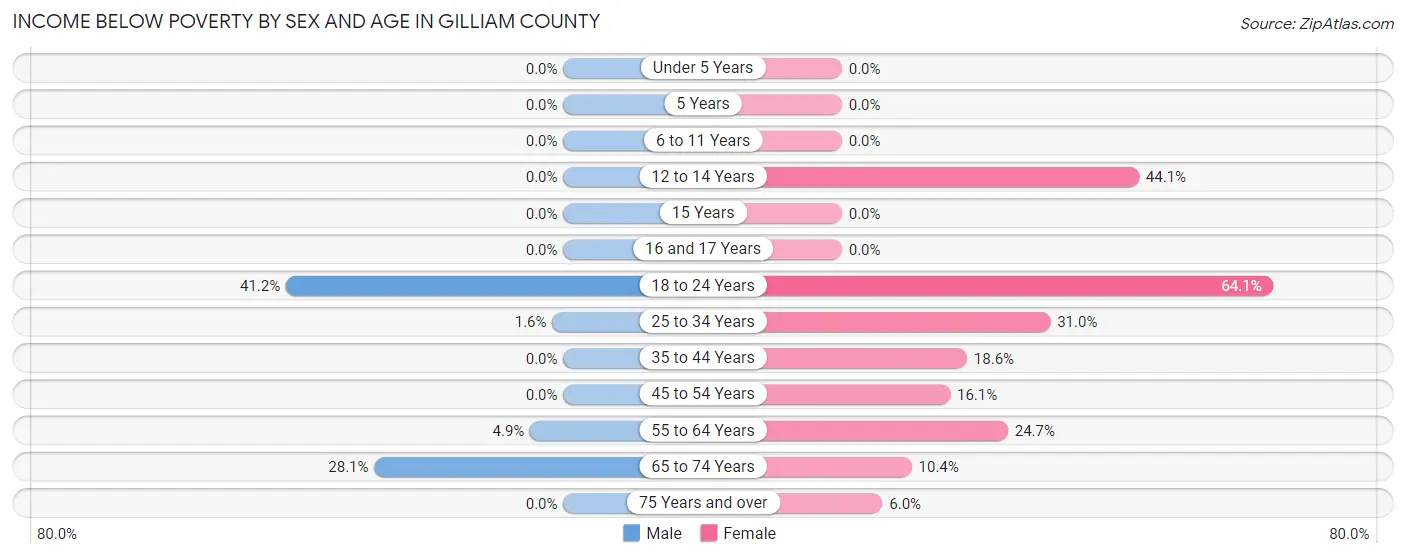
| Age Bracket | Male | Female |
| Under 5 Years | 0 (0.0%) | 0 (0.0%) |
| 5 Years | 0 (0.0%) | 0 (0.0%) |
| 6 to 11 Years | 0 (0.0%) | 0 (0.0%) |
| 12 to 14 Years | 0 (0.0%) | 15 (44.1%) |
| 15 Years | 0 (0.0%) | 0 (0.0%) |
| 16 and 17 Years | 0 (0.0%) | 0 (0.0%) |
| 18 to 24 Years | 35 (41.2%) | 25 (64.1%) |
| 25 to 34 Years | 2 (1.6%) | 13 (30.9%) |
| 35 to 44 Years | 0 (0.0%) | 21 (18.6%) |
| 45 to 54 Years | 0 (0.0%) | 18 (16.1%) |
| 55 to 64 Years | 7 (4.9%) | 35 (24.6%) |
| 65 to 74 Years | 55 (28.1%) | 17 (10.4%) |
| 75 Years and over | 0 (0.0%) | 8 (6.0%) |
| Total | 99 (9.6%) | 152 (16.5%) |
Income Above Poverty by Sex and Age in Gilliam County
According to the poverty statistics in Gilliam County, males aged under 5 years and females aged under 5 years are the age groups that are most secure financially, with 100.0% of males and 100.0% of females in these age groups living above the poverty line.
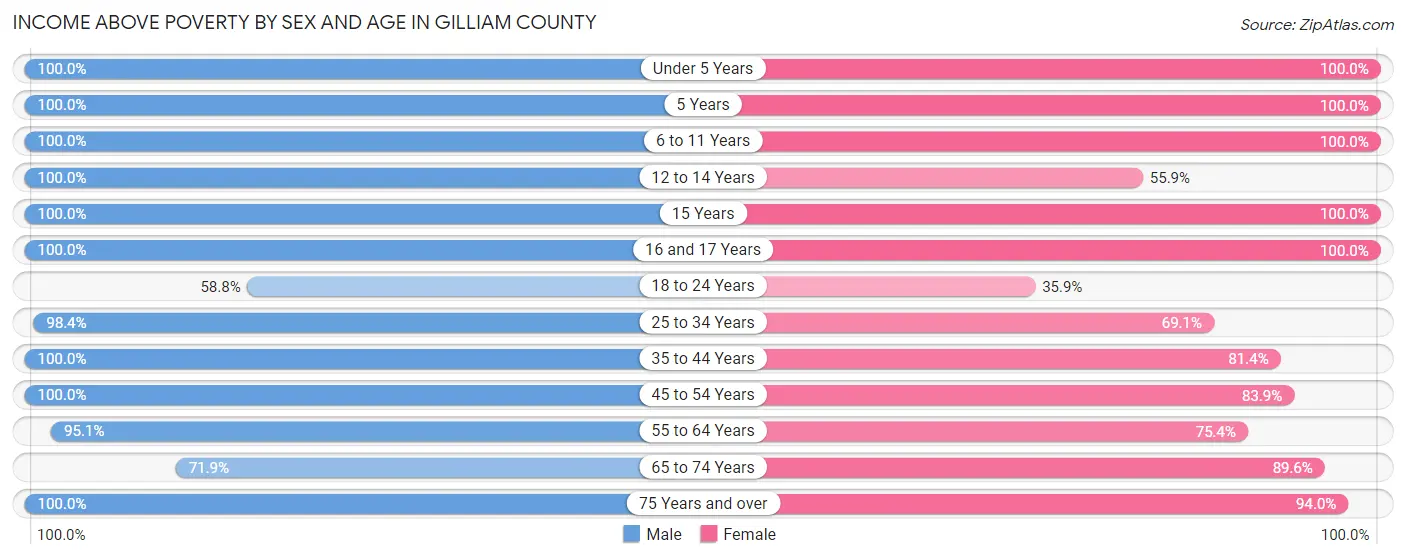
| Age Bracket | Male | Female |
| Under 5 Years | 35 (100.0%) | 13 (100.0%) |
| 5 Years | 11 (100.0%) | 5 (100.0%) |
| 6 to 11 Years | 59 (100.0%) | 101 (100.0%) |
| 12 to 14 Years | 55 (100.0%) | 19 (55.9%) |
| 15 Years | 10 (100.0%) | 7 (100.0%) |
| 16 and 17 Years | 34 (100.0%) | 18 (100.0%) |
| 18 to 24 Years | 50 (58.8%) | 14 (35.9%) |
| 25 to 34 Years | 121 (98.4%) | 29 (69.1%) |
| 35 to 44 Years | 95 (100.0%) | 92 (81.4%) |
| 45 to 54 Years | 89 (100.0%) | 94 (83.9%) |
| 55 to 64 Years | 135 (95.1%) | 107 (75.3%) |
| 65 to 74 Years | 141 (71.9%) | 147 (89.6%) |
| 75 Years and over | 95 (100.0%) | 125 (94.0%) |
| Total | 930 (90.4%) | 771 (83.5%) |
Income Below Poverty Among Married-Couple Families in Gilliam County
The poverty statistics for married-couple families in Gilliam County show that 3.4% or 12 of the total 352 families live below the poverty line. Families with 1 or 2 children have the highest poverty rate of 7.6%, comprising of 7 families. On the other hand, families with 3 or 4 children have the lowest poverty rate of 0.0%, which includes 0 families.
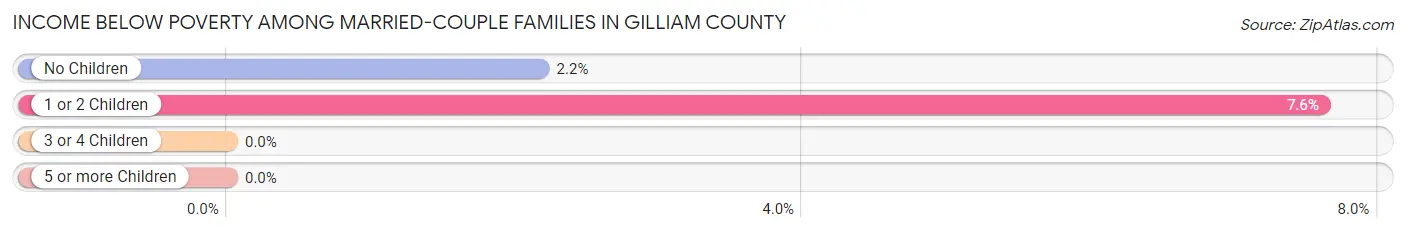
| Children | Above Poverty | Below Poverty |
| No Children | 225 (97.8%) | 5 (2.2%) |
| 1 or 2 Children | 85 (92.4%) | 7 (7.6%) |
| 3 or 4 Children | 29 (100.0%) | 0 (0.0%) |
| 5 or more Children | 1 (100.0%) | 0 (0.0%) |
| Total | 340 (96.6%) | 12 (3.4%) |
Income Below Poverty Among Single-Parent Households in Gilliam County
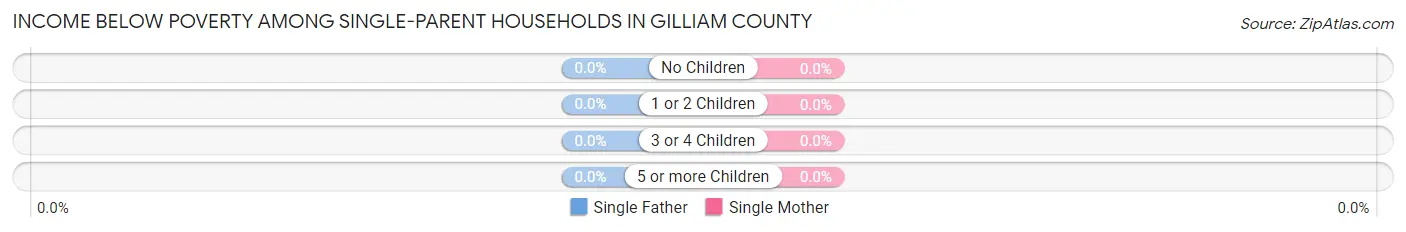
| Children | Single Father | Single Mother |
| No Children | 0 (0.0%) | 0 (0.0%) |
| 1 or 2 Children | 0 (0.0%) | 0 (0.0%) |
| 3 or 4 Children | 0 (0.0%) | 0 (0.0%) |
| 5 or more Children | 0 (0.0%) | 0 (0.0%) |
| Total | 0 (0.0%) | 0 (0.0%) |
Income Below Poverty Among Married-Couple vs Single-Parent Households in Gilliam County
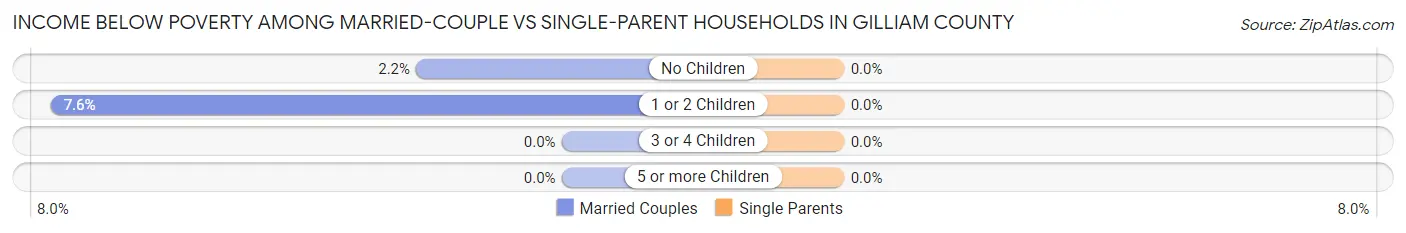
| Children | Married-Couple Families | Single-Parent Households |
| No Children | 5 (2.2%) | 0 (0.0%) |
| 1 or 2 Children | 7 (7.6%) | 0 (0.0%) |
| 3 or 4 Children | 0 (0.0%) | 0 (0.0%) |
| 5 or more Children | 0 (0.0%) | 0 (0.0%) |
| Total | 12 (3.4%) | 0 (0.0%) |
Employment Characteristics in Gilliam County
Employment by Class of Employer in Gilliam County
Among the 777 employed individuals in Gilliam County, private company employees (463 | 59.6%), local government employees (95 | 12.2%), and self-employed (not incorporated) (82 | 10.5%) make up the most common classes of employment.
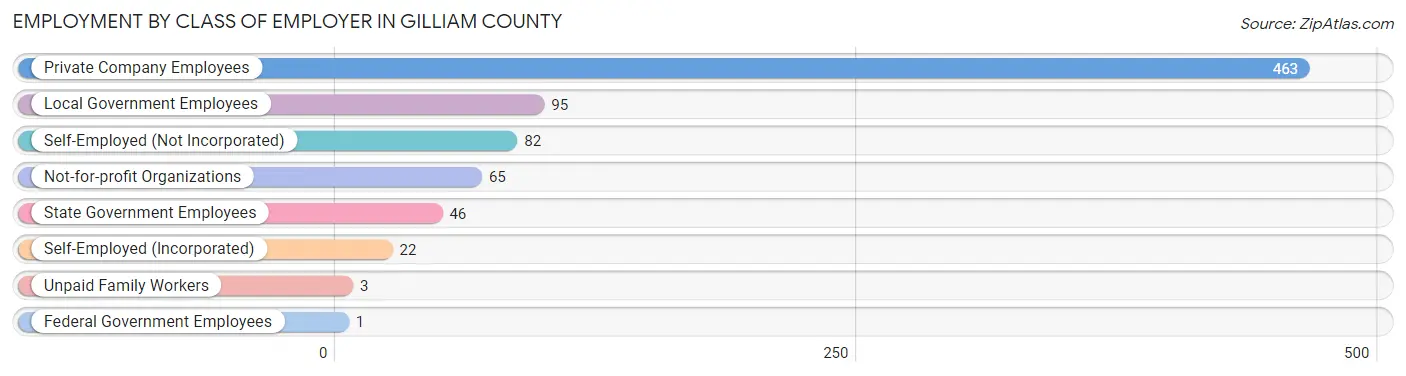
| Employer Class | # Employees | % Employees |
| Private Company Employees | 463 | 59.6% |
| Self-Employed (Incorporated) | 22 | 2.8% |
| Self-Employed (Not Incorporated) | 82 | 10.5% |
| Not-for-profit Organizations | 65 | 8.4% |
| Local Government Employees | 95 | 12.2% |
| State Government Employees | 46 | 5.9% |
| Federal Government Employees | 1 | 0.1% |
| Unpaid Family Workers | 3 | 0.4% |
| Total | 777 | 100.0% |
Employment Status by Age in Gilliam County
According to the labor force statistics for Gilliam County, out of the total population over 16 years of age (1,653), 51.8% or 856 individuals are in the labor force, with 6.3% or 54 of them unemployed. The age group with the highest labor force participation rate is 25 to 29 years, with 100.0% or 86 individuals in the labor force. Within the labor force, the 55 to 59 years age range has the highest percentage of unemployed individuals, with 40.0% or 14 of them being unemployed.
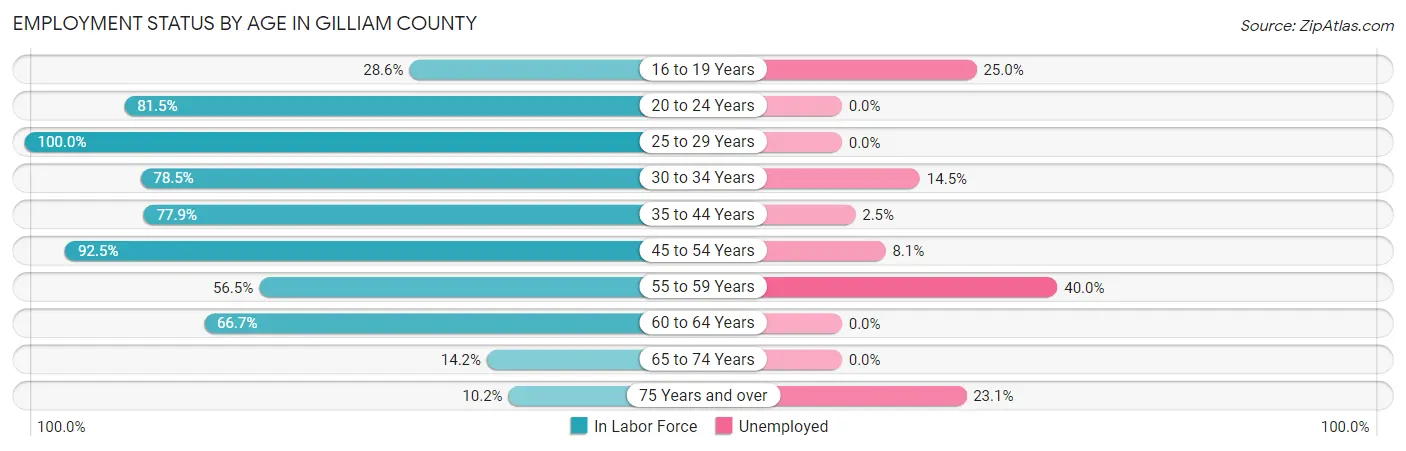
| Age Bracket | In Labor Force | Unemployed |
| 16 to 19 Years | 24 (28.6%) | 6 (25.0%) |
| 20 to 24 Years | 75 (81.5%) | 0 (0.0%) |
| 25 to 29 Years | 86 (100.0%) | 0 (0.0%) |
| 30 to 34 Years | 62 (78.5%) | 9 (14.5%) |
| 35 to 44 Years | 162 (77.9%) | 4 (2.5%) |
| 45 to 54 Years | 186 (92.5%) | 15 (8.1%) |
| 55 to 59 Years | 35 (56.5%) | 14 (40.0%) |
| 60 to 64 Years | 148 (66.7%) | 0 (0.0%) |
| 65 to 74 Years | 52 (14.2%) | 0 (0.0%) |
| 75 Years and over | 26 (10.2%) | 6 (23.1%) |
| Total | 856 (51.8%) | 54 (6.3%) |
Employment Status by Educational Attainment in Gilliam County
According to labor force statistics for Gilliam County, 79.1% of individuals (679) out of the total population between 25 and 64 years of age (858) are in the labor force, with 6.2% or 42 of them being unemployed. The group with the highest labor force participation rate are those with the educational attainment of bachelor's degree or higher, with 85.7% or 162 individuals in the labor force. Within the labor force, individuals with high school diploma education have the highest percentage of unemployment, with 7.5% or 12 of them being unemployed.
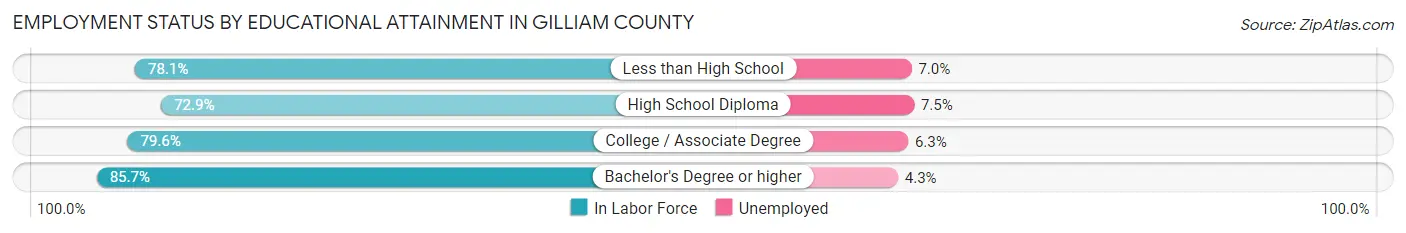
| Educational Attainment | In Labor Force | Unemployed |
| Less than High School | 57 (78.1%) | 5 (7.0%) |
| High School Diploma | 159 (72.9%) | 16 (7.5%) |
| College / Associate Degree | 301 (79.6%) | 24 (6.3%) |
| Bachelor's Degree or higher | 162 (85.7%) | 8 (4.3%) |
| Total | 679 (79.1%) | 53 (6.2%) |
Employment Occupations by Sex in Gilliam County
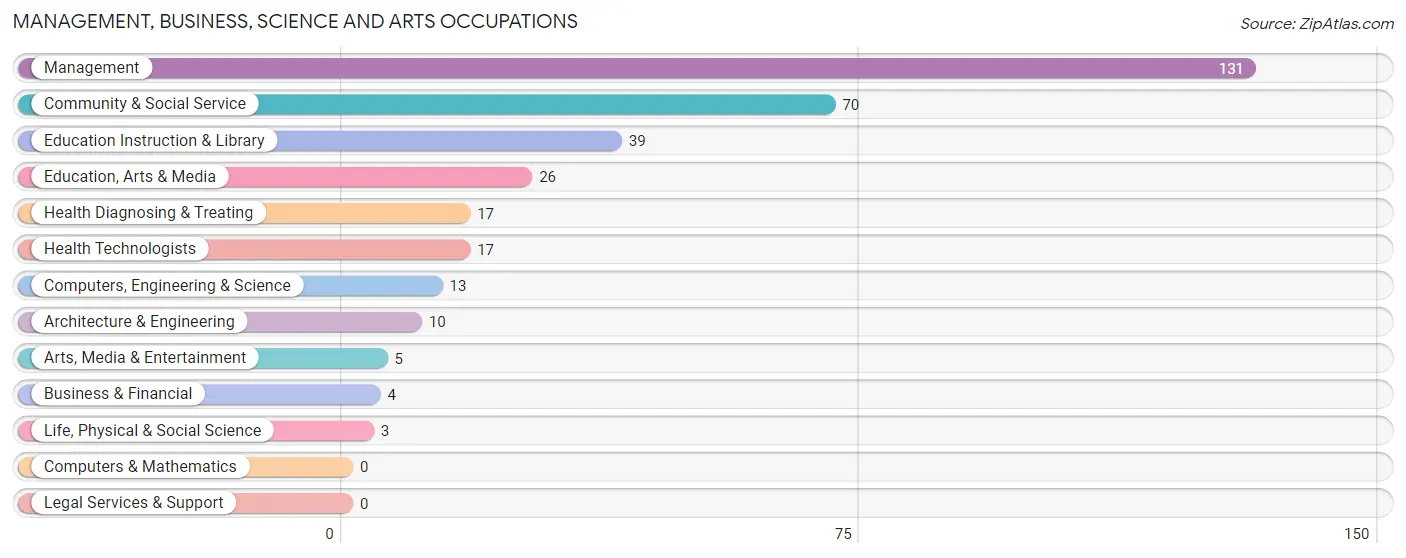
Management, Business, Science and Arts Occupations
The most common Management, Business, Science and Arts occupations in Gilliam County are Management (131 | 16.3%), Community & Social Service (70 | 8.7%), Education Instruction & Library (39 | 4.9%), Education, Arts & Media (26 | 3.2%), and Health Diagnosing & Treating (17 | 2.1%).
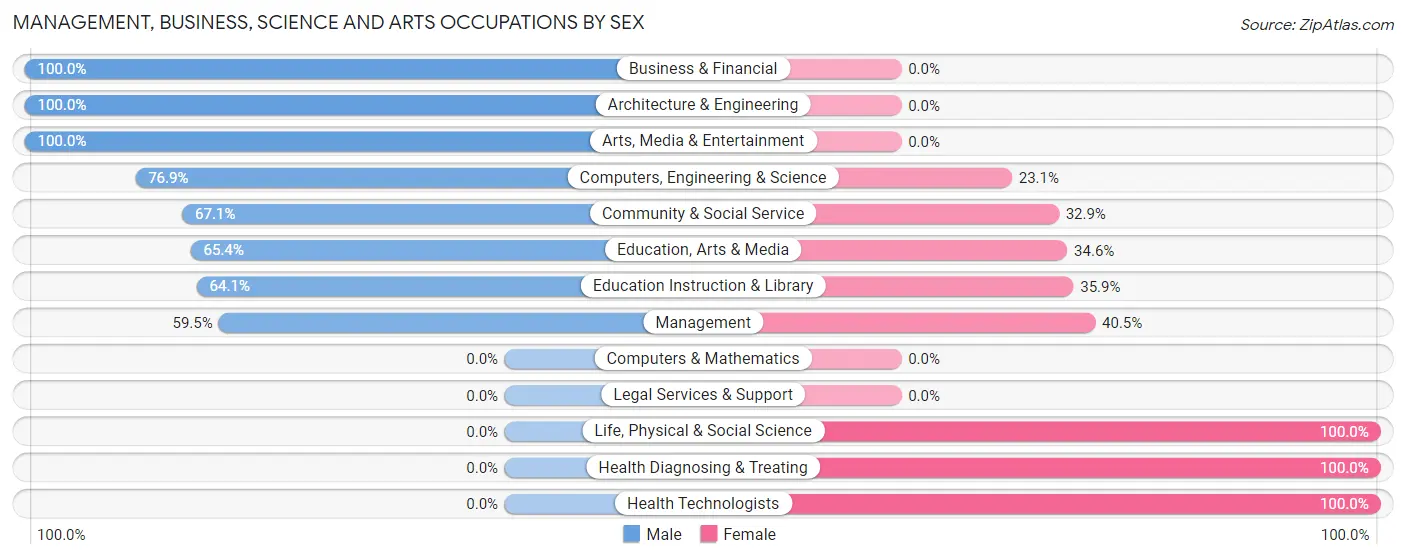
Management, Business, Science and Arts Occupations by Sex
Within the Management, Business, Science and Arts occupations in Gilliam County, the most male-oriented occupations are Business & Financial (100.0%), Architecture & Engineering (100.0%), and Arts, Media & Entertainment (100.0%), while the most female-oriented occupations are Life, Physical & Social Science (100.0%), Health Diagnosing & Treating (100.0%), and Health Technologists (100.0%).
| Occupation | Male | Female |
| Management | 78 (59.5%) | 53 (40.5%) |
| Business & Financial | 4 (100.0%) | 0 (0.0%) |
| Computers, Engineering & Science | 10 (76.9%) | 3 (23.1%) |
| Computers & Mathematics | 0 (0.0%) | 0 (0.0%) |
| Architecture & Engineering | 10 (100.0%) | 0 (0.0%) |
| Life, Physical & Social Science | 0 (0.0%) | 3 (100.0%) |
| Community & Social Service | 47 (67.1%) | 23 (32.9%) |
| Education, Arts & Media | 17 (65.4%) | 9 (34.6%) |
| Legal Services & Support | 0 (0.0%) | 0 (0.0%) |
| Education Instruction & Library | 25 (64.1%) | 14 (35.9%) |
| Arts, Media & Entertainment | 5 (100.0%) | 0 (0.0%) |
| Health Diagnosing & Treating | 0 (0.0%) | 17 (100.0%) |
| Health Technologists | 0 (0.0%) | 17 (100.0%) |
| Total (Category) | 139 (59.2%) | 96 (40.8%) |
| Total (Overall) | 488 (60.9%) | 314 (39.2%) |
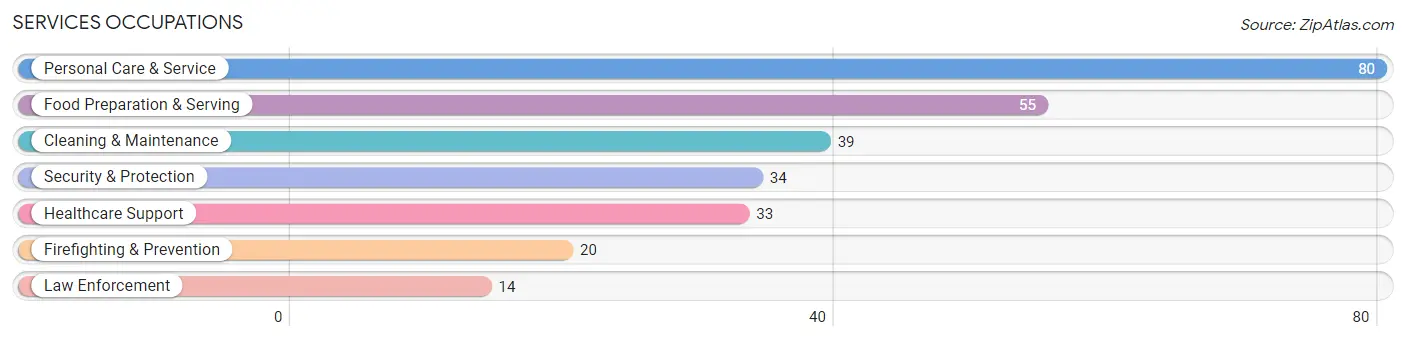
Services Occupations
The most common Services occupations in Gilliam County are Personal Care & Service (80 | 10.0%), Food Preparation & Serving (55 | 6.9%), Cleaning & Maintenance (39 | 4.9%), Security & Protection (34 | 4.2%), and Healthcare Support (33 | 4.1%).
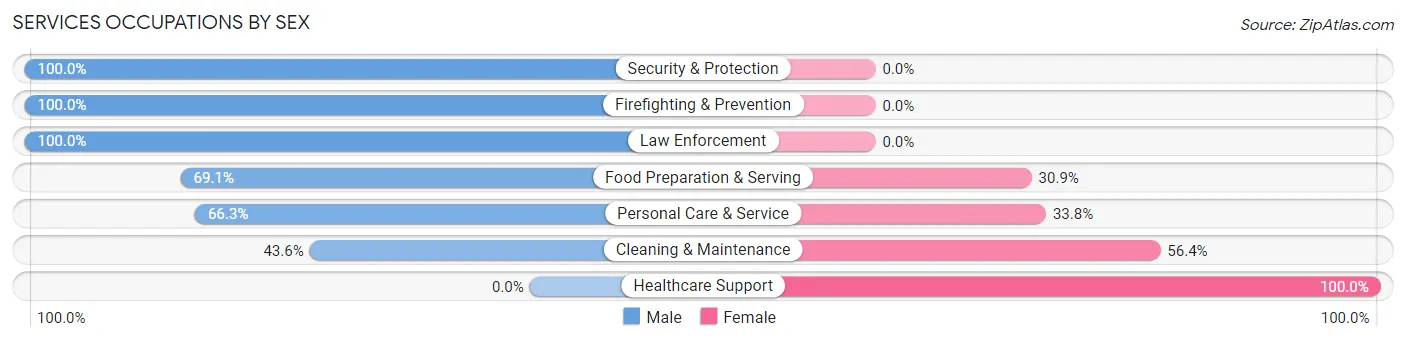
Services Occupations by Sex
Within the Services occupations in Gilliam County, the most male-oriented occupations are Security & Protection (100.0%), Firefighting & Prevention (100.0%), and Law Enforcement (100.0%), while the most female-oriented occupations are Healthcare Support (100.0%), Cleaning & Maintenance (56.4%), and Personal Care & Service (33.8%).
| Occupation | Male | Female |
| Healthcare Support | 0 (0.0%) | 33 (100.0%) |
| Security & Protection | 34 (100.0%) | 0 (0.0%) |
| Firefighting & Prevention | 20 (100.0%) | 0 (0.0%) |
| Law Enforcement | 14 (100.0%) | 0 (0.0%) |
| Food Preparation & Serving | 38 (69.1%) | 17 (30.9%) |
| Cleaning & Maintenance | 17 (43.6%) | 22 (56.4%) |
| Personal Care & Service | 53 (66.2%) | 27 (33.8%) |
| Total (Category) | 142 (58.9%) | 99 (41.1%) |
| Total (Overall) | 488 (60.9%) | 314 (39.2%) |
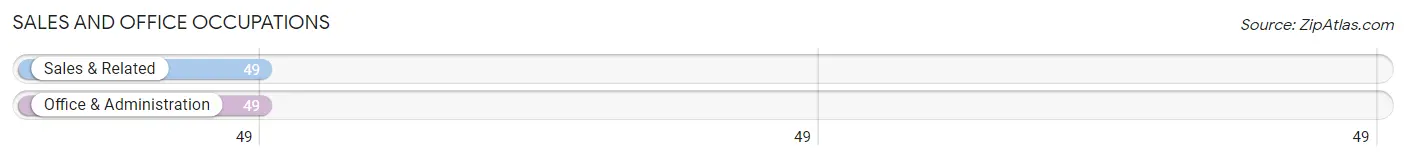
Sales and Office Occupations
The most common Sales and Office occupations in Gilliam County are Sales & Related (49 | 6.1%), and Office & Administration (49 | 6.1%).
Sales and Office Occupations by Sex
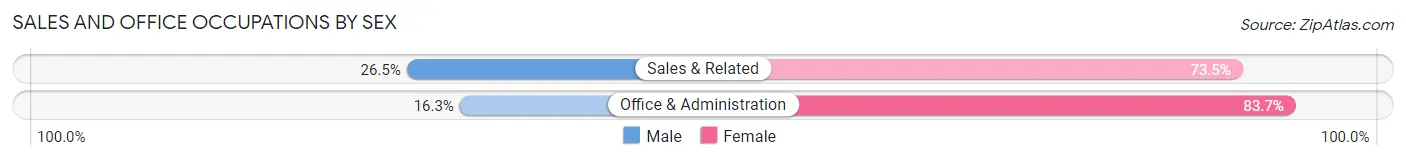
| Occupation | Male | Female |
| Sales & Related | 13 (26.5%) | 36 (73.5%) |
| Office & Administration | 8 (16.3%) | 41 (83.7%) |
| Total (Category) | 21 (21.4%) | 77 (78.6%) |
| Total (Overall) | 488 (60.9%) | 314 (39.2%) |
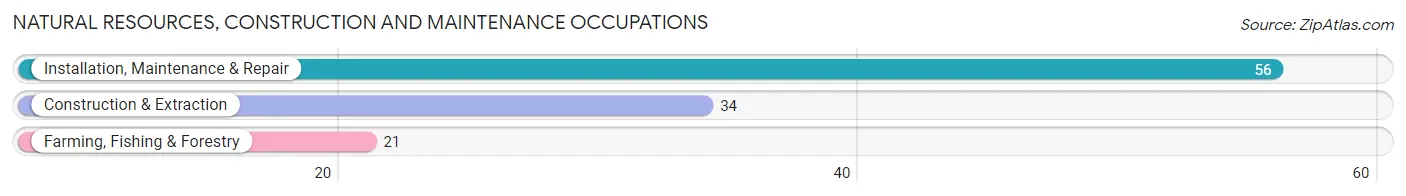
Natural Resources, Construction and Maintenance Occupations
The most common Natural Resources, Construction and Maintenance occupations in Gilliam County are Installation, Maintenance & Repair (56 | 7.0%), Construction & Extraction (34 | 4.2%), and Farming, Fishing & Forestry (21 | 2.6%).
Natural Resources, Construction and Maintenance Occupations by Sex
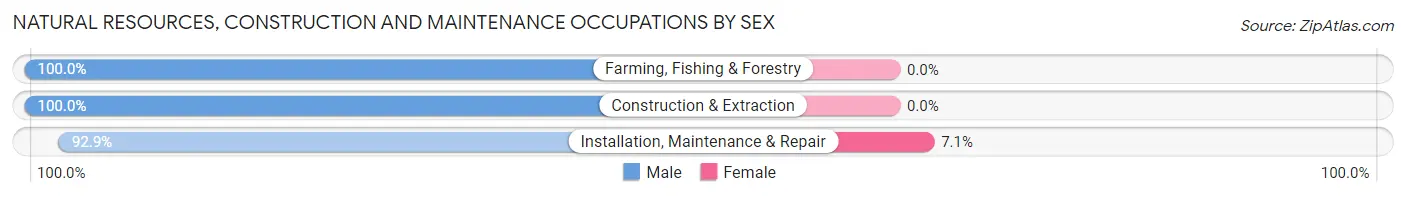
| Occupation | Male | Female |
| Farming, Fishing & Forestry | 21 (100.0%) | 0 (0.0%) |
| Construction & Extraction | 34 (100.0%) | 0 (0.0%) |
| Installation, Maintenance & Repair | 52 (92.9%) | 4 (7.1%) |
| Total (Category) | 107 (96.4%) | 4 (3.6%) |
| Total (Overall) | 488 (60.9%) | 314 (39.2%) |
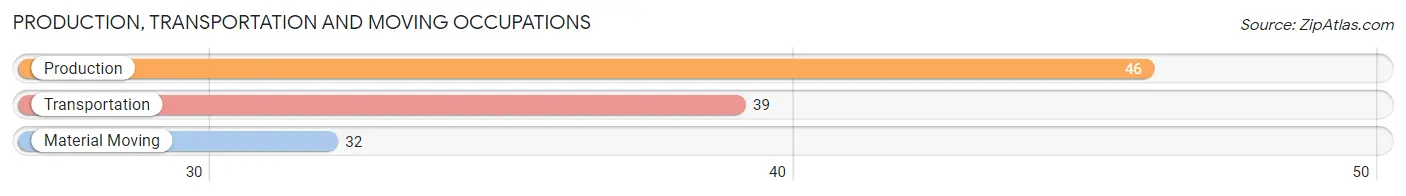
Production, Transportation and Moving Occupations
The most common Production, Transportation and Moving occupations in Gilliam County are Production (46 | 5.7%), Transportation (39 | 4.9%), and Material Moving (32 | 4.0%).
Production, Transportation and Moving Occupations by Sex
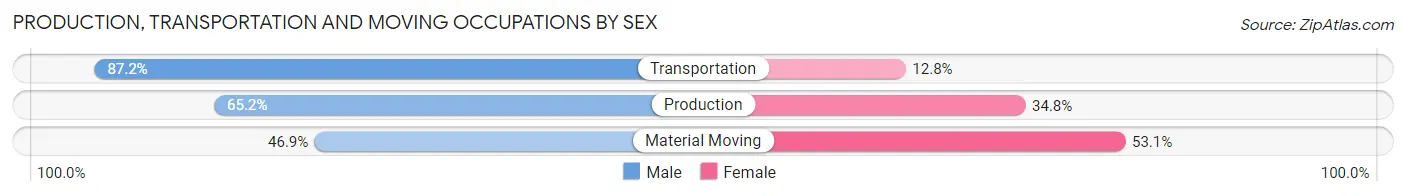
| Occupation | Male | Female |
| Production | 30 (65.2%) | 16 (34.8%) |
| Transportation | 34 (87.2%) | 5 (12.8%) |
| Material Moving | 15 (46.9%) | 17 (53.1%) |
| Total (Category) | 79 (67.5%) | 38 (32.5%) |
| Total (Overall) | 488 (60.9%) | 314 (39.2%) |
Employment Industries by Sex in Gilliam County
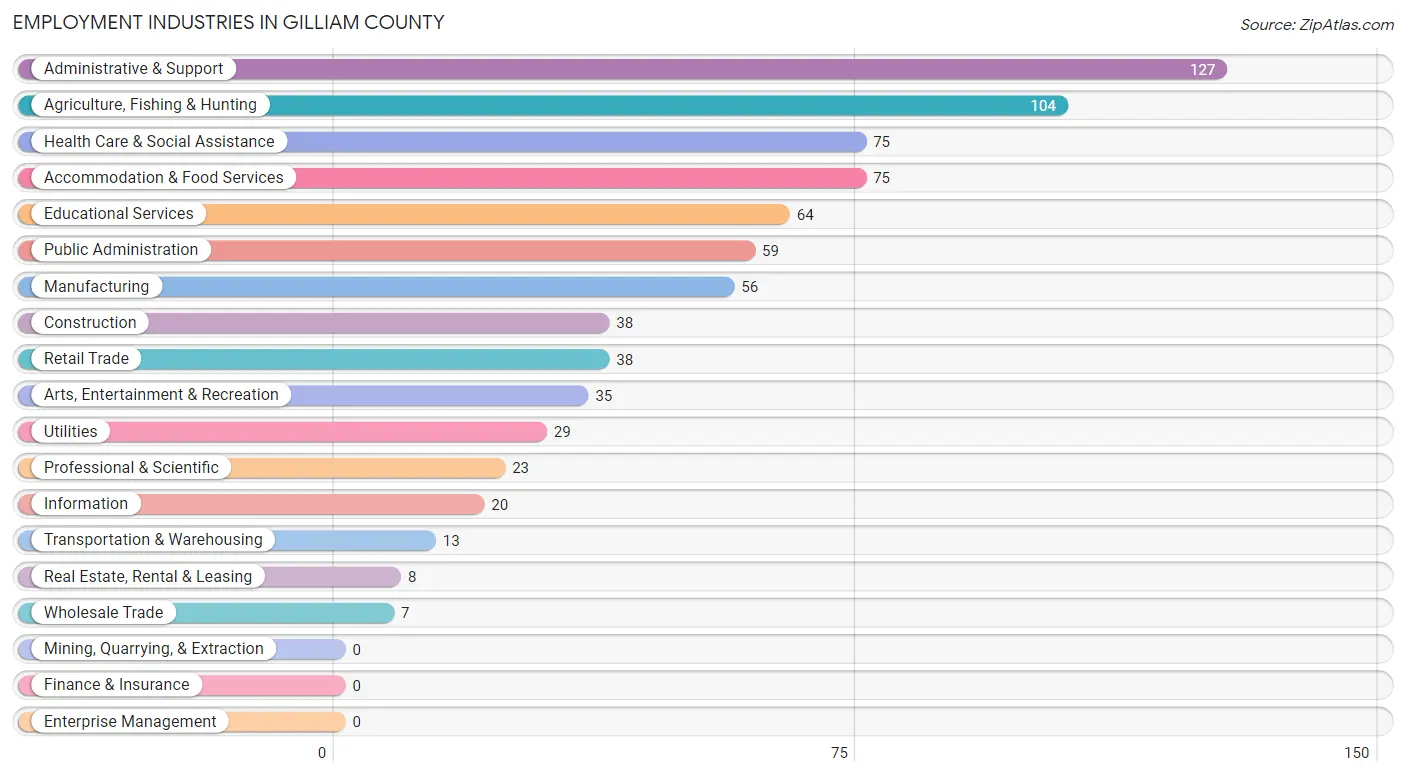
Employment Industries in Gilliam County
The major employment industries in Gilliam County include Administrative & Support (127 | 15.8%), Agriculture, Fishing & Hunting (104 | 13.0%), Health Care & Social Assistance (75 | 9.3%), Accommodation & Food Services (75 | 9.3%), and Educational Services (64 | 8.0%).
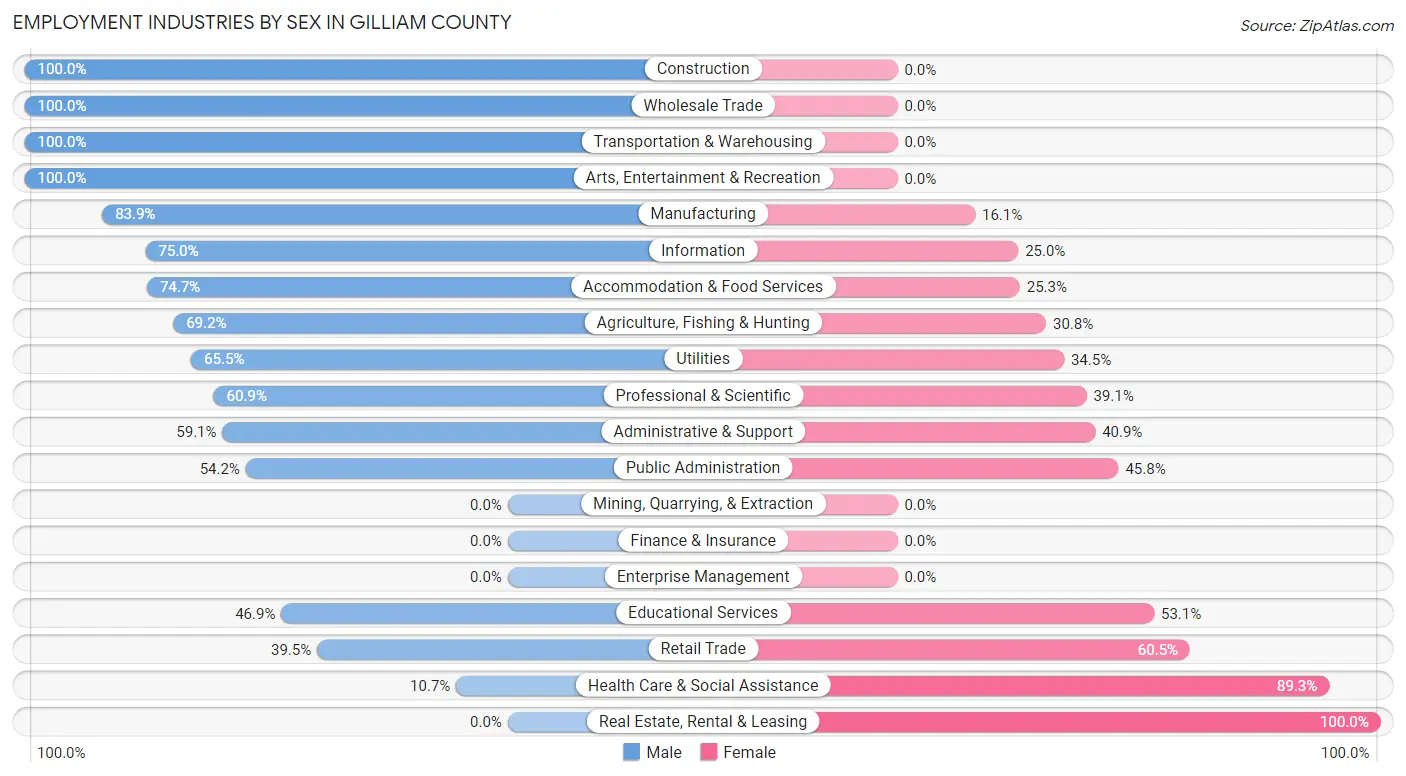
Employment Industries by Sex in Gilliam County
The Gilliam County industries that see more men than women are Construction (100.0%), Wholesale Trade (100.0%), and Transportation & Warehousing (100.0%), whereas the industries that tend to have a higher number of women are Real Estate, Rental & Leasing (100.0%), Health Care & Social Assistance (89.3%), and Retail Trade (60.5%).
| Industry | Male | Female |
| Agriculture, Fishing & Hunting | 72 (69.2%) | 32 (30.8%) |
| Mining, Quarrying, & Extraction | 0 (0.0%) | 0 (0.0%) |
| Construction | 38 (100.0%) | 0 (0.0%) |
| Manufacturing | 47 (83.9%) | 9 (16.1%) |
| Wholesale Trade | 7 (100.0%) | 0 (0.0%) |
| Retail Trade | 15 (39.5%) | 23 (60.5%) |
| Transportation & Warehousing | 13 (100.0%) | 0 (0.0%) |
| Utilities | 19 (65.5%) | 10 (34.5%) |
| Information | 15 (75.0%) | 5 (25.0%) |
| Finance & Insurance | 0 (0.0%) | 0 (0.0%) |
| Real Estate, Rental & Leasing | 0 (0.0%) | 8 (100.0%) |
| Professional & Scientific | 14 (60.9%) | 9 (39.1%) |
| Enterprise Management | 0 (0.0%) | 0 (0.0%) |
| Administrative & Support | 75 (59.1%) | 52 (40.9%) |
| Educational Services | 30 (46.9%) | 34 (53.1%) |
| Health Care & Social Assistance | 8 (10.7%) | 67 (89.3%) |
| Arts, Entertainment & Recreation | 35 (100.0%) | 0 (0.0%) |
| Accommodation & Food Services | 56 (74.7%) | 19 (25.3%) |
| Public Administration | 32 (54.2%) | 27 (45.8%) |
| Total | 488 (60.9%) | 314 (39.2%) |
Education in Gilliam County
School Enrollment in Gilliam County
The most common levels of schooling among the 386 students in Gilliam County are middle school (130 | 33.7%), high school (98 | 25.4%), and elementary school (94 | 24.3%).
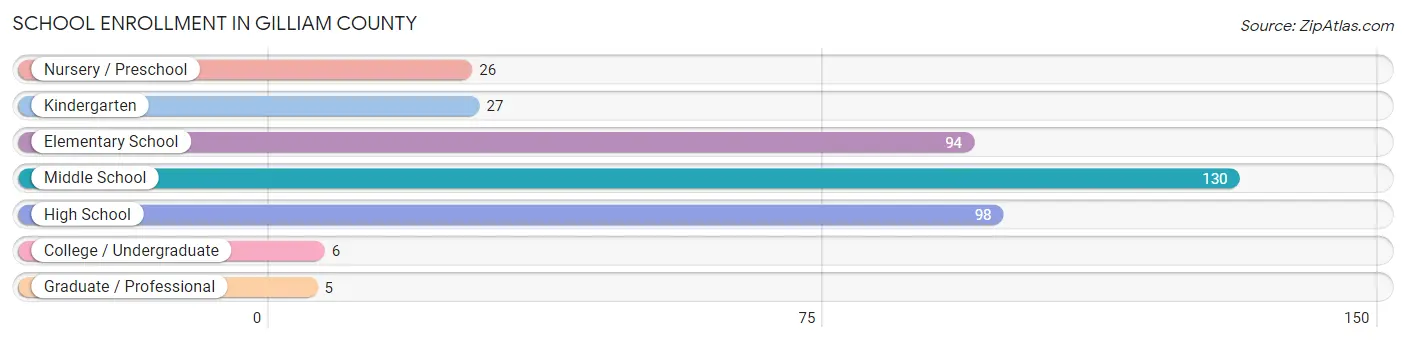
| School Level | # Students | % Students |
| Nursery / Preschool | 26 | 6.7% |
| Kindergarten | 27 | 7.0% |
| Elementary School | 94 | 24.3% |
| Middle School | 130 | 33.7% |
| High School | 98 | 25.4% |
| College / Undergraduate | 6 | 1.5% |
| Graduate / Professional | 5 | 1.3% |
| Total | 386 | 100.0% |
School Enrollment by Age by Funding Source in Gilliam County
Out of a total of 386 students who are enrolled in schools in Gilliam County, 25 (6.5%) attend a private institution, while the remaining 361 (93.5%) are enrolled in public schools. The age group of 3 to 4 year olds has the highest likelihood of being enrolled in private schools, with 8 (50.0% in the age bracket) enrolled. Conversely, the age group of 5 to 9 year old has the lowest likelihood of being enrolled in a private school, with 123 (100.0% in the age bracket) attending a public institution.
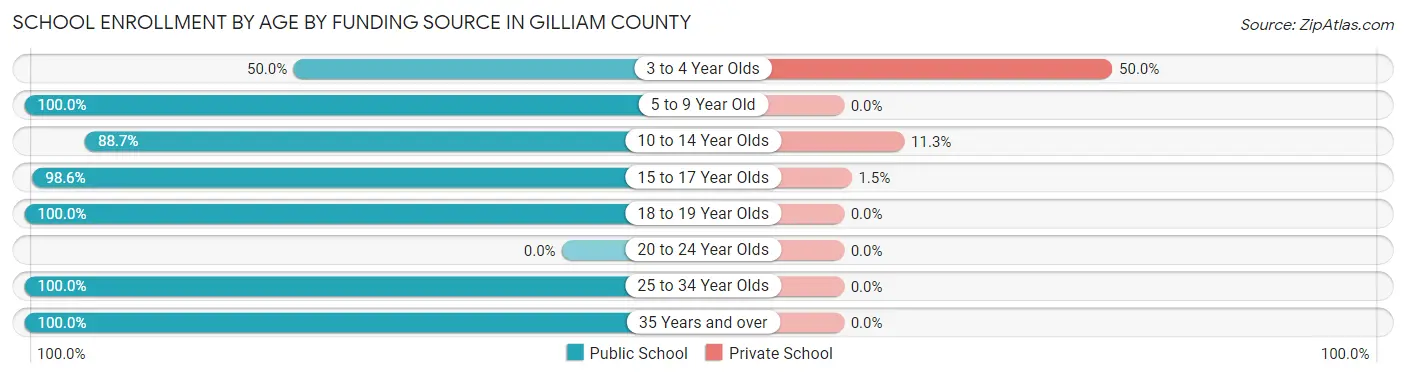
| Age Bracket | Public School | Private School |
| 3 to 4 Year Olds | 8 (50.0%) | 8 (50.0%) |
| 5 to 9 Year Old | 123 (100.0%) | 0 (0.0%) |
| 10 to 14 Year Olds | 126 (88.7%) | 16 (11.3%) |
| 15 to 17 Year Olds | 68 (98.6%) | 1 (1.5%) |
| 18 to 19 Year Olds | 25 (100.0%) | 0 (0.0%) |
| 20 to 24 Year Olds | 0 (0.0%) | 0 (0.0%) |
| 25 to 34 Year Olds | 6 (100.0%) | 0 (0.0%) |
| 35 Years and over | 5 (100.0%) | 0 (0.0%) |
| Total | 361 (93.5%) | 25 (6.5%) |
Educational Attainment by Field of Study in Gilliam County
Liberal arts & history (81 | 23.0%), business (49 | 13.9%), bio, nature & agricultural (43 | 12.2%), literature & languages (38 | 10.8%), and social sciences (34 | 9.6%) are the most common fields of study among 353 individuals in Gilliam County who have obtained a bachelor's degree or higher.
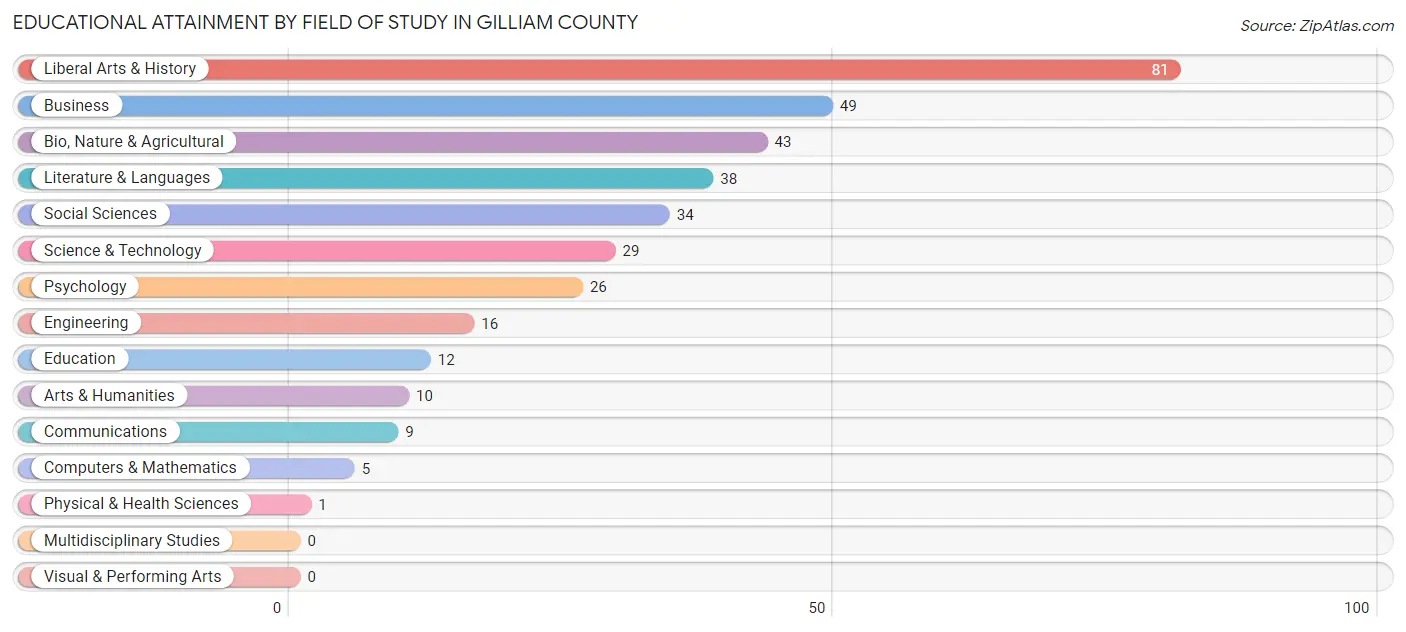
| Field of Study | # Graduates | % Graduates |
| Computers & Mathematics | 5 | 1.4% |
| Bio, Nature & Agricultural | 43 | 12.2% |
| Physical & Health Sciences | 1 | 0.3% |
| Psychology | 26 | 7.4% |
| Social Sciences | 34 | 9.6% |
| Engineering | 16 | 4.5% |
| Multidisciplinary Studies | 0 | 0.0% |
| Science & Technology | 29 | 8.2% |
| Business | 49 | 13.9% |
| Education | 12 | 3.4% |
| Literature & Languages | 38 | 10.8% |
| Liberal Arts & History | 81 | 23.0% |
| Visual & Performing Arts | 0 | 0.0% |
| Communications | 9 | 2.5% |
| Arts & Humanities | 10 | 2.8% |
| Total | 353 | 100.0% |
Transportation & Commute in Gilliam County
Vehicle Availability by Sex in Gilliam County
The most prevalent vehicle ownership categories in Gilliam County are males with 2 vehicles (222, accounting for 46.4%) and females with 2 vehicles (119, making up 74.5%).
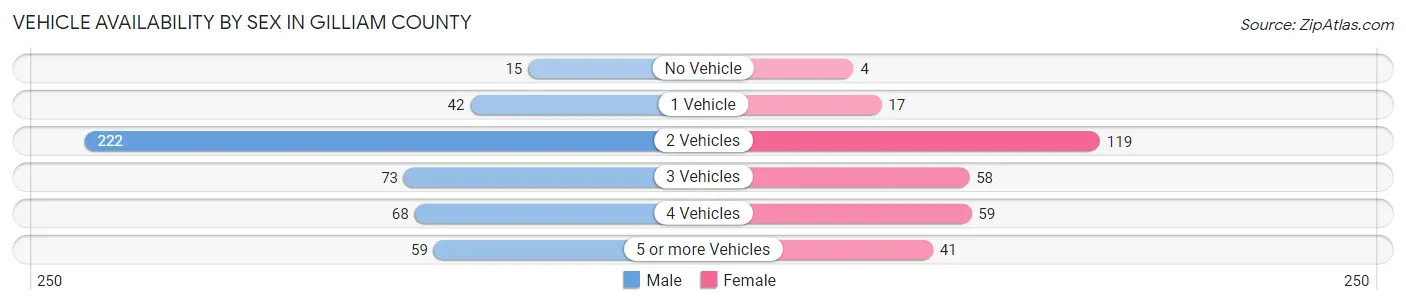
| Vehicles Available | Male | Female |
| No Vehicle | 15 (3.1%) | 4 (1.3%) |
| 1 Vehicle | 42 (8.8%) | 17 (5.7%) |
| 2 Vehicles | 222 (46.4%) | 119 (39.9%) |
| 3 Vehicles | 73 (15.2%) | 58 (19.5%) |
| 4 Vehicles | 68 (14.2%) | 59 (19.8%) |
| 5 or more Vehicles | 59 (12.3%) | 41 (13.8%) |
| Total | 479 (100.0%) | 298 (100.0%) |
Commute Time in Gilliam County
The most frequently occuring commute durations in Gilliam County are less than 5 minutes (200 commuters, 28.2%), 15 to 19 minutes (147 commuters, 20.7%), and 5 to 9 minutes (146 commuters, 20.6%).
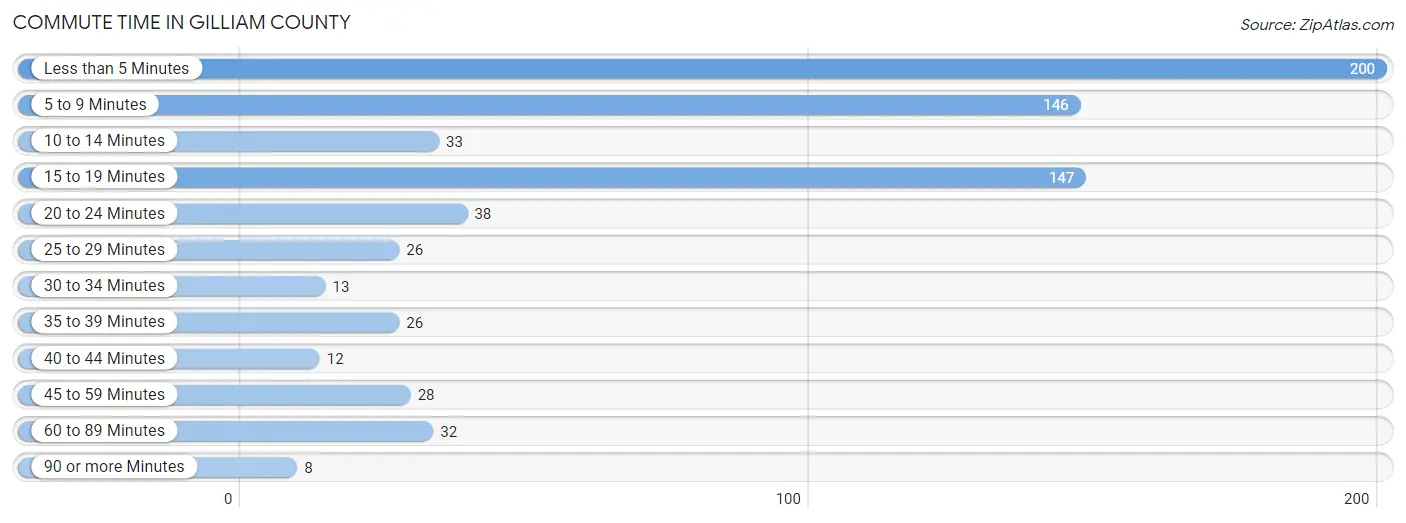
| Commute Time | # Commuters | % Commuters |
| Less than 5 Minutes | 200 | 28.2% |
| 5 to 9 Minutes | 146 | 20.6% |
| 10 to 14 Minutes | 33 | 4.6% |
| 15 to 19 Minutes | 147 | 20.7% |
| 20 to 24 Minutes | 38 | 5.4% |
| 25 to 29 Minutes | 26 | 3.7% |
| 30 to 34 Minutes | 13 | 1.8% |
| 35 to 39 Minutes | 26 | 3.7% |
| 40 to 44 Minutes | 12 | 1.7% |
| 45 to 59 Minutes | 28 | 4.0% |
| 60 to 89 Minutes | 32 | 4.5% |
| 90 or more Minutes | 8 | 1.1% |
Commute Time by Sex in Gilliam County
The most common commute times in Gilliam County are less than 5 minutes (116 commuters, 26.6%) for males and less than 5 minutes (84 commuters, 30.8%) for females.
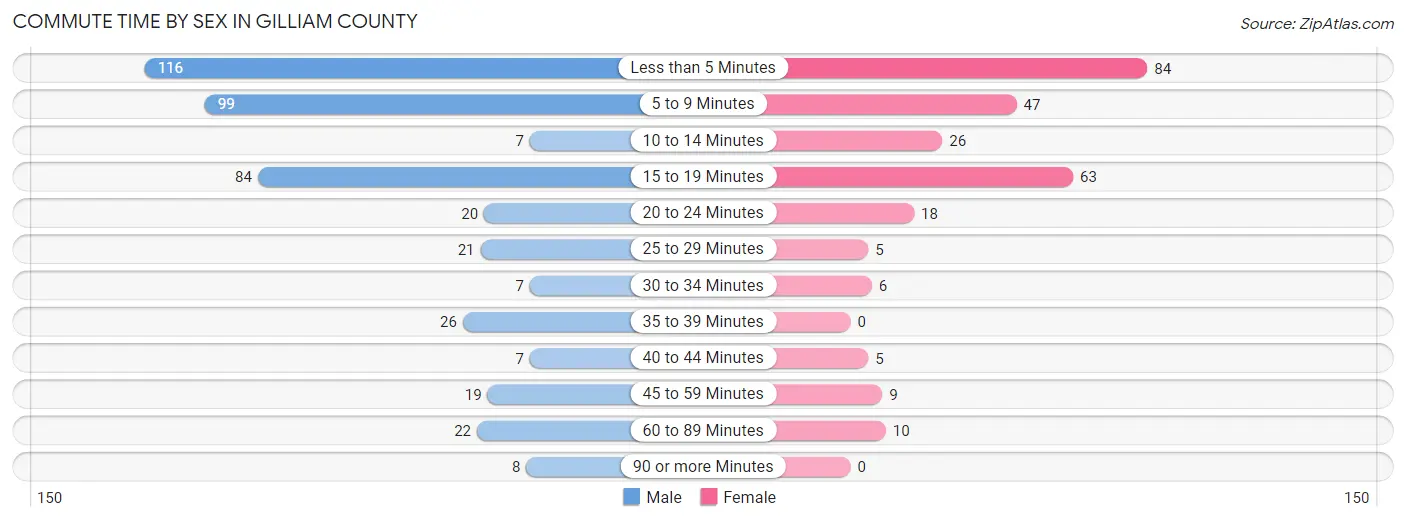
| Commute Time | Male | Female |
| Less than 5 Minutes | 116 (26.6%) | 84 (30.8%) |
| 5 to 9 Minutes | 99 (22.7%) | 47 (17.2%) |
| 10 to 14 Minutes | 7 (1.6%) | 26 (9.5%) |
| 15 to 19 Minutes | 84 (19.3%) | 63 (23.1%) |
| 20 to 24 Minutes | 20 (4.6%) | 18 (6.6%) |
| 25 to 29 Minutes | 21 (4.8%) | 5 (1.8%) |
| 30 to 34 Minutes | 7 (1.6%) | 6 (2.2%) |
| 35 to 39 Minutes | 26 (6.0%) | 0 (0.0%) |
| 40 to 44 Minutes | 7 (1.6%) | 5 (1.8%) |
| 45 to 59 Minutes | 19 (4.4%) | 9 (3.3%) |
| 60 to 89 Minutes | 22 (5.1%) | 10 (3.7%) |
| 90 or more Minutes | 8 (1.8%) | 0 (0.0%) |
Time of Departure to Work by Sex in Gilliam County
The most frequent times of departure to work in Gilliam County are 7:00 AM to 7:29 AM (75, 17.2%) for males and 6:30 AM to 6:59 AM (52, 19.1%) for females.
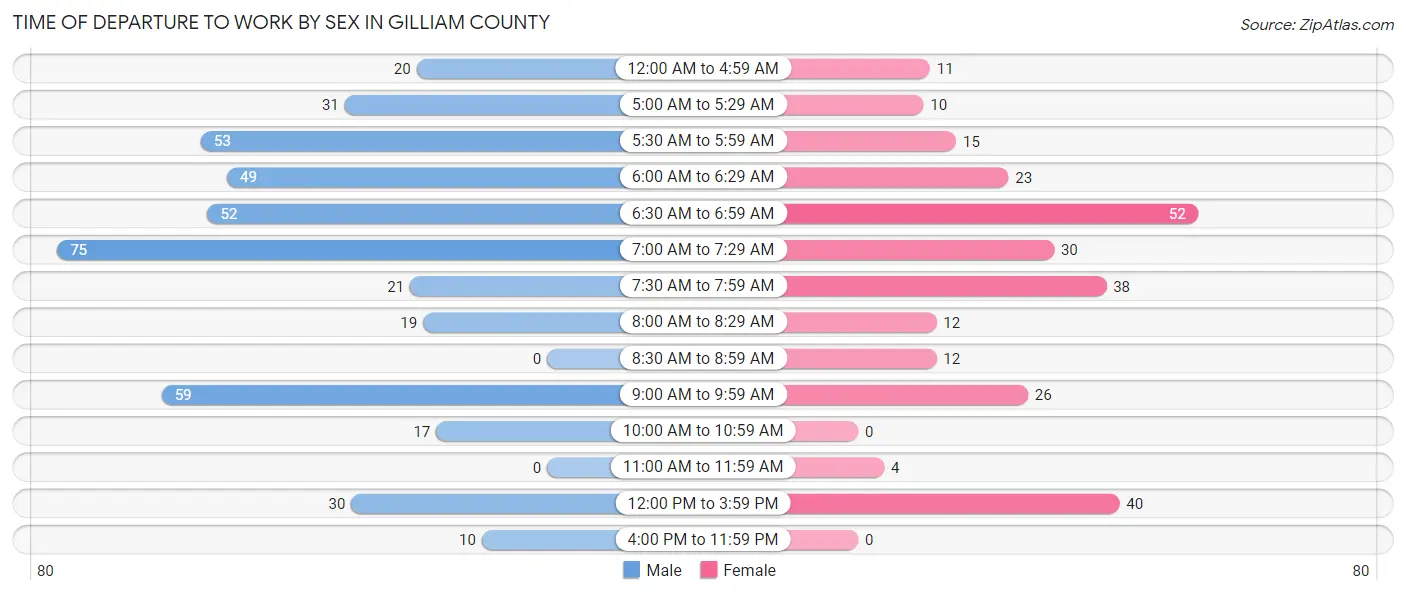
| Time of Departure | Male | Female |
| 12:00 AM to 4:59 AM | 20 (4.6%) | 11 (4.0%) |
| 5:00 AM to 5:29 AM | 31 (7.1%) | 10 (3.7%) |
| 5:30 AM to 5:59 AM | 53 (12.2%) | 15 (5.5%) |
| 6:00 AM to 6:29 AM | 49 (11.2%) | 23 (8.4%) |
| 6:30 AM to 6:59 AM | 52 (11.9%) | 52 (19.1%) |
| 7:00 AM to 7:29 AM | 75 (17.2%) | 30 (11.0%) |
| 7:30 AM to 7:59 AM | 21 (4.8%) | 38 (13.9%) |
| 8:00 AM to 8:29 AM | 19 (4.4%) | 12 (4.4%) |
| 8:30 AM to 8:59 AM | 0 (0.0%) | 12 (4.4%) |
| 9:00 AM to 9:59 AM | 59 (13.5%) | 26 (9.5%) |
| 10:00 AM to 10:59 AM | 17 (3.9%) | 0 (0.0%) |
| 11:00 AM to 11:59 AM | 0 (0.0%) | 4 (1.5%) |
| 12:00 PM to 3:59 PM | 30 (6.9%) | 40 (14.6%) |
| 4:00 PM to 11:59 PM | 10 (2.3%) | 0 (0.0%) |
| Total | 436 (100.0%) | 273 (100.0%) |
Housing Occupancy in Gilliam County
Occupancy by Ownership in Gilliam County
Of the total 862 dwellings in Gilliam County, owner-occupied units account for 643 (74.6%), while renter-occupied units make up 219 (25.4%).
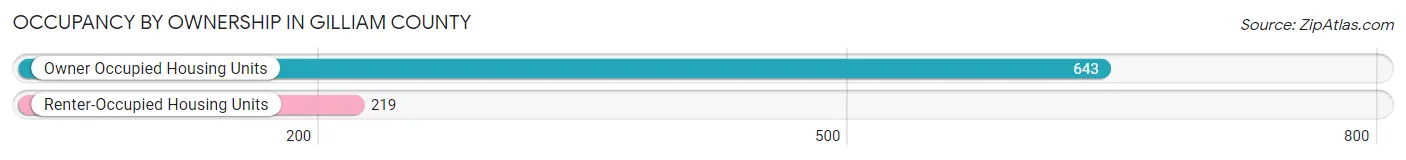
| Occupancy | # Housing Units | % Housing Units |
| Owner Occupied Housing Units | 643 | 74.6% |
| Renter-Occupied Housing Units | 219 | 25.4% |
| Total Occupied Housing Units | 862 | 100.0% |
Occupancy by Household Size in Gilliam County
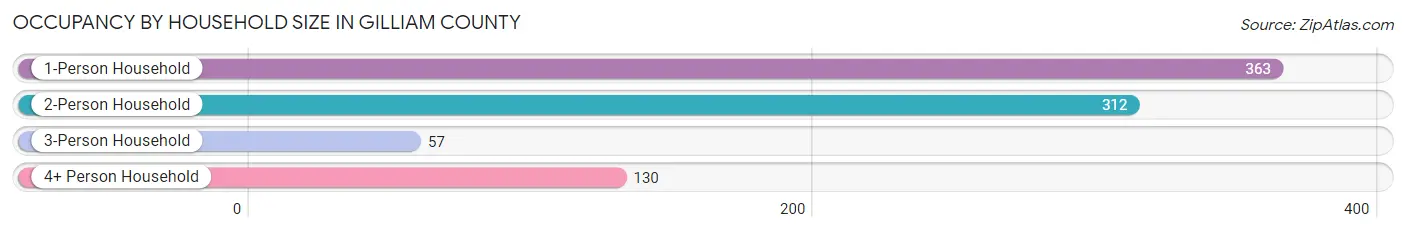
| Household Size | # Housing Units | % Housing Units |
| 1-Person Household | 363 | 42.1% |
| 2-Person Household | 312 | 36.2% |
| 3-Person Household | 57 | 6.6% |
| 4+ Person Household | 130 | 15.1% |
| Total Housing Units | 862 | 100.0% |
Occupancy by Ownership by Household Size in Gilliam County
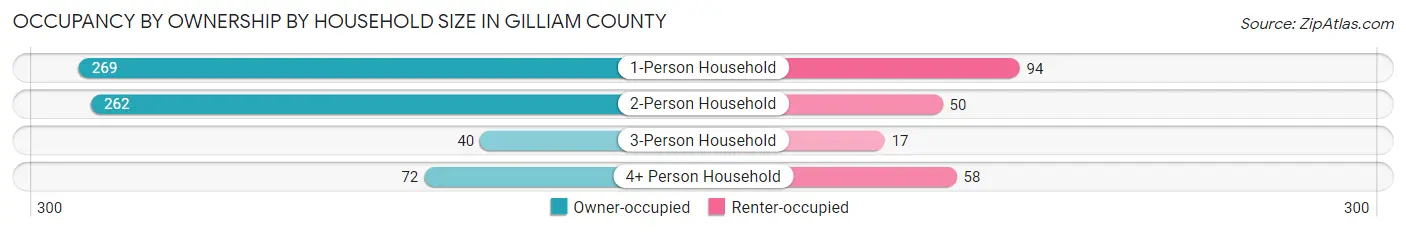
| Household Size | Owner-occupied | Renter-occupied |
| 1-Person Household | 269 (74.1%) | 94 (25.9%) |
| 2-Person Household | 262 (84.0%) | 50 (16.0%) |
| 3-Person Household | 40 (70.2%) | 17 (29.8%) |
| 4+ Person Household | 72 (55.4%) | 58 (44.6%) |
| Total Housing Units | 643 (74.6%) | 219 (25.4%) |
Occupancy by Educational Attainment in Gilliam County
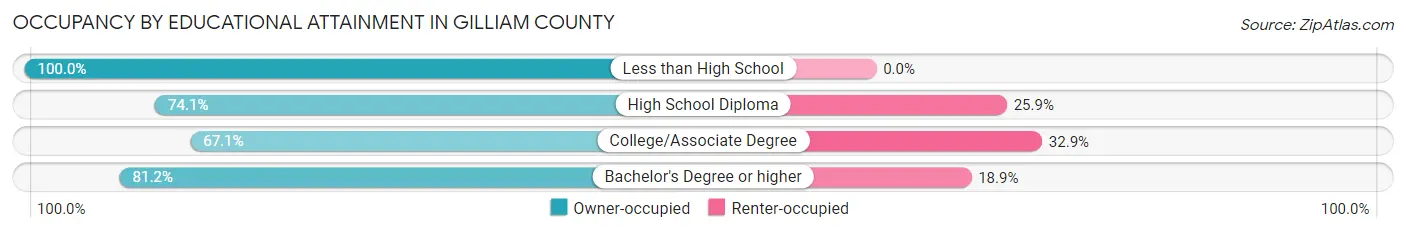
| Household Size | Owner-occupied | Renter-occupied |
| Less than High School | 44 (100.0%) | 0 (0.0%) |
| High School Diploma | 166 (74.1%) | 58 (25.9%) |
| College/Associate Degree | 235 (67.1%) | 115 (32.9%) |
| Bachelor's Degree or higher | 198 (81.1%) | 46 (18.9%) |
Occupancy by Age of Householder in Gilliam County
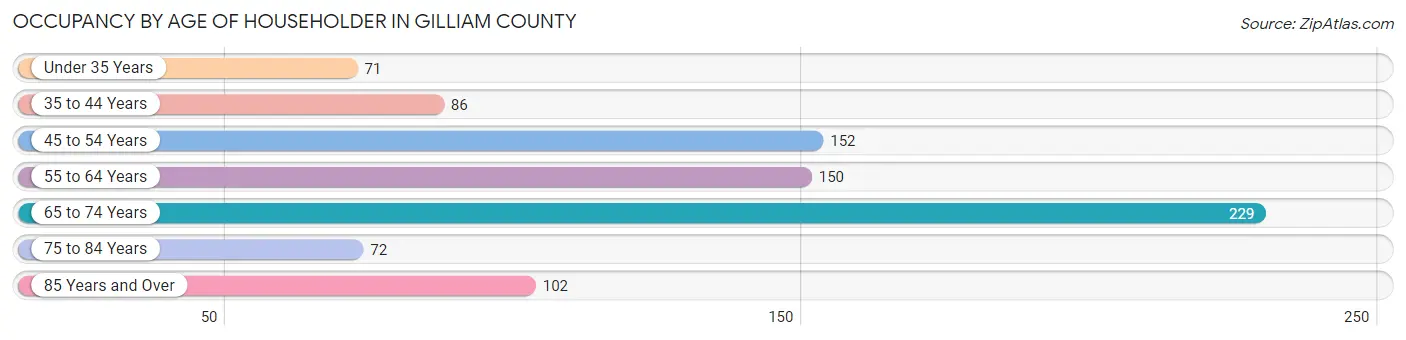
| Age Bracket | # Households | % Households |
| Under 35 Years | 71 | 8.2% |
| 35 to 44 Years | 86 | 10.0% |
| 45 to 54 Years | 152 | 17.6% |
| 55 to 64 Years | 150 | 17.4% |
| 65 to 74 Years | 229 | 26.6% |
| 75 to 84 Years | 72 | 8.4% |
| 85 Years and Over | 102 | 11.8% |
| Total | 862 | 100.0% |
Housing Finances in Gilliam County
Median Income by Occupancy in Gilliam County
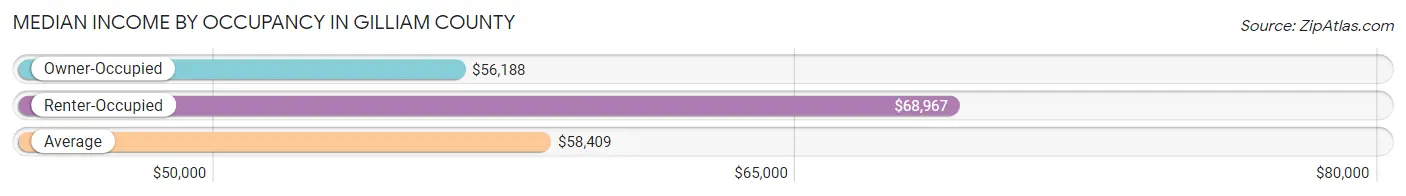
| Occupancy Type | # Households | Median Income |
| Owner-Occupied | 643 (74.6%) | $56,188 |
| Renter-Occupied | 219 (25.4%) | $68,967 |
| Average | 862 (100.0%) | $58,409 |
Occupancy by Householder Income Bracket in Gilliam County
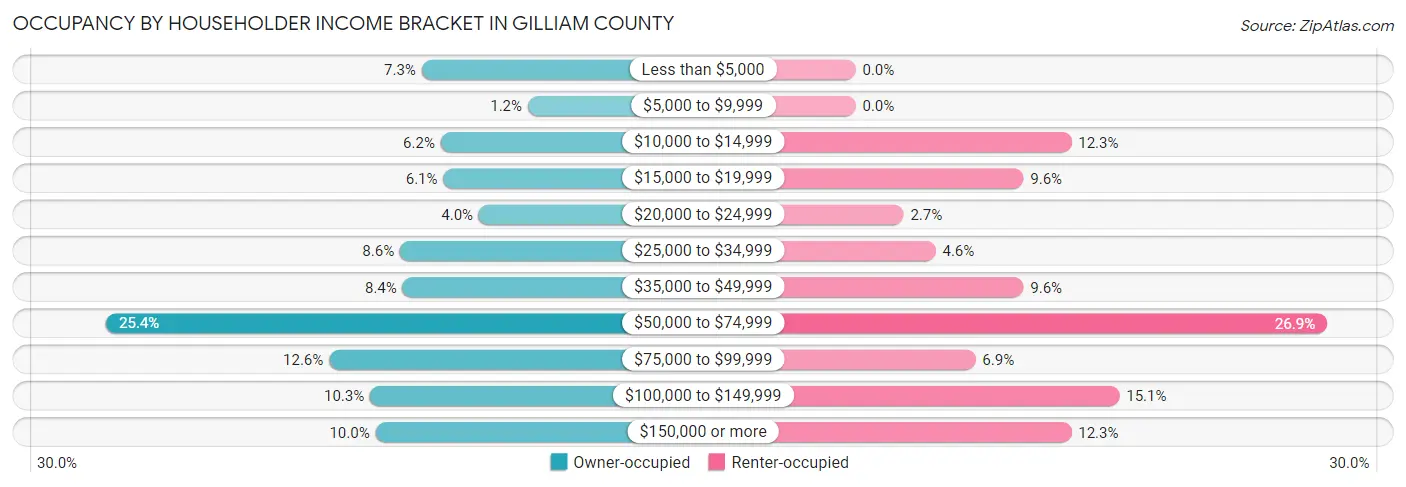
| Income Bracket | Owner-occupied | Renter-occupied |
| Less than $5,000 | 47 (7.3%) | 0 (0.0%) |
| $5,000 to $9,999 | 8 (1.2%) | 0 (0.0%) |
| $10,000 to $14,999 | 40 (6.2%) | 27 (12.3%) |
| $15,000 to $19,999 | 39 (6.1%) | 21 (9.6%) |
| $20,000 to $24,999 | 26 (4.0%) | 6 (2.7%) |
| $25,000 to $34,999 | 55 (8.6%) | 10 (4.6%) |
| $35,000 to $49,999 | 54 (8.4%) | 21 (9.6%) |
| $50,000 to $74,999 | 163 (25.4%) | 59 (26.9%) |
| $75,000 to $99,999 | 81 (12.6%) | 15 (6.9%) |
| $100,000 to $149,999 | 66 (10.3%) | 33 (15.1%) |
| $150,000 or more | 64 (10.0%) | 27 (12.3%) |
| Total | 643 (100.0%) | 219 (100.0%) |
Monthly Housing Cost Tiers in Gilliam County
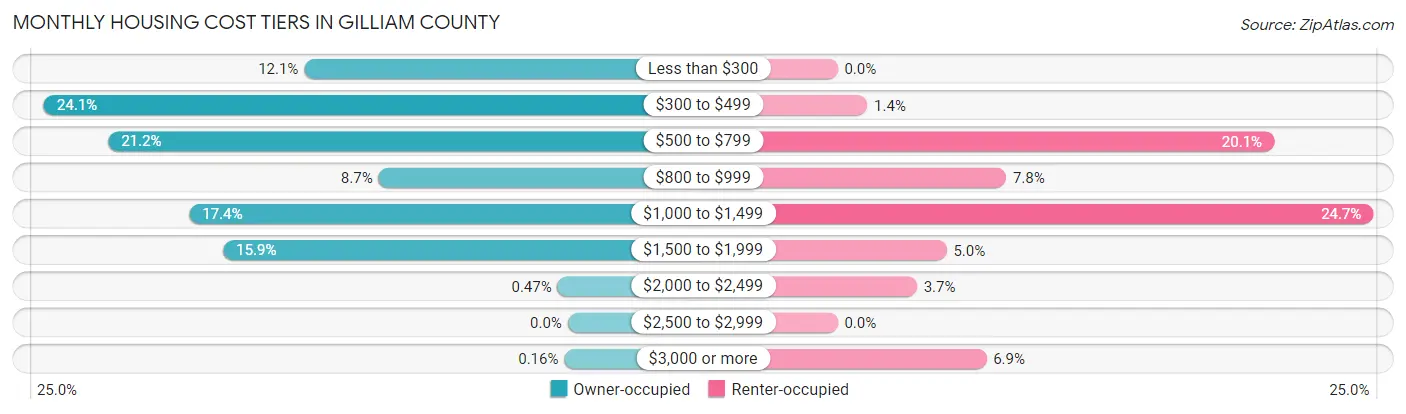
| Monthly Cost | Owner-occupied | Renter-occupied |
| Less than $300 | 78 (12.1%) | 0 (0.0%) |
| $300 to $499 | 155 (24.1%) | 3 (1.4%) |
| $500 to $799 | 136 (21.1%) | 44 (20.1%) |
| $800 to $999 | 56 (8.7%) | 17 (7.8%) |
| $1,000 to $1,499 | 112 (17.4%) | 54 (24.7%) |
| $1,500 to $1,999 | 102 (15.9%) | 11 (5.0%) |
| $2,000 to $2,499 | 3 (0.5%) | 8 (3.6%) |
| $2,500 to $2,999 | 0 (0.0%) | 0 (0.0%) |
| $3,000 or more | 1 (0.2%) | 15 (6.9%) |
| Total | 643 (100.0%) | 219 (100.0%) |
Physical Housing Characteristics in Gilliam County
Housing Structures in Gilliam County
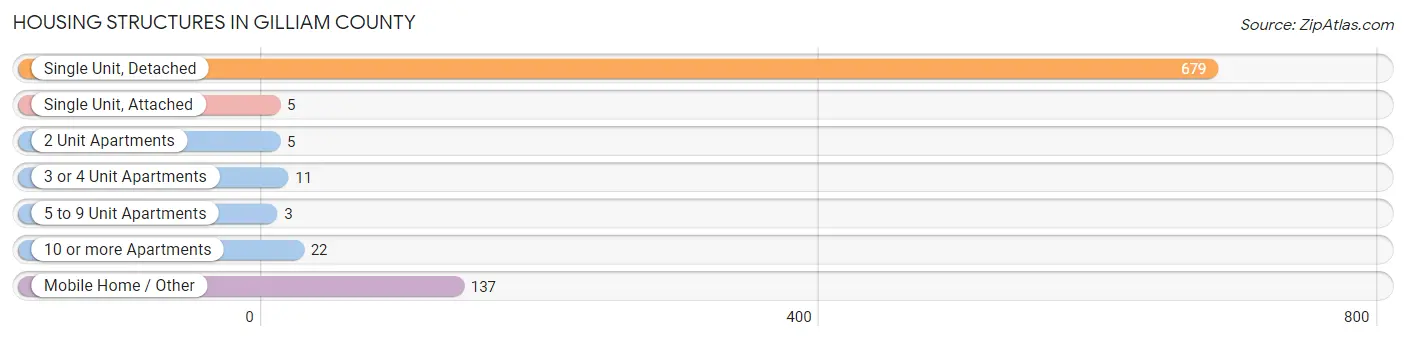
| Structure Type | # Housing Units | % Housing Units |
| Single Unit, Detached | 679 | 78.8% |
| Single Unit, Attached | 5 | 0.6% |
| 2 Unit Apartments | 5 | 0.6% |
| 3 or 4 Unit Apartments | 11 | 1.3% |
| 5 to 9 Unit Apartments | 3 | 0.4% |
| 10 or more Apartments | 22 | 2.5% |
| Mobile Home / Other | 137 | 15.9% |
| Total | 862 | 100.0% |
Housing Structures by Occupancy in Gilliam County
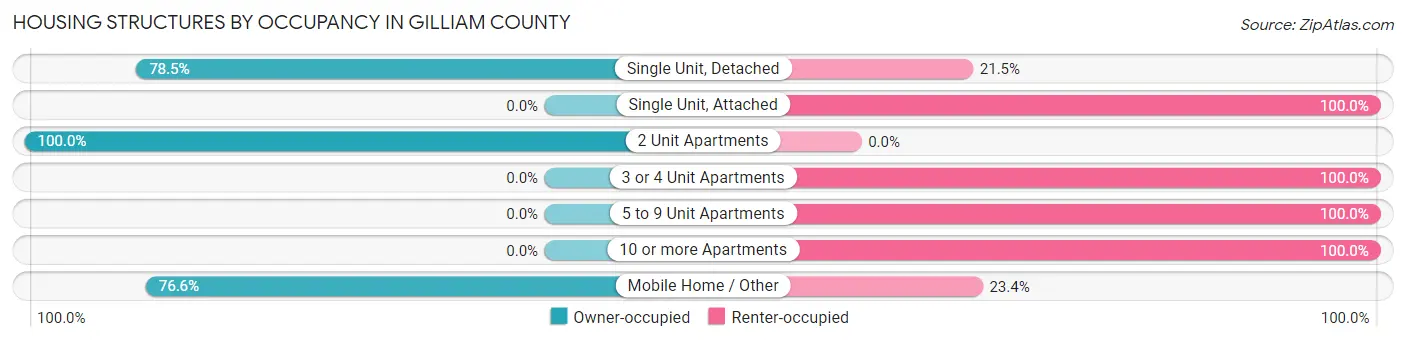
| Structure Type | Owner-occupied | Renter-occupied |
| Single Unit, Detached | 533 (78.5%) | 146 (21.5%) |
| Single Unit, Attached | 0 (0.0%) | 5 (100.0%) |
| 2 Unit Apartments | 5 (100.0%) | 0 (0.0%) |
| 3 or 4 Unit Apartments | 0 (0.0%) | 11 (100.0%) |
| 5 to 9 Unit Apartments | 0 (0.0%) | 3 (100.0%) |
| 10 or more Apartments | 0 (0.0%) | 22 (100.0%) |
| Mobile Home / Other | 105 (76.6%) | 32 (23.4%) |
| Total | 643 (74.6%) | 219 (25.4%) |
Housing Structures by Number of Rooms in Gilliam County
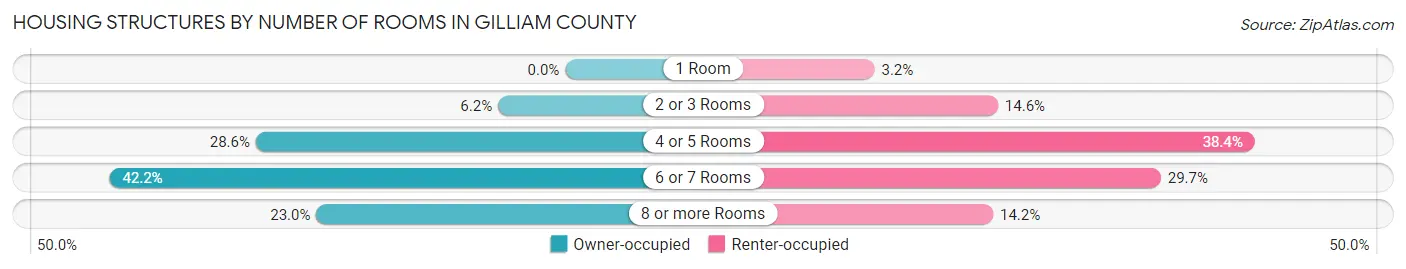
| Number of Rooms | Owner-occupied | Renter-occupied |
| 1 Room | 0 (0.0%) | 7 (3.2%) |
| 2 or 3 Rooms | 40 (6.2%) | 32 (14.6%) |
| 4 or 5 Rooms | 184 (28.6%) | 84 (38.4%) |
| 6 or 7 Rooms | 271 (42.1%) | 65 (29.7%) |
| 8 or more Rooms | 148 (23.0%) | 31 (14.2%) |
| Total | 643 (100.0%) | 219 (100.0%) |
Housing Structure by Heating Type in Gilliam County
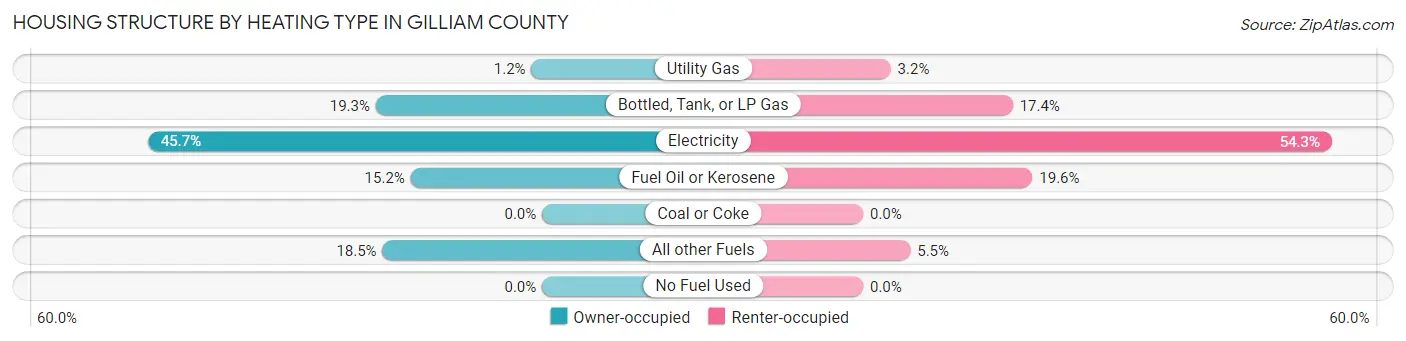
| Heating Type | Owner-occupied | Renter-occupied |
| Utility Gas | 8 (1.2%) | 7 (3.2%) |
| Bottled, Tank, or LP Gas | 124 (19.3%) | 38 (17.3%) |
| Electricity | 294 (45.7%) | 119 (54.3%) |
| Fuel Oil or Kerosene | 98 (15.2%) | 43 (19.6%) |
| Coal or Coke | 0 (0.0%) | 0 (0.0%) |
| All other Fuels | 119 (18.5%) | 12 (5.5%) |
| No Fuel Used | 0 (0.0%) | 0 (0.0%) |
| Total | 643 (100.0%) | 219 (100.0%) |
Household Vehicle Usage in Gilliam County
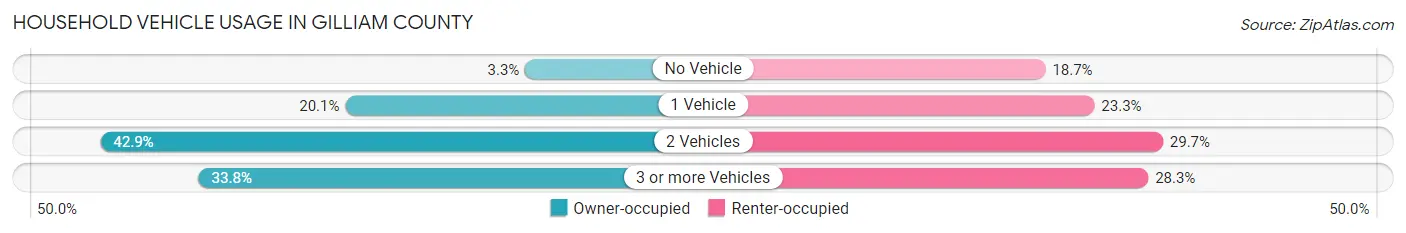
| Vehicles per Household | Owner-occupied | Renter-occupied |
| No Vehicle | 21 (3.3%) | 41 (18.7%) |
| 1 Vehicle | 129 (20.1%) | 51 (23.3%) |
| 2 Vehicles | 276 (42.9%) | 65 (29.7%) |
| 3 or more Vehicles | 217 (33.8%) | 62 (28.3%) |
| Total | 643 (100.0%) | 219 (100.0%) |
Real Estate & Mortgages in Gilliam County
Real Estate and Mortgage Overview in Gilliam County
| Characteristic | Without Mortgage | With Mortgage |
| Housing Units | 393 | 250 |
| Median Property Value | $131,900 | $216,300 |
| Median Household Income | $33,906 | $38 |
| Monthly Housing Costs | $413 | $1 |
| Real Estate Taxes | $1,198 | $0 |
Property Value by Mortgage Status in Gilliam County
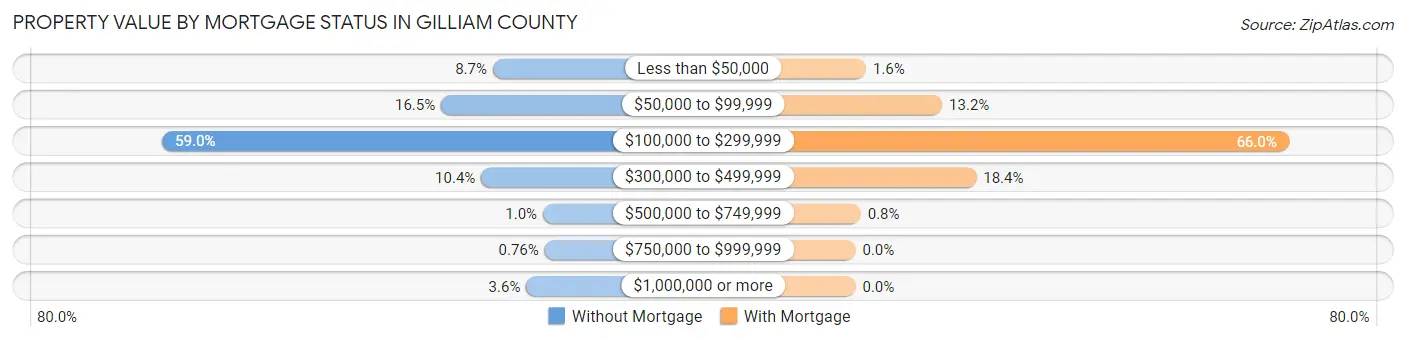
| Property Value | Without Mortgage | With Mortgage |
| Less than $50,000 | 34 (8.6%) | 4 (1.6%) |
| $50,000 to $99,999 | 65 (16.5%) | 33 (13.2%) |
| $100,000 to $299,999 | 232 (59.0%) | 165 (66.0%) |
| $300,000 to $499,999 | 41 (10.4%) | 46 (18.4%) |
| $500,000 to $749,999 | 4 (1.0%) | 2 (0.8%) |
| $750,000 to $999,999 | 3 (0.8%) | 0 (0.0%) |
| $1,000,000 or more | 14 (3.6%) | 0 (0.0%) |
| Total | 393 (100.0%) | 250 (100.0%) |
Household Income by Mortgage Status in Gilliam County
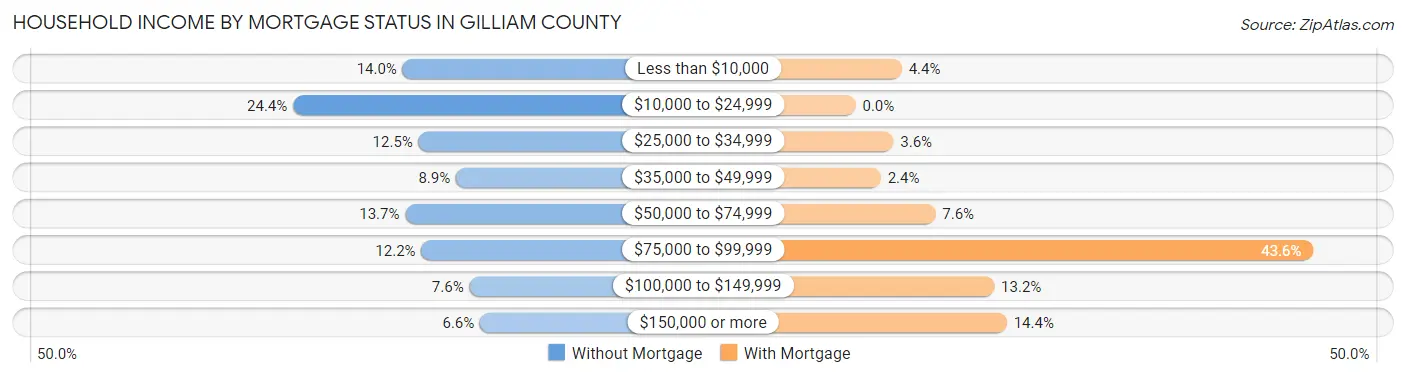
| Household Income | Without Mortgage | With Mortgage |
| Less than $10,000 | 55 (14.0%) | 11 (4.4%) |
| $10,000 to $24,999 | 96 (24.4%) | 0 (0.0%) |
| $25,000 to $34,999 | 49 (12.5%) | 9 (3.6%) |
| $35,000 to $49,999 | 35 (8.9%) | 6 (2.4%) |
| $50,000 to $74,999 | 54 (13.7%) | 19 (7.6%) |
| $75,000 to $99,999 | 48 (12.2%) | 109 (43.6%) |
| $100,000 to $149,999 | 30 (7.6%) | 33 (13.2%) |
| $150,000 or more | 26 (6.6%) | 36 (14.4%) |
| Total | 393 (100.0%) | 250 (100.0%) |
Property Value to Household Income Ratio in Gilliam County
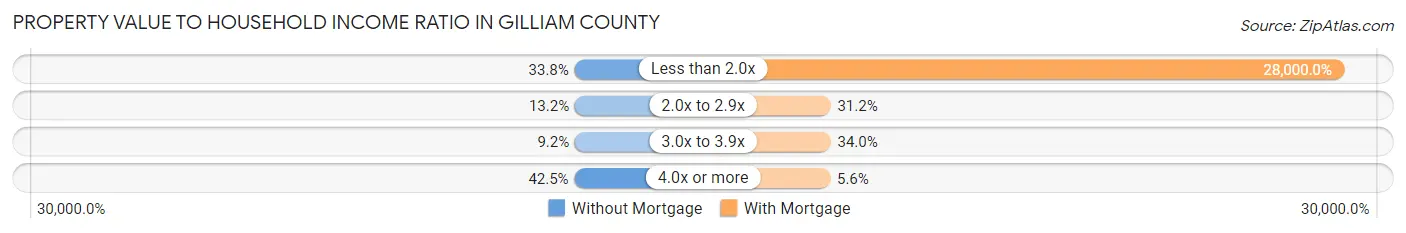
| Value-to-Income Ratio | Without Mortgage | With Mortgage |
| Less than 2.0x | 133 (33.8%) | 70,000 (28,000.0%) |
| 2.0x to 2.9x | 52 (13.2%) | 78 (31.2%) |
| 3.0x to 3.9x | 36 (9.2%) | 85 (34.0%) |
| 4.0x or more | 167 (42.5%) | 14 (5.6%) |
| Total | 393 (100.0%) | 250 (100.0%) |
Real Estate Taxes by Mortgage Status in Gilliam County
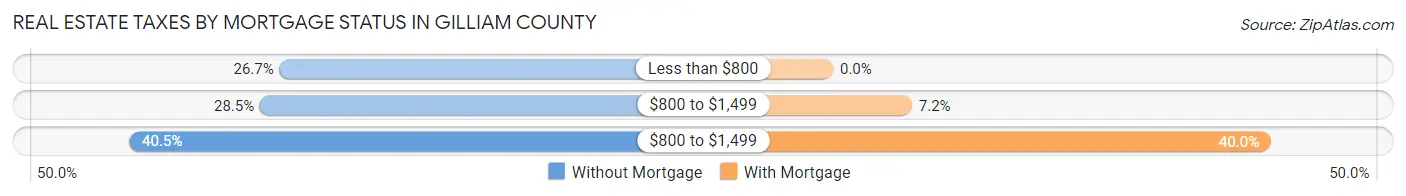
| Property Taxes | Without Mortgage | With Mortgage |
| Less than $800 | 105 (26.7%) | 0 (0.0%) |
| $800 to $1,499 | 112 (28.5%) | 18 (7.2%) |
| $800 to $1,499 | 159 (40.5%) | 100 (40.0%) |
| Total | 393 (100.0%) | 250 (100.0%) |
Health & Disability in Gilliam County
Health Insurance Coverage by Age in Gilliam County
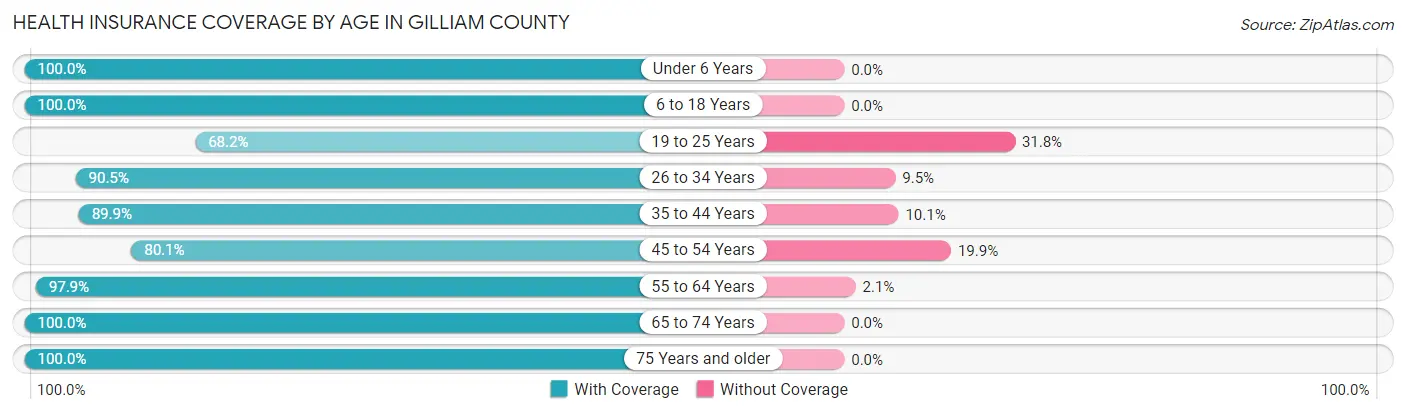
| Age Bracket | With Coverage | Without Coverage |
| Under 6 Years | 64 (100.0%) | 0 (0.0%) |
| 6 to 18 Years | 350 (100.0%) | 0 (0.0%) |
| 19 to 25 Years | 75 (68.2%) | 35 (31.8%) |
| 26 to 34 Years | 133 (90.5%) | 14 (9.5%) |
| 35 to 44 Years | 187 (89.9%) | 21 (10.1%) |
| 45 to 54 Years | 161 (80.1%) | 40 (19.9%) |
| 55 to 64 Years | 278 (97.9%) | 6 (2.1%) |
| 65 to 74 Years | 360 (100.0%) | 0 (0.0%) |
| 75 Years and older | 228 (100.0%) | 0 (0.0%) |
| Total | 1,836 (94.1%) | 116 (5.9%) |
Health Insurance Coverage by Citizenship Status in Gilliam County
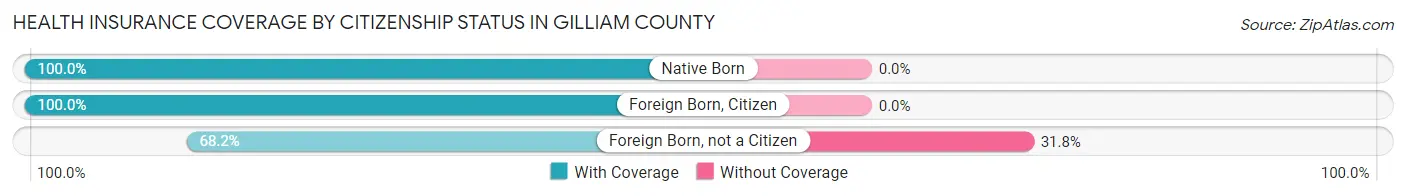
| Citizenship Status | With Coverage | Without Coverage |
| Native Born | 64 (100.0%) | 0 (0.0%) |
| Foreign Born, Citizen | 350 (100.0%) | 0 (0.0%) |
| Foreign Born, not a Citizen | 75 (68.2%) | 35 (31.8%) |
Health Insurance Coverage by Household Income in Gilliam County
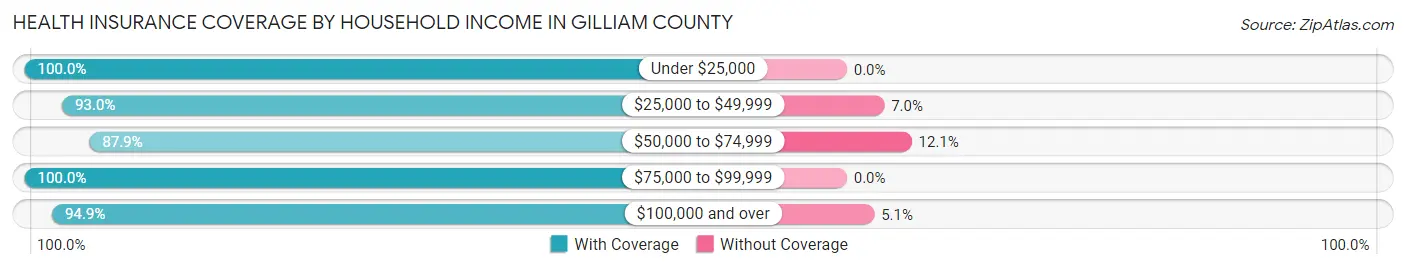
| Household Income | With Coverage | Without Coverage |
| Under $25,000 | 273 (100.0%) | 0 (0.0%) |
| $25,000 to $49,999 | 252 (93.0%) | 19 (7.0%) |
| $50,000 to $74,999 | 485 (87.9%) | 67 (12.1%) |
| $75,000 to $99,999 | 260 (100.0%) | 0 (0.0%) |
| $100,000 and over | 554 (94.9%) | 30 (5.1%) |
Public vs Private Health Insurance Coverage by Age in Gilliam County
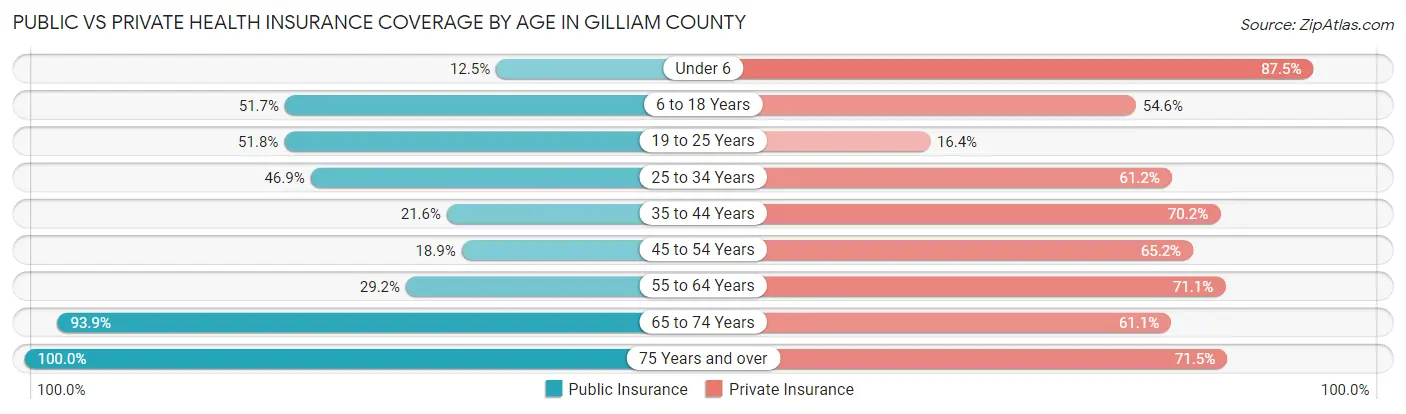
| Age Bracket | Public Insurance | Private Insurance |
| Under 6 | 8 (12.5%) | 56 (87.5%) |
| 6 to 18 Years | 181 (51.7%) | 191 (54.6%) |
| 19 to 25 Years | 57 (51.8%) | 18 (16.4%) |
| 25 to 34 Years | 69 (46.9%) | 90 (61.2%) |
| 35 to 44 Years | 45 (21.6%) | 146 (70.2%) |
| 45 to 54 Years | 38 (18.9%) | 131 (65.2%) |
| 55 to 64 Years | 83 (29.2%) | 202 (71.1%) |
| 65 to 74 Years | 338 (93.9%) | 220 (61.1%) |
| 75 Years and over | 228 (100.0%) | 163 (71.5%) |
| Total | 1,047 (53.6%) | 1,217 (62.4%) |
Disability Status by Sex by Age in Gilliam County
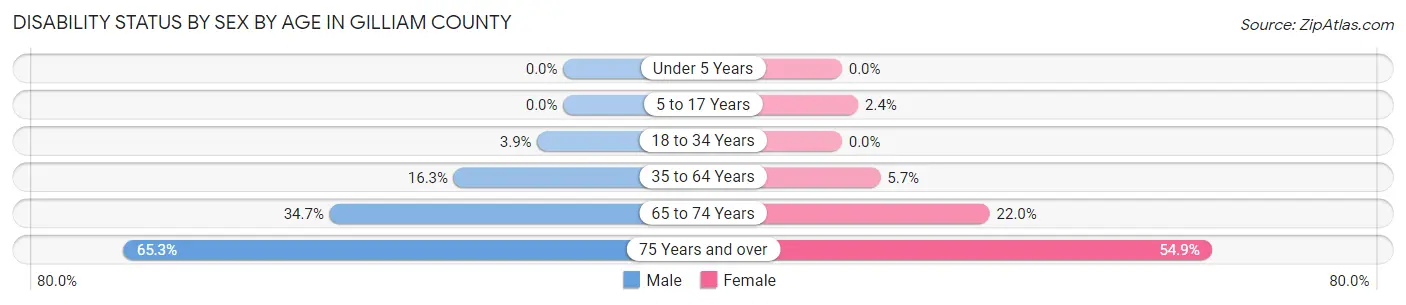
| Age Bracket | Male | Female |
| Under 5 Years | 0 (0.0%) | 0 (0.0%) |
| 5 to 17 Years | 0 (0.0%) | 4 (2.4%) |
| 18 to 34 Years | 8 (3.8%) | 0 (0.0%) |
| 35 to 64 Years | 53 (16.3%) | 21 (5.7%) |
| 65 to 74 Years | 68 (34.7%) | 36 (22.0%) |
| 75 Years and over | 62 (65.3%) | 73 (54.9%) |
Disability Class by Sex by Age in Gilliam County
Disability Class: Hearing Difficulty
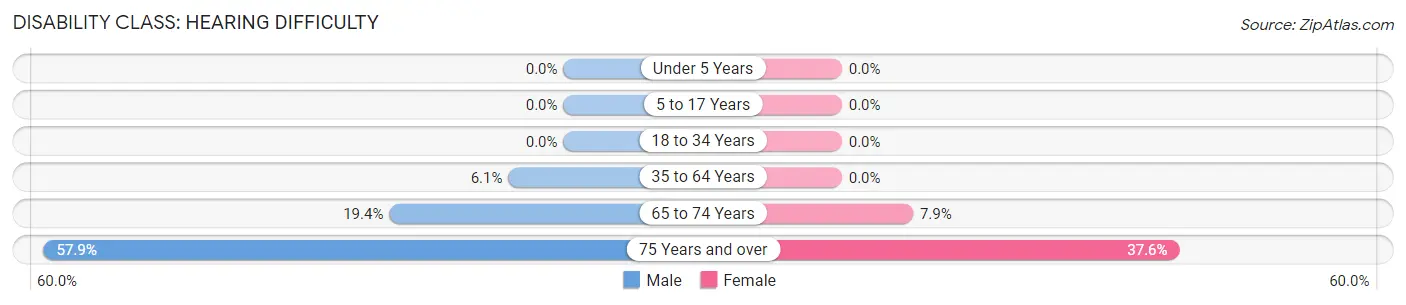
| Age Bracket | Male | Female |
| Under 5 Years | 0 (0.0%) | 0 (0.0%) |
| 5 to 17 Years | 0 (0.0%) | 0 (0.0%) |
| 18 to 34 Years | 0 (0.0%) | 0 (0.0%) |
| 35 to 64 Years | 20 (6.1%) | 0 (0.0%) |
| 65 to 74 Years | 38 (19.4%) | 13 (7.9%) |
| 75 Years and over | 55 (57.9%) | 50 (37.6%) |
Disability Class: Vision Difficulty
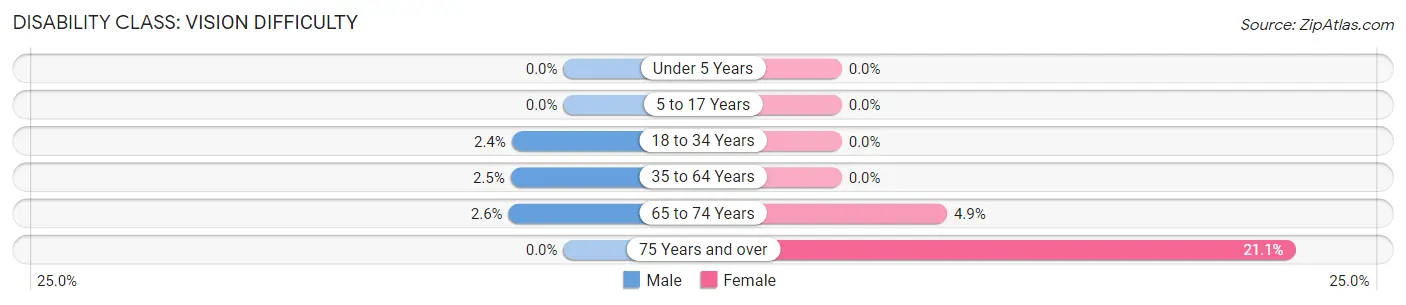
| Age Bracket | Male | Female |
| Under 5 Years | 0 (0.0%) | 0 (0.0%) |
| 5 to 17 Years | 0 (0.0%) | 0 (0.0%) |
| 18 to 34 Years | 5 (2.4%) | 0 (0.0%) |
| 35 to 64 Years | 8 (2.5%) | 0 (0.0%) |
| 65 to 74 Years | 5 (2.5%) | 8 (4.9%) |
| 75 Years and over | 0 (0.0%) | 28 (21.0%) |
Disability Class: Cognitive Difficulty
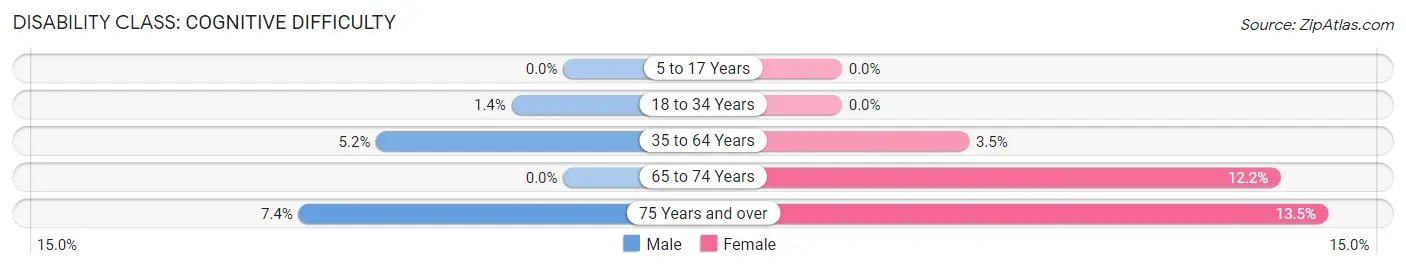
| Age Bracket | Male | Female |
| 5 to 17 Years | 0 (0.0%) | 0 (0.0%) |
| 18 to 34 Years | 3 (1.4%) | 0 (0.0%) |
| 35 to 64 Years | 17 (5.2%) | 13 (3.5%) |
| 65 to 74 Years | 0 (0.0%) | 20 (12.2%) |
| 75 Years and over | 7 (7.4%) | 18 (13.5%) |
Disability Class: Ambulatory Difficulty
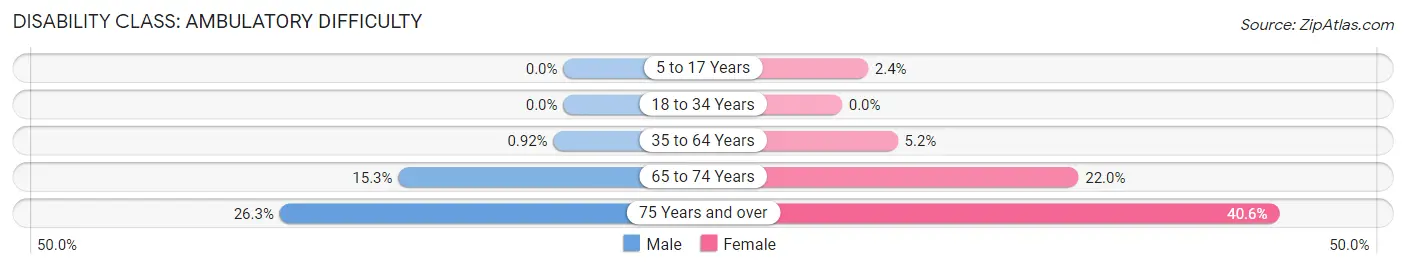
| Age Bracket | Male | Female |
| 5 to 17 Years | 0 (0.0%) | 4 (2.4%) |
| 18 to 34 Years | 0 (0.0%) | 0 (0.0%) |
| 35 to 64 Years | 3 (0.9%) | 19 (5.2%) |
| 65 to 74 Years | 30 (15.3%) | 36 (22.0%) |
| 75 Years and over | 25 (26.3%) | 54 (40.6%) |
Disability Class: Self-Care Difficulty
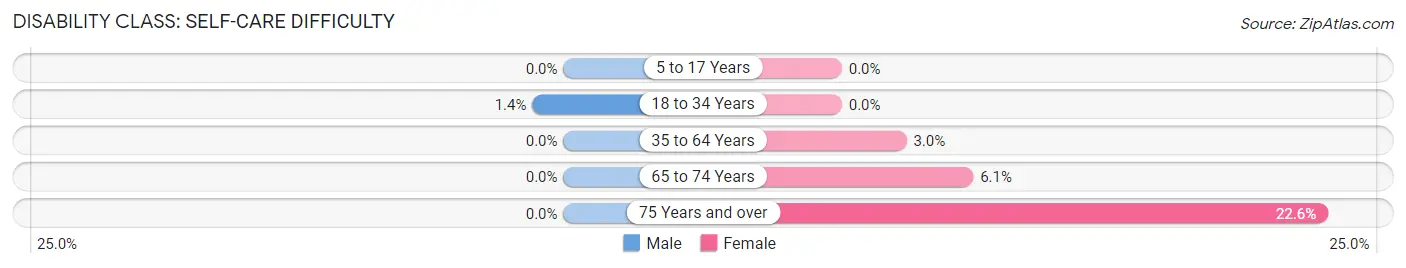
| Age Bracket | Male | Female |
| 5 to 17 Years | 0 (0.0%) | 0 (0.0%) |
| 18 to 34 Years | 3 (1.4%) | 0 (0.0%) |
| 35 to 64 Years | 0 (0.0%) | 11 (3.0%) |
| 65 to 74 Years | 0 (0.0%) | 10 (6.1%) |
| 75 Years and over | 0 (0.0%) | 30 (22.6%) |
Technology Access in Gilliam County
Computing Device Access in Gilliam County
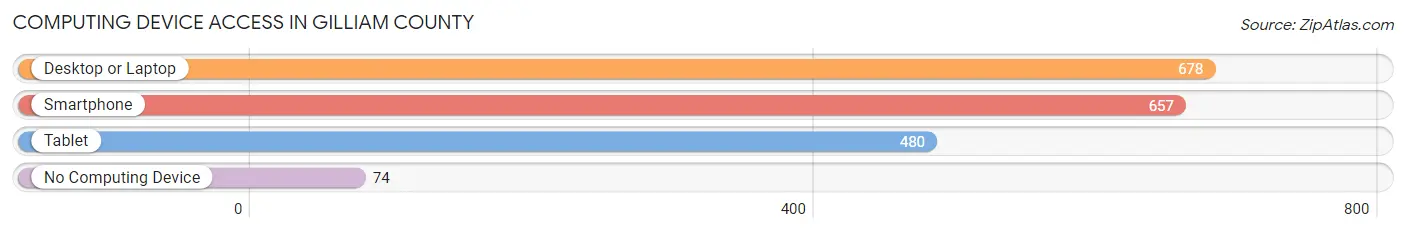
| Device Type | # Households | % Households |
| Desktop or Laptop | 678 | 78.6% |
| Smartphone | 657 | 76.2% |
| Tablet | 480 | 55.7% |
| No Computing Device | 74 | 8.6% |
| Total | 862 | 100.0% |
Internet Access in Gilliam County
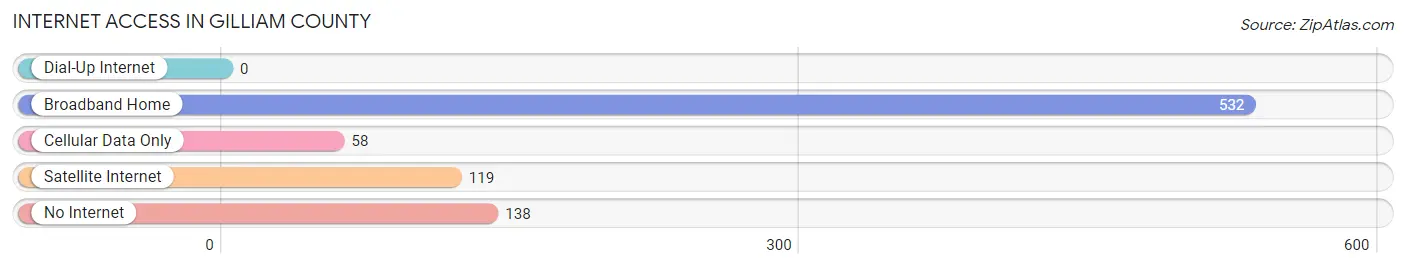
| Internet Type | # Households | % Households |
| Dial-Up Internet | 0 | 0.0% |
| Broadband Home | 532 | 61.7% |
| Cellular Data Only | 58 | 6.7% |
| Satellite Internet | 119 | 13.8% |
| No Internet | 138 | 16.0% |
| Total | 862 | 100.0% |
Gilliam County Summary
Gilliam County is located in the north-central region of Oregon, and is part of the state’s Columbia River Gorge region. The county is bordered by Sherman County to the north, Wasco County to the east, Wheeler County to the south, and Klickitat County, Washington to the west. The county seat is Condon, and the largest city is Arlington.
History
Gilliam County was created in 1885 from parts of Wasco and Wheeler counties. It was named after Cornelius Gilliam, a pioneer who was killed in the Yakima Indian War of 1855. The county was originally populated by Native American tribes, including the Wasco, Tenino, and Yakama.
The first settlers in the area were ranchers and farmers, who arrived in the late 1800s. The county was largely agricultural until the early 1900s, when the railroad arrived and the area began to develop. The county’s economy was further bolstered by the construction of the John Day Dam in the 1950s, which provided irrigation and hydroelectric power to the region.
Geography
Gilliam County covers an area of 1,092 square miles, making it the second-smallest county in Oregon. The county is located in the Columbia River Gorge region, and is characterized by rolling hills and wide open spaces. The county is home to several rivers, including the John Day River, the Deschutes River, and the Columbia River.
The county is home to several protected areas, including the John Day Fossil Beds National Monument, the Deschutes National Forest, and the Columbia River Gorge National Scenic Area. The county is also home to several state parks, including the Deschutes River State Recreation Area and the John Day Fossil Beds State Park.
Economy
Gilliam County’s economy is largely based on agriculture and tourism. The county is home to several large farms, which produce a variety of crops, including wheat, barley, hay, and potatoes. The county is also home to several wineries and breweries, which produce a variety of wines and beers.
Tourism is an important part of the county’s economy, as the area is home to several popular attractions, including the John Day Fossil Beds National Monument, the Deschutes National Forest, and the Columbia River Gorge National Scenic Area. The county is also home to several state parks, which attract visitors from all over the country.
Demographics
As of the 2010 census, Gilliam County had a population of 1,871. The population is largely white (94.2%), with small percentages of Native American (2.2%), Hispanic (1.7%), and Asian (0.7%) populations. The median household income is $41,944, and the median age is 44.7. The county has a poverty rate of 13.2%.
Common Questions
What is the Total Population of Gilliam County?
Total Population of Gilliam County is 1,983.
What is the Total Male Population of Gilliam County?
Total Male Population of Gilliam County is 1,029.
What is the Total Female Population of Gilliam County?
Total Female Population of Gilliam County is 954.
What is the Ratio of Males per 100 Females in Gilliam County?
There are 107.86 Males per 100 Females in Gilliam County.
What is the Ratio of Females per 100 Males in Gilliam County?
There are 92.71 Females per 100 Males in Gilliam County.
What is the Median Population Age in Gilliam County?
Median Population Age in Gilliam County is 51.0 Years.
What is the Average Family Size in Gilliam County
Average Family Size in Gilliam County is 3.1 People.
What is the Average Household Size in Gilliam County
Average Household Size in Gilliam County is 2.2 People.
What is Per Capita Income in Gilliam County?
Per Capita income in Gilliam County is $34,042.
What is the Median Family Income in Gilliam County?
Median Family Income in Gilliam County is $72,431.
What is the Median Household income in Gilliam County?
Median Household Income in Gilliam County is $58,409.
What is Income or Wage Gap in Gilliam County?
Income or Wage Gap in Gilliam County is 26.8%.
Women in Gilliam County earn 73.2 cents for every dollar earned by a man.
What is Inequality or Gini Index in Gilliam County?
Inequality or Gini Index in Gilliam County is 0.46.
How Large is the Labor Force in Gilliam County?
There are 856 People in the Labor Forcein in Gilliam County.
What is the Percentage of People in the Labor Force in Gilliam County?
51.8% of People are in the Labor Force in Gilliam County.
What is the Unemployment Rate in Gilliam County?
Unemployment Rate in Gilliam County is 6.3%.