Deschutes County, OR
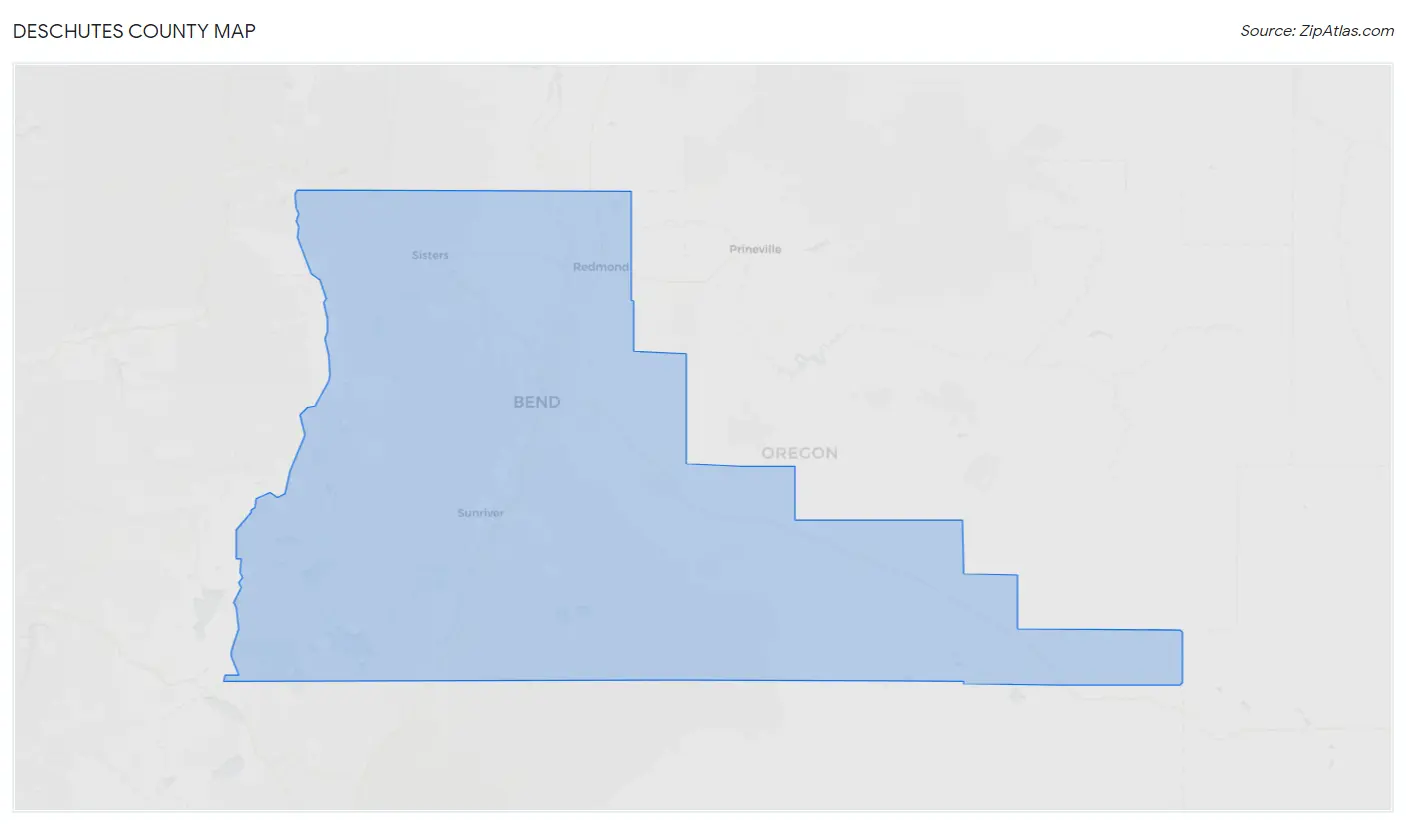
Deschutes County Map
Deschutes County Overview
199,352
TOTAL POPULATION
99,597
MALE POPULATION
99,755
FEMALE POPULATION
99.84
MALES / 100 FEMALES
100.16
FEMALES / 100 MALES
42.6
MEDIAN AGE
2.9
AVG FAMILY SIZE
2.4
AVG HOUSEHOLD SIZE
$46,765
PER CAPITA INCOME
$99,728
AVG FAMILY INCOME
$82,042
AVG HOUSEHOLD INCOME
30.1%
WAGE / INCOME GAP [ % ]
69.9¢/ $1
WAGE / INCOME GAP [ $ ]
$11,592
FAMILY INCOME DEFICIT
0.46
INEQUALITY / GINI INDEX
104,239
LABOR FORCE [ PEOPLE ]
63.2%
PERCENT IN LABOR FORCE
5.2%
UNEMPLOYMENT RATE
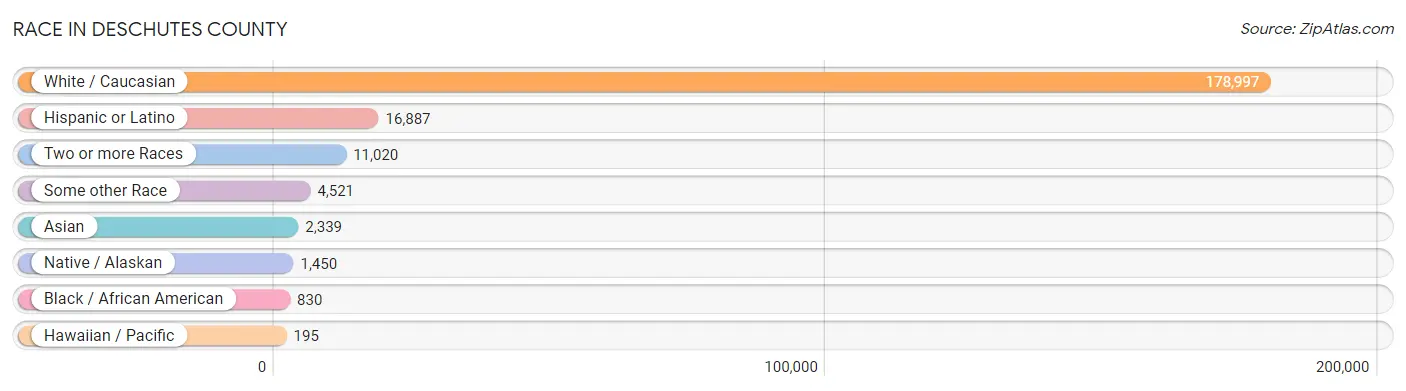
Race in Deschutes County
The most populous races in Deschutes County are White / Caucasian (178,997 | 89.8%), Hispanic or Latino (16,887 | 8.5%), and Two or more Races (11,020 | 5.5%).
| Race | # Population | % Population |
| Asian | 2,339 | 1.2% |
| Black / African American | 830 | 0.4% |
| Hawaiian / Pacific | 195 | 0.1% |
| Hispanic or Latino | 16,887 | 8.5% |
| Native / Alaskan | 1,450 | 0.7% |
| White / Caucasian | 178,997 | 89.8% |
| Two or more Races | 11,020 | 5.5% |
| Some other Race | 4,521 | 2.3% |
| Total | 199,352 | 100.0% |
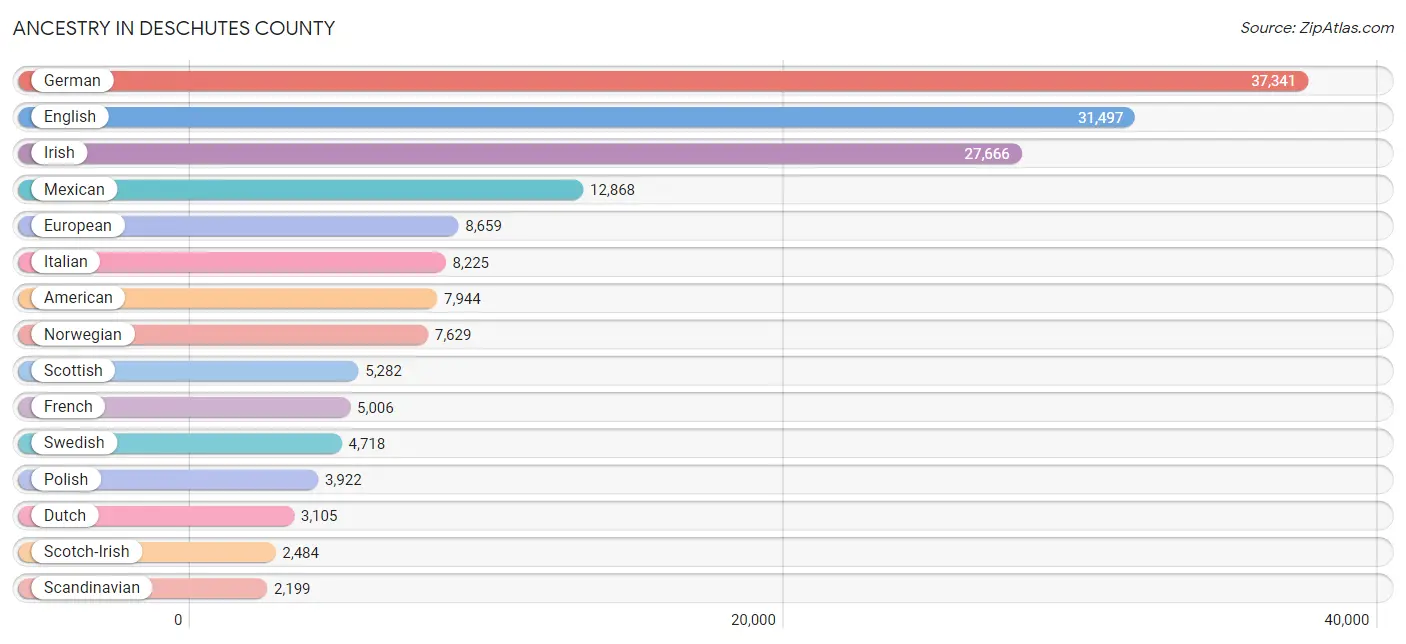
Ancestry in Deschutes County
The most populous ancestries reported in Deschutes County are German (37,341 | 18.7%), English (31,497 | 15.8%), Irish (27,666 | 13.9%), Mexican (12,868 | 6.5%), and European (8,659 | 4.3%), together accounting for 59.2% of all Deschutes County residents.
| Ancestry | # Population | % Population |
| African | 54 | 0.0% |
| Albanian | 54 | 0.0% |
| Alsatian | 17 | 0.0% |
| American | 7,944 | 4.0% |
| Apache | 7 | 0.0% |
| Arab | 398 | 0.2% |
| Arapaho | 24 | 0.0% |
| Argentinean | 86 | 0.0% |
| Armenian | 90 | 0.1% |
| Austrian | 624 | 0.3% |
| Barbadian | 9 | 0.0% |
| Basque | 256 | 0.1% |
| Belgian | 141 | 0.1% |
| Bhutanese | 1,090 | 0.5% |
| Blackfeet | 103 | 0.1% |
| Brazilian | 176 | 0.1% |
| British | 2,123 | 1.1% |
| Bulgarian | 76 | 0.0% |
| Burmese | 576 | 0.3% |
| Cajun | 26 | 0.0% |
| Cambodian | 12 | 0.0% |
| Canadian | 943 | 0.5% |
| Celtic | 52 | 0.0% |
| Central American | 1,253 | 0.6% |
| Central American Indian | 49 | 0.0% |
| Cherokee | 492 | 0.3% |
| Chickasaw | 59 | 0.0% |
| Chilean | 59 | 0.0% |
| Chippewa | 167 | 0.1% |
| Choctaw | 208 | 0.1% |
| Colombian | 184 | 0.1% |
| Comanche | 20 | 0.0% |
| Costa Rican | 80 | 0.0% |
| Cree | 38 | 0.0% |
| Creek | 29 | 0.0% |
| Croatian | 312 | 0.2% |
| Cuban | 109 | 0.1% |
| Czech | 1,084 | 0.5% |
| Czechoslovakian | 122 | 0.1% |
| Danish | 1,665 | 0.8% |
| Dutch | 3,105 | 1.6% |
| Dutch West Indian | 30 | 0.0% |
| Eastern European | 664 | 0.3% |
| Ecuadorian | 83 | 0.0% |
| English | 31,497 | 15.8% |
| Estonian | 73 | 0.0% |
| Ethiopian | 76 | 0.0% |
| European | 8,659 | 4.3% |
| Filipino | 116 | 0.1% |
| Finnish | 1,059 | 0.5% |
| French | 5,006 | 2.5% |
| French American Indian | 32 | 0.0% |
| French Canadian | 1,482 | 0.7% |
| German | 37,341 | 18.7% |
| German Russian | 42 | 0.0% |
| Greek | 679 | 0.3% |
| Guamanian / Chamorro | 70 | 0.0% |
| Guatemalan | 236 | 0.1% |
| Honduran | 182 | 0.1% |
| Hopi | 19 | 0.0% |
| Hungarian | 1,026 | 0.5% |
| Icelander | 204 | 0.1% |
| Indian (Asian) | 829 | 0.4% |
| Indonesian | 44 | 0.0% |
| Inupiat | 134 | 0.1% |
| Iranian | 121 | 0.1% |
| Irish | 27,666 | 13.9% |
| Iroquois | 19 | 0.0% |
| Israeli | 5 | 0.0% |
| Italian | 8,225 | 4.1% |
| Japanese | 29 | 0.0% |
| Kiowa | 6 | 0.0% |
| Korean | 821 | 0.4% |
| Laotian | 75 | 0.0% |
| Latvian | 149 | 0.1% |
| Lebanese | 267 | 0.1% |
| Lithuanian | 177 | 0.1% |
| Lumbee | 13 | 0.0% |
| Macedonian | 19 | 0.0% |
| Malaysian | 171 | 0.1% |
| Mexican | 12,868 | 6.5% |
| Mexican American Indian | 287 | 0.1% |
| Mongolian | 31 | 0.0% |
| Native Hawaiian | 513 | 0.3% |
| Navajo | 40 | 0.0% |
| Nicaraguan | 294 | 0.2% |
| Nigerian | 22 | 0.0% |
| Northern European | 1,155 | 0.6% |
| Norwegian | 7,629 | 3.8% |
| Paiute | 7 | 0.0% |
| Pakistani | 137 | 0.1% |
| Palestinian | 15 | 0.0% |
| Pennsylvania German | 38 | 0.0% |
| Peruvian | 175 | 0.1% |
| Pima | 32 | 0.0% |
| Polish | 3,922 | 2.0% |
| Portuguese | 525 | 0.3% |
| Potawatomi | 9 | 0.0% |
| Puerto Rican | 350 | 0.2% |
| Puget Sound Salish | 53 | 0.0% |
| Romanian | 277 | 0.1% |
| Russian | 1,157 | 0.6% |
| Salvadoran | 461 | 0.2% |
| Samoan | 87 | 0.0% |
| Scandinavian | 2,199 | 1.1% |
| Scotch-Irish | 2,484 | 1.3% |
| Scottish | 5,282 | 2.6% |
| Seminole | 19 | 0.0% |
| Serbian | 198 | 0.1% |
| Shoshone | 24 | 0.0% |
| Sioux | 13 | 0.0% |
| Slavic | 36 | 0.0% |
| Slovak | 253 | 0.1% |
| Slovene | 188 | 0.1% |
| South American | 619 | 0.3% |
| Spaniard | 389 | 0.2% |
| Spanish | 349 | 0.2% |
| Spanish American Indian | 17 | 0.0% |
| Sri Lankan | 377 | 0.2% |
| Subsaharan African | 174 | 0.1% |
| Swedish | 4,718 | 2.4% |
| Swiss | 1,188 | 0.6% |
| Thai | 222 | 0.1% |
| Tlingit-Haida | 46 | 0.0% |
| Turkish | 18 | 0.0% |
| Ukrainian | 244 | 0.1% |
| Ute | 16 | 0.0% |
| Venezuelan | 32 | 0.0% |
| Welsh | 1,926 | 1.0% |
| West Indian | 143 | 0.1% |
| Yaqui | 16 | 0.0% |
| Yugoslavian | 76 | 0.0% | View All 132 Rows |
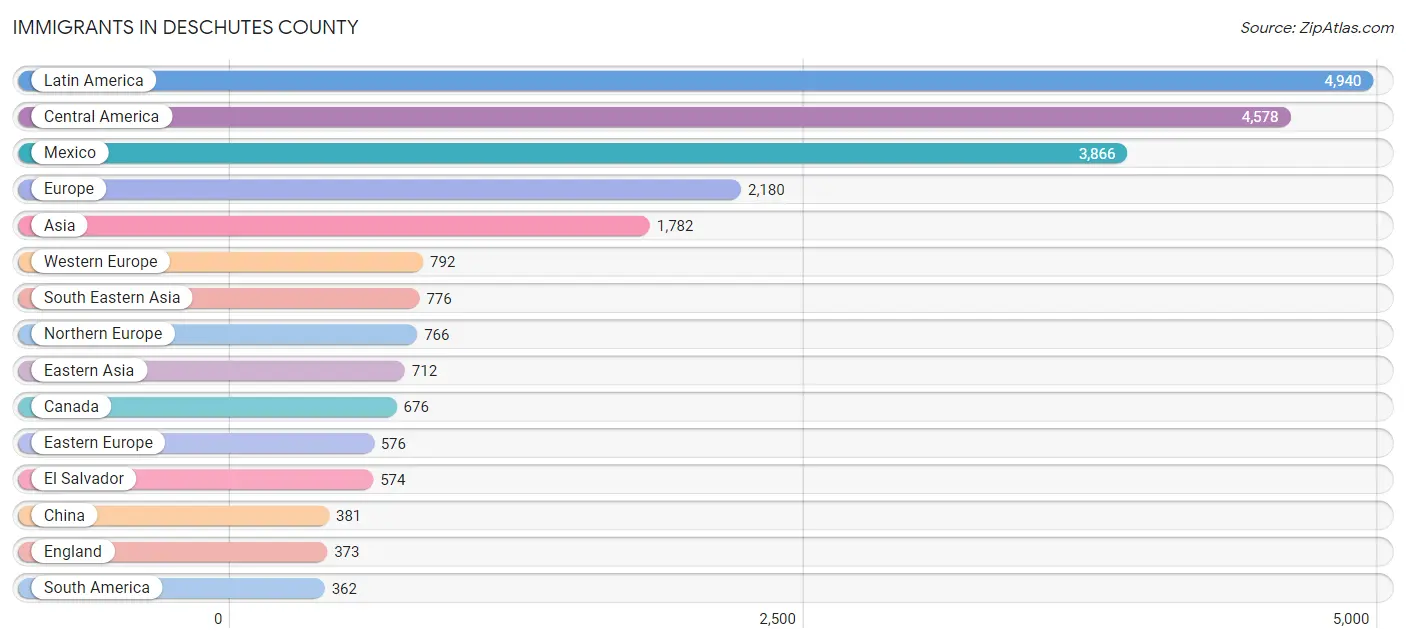
Immigrants in Deschutes County
The most numerous immigrant groups reported in Deschutes County came from Latin America (4,940 | 2.5%), Central America (4,578 | 2.3%), Mexico (3,866 | 1.9%), Europe (2,180 | 1.1%), and Asia (1,782 | 0.9%), together accounting for 8.7% of all Deschutes County residents.
| Immigration Origin | # Population | % Population |
| Africa | 126 | 0.1% |
| Argentina | 73 | 0.0% |
| Asia | 1,782 | 0.9% |
| Australia | 62 | 0.0% |
| Belarus | 85 | 0.0% |
| Bosnia and Herzegovina | 19 | 0.0% |
| Brazil | 36 | 0.0% |
| Bulgaria | 26 | 0.0% |
| Canada | 676 | 0.3% |
| Central America | 4,578 | 2.3% |
| China | 381 | 0.2% |
| Colombia | 153 | 0.1% |
| Costa Rica | 8 | 0.0% |
| Croatia | 56 | 0.0% |
| Czechoslovakia | 68 | 0.0% |
| Eastern Africa | 54 | 0.0% |
| Eastern Asia | 712 | 0.4% |
| Eastern Europe | 576 | 0.3% |
| Ecuador | 29 | 0.0% |
| El Salvador | 574 | 0.3% |
| England | 373 | 0.2% |
| Ethiopia | 54 | 0.0% |
| Europe | 2,180 | 1.1% |
| Fiji | 55 | 0.0% |
| France | 253 | 0.1% |
| Germany | 312 | 0.2% |
| Guatemala | 60 | 0.0% |
| Hong Kong | 10 | 0.0% |
| Hungary | 21 | 0.0% |
| India | 146 | 0.1% |
| Indonesia | 8 | 0.0% |
| Israel | 109 | 0.1% |
| Italy | 46 | 0.0% |
| Japan | 138 | 0.1% |
| Korea | 193 | 0.1% |
| Laos | 74 | 0.0% |
| Latin America | 4,940 | 2.5% |
| Latvia | 7 | 0.0% |
| Lebanon | 39 | 0.0% |
| Malaysia | 7 | 0.0% |
| Mexico | 3,866 | 1.9% |
| Netherlands | 88 | 0.0% |
| Nicaragua | 24 | 0.0% |
| Northern Europe | 766 | 0.4% |
| Oceania | 158 | 0.1% |
| Peru | 51 | 0.0% |
| Philippines | 319 | 0.2% |
| Poland | 36 | 0.0% |
| Romania | 97 | 0.1% |
| Russia | 102 | 0.1% |
| Scotland | 20 | 0.0% |
| Serbia | 19 | 0.0% |
| South Africa | 40 | 0.0% |
| South America | 362 | 0.2% |
| South Central Asia | 146 | 0.1% |
| South Eastern Asia | 776 | 0.4% |
| Southern Europe | 46 | 0.0% |
| Sweden | 39 | 0.0% |
| Switzerland | 139 | 0.1% |
| Taiwan | 113 | 0.1% |
| Thailand | 107 | 0.1% |
| Ukraine | 23 | 0.0% |
| Venezuela | 20 | 0.0% |
| Vietnam | 217 | 0.1% |
| Western Africa | 32 | 0.0% |
| Western Asia | 148 | 0.1% |
| Western Europe | 792 | 0.4% | View All 67 Rows |
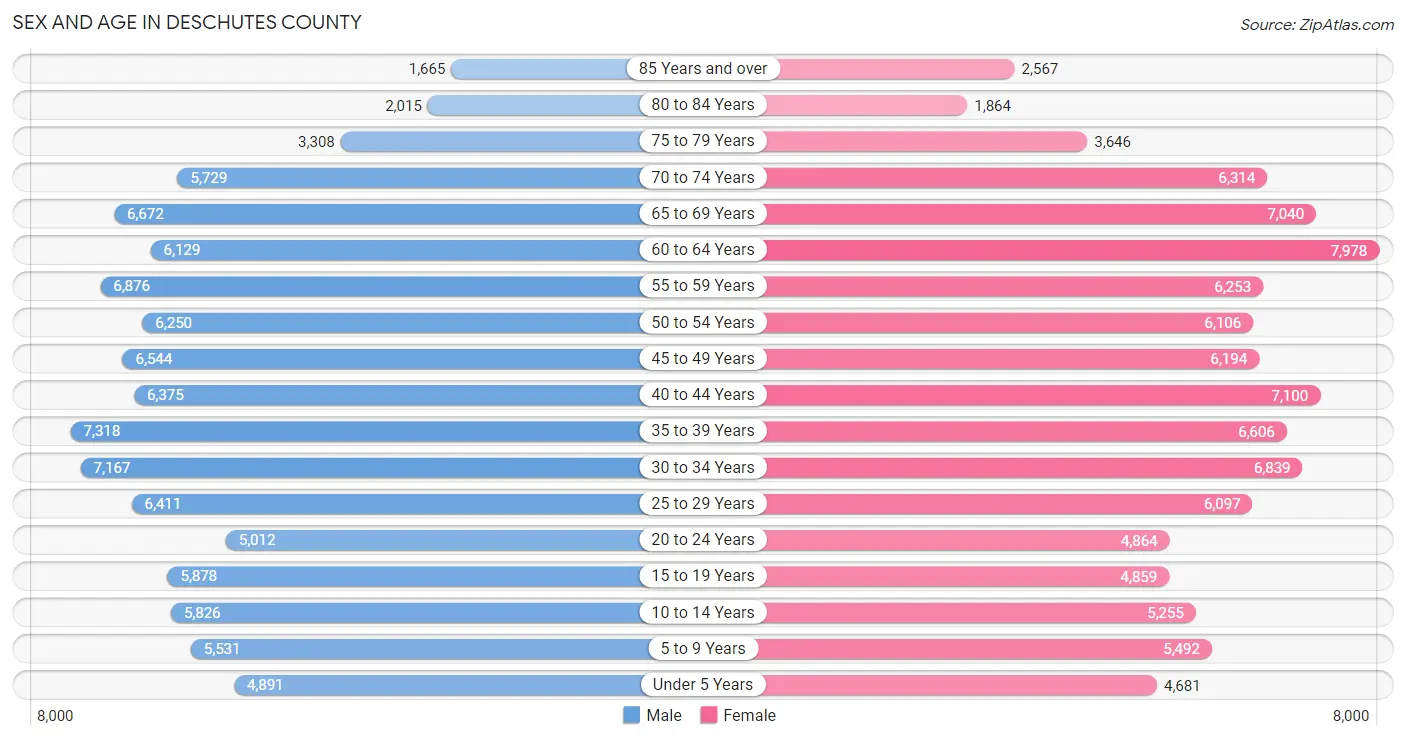
Sex and Age in Deschutes County
Sex and Age in Deschutes County
The most populous age groups in Deschutes County are 35 to 39 Years (7,318 | 7.3%) for men and 60 to 64 Years (7,978 | 8.0%) for women.
| Age Bracket | Male | Female |
| Under 5 Years | 4,891 (4.9%) | 4,681 (4.7%) |
| 5 to 9 Years | 5,531 (5.6%) | 5,492 (5.5%) |
| 10 to 14 Years | 5,826 (5.9%) | 5,255 (5.3%) |
| 15 to 19 Years | 5,878 (5.9%) | 4,859 (4.9%) |
| 20 to 24 Years | 5,012 (5.0%) | 4,864 (4.9%) |
| 25 to 29 Years | 6,411 (6.4%) | 6,097 (6.1%) |
| 30 to 34 Years | 7,167 (7.2%) | 6,839 (6.9%) |
| 35 to 39 Years | 7,318 (7.3%) | 6,606 (6.6%) |
| 40 to 44 Years | 6,375 (6.4%) | 7,100 (7.1%) |
| 45 to 49 Years | 6,544 (6.6%) | 6,194 (6.2%) |
| 50 to 54 Years | 6,250 (6.3%) | 6,106 (6.1%) |
| 55 to 59 Years | 6,876 (6.9%) | 6,253 (6.3%) |
| 60 to 64 Years | 6,129 (6.1%) | 7,978 (8.0%) |
| 65 to 69 Years | 6,672 (6.7%) | 7,040 (7.1%) |
| 70 to 74 Years | 5,729 (5.8%) | 6,314 (6.3%) |
| 75 to 79 Years | 3,308 (3.3%) | 3,646 (3.6%) |
| 80 to 84 Years | 2,015 (2.0%) | 1,864 (1.9%) |
| 85 Years and over | 1,665 (1.7%) | 2,567 (2.6%) |
| Total | 99,597 (100.0%) | 99,755 (100.0%) |
Families and Households in Deschutes County
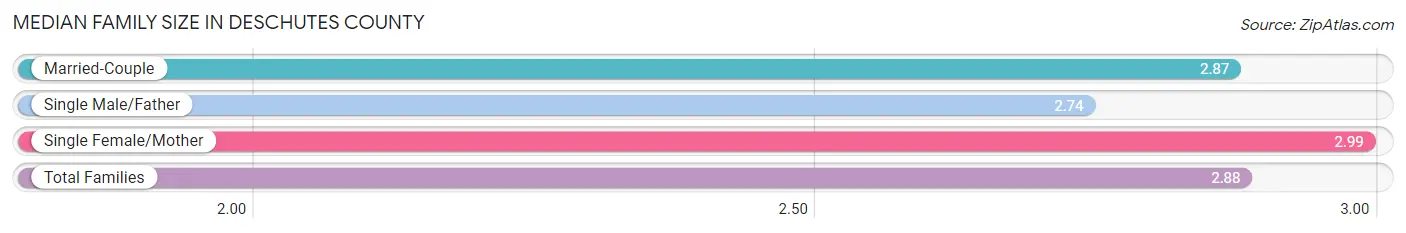
Median Family Size in Deschutes County
The median family size in Deschutes County is 2.88 persons per family, with single female/mother families (6,339 | 12.0%) accounting for the largest median family size of 2.99 persons per family. On the other hand, single male/father families (3,814 | 7.2%) represent the smallest median family size with 2.74 persons per family.
| Family Type | # Families | Family Size |
| Married-Couple | 42,854 (80.8%) | 2.87 |
| Single Male/Father | 3,814 (7.2%) | 2.74 |
| Single Female/Mother | 6,339 (12.0%) | 2.99 |
| Total Families | 53,007 (100.0%) | 2.88 |
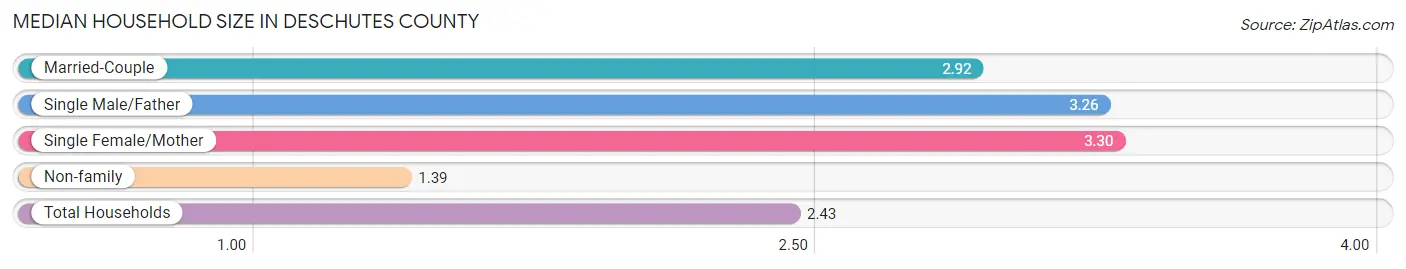
Median Household Size in Deschutes County
The median household size in Deschutes County is 2.43 persons per household, with single female/mother households (6,339 | 7.8%) accounting for the largest median household size of 3.3 persons per household. non-family households (28,474 | 34.9%) represent the smallest median household size with 1.39 persons per household.
| Household Type | # Households | Household Size |
| Married-Couple | 42,854 (52.6%) | 2.92 |
| Single Male/Father | 3,814 (4.7%) | 3.26 |
| Single Female/Mother | 6,339 (7.8%) | 3.30 |
| Non-family | 28,474 (34.9%) | 1.39 |
| Total Households | 81,481 (100.0%) | 2.43 |
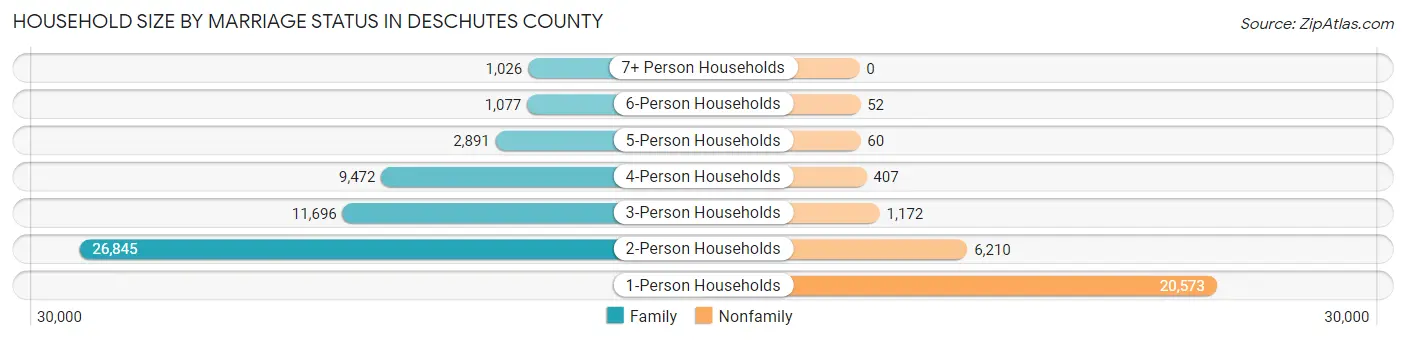
Household Size by Marriage Status in Deschutes County
Out of a total of 81,481 households in Deschutes County, 53,007 (65.0%) are family households, while 28,474 (34.9%) are nonfamily households. The most numerous type of family households are 2-person households, comprising 26,845, and the most common type of nonfamily households are 1-person households, comprising 20,573.
| Household Size | Family Households | Nonfamily Households |
| 1-Person Households | - | 20,573 (25.3%) |
| 2-Person Households | 26,845 (33.0%) | 6,210 (7.6%) |
| 3-Person Households | 11,696 (14.3%) | 1,172 (1.4%) |
| 4-Person Households | 9,472 (11.6%) | 407 (0.5%) |
| 5-Person Households | 2,891 (3.5%) | 60 (0.1%) |
| 6-Person Households | 1,077 (1.3%) | 52 (0.1%) |
| 7+ Person Households | 1,026 (1.3%) | 0 (0.0%) |
| Total | 53,007 (65.0%) | 28,474 (34.9%) |
Female Fertility in Deschutes County
Fertility by Age in Deschutes County
Average fertility rate in Deschutes County is 57.0 births per 1,000 women. Women in the age bracket of 20 to 34 years have the highest fertility rate with 86.0 births per 1,000 women. Women in the age bracket of 20 to 34 years acount for 62.0% of all women with births.
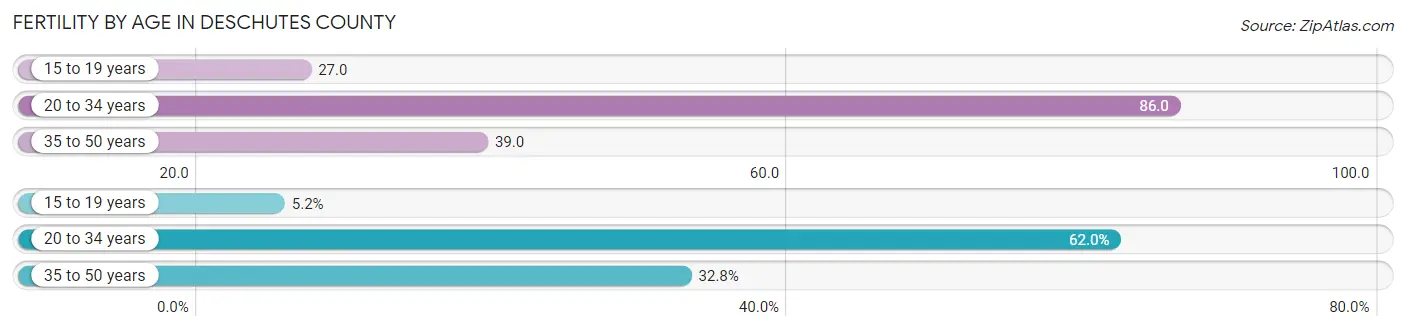
| Age Bracket | Women with Births | Births / 1,000 Women |
| 15 to 19 years | 129 (5.2%) | 27.0 |
| 20 to 34 years | 1,535 (62.0%) | 86.0 |
| 35 to 50 years | 813 (32.8%) | 39.0 |
| Total | 2,477 (100.0%) | 57.0 |
Fertility by Age by Marriage Status in Deschutes County
80.7% of women with births (2,477) in Deschutes County are married. The highest percentage of unmarried women with births falls into 20 to 34 years age bracket with 22.2% of them unmarried at the time of birth, while the lowest percentage of unmarried women with births belong to 15 to 19 years age bracket with 1.5% of them unmarried.
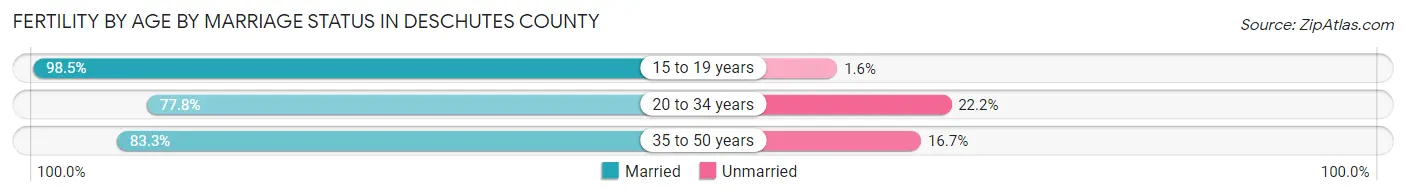
| Age Bracket | Married | Unmarried |
| 15 to 19 years | 127 (98.5%) | 2 (1.5%) |
| 20 to 34 years | 1,194 (77.8%) | 341 (22.2%) |
| 35 to 50 years | 677 (83.3%) | 136 (16.7%) |
| Total | 1,999 (80.7%) | 478 (19.3%) |
Fertility by Education in Deschutes County
Average fertility rate in Deschutes County is 57.0 births per 1,000 women. Women with the education attainment of bachelor's degree have the highest fertility rate of 91.0 births per 1,000 women, while women with the education attainment of less than high school have the lowest fertility at 17.0 births per 1,000 women. Women with the education attainment of bachelor's degree represent 40.7% of all women with births.
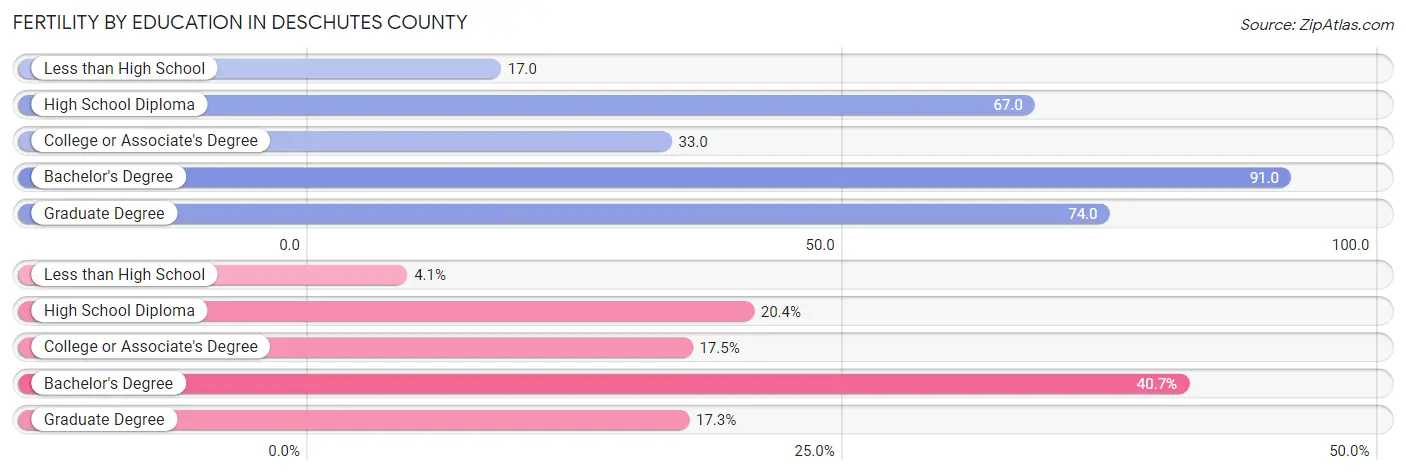
| Educational Attainment | Women with Births | Births / 1,000 Women |
| Less than High School | 102 (4.1%) | 17.0 |
| High School Diploma | 504 (20.3%) | 67.0 |
| College or Associate's Degree | 433 (17.5%) | 33.0 |
| Bachelor's Degree | 1,009 (40.7%) | 91.0 |
| Graduate Degree | 429 (17.3%) | 74.0 |
| Total | 2,477 (100.0%) | 57.0 |
Fertility by Education by Marriage Status in Deschutes County
19.3% of women with births in Deschutes County are unmarried. Women with the educational attainment of graduate degree are most likely to be married with 93.2% of them married at childbirth, while women with the educational attainment of high school diploma are least likely to be married with 40.9% of them unmarried at childbirth.
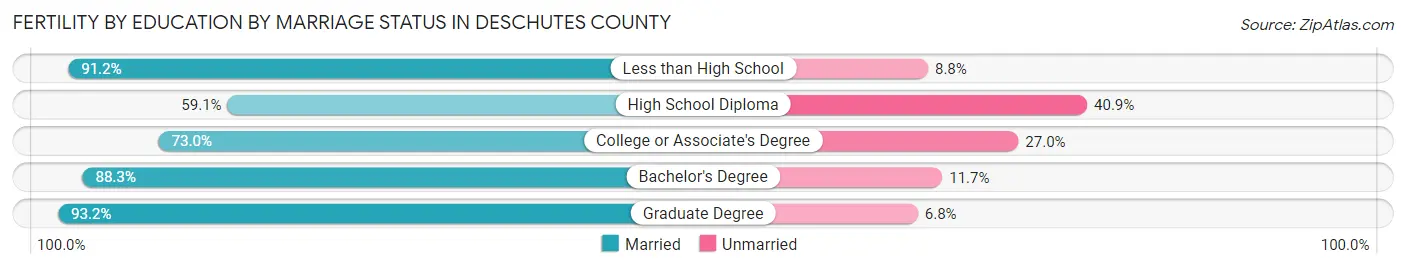
| Educational Attainment | Married | Unmarried |
| Less than High School | 93 (91.2%) | 9 (8.8%) |
| High School Diploma | 298 (59.1%) | 206 (40.9%) |
| College or Associate's Degree | 316 (73.0%) | 117 (27.0%) |
| Bachelor's Degree | 891 (88.3%) | 118 (11.7%) |
| Graduate Degree | 400 (93.2%) | 29 (6.8%) |
| Total | 1,999 (80.7%) | 478 (19.3%) |
Income in Deschutes County
Income Overview in Deschutes County
Per Capita Income in Deschutes County is $46,765, while median incomes of families and households are $99,728 and $82,042 respectively.
| Characteristic | Number | Measure |
| Per Capita Income | 199,352 | $46,765 |
| Median Family Income | 53,007 | $99,728 |
| Mean Family Income | 53,007 | $131,803 |
| Median Household Income | 81,481 | $82,042 |
| Mean Household Income | 81,481 | $112,537 |
| Income Deficit | 53,007 | $11,592 |
| Wage / Income Gap (%) | 199,352 | 30.09% |
| Wage / Income Gap ($) | 199,352 | 69.91¢ per $1 |
| Gini / Inequality Index | 199,352 | 0.46 |
Earnings by Sex in Deschutes County
Average Earnings in Deschutes County are $41,848, $50,894 for men and $35,578 for women, a difference of 30.1%.
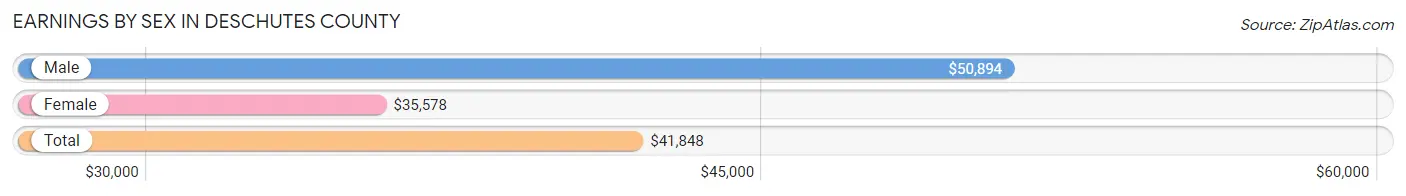
| Sex | Number | Average Earnings |
| Male | 57,990 (53.0%) | $50,894 |
| Female | 51,362 (47.0%) | $35,578 |
| Total | 109,352 (100.0%) | $41,848 |
Earnings by Sex by Income Bracket in Deschutes County
The most common earnings brackets in Deschutes County are $100,000+ for men (11,457 | 19.8%) and $100,000+ for women (5,237 | 10.2%).
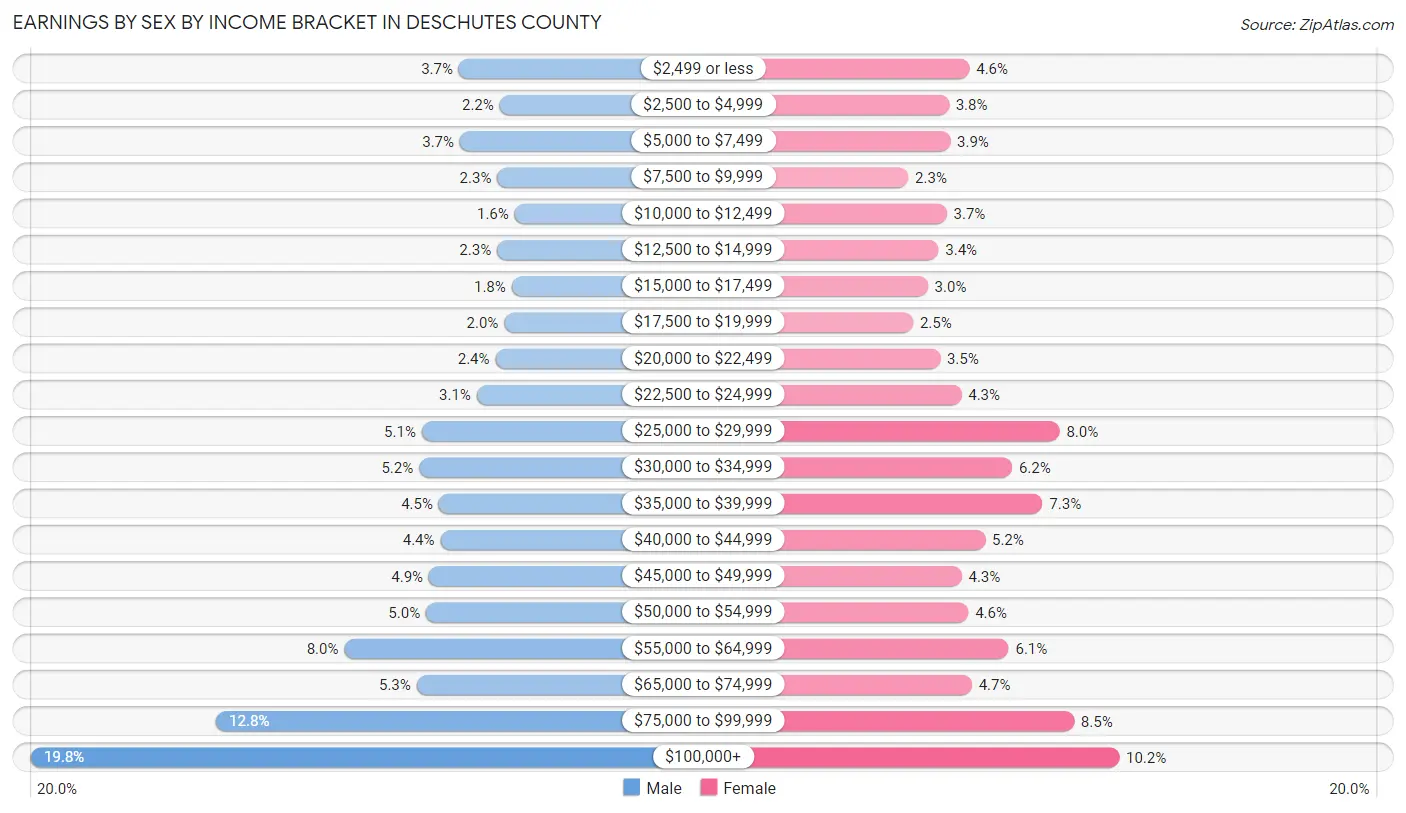
| Income | Male | Female |
| $2,499 or less | 2,163 (3.7%) | 2,355 (4.6%) |
| $2,500 to $4,999 | 1,278 (2.2%) | 1,961 (3.8%) |
| $5,000 to $7,499 | 2,138 (3.7%) | 1,986 (3.9%) |
| $7,500 to $9,999 | 1,328 (2.3%) | 1,180 (2.3%) |
| $10,000 to $12,499 | 951 (1.6%) | 1,921 (3.7%) |
| $12,500 to $14,999 | 1,334 (2.3%) | 1,762 (3.4%) |
| $15,000 to $17,499 | 1,015 (1.8%) | 1,554 (3.0%) |
| $17,500 to $19,999 | 1,180 (2.0%) | 1,276 (2.5%) |
| $20,000 to $22,499 | 1,366 (2.4%) | 1,793 (3.5%) |
| $22,500 to $24,999 | 1,773 (3.1%) | 2,205 (4.3%) |
| $25,000 to $29,999 | 2,969 (5.1%) | 4,095 (8.0%) |
| $30,000 to $34,999 | 3,027 (5.2%) | 3,177 (6.2%) |
| $35,000 to $39,999 | 2,600 (4.5%) | 3,764 (7.3%) |
| $40,000 to $44,999 | 2,563 (4.4%) | 2,663 (5.2%) |
| $45,000 to $49,999 | 2,811 (4.9%) | 2,210 (4.3%) |
| $50,000 to $54,999 | 2,876 (5.0%) | 2,336 (4.5%) |
| $55,000 to $64,999 | 4,649 (8.0%) | 3,111 (6.1%) |
| $65,000 to $74,999 | 3,080 (5.3%) | 2,406 (4.7%) |
| $75,000 to $99,999 | 7,432 (12.8%) | 4,370 (8.5%) |
| $100,000+ | 11,457 (19.8%) | 5,237 (10.2%) |
| Total | 57,990 (100.0%) | 51,362 (100.0%) |
Earnings by Sex by Educational Attainment in Deschutes County
Average earnings in Deschutes County are $56,146 for men and $39,385 for women, a difference of 29.8%. Men with an educational attainment of graduate degree enjoy the highest average annual earnings of $91,506, while those with less than high school education earn the least with $34,766. Women with an educational attainment of graduate degree earn the most with the average annual earnings of $67,924, while those with less than high school education have the smallest earnings of $27,142.
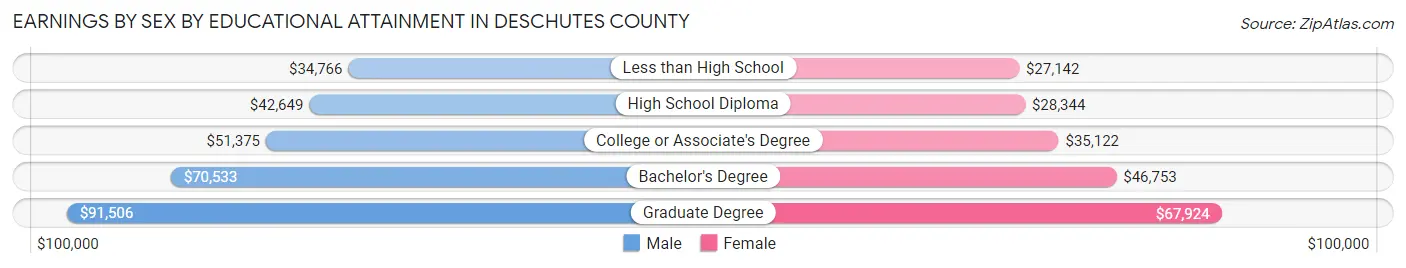
| Educational Attainment | Male Income | Female Income |
| Less than High School | $34,766 | $27,142 |
| High School Diploma | $42,649 | $28,344 |
| College or Associate's Degree | $51,375 | $35,122 |
| Bachelor's Degree | $70,533 | $46,753 |
| Graduate Degree | $91,506 | $67,924 |
| Total | $56,146 | $39,385 |
Family Income in Deschutes County
Family Income Brackets in Deschutes County
According to the Deschutes County family income data, there are 11,290 families falling into the $100,000 to $149,999 income range, which is the most common income bracket and makes up 21.3% of all families. Conversely, the $10,000 to $14,999 income bracket is the least frequent group with only 477 families (0.9%) belonging to this category.
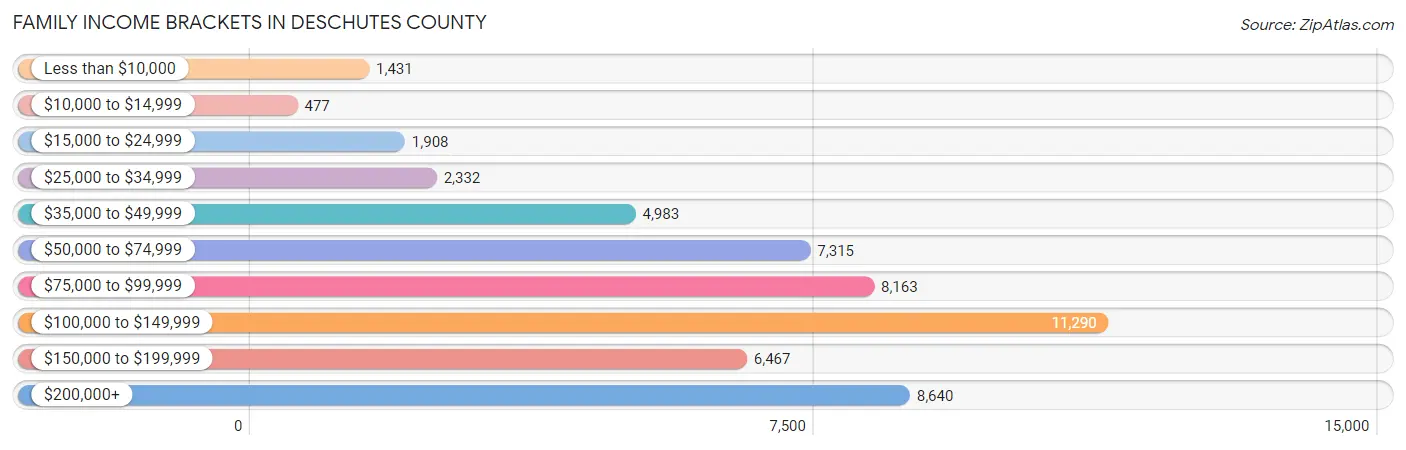
| Income Bracket | # Families | % Families |
| Less than $10,000 | 1,431 | 2.7% |
| $10,000 to $14,999 | 477 | 0.9% |
| $15,000 to $24,999 | 1,908 | 3.6% |
| $25,000 to $34,999 | 2,332 | 4.4% |
| $35,000 to $49,999 | 4,983 | 9.4% |
| $50,000 to $74,999 | 7,315 | 13.8% |
| $75,000 to $99,999 | 8,163 | 15.4% |
| $100,000 to $149,999 | 11,290 | 21.3% |
| $150,000 to $199,999 | 6,467 | 12.2% |
| $200,000+ | 8,640 | 16.3% |
Family Income by Famaliy Size in Deschutes County
5-person families (2,489 | 4.7%) account for the highest median family income in Deschutes County with $135,616 per family, while 2-person families (29,015 | 54.7%) have the highest median income of $45,538 per family member.
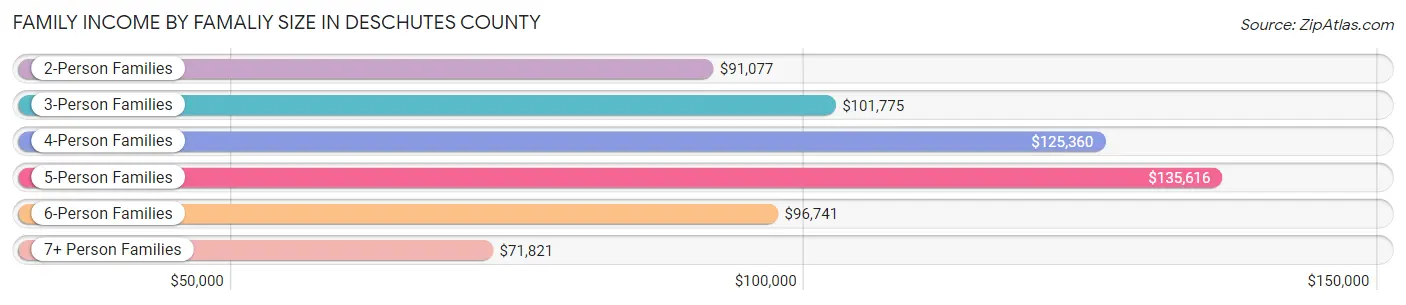
| Income Bracket | # Families | Median Income |
| 2-Person Families | 29,015 (54.7%) | $91,077 |
| 3-Person Families | 11,056 (20.9%) | $101,775 |
| 4-Person Families | 8,753 (16.5%) | $125,360 |
| 5-Person Families | 2,489 (4.7%) | $135,616 |
| 6-Person Families | 1,173 (2.2%) | $96,741 |
| 7+ Person Families | 521 (1.0%) | $71,821 |
| Total | 53,007 (100.0%) | $99,728 |
Family Income by Number of Earners in Deschutes County
The median family income in Deschutes County is $99,728, with families comprising 3+ earners (5,254) having the highest median family income of $139,292, while families with no earners (10,911) have the lowest median family income of $68,502, accounting for 9.9% and 20.6% of families, respectively.
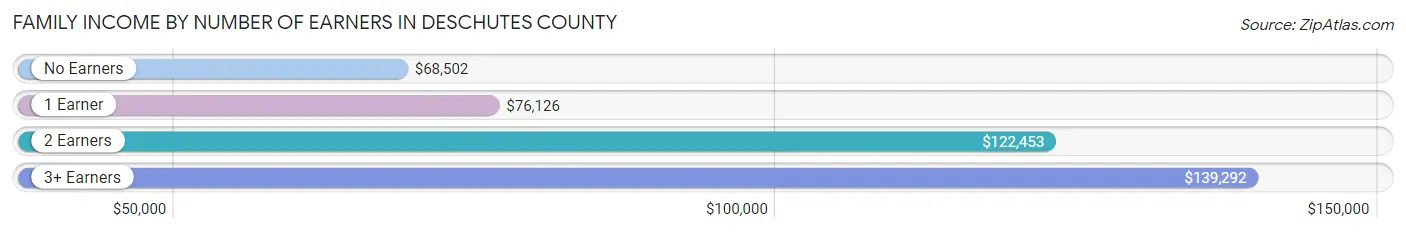
| Number of Earners | # Families | Median Income |
| No Earners | 10,911 (20.6%) | $68,502 |
| 1 Earner | 14,772 (27.9%) | $76,126 |
| 2 Earners | 22,070 (41.6%) | $122,453 |
| 3+ Earners | 5,254 (9.9%) | $139,292 |
| Total | 53,007 (100.0%) | $99,728 |
Household Income in Deschutes County
Household Income Brackets in Deschutes County
With 14,259 households falling in the category, the $100,000 to $149,999 income range is the most frequent in Deschutes County, accounting for 17.5% of all households. In contrast, only 1,630 households (2.0%) fall into the $10,000 to $14,999 income bracket, making it the least populous group.
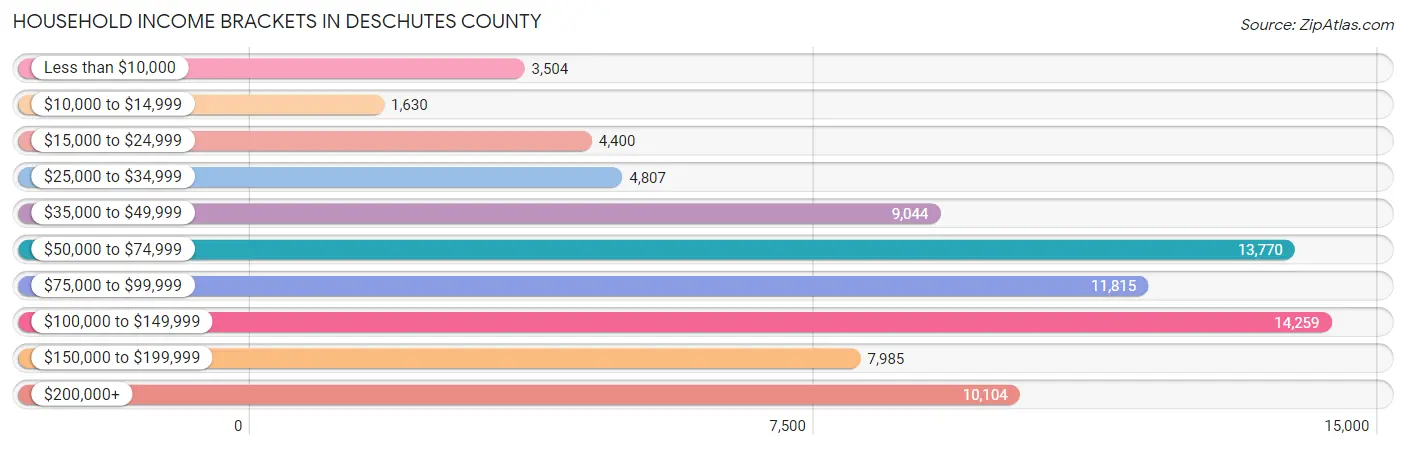
| Income Bracket | # Households | % Households |
| Less than $10,000 | 3,504 | 4.3% |
| $10,000 to $14,999 | 1,630 | 2.0% |
| $15,000 to $24,999 | 4,400 | 5.4% |
| $25,000 to $34,999 | 4,807 | 5.9% |
| $35,000 to $49,999 | 9,044 | 11.1% |
| $50,000 to $74,999 | 13,770 | 16.9% |
| $75,000 to $99,999 | 11,815 | 14.5% |
| $100,000 to $149,999 | 14,259 | 17.5% |
| $150,000 to $199,999 | 7,985 | 9.8% |
| $200,000+ | 10,104 | 12.4% |
Household Income by Householder Age in Deschutes County
The median household income in Deschutes County is $82,042, with the highest median household income of $95,715 found in the 45 to 64 years age bracket for the primary householder. A total of 28,623 households (35.1%) fall into this category. Meanwhile, the 15 to 24 years age bracket for the primary householder has the lowest median household income of $57,990, with 2,806 households (3.4%) in this group.
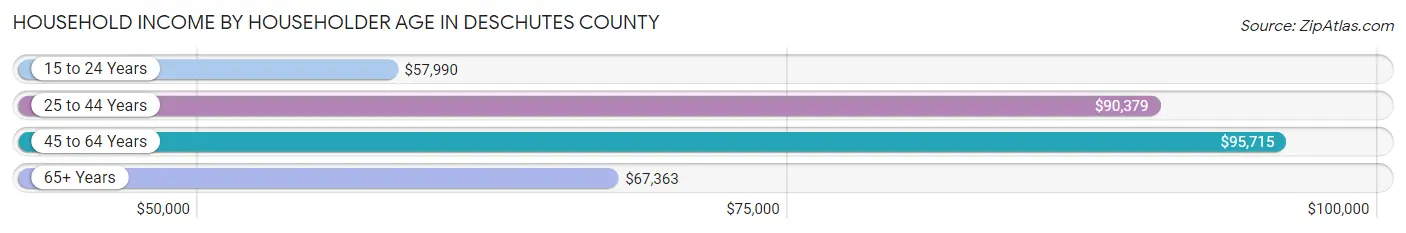
| Income Bracket | # Households | Median Income |
| 15 to 24 Years | 2,806 (3.4%) | $57,990 |
| 25 to 44 Years | 25,072 (30.8%) | $90,379 |
| 45 to 64 Years | 28,623 (35.1%) | $95,715 |
| 65+ Years | 24,980 (30.7%) | $67,363 |
| Total | 81,481 (100.0%) | $82,042 |
Poverty in Deschutes County
Income Below Poverty by Sex and Age in Deschutes County
With 8.3% poverty level for males and 10.0% for females among the residents of Deschutes County, 5 year old males and 18 to 24 year old females are the most vulnerable to poverty, with 192 males (17.4%) and 1,198 females (18.6%) in their respective age groups living below the poverty level.
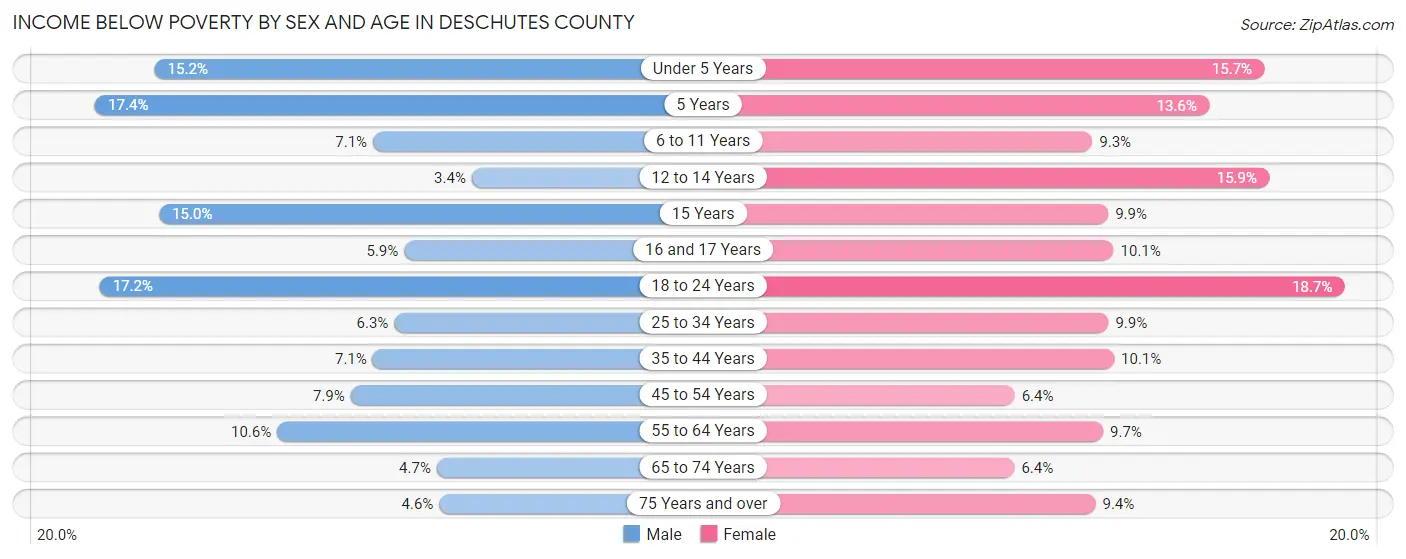
| Age Bracket | Male | Female |
| Under 5 Years | 714 (15.2%) | 700 (15.7%) |
| 5 Years | 192 (17.4%) | 188 (13.6%) |
| 6 to 11 Years | 472 (7.1%) | 553 (9.3%) |
| 12 to 14 Years | 111 (3.4%) | 495 (15.9%) |
| 15 Years | 217 (15.0%) | 128 (9.9%) |
| 16 and 17 Years | 136 (5.9%) | 200 (10.1%) |
| 18 to 24 Years | 1,217 (17.2%) | 1,198 (18.6%) |
| 25 to 34 Years | 847 (6.3%) | 1,278 (9.9%) |
| 35 to 44 Years | 965 (7.1%) | 1,384 (10.1%) |
| 45 to 54 Years | 1,009 (7.9%) | 789 (6.4%) |
| 55 to 64 Years | 1,379 (10.6%) | 1,380 (9.7%) |
| 65 to 74 Years | 582 (4.7%) | 853 (6.4%) |
| 75 Years and over | 319 (4.6%) | 746 (9.4%) |
| Total | 8,160 (8.3%) | 9,892 (10.0%) |
Income Above Poverty by Sex and Age in Deschutes County
According to the poverty statistics in Deschutes County, males aged 12 to 14 years and females aged 65 to 74 years are the age groups that are most secure financially, with 96.6% of males and 93.6% of females in these age groups living above the poverty line.
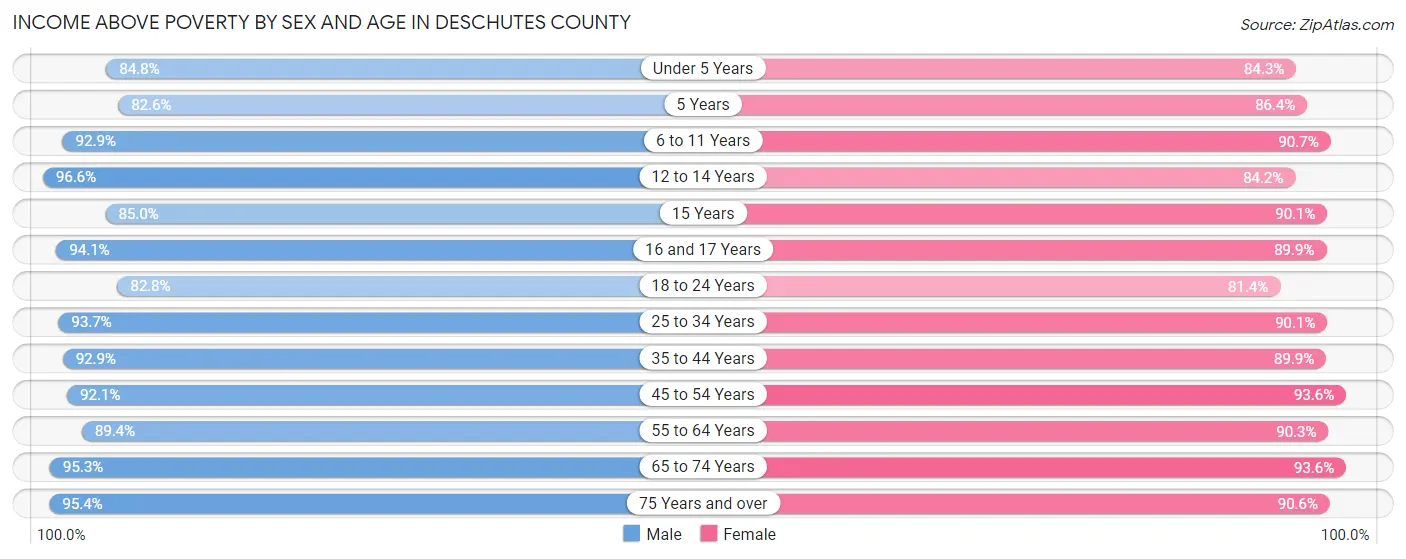
| Age Bracket | Male | Female |
| Under 5 Years | 3,992 (84.8%) | 3,768 (84.3%) |
| 5 Years | 913 (82.6%) | 1,192 (86.4%) |
| 6 to 11 Years | 6,202 (92.9%) | 5,395 (90.7%) |
| 12 to 14 Years | 3,154 (96.6%) | 2,629 (84.2%) |
| 15 Years | 1,229 (85.0%) | 1,166 (90.1%) |
| 16 and 17 Years | 2,167 (94.1%) | 1,783 (89.9%) |
| 18 to 24 Years | 5,854 (82.8%) | 5,226 (81.4%) |
| 25 to 34 Years | 12,646 (93.7%) | 11,634 (90.1%) |
| 35 to 44 Years | 12,668 (92.9%) | 12,308 (89.9%) |
| 45 to 54 Years | 11,768 (92.1%) | 11,497 (93.6%) |
| 55 to 64 Years | 11,590 (89.4%) | 12,842 (90.3%) |
| 65 to 74 Years | 11,805 (95.3%) | 12,457 (93.6%) |
| 75 Years and over | 6,608 (95.4%) | 7,171 (90.6%) |
| Total | 90,596 (91.7%) | 89,068 (90.0%) |
Income Below Poverty Among Married-Couple Families in Deschutes County
The poverty statistics for married-couple families in Deschutes County show that 3.0% or 1,282 of the total 42,854 families live below the poverty line. Families with 5 or more children have the highest poverty rate of 40.0%, comprising of 62 families. On the other hand, families with 3 or 4 children have the lowest poverty rate of 2.0%, which includes 42 families.
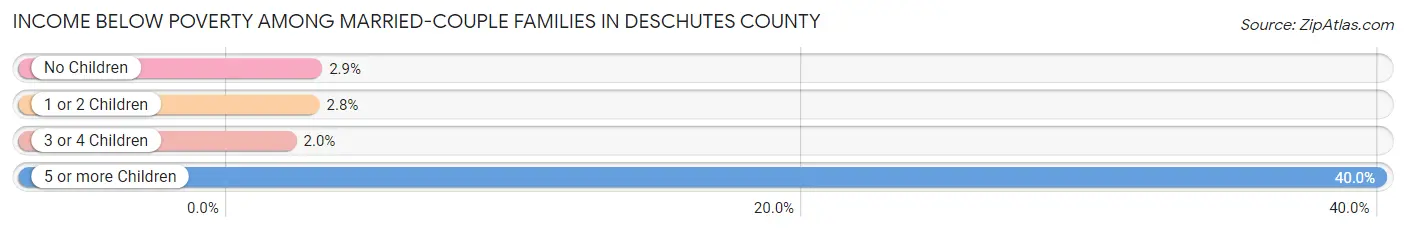
| Children | Above Poverty | Below Poverty |
| No Children | 26,446 (97.1%) | 797 (2.9%) |
| 1 or 2 Children | 13,015 (97.2%) | 381 (2.8%) |
| 3 or 4 Children | 2,018 (98.0%) | 42 (2.0%) |
| 5 or more Children | 93 (60.0%) | 62 (40.0%) |
| Total | 41,572 (97.0%) | 1,282 (3.0%) |
Income Below Poverty Among Single-Parent Households in Deschutes County
According to the poverty data in Deschutes County, 12.6% or 479 single-father households and 20.6% or 1,307 single-mother households are living below the poverty line. Among single-father households, those with 3 or 4 children have the highest poverty rate, with 62 households (20.4%) experiencing poverty. Likewise, among single-mother households, those with 3 or 4 children have the highest poverty rate, with 280 households (61.7%) falling below the poverty line.
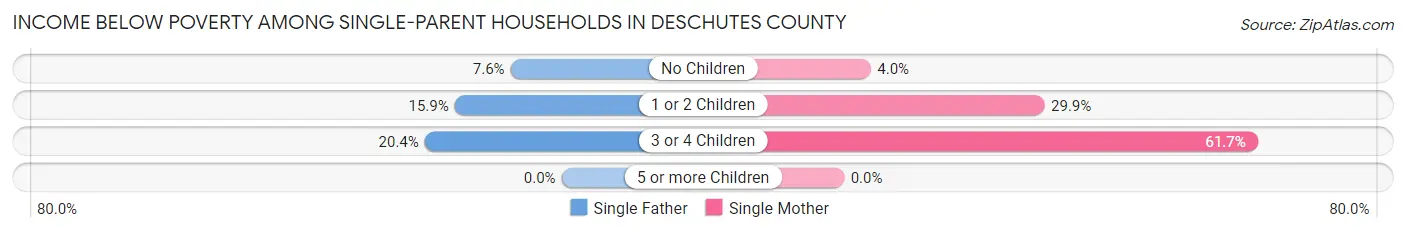
| Children | Single Father | Single Mother |
| No Children | 105 (7.6%) | 112 (4.0%) |
| 1 or 2 Children | 312 (15.9%) | 915 (29.9%) |
| 3 or 4 Children | 62 (20.4%) | 280 (61.7%) |
| 5 or more Children | 0 (0.0%) | 0 (0.0%) |
| Total | 479 (12.6%) | 1,307 (20.6%) |
Income Below Poverty Among Married-Couple vs Single-Parent Households in Deschutes County
The poverty data for Deschutes County shows that 1,282 of the married-couple family households (3.0%) and 1,786 of the single-parent households (17.6%) are living below the poverty level. Within the married-couple family households, those with 5 or more children have the highest poverty rate, with 62 households (40.0%) falling below the poverty line. Among the single-parent households, those with 3 or 4 children have the highest poverty rate, with 342 household (45.1%) living below poverty.
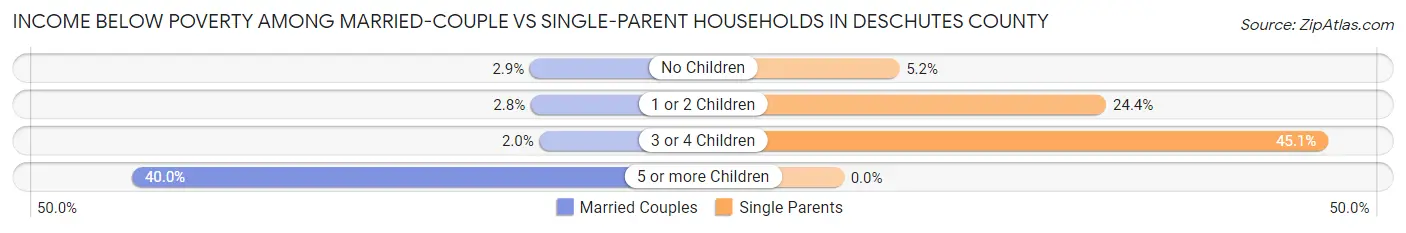
| Children | Married-Couple Families | Single-Parent Households |
| No Children | 797 (2.9%) | 217 (5.2%) |
| 1 or 2 Children | 381 (2.8%) | 1,227 (24.4%) |
| 3 or 4 Children | 42 (2.0%) | 342 (45.1%) |
| 5 or more Children | 62 (40.0%) | 0 (0.0%) |
| Total | 1,282 (3.0%) | 1,786 (17.6%) |
Employment Characteristics in Deschutes County
Employment by Class of Employer in Deschutes County
Among the 96,606 employed individuals in Deschutes County, private company employees (60,394 | 62.5%), self-employed (not incorporated) (8,876 | 9.2%), and not-for-profit organizations (8,101 | 8.4%) make up the most common classes of employment.
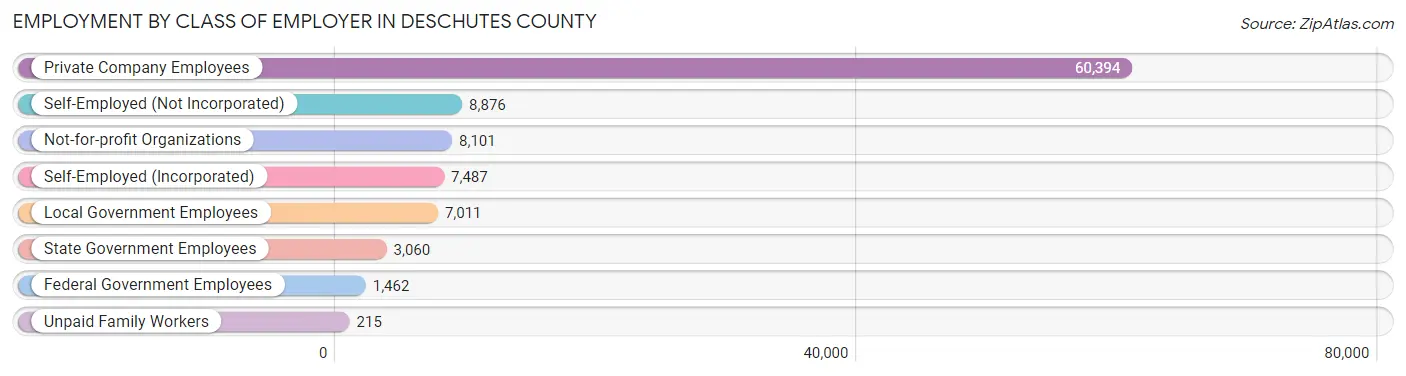
| Employer Class | # Employees | % Employees |
| Private Company Employees | 60,394 | 62.5% |
| Self-Employed (Incorporated) | 7,487 | 7.7% |
| Self-Employed (Not Incorporated) | 8,876 | 9.2% |
| Not-for-profit Organizations | 8,101 | 8.4% |
| Local Government Employees | 7,011 | 7.3% |
| State Government Employees | 3,060 | 3.2% |
| Federal Government Employees | 1,462 | 1.5% |
| Unpaid Family Workers | 215 | 0.2% |
| Total | 96,606 | 100.0% |
Employment Status by Age in Deschutes County
According to the labor force statistics for Deschutes County, out of the total population over 16 years of age (164,935), 63.2% or 104,239 individuals are in the labor force, with 5.2% or 5,420 of them unemployed. The age group with the highest labor force participation rate is 25 to 29 years, with 89.2% or 11,157 individuals in the labor force. Within the labor force, the 16 to 19 years age range has the highest percentage of unemployed individuals, with 12.1% or 468 of them being unemployed.
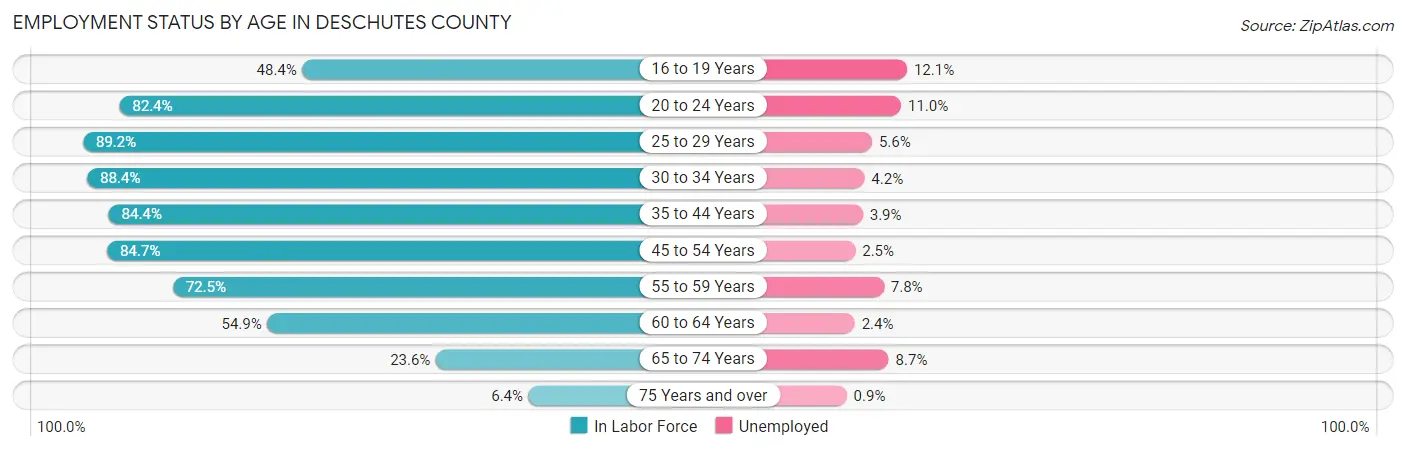
| Age Bracket | In Labor Force | Unemployed |
| 16 to 19 Years | 3,870 (48.4%) | 468 (12.1%) |
| 20 to 24 Years | 8,138 (82.4%) | 895 (11.0%) |
| 25 to 29 Years | 11,157 (89.2%) | 625 (5.6%) |
| 30 to 34 Years | 12,381 (88.4%) | 520 (4.2%) |
| 35 to 44 Years | 23,125 (84.4%) | 902 (3.9%) |
| 45 to 54 Years | 21,255 (84.7%) | 531 (2.5%) |
| 55 to 59 Years | 9,519 (72.5%) | 742 (7.8%) |
| 60 to 64 Years | 7,745 (54.9%) | 186 (2.4%) |
| 65 to 74 Years | 6,078 (23.6%) | 529 (8.7%) |
| 75 Years and over | 964 (6.4%) | 9 (0.9%) |
| Total | 104,239 (63.2%) | 5,420 (5.2%) |
Employment Status by Educational Attainment in Deschutes County
According to labor force statistics for Deschutes County, 80.2% of individuals (85,207) out of the total population between 25 and 64 years of age (106,243) are in the labor force, with 4.1% or 3,493 of them being unemployed. The group with the highest labor force participation rate are those with the educational attainment of bachelor's degree or higher, with 86.1% or 37,336 individuals in the labor force. Within the labor force, individuals with high school diploma education have the highest percentage of unemployment, with 5.7% or 849 of them being unemployed.
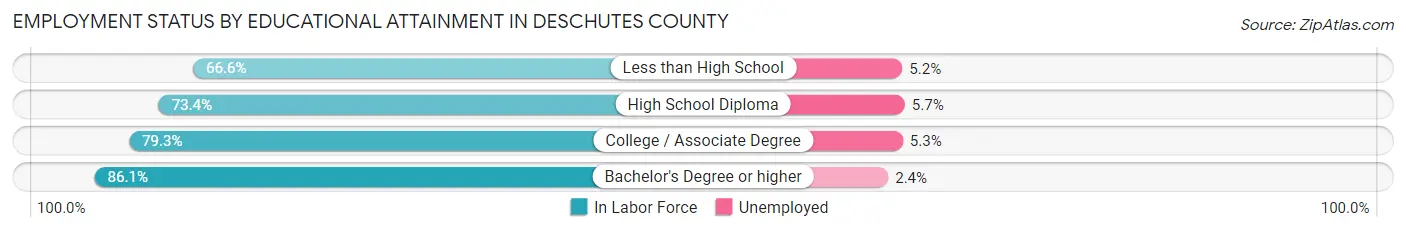
| Educational Attainment | In Labor Force | Unemployed |
| Less than High School | 4,462 (66.6%) | 348 (5.2%) |
| High School Diploma | 14,890 (73.4%) | 1,156 (5.7%) |
| College / Associate Degree | 28,464 (79.3%) | 1,902 (5.3%) |
| Bachelor's Degree or higher | 37,336 (86.1%) | 1,041 (2.4%) |
| Total | 85,207 (80.2%) | 4,356 (4.1%) |
Employment Occupations by Sex in Deschutes County
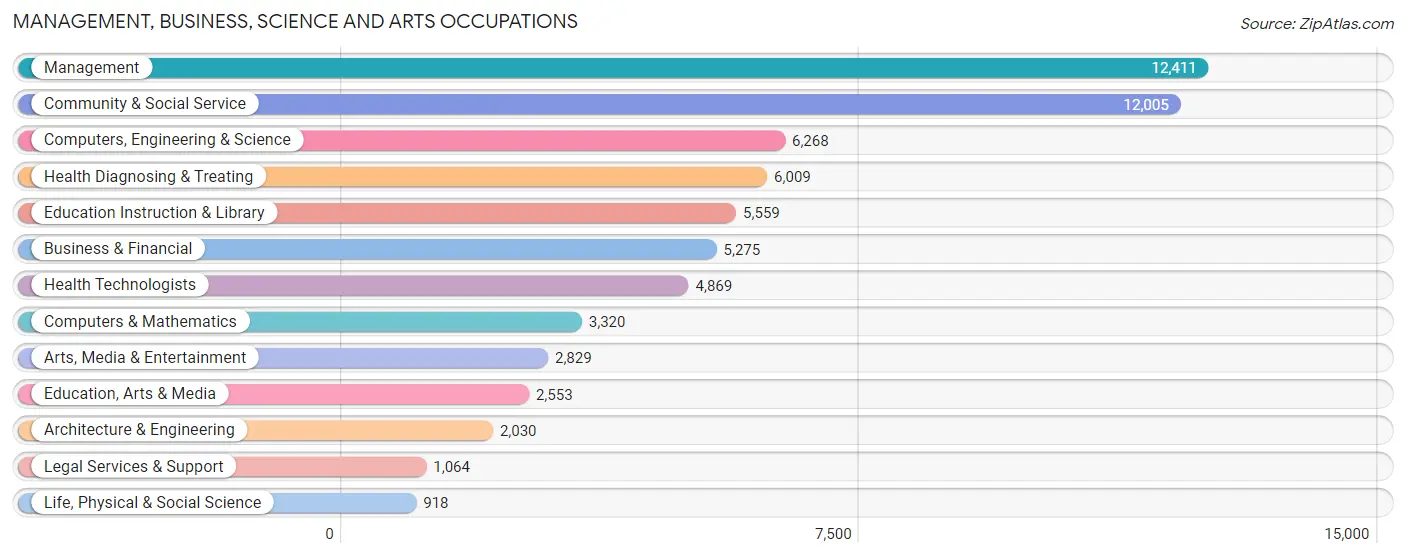
Management, Business, Science and Arts Occupations
The most common Management, Business, Science and Arts occupations in Deschutes County are Management (12,411 | 12.6%), Community & Social Service (12,005 | 12.2%), Computers, Engineering & Science (6,268 | 6.4%), Health Diagnosing & Treating (6,009 | 6.1%), and Education Instruction & Library (5,559 | 5.6%).
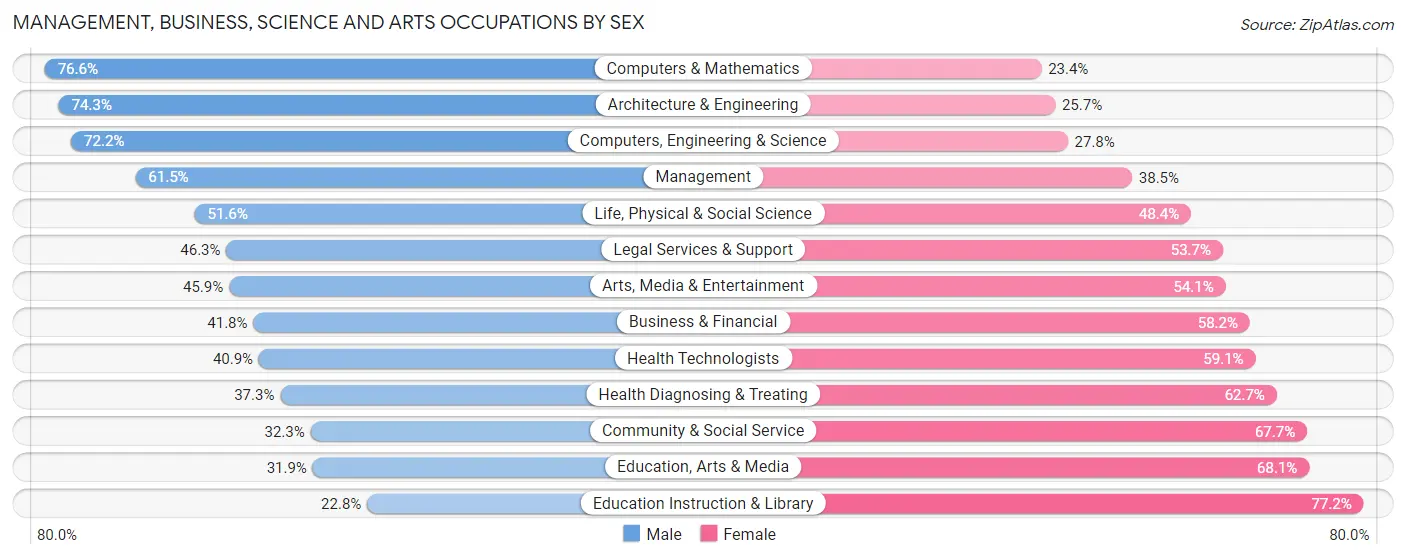
Management, Business, Science and Arts Occupations by Sex
Within the Management, Business, Science and Arts occupations in Deschutes County, the most male-oriented occupations are Computers & Mathematics (76.6%), Architecture & Engineering (74.3%), and Computers, Engineering & Science (72.2%), while the most female-oriented occupations are Education Instruction & Library (77.2%), Education, Arts & Media (68.1%), and Community & Social Service (67.7%).
| Occupation | Male | Female |
| Management | 7,633 (61.5%) | 4,778 (38.5%) |
| Business & Financial | 2,206 (41.8%) | 3,069 (58.2%) |
| Computers, Engineering & Science | 4,527 (72.2%) | 1,741 (27.8%) |
| Computers & Mathematics | 2,544 (76.6%) | 776 (23.4%) |
| Architecture & Engineering | 1,509 (74.3%) | 521 (25.7%) |
| Life, Physical & Social Science | 474 (51.6%) | 444 (48.4%) |
| Community & Social Service | 3,875 (32.3%) | 8,130 (67.7%) |
| Education, Arts & Media | 815 (31.9%) | 1,738 (68.1%) |
| Legal Services & Support | 493 (46.3%) | 571 (53.7%) |
| Education Instruction & Library | 1,269 (22.8%) | 4,290 (77.2%) |
| Arts, Media & Entertainment | 1,298 (45.9%) | 1,531 (54.1%) |
| Health Diagnosing & Treating | 2,244 (37.3%) | 3,765 (62.7%) |
| Health Technologists | 1,991 (40.9%) | 2,878 (59.1%) |
| Total (Category) | 20,485 (48.8%) | 21,483 (51.2%) |
| Total (Overall) | 52,057 (52.8%) | 46,579 (47.2%) |
Services Occupations
The most common Services occupations in Deschutes County are Food Preparation & Serving (6,706 | 6.8%), Healthcare Support (3,116 | 3.2%), Personal Care & Service (2,976 | 3.0%), Cleaning & Maintenance (2,580 | 2.6%), and Security & Protection (1,905 | 1.9%).

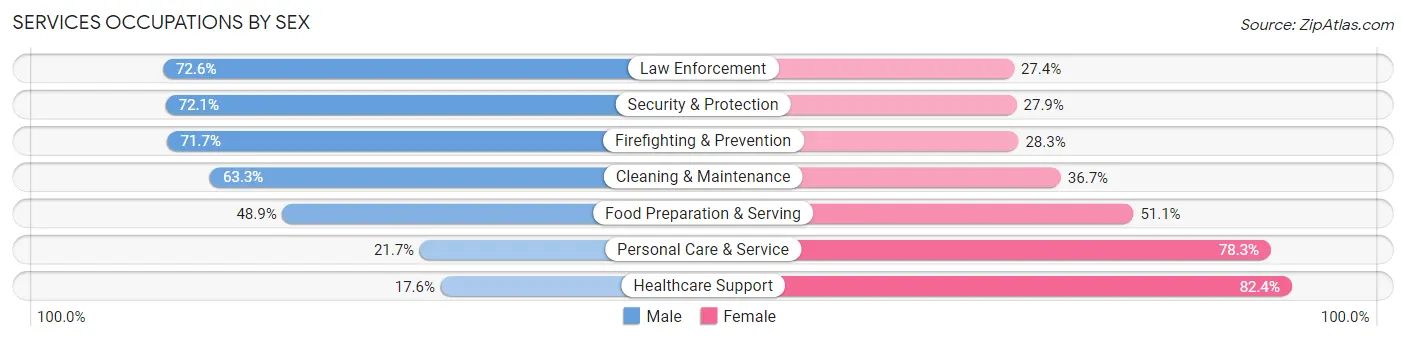
Services Occupations by Sex
Within the Services occupations in Deschutes County, the most male-oriented occupations are Law Enforcement (72.6%), Security & Protection (72.1%), and Firefighting & Prevention (71.7%), while the most female-oriented occupations are Healthcare Support (82.4%), Personal Care & Service (78.3%), and Food Preparation & Serving (51.1%).
| Occupation | Male | Female |
| Healthcare Support | 548 (17.6%) | 2,568 (82.4%) |
| Security & Protection | 1,373 (72.1%) | 532 (27.9%) |
| Firefighting & Prevention | 793 (71.7%) | 313 (28.3%) |
| Law Enforcement | 580 (72.6%) | 219 (27.4%) |
| Food Preparation & Serving | 3,281 (48.9%) | 3,425 (51.1%) |
| Cleaning & Maintenance | 1,633 (63.3%) | 947 (36.7%) |
| Personal Care & Service | 646 (21.7%) | 2,330 (78.3%) |
| Total (Category) | 7,481 (43.3%) | 9,802 (56.7%) |
| Total (Overall) | 52,057 (52.8%) | 46,579 (47.2%) |
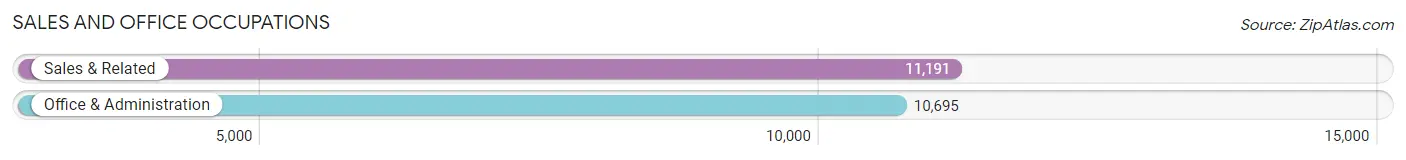
Sales and Office Occupations
The most common Sales and Office occupations in Deschutes County are Sales & Related (11,191 | 11.4%), and Office & Administration (10,695 | 10.8%).
Sales and Office Occupations by Sex
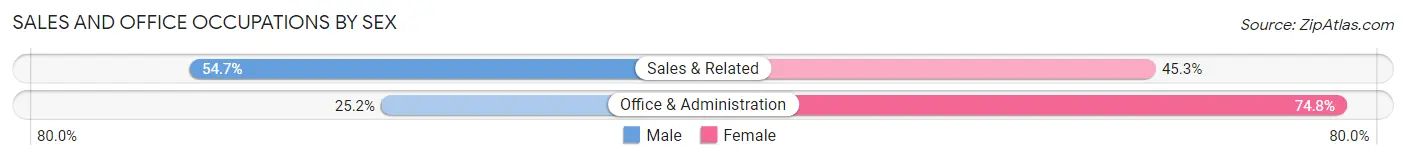
| Occupation | Male | Female |
| Sales & Related | 6,122 (54.7%) | 5,069 (45.3%) |
| Office & Administration | 2,694 (25.2%) | 8,001 (74.8%) |
| Total (Category) | 8,816 (40.3%) | 13,070 (59.7%) |
| Total (Overall) | 52,057 (52.8%) | 46,579 (47.2%) |
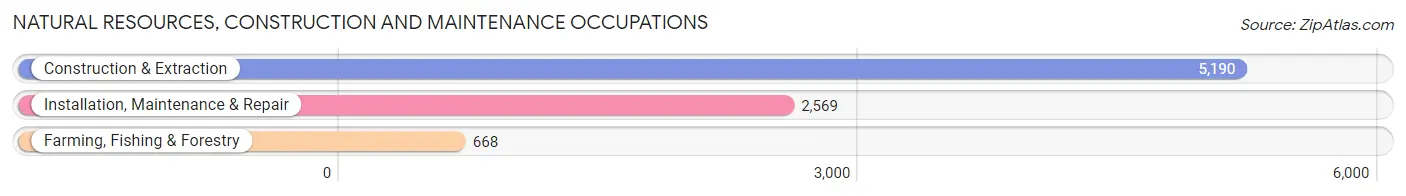
Natural Resources, Construction and Maintenance Occupations
The most common Natural Resources, Construction and Maintenance occupations in Deschutes County are Construction & Extraction (5,190 | 5.3%), Installation, Maintenance & Repair (2,569 | 2.6%), and Farming, Fishing & Forestry (668 | 0.7%).
Natural Resources, Construction and Maintenance Occupations by Sex
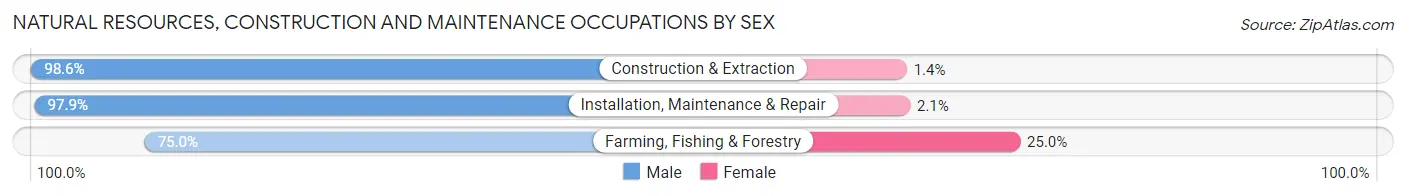
| Occupation | Male | Female |
| Farming, Fishing & Forestry | 501 (75.0%) | 167 (25.0%) |
| Construction & Extraction | 5,117 (98.6%) | 73 (1.4%) |
| Installation, Maintenance & Repair | 2,515 (97.9%) | 54 (2.1%) |
| Total (Category) | 8,133 (96.5%) | 294 (3.5%) |
| Total (Overall) | 52,057 (52.8%) | 46,579 (47.2%) |
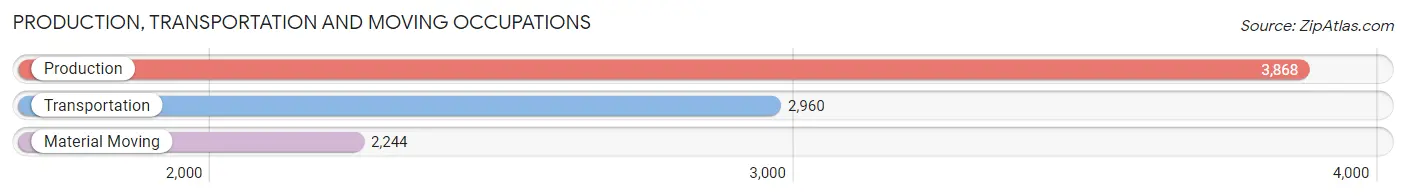
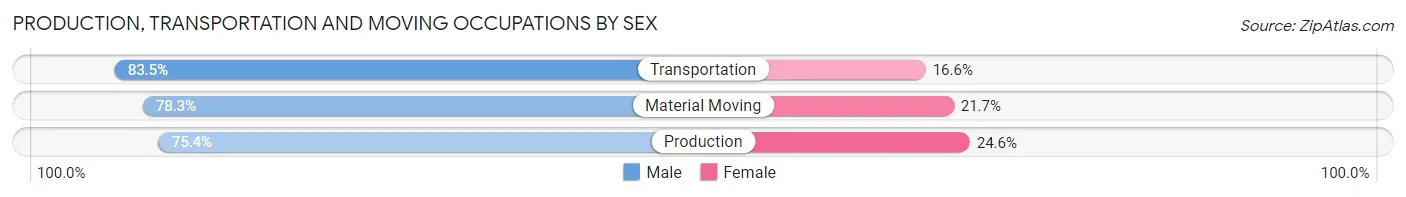
Production, Transportation and Moving Occupations
The most common Production, Transportation and Moving occupations in Deschutes County are Production (3,868 | 3.9%), Transportation (2,960 | 3.0%), and Material Moving (2,244 | 2.3%).
Production, Transportation and Moving Occupations by Sex
| Occupation | Male | Female |
| Production | 2,915 (75.4%) | 953 (24.6%) |
| Transportation | 2,470 (83.5%) | 490 (16.6%) |
| Material Moving | 1,757 (78.3%) | 487 (21.7%) |
| Total (Category) | 7,142 (78.7%) | 1,930 (21.3%) |
| Total (Overall) | 52,057 (52.8%) | 46,579 (47.2%) |
Employment Industries by Sex in Deschutes County
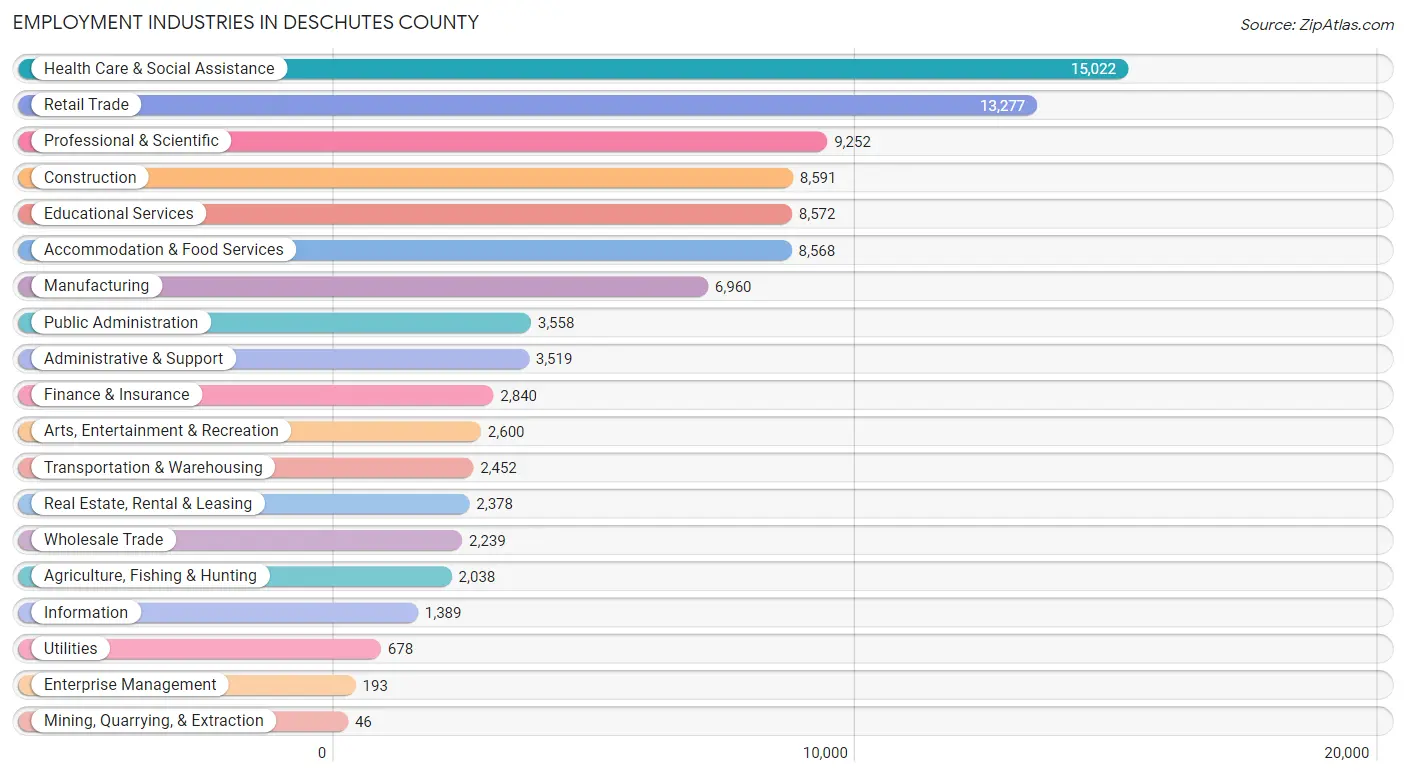
Employment Industries in Deschutes County
The major employment industries in Deschutes County include Health Care & Social Assistance (15,022 | 15.2%), Retail Trade (13,277 | 13.5%), Professional & Scientific (9,252 | 9.4%), Construction (8,591 | 8.7%), and Educational Services (8,572 | 8.7%).
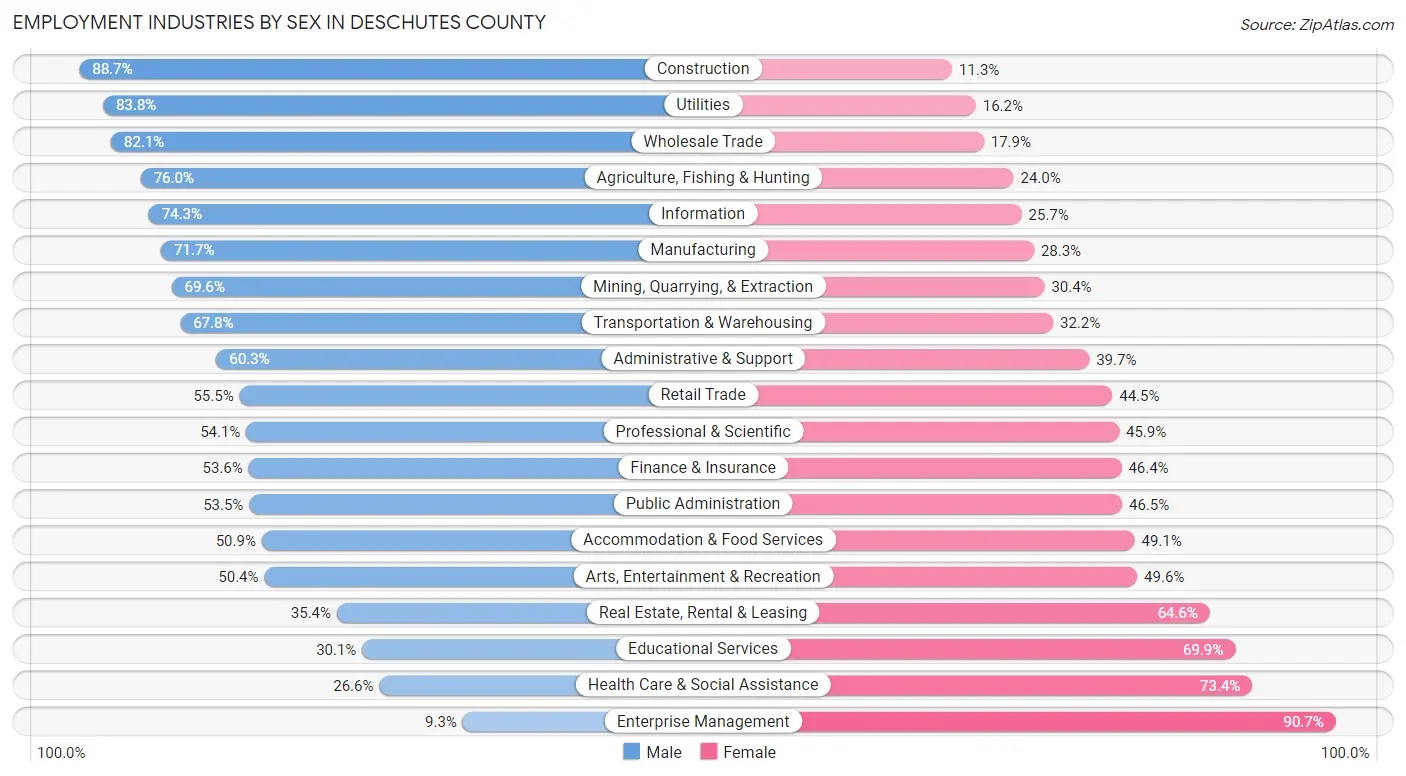
Employment Industries by Sex in Deschutes County
The Deschutes County industries that see more men than women are Construction (88.7%), Utilities (83.8%), and Wholesale Trade (82.1%), whereas the industries that tend to have a higher number of women are Enterprise Management (90.7%), Health Care & Social Assistance (73.4%), and Educational Services (69.9%).
| Industry | Male | Female |
| Agriculture, Fishing & Hunting | 1,548 (76.0%) | 490 (24.0%) |
| Mining, Quarrying, & Extraction | 32 (69.6%) | 14 (30.4%) |
| Construction | 7,618 (88.7%) | 973 (11.3%) |
| Manufacturing | 4,993 (71.7%) | 1,967 (28.3%) |
| Wholesale Trade | 1,839 (82.1%) | 400 (17.9%) |
| Retail Trade | 7,372 (55.5%) | 5,905 (44.5%) |
| Transportation & Warehousing | 1,662 (67.8%) | 790 (32.2%) |
| Utilities | 568 (83.8%) | 110 (16.2%) |
| Information | 1,032 (74.3%) | 357 (25.7%) |
| Finance & Insurance | 1,523 (53.6%) | 1,317 (46.4%) |
| Real Estate, Rental & Leasing | 841 (35.4%) | 1,537 (64.6%) |
| Professional & Scientific | 5,008 (54.1%) | 4,244 (45.9%) |
| Enterprise Management | 18 (9.3%) | 175 (90.7%) |
| Administrative & Support | 2,122 (60.3%) | 1,397 (39.7%) |
| Educational Services | 2,582 (30.1%) | 5,990 (69.9%) |
| Health Care & Social Assistance | 3,993 (26.6%) | 11,029 (73.4%) |
| Arts, Entertainment & Recreation | 1,310 (50.4%) | 1,290 (49.6%) |
| Accommodation & Food Services | 4,363 (50.9%) | 4,205 (49.1%) |
| Public Administration | 1,904 (53.5%) | 1,654 (46.5%) |
| Total | 52,057 (52.8%) | 46,579 (47.2%) |
Education in Deschutes County
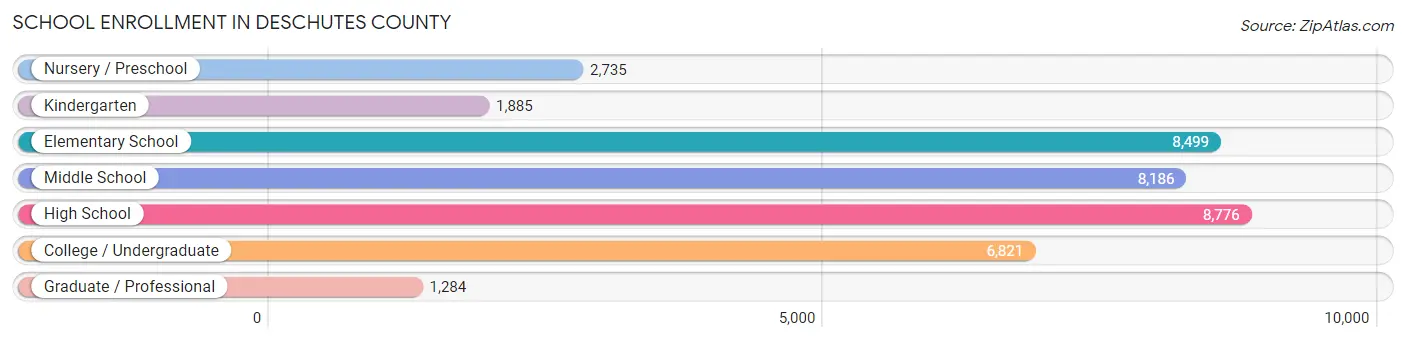
School Enrollment in Deschutes County
The most common levels of schooling among the 38,186 students in Deschutes County are high school (8,776 | 23.0%), elementary school (8,499 | 22.3%), and middle school (8,186 | 21.4%).
| School Level | # Students | % Students |
| Nursery / Preschool | 2,735 | 7.2% |
| Kindergarten | 1,885 | 4.9% |
| Elementary School | 8,499 | 22.3% |
| Middle School | 8,186 | 21.4% |
| High School | 8,776 | 23.0% |
| College / Undergraduate | 6,821 | 17.9% |
| Graduate / Professional | 1,284 | 3.4% |
| Total | 38,186 | 100.0% |
School Enrollment by Age by Funding Source in Deschutes County
Out of a total of 38,186 students who are enrolled in schools in Deschutes County, 5,995 (15.7%) attend a private institution, while the remaining 32,191 (84.3%) are enrolled in public schools. The age group of 3 to 4 year olds has the highest likelihood of being enrolled in private schools, with 1,052 (56.3% in the age bracket) enrolled. Conversely, the age group of 15 to 17 year olds has the lowest likelihood of being enrolled in a private school, with 6,111 (95.1% in the age bracket) attending a public institution.
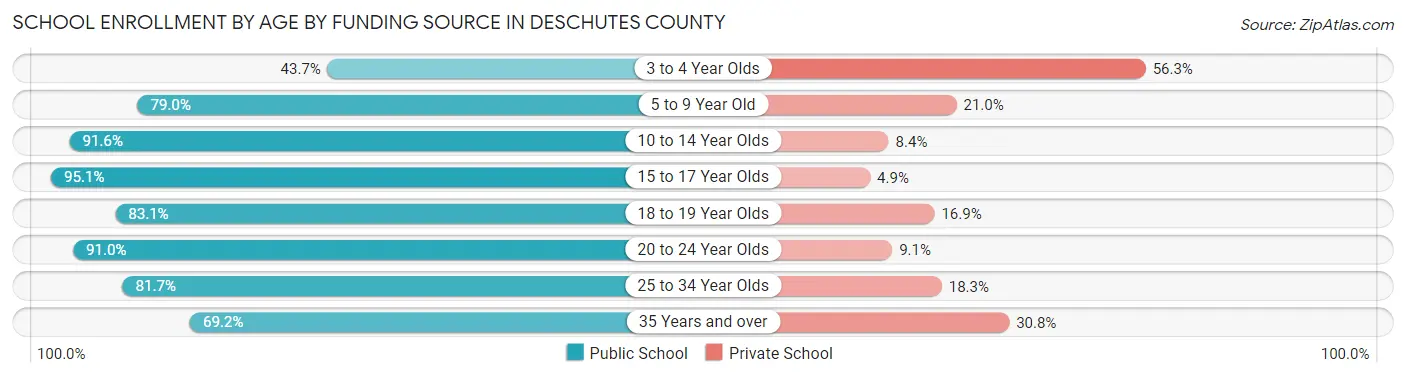
| Age Bracket | Public School | Private School |
| 3 to 4 Year Olds | 818 (43.7%) | 1,052 (56.3%) |
| 5 to 9 Year Old | 7,697 (79.0%) | 2,050 (21.0%) |
| 10 to 14 Year Olds | 9,683 (91.6%) | 886 (8.4%) |
| 15 to 17 Year Olds | 6,111 (95.1%) | 317 (4.9%) |
| 18 to 19 Year Olds | 1,743 (83.1%) | 355 (16.9%) |
| 20 to 24 Year Olds | 2,613 (90.9%) | 260 (9.0%) |
| 25 to 34 Year Olds | 2,130 (81.7%) | 476 (18.3%) |
| 35 Years and over | 1,380 (69.2%) | 615 (30.8%) |
| Total | 32,191 (84.3%) | 5,995 (15.7%) |
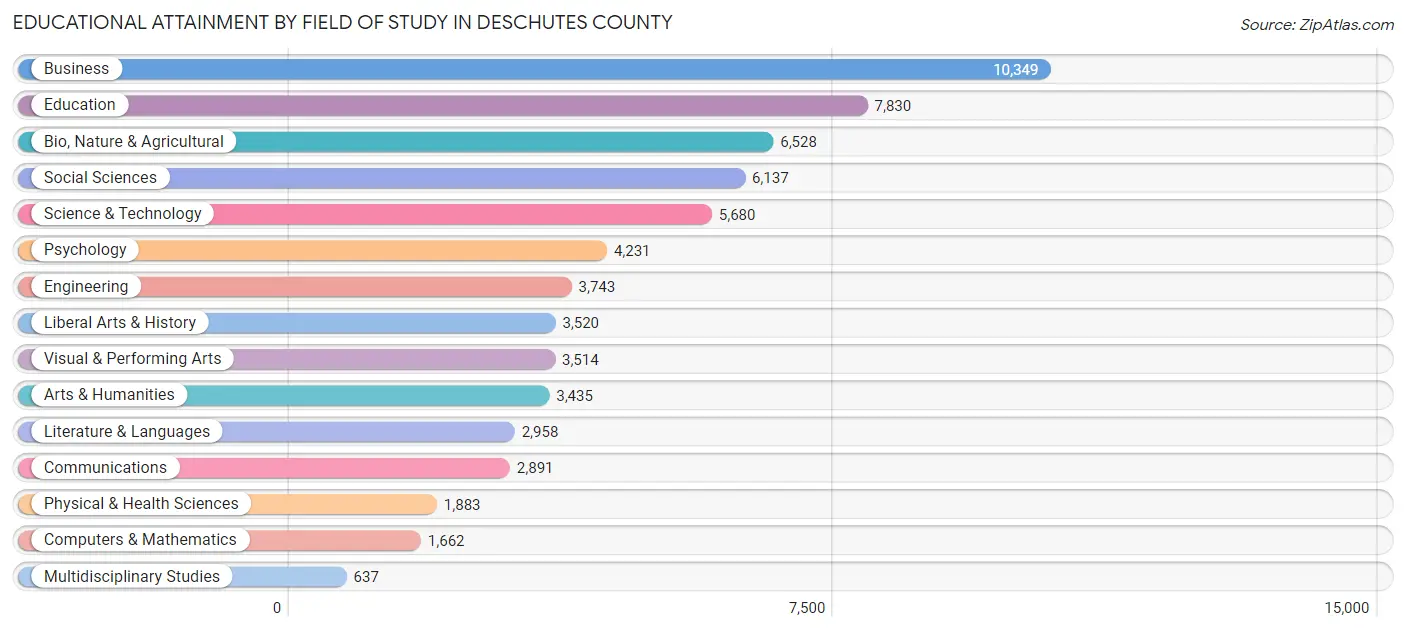
Educational Attainment by Field of Study in Deschutes County
Business (10,349 | 15.9%), education (7,830 | 12.0%), bio, nature & agricultural (6,528 | 10.0%), social sciences (6,137 | 9.4%), and science & technology (5,680 | 8.7%) are the most common fields of study among 64,998 individuals in Deschutes County who have obtained a bachelor's degree or higher.
| Field of Study | # Graduates | % Graduates |
| Computers & Mathematics | 1,662 | 2.6% |
| Bio, Nature & Agricultural | 6,528 | 10.0% |
| Physical & Health Sciences | 1,883 | 2.9% |
| Psychology | 4,231 | 6.5% |
| Social Sciences | 6,137 | 9.4% |
| Engineering | 3,743 | 5.8% |
| Multidisciplinary Studies | 637 | 1.0% |
| Science & Technology | 5,680 | 8.7% |
| Business | 10,349 | 15.9% |
| Education | 7,830 | 12.0% |
| Literature & Languages | 2,958 | 4.5% |
| Liberal Arts & History | 3,520 | 5.4% |
| Visual & Performing Arts | 3,514 | 5.4% |
| Communications | 2,891 | 4.4% |
| Arts & Humanities | 3,435 | 5.3% |
| Total | 64,998 | 100.0% |
Transportation & Commute in Deschutes County
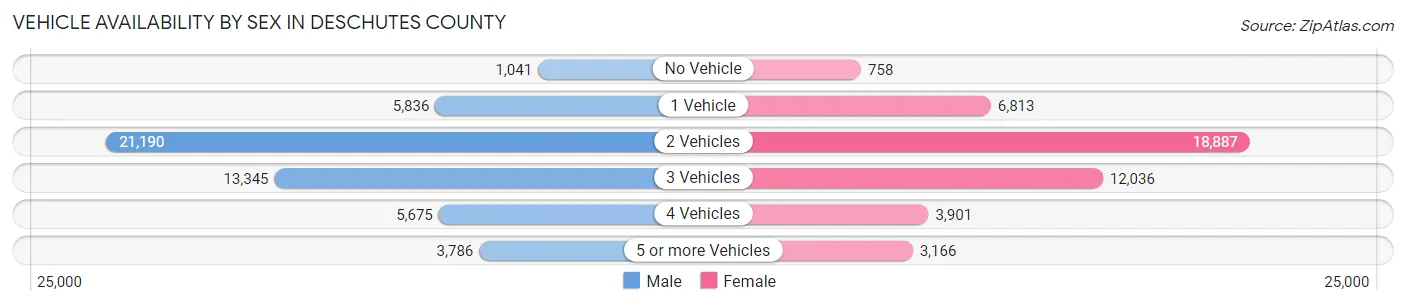
Vehicle Availability by Sex in Deschutes County
The most prevalent vehicle ownership categories in Deschutes County are males with 2 vehicles (21,190, accounting for 41.6%) and females with 2 vehicles (18,887, making up 46.5%).
| Vehicles Available | Male | Female |
| No Vehicle | 1,041 (2.1%) | 758 (1.7%) |
| 1 Vehicle | 5,836 (11.5%) | 6,813 (14.9%) |
| 2 Vehicles | 21,190 (41.6%) | 18,887 (41.4%) |
| 3 Vehicles | 13,345 (26.2%) | 12,036 (26.4%) |
| 4 Vehicles | 5,675 (11.2%) | 3,901 (8.6%) |
| 5 or more Vehicles | 3,786 (7.4%) | 3,166 (7.0%) |
| Total | 50,873 (100.0%) | 45,561 (100.0%) |
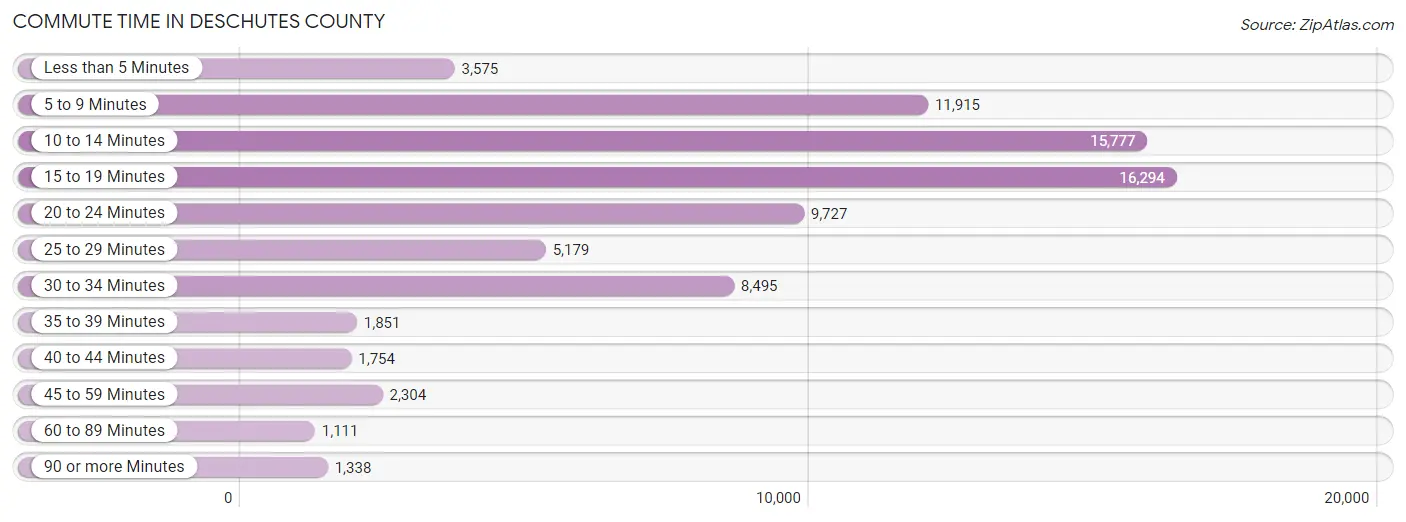
Commute Time in Deschutes County
The most frequently occuring commute durations in Deschutes County are 15 to 19 minutes (16,294 commuters, 20.5%), 10 to 14 minutes (15,777 commuters, 19.9%), and 5 to 9 minutes (11,915 commuters, 15.0%).
| Commute Time | # Commuters | % Commuters |
| Less than 5 Minutes | 3,575 | 4.5% |
| 5 to 9 Minutes | 11,915 | 15.0% |
| 10 to 14 Minutes | 15,777 | 19.9% |
| 15 to 19 Minutes | 16,294 | 20.5% |
| 20 to 24 Minutes | 9,727 | 12.3% |
| 25 to 29 Minutes | 5,179 | 6.5% |
| 30 to 34 Minutes | 8,495 | 10.7% |
| 35 to 39 Minutes | 1,851 | 2.3% |
| 40 to 44 Minutes | 1,754 | 2.2% |
| 45 to 59 Minutes | 2,304 | 2.9% |
| 60 to 89 Minutes | 1,111 | 1.4% |
| 90 or more Minutes | 1,338 | 1.7% |
Commute Time by Sex in Deschutes County
The most common commute times in Deschutes County are 15 to 19 minutes (9,412 commuters, 22.0%) for males and 10 to 14 minutes (8,192 commuters, 22.5%) for females.
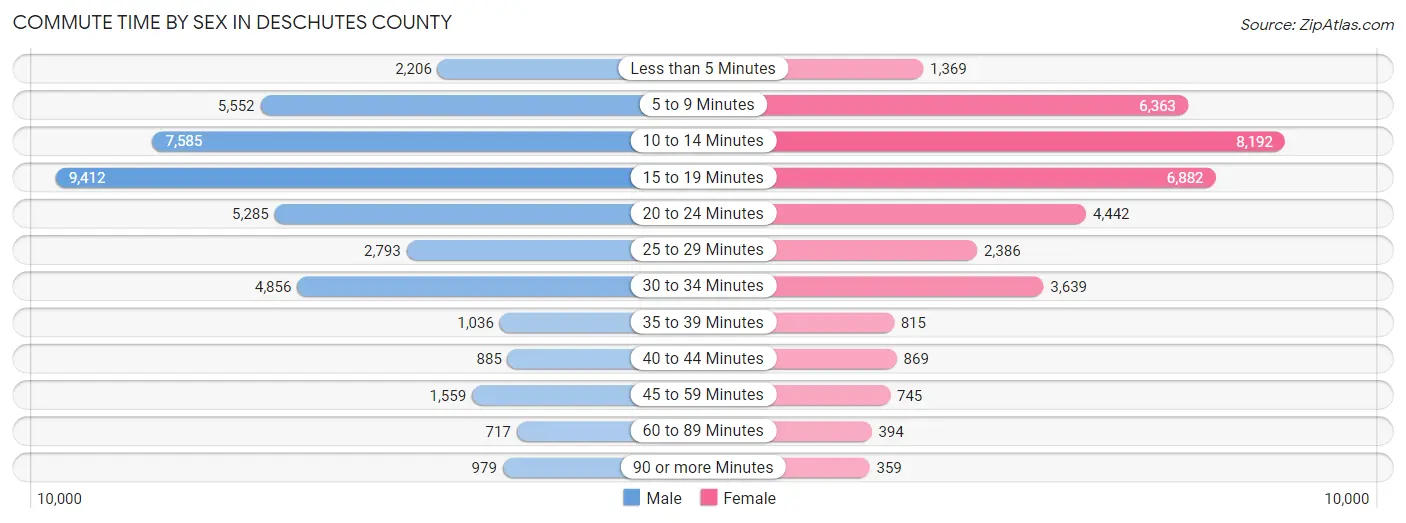
| Commute Time | Male | Female |
| Less than 5 Minutes | 2,206 (5.1%) | 1,369 (3.8%) |
| 5 to 9 Minutes | 5,552 (13.0%) | 6,363 (17.4%) |
| 10 to 14 Minutes | 7,585 (17.7%) | 8,192 (22.5%) |
| 15 to 19 Minutes | 9,412 (22.0%) | 6,882 (18.9%) |
| 20 to 24 Minutes | 5,285 (12.3%) | 4,442 (12.2%) |
| 25 to 29 Minutes | 2,793 (6.5%) | 2,386 (6.6%) |
| 30 to 34 Minutes | 4,856 (11.3%) | 3,639 (10.0%) |
| 35 to 39 Minutes | 1,036 (2.4%) | 815 (2.2%) |
| 40 to 44 Minutes | 885 (2.1%) | 869 (2.4%) |
| 45 to 59 Minutes | 1,559 (3.6%) | 745 (2.0%) |
| 60 to 89 Minutes | 717 (1.7%) | 394 (1.1%) |
| 90 or more Minutes | 979 (2.3%) | 359 (1.0%) |
Time of Departure to Work by Sex in Deschutes County
The most frequent times of departure to work in Deschutes County are 7:00 AM to 7:29 AM (6,538, 15.2%) for males and 7:30 AM to 7:59 AM (6,391, 17.5%) for females.
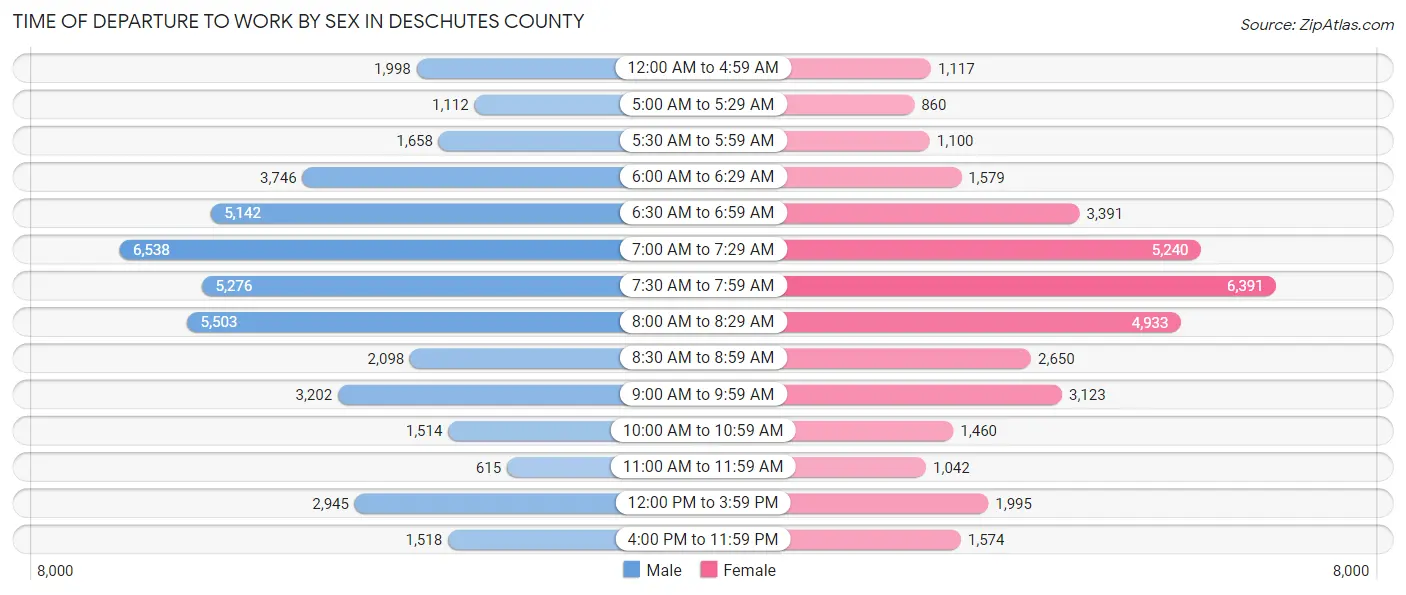
| Time of Departure | Male | Female |
| 12:00 AM to 4:59 AM | 1,998 (4.7%) | 1,117 (3.1%) |
| 5:00 AM to 5:29 AM | 1,112 (2.6%) | 860 (2.4%) |
| 5:30 AM to 5:59 AM | 1,658 (3.9%) | 1,100 (3.0%) |
| 6:00 AM to 6:29 AM | 3,746 (8.7%) | 1,579 (4.3%) |
| 6:30 AM to 6:59 AM | 5,142 (12.0%) | 3,391 (9.3%) |
| 7:00 AM to 7:29 AM | 6,538 (15.2%) | 5,240 (14.4%) |
| 7:30 AM to 7:59 AM | 5,276 (12.3%) | 6,391 (17.5%) |
| 8:00 AM to 8:29 AM | 5,503 (12.8%) | 4,933 (13.5%) |
| 8:30 AM to 8:59 AM | 2,098 (4.9%) | 2,650 (7.3%) |
| 9:00 AM to 9:59 AM | 3,202 (7.5%) | 3,123 (8.6%) |
| 10:00 AM to 10:59 AM | 1,514 (3.5%) | 1,460 (4.0%) |
| 11:00 AM to 11:59 AM | 615 (1.4%) | 1,042 (2.9%) |
| 12:00 PM to 3:59 PM | 2,945 (6.9%) | 1,995 (5.5%) |
| 4:00 PM to 11:59 PM | 1,518 (3.5%) | 1,574 (4.3%) |
| Total | 42,865 (100.0%) | 36,455 (100.0%) |
Housing Occupancy in Deschutes County
Occupancy by Ownership in Deschutes County
Of the total 81,481 dwellings in Deschutes County, owner-occupied units account for 56,821 (69.7%), while renter-occupied units make up 24,660 (30.3%).
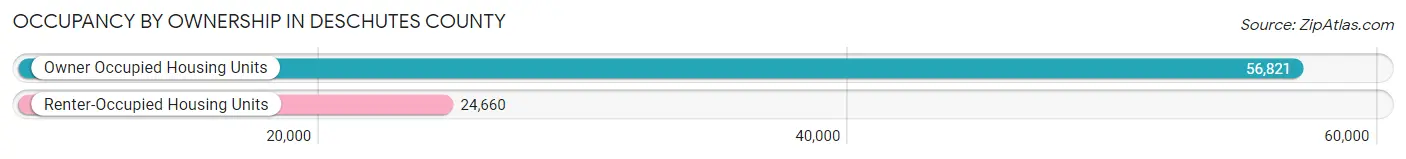
| Occupancy | # Housing Units | % Housing Units |
| Owner Occupied Housing Units | 56,821 | 69.7% |
| Renter-Occupied Housing Units | 24,660 | 30.3% |
| Total Occupied Housing Units | 81,481 | 100.0% |
Occupancy by Household Size in Deschutes County
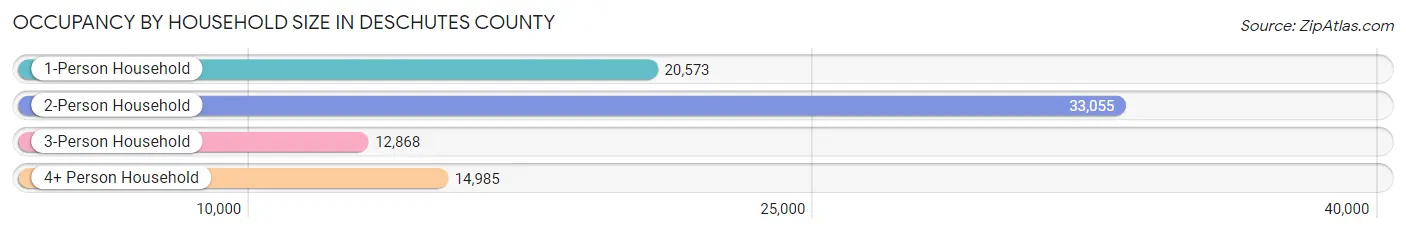
| Household Size | # Housing Units | % Housing Units |
| 1-Person Household | 20,573 | 25.3% |
| 2-Person Household | 33,055 | 40.6% |
| 3-Person Household | 12,868 | 15.8% |
| 4+ Person Household | 14,985 | 18.4% |
| Total Housing Units | 81,481 | 100.0% |
Occupancy by Ownership by Household Size in Deschutes County
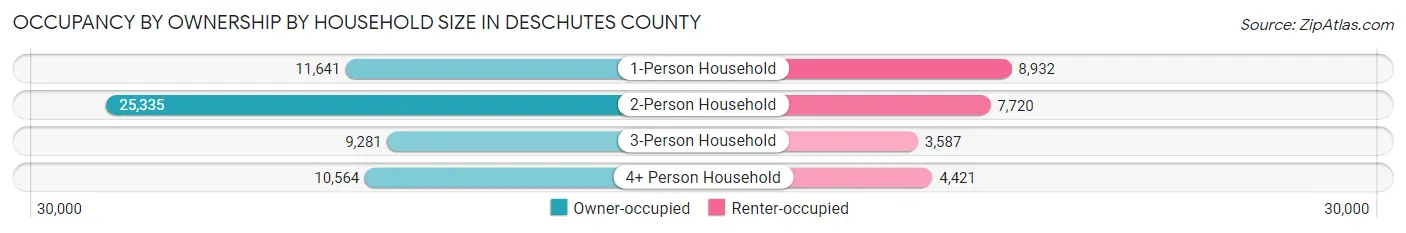
| Household Size | Owner-occupied | Renter-occupied |
| 1-Person Household | 11,641 (56.6%) | 8,932 (43.4%) |
| 2-Person Household | 25,335 (76.6%) | 7,720 (23.4%) |
| 3-Person Household | 9,281 (72.1%) | 3,587 (27.9%) |
| 4+ Person Household | 10,564 (70.5%) | 4,421 (29.5%) |
| Total Housing Units | 56,821 (69.7%) | 24,660 (30.3%) |
Occupancy by Educational Attainment in Deschutes County
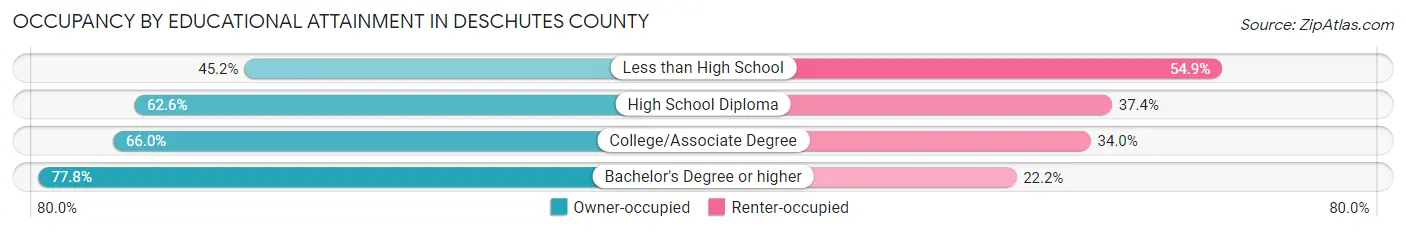
| Household Size | Owner-occupied | Renter-occupied |
| Less than High School | 1,531 (45.2%) | 1,860 (54.8%) |
| High School Diploma | 8,125 (62.6%) | 4,847 (37.4%) |
| College/Associate Degree | 19,520 (66.0%) | 10,060 (34.0%) |
| Bachelor's Degree or higher | 27,645 (77.8%) | 7,893 (22.2%) |
Occupancy by Age of Householder in Deschutes County
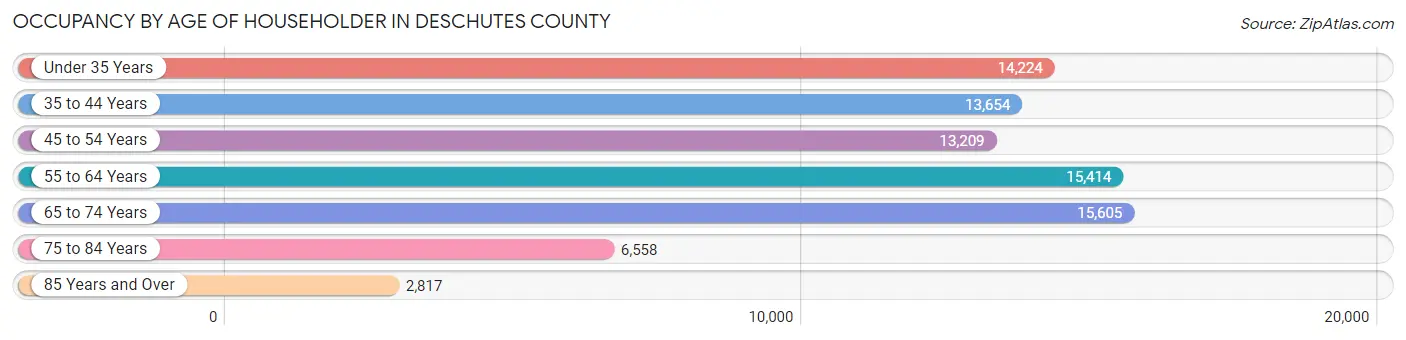
| Age Bracket | # Households | % Households |
| Under 35 Years | 14,224 | 17.5% |
| 35 to 44 Years | 13,654 | 16.8% |
| 45 to 54 Years | 13,209 | 16.2% |
| 55 to 64 Years | 15,414 | 18.9% |
| 65 to 74 Years | 15,605 | 19.2% |
| 75 to 84 Years | 6,558 | 8.1% |
| 85 Years and Over | 2,817 | 3.5% |
| Total | 81,481 | 100.0% |
Housing Finances in Deschutes County
Median Income by Occupancy in Deschutes County
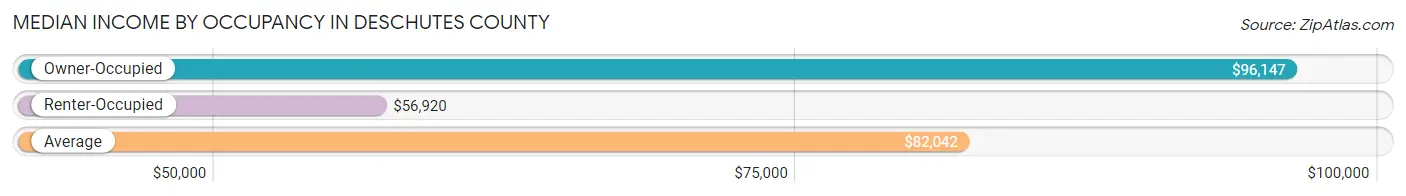
| Occupancy Type | # Households | Median Income |
| Owner-Occupied | 56,821 (69.7%) | $96,147 |
| Renter-Occupied | 24,660 (30.3%) | $56,920 |
| Average | 81,481 (100.0%) | $82,042 |
Occupancy by Householder Income Bracket in Deschutes County
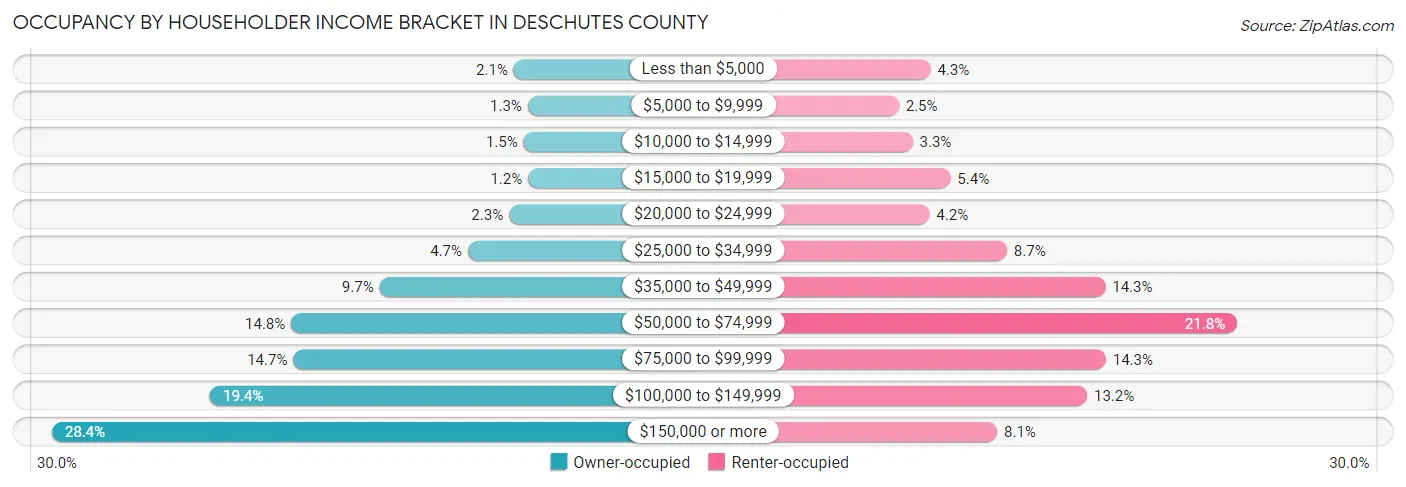
| Income Bracket | Owner-occupied | Renter-occupied |
| Less than $5,000 | 1,166 (2.1%) | 1,055 (4.3%) |
| $5,000 to $9,999 | 708 (1.3%) | 610 (2.5%) |
| $10,000 to $14,999 | 848 (1.5%) | 805 (3.3%) |
| $15,000 to $19,999 | 701 (1.2%) | 1,336 (5.4%) |
| $20,000 to $24,999 | 1,317 (2.3%) | 1,040 (4.2%) |
| $25,000 to $34,999 | 2,655 (4.7%) | 2,134 (8.6%) |
| $35,000 to $49,999 | 5,522 (9.7%) | 3,518 (14.3%) |
| $50,000 to $74,999 | 8,392 (14.8%) | 5,377 (21.8%) |
| $75,000 to $99,999 | 8,327 (14.6%) | 3,527 (14.3%) |
| $100,000 to $149,999 | 11,025 (19.4%) | 3,263 (13.2%) |
| $150,000 or more | 16,160 (28.4%) | 1,995 (8.1%) |
| Total | 56,821 (100.0%) | 24,660 (100.0%) |
Monthly Housing Cost Tiers in Deschutes County
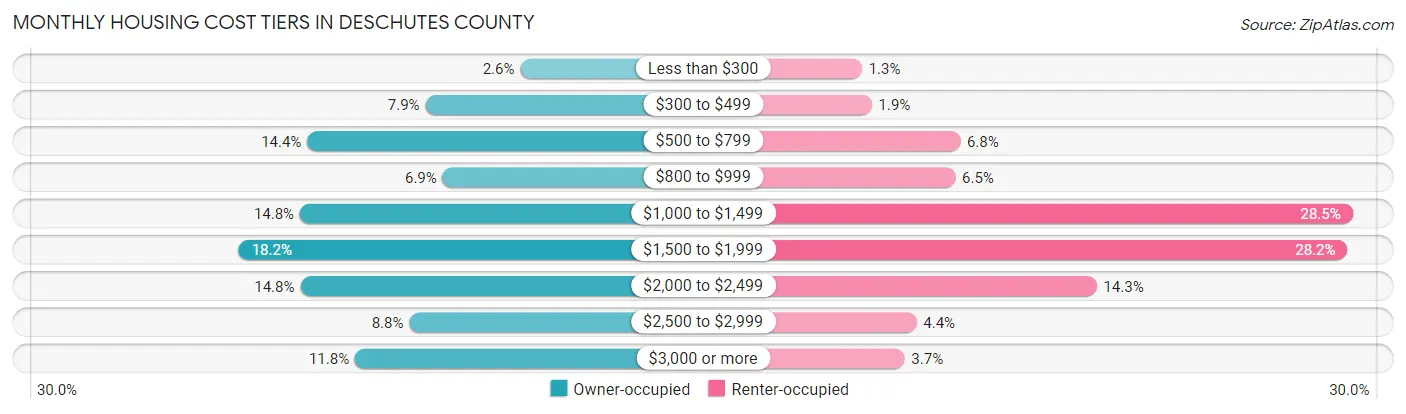
| Monthly Cost | Owner-occupied | Renter-occupied |
| Less than $300 | 1,490 (2.6%) | 331 (1.3%) |
| $300 to $499 | 4,465 (7.9%) | 467 (1.9%) |
| $500 to $799 | 8,175 (14.4%) | 1,669 (6.8%) |
| $800 to $999 | 3,924 (6.9%) | 1,603 (6.5%) |
| $1,000 to $1,499 | 8,402 (14.8%) | 7,016 (28.4%) |
| $1,500 to $1,999 | 10,323 (18.2%) | 6,944 (28.2%) |
| $2,000 to $2,499 | 8,392 (14.8%) | 3,528 (14.3%) |
| $2,500 to $2,999 | 4,971 (8.7%) | 1,076 (4.4%) |
| $3,000 or more | 6,679 (11.7%) | 913 (3.7%) |
| Total | 56,821 (100.0%) | 24,660 (100.0%) |
Physical Housing Characteristics in Deschutes County
Housing Structures in Deschutes County
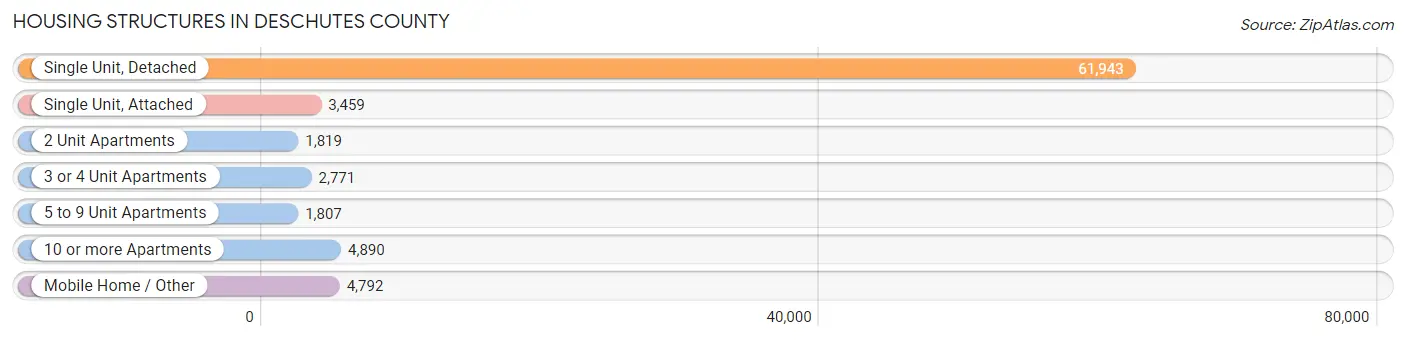
| Structure Type | # Housing Units | % Housing Units |
| Single Unit, Detached | 61,943 | 76.0% |
| Single Unit, Attached | 3,459 | 4.3% |
| 2 Unit Apartments | 1,819 | 2.2% |
| 3 or 4 Unit Apartments | 2,771 | 3.4% |
| 5 to 9 Unit Apartments | 1,807 | 2.2% |
| 10 or more Apartments | 4,890 | 6.0% |
| Mobile Home / Other | 4,792 | 5.9% |
| Total | 81,481 | 100.0% |
Housing Structures by Occupancy in Deschutes County
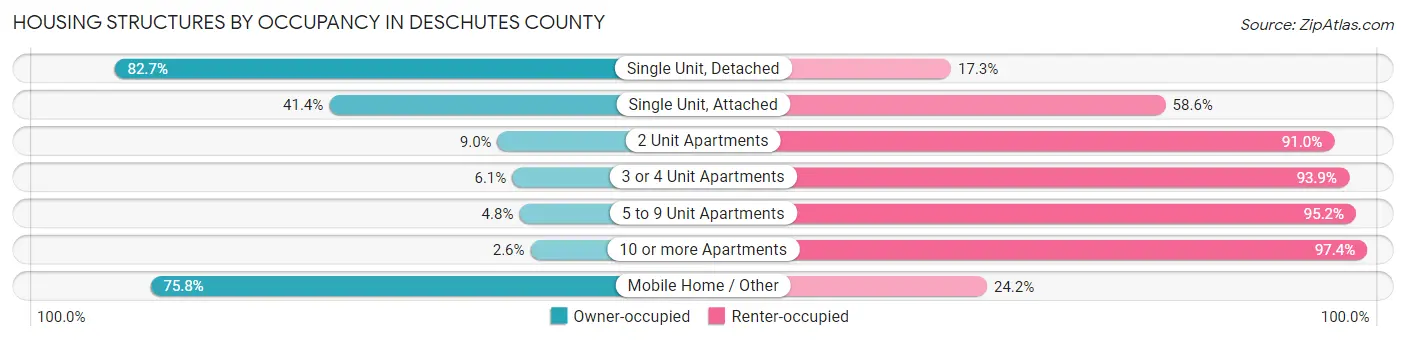
| Structure Type | Owner-occupied | Renter-occupied |
| Single Unit, Detached | 51,212 (82.7%) | 10,731 (17.3%) |
| Single Unit, Attached | 1,431 (41.4%) | 2,028 (58.6%) |
| 2 Unit Apartments | 163 (9.0%) | 1,656 (91.0%) |
| 3 or 4 Unit Apartments | 170 (6.1%) | 2,601 (93.9%) |
| 5 to 9 Unit Apartments | 86 (4.8%) | 1,721 (95.2%) |
| 10 or more Apartments | 128 (2.6%) | 4,762 (97.4%) |
| Mobile Home / Other | 3,631 (75.8%) | 1,161 (24.2%) |
| Total | 56,821 (69.7%) | 24,660 (30.3%) |
Housing Structures by Number of Rooms in Deschutes County

| Number of Rooms | Owner-occupied | Renter-occupied |
| 1 Room | 137 (0.2%) | 1,059 (4.3%) |
| 2 or 3 Rooms | 1,675 (2.9%) | 5,111 (20.7%) |
| 4 or 5 Rooms | 20,055 (35.3%) | 13,086 (53.1%) |
| 6 or 7 Rooms | 21,177 (37.3%) | 4,461 (18.1%) |
| 8 or more Rooms | 13,777 (24.2%) | 943 (3.8%) |
| Total | 56,821 (100.0%) | 24,660 (100.0%) |
Housing Structure by Heating Type in Deschutes County
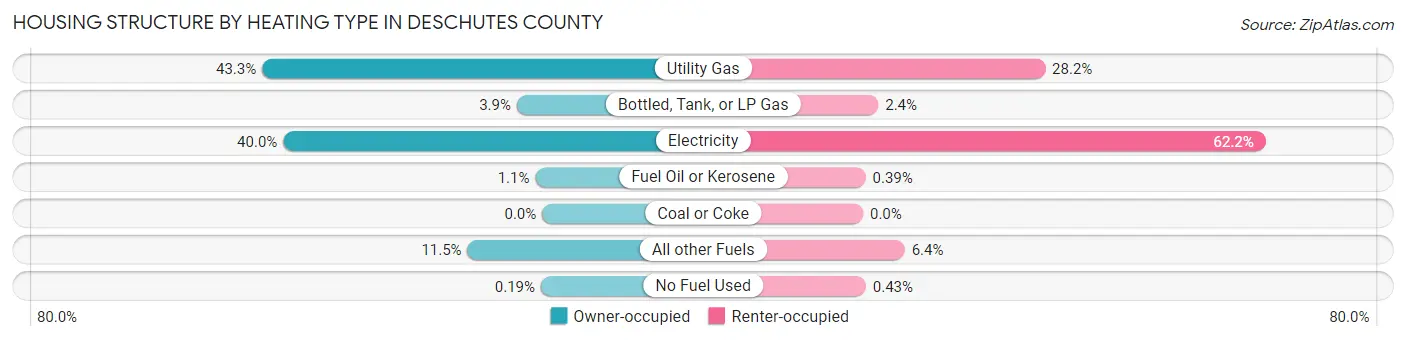
| Heating Type | Owner-occupied | Renter-occupied |
| Utility Gas | 24,597 (43.3%) | 6,942 (28.1%) |
| Bottled, Tank, or LP Gas | 2,221 (3.9%) | 582 (2.4%) |
| Electricity | 22,743 (40.0%) | 15,347 (62.2%) |
| Fuel Oil or Kerosene | 595 (1.1%) | 97 (0.4%) |
| Coal or Coke | 0 (0.0%) | 0 (0.0%) |
| All other Fuels | 6,558 (11.5%) | 1,587 (6.4%) |
| No Fuel Used | 107 (0.2%) | 105 (0.4%) |
| Total | 56,821 (100.0%) | 24,660 (100.0%) |
Household Vehicle Usage in Deschutes County
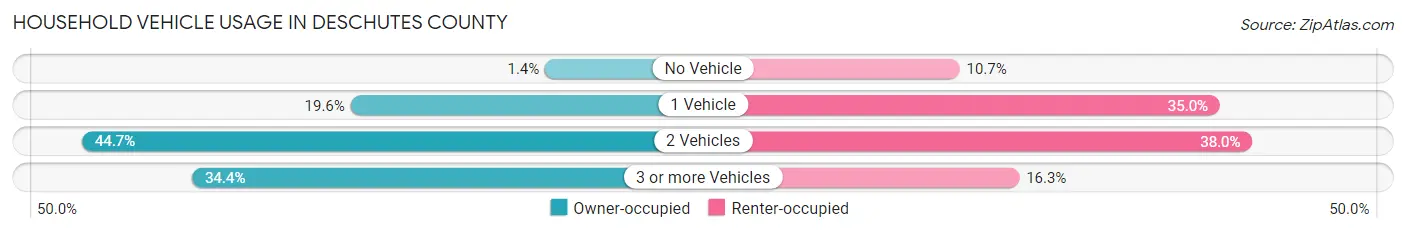
| Vehicles per Household | Owner-occupied | Renter-occupied |
| No Vehicle | 800 (1.4%) | 2,639 (10.7%) |
| 1 Vehicle | 11,119 (19.6%) | 8,632 (35.0%) |
| 2 Vehicles | 25,371 (44.7%) | 9,378 (38.0%) |
| 3 or more Vehicles | 19,531 (34.4%) | 4,011 (16.3%) |
| Total | 56,821 (100.0%) | 24,660 (100.0%) |
Real Estate & Mortgages in Deschutes County
Real Estate and Mortgage Overview in Deschutes County
| Characteristic | Without Mortgage | With Mortgage |
| Housing Units | 18,464 | 38,357 |
| Median Property Value | $528,400 | $525,300 |
| Median Household Income | $71,920 | $12,420 |
| Monthly Housing Costs | $629 | $6,649 |
| Real Estate Taxes | $3,645 | $430 |
Property Value by Mortgage Status in Deschutes County
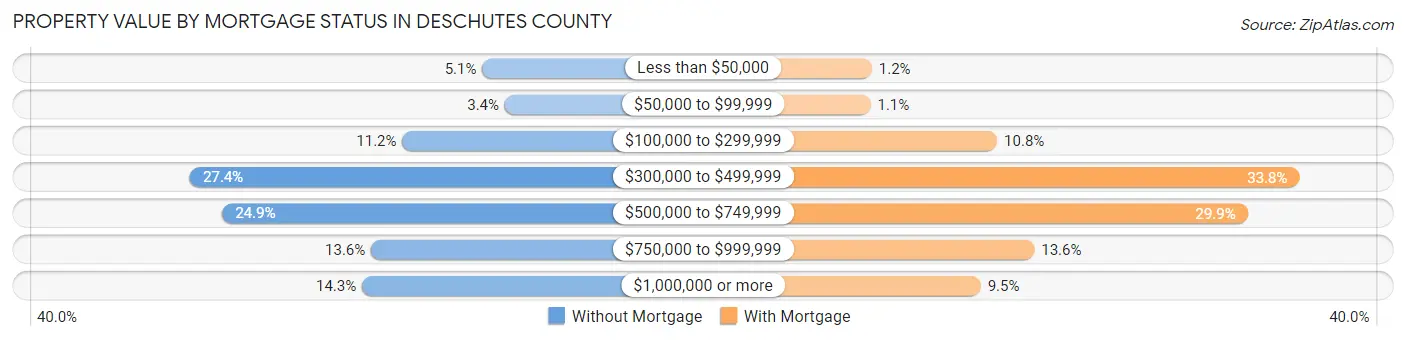
| Property Value | Without Mortgage | With Mortgage |
| Less than $50,000 | 947 (5.1%) | 476 (1.2%) |
| $50,000 to $99,999 | 630 (3.4%) | 437 (1.1%) |
| $100,000 to $299,999 | 2,071 (11.2%) | 4,137 (10.8%) |
| $300,000 to $499,999 | 5,060 (27.4%) | 12,970 (33.8%) |
| $500,000 to $749,999 | 4,605 (24.9%) | 11,456 (29.9%) |
| $750,000 to $999,999 | 2,512 (13.6%) | 5,223 (13.6%) |
| $1,000,000 or more | 2,639 (14.3%) | 3,658 (9.5%) |
| Total | 18,464 (100.0%) | 38,357 (100.0%) |
Household Income by Mortgage Status in Deschutes County
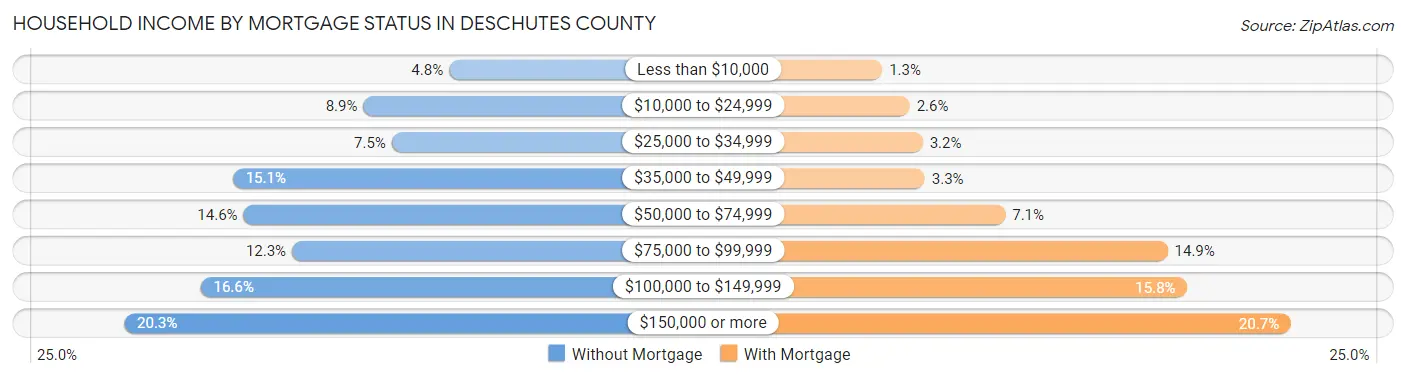
| Household Income | Without Mortgage | With Mortgage |
| Less than $10,000 | 884 (4.8%) | 487 (1.3%) |
| $10,000 to $24,999 | 1,638 (8.9%) | 990 (2.6%) |
| $25,000 to $34,999 | 1,389 (7.5%) | 1,228 (3.2%) |
| $35,000 to $49,999 | 2,787 (15.1%) | 1,266 (3.3%) |
| $50,000 to $74,999 | 2,692 (14.6%) | 2,735 (7.1%) |
| $75,000 to $99,999 | 2,266 (12.3%) | 5,700 (14.9%) |
| $100,000 to $149,999 | 3,068 (16.6%) | 6,061 (15.8%) |
| $150,000 or more | 3,740 (20.3%) | 7,957 (20.7%) |
| Total | 18,464 (100.0%) | 38,357 (100.0%) |
Property Value to Household Income Ratio in Deschutes County
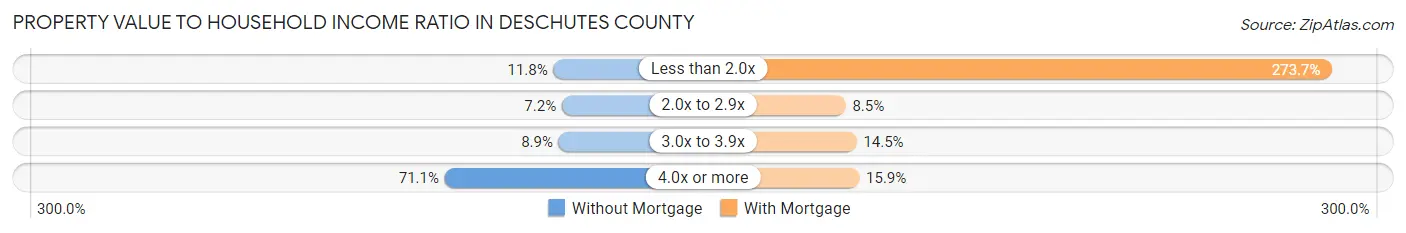
| Value-to-Income Ratio | Without Mortgage | With Mortgage |
| Less than 2.0x | 2,179 (11.8%) | 104,993 (273.7%) |
| 2.0x to 2.9x | 1,334 (7.2%) | 3,247 (8.5%) |
| 3.0x to 3.9x | 1,651 (8.9%) | 5,545 (14.5%) |
| 4.0x or more | 13,125 (71.1%) | 6,094 (15.9%) |
| Total | 18,464 (100.0%) | 38,357 (100.0%) |
Real Estate Taxes by Mortgage Status in Deschutes County
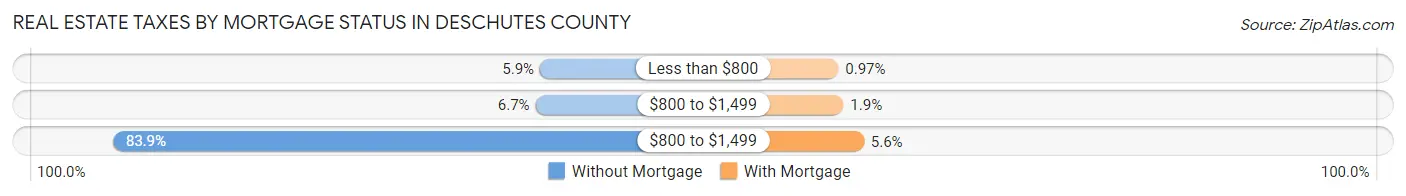
| Property Taxes | Without Mortgage | With Mortgage |
| Less than $800 | 1,084 (5.9%) | 371 (1.0%) |
| $800 to $1,499 | 1,237 (6.7%) | 725 (1.9%) |
| $800 to $1,499 | 15,487 (83.9%) | 2,159 (5.6%) |
| Total | 18,464 (100.0%) | 38,357 (100.0%) |
Health & Disability in Deschutes County
Health Insurance Coverage by Age in Deschutes County
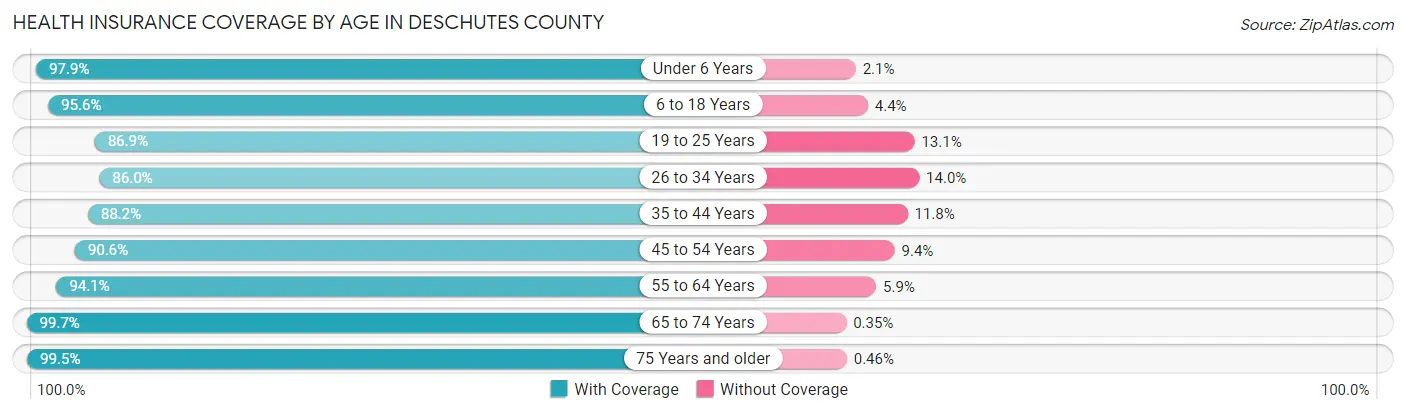
| Age Bracket | With Coverage | Without Coverage |
| Under 6 Years | 11,914 (97.9%) | 259 (2.1%) |
| 6 to 18 Years | 27,304 (95.6%) | 1,254 (4.4%) |
| 19 to 25 Years | 12,199 (86.9%) | 1,838 (13.1%) |
| 26 to 34 Years | 20,492 (86.0%) | 3,325 (14.0%) |
| 35 to 44 Years | 24,020 (88.2%) | 3,212 (11.8%) |
| 45 to 54 Years | 22,668 (90.6%) | 2,345 (9.4%) |
| 55 to 64 Years | 25,578 (94.1%) | 1,613 (5.9%) |
| 65 to 74 Years | 25,606 (99.7%) | 91 (0.4%) |
| 75 Years and older | 14,775 (99.5%) | 69 (0.5%) |
| Total | 184,556 (92.9%) | 14,006 (7.0%) |
Health Insurance Coverage by Citizenship Status in Deschutes County
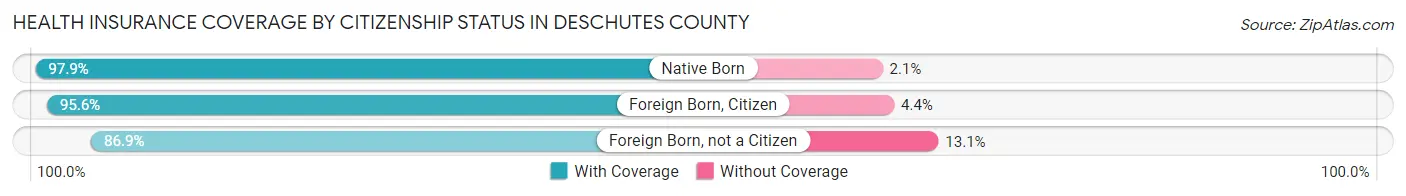
| Citizenship Status | With Coverage | Without Coverage |
| Native Born | 11,914 (97.9%) | 259 (2.1%) |
| Foreign Born, Citizen | 27,304 (95.6%) | 1,254 (4.4%) |
| Foreign Born, not a Citizen | 12,199 (86.9%) | 1,838 (13.1%) |
Health Insurance Coverage by Household Income in Deschutes County
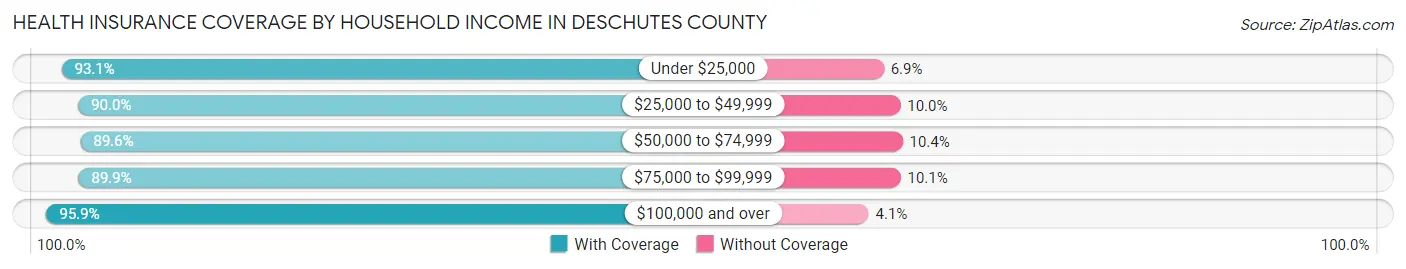
| Household Income | With Coverage | Without Coverage |
| Under $25,000 | 13,646 (93.1%) | 1,013 (6.9%) |
| $25,000 to $49,999 | 25,346 (90.0%) | 2,826 (10.0%) |
| $50,000 to $74,999 | 27,918 (89.6%) | 3,254 (10.4%) |
| $75,000 to $99,999 | 27,232 (89.9%) | 3,050 (10.1%) |
| $100,000 and over | 89,631 (95.9%) | 3,815 (4.1%) |
Public vs Private Health Insurance Coverage by Age in Deschutes County
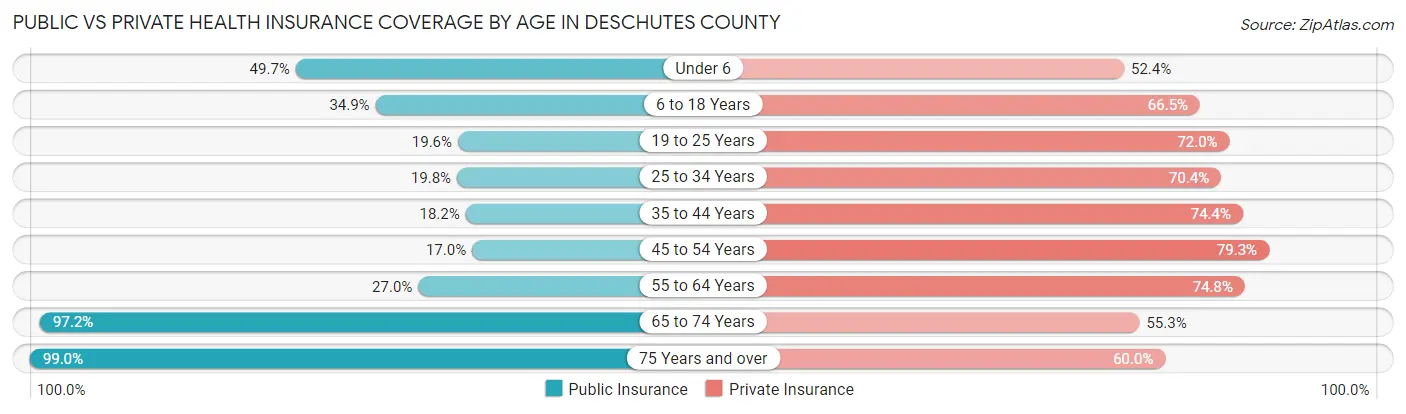
| Age Bracket | Public Insurance | Private Insurance |
| Under 6 | 6,049 (49.7%) | 6,377 (52.4%) |
| 6 to 18 Years | 9,962 (34.9%) | 18,980 (66.5%) |
| 19 to 25 Years | 2,749 (19.6%) | 10,099 (72.0%) |
| 25 to 34 Years | 4,705 (19.8%) | 16,768 (70.4%) |
| 35 to 44 Years | 4,944 (18.2%) | 20,267 (74.4%) |
| 45 to 54 Years | 4,243 (17.0%) | 19,828 (79.3%) |
| 55 to 64 Years | 7,328 (27.0%) | 20,340 (74.8%) |
| 65 to 74 Years | 24,965 (97.2%) | 14,201 (55.3%) |
| 75 Years and over | 14,698 (99.0%) | 8,911 (60.0%) |
| Total | 79,643 (40.1%) | 135,771 (68.4%) |
Disability Status by Sex by Age in Deschutes County
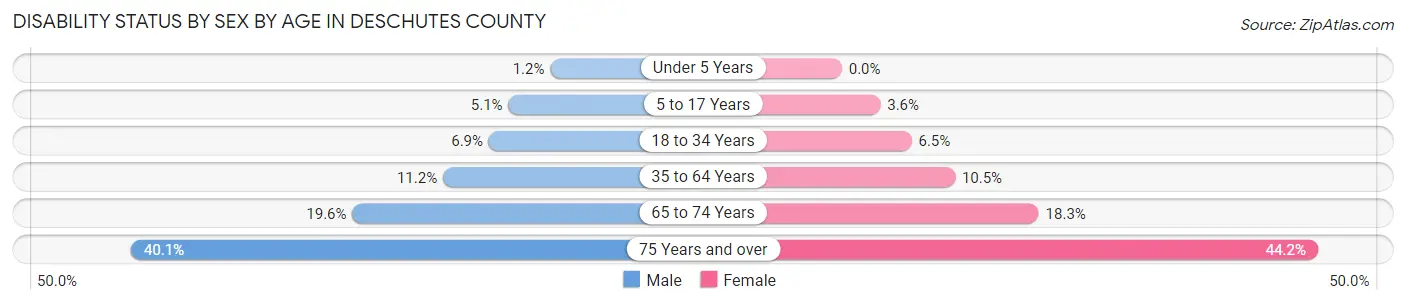
| Age Bracket | Male | Female |
| Under 5 Years | 59 (1.2%) | 0 (0.0%) |
| 5 to 17 Years | 771 (5.1%) | 500 (3.6%) |
| 18 to 34 Years | 1,420 (6.9%) | 1,251 (6.5%) |
| 35 to 64 Years | 4,385 (11.2%) | 4,217 (10.5%) |
| 65 to 74 Years | 2,425 (19.6%) | 2,432 (18.3%) |
| 75 Years and over | 2,780 (40.1%) | 3,497 (44.2%) |
Disability Class by Sex by Age in Deschutes County
Disability Class: Hearing Difficulty
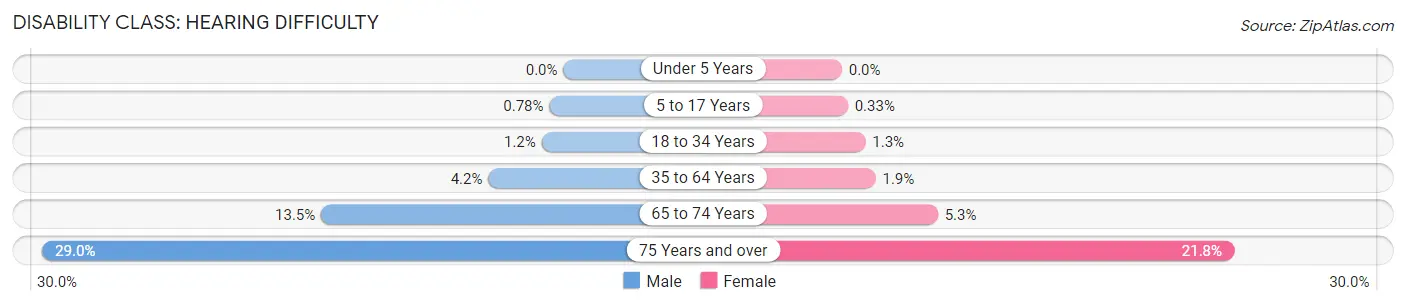
| Age Bracket | Male | Female |
| Under 5 Years | 0 (0.0%) | 0 (0.0%) |
| 5 to 17 Years | 118 (0.8%) | 46 (0.3%) |
| 18 to 34 Years | 248 (1.2%) | 254 (1.3%) |
| 35 to 64 Years | 1,642 (4.2%) | 757 (1.9%) |
| 65 to 74 Years | 1,671 (13.5%) | 711 (5.3%) |
| 75 Years and over | 2,010 (29.0%) | 1,728 (21.8%) |
Disability Class: Vision Difficulty
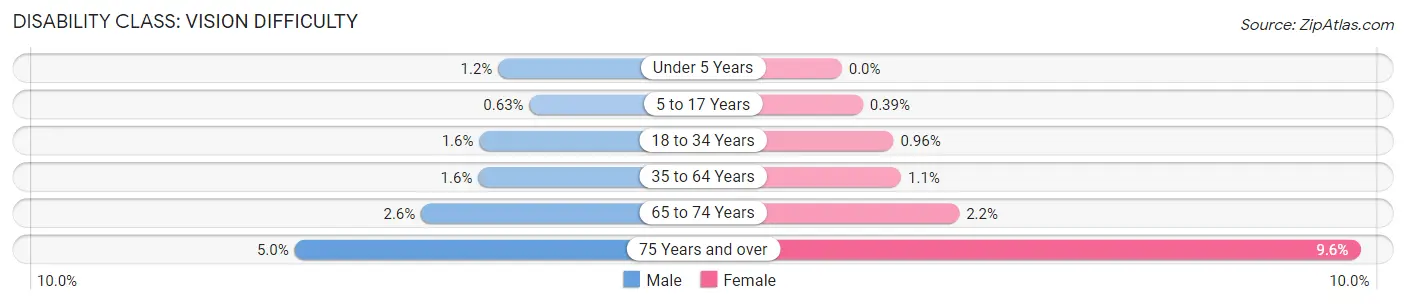
| Age Bracket | Male | Female |
| Under 5 Years | 59 (1.2%) | 0 (0.0%) |
| 5 to 17 Years | 95 (0.6%) | 55 (0.4%) |
| 18 to 34 Years | 320 (1.6%) | 186 (1.0%) |
| 35 to 64 Years | 622 (1.6%) | 440 (1.1%) |
| 65 to 74 Years | 327 (2.6%) | 290 (2.2%) |
| 75 Years and over | 346 (5.0%) | 762 (9.6%) |
Disability Class: Cognitive Difficulty
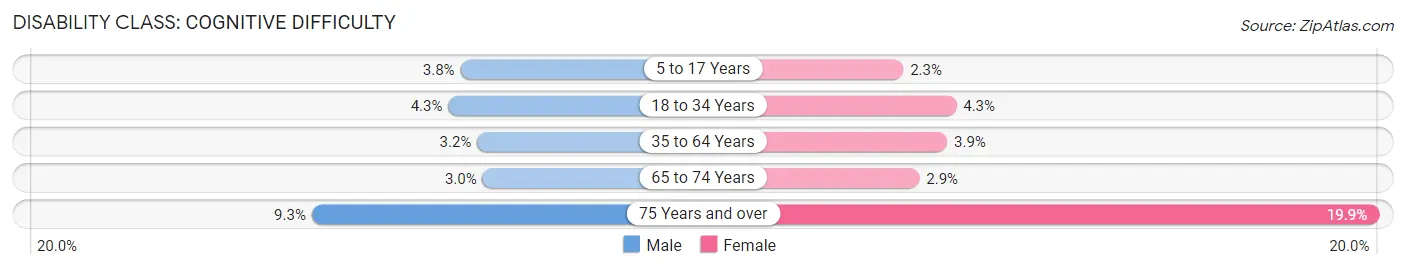
| Age Bracket | Male | Female |
| 5 to 17 Years | 577 (3.8%) | 320 (2.3%) |
| 18 to 34 Years | 876 (4.3%) | 822 (4.3%) |
| 35 to 64 Years | 1,258 (3.2%) | 1,571 (3.9%) |
| 65 to 74 Years | 372 (3.0%) | 383 (2.9%) |
| 75 Years and over | 647 (9.3%) | 1,579 (19.9%) |
Disability Class: Ambulatory Difficulty
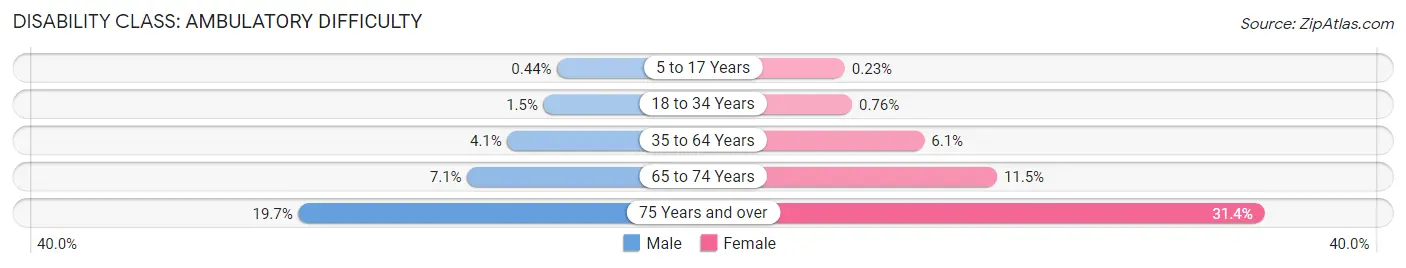
| Age Bracket | Male | Female |
| 5 to 17 Years | 66 (0.4%) | 32 (0.2%) |
| 18 to 34 Years | 297 (1.5%) | 148 (0.8%) |
| 35 to 64 Years | 1,624 (4.1%) | 2,464 (6.1%) |
| 65 to 74 Years | 882 (7.1%) | 1,533 (11.5%) |
| 75 Years and over | 1,362 (19.7%) | 2,485 (31.4%) |
Disability Class: Self-Care Difficulty
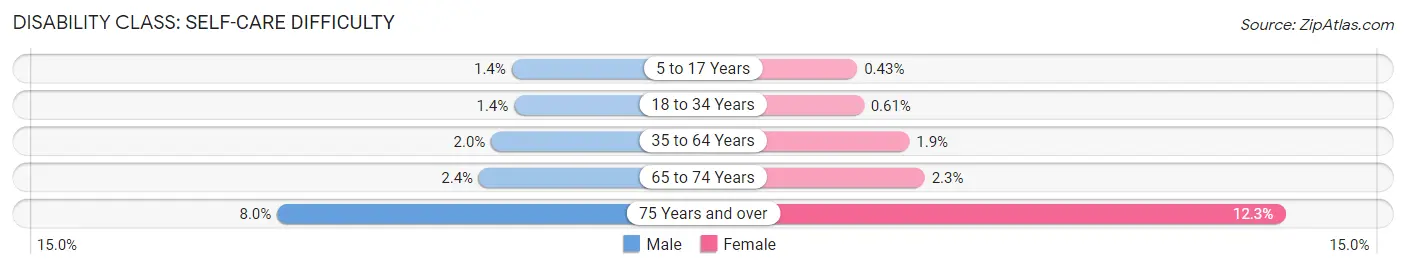
| Age Bracket | Male | Female |
| 5 to 17 Years | 217 (1.4%) | 60 (0.4%) |
| 18 to 34 Years | 281 (1.4%) | 118 (0.6%) |
| 35 to 64 Years | 791 (2.0%) | 756 (1.9%) |
| 65 to 74 Years | 291 (2.4%) | 308 (2.3%) |
| 75 Years and over | 552 (8.0%) | 977 (12.3%) |
Technology Access in Deschutes County
Computing Device Access in Deschutes County
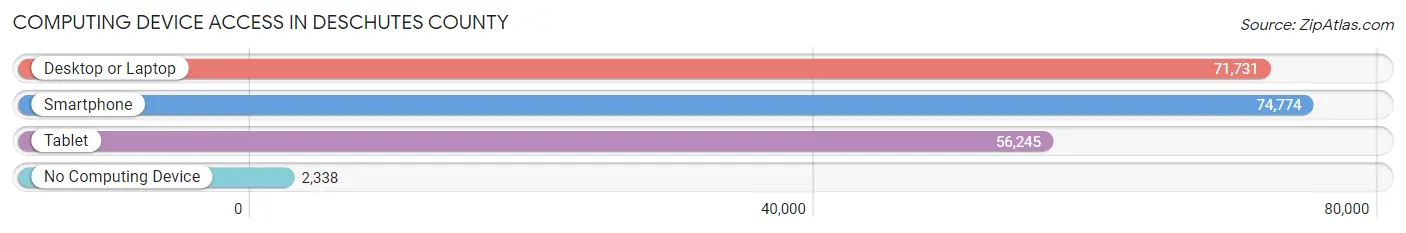
| Device Type | # Households | % Households |
| Desktop or Laptop | 71,731 | 88.0% |
| Smartphone | 74,774 | 91.8% |
| Tablet | 56,245 | 69.0% |
| No Computing Device | 2,338 | 2.9% |
| Total | 81,481 | 100.0% |
Internet Access in Deschutes County
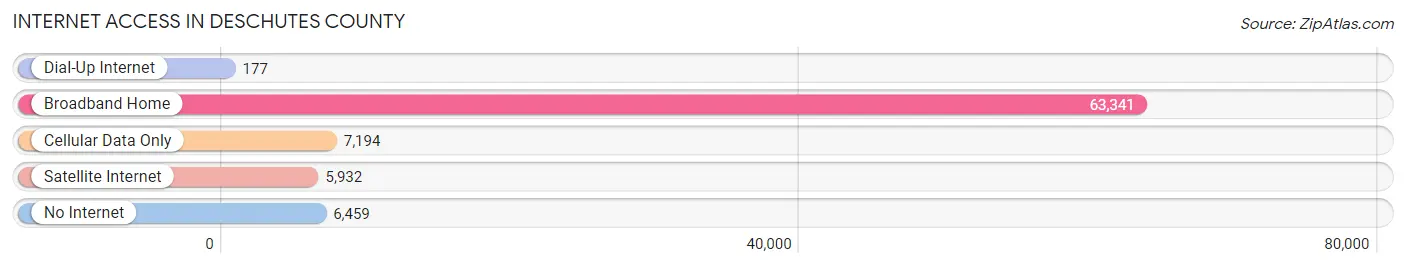
| Internet Type | # Households | % Households |
| Dial-Up Internet | 177 | 0.2% |
| Broadband Home | 63,341 | 77.7% |
| Cellular Data Only | 7,194 | 8.8% |
| Satellite Internet | 5,932 | 7.3% |
| No Internet | 6,459 | 7.9% |
| Total | 81,481 | 100.0% |
Deschutes County Summary
Deschutes County is located in the central part of the state of Oregon, in the Pacific Northwest region of the United States. It is bordered by Jefferson County to the north, Crook County to the east, Klamath County to the south, and Lane County to the west. The county seat is Bend, and the largest city is Redmond. Deschutes County covers an area of 3,055 square miles, making it the sixth largest county in Oregon.
History
The area that is now Deschutes County was originally inhabited by the Northern Paiute and Warm Springs tribes. The first non-native settlers arrived in the area in the 1860s, and the county was officially established in 1916. The county was named after the Deschutes River, which flows through the county.
The county experienced rapid growth in the early 20th century, due to the construction of the Oregon Trunk Railway and the development of the lumber industry. The county also became a popular tourist destination, due to its proximity to the Cascade Mountains and the Deschutes River.
Geography
Deschutes County is located in the central part of the state of Oregon, in the Pacific Northwest region of the United States. It is bordered by Jefferson County to the north, Crook County to the east, Klamath County to the south, and Lane County to the west. The county covers an area of 3,055 square miles, making it the sixth largest county in Oregon.
The county is located in the High Desert region of Oregon, and is characterized by a semi-arid climate. The county is home to several mountain ranges, including the Cascade Range, the Ochoco Mountains, and the Three Sisters. The Deschutes River flows through the county, and is a popular destination for fishing, rafting, and other recreational activities.
Economy
The economy of Deschutes County is largely based on tourism, agriculture, and manufacturing. The county is home to several ski resorts, including Mt. Bachelor and Hoodoo Ski Area, which attract visitors from around the world. The county is also home to several wineries, breweries, and distilleries, which produce a variety of craft beverages.
Agriculture is an important part of the county’s economy, with crops such as hay, wheat, and potatoes being grown in the area. The county is also home to several manufacturing companies, including Deschutes Brewery, which produces a variety of craft beers.
Demographics
As of the 2010 census, Deschutes County had a population of 177,204. The population is largely white (90.2%), with smaller percentages of Hispanic (4.7%), Native American (2.2%), and Asian (1.7%) residents. The median household income is $50,867, and the median home value is $269,400.
The county is home to several colleges and universities, including Central Oregon Community College, Oregon State University-Cascades, and the University of Oregon-Cascades. The county is also home to several museums, including the High Desert Museum and the Deschutes Historical Museum.
Conclusion
Deschutes County is located in the central part of the state of Oregon, in the Pacific Northwest region of the United States. It is bordered by Jefferson County to the north, Crook County to the east, Klamath County to the south, and Lane County to the west. The county covers an area of 3,055 square miles, making it the sixth largest county in Oregon. The county is home to several mountain ranges, including the Cascade Range, the Ochoco Mountains, and the Three Sisters. The economy of Deschutes County is largely based on tourism, agriculture, and manufacturing. As of the 2010 census, Deschutes County had a population of 177,204. The county is home to several colleges and universities, as well as several museums.
Common Questions
What is the Total Population of Deschutes County?
Total Population of Deschutes County is 199,352.
What is the Total Male Population of Deschutes County?
Total Male Population of Deschutes County is 99,597.
What is the Total Female Population of Deschutes County?
Total Female Population of Deschutes County is 99,755.
What is the Ratio of Males per 100 Females in Deschutes County?
There are 99.84 Males per 100 Females in Deschutes County.
What is the Ratio of Females per 100 Males in Deschutes County?
There are 100.16 Females per 100 Males in Deschutes County.
What is the Median Population Age in Deschutes County?
Median Population Age in Deschutes County is 42.6 Years.
What is the Average Family Size in Deschutes County
Average Family Size in Deschutes County is 2.9 People.
What is the Average Household Size in Deschutes County
Average Household Size in Deschutes County is 2.4 People.
What is Per Capita Income in Deschutes County?
Per Capita income in Deschutes County is $46,765.
What is the Median Family Income in Deschutes County?
Median Family Income in Deschutes County is $99,728.
What is the Median Household income in Deschutes County?
Median Household Income in Deschutes County is $82,042.
What is Income or Wage Gap in Deschutes County?
Income or Wage Gap in Deschutes County is 30.1%.
Women in Deschutes County earn 69.9 cents for every dollar earned by a man.
What is Family Income Deficit in Deschutes County?
Family Income Deficit in Deschutes County is $11,592.
Families that are below poverty line in Deschutes County earn $11,592 less on average than the poverty threshold level.
What is Inequality or Gini Index in Deschutes County?
Inequality or Gini Index in Deschutes County is 0.46.
How Large is the Labor Force in Deschutes County?
There are 104,239 People in the Labor Forcein in Deschutes County.
What is the Percentage of People in the Labor Force in Deschutes County?
63.2% of People are in the Labor Force in Deschutes County.
What is the Unemployment Rate in Deschutes County?
Unemployment Rate in Deschutes County is 5.2%.