Curry County, OR
Curry County Map
Curry County Overview
23,404
TOTAL POPULATION
11,530
MALE POPULATION
11,874
FEMALE POPULATION
97.10
MALES / 100 FEMALES
102.98
FEMALES / 100 MALES
56.8
MEDIAN AGE
2.4
AVG FAMILY SIZE
2.1
AVG HOUSEHOLD SIZE
$38,214
PER CAPITA INCOME
$71,283
AVG FAMILY INCOME
$64,300
AVG HOUSEHOLD INCOME
40.4%
WAGE / INCOME GAP [ % ]
59.6¢/ $1
WAGE / INCOME GAP [ $ ]
$4,616
FAMILY INCOME DEFICIT
0.44
INEQUALITY / GINI INDEX
9,519
LABOR FORCE [ PEOPLE ]
46.6%
PERCENT IN LABOR FORCE
7.2%
UNEMPLOYMENT RATE
Curry County Area Codes
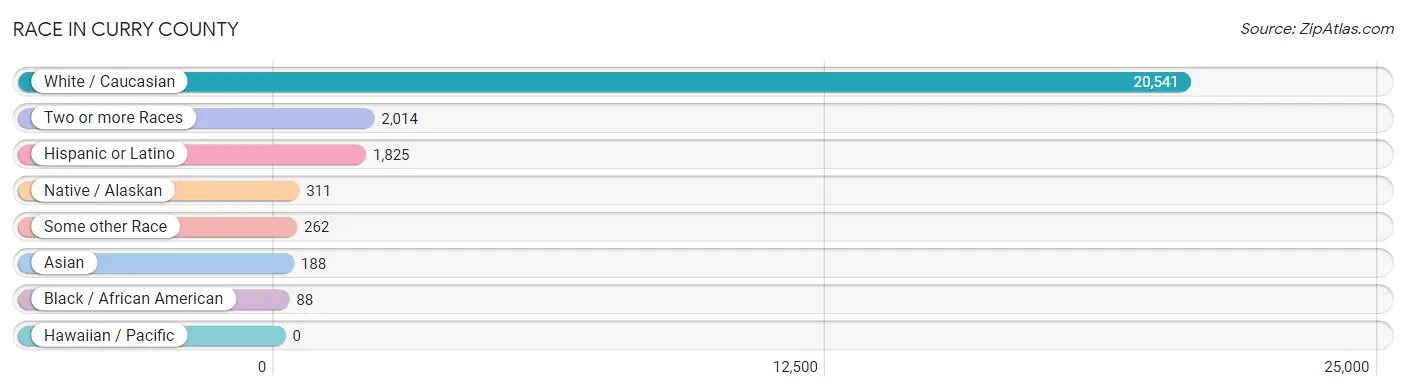
Race in Curry County
The most populous races in Curry County are White / Caucasian (20,541 | 87.8%), Two or more Races (2,014 | 8.6%), and Hispanic or Latino (1,825 | 7.8%).
| Race | # Population | % Population |
| Asian | 188 | 0.8% |
| Black / African American | 88 | 0.4% |
| Hawaiian / Pacific | 0 | 0.0% |
| Hispanic or Latino | 1,825 | 7.8% |
| Native / Alaskan | 311 | 1.3% |
| White / Caucasian | 20,541 | 87.8% |
| Two or more Races | 2,014 | 8.6% |
| Some other Race | 262 | 1.1% |
| Total | 23,404 | 100.0% |
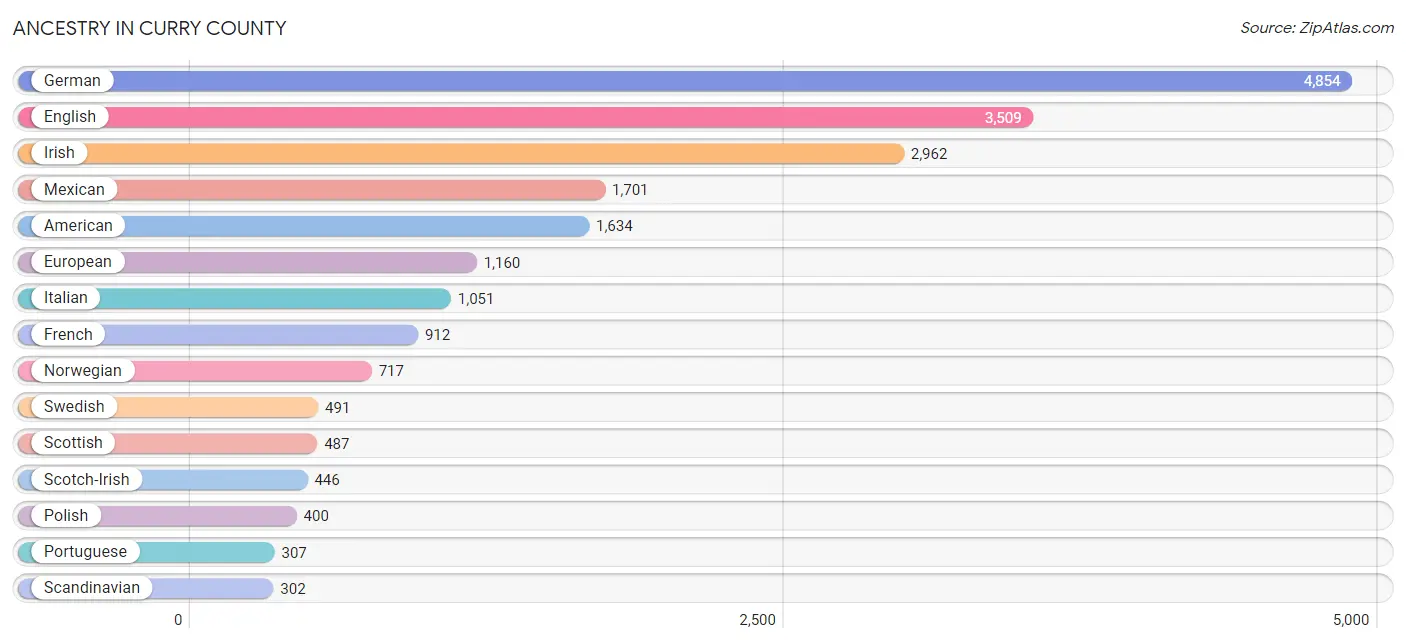
Ancestry in Curry County
The most populous ancestries reported in Curry County are German (4,854 | 20.7%), English (3,509 | 15.0%), Irish (2,962 | 12.7%), Mexican (1,701 | 7.3%), and American (1,634 | 7.0%), together accounting for 62.6% of all Curry County residents.
| Ancestry | # Population | % Population |
| Afghan | 10 | 0.0% |
| African | 1 | 0.0% |
| American | 1,634 | 7.0% |
| Apache | 78 | 0.3% |
| Arab | 14 | 0.1% |
| Australian | 18 | 0.1% |
| Austrian | 99 | 0.4% |
| Basque | 3 | 0.0% |
| Bhutanese | 13 | 0.1% |
| Blackfeet | 11 | 0.1% |
| British | 100 | 0.4% |
| Bulgarian | 77 | 0.3% |
| Burmese | 30 | 0.1% |
| Cambodian | 42 | 0.2% |
| Canadian | 56 | 0.2% |
| Central American | 5 | 0.0% |
| Central American Indian | 5 | 0.0% |
| Cherokee | 289 | 1.2% |
| Cheyenne | 48 | 0.2% |
| Chickasaw | 78 | 0.3% |
| Choctaw | 3 | 0.0% |
| Colombian | 15 | 0.1% |
| Cree | 38 | 0.2% |
| Croatian | 156 | 0.7% |
| Czech | 111 | 0.5% |
| Czechoslovakian | 3 | 0.0% |
| Danish | 241 | 1.0% |
| Dutch | 154 | 0.7% |
| Eastern European | 16 | 0.1% |
| English | 3,509 | 15.0% |
| European | 1,160 | 5.0% |
| Finnish | 59 | 0.3% |
| French | 912 | 3.9% |
| French Canadian | 173 | 0.7% |
| German | 4,854 | 20.7% |
| Greek | 248 | 1.1% |
| Guyanese | 1 | 0.0% |
| Hungarian | 47 | 0.2% |
| Indian (Asian) | 79 | 0.3% |
| Irish | 2,962 | 12.7% |
| Iroquois | 9 | 0.0% |
| Italian | 1,051 | 4.5% |
| Korean | 89 | 0.4% |
| Laotian | 8 | 0.0% |
| Lebanese | 2 | 0.0% |
| Lithuanian | 57 | 0.2% |
| Luxembourger | 45 | 0.2% |
| Mexican | 1,701 | 7.3% |
| Mexican American Indian | 112 | 0.5% |
| Native Hawaiian | 27 | 0.1% |
| Navajo | 126 | 0.5% |
| Northern European | 172 | 0.7% |
| Norwegian | 717 | 3.1% |
| Paiute | 189 | 0.8% |
| Pima | 11 | 0.1% |
| Polish | 400 | 1.7% |
| Portuguese | 307 | 1.3% |
| Pueblo | 7 | 0.0% |
| Puerto Rican | 60 | 0.3% |
| Russian | 51 | 0.2% |
| Salvadoran | 5 | 0.0% |
| Scandinavian | 302 | 1.3% |
| Scotch-Irish | 446 | 1.9% |
| Scottish | 487 | 2.1% |
| Shoshone | 27 | 0.1% |
| Slavic | 14 | 0.1% |
| Slovak | 71 | 0.3% |
| Slovene | 22 | 0.1% |
| South American | 15 | 0.1% |
| Spaniard | 12 | 0.1% |
| Spanish | 32 | 0.1% |
| Subsaharan African | 1 | 0.0% |
| Swedish | 491 | 2.1% |
| Swiss | 66 | 0.3% |
| Thai | 8 | 0.0% |
| Ukrainian | 7 | 0.0% |
| Vietnamese | 15 | 0.1% |
| Welsh | 121 | 0.5% |
| Yakama | 14 | 0.1% | View All 79 Rows |
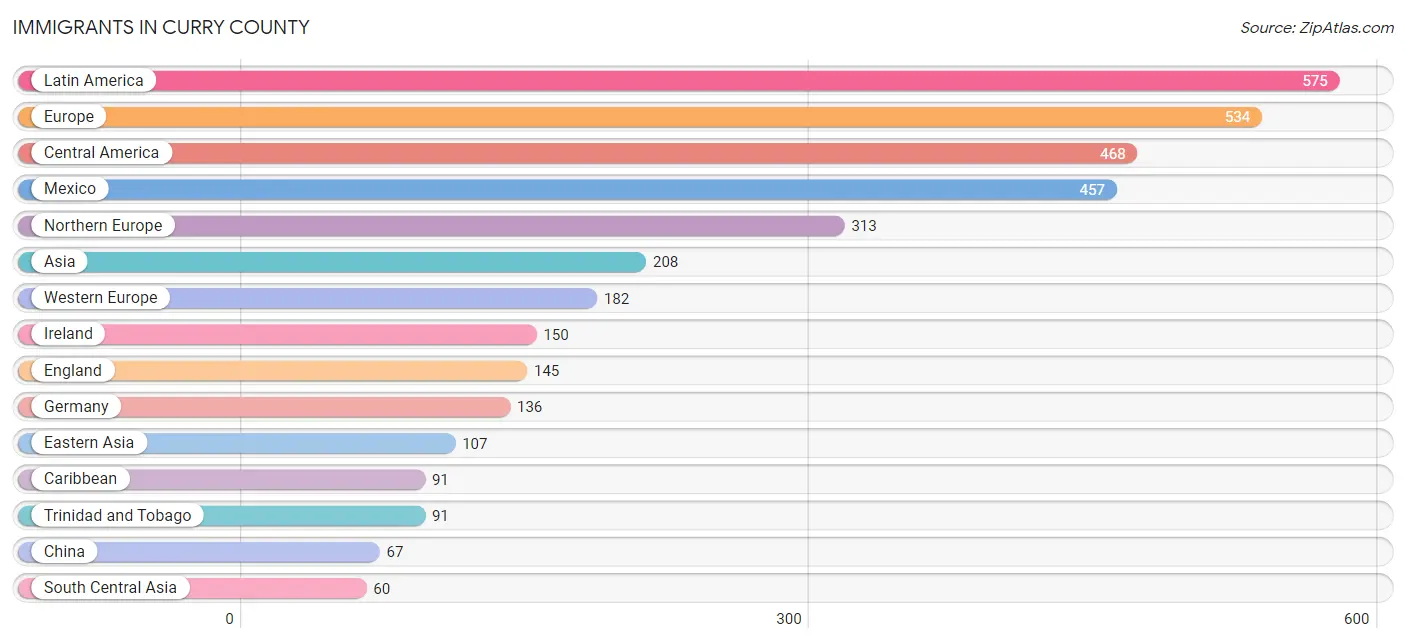
Immigrants in Curry County
The most numerous immigrant groups reported in Curry County came from Latin America (575 | 2.5%), Europe (534 | 2.3%), Central America (468 | 2.0%), Mexico (457 | 1.9%), and Northern Europe (313 | 1.3%), together accounting for 10.0% of all Curry County residents.
| Immigration Origin | # Population | % Population |
| Afghanistan | 18 | 0.1% |
| Asia | 208 | 0.9% |
| Bangladesh | 15 | 0.1% |
| Bulgaria | 25 | 0.1% |
| Canada | 46 | 0.2% |
| Caribbean | 91 | 0.4% |
| Central America | 468 | 2.0% |
| China | 67 | 0.3% |
| Colombia | 15 | 0.1% |
| Eastern Asia | 107 | 0.5% |
| Eastern Europe | 33 | 0.1% |
| El Salvador | 5 | 0.0% |
| England | 145 | 0.6% |
| Europe | 534 | 2.3% |
| France | 27 | 0.1% |
| Germany | 136 | 0.6% |
| Guatemala | 6 | 0.0% |
| Guyana | 1 | 0.0% |
| Hungary | 8 | 0.0% |
| Iran | 27 | 0.1% |
| Ireland | 150 | 0.6% |
| Italy | 6 | 0.0% |
| Japan | 27 | 0.1% |
| Korea | 13 | 0.1% |
| Latin America | 575 | 2.5% |
| Mexico | 457 | 1.9% |
| Netherlands | 19 | 0.1% |
| Northern Europe | 313 | 1.3% |
| Philippines | 41 | 0.2% |
| South America | 16 | 0.1% |
| South Central Asia | 60 | 0.3% |
| South Eastern Asia | 41 | 0.2% |
| Southern Europe | 6 | 0.0% |
| Trinidad and Tobago | 91 | 0.4% |
| Western Europe | 182 | 0.8% | View All 35 Rows |
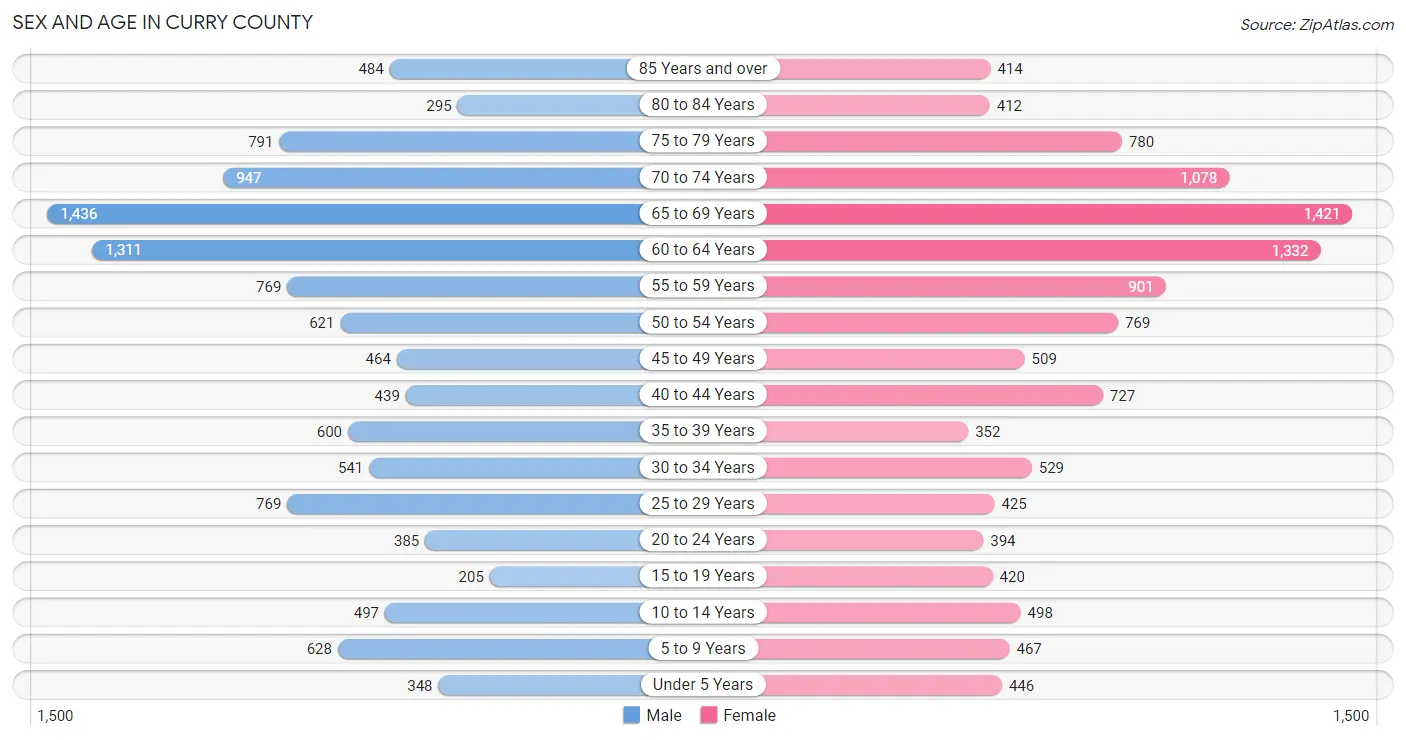
Sex and Age in Curry County
Sex and Age in Curry County
The most populous age groups in Curry County are 65 to 69 Years (1,436 | 12.4%) for men and 65 to 69 Years (1,421 | 12.0%) for women.
| Age Bracket | Male | Female |
| Under 5 Years | 348 (3.0%) | 446 (3.8%) |
| 5 to 9 Years | 628 (5.4%) | 467 (3.9%) |
| 10 to 14 Years | 497 (4.3%) | 498 (4.2%) |
| 15 to 19 Years | 205 (1.8%) | 420 (3.5%) |
| 20 to 24 Years | 385 (3.3%) | 394 (3.3%) |
| 25 to 29 Years | 769 (6.7%) | 425 (3.6%) |
| 30 to 34 Years | 541 (4.7%) | 529 (4.5%) |
| 35 to 39 Years | 600 (5.2%) | 352 (3.0%) |
| 40 to 44 Years | 439 (3.8%) | 727 (6.1%) |
| 45 to 49 Years | 464 (4.0%) | 509 (4.3%) |
| 50 to 54 Years | 621 (5.4%) | 769 (6.5%) |
| 55 to 59 Years | 769 (6.7%) | 901 (7.6%) |
| 60 to 64 Years | 1,311 (11.4%) | 1,332 (11.2%) |
| 65 to 69 Years | 1,436 (12.4%) | 1,421 (12.0%) |
| 70 to 74 Years | 947 (8.2%) | 1,078 (9.1%) |
| 75 to 79 Years | 791 (6.9%) | 780 (6.6%) |
| 80 to 84 Years | 295 (2.6%) | 412 (3.5%) |
| 85 Years and over | 484 (4.2%) | 414 (3.5%) |
| Total | 11,530 (100.0%) | 11,874 (100.0%) |
Families and Households in Curry County
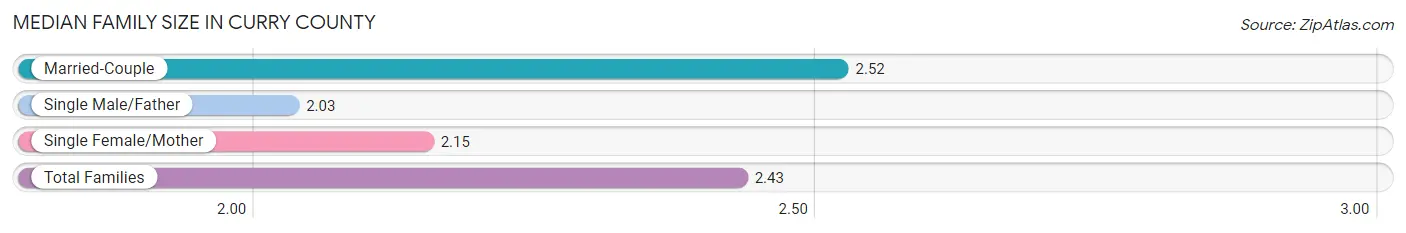
Median Family Size in Curry County
The median family size in Curry County is 2.43 persons per family, with married-couple families (5,843 | 77.4%) accounting for the largest median family size of 2.52 persons per family. On the other hand, single male/father families (555 | 7.3%) represent the smallest median family size with 2.03 persons per family.
| Family Type | # Families | Family Size |
| Married-Couple | 5,843 (77.4%) | 2.52 |
| Single Male/Father | 555 (7.3%) | 2.03 |
| Single Female/Mother | 1,154 (15.3%) | 2.15 |
| Total Families | 7,552 (100.0%) | 2.43 |
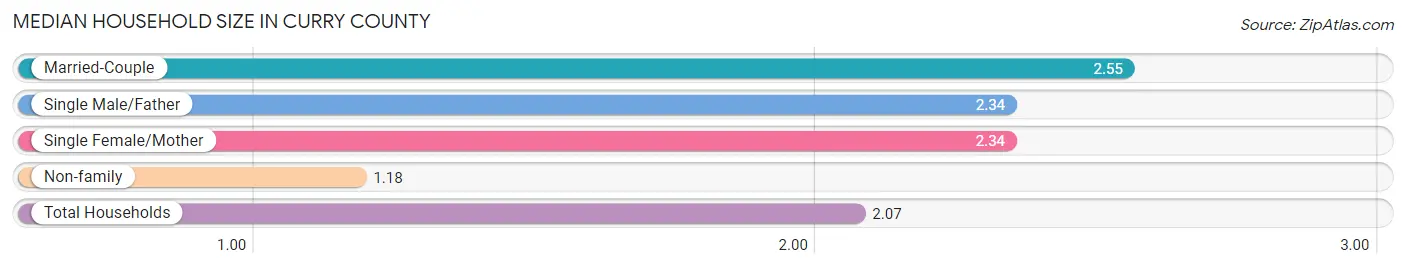
Median Household Size in Curry County
The median household size in Curry County is 2.07 persons per household, with married-couple households (5,843 | 52.4%) accounting for the largest median household size of 2.55 persons per household. non-family households (3,596 | 32.3%) represent the smallest median household size with 1.18 persons per household.
| Household Type | # Households | Household Size |
| Married-Couple | 5,843 (52.4%) | 2.55 |
| Single Male/Father | 555 (5.0%) | 2.34 |
| Single Female/Mother | 1,154 (10.3%) | 2.34 |
| Non-family | 3,596 (32.3%) | 1.18 |
| Total Households | 11,148 (100.0%) | 2.07 |
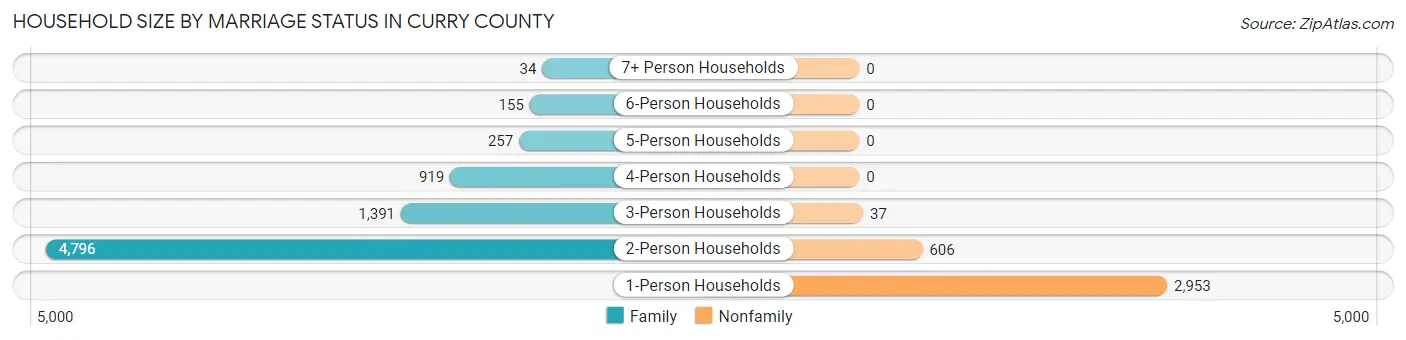
Household Size by Marriage Status in Curry County
Out of a total of 11,148 households in Curry County, 7,552 (67.7%) are family households, while 3,596 (32.3%) are nonfamily households. The most numerous type of family households are 2-person households, comprising 4,796, and the most common type of nonfamily households are 1-person households, comprising 2,953.
| Household Size | Family Households | Nonfamily Households |
| 1-Person Households | - | 2,953 (26.5%) |
| 2-Person Households | 4,796 (43.0%) | 606 (5.4%) |
| 3-Person Households | 1,391 (12.5%) | 37 (0.3%) |
| 4-Person Households | 919 (8.2%) | 0 (0.0%) |
| 5-Person Households | 257 (2.3%) | 0 (0.0%) |
| 6-Person Households | 155 (1.4%) | 0 (0.0%) |
| 7+ Person Households | 34 (0.3%) | 0 (0.0%) |
| Total | 7,552 (67.7%) | 3,596 (32.3%) |
Female Fertility in Curry County
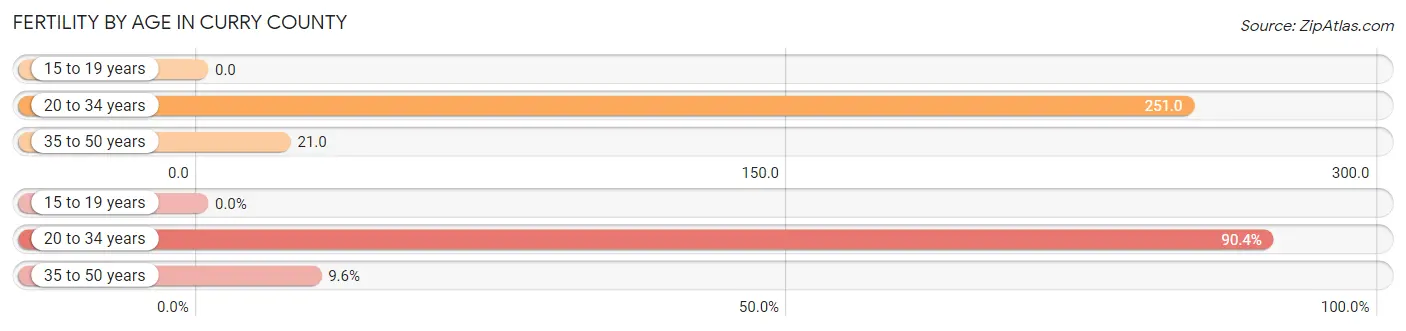
Fertility by Age in Curry County
Average fertility rate in Curry County is 109.0 births per 1,000 women. Women in the age bracket of 20 to 34 years have the highest fertility rate with 251.0 births per 1,000 women. Women in the age bracket of 20 to 34 years acount for 90.4% of all women with births.
| Age Bracket | Women with Births | Births / 1,000 Women |
| 15 to 19 years | 0 (0.0%) | 0.0 |
| 20 to 34 years | 339 (90.4%) | 251.0 |
| 35 to 50 years | 36 (9.6%) | 21.0 |
| Total | 375 (100.0%) | 109.0 |
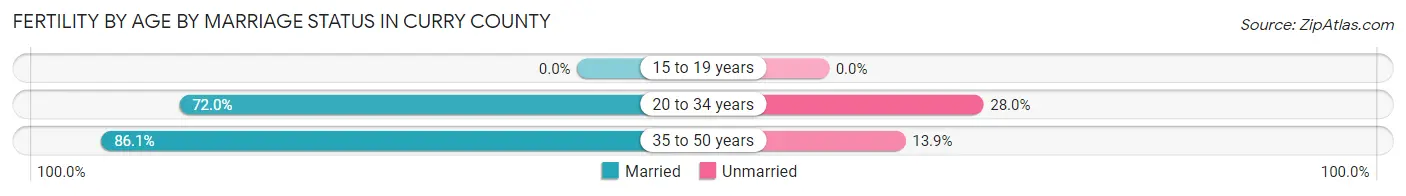
Fertility by Age by Marriage Status in Curry County
73.3% of women with births (375) in Curry County are married. The highest percentage of unmarried women with births falls into 20 to 34 years age bracket with 28.0% of them unmarried at the time of birth, while the lowest percentage of unmarried women with births belong to 35 to 50 years age bracket with 13.9% of them unmarried.
| Age Bracket | Married | Unmarried |
| 15 to 19 years | 0 (0.0%) | 0 (0.0%) |
| 20 to 34 years | 244 (72.0%) | 95 (28.0%) |
| 35 to 50 years | 31 (86.1%) | 5 (13.9%) |
| Total | 275 (73.3%) | 100 (26.7%) |
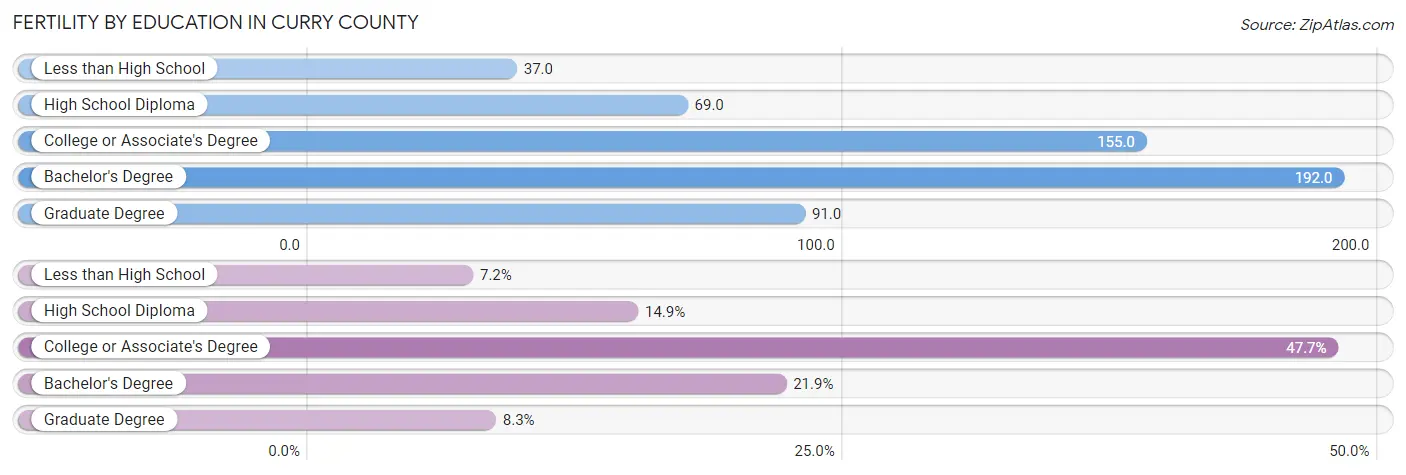
Fertility by Education in Curry County
Average fertility rate in Curry County is 109.0 births per 1,000 women. Women with the education attainment of bachelor's degree have the highest fertility rate of 192.0 births per 1,000 women, while women with the education attainment of less than high school have the lowest fertility at 37.0 births per 1,000 women. Women with the education attainment of college or associate's degree represent 47.7% of all women with births.
| Educational Attainment | Women with Births | Births / 1,000 Women |
| Less than High School | 27 (7.2%) | 37.0 |
| High School Diploma | 56 (14.9%) | 69.0 |
| College or Associate's Degree | 179 (47.7%) | 155.0 |
| Bachelor's Degree | 82 (21.9%) | 192.0 |
| Graduate Degree | 31 (8.3%) | 91.0 |
| Total | 375 (100.0%) | 109.0 |
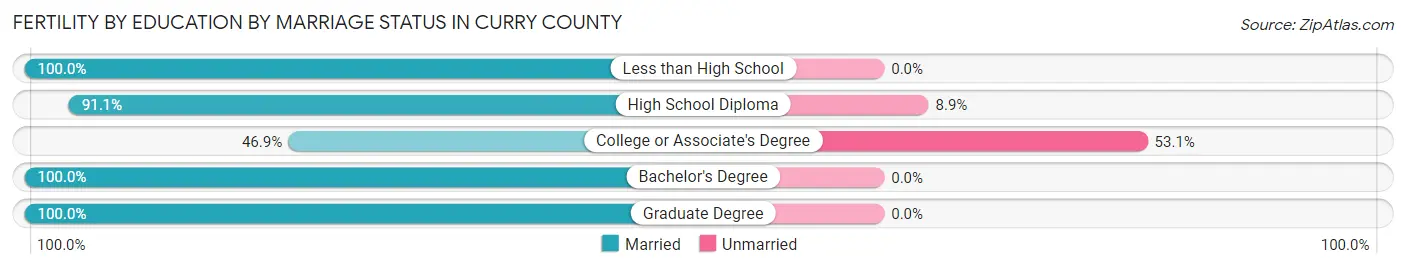
Fertility by Education by Marriage Status in Curry County
26.7% of women with births in Curry County are unmarried. Women with the educational attainment of less than high school are most likely to be married with 100.0% of them married at childbirth, while women with the educational attainment of college or associate's degree are least likely to be married with 53.1% of them unmarried at childbirth.
| Educational Attainment | Married | Unmarried |
| Less than High School | 27 (100.0%) | 0 (0.0%) |
| High School Diploma | 51 (91.1%) | 5 (8.9%) |
| College or Associate's Degree | 84 (46.9%) | 95 (53.1%) |
| Bachelor's Degree | 82 (100.0%) | 0 (0.0%) |
| Graduate Degree | 31 (100.0%) | 0 (0.0%) |
| Total | 275 (73.3%) | 100 (26.7%) |
Income in Curry County
Income Overview in Curry County
Per Capita Income in Curry County is $38,214, while median incomes of families and households are $71,283 and $64,300 respectively.
| Characteristic | Number | Measure |
| Per Capita Income | 23,404 | $38,214 |
| Median Family Income | 7,552 | $71,283 |
| Mean Family Income | 7,552 | $93,637 |
| Median Household Income | 11,148 | $64,300 |
| Mean Household Income | 11,148 | $81,737 |
| Income Deficit | 7,552 | $4,616 |
| Wage / Income Gap (%) | 23,404 | 40.40% |
| Wage / Income Gap ($) | 23,404 | 59.60¢ per $1 |
| Gini / Inequality Index | 23,404 | 0.44 |
Earnings by Sex in Curry County
Average Earnings in Curry County are $37,989, $46,713 for men and $27,839 for women, a difference of 40.4%.
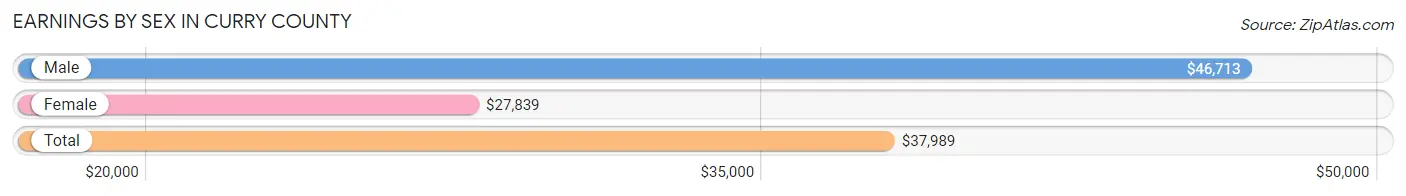
| Sex | Number | Average Earnings |
| Male | 5,459 (54.6%) | $46,713 |
| Female | 4,540 (45.4%) | $27,839 |
| Total | 9,999 (100.0%) | $37,989 |
Earnings by Sex by Income Bracket in Curry County
The most common earnings brackets in Curry County are $100,000+ for men (1,182 | 21.6%) and $100,000+ for women (396 | 8.7%).
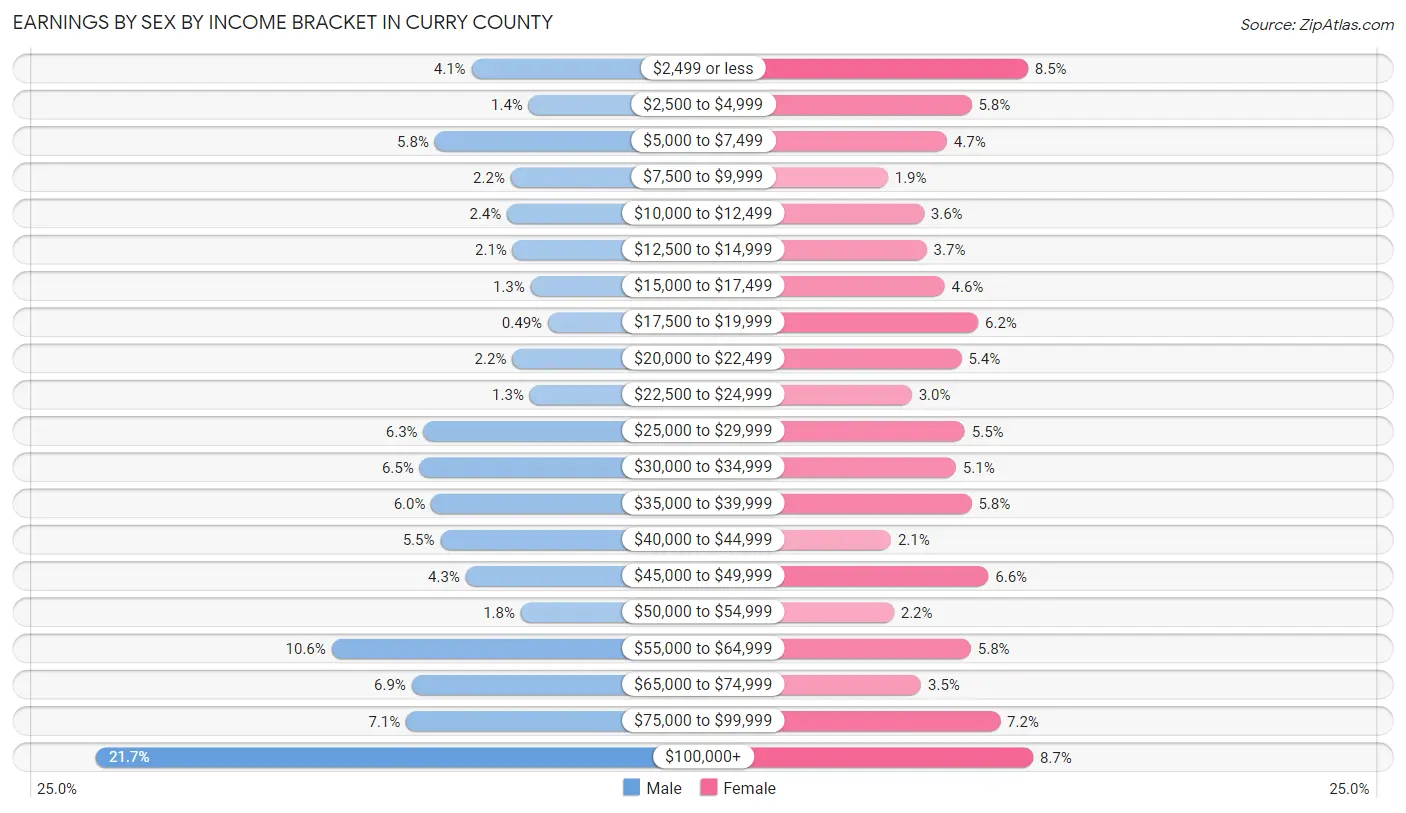
| Income | Male | Female |
| $2,499 or less | 222 (4.1%) | 385 (8.5%) |
| $2,500 to $4,999 | 76 (1.4%) | 265 (5.8%) |
| $5,000 to $7,499 | 316 (5.8%) | 213 (4.7%) |
| $7,500 to $9,999 | 122 (2.2%) | 87 (1.9%) |
| $10,000 to $12,499 | 131 (2.4%) | 164 (3.6%) |
| $12,500 to $14,999 | 117 (2.1%) | 170 (3.7%) |
| $15,000 to $17,499 | 71 (1.3%) | 208 (4.6%) |
| $17,500 to $19,999 | 27 (0.5%) | 279 (6.1%) |
| $20,000 to $22,499 | 118 (2.2%) | 244 (5.4%) |
| $22,500 to $24,999 | 73 (1.3%) | 138 (3.0%) |
| $25,000 to $29,999 | 345 (6.3%) | 251 (5.5%) |
| $30,000 to $34,999 | 355 (6.5%) | 232 (5.1%) |
| $35,000 to $39,999 | 325 (5.9%) | 265 (5.8%) |
| $40,000 to $44,999 | 302 (5.5%) | 94 (2.1%) |
| $45,000 to $49,999 | 237 (4.3%) | 301 (6.6%) |
| $50,000 to $54,999 | 96 (1.8%) | 100 (2.2%) |
| $55,000 to $64,999 | 580 (10.6%) | 264 (5.8%) |
| $65,000 to $74,999 | 375 (6.9%) | 158 (3.5%) |
| $75,000 to $99,999 | 389 (7.1%) | 326 (7.2%) |
| $100,000+ | 1,182 (21.6%) | 396 (8.7%) |
| Total | 5,459 (100.0%) | 4,540 (100.0%) |
Earnings by Sex by Educational Attainment in Curry County
Average earnings in Curry County are $55,921 for men and $29,254 for women, a difference of 47.7%. Men with an educational attainment of bachelor's degree enjoy the highest average annual earnings of $67,833, while those with less than high school education earn the least with $36,724. Women with an educational attainment of graduate degree earn the most with the average annual earnings of $67,979, while those with less than high school education have the smallest earnings of $12,857.
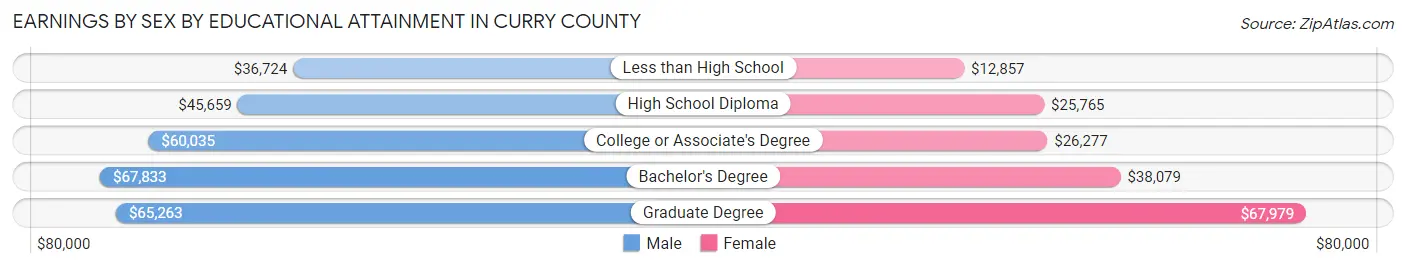
| Educational Attainment | Male Income | Female Income |
| Less than High School | $36,724 | $12,857 |
| High School Diploma | $45,659 | $25,765 |
| College or Associate's Degree | $60,035 | $26,277 |
| Bachelor's Degree | $67,833 | $38,079 |
| Graduate Degree | $65,263 | $67,979 |
| Total | $55,921 | $29,254 |
Family Income in Curry County
Family Income Brackets in Curry County
According to the Curry County family income data, there are 1,533 families falling into the $50,000 to $74,999 income range, which is the most common income bracket and makes up 20.3% of all families. Conversely, the less than $10,000 income bracket is the least frequent group with only 53 families (0.7%) belonging to this category.
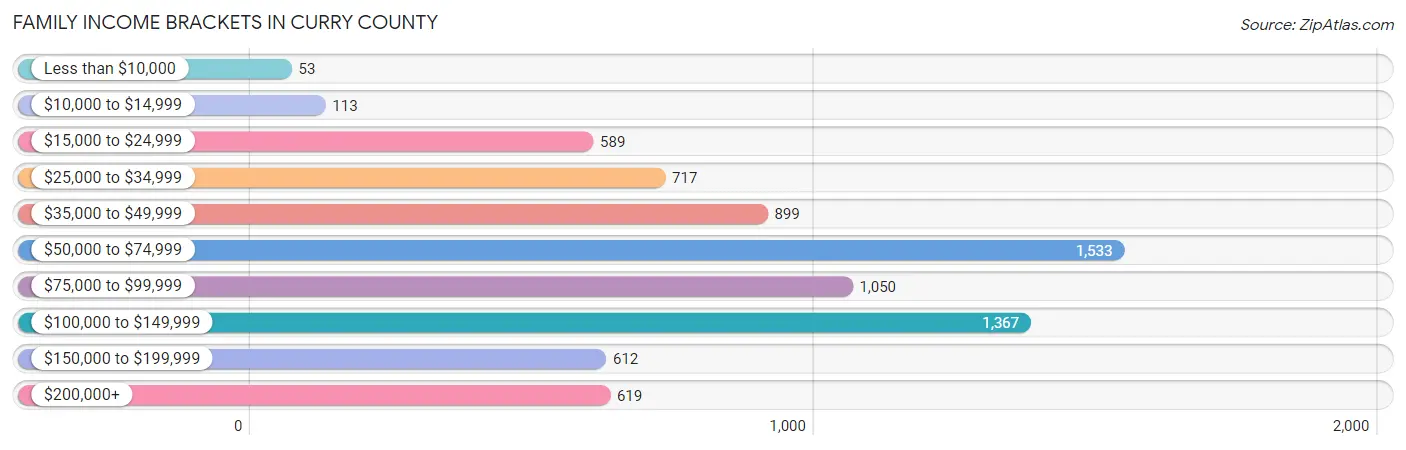
| Income Bracket | # Families | % Families |
| Less than $10,000 | 53 | 0.7% |
| $10,000 to $14,999 | 113 | 1.5% |
| $15,000 to $24,999 | 589 | 7.8% |
| $25,000 to $34,999 | 717 | 9.5% |
| $35,000 to $49,999 | 899 | 11.9% |
| $50,000 to $74,999 | 1,533 | 20.3% |
| $75,000 to $99,999 | 1,050 | 13.9% |
| $100,000 to $149,999 | 1,367 | 18.1% |
| $150,000 to $199,999 | 612 | 8.1% |
| $200,000+ | 619 | 8.2% |
Family Income by Famaliy Size in Curry County
5-person families (230 | 3.0%) account for the highest median family income in Curry County with $111,719 per family, while 2-person families (5,204 | 68.9%) have the highest median income of $35,038 per family member.
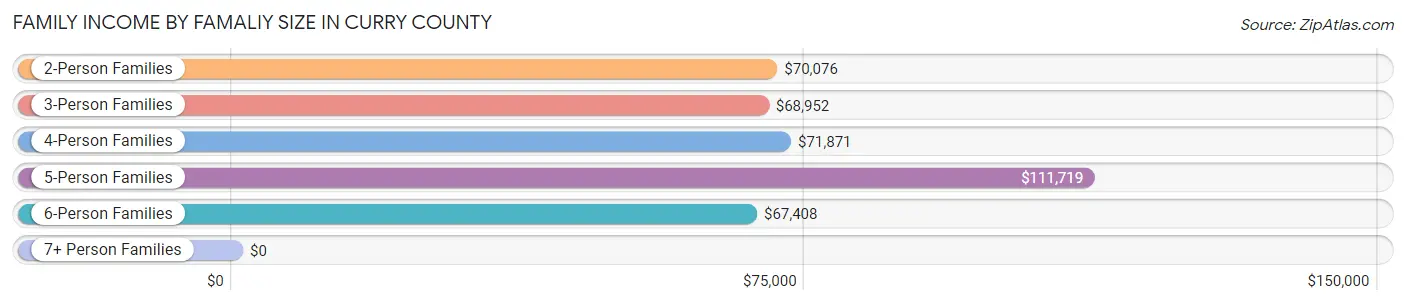
| Income Bracket | # Families | Median Income |
| 2-Person Families | 5,204 (68.9%) | $70,076 |
| 3-Person Families | 1,228 (16.3%) | $68,952 |
| 4-Person Families | 755 (10.0%) | $71,871 |
| 5-Person Families | 230 (3.0%) | $111,719 |
| 6-Person Families | 135 (1.8%) | $67,408 |
| 7+ Person Families | 0 (0.0%) | $0 |
| Total | 7,552 (100.0%) | $71,283 |
Family Income by Number of Earners in Curry County
The median family income in Curry County is $71,283, with families comprising 2 earners (2,178) having the highest median family income of $115,965, while families with no earners (2,534) have the lowest median family income of $55,388, accounting for 28.8% and 33.6% of families, respectively.
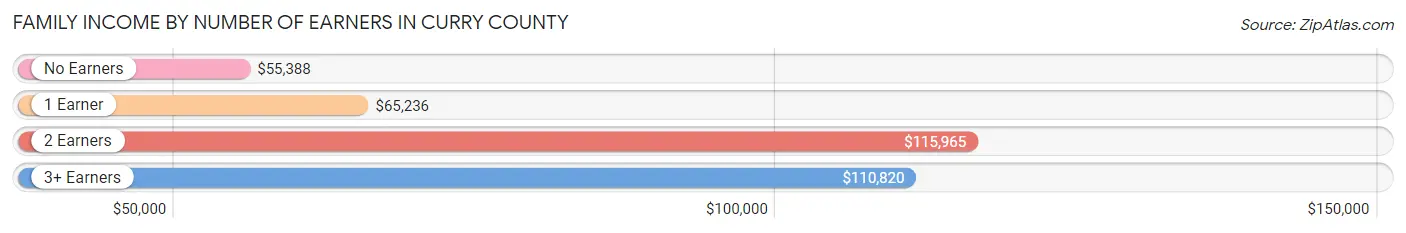
| Number of Earners | # Families | Median Income |
| No Earners | 2,534 (33.6%) | $55,388 |
| 1 Earner | 2,377 (31.5%) | $65,236 |
| 2 Earners | 2,178 (28.8%) | $115,965 |
| 3+ Earners | 463 (6.1%) | $110,820 |
| Total | 7,552 (100.0%) | $71,283 |
Household Income in Curry County
Household Income Brackets in Curry County
With 2,051 households falling in the category, the $50,000 to $74,999 income range is the most frequent in Curry County, accounting for 18.4% of all households. In contrast, only 323 households (2.9%) fall into the less than $10,000 income bracket, making it the least populous group.
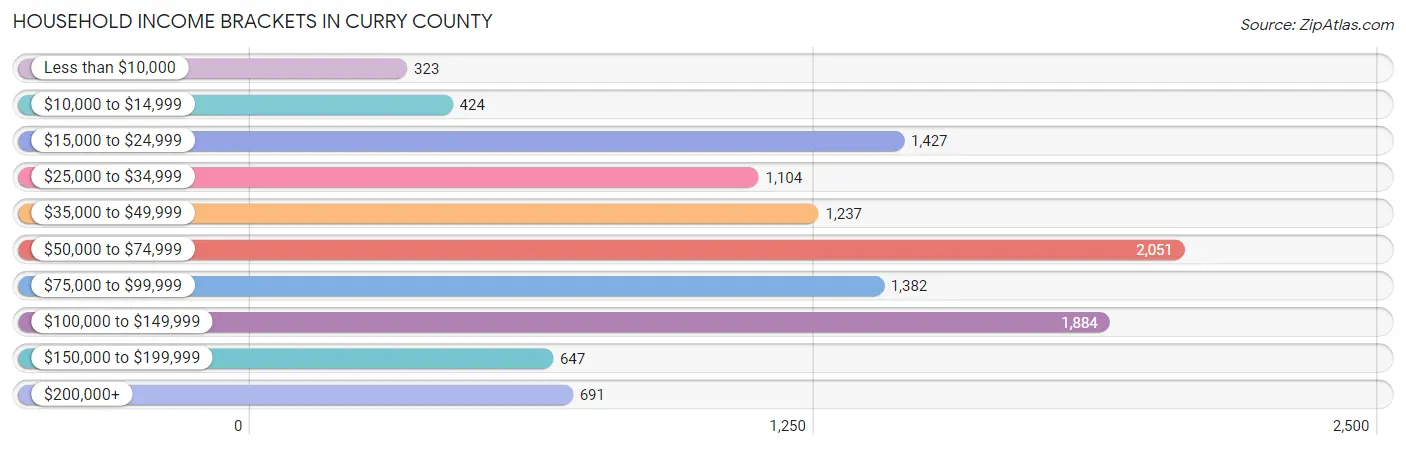
| Income Bracket | # Households | % Households |
| Less than $10,000 | 323 | 2.9% |
| $10,000 to $14,999 | 424 | 3.8% |
| $15,000 to $24,999 | 1,427 | 12.8% |
| $25,000 to $34,999 | 1,104 | 9.9% |
| $35,000 to $49,999 | 1,237 | 11.1% |
| $50,000 to $74,999 | 2,051 | 18.4% |
| $75,000 to $99,999 | 1,382 | 12.4% |
| $100,000 to $149,999 | 1,884 | 16.9% |
| $150,000 to $199,999 | 647 | 5.8% |
| $200,000+ | 691 | 6.2% |
Household Income by Householder Age in Curry County
The median household income in Curry County is $64,300, with the highest median household income of $74,662 found in the 45 to 64 years age bracket for the primary householder. A total of 3,434 households (30.8%) fall into this category. Meanwhile, the 15 to 24 years age bracket for the primary householder has the lowest median household income of $44,874, with 259 households (2.3%) in this group.
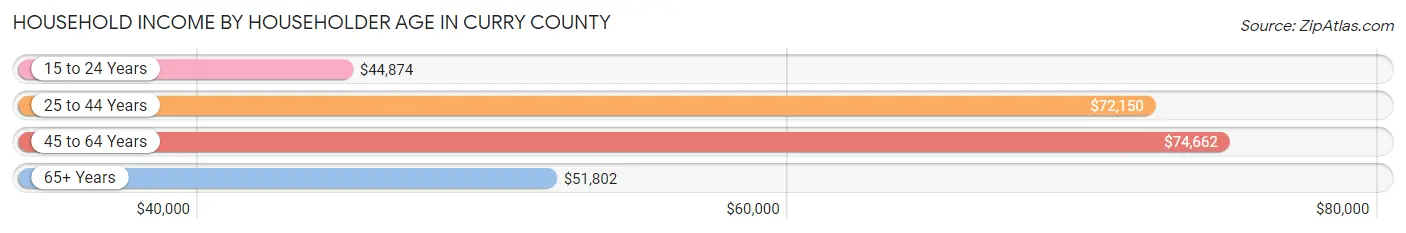
| Income Bracket | # Households | Median Income |
| 15 to 24 Years | 259 (2.3%) | $44,874 |
| 25 to 44 Years | 2,235 (20.1%) | $72,150 |
| 45 to 64 Years | 3,434 (30.8%) | $74,662 |
| 65+ Years | 5,220 (46.8%) | $51,802 |
| Total | 11,148 (100.0%) | $64,300 |
Poverty in Curry County
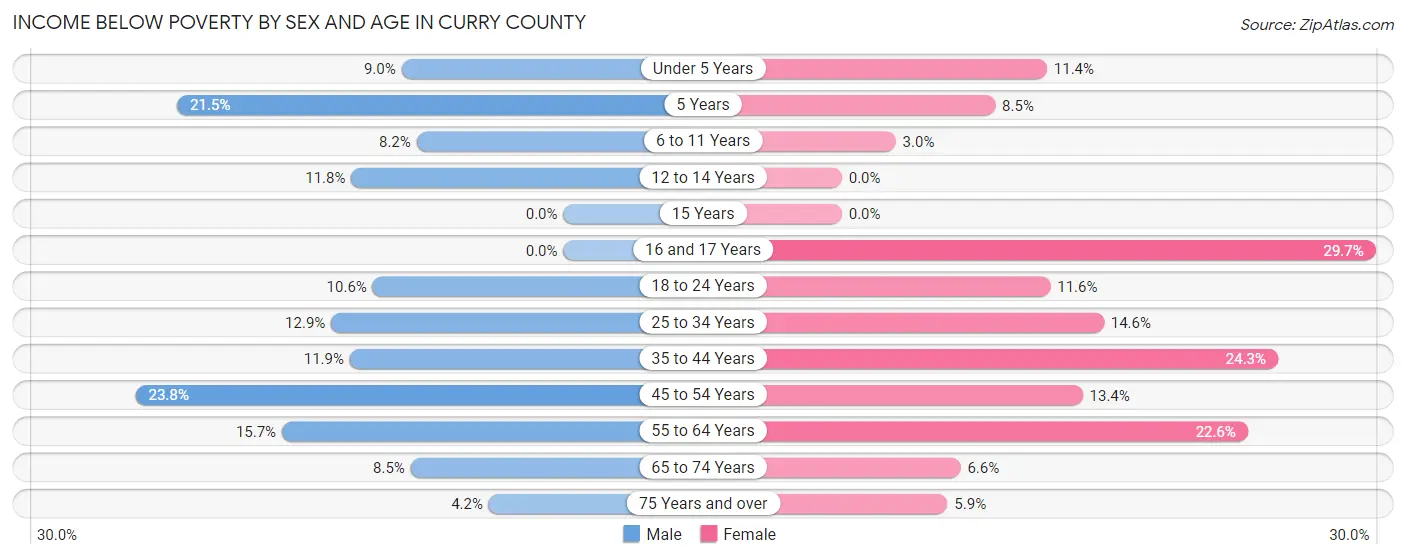
Income Below Poverty by Sex and Age in Curry County
With 11.7% poverty level for males and 13.1% for females among the residents of Curry County, 45 to 54 year old males and 16 and 17 year old females are the most vulnerable to poverty, with 257 males (23.8%) and 85 females (29.7%) in their respective age groups living below the poverty level.
| Age Bracket | Male | Female |
| Under 5 Years | 30 (9.0%) | 50 (11.4%) |
| 5 Years | 20 (21.5%) | 7 (8.5%) |
| 6 to 11 Years | 62 (8.2%) | 23 (3.0%) |
| 12 to 14 Years | 30 (11.8%) | 0 (0.0%) |
| 15 Years | 0 (0.0%) | 0 (0.0%) |
| 16 and 17 Years | 0 (0.0%) | 85 (29.7%) |
| 18 to 24 Years | 55 (10.6%) | 52 (11.6%) |
| 25 to 34 Years | 168 (12.9%) | 139 (14.6%) |
| 35 to 44 Years | 122 (11.9%) | 262 (24.3%) |
| 45 to 54 Years | 257 (23.8%) | 171 (13.4%) |
| 55 to 64 Years | 326 (15.7%) | 504 (22.6%) |
| 65 to 74 Years | 202 (8.5%) | 164 (6.6%) |
| 75 Years and over | 64 (4.2%) | 93 (5.9%) |
| Total | 1,336 (11.7%) | 1,550 (13.1%) |
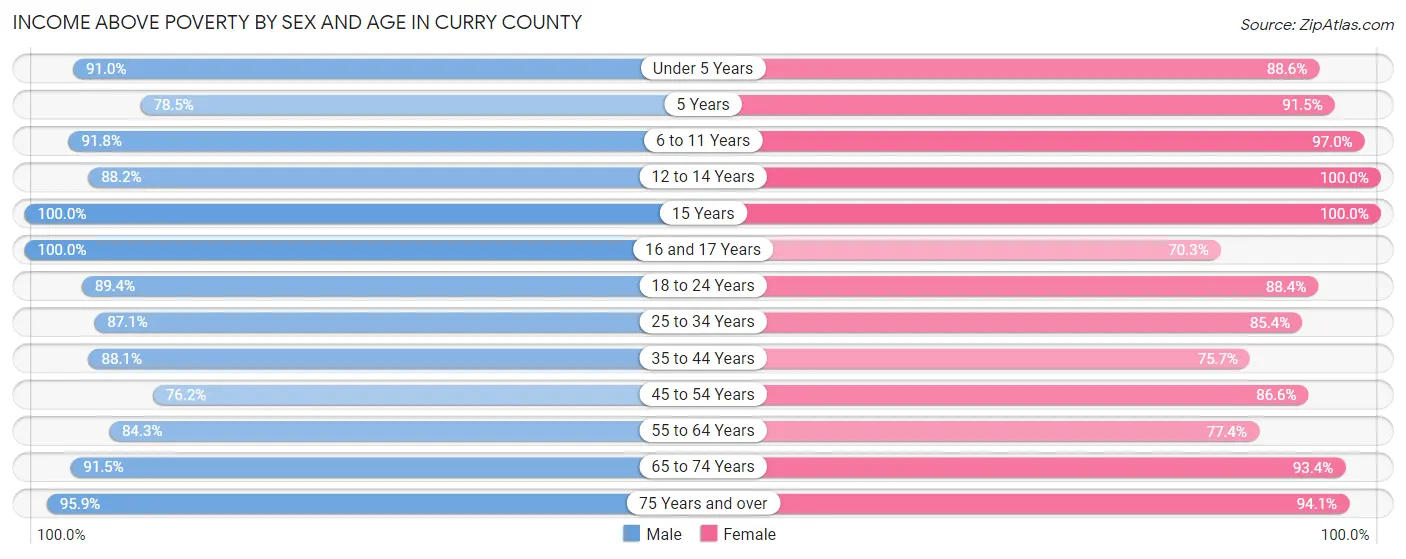
Income Above Poverty by Sex and Age in Curry County
According to the poverty statistics in Curry County, males aged 15 years and females aged 12 to 14 years are the age groups that are most secure financially, with 100.0% of males and 100.0% of females in these age groups living above the poverty line.
| Age Bracket | Male | Female |
| Under 5 Years | 303 (91.0%) | 388 (88.6%) |
| 5 Years | 73 (78.5%) | 75 (91.5%) |
| 6 to 11 Years | 697 (91.8%) | 743 (97.0%) |
| 12 to 14 Years | 224 (88.2%) | 107 (100.0%) |
| 15 Years | 16 (100.0%) | 73 (100.0%) |
| 16 and 17 Years | 51 (100.0%) | 201 (70.3%) |
| 18 to 24 Years | 463 (89.4%) | 396 (88.4%) |
| 25 to 34 Years | 1,131 (87.1%) | 814 (85.4%) |
| 35 to 44 Years | 904 (88.1%) | 817 (75.7%) |
| 45 to 54 Years | 822 (76.2%) | 1,104 (86.6%) |
| 55 to 64 Years | 1,754 (84.3%) | 1,726 (77.4%) |
| 65 to 74 Years | 2,175 (91.5%) | 2,318 (93.4%) |
| 75 Years and over | 1,478 (95.9%) | 1,488 (94.1%) |
| Total | 10,091 (88.3%) | 10,250 (86.9%) |
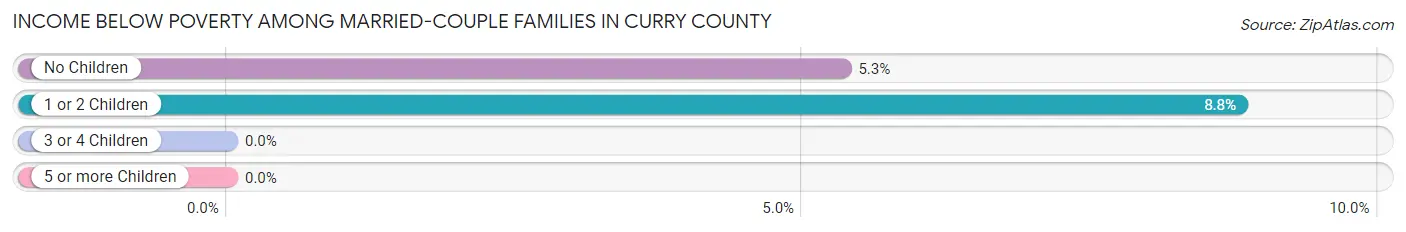
Income Below Poverty Among Married-Couple Families in Curry County
The poverty statistics for married-couple families in Curry County show that 5.8% or 339 of the total 5,843 families live below the poverty line. Families with 1 or 2 children have the highest poverty rate of 8.8%, comprising of 85 families. On the other hand, families with 3 or 4 children have the lowest poverty rate of 0.0%, which includes 0 families.
| Children | Above Poverty | Below Poverty |
| No Children | 4,501 (94.7%) | 254 (5.3%) |
| 1 or 2 Children | 882 (91.2%) | 85 (8.8%) |
| 3 or 4 Children | 121 (100.0%) | 0 (0.0%) |
| 5 or more Children | 0 (0.0%) | 0 (0.0%) |
| Total | 5,504 (94.2%) | 339 (5.8%) |
Income Below Poverty Among Single-Parent Households in Curry County
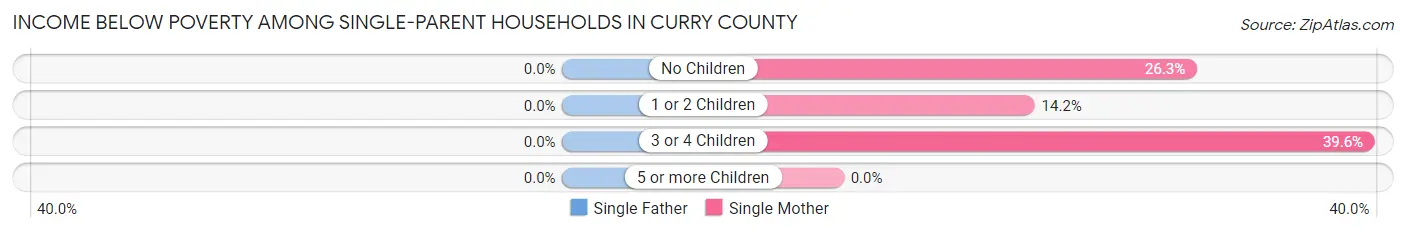
| Children | Single Father | Single Mother |
| No Children | 0 (0.0%) | 158 (26.3%) |
| 1 or 2 Children | 0 (0.0%) | 72 (14.2%) |
| 3 or 4 Children | 0 (0.0%) | 19 (39.6%) |
| 5 or more Children | 0 (0.0%) | 0 (0.0%) |
| Total | 0 (0.0%) | 249 (21.6%) |
Income Below Poverty Among Married-Couple vs Single-Parent Households in Curry County
The poverty data for Curry County shows that 339 of the married-couple family households (5.8%) and 249 of the single-parent households (14.6%) are living below the poverty level. Within the married-couple family households, those with 1 or 2 children have the highest poverty rate, with 85 households (8.8%) falling below the poverty line. Among the single-parent households, those with no children have the highest poverty rate, with 158 household (19.5%) living below poverty.
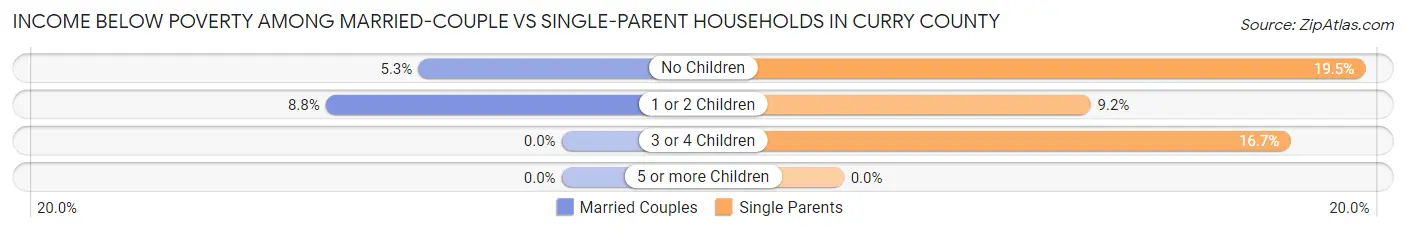
| Children | Married-Couple Families | Single-Parent Households |
| No Children | 254 (5.3%) | 158 (19.5%) |
| 1 or 2 Children | 85 (8.8%) | 72 (9.2%) |
| 3 or 4 Children | 0 (0.0%) | 19 (16.7%) |
| 5 or more Children | 0 (0.0%) | 0 (0.0%) |
| Total | 339 (5.8%) | 249 (14.6%) |
Employment Characteristics in Curry County
Employment by Class of Employer in Curry County
Among the 8,625 employed individuals in Curry County, private company employees (4,410 | 51.1%), state government employees (999 | 11.6%), and self-employed (not incorporated) (990 | 11.5%) make up the most common classes of employment.
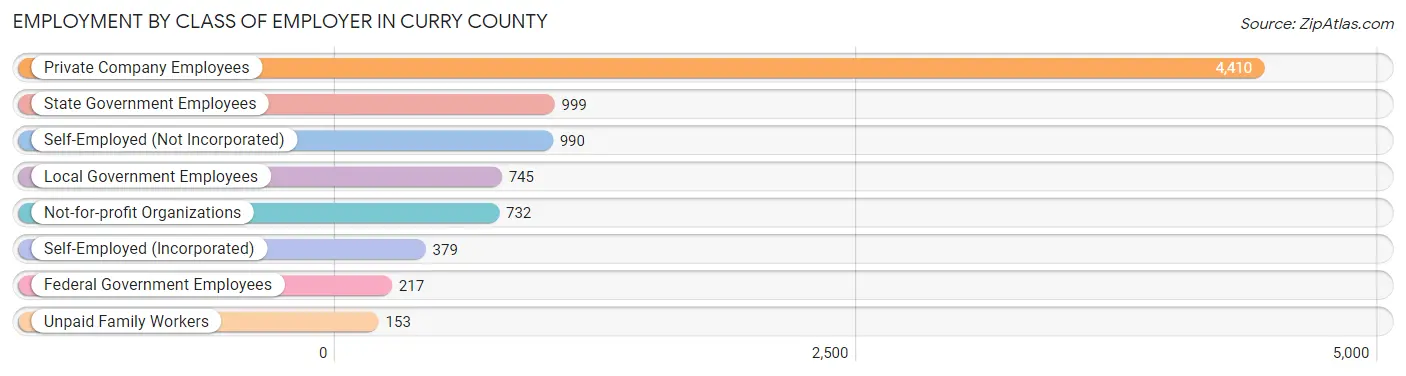
| Employer Class | # Employees | % Employees |
| Private Company Employees | 4,410 | 51.1% |
| Self-Employed (Incorporated) | 379 | 4.4% |
| Self-Employed (Not Incorporated) | 990 | 11.5% |
| Not-for-profit Organizations | 732 | 8.5% |
| Local Government Employees | 745 | 8.6% |
| State Government Employees | 999 | 11.6% |
| Federal Government Employees | 217 | 2.5% |
| Unpaid Family Workers | 153 | 1.8% |
| Total | 8,625 | 100.0% |
Employment Status by Age in Curry County
According to the labor force statistics for Curry County, out of the total population over 16 years of age (20,426), 46.6% or 9,519 individuals are in the labor force, with 7.2% or 685 of them unemployed. The age group with the highest labor force participation rate is 20 to 24 years, with 99.0% or 771 individuals in the labor force. Within the labor force, the 16 to 19 years age range has the highest percentage of unemployed individuals, with 45.2% or 123 of them being unemployed.
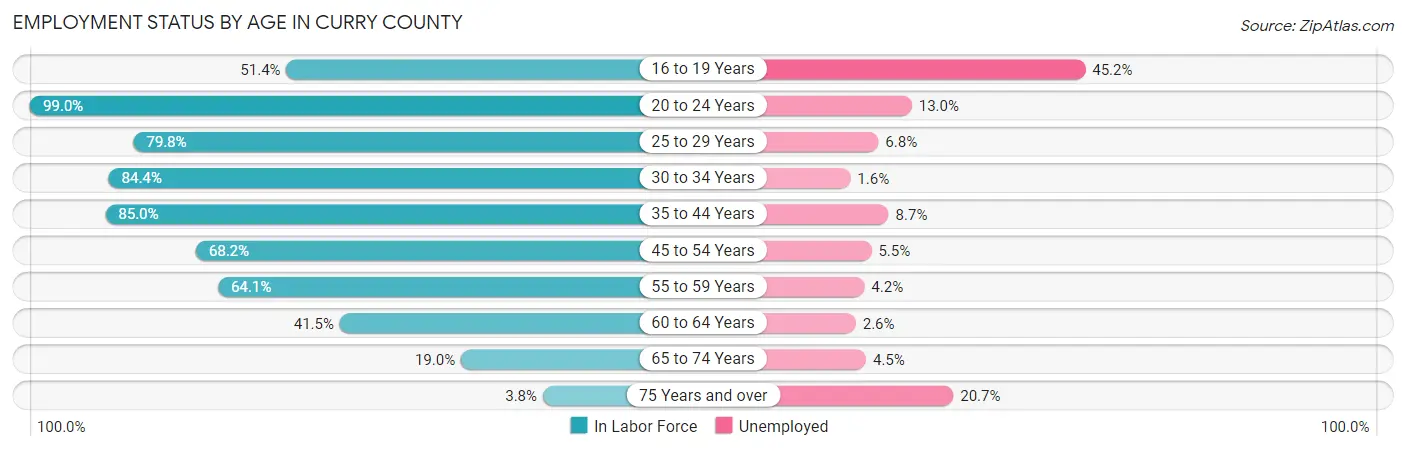
| Age Bracket | In Labor Force | Unemployed |
| 16 to 19 Years | 273 (51.4%) | 123 (45.2%) |
| 20 to 24 Years | 771 (99.0%) | 100 (13.0%) |
| 25 to 29 Years | 953 (79.8%) | 65 (6.8%) |
| 30 to 34 Years | 903 (84.4%) | 14 (1.6%) |
| 35 to 44 Years | 1,800 (85.0%) | 157 (8.7%) |
| 45 to 54 Years | 1,612 (68.2%) | 89 (5.5%) |
| 55 to 59 Years | 1,070 (64.1%) | 45 (4.2%) |
| 60 to 64 Years | 1,097 (41.5%) | 29 (2.6%) |
| 65 to 74 Years | 928 (19.0%) | 42 (4.5%) |
| 75 Years and over | 121 (3.8%) | 25 (20.7%) |
| Total | 9,519 (46.6%) | 685 (7.2%) |
Employment Status by Educational Attainment in Curry County
According to labor force statistics for Curry County, 67.2% of individuals (7,431) out of the total population between 25 and 64 years of age (11,058) are in the labor force, with 5.4% or 401 of them being unemployed. The group with the highest labor force participation rate are those with the educational attainment of bachelor's degree or higher, with 75.1% or 1,766 individuals in the labor force. Within the labor force, individuals with less than high school education have the highest percentage of unemployment, with 15.8% or 92 of them being unemployed.
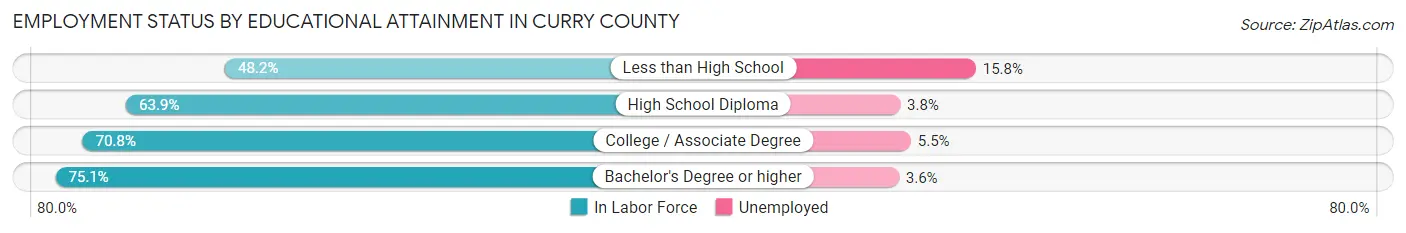
| Educational Attainment | In Labor Force | Unemployed |
| Less than High School | 583 (48.2%) | 191 (15.8%) |
| High School Diploma | 2,059 (63.9%) | 122 (3.8%) |
| College / Associate Degree | 3,026 (70.8%) | 235 (5.5%) |
| Bachelor's Degree or higher | 1,766 (75.1%) | 85 (3.6%) |
| Total | 7,431 (67.2%) | 597 (5.4%) |
Employment Occupations by Sex in Curry County
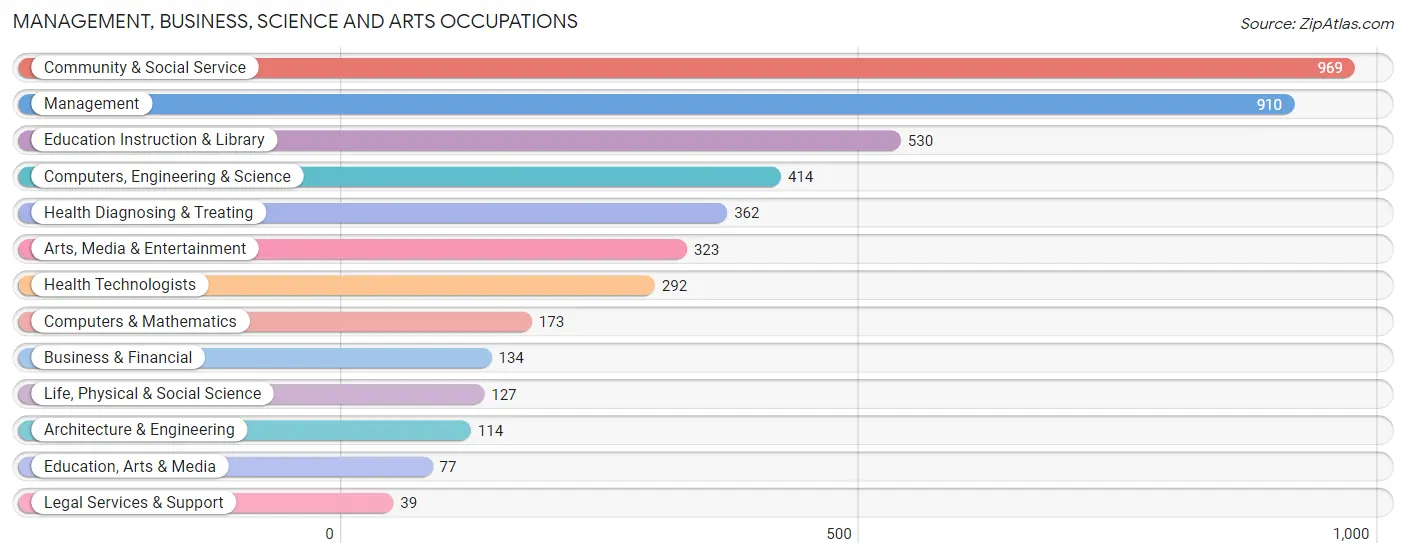
Management, Business, Science and Arts Occupations
The most common Management, Business, Science and Arts occupations in Curry County are Community & Social Service (969 | 11.0%), Management (910 | 10.3%), Education Instruction & Library (530 | 6.0%), Computers, Engineering & Science (414 | 4.7%), and Health Diagnosing & Treating (362 | 4.1%).
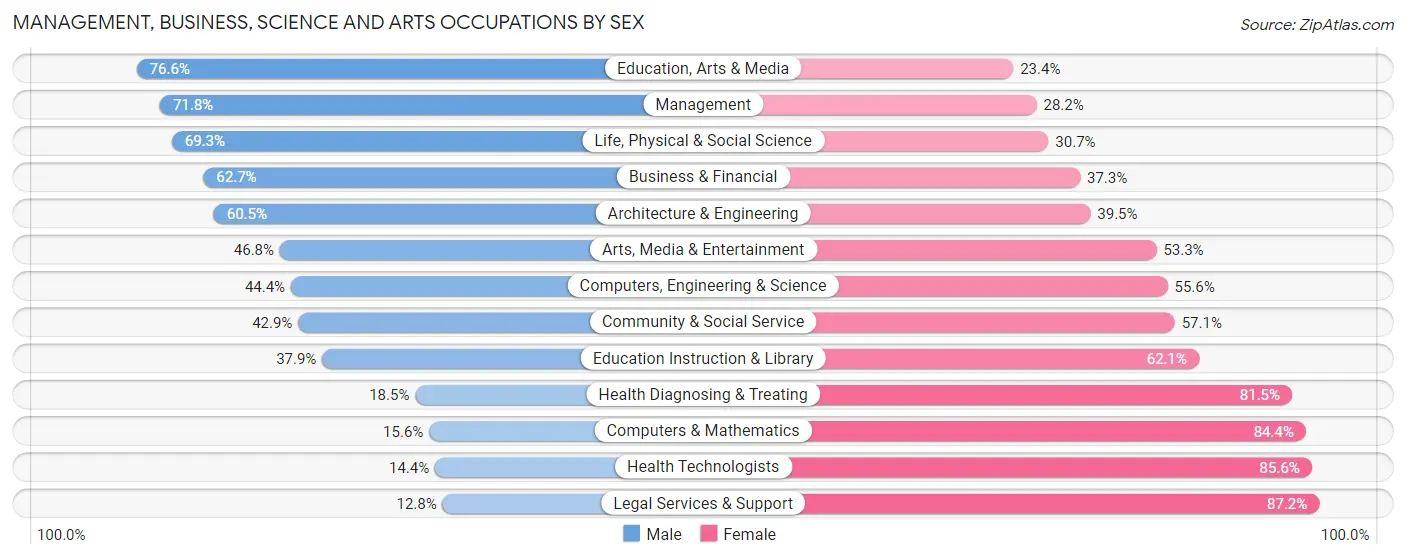
Management, Business, Science and Arts Occupations by Sex
Within the Management, Business, Science and Arts occupations in Curry County, the most male-oriented occupations are Education, Arts & Media (76.6%), Management (71.8%), and Life, Physical & Social Science (69.3%), while the most female-oriented occupations are Legal Services & Support (87.2%), Health Technologists (85.6%), and Computers & Mathematics (84.4%).
| Occupation | Male | Female |
| Management | 653 (71.8%) | 257 (28.2%) |
| Business & Financial | 84 (62.7%) | 50 (37.3%) |
| Computers, Engineering & Science | 184 (44.4%) | 230 (55.6%) |
| Computers & Mathematics | 27 (15.6%) | 146 (84.4%) |
| Architecture & Engineering | 69 (60.5%) | 45 (39.5%) |
| Life, Physical & Social Science | 88 (69.3%) | 39 (30.7%) |
| Community & Social Service | 416 (42.9%) | 553 (57.1%) |
| Education, Arts & Media | 59 (76.6%) | 18 (23.4%) |
| Legal Services & Support | 5 (12.8%) | 34 (87.2%) |
| Education Instruction & Library | 201 (37.9%) | 329 (62.1%) |
| Arts, Media & Entertainment | 151 (46.8%) | 172 (53.2%) |
| Health Diagnosing & Treating | 67 (18.5%) | 295 (81.5%) |
| Health Technologists | 42 (14.4%) | 250 (85.6%) |
| Total (Category) | 1,404 (50.3%) | 1,385 (49.7%) |
| Total (Overall) | 4,825 (54.6%) | 4,008 (45.4%) |
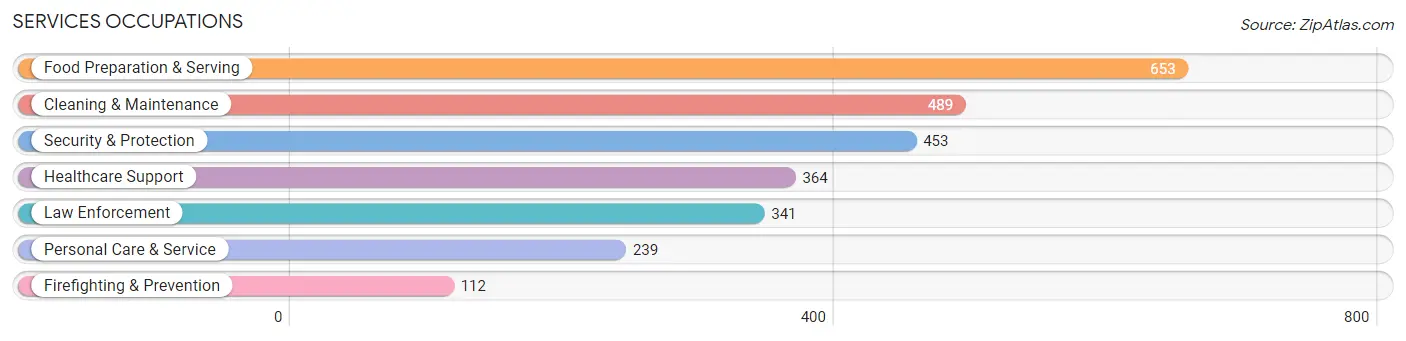
Services Occupations
The most common Services occupations in Curry County are Food Preparation & Serving (653 | 7.4%), Cleaning & Maintenance (489 | 5.5%), Security & Protection (453 | 5.1%), Healthcare Support (364 | 4.1%), and Law Enforcement (341 | 3.9%).
Services Occupations by Sex
Within the Services occupations in Curry County, the most male-oriented occupations are Law Enforcement (86.2%), Security & Protection (86.1%), and Firefighting & Prevention (85.7%), while the most female-oriented occupations are Healthcare Support (90.9%), Personal Care & Service (89.1%), and Food Preparation & Serving (57.9%).

| Occupation | Male | Female |
| Healthcare Support | 33 (9.1%) | 331 (90.9%) |
| Security & Protection | 390 (86.1%) | 63 (13.9%) |
| Firefighting & Prevention | 96 (85.7%) | 16 (14.3%) |
| Law Enforcement | 294 (86.2%) | 47 (13.8%) |
| Food Preparation & Serving | 275 (42.1%) | 378 (57.9%) |
| Cleaning & Maintenance | 355 (72.6%) | 134 (27.4%) |
| Personal Care & Service | 26 (10.9%) | 213 (89.1%) |
| Total (Category) | 1,079 (49.1%) | 1,119 (50.9%) |
| Total (Overall) | 4,825 (54.6%) | 4,008 (45.4%) |
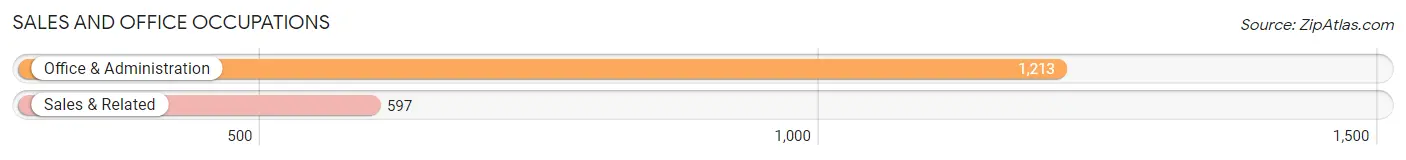
Sales and Office Occupations
The most common Sales and Office occupations in Curry County are Office & Administration (1,213 | 13.7%), and Sales & Related (597 | 6.8%).
Sales and Office Occupations by Sex
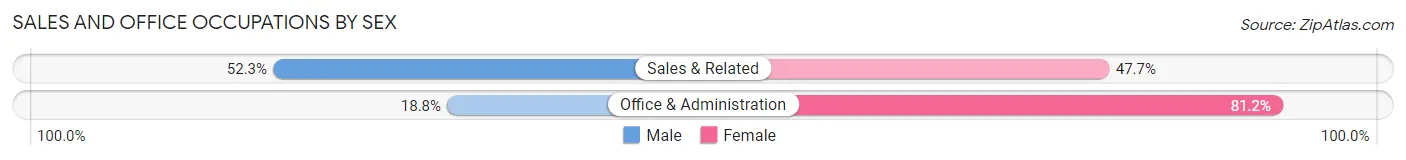
| Occupation | Male | Female |
| Sales & Related | 312 (52.3%) | 285 (47.7%) |
| Office & Administration | 228 (18.8%) | 985 (81.2%) |
| Total (Category) | 540 (29.8%) | 1,270 (70.2%) |
| Total (Overall) | 4,825 (54.6%) | 4,008 (45.4%) |
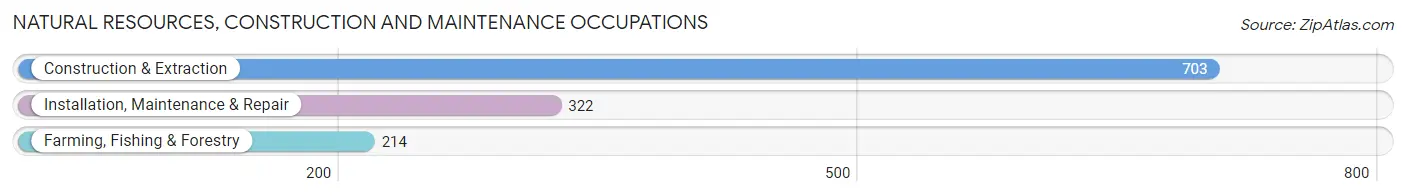
Natural Resources, Construction and Maintenance Occupations
The most common Natural Resources, Construction and Maintenance occupations in Curry County are Construction & Extraction (703 | 8.0%), Installation, Maintenance & Repair (322 | 3.6%), and Farming, Fishing & Forestry (214 | 2.4%).
Natural Resources, Construction and Maintenance Occupations by Sex
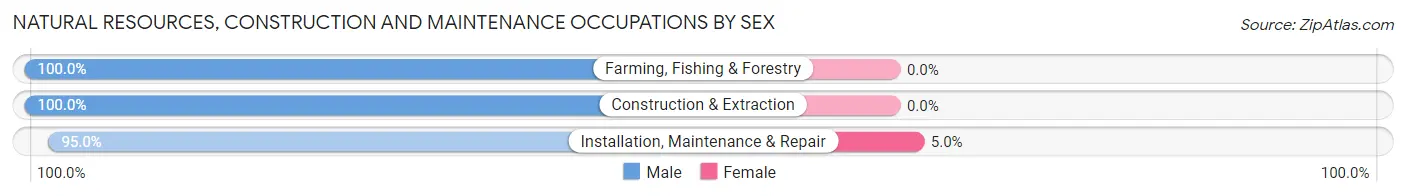
| Occupation | Male | Female |
| Farming, Fishing & Forestry | 214 (100.0%) | 0 (0.0%) |
| Construction & Extraction | 703 (100.0%) | 0 (0.0%) |
| Installation, Maintenance & Repair | 306 (95.0%) | 16 (5.0%) |
| Total (Category) | 1,223 (98.7%) | 16 (1.3%) |
| Total (Overall) | 4,825 (54.6%) | 4,008 (45.4%) |
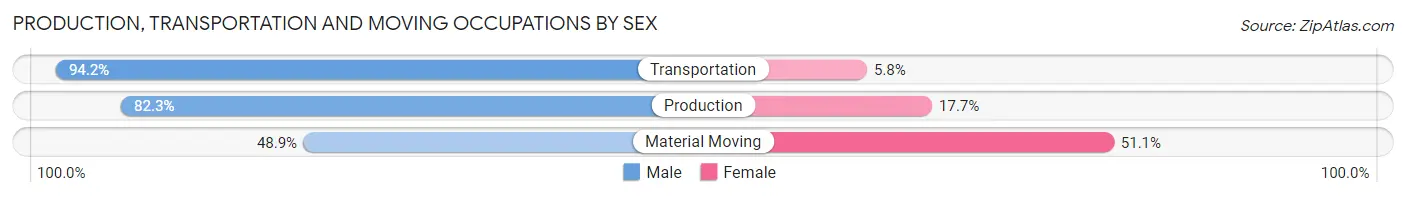
Production, Transportation and Moving Occupations
The most common Production, Transportation and Moving occupations in Curry County are Production (378 | 4.3%), Material Moving (280 | 3.2%), and Transportation (139 | 1.6%).
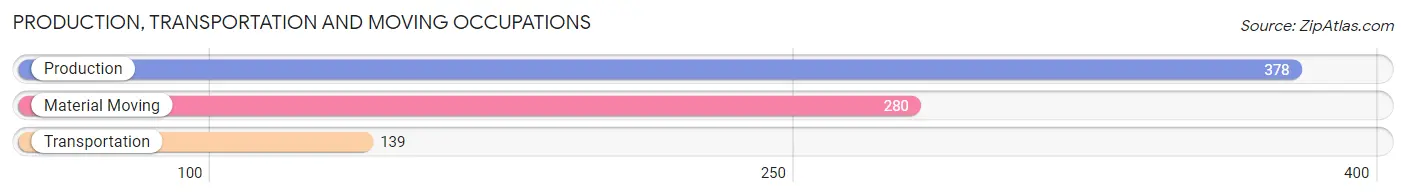
Production, Transportation and Moving Occupations by Sex
| Occupation | Male | Female |
| Production | 311 (82.3%) | 67 (17.7%) |
| Transportation | 131 (94.2%) | 8 (5.8%) |
| Material Moving | 137 (48.9%) | 143 (51.1%) |
| Total (Category) | 579 (72.7%) | 218 (27.4%) |
| Total (Overall) | 4,825 (54.6%) | 4,008 (45.4%) |
Employment Industries by Sex in Curry County
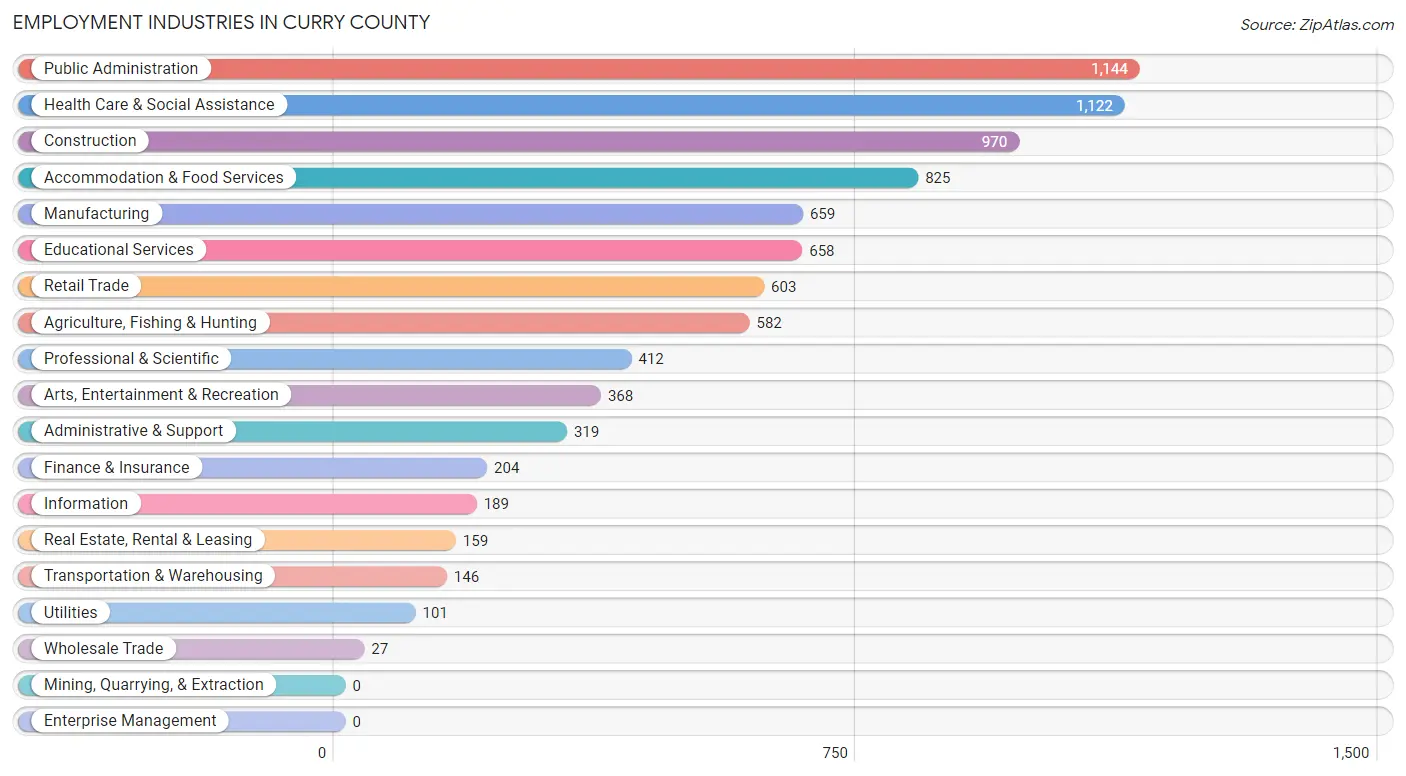
Employment Industries in Curry County
The major employment industries in Curry County include Public Administration (1,144 | 13.0%), Health Care & Social Assistance (1,122 | 12.7%), Construction (970 | 11.0%), Accommodation & Food Services (825 | 9.3%), and Manufacturing (659 | 7.5%).
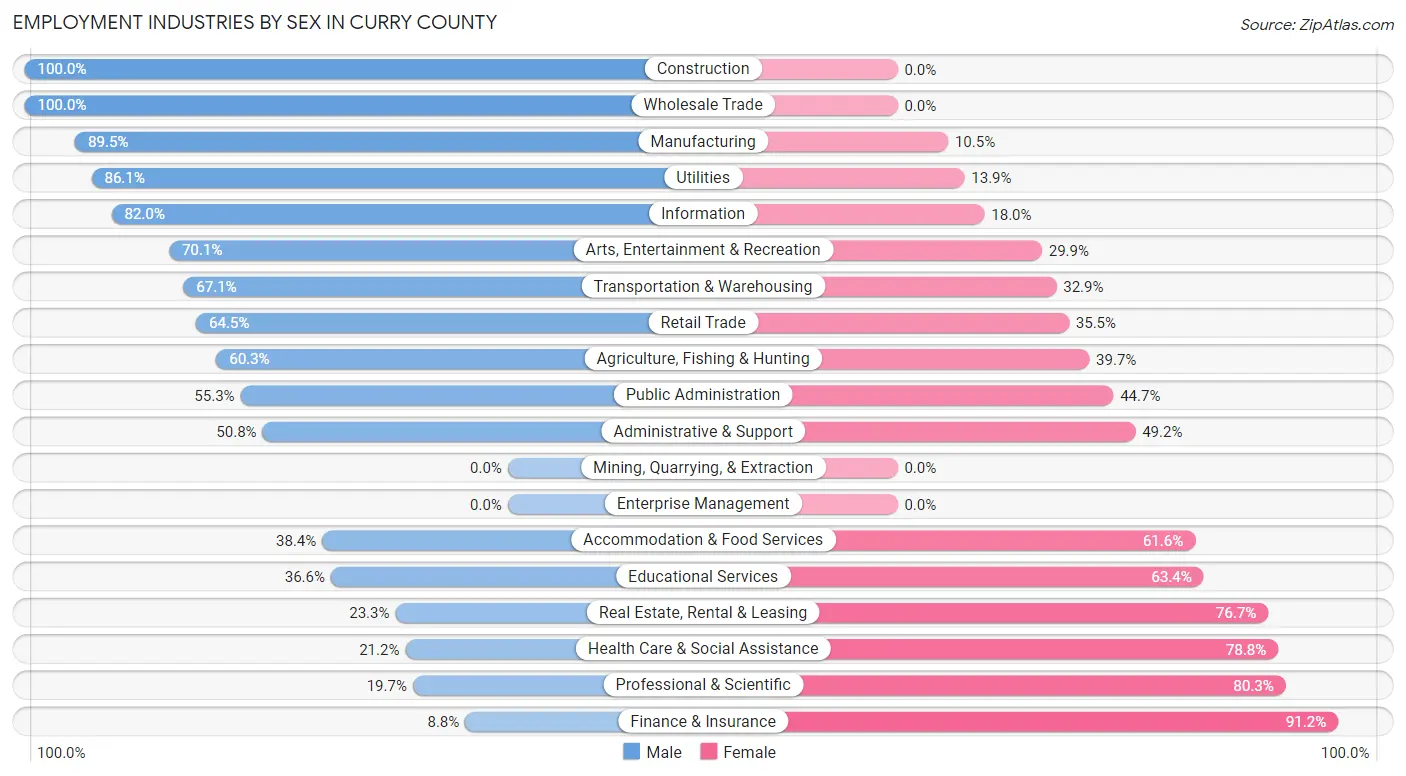
Employment Industries by Sex in Curry County
The Curry County industries that see more men than women are Construction (100.0%), Wholesale Trade (100.0%), and Manufacturing (89.5%), whereas the industries that tend to have a higher number of women are Finance & Insurance (91.2%), Professional & Scientific (80.3%), and Health Care & Social Assistance (78.8%).
| Industry | Male | Female |
| Agriculture, Fishing & Hunting | 351 (60.3%) | 231 (39.7%) |
| Mining, Quarrying, & Extraction | 0 (0.0%) | 0 (0.0%) |
| Construction | 970 (100.0%) | 0 (0.0%) |
| Manufacturing | 590 (89.5%) | 69 (10.5%) |
| Wholesale Trade | 27 (100.0%) | 0 (0.0%) |
| Retail Trade | 389 (64.5%) | 214 (35.5%) |
| Transportation & Warehousing | 98 (67.1%) | 48 (32.9%) |
| Utilities | 87 (86.1%) | 14 (13.9%) |
| Information | 155 (82.0%) | 34 (18.0%) |
| Finance & Insurance | 18 (8.8%) | 186 (91.2%) |
| Real Estate, Rental & Leasing | 37 (23.3%) | 122 (76.7%) |
| Professional & Scientific | 81 (19.7%) | 331 (80.3%) |
| Enterprise Management | 0 (0.0%) | 0 (0.0%) |
| Administrative & Support | 162 (50.8%) | 157 (49.2%) |
| Educational Services | 241 (36.6%) | 417 (63.4%) |
| Health Care & Social Assistance | 238 (21.2%) | 884 (78.8%) |
| Arts, Entertainment & Recreation | 258 (70.1%) | 110 (29.9%) |
| Accommodation & Food Services | 317 (38.4%) | 508 (61.6%) |
| Public Administration | 633 (55.3%) | 511 (44.7%) |
| Total | 4,825 (54.6%) | 4,008 (45.4%) |
Education in Curry County
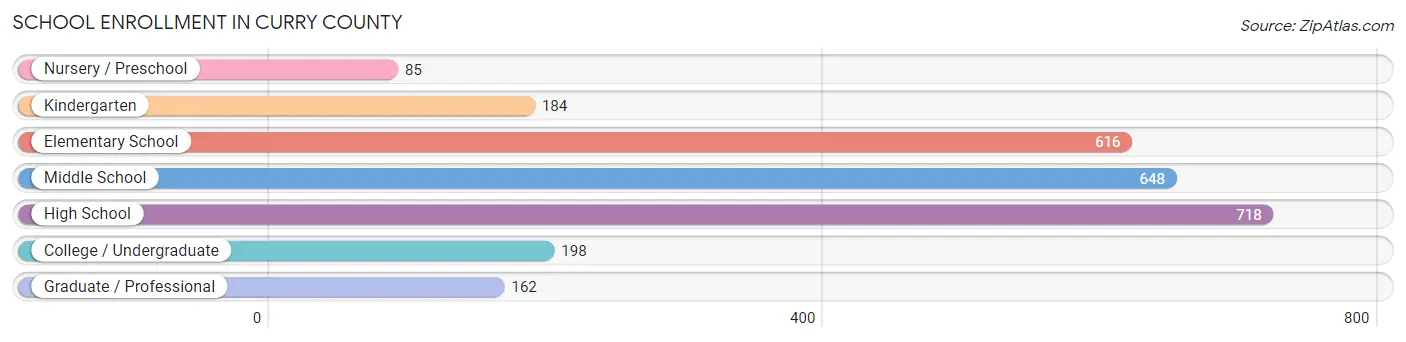
School Enrollment in Curry County
The most common levels of schooling among the 2,611 students in Curry County are high school (718 | 27.5%), middle school (648 | 24.8%), and elementary school (616 | 23.6%).
| School Level | # Students | % Students |
| Nursery / Preschool | 85 | 3.3% |
| Kindergarten | 184 | 7.0% |
| Elementary School | 616 | 23.6% |
| Middle School | 648 | 24.8% |
| High School | 718 | 27.5% |
| College / Undergraduate | 198 | 7.6% |
| Graduate / Professional | 162 | 6.2% |
| Total | 2,611 | 100.0% |
School Enrollment by Age by Funding Source in Curry County
Out of a total of 2,611 students who are enrolled in schools in Curry County, 366 (14.0%) attend a private institution, while the remaining 2,245 (86.0%) are enrolled in public schools. The age group of 25 to 34 year olds has the highest likelihood of being enrolled in private schools, with 147 (95.5% in the age bracket) enrolled. Conversely, the age group of 18 to 19 year olds has the lowest likelihood of being enrolled in a private school, with 100 (100.0% in the age bracket) attending a public institution.
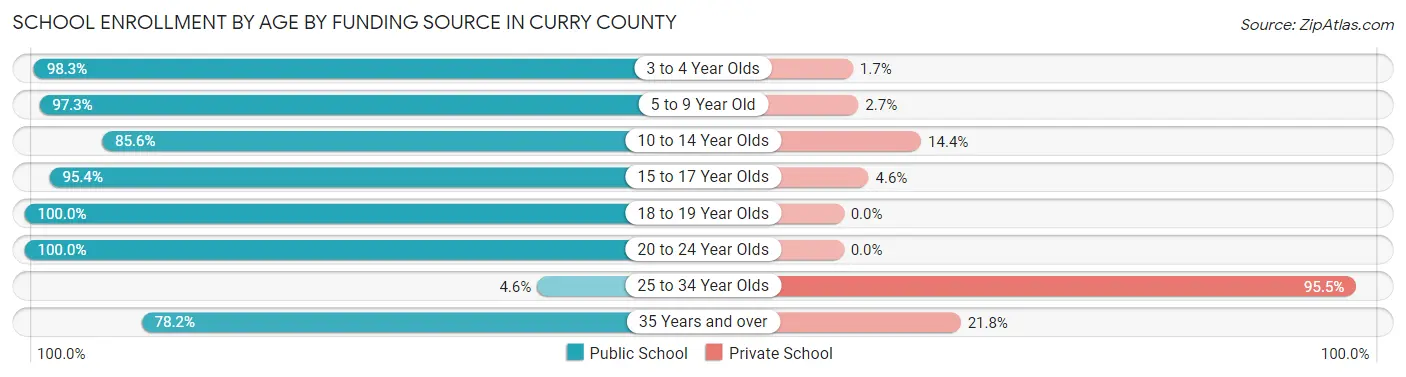
| Age Bracket | Public School | Private School |
| 3 to 4 Year Olds | 57 (98.3%) | 1 (1.7%) |
| 5 to 9 Year Old | 711 (97.3%) | 20 (2.7%) |
| 10 to 14 Year Olds | 783 (85.6%) | 132 (14.4%) |
| 15 to 17 Year Olds | 411 (95.4%) | 20 (4.6%) |
| 18 to 19 Year Olds | 100 (100.0%) | 0 (0.0%) |
| 20 to 24 Year Olds | 11 (100.0%) | 0 (0.0%) |
| 25 to 34 Year Olds | 7 (4.5%) | 147 (95.5%) |
| 35 Years and over | 165 (78.2%) | 46 (21.8%) |
| Total | 2,245 (86.0%) | 366 (14.0%) |
Educational Attainment by Field of Study in Curry County
Education (633 | 12.4%), social sciences (560 | 11.0%), business (534 | 10.5%), science & technology (504 | 9.9%), and psychology (457 | 9.0%) are the most common fields of study among 5,085 individuals in Curry County who have obtained a bachelor's degree or higher.
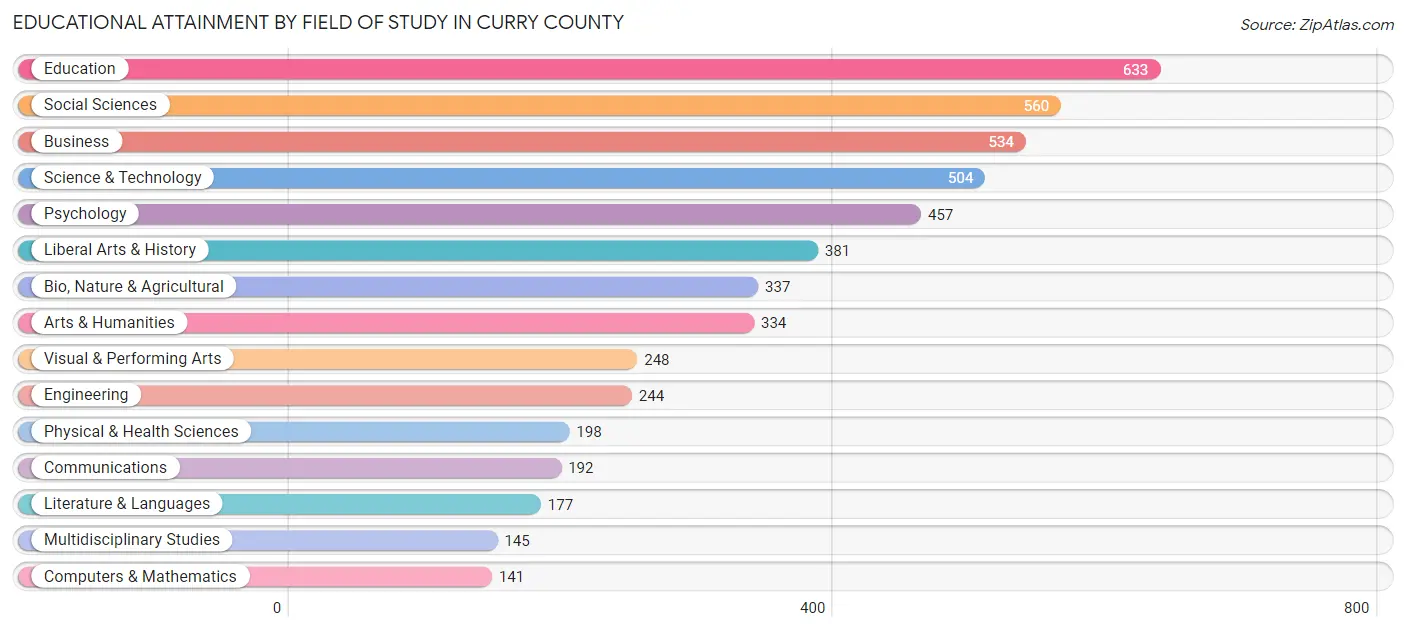
| Field of Study | # Graduates | % Graduates |
| Computers & Mathematics | 141 | 2.8% |
| Bio, Nature & Agricultural | 337 | 6.6% |
| Physical & Health Sciences | 198 | 3.9% |
| Psychology | 457 | 9.0% |
| Social Sciences | 560 | 11.0% |
| Engineering | 244 | 4.8% |
| Multidisciplinary Studies | 145 | 2.9% |
| Science & Technology | 504 | 9.9% |
| Business | 534 | 10.5% |
| Education | 633 | 12.4% |
| Literature & Languages | 177 | 3.5% |
| Liberal Arts & History | 381 | 7.5% |
| Visual & Performing Arts | 248 | 4.9% |
| Communications | 192 | 3.8% |
| Arts & Humanities | 334 | 6.6% |
| Total | 5,085 | 100.0% |
Transportation & Commute in Curry County
Vehicle Availability by Sex in Curry County
The most prevalent vehicle ownership categories in Curry County are males with 2 vehicles (2,225, accounting for 47.3%) and females with 2 vehicles (1,700, making up 57.2%).
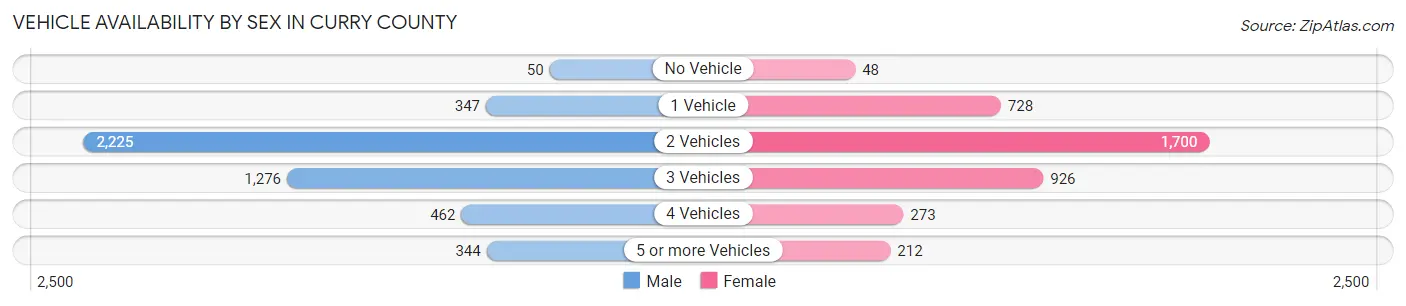
| Vehicles Available | Male | Female |
| No Vehicle | 50 (1.1%) | 48 (1.2%) |
| 1 Vehicle | 347 (7.4%) | 728 (18.7%) |
| 2 Vehicles | 2,225 (47.3%) | 1,700 (43.7%) |
| 3 Vehicles | 1,276 (27.1%) | 926 (23.8%) |
| 4 Vehicles | 462 (9.8%) | 273 (7.0%) |
| 5 or more Vehicles | 344 (7.3%) | 212 (5.4%) |
| Total | 4,704 (100.0%) | 3,887 (100.0%) |
Commute Time in Curry County
The most frequently occuring commute durations in Curry County are 5 to 9 minutes (2,082 commuters, 28.9%), 10 to 14 minutes (1,473 commuters, 20.4%), and 30 to 34 minutes (831 commuters, 11.5%).
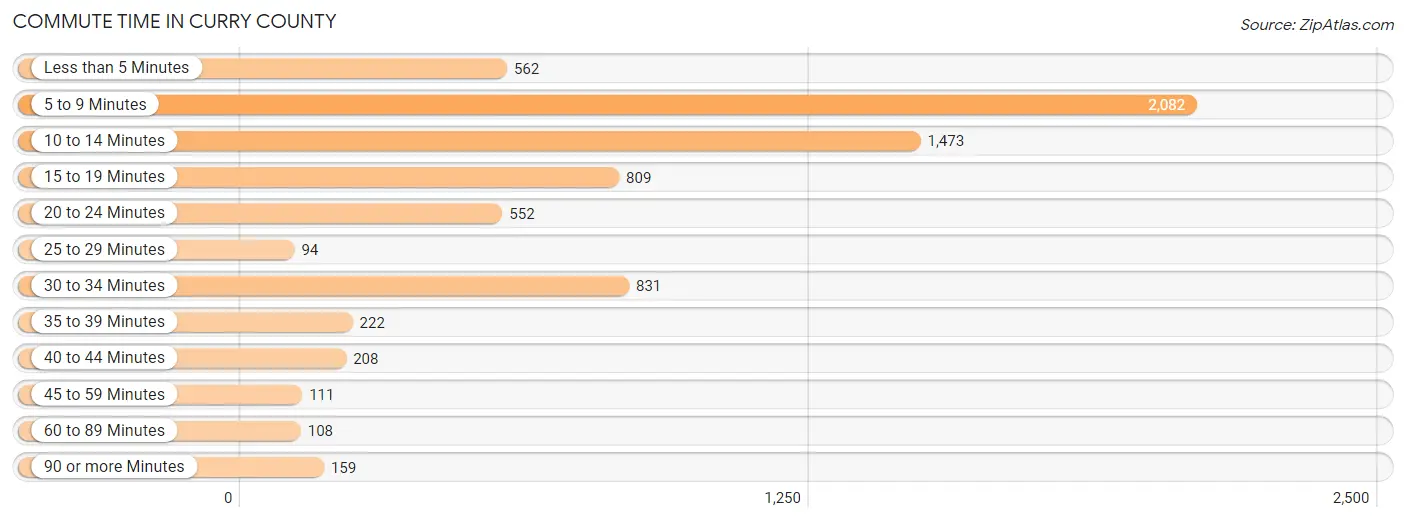
| Commute Time | # Commuters | % Commuters |
| Less than 5 Minutes | 562 | 7.8% |
| 5 to 9 Minutes | 2,082 | 28.9% |
| 10 to 14 Minutes | 1,473 | 20.4% |
| 15 to 19 Minutes | 809 | 11.2% |
| 20 to 24 Minutes | 552 | 7.6% |
| 25 to 29 Minutes | 94 | 1.3% |
| 30 to 34 Minutes | 831 | 11.5% |
| 35 to 39 Minutes | 222 | 3.1% |
| 40 to 44 Minutes | 208 | 2.9% |
| 45 to 59 Minutes | 111 | 1.5% |
| 60 to 89 Minutes | 108 | 1.5% |
| 90 or more Minutes | 159 | 2.2% |
Commute Time by Sex in Curry County
The most common commute times in Curry County are 5 to 9 minutes (1,118 commuters, 29.3%) for males and 5 to 9 minutes (964 commuters, 28.4%) for females.
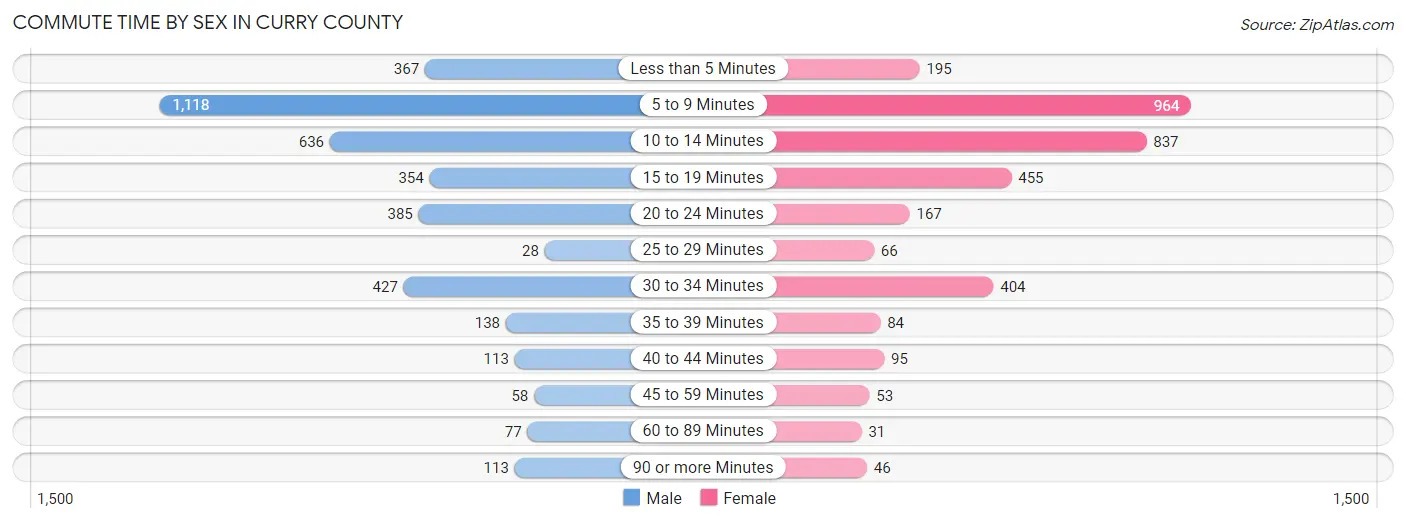
| Commute Time | Male | Female |
| Less than 5 Minutes | 367 (9.6%) | 195 (5.7%) |
| 5 to 9 Minutes | 1,118 (29.3%) | 964 (28.4%) |
| 10 to 14 Minutes | 636 (16.7%) | 837 (24.6%) |
| 15 to 19 Minutes | 354 (9.3%) | 455 (13.4%) |
| 20 to 24 Minutes | 385 (10.1%) | 167 (4.9%) |
| 25 to 29 Minutes | 28 (0.7%) | 66 (1.9%) |
| 30 to 34 Minutes | 427 (11.2%) | 404 (11.9%) |
| 35 to 39 Minutes | 138 (3.6%) | 84 (2.5%) |
| 40 to 44 Minutes | 113 (3.0%) | 95 (2.8%) |
| 45 to 59 Minutes | 58 (1.5%) | 53 (1.6%) |
| 60 to 89 Minutes | 77 (2.0%) | 31 (0.9%) |
| 90 or more Minutes | 113 (3.0%) | 46 (1.3%) |
Time of Departure to Work by Sex in Curry County
The most frequent times of departure to work in Curry County are 7:00 AM to 7:29 AM (603, 15.8%) for males and 7:30 AM to 7:59 AM (906, 26.7%) for females.
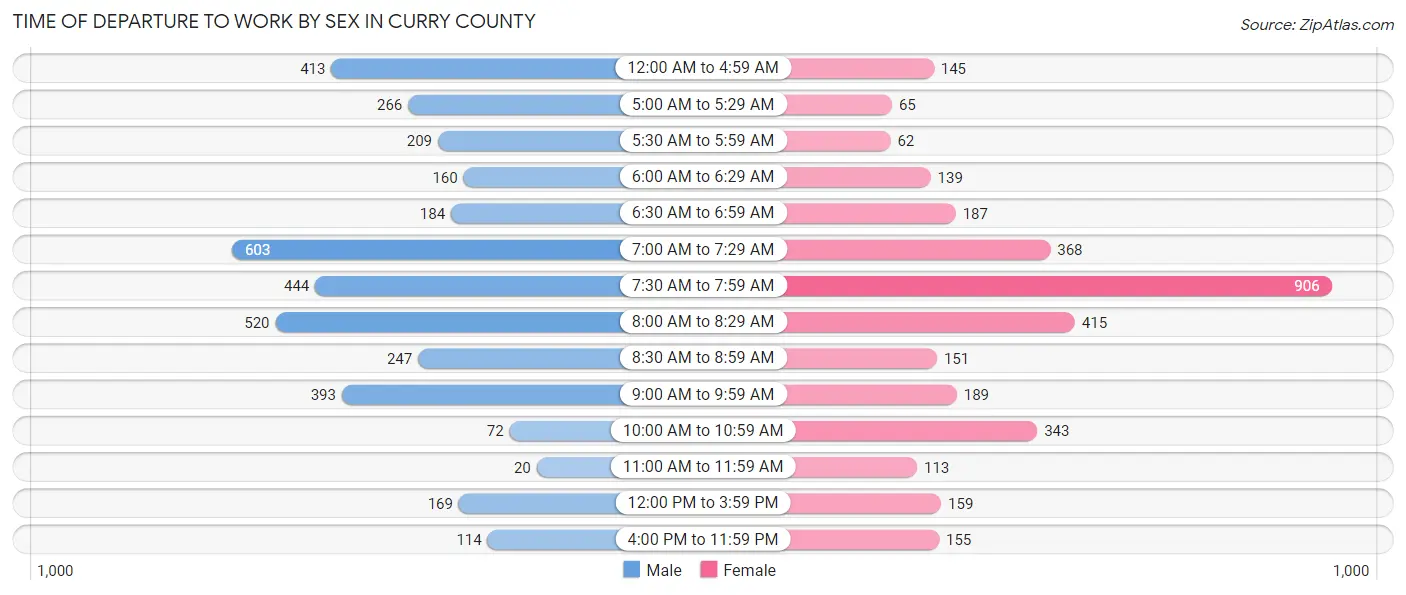
| Time of Departure | Male | Female |
| 12:00 AM to 4:59 AM | 413 (10.8%) | 145 (4.3%) |
| 5:00 AM to 5:29 AM | 266 (7.0%) | 65 (1.9%) |
| 5:30 AM to 5:59 AM | 209 (5.5%) | 62 (1.8%) |
| 6:00 AM to 6:29 AM | 160 (4.2%) | 139 (4.1%) |
| 6:30 AM to 6:59 AM | 184 (4.8%) | 187 (5.5%) |
| 7:00 AM to 7:29 AM | 603 (15.8%) | 368 (10.8%) |
| 7:30 AM to 7:59 AM | 444 (11.6%) | 906 (26.7%) |
| 8:00 AM to 8:29 AM | 520 (13.6%) | 415 (12.2%) |
| 8:30 AM to 8:59 AM | 247 (6.5%) | 151 (4.4%) |
| 9:00 AM to 9:59 AM | 393 (10.3%) | 189 (5.6%) |
| 10:00 AM to 10:59 AM | 72 (1.9%) | 343 (10.1%) |
| 11:00 AM to 11:59 AM | 20 (0.5%) | 113 (3.3%) |
| 12:00 PM to 3:59 PM | 169 (4.4%) | 159 (4.7%) |
| 4:00 PM to 11:59 PM | 114 (3.0%) | 155 (4.6%) |
| Total | 3,814 (100.0%) | 3,397 (100.0%) |
Housing Occupancy in Curry County
Occupancy by Ownership in Curry County
Of the total 11,148 dwellings in Curry County, owner-occupied units account for 8,542 (76.6%), while renter-occupied units make up 2,606 (23.4%).
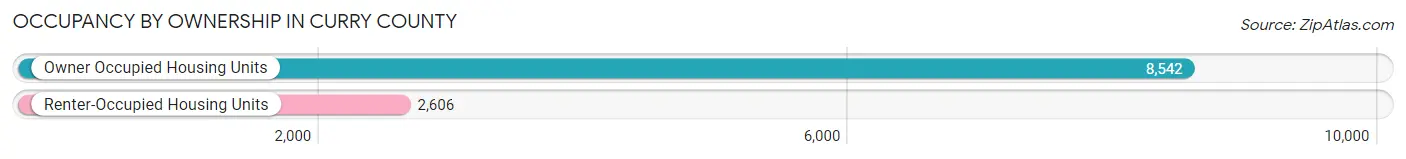
| Occupancy | # Housing Units | % Housing Units |
| Owner Occupied Housing Units | 8,542 | 76.6% |
| Renter-Occupied Housing Units | 2,606 | 23.4% |
| Total Occupied Housing Units | 11,148 | 100.0% |
Occupancy by Household Size in Curry County
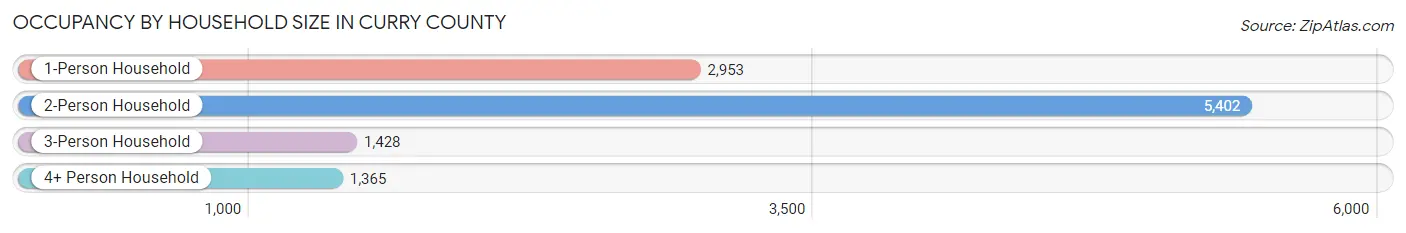
| Household Size | # Housing Units | % Housing Units |
| 1-Person Household | 2,953 | 26.5% |
| 2-Person Household | 5,402 | 48.5% |
| 3-Person Household | 1,428 | 12.8% |
| 4+ Person Household | 1,365 | 12.2% |
| Total Housing Units | 11,148 | 100.0% |
Occupancy by Ownership by Household Size in Curry County
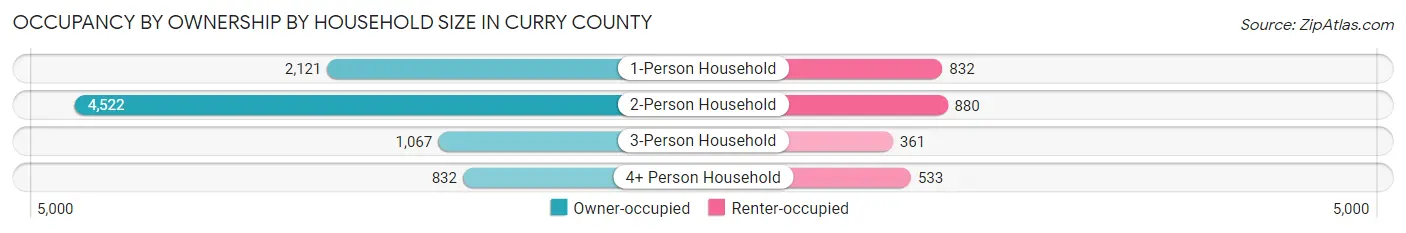
| Household Size | Owner-occupied | Renter-occupied |
| 1-Person Household | 2,121 (71.8%) | 832 (28.2%) |
| 2-Person Household | 4,522 (83.7%) | 880 (16.3%) |
| 3-Person Household | 1,067 (74.7%) | 361 (25.3%) |
| 4+ Person Household | 832 (61.0%) | 533 (39.1%) |
| Total Housing Units | 8,542 (76.6%) | 2,606 (23.4%) |
Occupancy by Educational Attainment in Curry County
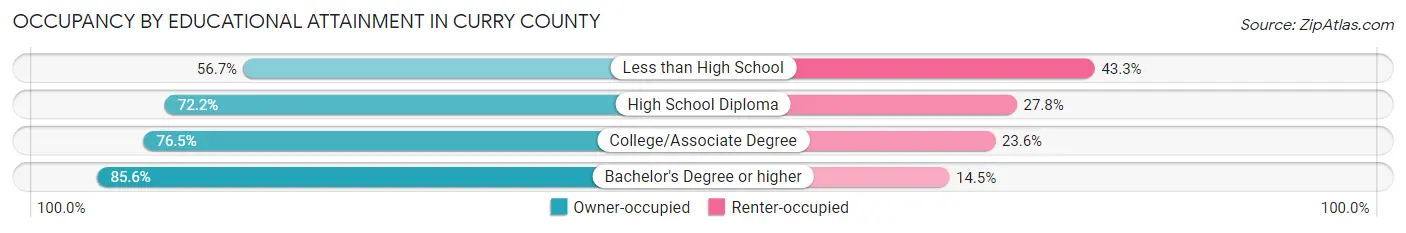
| Household Size | Owner-occupied | Renter-occupied |
| Less than High School | 384 (56.7%) | 293 (43.3%) |
| High School Diploma | 1,714 (72.2%) | 661 (27.8%) |
| College/Associate Degree | 4,047 (76.4%) | 1,247 (23.5%) |
| Bachelor's Degree or higher | 2,397 (85.6%) | 405 (14.4%) |
Occupancy by Age of Householder in Curry County
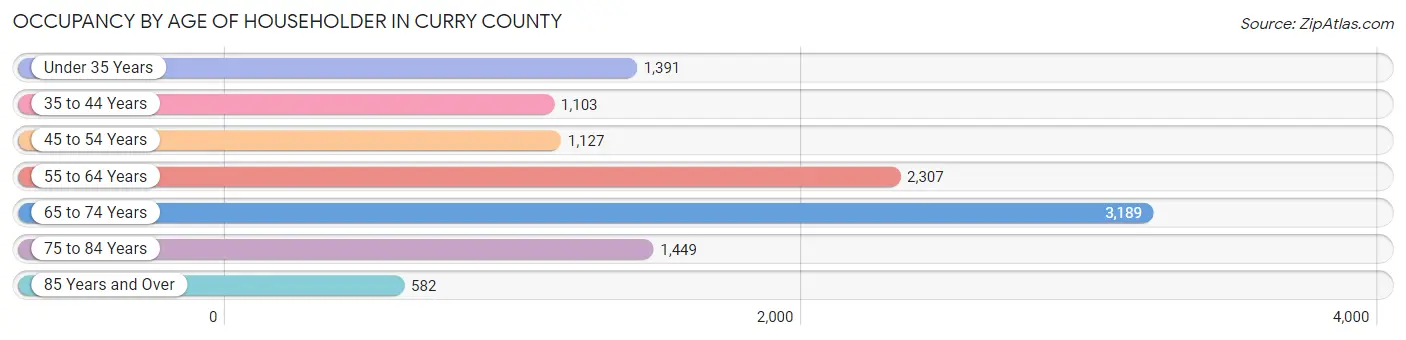
| Age Bracket | # Households | % Households |
| Under 35 Years | 1,391 | 12.5% |
| 35 to 44 Years | 1,103 | 9.9% |
| 45 to 54 Years | 1,127 | 10.1% |
| 55 to 64 Years | 2,307 | 20.7% |
| 65 to 74 Years | 3,189 | 28.6% |
| 75 to 84 Years | 1,449 | 13.0% |
| 85 Years and Over | 582 | 5.2% |
| Total | 11,148 | 100.0% |
Housing Finances in Curry County
Median Income by Occupancy in Curry County
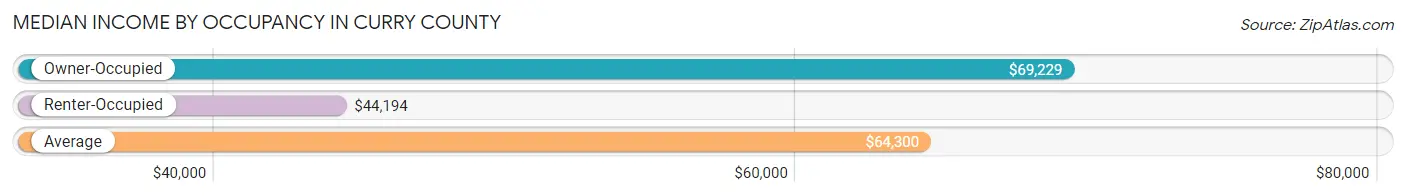
| Occupancy Type | # Households | Median Income |
| Owner-Occupied | 8,542 (76.6%) | $69,229 |
| Renter-Occupied | 2,606 (23.4%) | $44,194 |
| Average | 11,148 (100.0%) | $64,300 |
Occupancy by Householder Income Bracket in Curry County
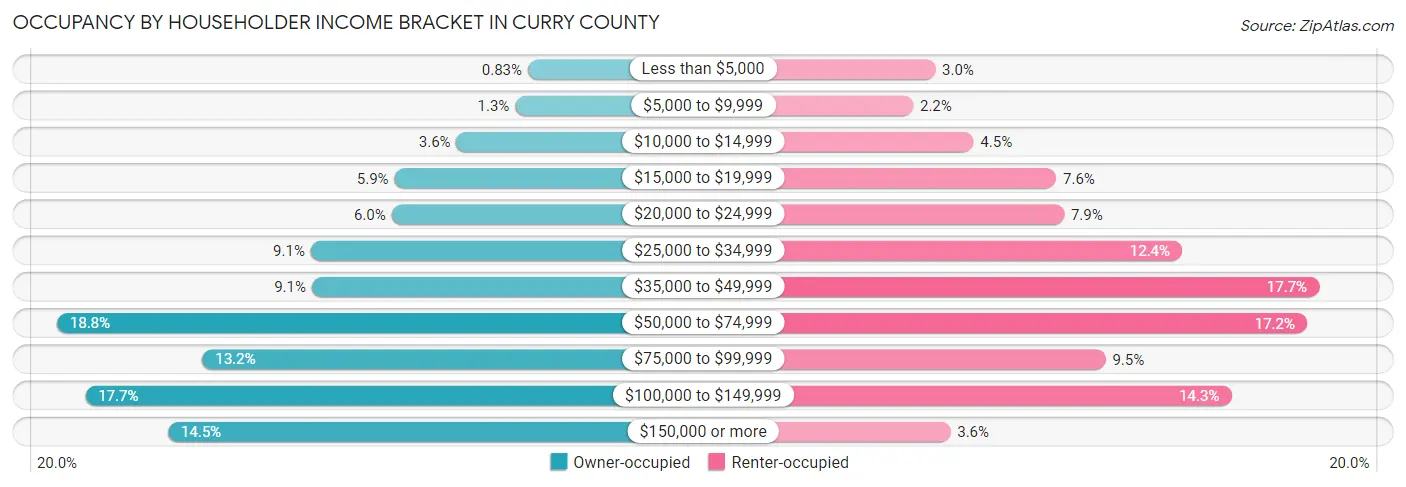
| Income Bracket | Owner-occupied | Renter-occupied |
| Less than $5,000 | 71 (0.8%) | 79 (3.0%) |
| $5,000 to $9,999 | 112 (1.3%) | 57 (2.2%) |
| $10,000 to $14,999 | 303 (3.5%) | 117 (4.5%) |
| $15,000 to $19,999 | 505 (5.9%) | 199 (7.6%) |
| $20,000 to $24,999 | 514 (6.0%) | 207 (7.9%) |
| $25,000 to $34,999 | 777 (9.1%) | 324 (12.4%) |
| $35,000 to $49,999 | 774 (9.1%) | 460 (17.6%) |
| $50,000 to $74,999 | 1,603 (18.8%) | 448 (17.2%) |
| $75,000 to $99,999 | 1,130 (13.2%) | 248 (9.5%) |
| $100,000 to $149,999 | 1,511 (17.7%) | 373 (14.3%) |
| $150,000 or more | 1,242 (14.5%) | 94 (3.6%) |
| Total | 8,542 (100.0%) | 2,606 (100.0%) |
Monthly Housing Cost Tiers in Curry County
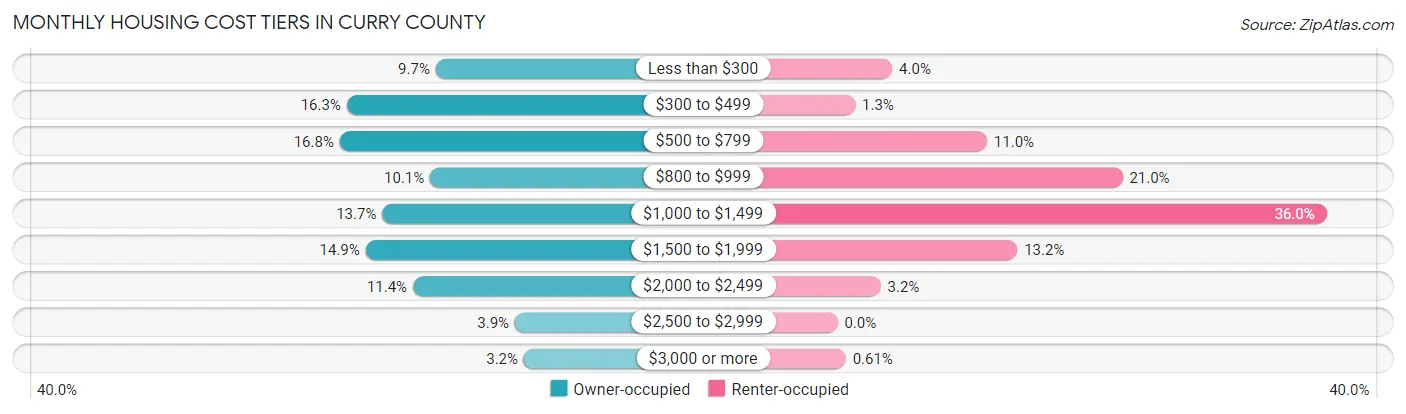
| Monthly Cost | Owner-occupied | Renter-occupied |
| Less than $300 | 830 (9.7%) | 105 (4.0%) |
| $300 to $499 | 1,391 (16.3%) | 34 (1.3%) |
| $500 to $799 | 1,434 (16.8%) | 287 (11.0%) |
| $800 to $999 | 866 (10.1%) | 547 (21.0%) |
| $1,000 to $1,499 | 1,167 (13.7%) | 939 (36.0%) |
| $1,500 to $1,999 | 1,272 (14.9%) | 345 (13.2%) |
| $2,000 to $2,499 | 974 (11.4%) | 83 (3.2%) |
| $2,500 to $2,999 | 332 (3.9%) | 0 (0.0%) |
| $3,000 or more | 276 (3.2%) | 16 (0.6%) |
| Total | 8,542 (100.0%) | 2,606 (100.0%) |
Physical Housing Characteristics in Curry County
Housing Structures in Curry County
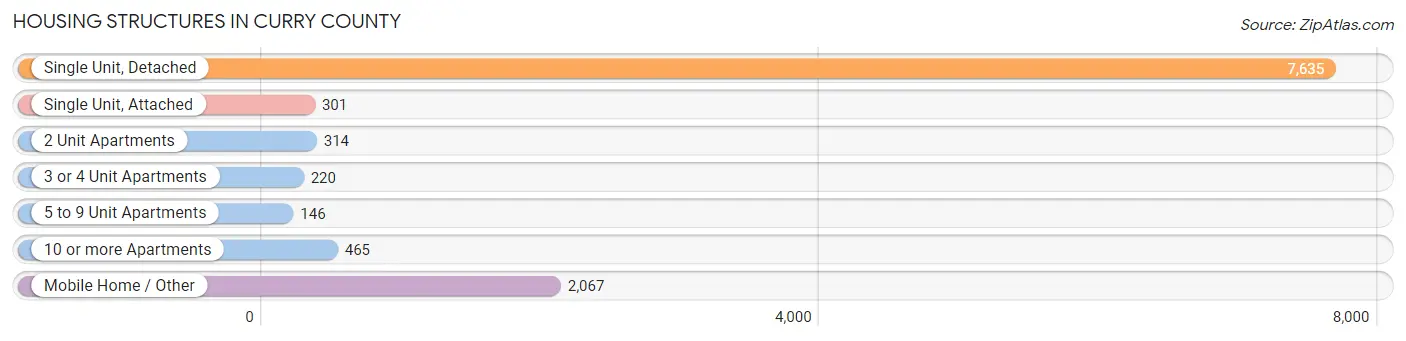
| Structure Type | # Housing Units | % Housing Units |
| Single Unit, Detached | 7,635 | 68.5% |
| Single Unit, Attached | 301 | 2.7% |
| 2 Unit Apartments | 314 | 2.8% |
| 3 or 4 Unit Apartments | 220 | 2.0% |
| 5 to 9 Unit Apartments | 146 | 1.3% |
| 10 or more Apartments | 465 | 4.2% |
| Mobile Home / Other | 2,067 | 18.5% |
| Total | 11,148 | 100.0% |
Housing Structures by Occupancy in Curry County
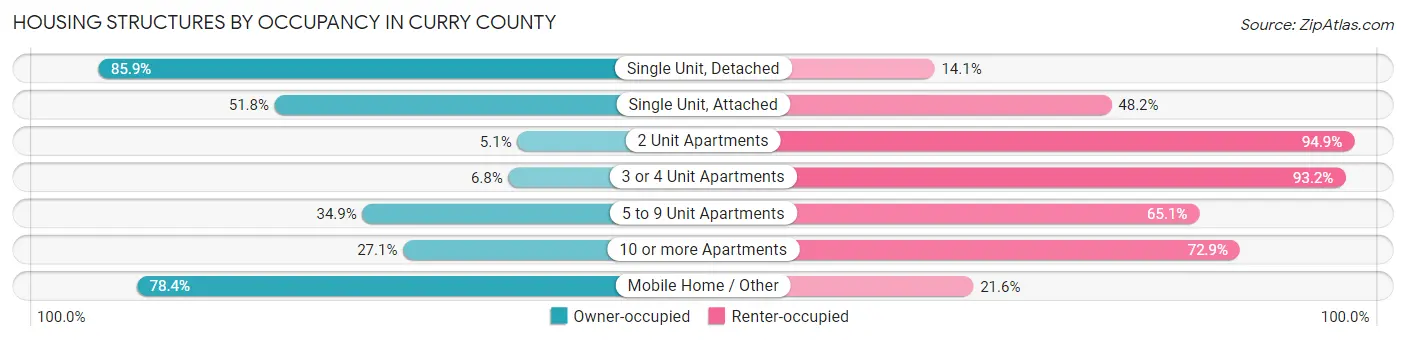
| Structure Type | Owner-occupied | Renter-occupied |
| Single Unit, Detached | 6,557 (85.9%) | 1,078 (14.1%) |
| Single Unit, Attached | 156 (51.8%) | 145 (48.2%) |
| 2 Unit Apartments | 16 (5.1%) | 298 (94.9%) |
| 3 or 4 Unit Apartments | 15 (6.8%) | 205 (93.2%) |
| 5 to 9 Unit Apartments | 51 (34.9%) | 95 (65.1%) |
| 10 or more Apartments | 126 (27.1%) | 339 (72.9%) |
| Mobile Home / Other | 1,621 (78.4%) | 446 (21.6%) |
| Total | 8,542 (76.6%) | 2,606 (23.4%) |
Housing Structures by Number of Rooms in Curry County
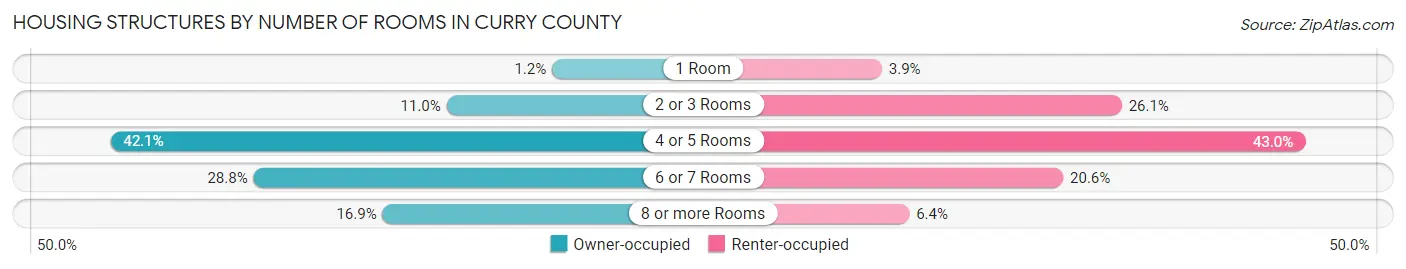
| Number of Rooms | Owner-occupied | Renter-occupied |
| 1 Room | 104 (1.2%) | 101 (3.9%) |
| 2 or 3 Rooms | 937 (11.0%) | 679 (26.1%) |
| 4 or 5 Rooms | 3,594 (42.1%) | 1,121 (43.0%) |
| 6 or 7 Rooms | 2,463 (28.8%) | 538 (20.6%) |
| 8 or more Rooms | 1,444 (16.9%) | 167 (6.4%) |
| Total | 8,542 (100.0%) | 2,606 (100.0%) |
Housing Structure by Heating Type in Curry County
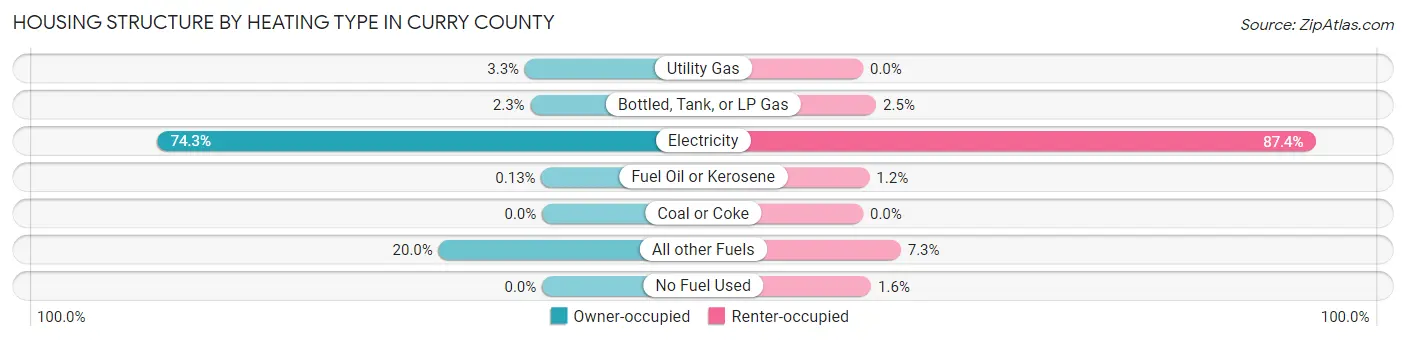
| Heating Type | Owner-occupied | Renter-occupied |
| Utility Gas | 284 (3.3%) | 0 (0.0%) |
| Bottled, Tank, or LP Gas | 192 (2.2%) | 66 (2.5%) |
| Electricity | 6,347 (74.3%) | 2,277 (87.4%) |
| Fuel Oil or Kerosene | 11 (0.1%) | 32 (1.2%) |
| Coal or Coke | 0 (0.0%) | 0 (0.0%) |
| All other Fuels | 1,708 (20.0%) | 190 (7.3%) |
| No Fuel Used | 0 (0.0%) | 41 (1.6%) |
| Total | 8,542 (100.0%) | 2,606 (100.0%) |
Household Vehicle Usage in Curry County
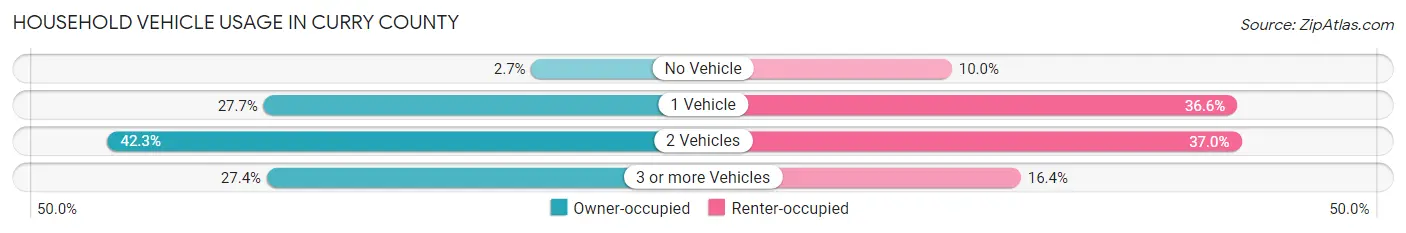
| Vehicles per Household | Owner-occupied | Renter-occupied |
| No Vehicle | 230 (2.7%) | 260 (10.0%) |
| 1 Vehicle | 2,364 (27.7%) | 954 (36.6%) |
| 2 Vehicles | 3,609 (42.2%) | 964 (37.0%) |
| 3 or more Vehicles | 2,339 (27.4%) | 428 (16.4%) |
| Total | 8,542 (100.0%) | 2,606 (100.0%) |
Real Estate & Mortgages in Curry County
Real Estate and Mortgage Overview in Curry County
| Characteristic | Without Mortgage | With Mortgage |
| Housing Units | 3,866 | 4,676 |
| Median Property Value | $314,400 | $379,000 |
| Median Household Income | $39,776 | $1,006 |
| Monthly Housing Costs | $470 | $276 |
| Real Estate Taxes | $1,631 | $256 |
Property Value by Mortgage Status in Curry County
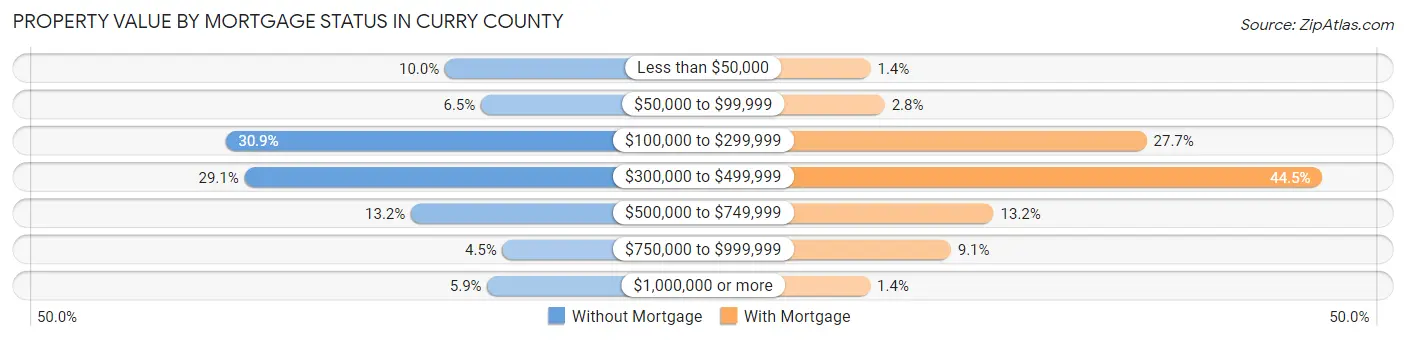
| Property Value | Without Mortgage | With Mortgage |
| Less than $50,000 | 385 (10.0%) | 67 (1.4%) |
| $50,000 to $99,999 | 252 (6.5%) | 130 (2.8%) |
| $100,000 to $299,999 | 1,194 (30.9%) | 1,296 (27.7%) |
| $300,000 to $499,999 | 1,123 (29.0%) | 2,079 (44.5%) |
| $500,000 to $749,999 | 510 (13.2%) | 615 (13.2%) |
| $750,000 to $999,999 | 173 (4.5%) | 424 (9.1%) |
| $1,000,000 or more | 229 (5.9%) | 65 (1.4%) |
| Total | 3,866 (100.0%) | 4,676 (100.0%) |
Household Income by Mortgage Status in Curry County
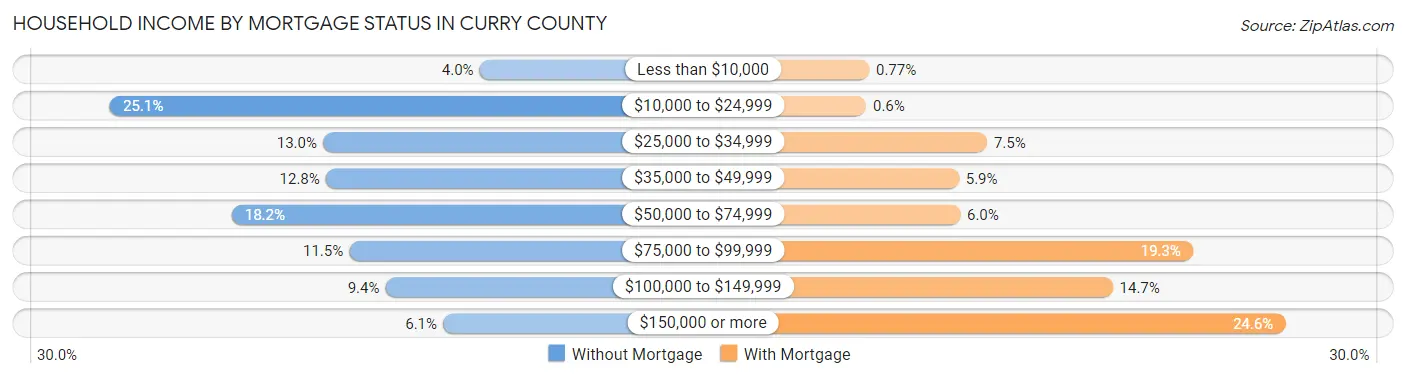
| Household Income | Without Mortgage | With Mortgage |
| Less than $10,000 | 155 (4.0%) | 36 (0.8%) |
| $10,000 to $24,999 | 971 (25.1%) | 28 (0.6%) |
| $25,000 to $34,999 | 501 (13.0%) | 351 (7.5%) |
| $35,000 to $49,999 | 495 (12.8%) | 276 (5.9%) |
| $50,000 to $74,999 | 702 (18.2%) | 279 (6.0%) |
| $75,000 to $99,999 | 443 (11.5%) | 901 (19.3%) |
| $100,000 to $149,999 | 363 (9.4%) | 687 (14.7%) |
| $150,000 or more | 236 (6.1%) | 1,148 (24.5%) |
| Total | 3,866 (100.0%) | 4,676 (100.0%) |
Property Value to Household Income Ratio in Curry County
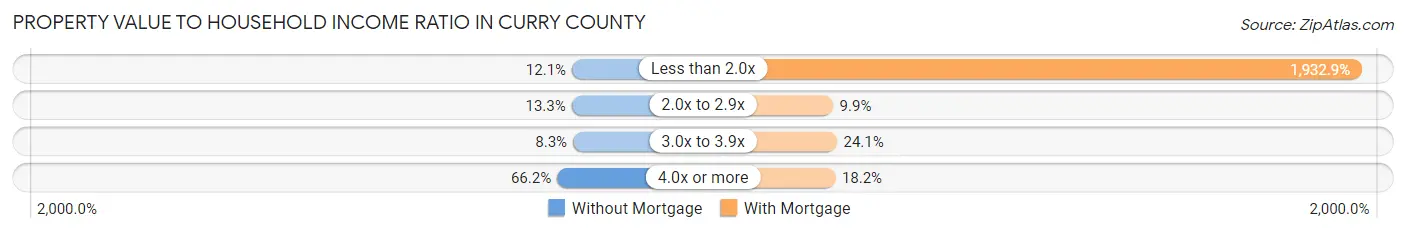
| Value-to-Income Ratio | Without Mortgage | With Mortgage |
| Less than 2.0x | 469 (12.1%) | 90,382 (1,932.9%) |
| 2.0x to 2.9x | 513 (13.3%) | 463 (9.9%) |
| 3.0x to 3.9x | 319 (8.3%) | 1,125 (24.1%) |
| 4.0x or more | 2,560 (66.2%) | 853 (18.2%) |
| Total | 3,866 (100.0%) | 4,676 (100.0%) |
Real Estate Taxes by Mortgage Status in Curry County
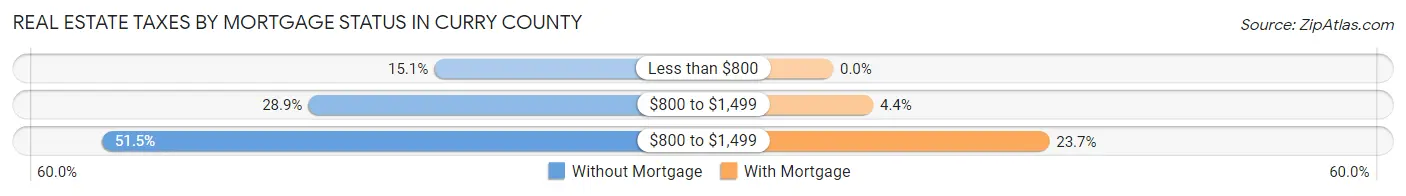
| Property Taxes | Without Mortgage | With Mortgage |
| Less than $800 | 585 (15.1%) | 0 (0.0%) |
| $800 to $1,499 | 1,118 (28.9%) | 205 (4.4%) |
| $800 to $1,499 | 1,992 (51.5%) | 1,108 (23.7%) |
| Total | 3,866 (100.0%) | 4,676 (100.0%) |
Health & Disability in Curry County
Health Insurance Coverage by Age in Curry County
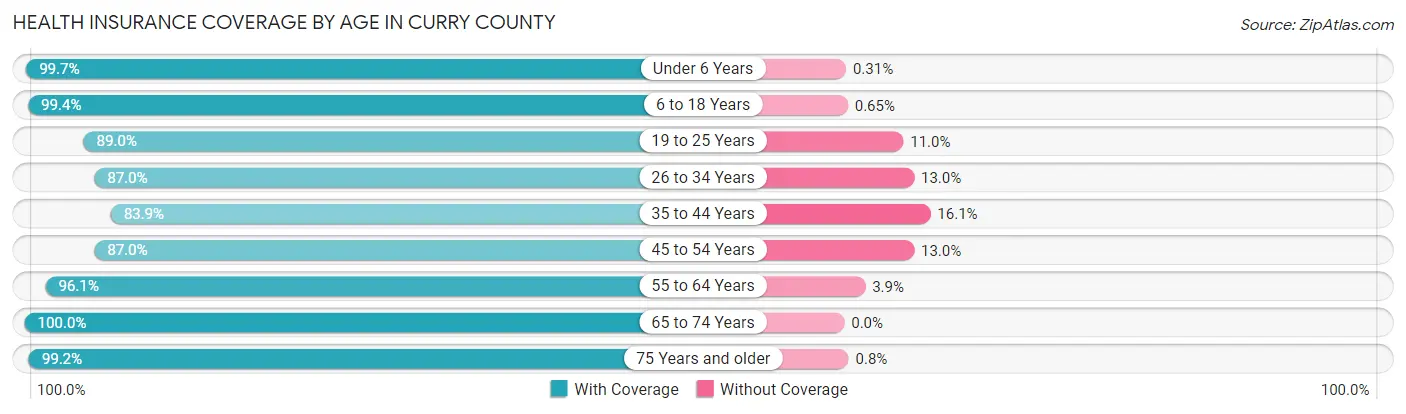
| Age Bracket | With Coverage | Without Coverage |
| Under 6 Years | 966 (99.7%) | 3 (0.3%) |
| 6 to 18 Years | 2,461 (99.4%) | 16 (0.6%) |
| 19 to 25 Years | 785 (89.0%) | 97 (11.0%) |
| 26 to 34 Years | 1,914 (87.0%) | 286 (13.0%) |
| 35 to 44 Years | 1,767 (83.9%) | 338 (16.1%) |
| 45 to 54 Years | 2,048 (87.0%) | 306 (13.0%) |
| 55 to 64 Years | 4,142 (96.1%) | 168 (3.9%) |
| 65 to 74 Years | 4,859 (100.0%) | 0 (0.0%) |
| 75 Years and older | 3,098 (99.2%) | 25 (0.8%) |
| Total | 22,040 (94.7%) | 1,239 (5.3%) |
Health Insurance Coverage by Citizenship Status in Curry County
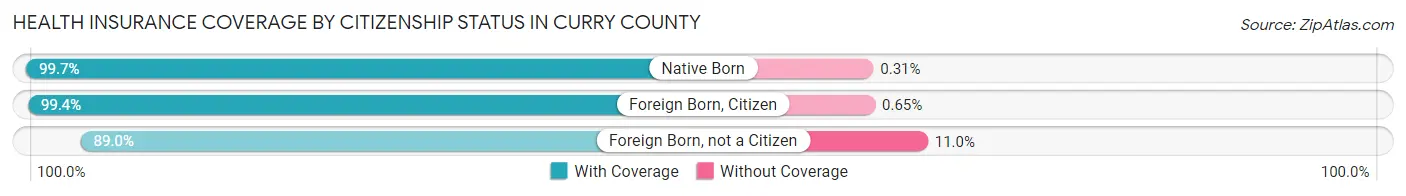
| Citizenship Status | With Coverage | Without Coverage |
| Native Born | 966 (99.7%) | 3 (0.3%) |
| Foreign Born, Citizen | 2,461 (99.4%) | 16 (0.6%) |
| Foreign Born, not a Citizen | 785 (89.0%) | 97 (11.0%) |
Health Insurance Coverage by Household Income in Curry County
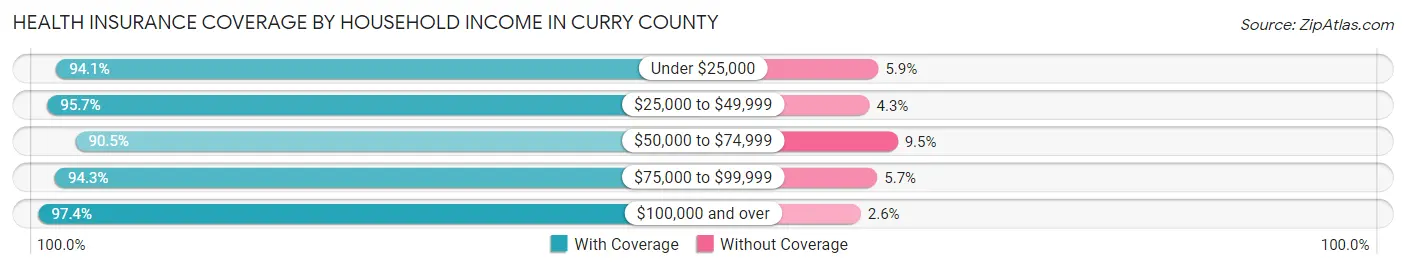
| Household Income | With Coverage | Without Coverage |
| Under $25,000 | 3,007 (94.1%) | 190 (5.9%) |
| $25,000 to $49,999 | 4,010 (95.7%) | 179 (4.3%) |
| $50,000 to $74,999 | 4,762 (90.5%) | 502 (9.5%) |
| $75,000 to $99,999 | 2,671 (94.3%) | 162 (5.7%) |
| $100,000 and over | 7,433 (97.4%) | 201 (2.6%) |
Public vs Private Health Insurance Coverage by Age in Curry County
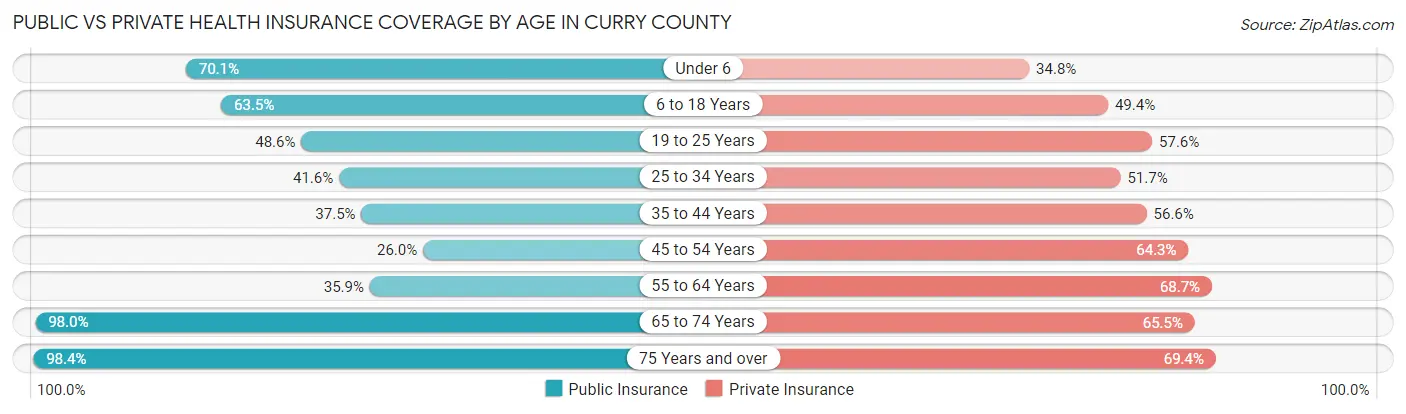
| Age Bracket | Public Insurance | Private Insurance |
| Under 6 | 679 (70.1%) | 337 (34.8%) |
| 6 to 18 Years | 1,574 (63.5%) | 1,224 (49.4%) |
| 19 to 25 Years | 429 (48.6%) | 508 (57.6%) |
| 25 to 34 Years | 916 (41.6%) | 1,138 (51.7%) |
| 35 to 44 Years | 789 (37.5%) | 1,191 (56.6%) |
| 45 to 54 Years | 613 (26.0%) | 1,514 (64.3%) |
| 55 to 64 Years | 1,548 (35.9%) | 2,961 (68.7%) |
| 65 to 74 Years | 4,763 (98.0%) | 3,183 (65.5%) |
| 75 Years and over | 3,073 (98.4%) | 2,168 (69.4%) |
| Total | 14,384 (61.8%) | 14,224 (61.1%) |
Disability Status by Sex by Age in Curry County
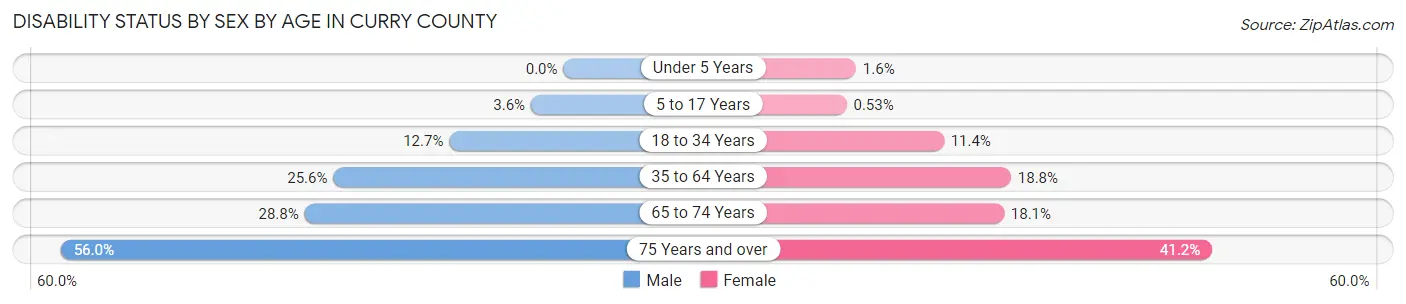
| Age Bracket | Male | Female |
| Under 5 Years | 0 (0.0%) | 7 (1.6%) |
| 5 to 17 Years | 43 (3.6%) | 7 (0.5%) |
| 18 to 34 Years | 231 (12.7%) | 159 (11.4%) |
| 35 to 64 Years | 1,072 (25.6%) | 863 (18.8%) |
| 65 to 74 Years | 685 (28.8%) | 448 (18.0%) |
| 75 Years and over | 863 (56.0%) | 652 (41.2%) |
Disability Class by Sex by Age in Curry County
Disability Class: Hearing Difficulty
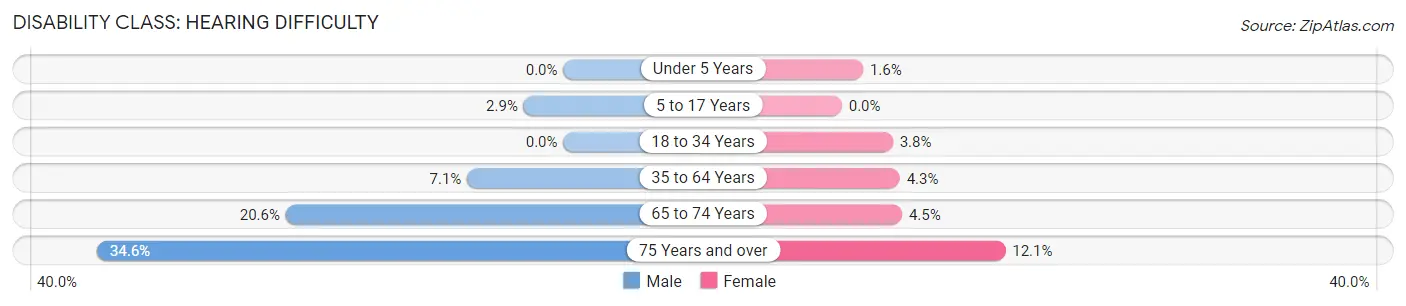
| Age Bracket | Male | Female |
| Under 5 Years | 0 (0.0%) | 7 (1.6%) |
| 5 to 17 Years | 35 (2.9%) | 0 (0.0%) |
| 18 to 34 Years | 0 (0.0%) | 53 (3.8%) |
| 35 to 64 Years | 299 (7.1%) | 197 (4.3%) |
| 65 to 74 Years | 490 (20.6%) | 111 (4.5%) |
| 75 Years and over | 534 (34.6%) | 192 (12.1%) |
Disability Class: Vision Difficulty
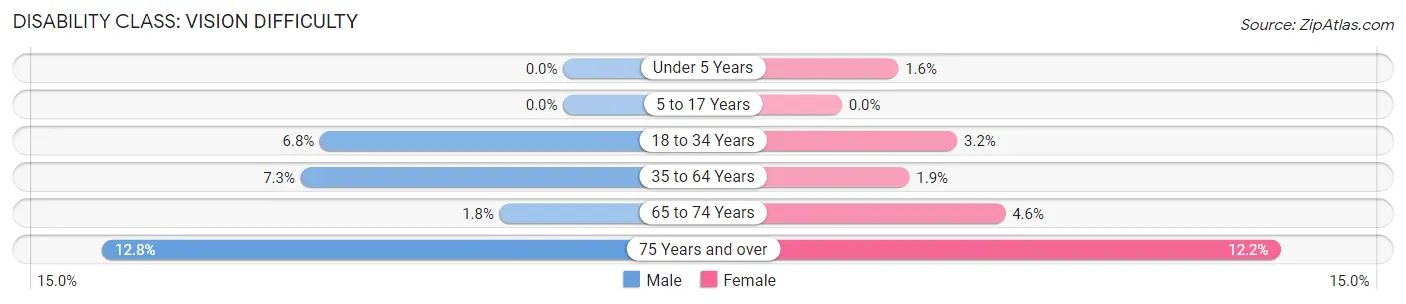
| Age Bracket | Male | Female |
| Under 5 Years | 0 (0.0%) | 7 (1.6%) |
| 5 to 17 Years | 0 (0.0%) | 0 (0.0%) |
| 18 to 34 Years | 123 (6.8%) | 45 (3.2%) |
| 35 to 64 Years | 306 (7.3%) | 86 (1.9%) |
| 65 to 74 Years | 42 (1.8%) | 113 (4.5%) |
| 75 Years and over | 198 (12.8%) | 193 (12.2%) |
Disability Class: Cognitive Difficulty
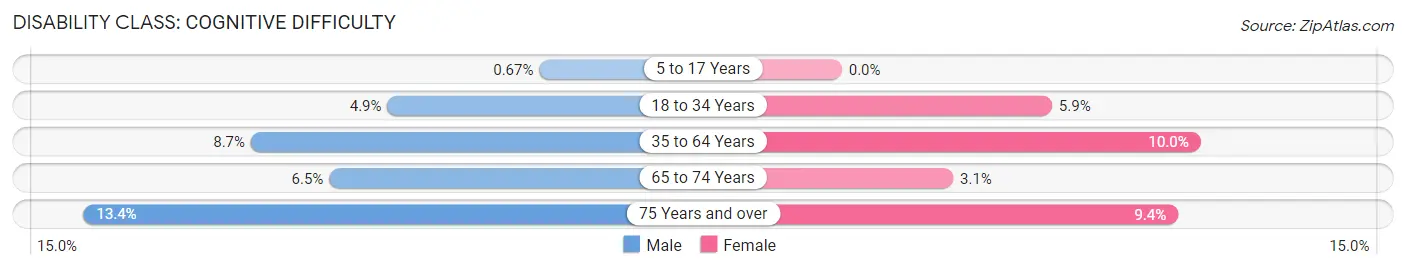
| Age Bracket | Male | Female |
| 5 to 17 Years | 8 (0.7%) | 0 (0.0%) |
| 18 to 34 Years | 89 (4.9%) | 82 (5.9%) |
| 35 to 64 Years | 364 (8.7%) | 458 (10.0%) |
| 65 to 74 Years | 155 (6.5%) | 77 (3.1%) |
| 75 Years and over | 206 (13.4%) | 148 (9.4%) |
Disability Class: Ambulatory Difficulty
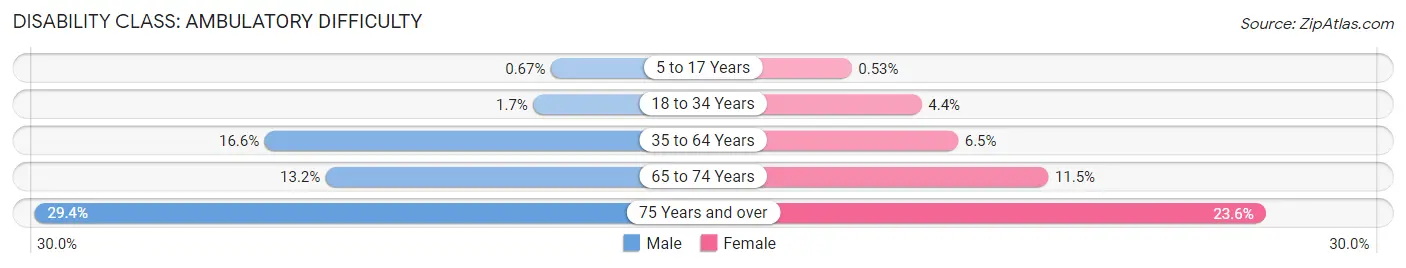
| Age Bracket | Male | Female |
| 5 to 17 Years | 8 (0.7%) | 7 (0.5%) |
| 18 to 34 Years | 30 (1.7%) | 62 (4.4%) |
| 35 to 64 Years | 695 (16.6%) | 296 (6.5%) |
| 65 to 74 Years | 314 (13.2%) | 285 (11.5%) |
| 75 Years and over | 454 (29.4%) | 373 (23.6%) |
Disability Class: Self-Care Difficulty
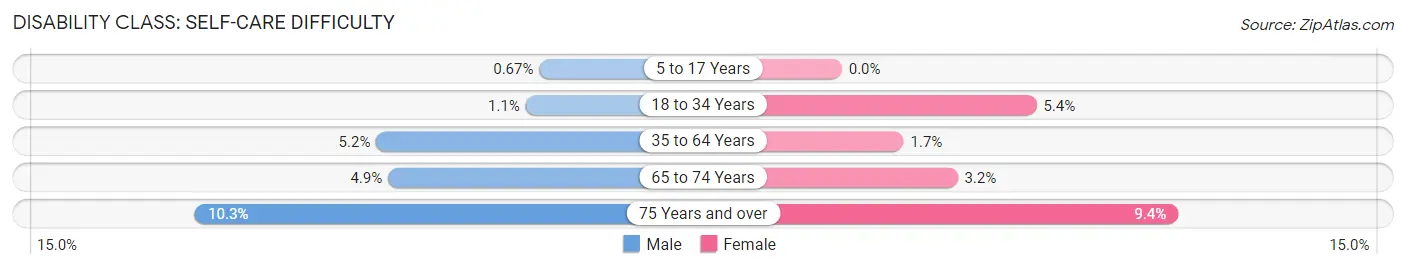
| Age Bracket | Male | Female |
| 5 to 17 Years | 8 (0.7%) | 0 (0.0%) |
| 18 to 34 Years | 19 (1.1%) | 76 (5.4%) |
| 35 to 64 Years | 218 (5.2%) | 79 (1.7%) |
| 65 to 74 Years | 116 (4.9%) | 80 (3.2%) |
| 75 Years and over | 158 (10.2%) | 148 (9.4%) |
Technology Access in Curry County
Computing Device Access in Curry County
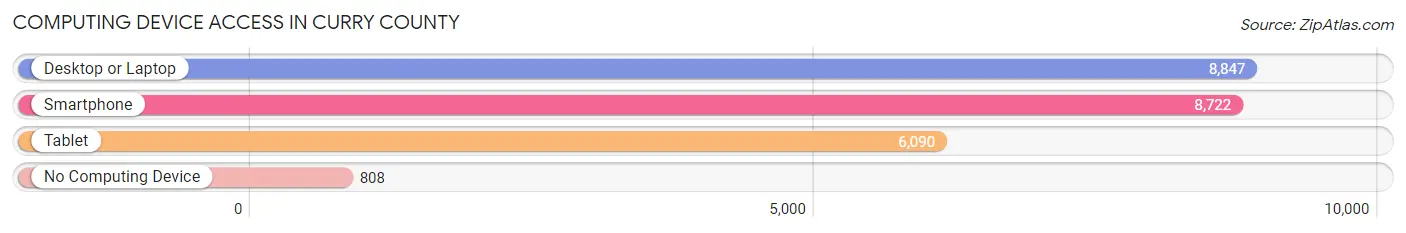
| Device Type | # Households | % Households |
| Desktop or Laptop | 8,847 | 79.4% |
| Smartphone | 8,722 | 78.2% |
| Tablet | 6,090 | 54.6% |
| No Computing Device | 808 | 7.2% |
| Total | 11,148 | 100.0% |
Internet Access in Curry County
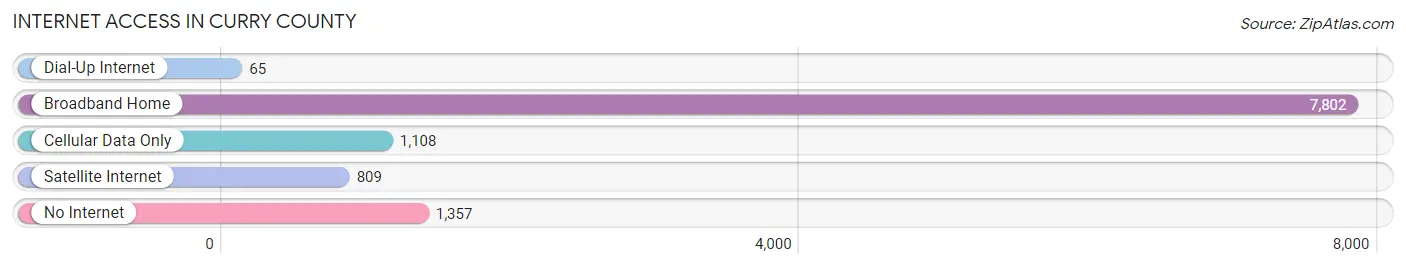
| Internet Type | # Households | % Households |
| Dial-Up Internet | 65 | 0.6% |
| Broadband Home | 7,802 | 70.0% |
| Cellular Data Only | 1,108 | 9.9% |
| Satellite Internet | 809 | 7.3% |
| No Internet | 1,357 | 12.2% |
| Total | 11,148 | 100.0% |
Curry County Summary
Curry County is located in the southwestern corner of Oregon, along the Pacific Ocean. It is bordered by Coos County to the north, Douglas County to the east, and Del Norte County, California to the south. The county seat is Gold Beach, and the largest city is Brookings. The county was named after George Law Curry, the first governor of the Oregon Territory.
Geography
Curry County covers an area of 1,988 square miles, making it the fifth-largest county in Oregon. The terrain is mostly mountainous, with the highest point being the summit of Mount Emily at 4,788 feet. The county is home to several rivers, including the Rogue, Chetco, and Elk Rivers. The coastline is rugged and scenic, with many beaches and coves.
Climate
Curry County has a mild, temperate climate, with warm summers and mild winters. Average temperatures range from a low of 36°F in January to a high of 73°F in July. Average annual precipitation is around 50 inches, with most of it falling between October and April.
Demographics
As of the 2010 census, Curry County had a population of 22,364. The racial makeup of the county was 91.2% White, 0.7% African American, 1.3% Native American, 1.2% Asian, 0.2% Pacific Islander, 2.3% from other races, and 3.2% from two or more races. Hispanic or Latino of any race were 6.2% of the population.
Economy
Curry County’s economy is largely based on tourism, fishing, and timber. The county is home to several state parks, including the Samuel H. Boardman State Scenic Corridor, which is a popular destination for hikers and campers. The county is also home to several commercial fishing operations, and the timber industry is a major employer. Other industries in the county include manufacturing, retail, and healthcare.
History
Curry County was created in 1855, and was originally part of Coos County. It was named after George Law Curry, the first governor of the Oregon Territory. The county seat was originally Port Orford, but was moved to Gold Beach in 1859.
In the late 19th century, the county was home to several gold mining operations, and the town of Gold Beach was founded in 1892. The timber industry began to take off in the early 20th century, and the county’s population began to grow.
In the 1950s, the county began to develop its tourism industry, and the town of Brookings was founded in 1956. The county has continued to grow and develop since then, and today it is a popular destination for tourists and outdoor enthusiasts.
Common Questions
What is the Total Population of Curry County?
Total Population of Curry County is 23,404.
What is the Total Male Population of Curry County?
Total Male Population of Curry County is 11,530.
What is the Total Female Population of Curry County?
Total Female Population of Curry County is 11,874.
What is the Ratio of Males per 100 Females in Curry County?
There are 97.10 Males per 100 Females in Curry County.
What is the Ratio of Females per 100 Males in Curry County?
There are 102.98 Females per 100 Males in Curry County.
What is the Median Population Age in Curry County?
Median Population Age in Curry County is 56.8 Years.
What is the Average Family Size in Curry County
Average Family Size in Curry County is 2.4 People.
What is the Average Household Size in Curry County
Average Household Size in Curry County is 2.1 People.
What is Per Capita Income in Curry County?
Per Capita income in Curry County is $38,214.
What is the Median Family Income in Curry County?
Median Family Income in Curry County is $71,283.
What is the Median Household income in Curry County?
Median Household Income in Curry County is $64,300.
What is Income or Wage Gap in Curry County?
Income or Wage Gap in Curry County is 40.4%.
Women in Curry County earn 59.6 cents for every dollar earned by a man.
What is Family Income Deficit in Curry County?
Family Income Deficit in Curry County is $4,616.
Families that are below poverty line in Curry County earn $4,616 less on average than the poverty threshold level.
What is Inequality or Gini Index in Curry County?
Inequality or Gini Index in Curry County is 0.44.
How Large is the Labor Force in Curry County?
There are 9,519 People in the Labor Forcein in Curry County.
What is the Percentage of People in the Labor Force in Curry County?
46.6% of People are in the Labor Force in Curry County.
What is the Unemployment Rate in Curry County?
Unemployment Rate in Curry County is 7.2%.