Crook County, OR
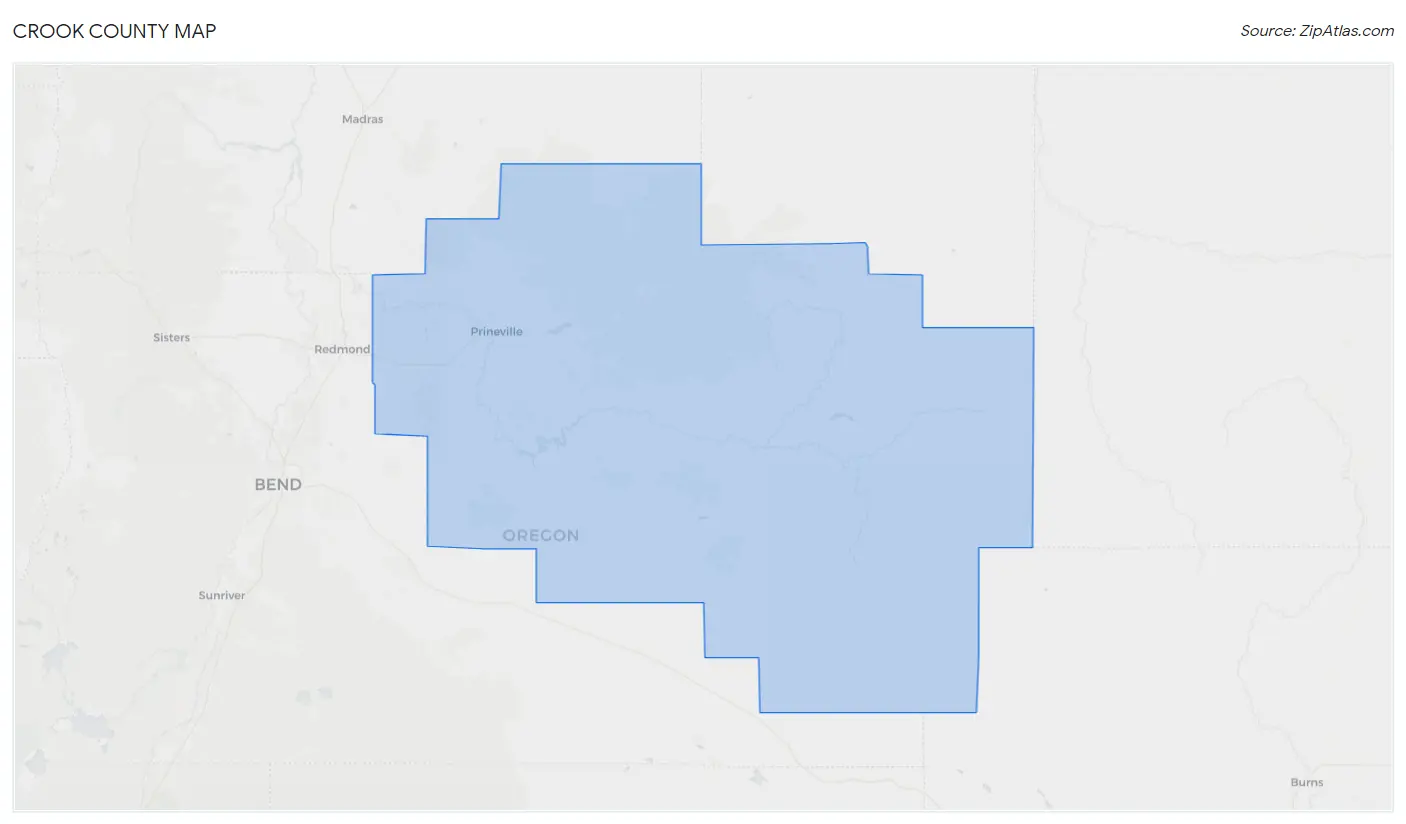
Crook County Map
Crook County Overview
24,987
TOTAL POPULATION
12,493
MALE POPULATION
12,494
FEMALE POPULATION
99.99
MALES / 100 FEMALES
100.01
FEMALES / 100 MALES
47.0
MEDIAN AGE
2.8
AVG FAMILY SIZE
2.4
AVG HOUSEHOLD SIZE
$38,484
PER CAPITA INCOME
$85,708
AVG FAMILY INCOME
$74,969
AVG HOUSEHOLD INCOME
25.2%
WAGE / INCOME GAP [ % ]
74.8¢/ $1
WAGE / INCOME GAP [ $ ]
0.41
INEQUALITY / GINI INDEX
11,774
LABOR FORCE [ PEOPLE ]
57.2%
PERCENT IN LABOR FORCE
4.1%
UNEMPLOYMENT RATE
Crook County Area Codes
Race in Crook County
The most populous races in Crook County are White / Caucasian (22,504 | 90.1%), Hispanic or Latino (2,005 | 8.0%), and Two or more Races (1,531 | 6.1%).
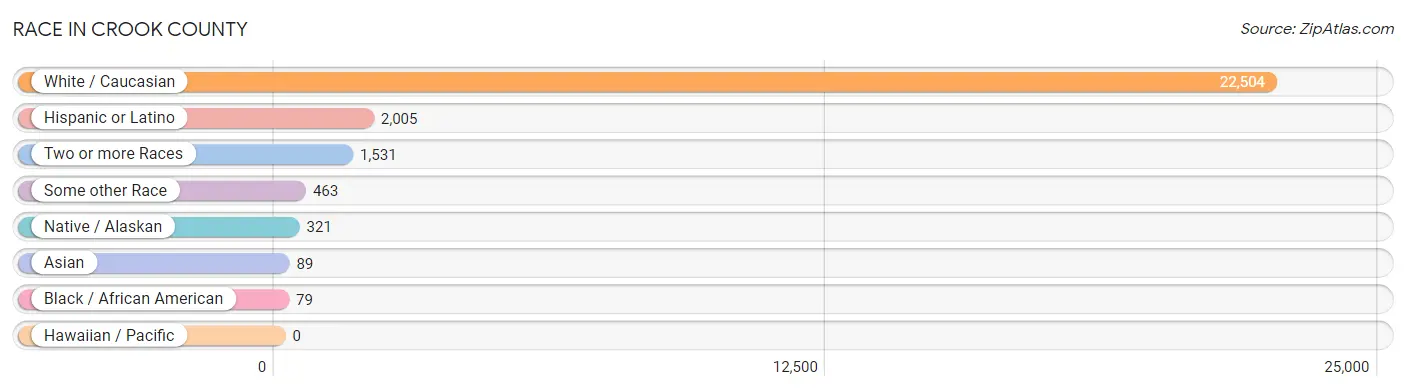
| Race | # Population | % Population |
| Asian | 89 | 0.4% |
| Black / African American | 79 | 0.3% |
| Hawaiian / Pacific | 0 | 0.0% |
| Hispanic or Latino | 2,005 | 8.0% |
| Native / Alaskan | 321 | 1.3% |
| White / Caucasian | 22,504 | 90.1% |
| Two or more Races | 1,531 | 6.1% |
| Some other Race | 463 | 1.8% |
| Total | 24,987 | 100.0% |
Ancestry in Crook County
The most populous ancestries reported in Crook County are German (4,093 | 16.4%), English (3,906 | 15.6%), Irish (2,757 | 11.0%), Mexican (1,522 | 6.1%), and American (1,384 | 5.5%), together accounting for 54.7% of all Crook County residents.
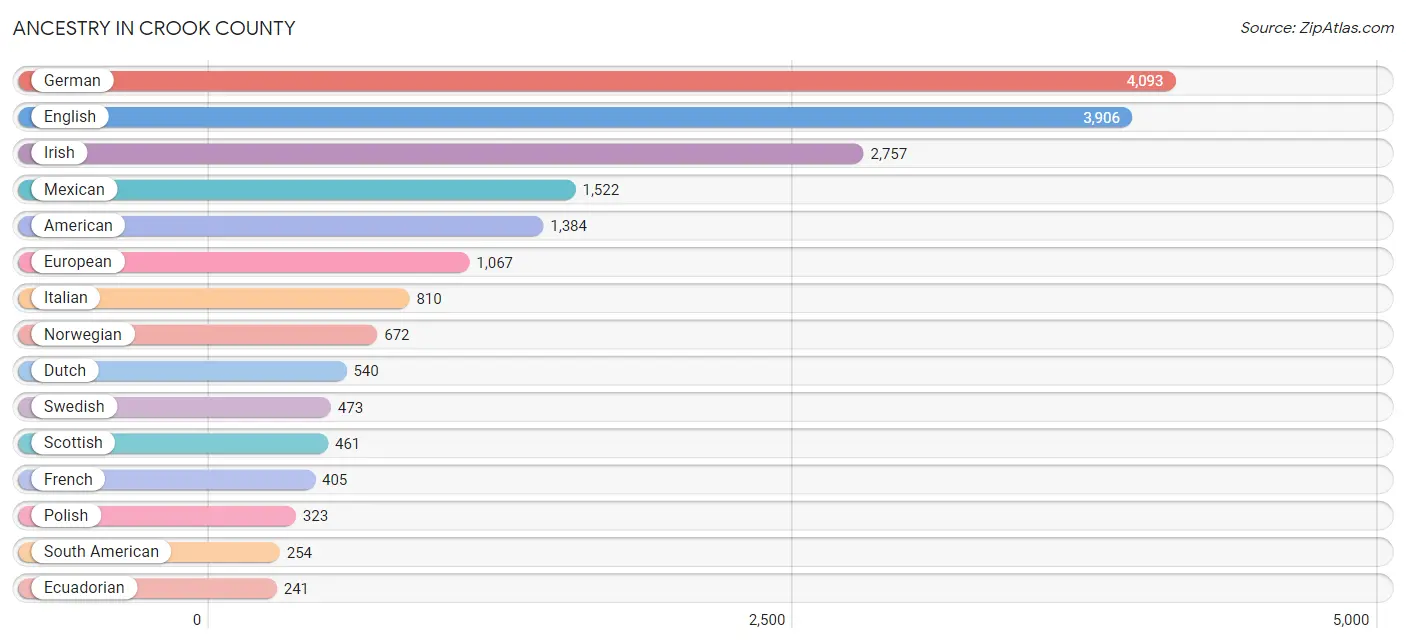
| Ancestry | # Population | % Population |
| African | 16 | 0.1% |
| Alaskan Athabascan | 11 | 0.0% |
| Aleut | 6 | 0.0% |
| American | 1,384 | 5.5% |
| Arab | 32 | 0.1% |
| Basque | 53 | 0.2% |
| Bhutanese | 27 | 0.1% |
| Blackfeet | 41 | 0.2% |
| British | 165 | 0.7% |
| Bulgarian | 23 | 0.1% |
| Burmese | 29 | 0.1% |
| Cambodian | 46 | 0.2% |
| Canadian | 51 | 0.2% |
| Celtic | 79 | 0.3% |
| Central American | 11 | 0.0% |
| Central American Indian | 11 | 0.0% |
| Cherokee | 89 | 0.4% |
| Chickasaw | 10 | 0.0% |
| Chippewa | 14 | 0.1% |
| Creek | 21 | 0.1% |
| Croatian | 11 | 0.0% |
| Czech | 86 | 0.3% |
| Czechoslovakian | 12 | 0.1% |
| Danish | 83 | 0.3% |
| Dutch | 540 | 2.2% |
| Eastern European | 195 | 0.8% |
| Ecuadorian | 241 | 1.0% |
| English | 3,906 | 15.6% |
| European | 1,067 | 4.3% |
| Finnish | 182 | 0.7% |
| French | 405 | 1.6% |
| French Canadian | 68 | 0.3% |
| German | 4,093 | 16.4% |
| Greek | 35 | 0.1% |
| Guatemalan | 11 | 0.0% |
| Hungarian | 8 | 0.0% |
| Indian (Asian) | 35 | 0.1% |
| Inupiat | 18 | 0.1% |
| Irish | 2,757 | 11.0% |
| Italian | 810 | 3.2% |
| Korean | 37 | 0.2% |
| Laotian | 52 | 0.2% |
| Latvian | 114 | 0.5% |
| Luxembourger | 14 | 0.1% |
| Mexican | 1,522 | 6.1% |
| Mexican American Indian | 18 | 0.1% |
| Native Hawaiian | 34 | 0.1% |
| Northern European | 171 | 0.7% |
| Norwegian | 672 | 2.7% |
| Polish | 323 | 1.3% |
| Portuguese | 30 | 0.1% |
| Potawatomi | 59 | 0.2% |
| Puerto Rican | 47 | 0.2% |
| Russian | 110 | 0.4% |
| Scandinavian | 240 | 1.0% |
| Scotch-Irish | 203 | 0.8% |
| Scottish | 461 | 1.8% |
| Sioux | 24 | 0.1% |
| Slavic | 15 | 0.1% |
| Slovene | 31 | 0.1% |
| South American | 254 | 1.0% |
| Spaniard | 50 | 0.2% |
| Spanish | 121 | 0.5% |
| Subsaharan African | 37 | 0.2% |
| Swedish | 473 | 1.9% |
| Swiss | 62 | 0.3% |
| Thai | 16 | 0.1% |
| Tlingit-Haida | 20 | 0.1% |
| Ukrainian | 128 | 0.5% |
| Venezuelan | 13 | 0.1% |
| Welsh | 132 | 0.5% |
| Yakama | 6 | 0.0% |
| Yaqui | 102 | 0.4% | View All 73 Rows |
Immigrants in Crook County
The most numerous immigrant groups reported in Crook County came from Latin America (341 | 1.4%), Central America (263 | 1.1%), Mexico (252 | 1.0%), Europe (185 | 0.7%), and Eastern Europe (121 | 0.5%), together accounting for 4.6% of all Crook County residents.
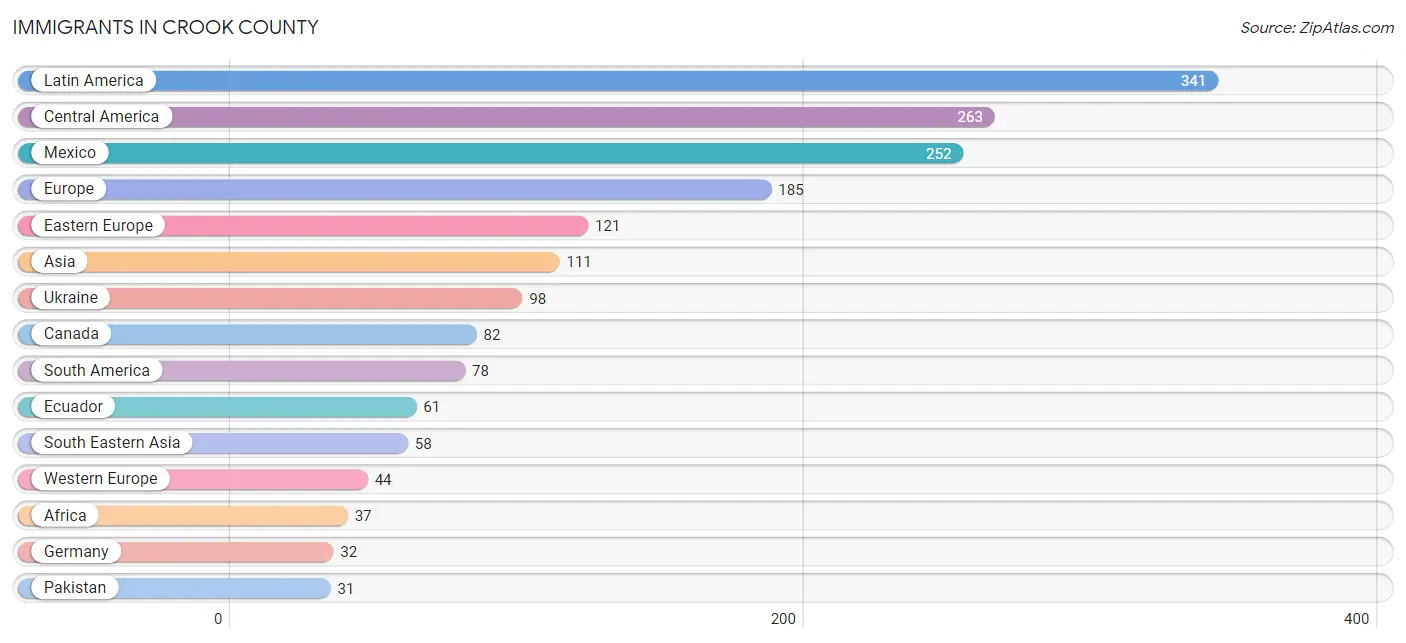
| Immigration Origin | # Population | % Population |
| Africa | 37 | 0.2% |
| Asia | 111 | 0.4% |
| Brazil | 4 | 0.0% |
| Bulgaria | 23 | 0.1% |
| Canada | 82 | 0.3% |
| Central America | 263 | 1.1% |
| Eastern Africa | 21 | 0.1% |
| Eastern Asia | 22 | 0.1% |
| Eastern Europe | 121 | 0.5% |
| Ecuador | 61 | 0.2% |
| Europe | 185 | 0.7% |
| Germany | 32 | 0.1% |
| Greece | 9 | 0.0% |
| Guatemala | 11 | 0.0% |
| Korea | 22 | 0.1% |
| Latin America | 341 | 1.4% |
| Mexico | 252 | 1.0% |
| Netherlands | 12 | 0.1% |
| Northern Europe | 11 | 0.0% |
| Pakistan | 31 | 0.1% |
| Philippines | 29 | 0.1% |
| Scotland | 11 | 0.0% |
| Singapore | 29 | 0.1% |
| South America | 78 | 0.3% |
| South Central Asia | 31 | 0.1% |
| South Eastern Asia | 58 | 0.2% |
| Southern Europe | 9 | 0.0% |
| Uganda | 21 | 0.1% |
| Ukraine | 98 | 0.4% |
| Venezuela | 13 | 0.1% |
| Western Europe | 44 | 0.2% | View All 31 Rows |
Sex and Age in Crook County
Sex and Age in Crook County
The most populous age groups in Crook County are 70 to 74 Years (1,005 | 8.0%) for men and 65 to 69 Years (1,150 | 9.2%) for women.
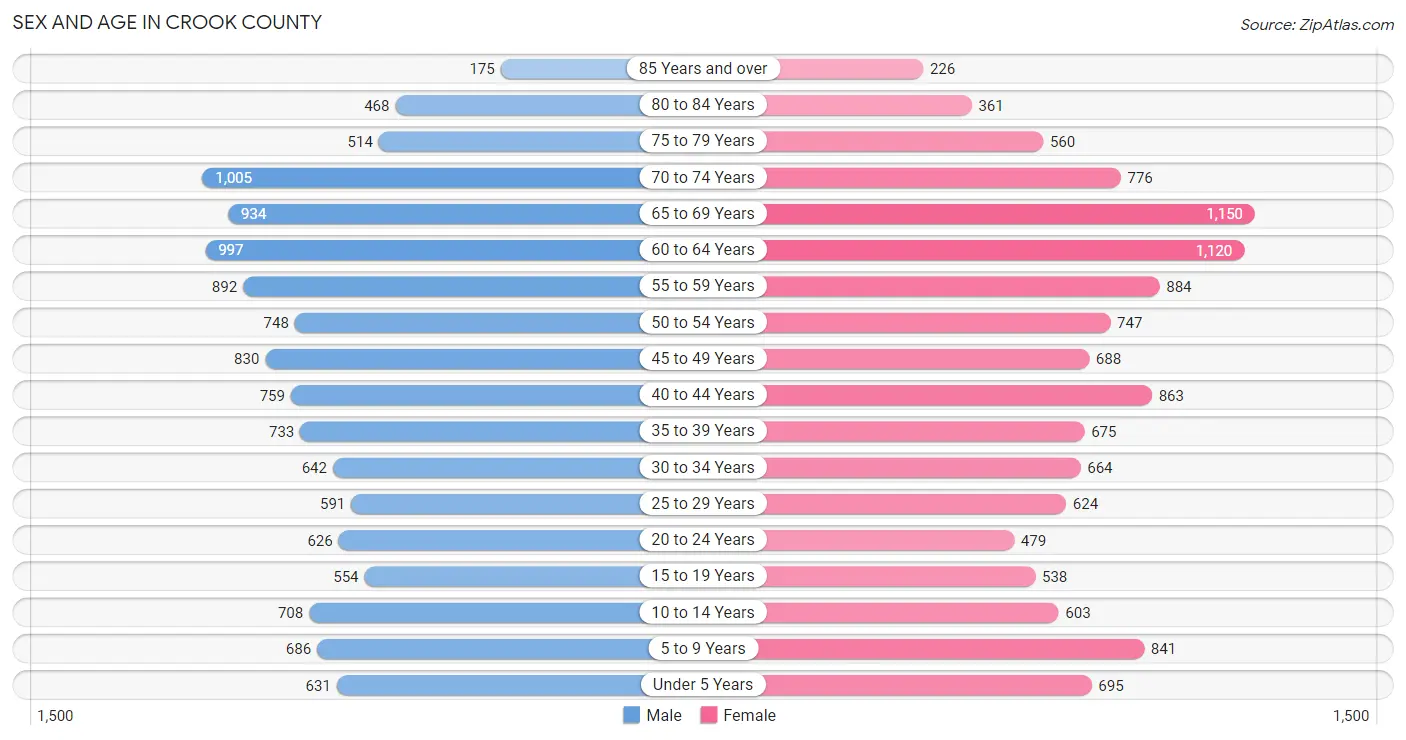
| Age Bracket | Male | Female |
| Under 5 Years | 631 (5.1%) | 695 (5.6%) |
| 5 to 9 Years | 686 (5.5%) | 841 (6.7%) |
| 10 to 14 Years | 708 (5.7%) | 603 (4.8%) |
| 15 to 19 Years | 554 (4.4%) | 538 (4.3%) |
| 20 to 24 Years | 626 (5.0%) | 479 (3.8%) |
| 25 to 29 Years | 591 (4.7%) | 624 (5.0%) |
| 30 to 34 Years | 642 (5.1%) | 664 (5.3%) |
| 35 to 39 Years | 733 (5.9%) | 675 (5.4%) |
| 40 to 44 Years | 759 (6.1%) | 863 (6.9%) |
| 45 to 49 Years | 830 (6.6%) | 688 (5.5%) |
| 50 to 54 Years | 748 (6.0%) | 747 (6.0%) |
| 55 to 59 Years | 892 (7.1%) | 884 (7.1%) |
| 60 to 64 Years | 997 (8.0%) | 1,120 (9.0%) |
| 65 to 69 Years | 934 (7.5%) | 1,150 (9.2%) |
| 70 to 74 Years | 1,005 (8.0%) | 776 (6.2%) |
| 75 to 79 Years | 514 (4.1%) | 560 (4.5%) |
| 80 to 84 Years | 468 (3.7%) | 361 (2.9%) |
| 85 Years and over | 175 (1.4%) | 226 (1.8%) |
| Total | 12,493 (100.0%) | 12,494 (100.0%) |
Families and Households in Crook County
Median Family Size in Crook County
The median family size in Crook County is 2.81 persons per family, with single female/mother families (946 | 13.2%) accounting for the largest median family size of 2.86 persons per family. On the other hand, single male/father families (697 | 9.7%) represent the smallest median family size with 2.48 persons per family.
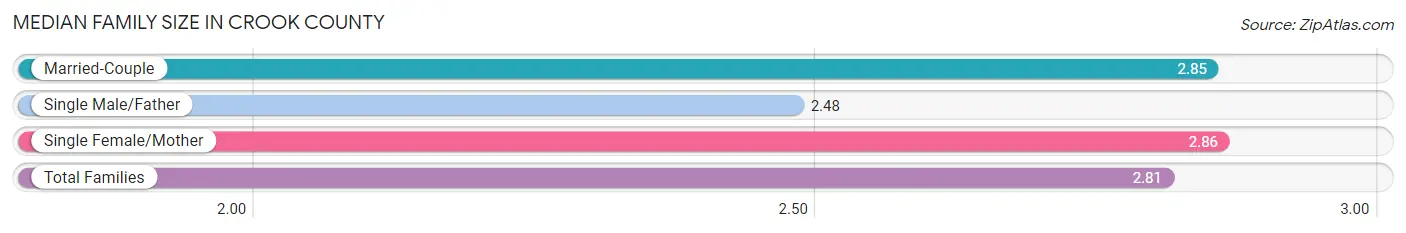
| Family Type | # Families | Family Size |
| Married-Couple | 5,543 (77.1%) | 2.85 |
| Single Male/Father | 697 (9.7%) | 2.48 |
| Single Female/Mother | 946 (13.2%) | 2.86 |
| Total Families | 7,186 (100.0%) | 2.81 |
Median Household Size in Crook County
The median household size in Crook County is 2.41 persons per household, with single female/mother households (946 | 9.2%) accounting for the largest median household size of 3.26 persons per household. non-family households (3,105 | 30.2%) represent the smallest median household size with 1.21 persons per household.
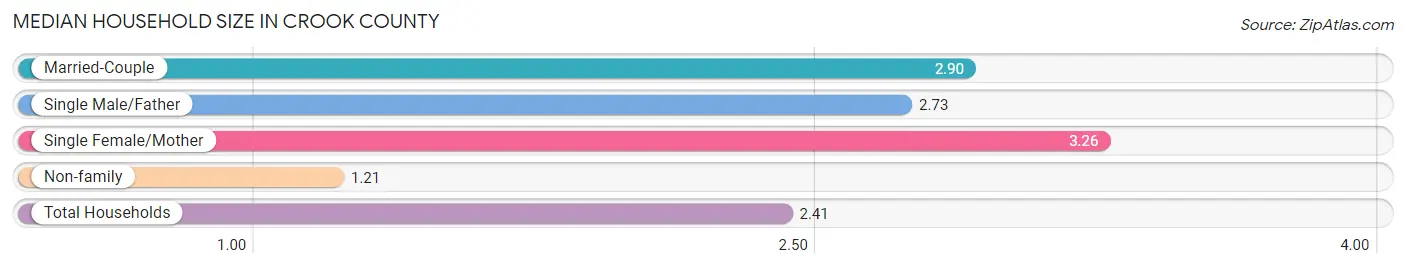
| Household Type | # Households | Household Size |
| Married-Couple | 5,543 (53.9%) | 2.90 |
| Single Male/Father | 697 (6.8%) | 2.73 |
| Single Female/Mother | 946 (9.2%) | 3.26 |
| Non-family | 3,105 (30.2%) | 1.21 |
| Total Households | 10,291 (100.0%) | 2.41 |
Household Size by Marriage Status in Crook County
Out of a total of 10,291 households in Crook County, 7,186 (69.8%) are family households, while 3,105 (30.2%) are nonfamily households. The most numerous type of family households are 2-person households, comprising 3,627, and the most common type of nonfamily households are 1-person households, comprising 2,511.
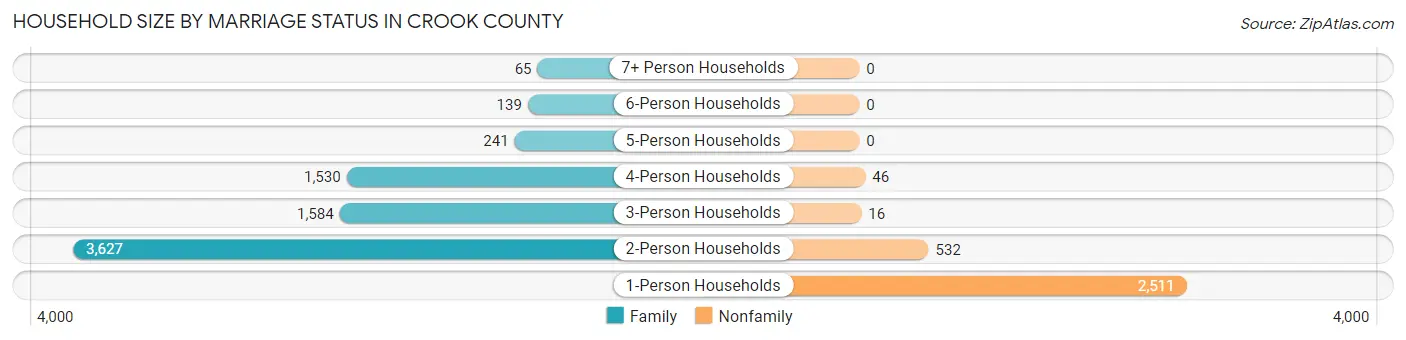
| Household Size | Family Households | Nonfamily Households |
| 1-Person Households | - | 2,511 (24.4%) |
| 2-Person Households | 3,627 (35.2%) | 532 (5.2%) |
| 3-Person Households | 1,584 (15.4%) | 16 (0.2%) |
| 4-Person Households | 1,530 (14.9%) | 46 (0.4%) |
| 5-Person Households | 241 (2.3%) | 0 (0.0%) |
| 6-Person Households | 139 (1.3%) | 0 (0.0%) |
| 7+ Person Households | 65 (0.6%) | 0 (0.0%) |
| Total | 7,186 (69.8%) | 3,105 (30.2%) |
Female Fertility in Crook County
Fertility by Age in Crook County
Average fertility rate in Crook County is 58.0 births per 1,000 women. Women in the age bracket of 20 to 34 years have the highest fertility rate with 71.0 births per 1,000 women. Women in the age bracket of 20 to 34 years acount for 45.6% of all women with births.
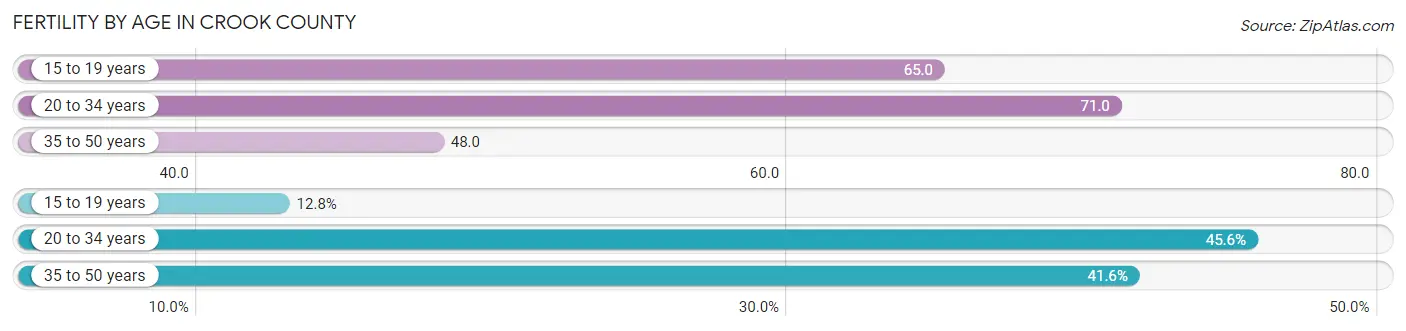
| Age Bracket | Women with Births | Births / 1,000 Women |
| 15 to 19 years | 35 (12.8%) | 65.0 |
| 20 to 34 years | 125 (45.6%) | 71.0 |
| 35 to 50 years | 114 (41.6%) | 48.0 |
| Total | 274 (100.0%) | 58.0 |
Fertility by Age by Marriage Status in Crook County
70.4% of women with births (274) in Crook County are married. The highest percentage of unmarried women with births falls into 15 to 19 years age bracket with 100.0% of them unmarried at the time of birth, while the lowest percentage of unmarried women with births belong to 20 to 34 years age bracket with 15.2% of them unmarried.
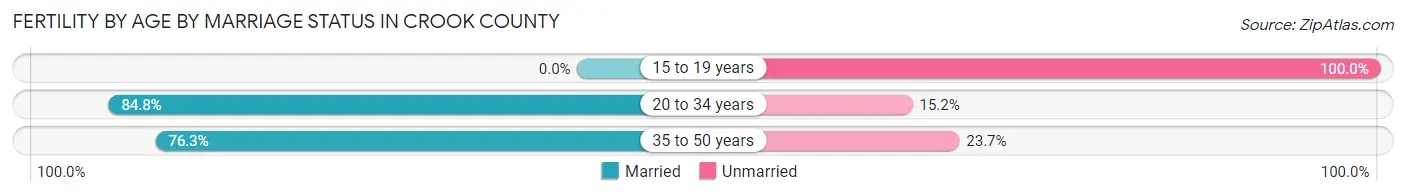
| Age Bracket | Married | Unmarried |
| 15 to 19 years | 0 (0.0%) | 35 (100.0%) |
| 20 to 34 years | 106 (84.8%) | 19 (15.2%) |
| 35 to 50 years | 87 (76.3%) | 27 (23.7%) |
| Total | 193 (70.4%) | 81 (29.6%) |
Fertility by Education in Crook County
Average fertility rate in Crook County is 58.0 births per 1,000 women. Women with the education attainment of graduate degree have the highest fertility rate of 357.0 births per 1,000 women, while women with the education attainment of high school diploma have the lowest fertility at 35.0 births per 1,000 women. Women with the education attainment of college or associate's degree represent 34.7% of all women with births.
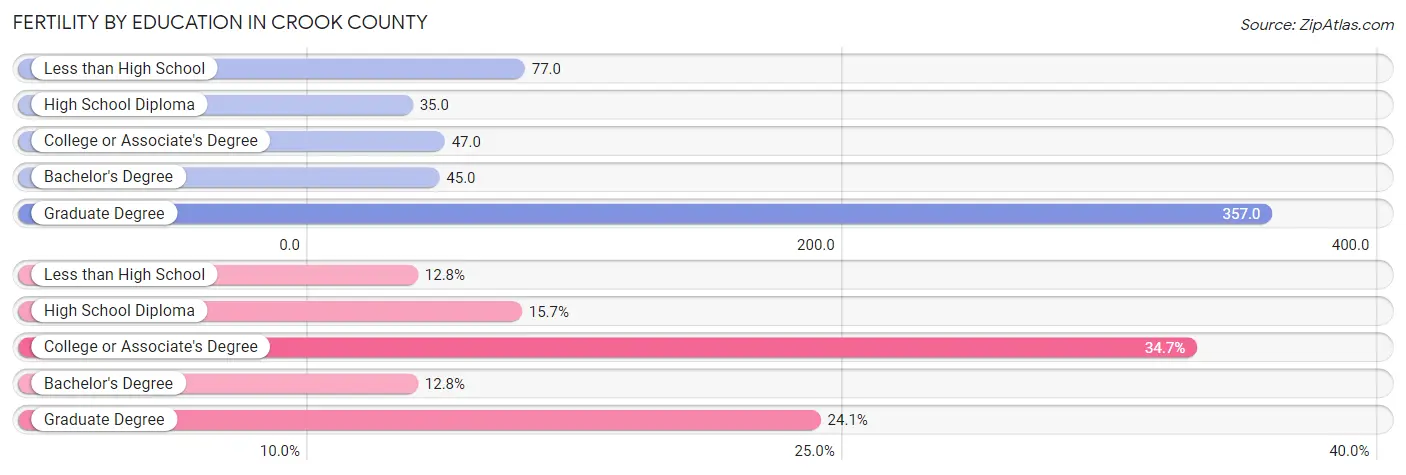
| Educational Attainment | Women with Births | Births / 1,000 Women |
| Less than High School | 35 (12.8%) | 77.0 |
| High School Diploma | 43 (15.7%) | 35.0 |
| College or Associate's Degree | 95 (34.7%) | 47.0 |
| Bachelor's Degree | 35 (12.8%) | 45.0 |
| Graduate Degree | 66 (24.1%) | 357.0 |
| Total | 274 (100.0%) | 58.0 |
Fertility by Education by Marriage Status in Crook County
29.6% of women with births in Crook County are unmarried. Women with the educational attainment of bachelor's degree are most likely to be married with 100.0% of them married at childbirth, while women with the educational attainment of less than high school are least likely to be married with 100.0% of them unmarried at childbirth.
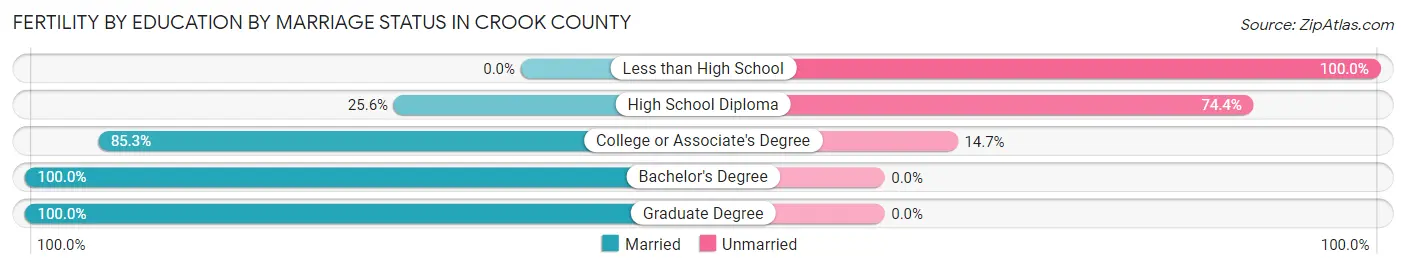
| Educational Attainment | Married | Unmarried |
| Less than High School | 0 (0.0%) | 35 (100.0%) |
| High School Diploma | 11 (25.6%) | 32 (74.4%) |
| College or Associate's Degree | 81 (85.3%) | 14 (14.7%) |
| Bachelor's Degree | 35 (100.0%) | 0 (0.0%) |
| Graduate Degree | 66 (100.0%) | 0 (0.0%) |
| Total | 193 (70.4%) | 81 (29.6%) |
Income in Crook County
Income Overview in Crook County
Per Capita Income in Crook County is $38,484, while median incomes of families and households are $85,708 and $74,969 respectively.
| Characteristic | Number | Measure |
| Per Capita Income | 24,987 | $38,484 |
| Median Family Income | 7,186 | $85,708 |
| Mean Family Income | 7,186 | $105,807 |
| Median Household Income | 10,291 | $74,969 |
| Mean Household Income | 10,291 | $92,863 |
| Income Deficit | 7,186 | $0 |
| Wage / Income Gap (%) | 24,987 | 25.19% |
| Wage / Income Gap ($) | 24,987 | 74.81¢ per $1 |
| Gini / Inequality Index | 24,987 | 0.41 |
Earnings by Sex in Crook County
Average Earnings in Crook County are $40,257, $48,519 for men and $36,297 for women, a difference of 25.2%.
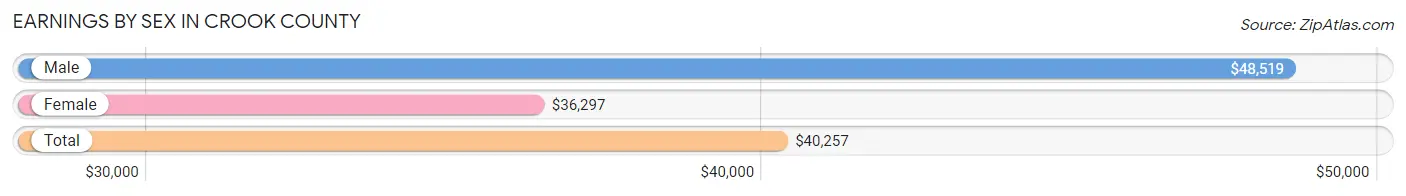
| Sex | Number | Average Earnings |
| Male | 6,702 (54.4%) | $48,519 |
| Female | 5,616 (45.6%) | $36,297 |
| Total | 12,318 (100.0%) | $40,257 |
Earnings by Sex by Income Bracket in Crook County
The most common earnings brackets in Crook County are $75,000 to $99,999 for men (1,050 | 15.7%) and $75,000 to $99,999 for women (644 | 11.5%).
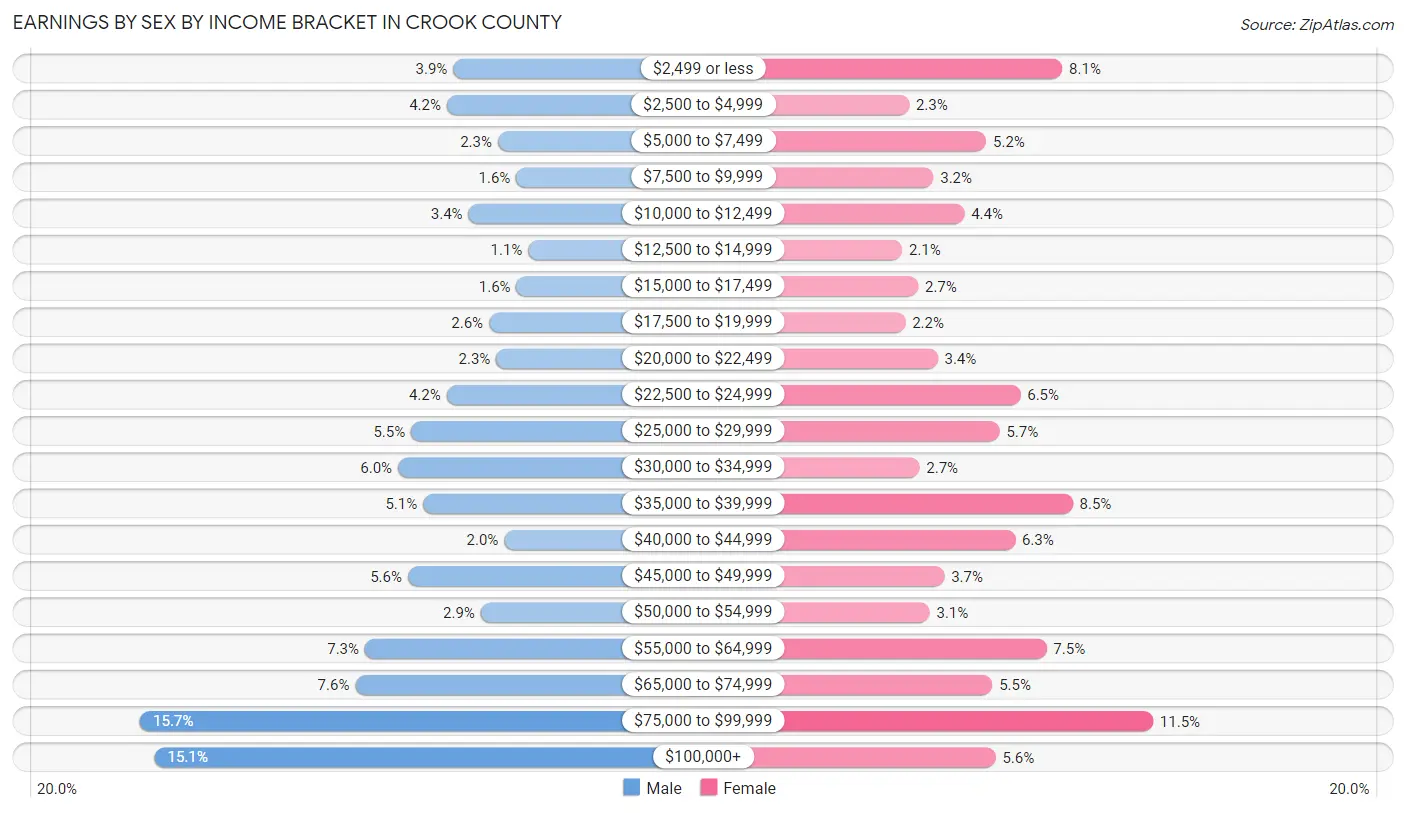
| Income | Male | Female |
| $2,499 or less | 264 (3.9%) | 453 (8.1%) |
| $2,500 to $4,999 | 280 (4.2%) | 131 (2.3%) |
| $5,000 to $7,499 | 152 (2.3%) | 293 (5.2%) |
| $7,500 to $9,999 | 106 (1.6%) | 182 (3.2%) |
| $10,000 to $12,499 | 226 (3.4%) | 247 (4.4%) |
| $12,500 to $14,999 | 76 (1.1%) | 116 (2.1%) |
| $15,000 to $17,499 | 105 (1.6%) | 150 (2.7%) |
| $17,500 to $19,999 | 174 (2.6%) | 123 (2.2%) |
| $20,000 to $22,499 | 156 (2.3%) | 191 (3.4%) |
| $22,500 to $24,999 | 281 (4.2%) | 365 (6.5%) |
| $25,000 to $29,999 | 370 (5.5%) | 321 (5.7%) |
| $30,000 to $34,999 | 403 (6.0%) | 153 (2.7%) |
| $35,000 to $39,999 | 340 (5.1%) | 475 (8.5%) |
| $40,000 to $44,999 | 136 (2.0%) | 354 (6.3%) |
| $45,000 to $49,999 | 378 (5.6%) | 205 (3.6%) |
| $50,000 to $54,999 | 195 (2.9%) | 174 (3.1%) |
| $55,000 to $64,999 | 486 (7.2%) | 420 (7.5%) |
| $65,000 to $74,999 | 510 (7.6%) | 306 (5.4%) |
| $75,000 to $99,999 | 1,050 (15.7%) | 644 (11.5%) |
| $100,000+ | 1,014 (15.1%) | 313 (5.6%) |
| Total | 6,702 (100.0%) | 5,616 (100.0%) |
Earnings by Sex by Educational Attainment in Crook County
Average earnings in Crook County are $56,569 for men and $39,167 for women, a difference of 30.8%. Men with an educational attainment of bachelor's degree enjoy the highest average annual earnings of $87,459, while those with high school diploma education earn the least with $45,533. Women with an educational attainment of graduate degree earn the most with the average annual earnings of $86,750, while those with high school diploma education have the smallest earnings of $34,113.
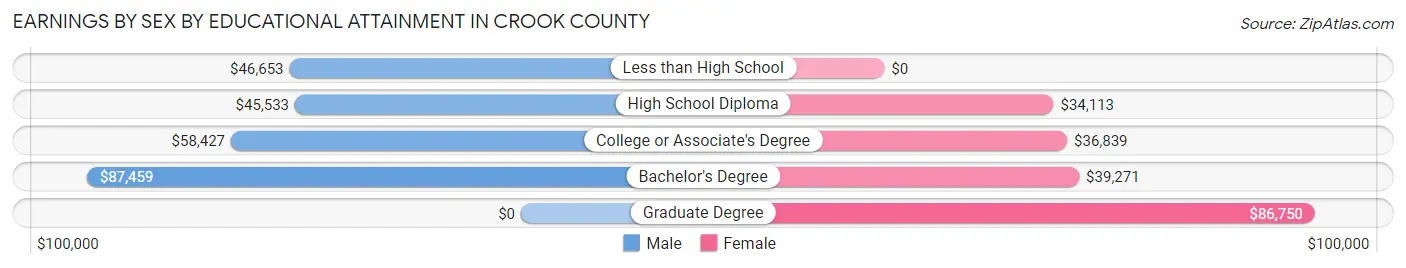
| Educational Attainment | Male Income | Female Income |
| Less than High School | $46,653 | $0 |
| High School Diploma | $45,533 | $34,113 |
| College or Associate's Degree | $58,427 | $36,839 |
| Bachelor's Degree | $87,459 | $39,271 |
| Graduate Degree | - | - |
| Total | $56,569 | $39,167 |
Family Income in Crook County
Family Income Brackets in Crook County
According to the Crook County family income data, there are 1,538 families falling into the $100,000 to $149,999 income range, which is the most common income bracket and makes up 21.4% of all families. Conversely, the $10,000 to $14,999 income bracket is the least frequent group with only 72 families (1.0%) belonging to this category.
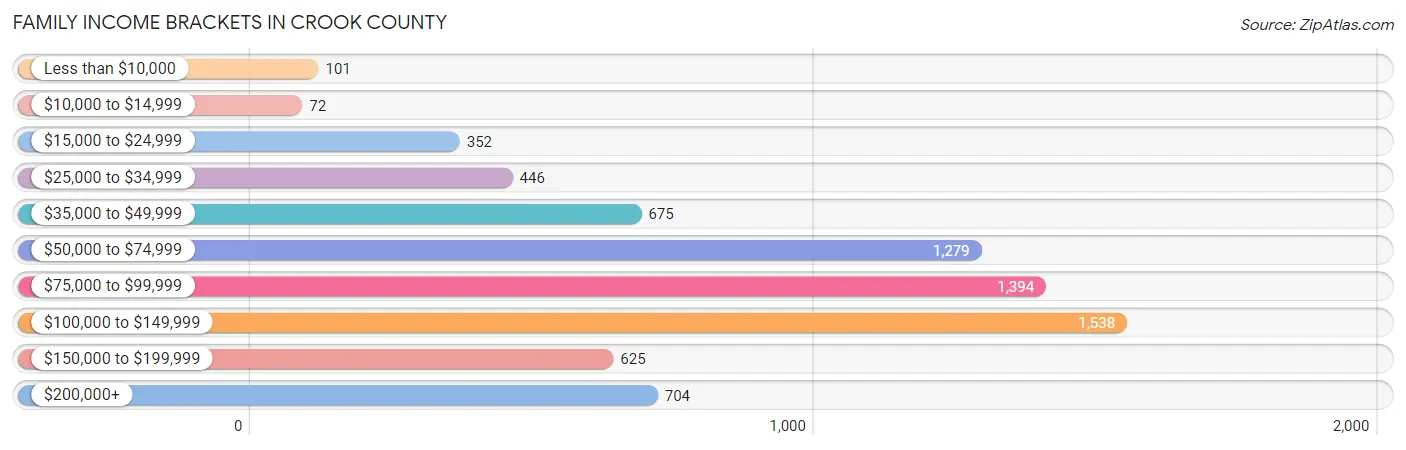
| Income Bracket | # Families | % Families |
| Less than $10,000 | 101 | 1.4% |
| $10,000 to $14,999 | 72 | 1.0% |
| $15,000 to $24,999 | 352 | 4.9% |
| $25,000 to $34,999 | 446 | 6.2% |
| $35,000 to $49,999 | 675 | 9.4% |
| $50,000 to $74,999 | 1,279 | 17.8% |
| $75,000 to $99,999 | 1,394 | 19.4% |
| $100,000 to $149,999 | 1,538 | 21.4% |
| $150,000 to $199,999 | 625 | 8.7% |
| $200,000+ | 704 | 9.8% |
Family Income by Famaliy Size in Crook County
5-person families (190 | 2.6%) account for the highest median family income in Crook County with $111,413 per family, while 2-person families (4,089 | 56.9%) have the highest median income of $40,294 per family member.
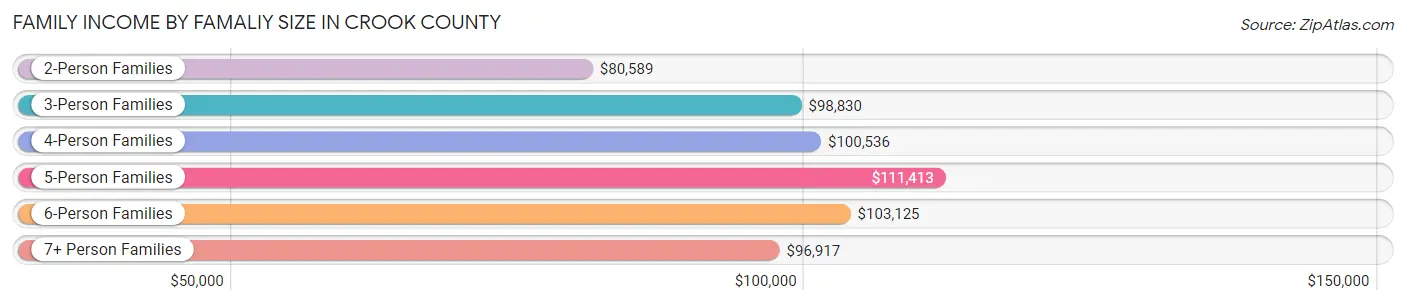
| Income Bracket | # Families | Median Income |
| 2-Person Families | 4,089 (56.9%) | $80,589 |
| 3-Person Families | 1,418 (19.7%) | $98,830 |
| 4-Person Families | 1,303 (18.1%) | $100,536 |
| 5-Person Families | 190 (2.6%) | $111,413 |
| 6-Person Families | 121 (1.7%) | $103,125 |
| 7+ Person Families | 65 (0.9%) | $96,917 |
| Total | 7,186 (100.0%) | $85,708 |
Family Income by Number of Earners in Crook County
The median family income in Crook County is $85,708, with families comprising 3+ earners (645) having the highest median family income of $116,619, while families with no earners (1,444) have the lowest median family income of $64,091, accounting for 9.0% and 20.1% of families, respectively.
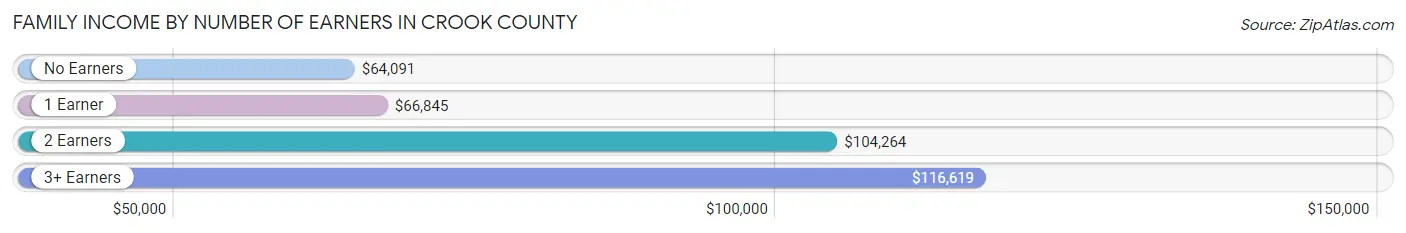
| Number of Earners | # Families | Median Income |
| No Earners | 1,444 (20.1%) | $64,091 |
| 1 Earner | 2,304 (32.1%) | $66,845 |
| 2 Earners | 2,793 (38.9%) | $104,264 |
| 3+ Earners | 645 (9.0%) | $116,619 |
| Total | 7,186 (100.0%) | $85,708 |
Household Income in Crook County
Household Income Brackets in Crook County
With 1,966 households falling in the category, the $50,000 to $74,999 income range is the most frequent in Crook County, accounting for 19.1% of all households. In contrast, only 226 households (2.2%) fall into the less than $10,000 income bracket, making it the least populous group.
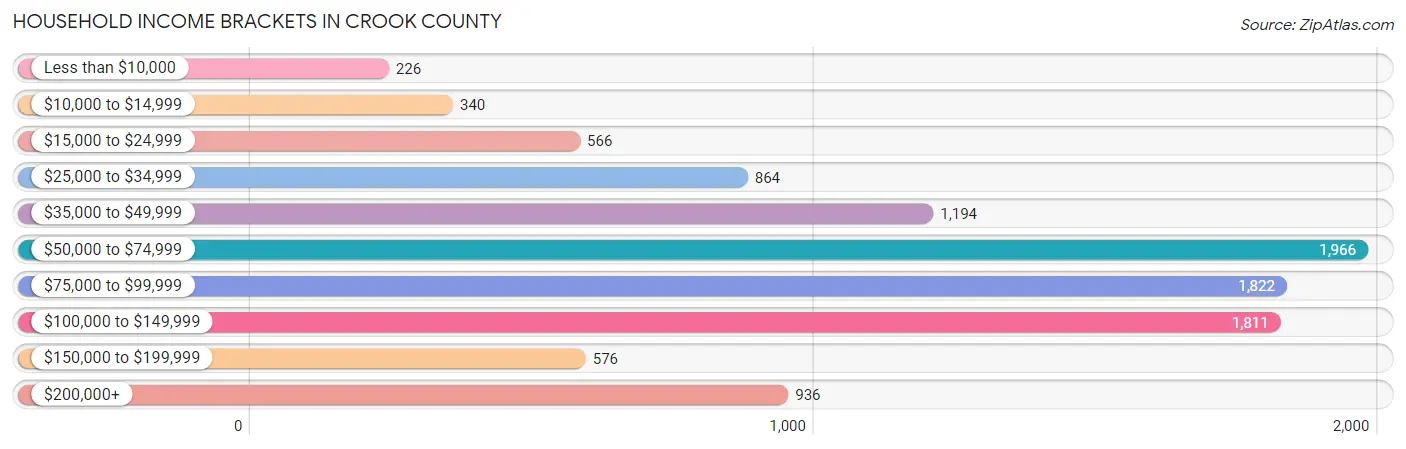
| Income Bracket | # Households | % Households |
| Less than $10,000 | 226 | 2.2% |
| $10,000 to $14,999 | 340 | 3.3% |
| $15,000 to $24,999 | 566 | 5.5% |
| $25,000 to $34,999 | 864 | 8.4% |
| $35,000 to $49,999 | 1,194 | 11.6% |
| $50,000 to $74,999 | 1,966 | 19.1% |
| $75,000 to $99,999 | 1,822 | 17.7% |
| $100,000 to $149,999 | 1,811 | 17.6% |
| $150,000 to $199,999 | 576 | 5.6% |
| $200,000+ | 936 | 9.1% |
Household Income by Householder Age in Crook County
The median household income in Crook County is $74,969, with the highest median household income of $83,036 found in the 25 to 44 years age bracket for the primary householder. A total of 2,572 households (25.0%) fall into this category. Meanwhile, the 15 to 24 years age bracket for the primary householder has the lowest median household income of $39,250, with 170 households (1.7%) in this group.
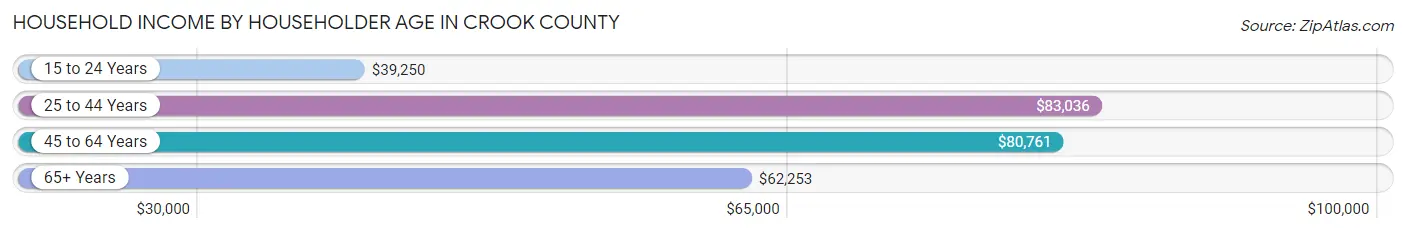
| Income Bracket | # Households | Median Income |
| 15 to 24 Years | 170 (1.7%) | $39,250 |
| 25 to 44 Years | 2,572 (25.0%) | $83,036 |
| 45 to 64 Years | 3,804 (37.0%) | $80,761 |
| 65+ Years | 3,745 (36.4%) | $62,253 |
| Total | 10,291 (100.0%) | $74,969 |
Poverty in Crook County
Income Below Poverty by Sex and Age in Crook County
With 7.4% poverty level for males and 8.4% for females among the residents of Crook County, under 5 year old males and 5 year old females are the most vulnerable to poverty, with 198 males (31.4%) and 11 females (25.0%) in their respective age groups living below the poverty level.
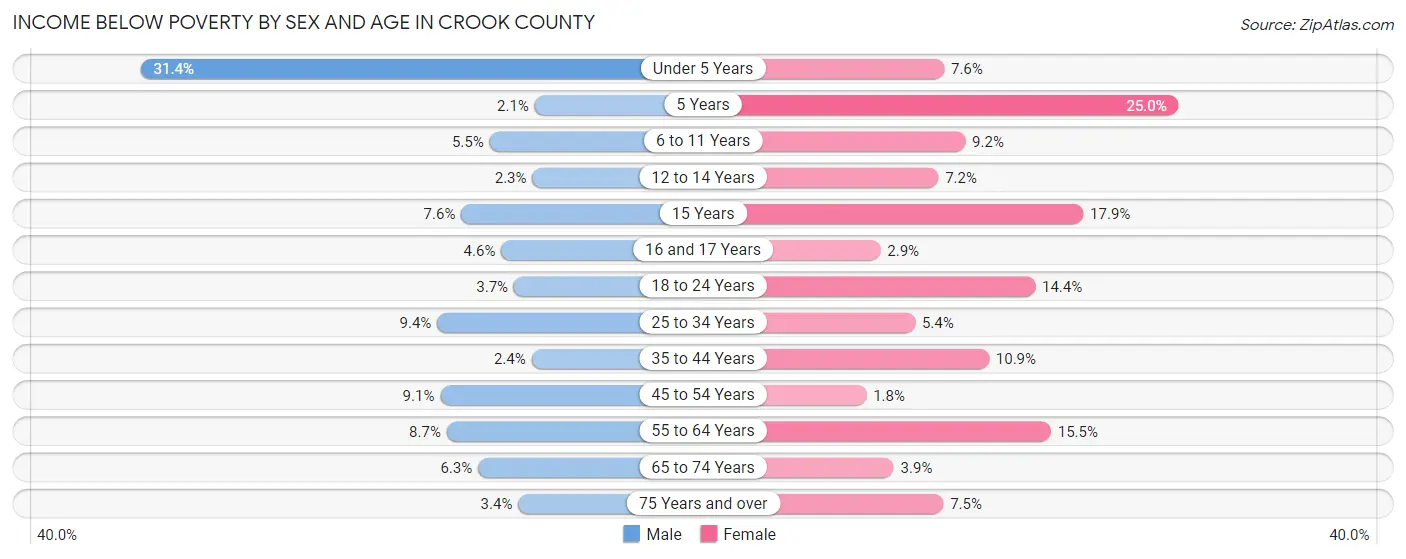
| Age Bracket | Male | Female |
| Under 5 Years | 198 (31.4%) | 52 (7.6%) |
| 5 Years | 4 (2.1%) | 11 (25.0%) |
| 6 to 11 Years | 39 (5.5%) | 90 (9.2%) |
| 12 to 14 Years | 10 (2.3%) | 28 (7.2%) |
| 15 Years | 5 (7.6%) | 31 (17.9%) |
| 16 and 17 Years | 16 (4.6%) | 5 (2.9%) |
| 18 to 24 Years | 28 (3.7%) | 96 (14.3%) |
| 25 to 34 Years | 115 (9.4%) | 70 (5.4%) |
| 35 to 44 Years | 35 (2.4%) | 168 (10.9%) |
| 45 to 54 Years | 144 (9.1%) | 26 (1.8%) |
| 55 to 64 Years | 163 (8.7%) | 311 (15.5%) |
| 65 to 74 Years | 122 (6.3%) | 74 (3.8%) |
| 75 Years and over | 38 (3.4%) | 86 (7.5%) |
| Total | 917 (7.4%) | 1,048 (8.4%) |
Income Above Poverty by Sex and Age in Crook County
According to the poverty statistics in Crook County, males aged 5 years and females aged 45 to 54 years are the age groups that are most secure financially, with 97.9% of males and 98.2% of females in these age groups living above the poverty line.
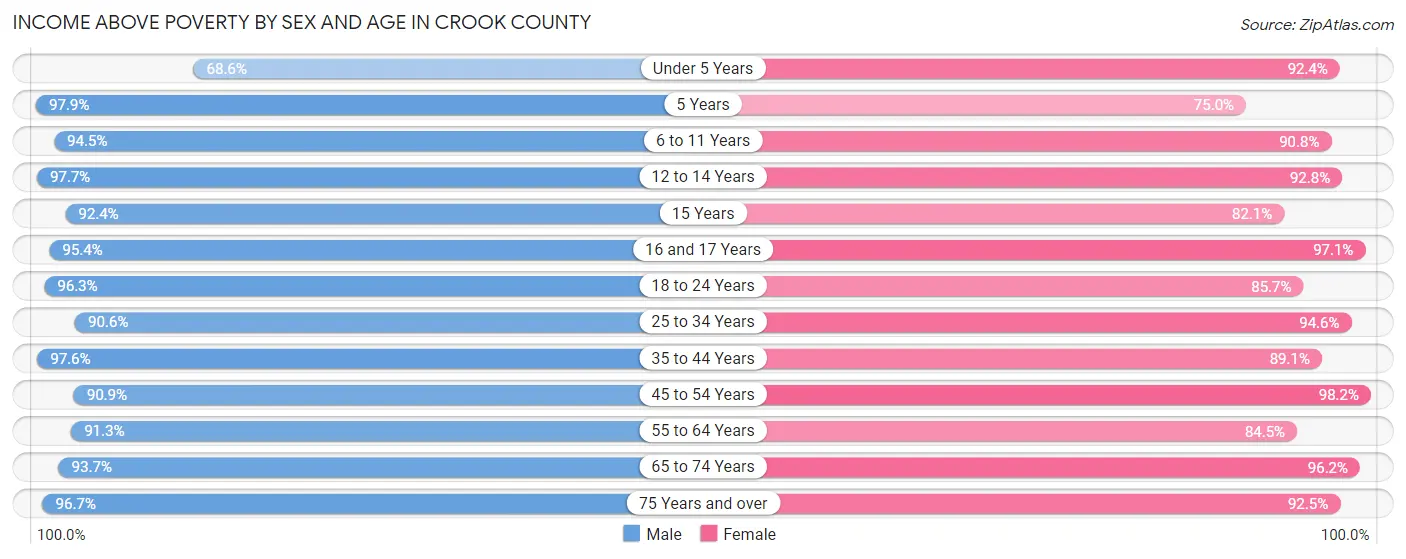
| Age Bracket | Male | Female |
| Under 5 Years | 433 (68.6%) | 633 (92.4%) |
| 5 Years | 184 (97.9%) | 33 (75.0%) |
| 6 to 11 Years | 673 (94.5%) | 892 (90.8%) |
| 12 to 14 Years | 425 (97.7%) | 363 (92.8%) |
| 15 Years | 61 (92.4%) | 142 (82.1%) |
| 16 and 17 Years | 331 (95.4%) | 170 (97.1%) |
| 18 to 24 Years | 735 (96.3%) | 573 (85.7%) |
| 25 to 34 Years | 1,112 (90.6%) | 1,218 (94.6%) |
| 35 to 44 Years | 1,451 (97.6%) | 1,370 (89.1%) |
| 45 to 54 Years | 1,432 (90.9%) | 1,409 (98.2%) |
| 55 to 64 Years | 1,719 (91.3%) | 1,693 (84.5%) |
| 65 to 74 Years | 1,806 (93.7%) | 1,847 (96.2%) |
| 75 Years and over | 1,095 (96.7%) | 1,056 (92.5%) |
| Total | 11,457 (92.6%) | 11,399 (91.6%) |
Income Below Poverty Among Married-Couple Families in Crook County
The poverty statistics for married-couple families in Crook County show that 1.6% or 91 of the total 5,543 families live below the poverty line. Families with no children have the highest poverty rate of 2.1%, comprising of 77 families. On the other hand, families with 3 or 4 children have the lowest poverty rate of 0.0%, which includes 0 families.
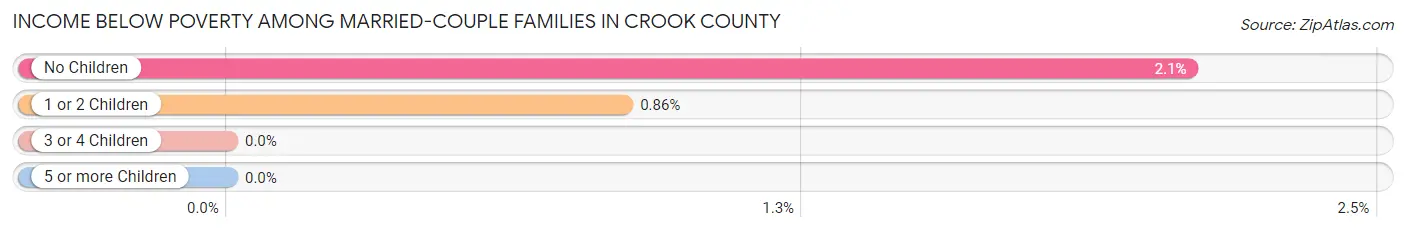
| Children | Above Poverty | Below Poverty |
| No Children | 3,615 (97.9%) | 77 (2.1%) |
| 1 or 2 Children | 1,612 (99.1%) | 14 (0.9%) |
| 3 or 4 Children | 208 (100.0%) | 0 (0.0%) |
| 5 or more Children | 17 (100.0%) | 0 (0.0%) |
| Total | 5,452 (98.4%) | 91 (1.6%) |
Income Below Poverty Among Single-Parent Households in Crook County
According to the poverty data in Crook County, 6.7% or 47 single-father households and 18.4% or 174 single-mother households are living below the poverty line. Among single-father households, those with 1 or 2 children have the highest poverty rate, with 47 households (9.2%) experiencing poverty. Likewise, among single-mother households, those with 5 or more children have the highest poverty rate, with 38 households (80.8%) falling below the poverty line.
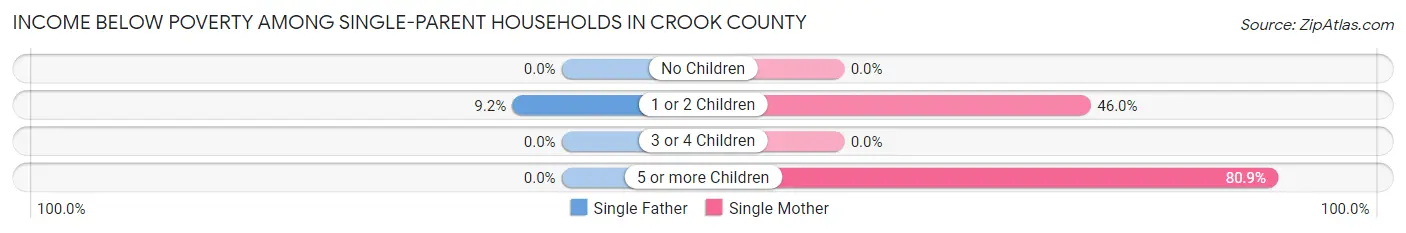
| Children | Single Father | Single Mother |
| No Children | 0 (0.0%) | 0 (0.0%) |
| 1 or 2 Children | 47 (9.2%) | 136 (46.0%) |
| 3 or 4 Children | 0 (0.0%) | 0 (0.0%) |
| 5 or more Children | 0 (0.0%) | 38 (80.8%) |
| Total | 47 (6.7%) | 174 (18.4%) |
Income Below Poverty Among Married-Couple vs Single-Parent Households in Crook County
The poverty data for Crook County shows that 91 of the married-couple family households (1.6%) and 221 of the single-parent households (13.5%) are living below the poverty level. Within the married-couple family households, those with no children have the highest poverty rate, with 77 households (2.1%) falling below the poverty line. Among the single-parent households, those with 5 or more children have the highest poverty rate, with 38 household (80.8%) living below poverty.
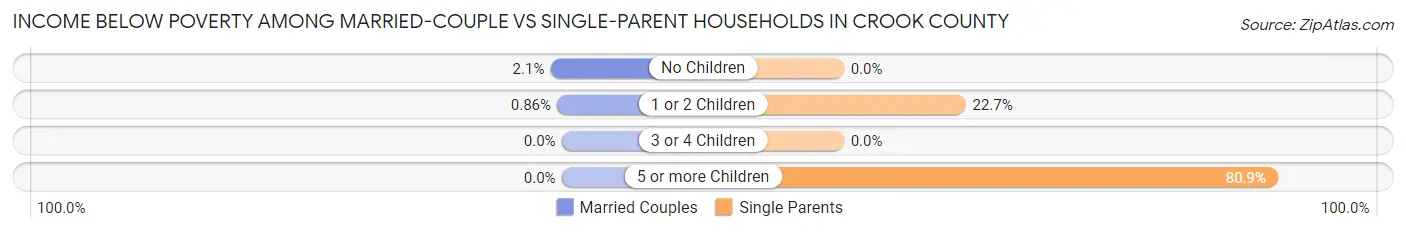
| Children | Married-Couple Families | Single-Parent Households |
| No Children | 77 (2.1%) | 0 (0.0%) |
| 1 or 2 Children | 14 (0.9%) | 183 (22.7%) |
| 3 or 4 Children | 0 (0.0%) | 0 (0.0%) |
| 5 or more Children | 0 (0.0%) | 38 (80.8%) |
| Total | 91 (1.6%) | 221 (13.5%) |
Employment Characteristics in Crook County
Employment by Class of Employer in Crook County
Among the 11,025 employed individuals in Crook County, private company employees (6,958 | 63.1%), state government employees (904 | 8.2%), and self-employed (not incorporated) (843 | 7.6%) make up the most common classes of employment.
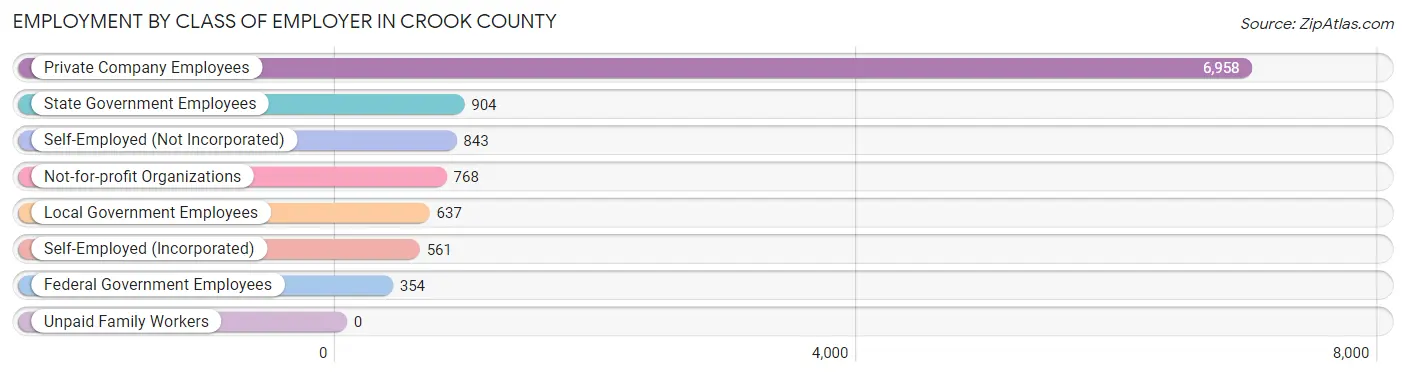
| Employer Class | # Employees | % Employees |
| Private Company Employees | 6,958 | 63.1% |
| Self-Employed (Incorporated) | 561 | 5.1% |
| Self-Employed (Not Incorporated) | 843 | 7.6% |
| Not-for-profit Organizations | 768 | 7.0% |
| Local Government Employees | 637 | 5.8% |
| State Government Employees | 904 | 8.2% |
| Federal Government Employees | 354 | 3.2% |
| Unpaid Family Workers | 0 | 0.0% |
| Total | 11,025 | 100.0% |
Employment Status by Age in Crook County
According to the labor force statistics for Crook County, out of the total population over 16 years of age (20,584), 57.2% or 11,774 individuals are in the labor force, with 4.1% or 483 of them unemployed. The age group with the highest labor force participation rate is 25 to 29 years, with 86.8% or 1,055 individuals in the labor force. Within the labor force, the 16 to 19 years age range has the highest percentage of unemployed individuals, with 16.4% or 79 of them being unemployed.
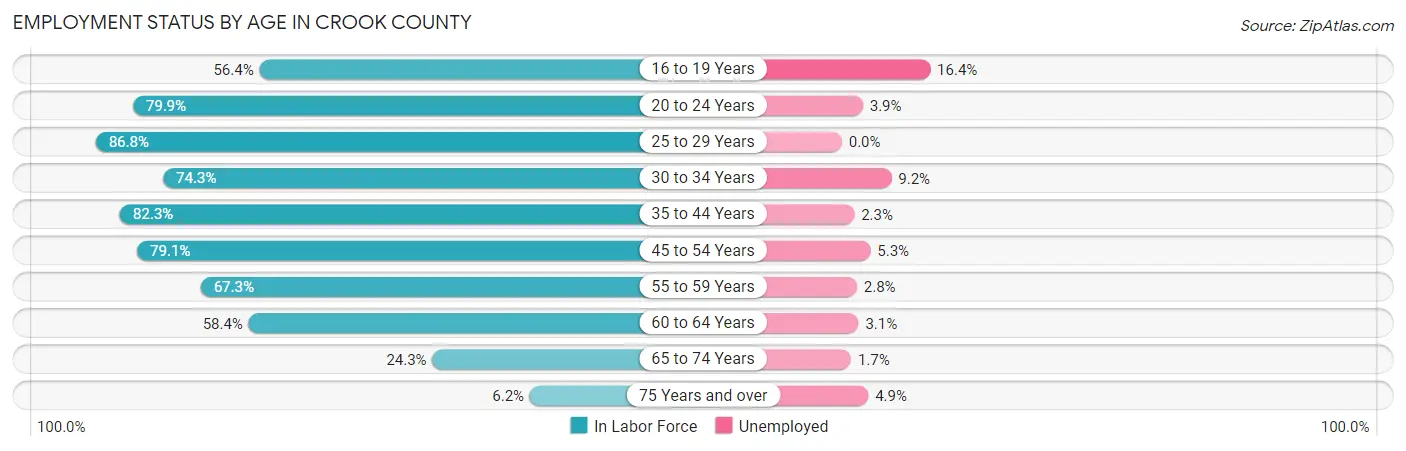
| Age Bracket | In Labor Force | Unemployed |
| 16 to 19 Years | 481 (56.4%) | 79 (16.4%) |
| 20 to 24 Years | 883 (79.9%) | 34 (3.9%) |
| 25 to 29 Years | 1,055 (86.8%) | 0 (0.0%) |
| 30 to 34 Years | 970 (74.3%) | 89 (9.2%) |
| 35 to 44 Years | 2,494 (82.3%) | 57 (2.3%) |
| 45 to 54 Years | 2,383 (79.1%) | 126 (5.3%) |
| 55 to 59 Years | 1,195 (67.3%) | 33 (2.8%) |
| 60 to 64 Years | 1,236 (58.4%) | 38 (3.1%) |
| 65 to 74 Years | 939 (24.3%) | 16 (1.7%) |
| 75 Years and over | 143 (6.2%) | 7 (4.9%) |
| Total | 11,774 (57.2%) | 483 (4.1%) |
Employment Status by Educational Attainment in Crook County
According to labor force statistics for Crook County, 74.9% of individuals (9,330) out of the total population between 25 and 64 years of age (12,457) are in the labor force, with 3.7% or 345 of them being unemployed. The group with the highest labor force participation rate are those with the educational attainment of college / associate degree, with 80.4% or 3,961 individuals in the labor force. Within the labor force, individuals with high school diploma education have the highest percentage of unemployment, with 6.7% or 173 of them being unemployed.
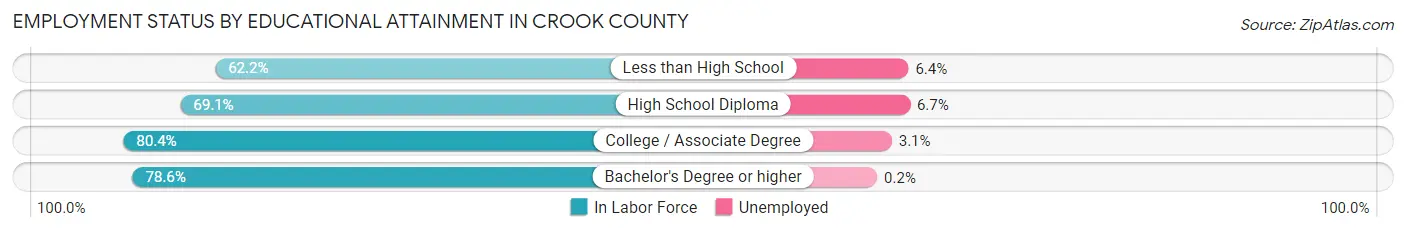
| Educational Attainment | In Labor Force | Unemployed |
| Less than High School | 723 (62.2%) | 74 (6.4%) |
| High School Diploma | 2,583 (69.1%) | 250 (6.7%) |
| College / Associate Degree | 3,961 (80.4%) | 153 (3.1%) |
| Bachelor's Degree or higher | 2,067 (78.6%) | 5 (0.2%) |
| Total | 9,330 (74.9%) | 461 (3.7%) |
Employment Occupations by Sex in Crook County
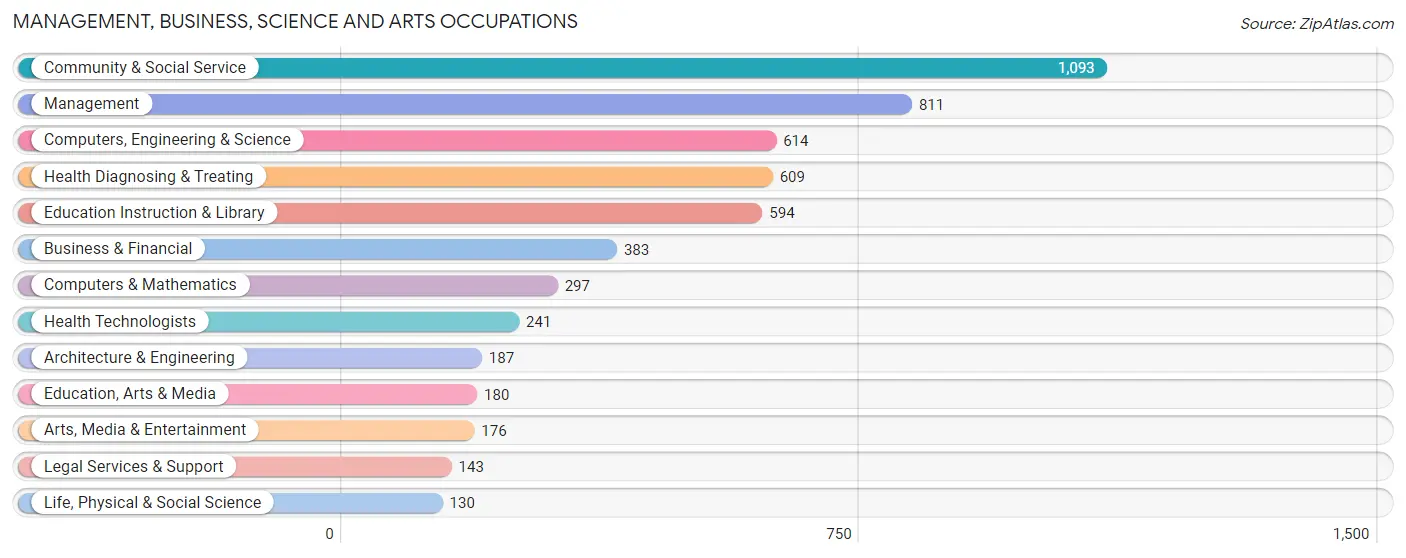
Management, Business, Science and Arts Occupations
The most common Management, Business, Science and Arts occupations in Crook County are Community & Social Service (1,093 | 9.7%), Management (811 | 7.2%), Computers, Engineering & Science (614 | 5.4%), Health Diagnosing & Treating (609 | 5.4%), and Education Instruction & Library (594 | 5.3%).
Management, Business, Science and Arts Occupations by Sex
Within the Management, Business, Science and Arts occupations in Crook County, the most male-oriented occupations are Computers & Mathematics (93.3%), Architecture & Engineering (91.4%), and Computers, Engineering & Science (89.6%), while the most female-oriented occupations are Education, Arts & Media (89.4%), Arts, Media & Entertainment (85.2%), and Legal Services & Support (79.7%).
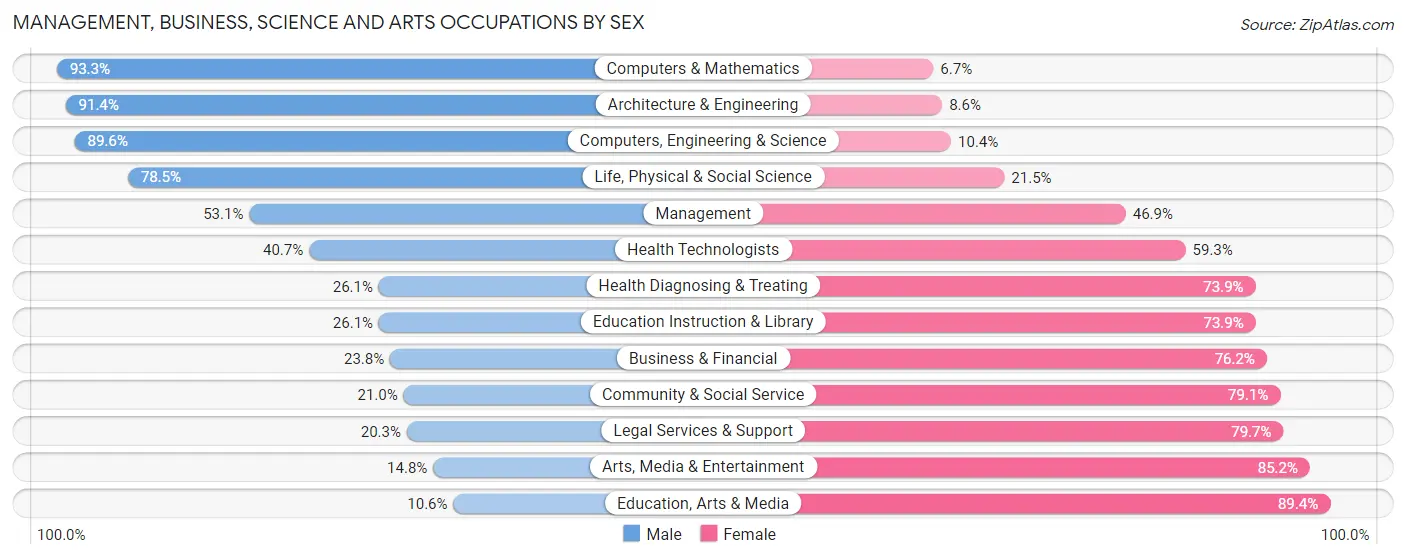
| Occupation | Male | Female |
| Management | 431 (53.1%) | 380 (46.9%) |
| Business & Financial | 91 (23.8%) | 292 (76.2%) |
| Computers, Engineering & Science | 550 (89.6%) | 64 (10.4%) |
| Computers & Mathematics | 277 (93.3%) | 20 (6.7%) |
| Architecture & Engineering | 171 (91.4%) | 16 (8.6%) |
| Life, Physical & Social Science | 102 (78.5%) | 28 (21.5%) |
| Community & Social Service | 229 (20.9%) | 864 (79.0%) |
| Education, Arts & Media | 19 (10.6%) | 161 (89.4%) |
| Legal Services & Support | 29 (20.3%) | 114 (79.7%) |
| Education Instruction & Library | 155 (26.1%) | 439 (73.9%) |
| Arts, Media & Entertainment | 26 (14.8%) | 150 (85.2%) |
| Health Diagnosing & Treating | 159 (26.1%) | 450 (73.9%) |
| Health Technologists | 98 (40.7%) | 143 (59.3%) |
| Total (Category) | 1,460 (41.6%) | 2,050 (58.4%) |
| Total (Overall) | 6,062 (53.6%) | 5,238 (46.4%) |
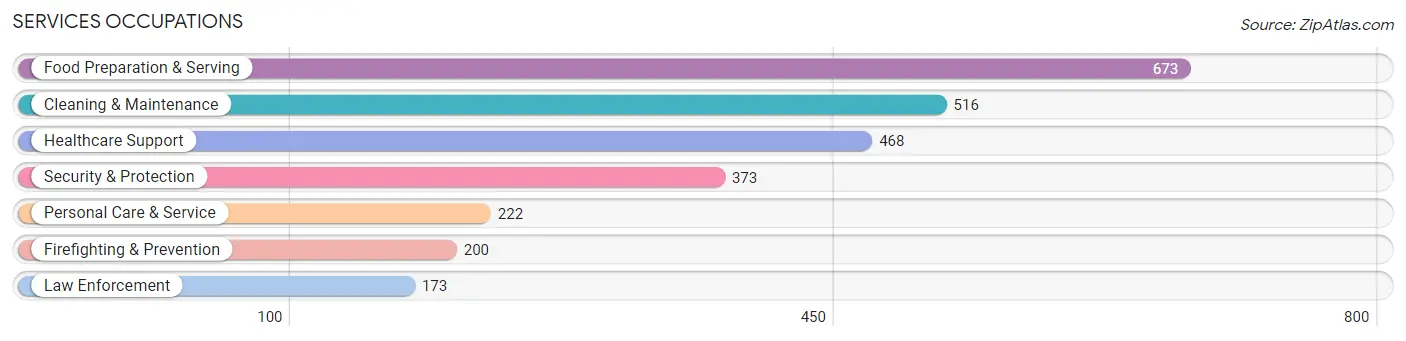
Services Occupations
The most common Services occupations in Crook County are Food Preparation & Serving (673 | 6.0%), Cleaning & Maintenance (516 | 4.6%), Healthcare Support (468 | 4.1%), Security & Protection (373 | 3.3%), and Personal Care & Service (222 | 2.0%).
Services Occupations by Sex
Within the Services occupations in Crook County, the most male-oriented occupations are Firefighting & Prevention (91.5%), Security & Protection (91.4%), and Law Enforcement (91.3%), while the most female-oriented occupations are Personal Care & Service (83.8%), Healthcare Support (77.1%), and Food Preparation & Serving (75.0%).
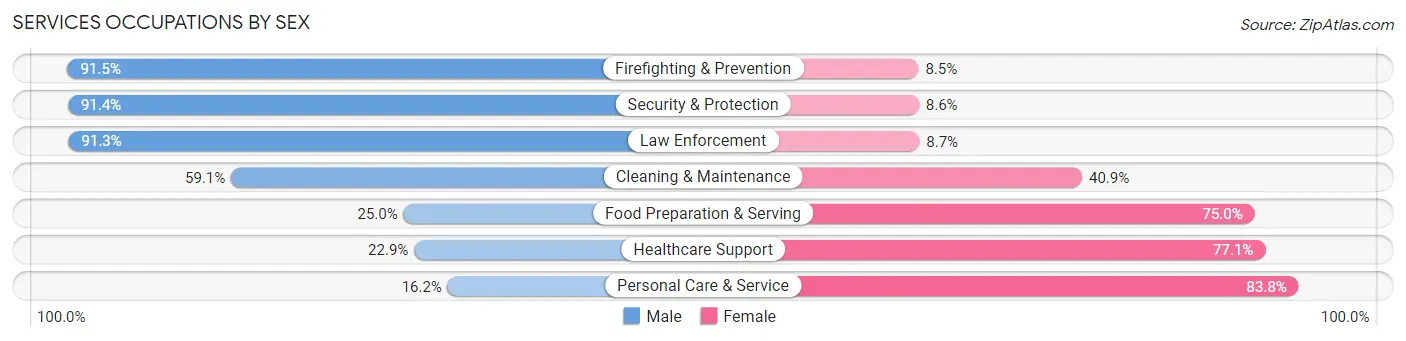
| Occupation | Male | Female |
| Healthcare Support | 107 (22.9%) | 361 (77.1%) |
| Security & Protection | 341 (91.4%) | 32 (8.6%) |
| Firefighting & Prevention | 183 (91.5%) | 17 (8.5%) |
| Law Enforcement | 158 (91.3%) | 15 (8.7%) |
| Food Preparation & Serving | 168 (25.0%) | 505 (75.0%) |
| Cleaning & Maintenance | 305 (59.1%) | 211 (40.9%) |
| Personal Care & Service | 36 (16.2%) | 186 (83.8%) |
| Total (Category) | 957 (42.5%) | 1,295 (57.5%) |
| Total (Overall) | 6,062 (53.6%) | 5,238 (46.4%) |
Sales and Office Occupations
The most common Sales and Office occupations in Crook County are Office & Administration (1,105 | 9.8%), and Sales & Related (837 | 7.4%).

Sales and Office Occupations by Sex

| Occupation | Male | Female |
| Sales & Related | 257 (30.7%) | 580 (69.3%) |
| Office & Administration | 177 (16.0%) | 928 (84.0%) |
| Total (Category) | 434 (22.4%) | 1,508 (77.6%) |
| Total (Overall) | 6,062 (53.6%) | 5,238 (46.4%) |
Natural Resources, Construction and Maintenance Occupations
The most common Natural Resources, Construction and Maintenance occupations in Crook County are Construction & Extraction (1,083 | 9.6%), Installation, Maintenance & Repair (542 | 4.8%), and Farming, Fishing & Forestry (86 | 0.8%).

Natural Resources, Construction and Maintenance Occupations by Sex
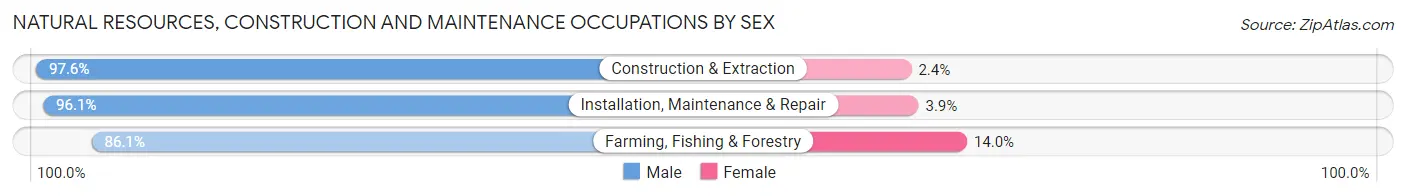
| Occupation | Male | Female |
| Farming, Fishing & Forestry | 74 (86.1%) | 12 (14.0%) |
| Construction & Extraction | 1,057 (97.6%) | 26 (2.4%) |
| Installation, Maintenance & Repair | 521 (96.1%) | 21 (3.9%) |
| Total (Category) | 1,652 (96.6%) | 59 (3.5%) |
| Total (Overall) | 6,062 (53.6%) | 5,238 (46.4%) |
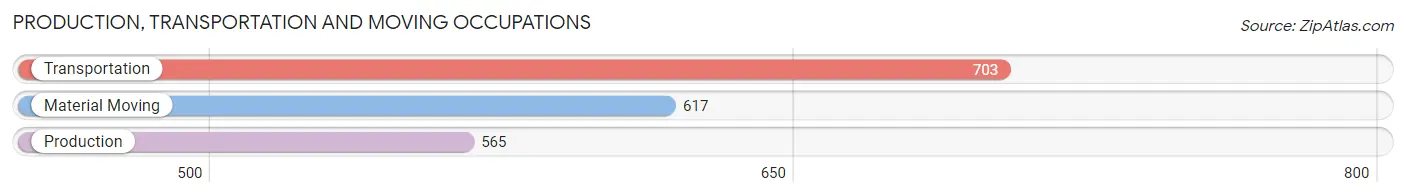
Production, Transportation and Moving Occupations
The most common Production, Transportation and Moving occupations in Crook County are Transportation (703 | 6.2%), Material Moving (617 | 5.5%), and Production (565 | 5.0%).
Production, Transportation and Moving Occupations by Sex
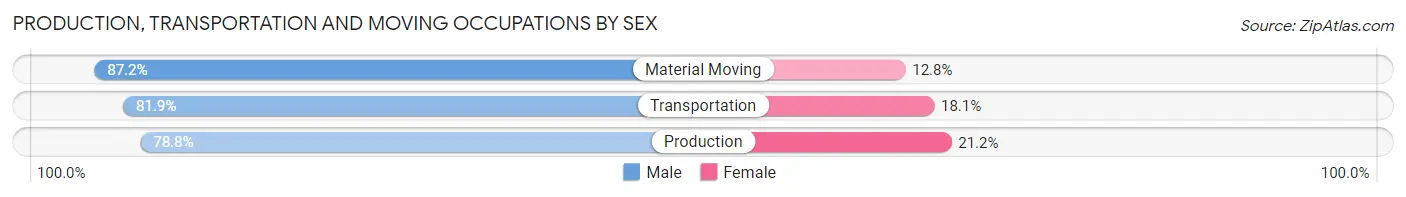
| Occupation | Male | Female |
| Production | 445 (78.8%) | 120 (21.2%) |
| Transportation | 576 (81.9%) | 127 (18.1%) |
| Material Moving | 538 (87.2%) | 79 (12.8%) |
| Total (Category) | 1,559 (82.7%) | 326 (17.3%) |
| Total (Overall) | 6,062 (53.6%) | 5,238 (46.4%) |
Employment Industries by Sex in Crook County
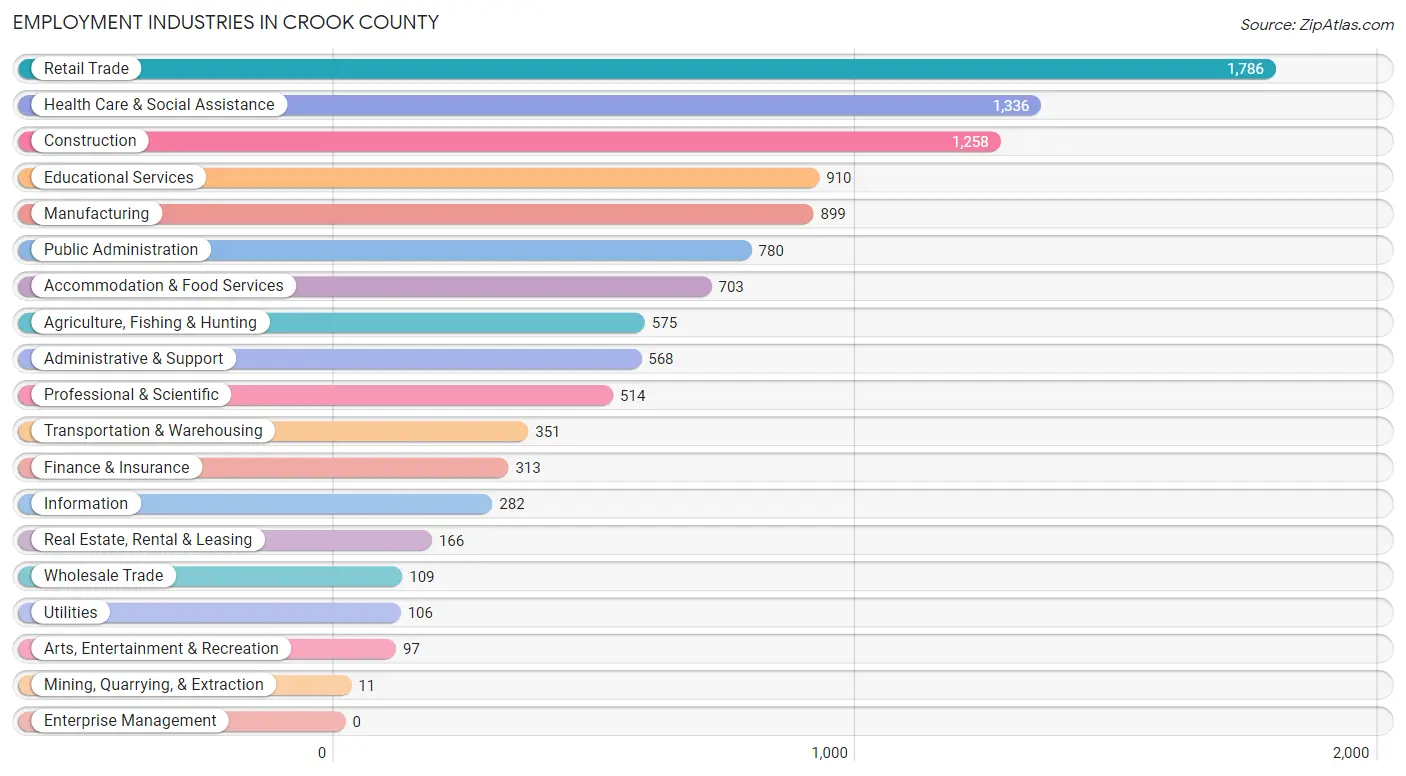
Employment Industries in Crook County
The major employment industries in Crook County include Retail Trade (1,786 | 15.8%), Health Care & Social Assistance (1,336 | 11.8%), Construction (1,258 | 11.1%), Educational Services (910 | 8.1%), and Manufacturing (899 | 8.0%).
Employment Industries by Sex in Crook County
The Crook County industries that see more men than women are Mining, Quarrying, & Extraction (100.0%), Utilities (100.0%), and Construction (95.7%), whereas the industries that tend to have a higher number of women are Finance & Insurance (91.4%), Real Estate, Rental & Leasing (78.9%), and Health Care & Social Assistance (76.2%).
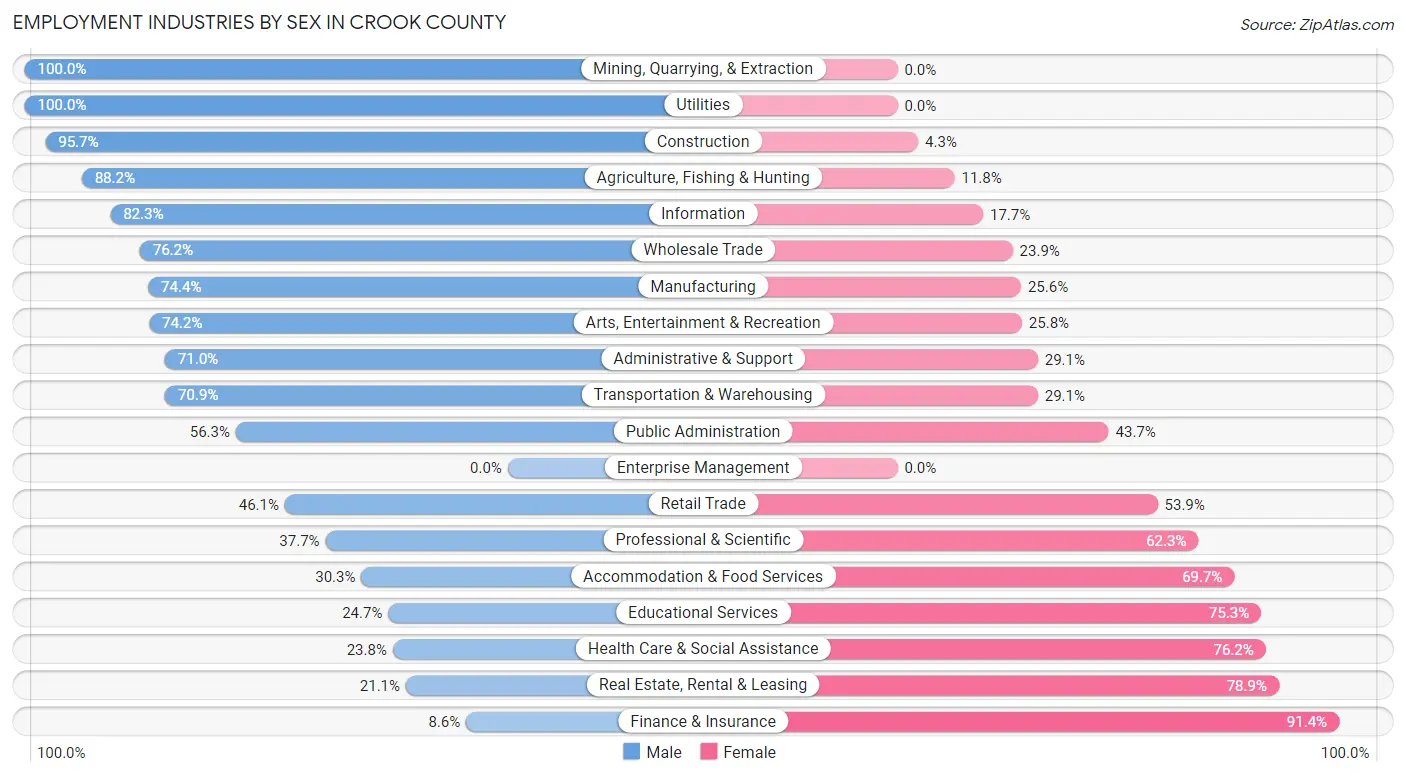
| Industry | Male | Female |
| Agriculture, Fishing & Hunting | 507 (88.2%) | 68 (11.8%) |
| Mining, Quarrying, & Extraction | 11 (100.0%) | 0 (0.0%) |
| Construction | 1,204 (95.7%) | 54 (4.3%) |
| Manufacturing | 669 (74.4%) | 230 (25.6%) |
| Wholesale Trade | 83 (76.1%) | 26 (23.8%) |
| Retail Trade | 824 (46.1%) | 962 (53.9%) |
| Transportation & Warehousing | 249 (70.9%) | 102 (29.1%) |
| Utilities | 106 (100.0%) | 0 (0.0%) |
| Information | 232 (82.3%) | 50 (17.7%) |
| Finance & Insurance | 27 (8.6%) | 286 (91.4%) |
| Real Estate, Rental & Leasing | 35 (21.1%) | 131 (78.9%) |
| Professional & Scientific | 194 (37.7%) | 320 (62.3%) |
| Enterprise Management | 0 (0.0%) | 0 (0.0%) |
| Administrative & Support | 403 (71.0%) | 165 (29.0%) |
| Educational Services | 225 (24.7%) | 685 (75.3%) |
| Health Care & Social Assistance | 318 (23.8%) | 1,018 (76.2%) |
| Arts, Entertainment & Recreation | 72 (74.2%) | 25 (25.8%) |
| Accommodation & Food Services | 213 (30.3%) | 490 (69.7%) |
| Public Administration | 439 (56.3%) | 341 (43.7%) |
| Total | 6,062 (53.6%) | 5,238 (46.4%) |
Education in Crook County
School Enrollment in Crook County
The most common levels of schooling among the 4,545 students in Crook County are middle school (1,154 | 25.4%), elementary school (953 | 21.0%), and high school (842 | 18.5%).
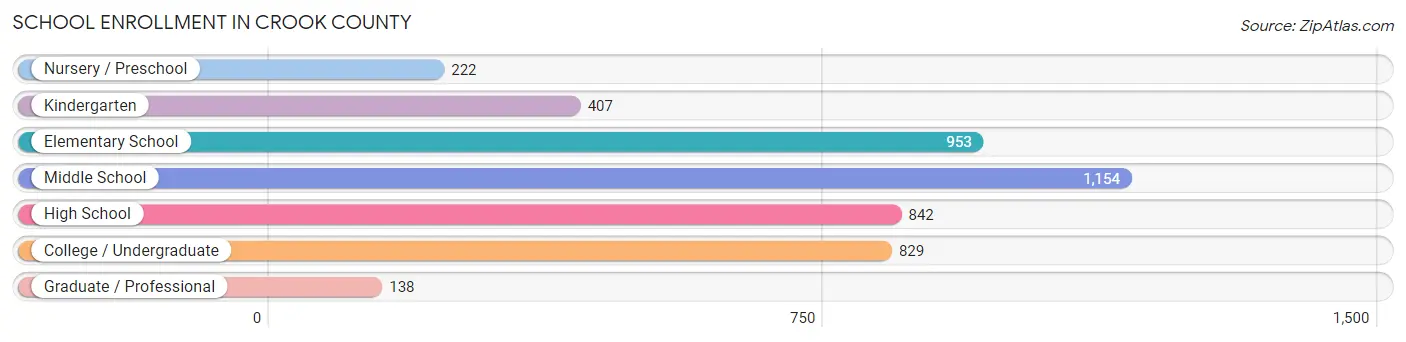
| School Level | # Students | % Students |
| Nursery / Preschool | 222 | 4.9% |
| Kindergarten | 407 | 8.9% |
| Elementary School | 953 | 21.0% |
| Middle School | 1,154 | 25.4% |
| High School | 842 | 18.5% |
| College / Undergraduate | 829 | 18.2% |
| Graduate / Professional | 138 | 3.0% |
| Total | 4,545 | 100.0% |
School Enrollment by Age by Funding Source in Crook County
Out of a total of 4,545 students who are enrolled in schools in Crook County, 845 (18.6%) attend a private institution, while the remaining 3,700 (81.4%) are enrolled in public schools. The age group of 3 to 4 year olds has the highest likelihood of being enrolled in private schools, with 118 (64.1% in the age bracket) enrolled. Conversely, the age group of 18 to 19 year olds has the lowest likelihood of being enrolled in a private school, with 216 (100.0% in the age bracket) attending a public institution.
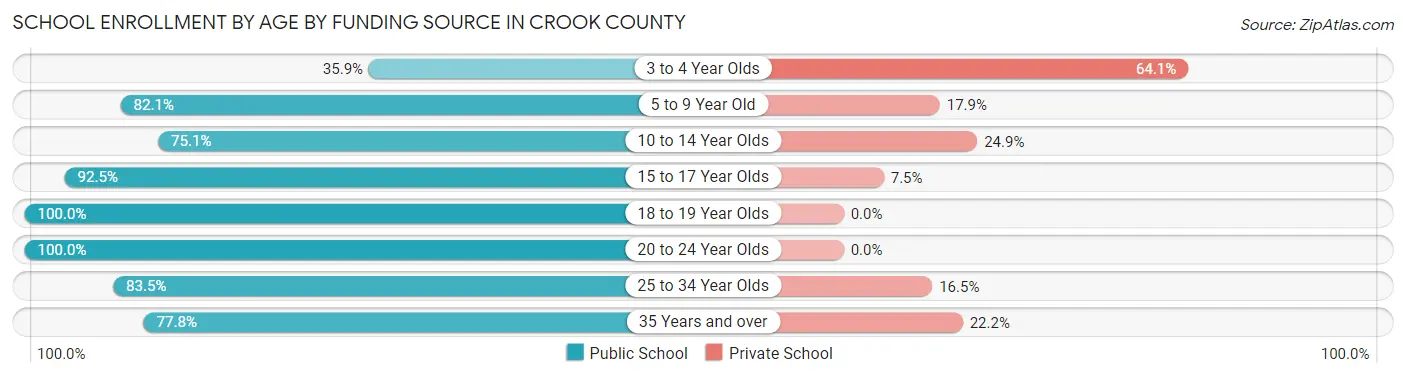
| Age Bracket | Public School | Private School |
| 3 to 4 Year Olds | 66 (35.9%) | 118 (64.1%) |
| 5 to 9 Year Old | 1,087 (82.1%) | 237 (17.9%) |
| 10 to 14 Year Olds | 930 (75.1%) | 308 (24.9%) |
| 15 to 17 Year Olds | 619 (92.5%) | 50 (7.5%) |
| 18 to 19 Year Olds | 216 (100.0%) | 0 (0.0%) |
| 20 to 24 Year Olds | 288 (100.0%) | 0 (0.0%) |
| 25 to 34 Year Olds | 86 (83.5%) | 17 (16.5%) |
| 35 Years and over | 407 (77.8%) | 116 (22.2%) |
| Total | 3,700 (81.4%) | 845 (18.6%) |
Educational Attainment by Field of Study in Crook County
Education (730 | 17.8%), bio, nature & agricultural (600 | 14.6%), business (537 | 13.1%), psychology (498 | 12.1%), and liberal arts & history (395 | 9.6%) are the most common fields of study among 4,106 individuals in Crook County who have obtained a bachelor's degree or higher.
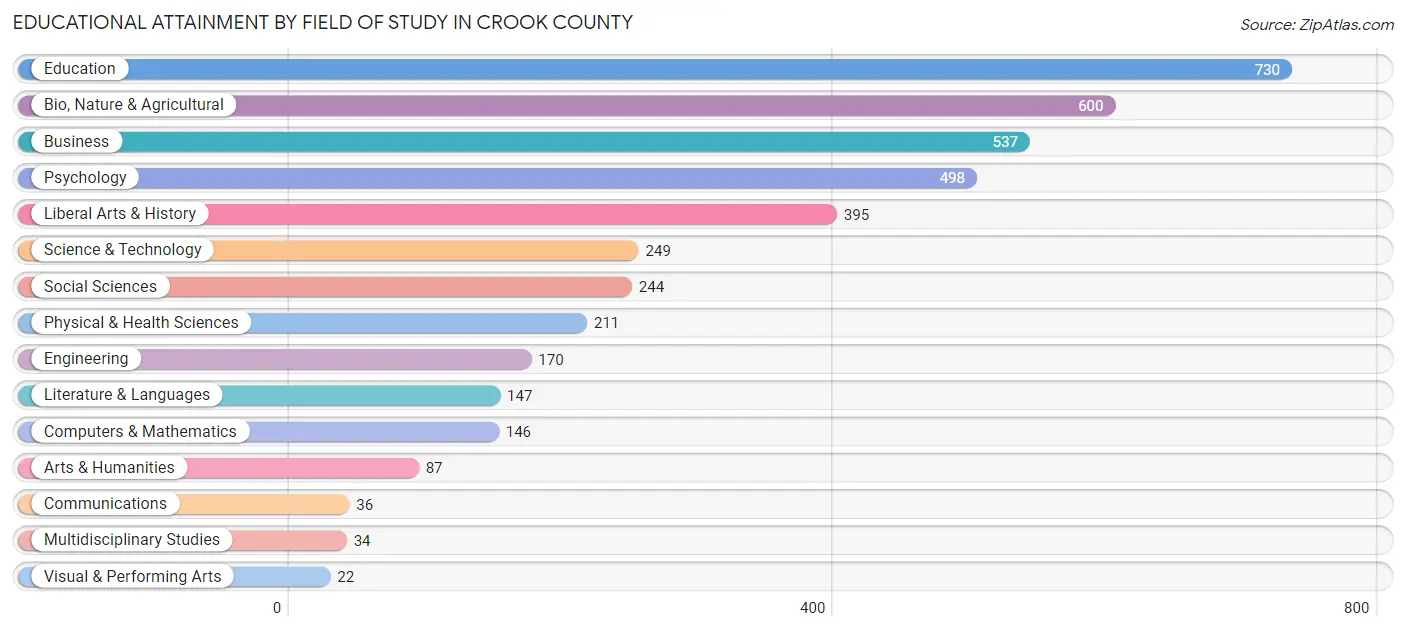
| Field of Study | # Graduates | % Graduates |
| Computers & Mathematics | 146 | 3.6% |
| Bio, Nature & Agricultural | 600 | 14.6% |
| Physical & Health Sciences | 211 | 5.1% |
| Psychology | 498 | 12.1% |
| Social Sciences | 244 | 5.9% |
| Engineering | 170 | 4.1% |
| Multidisciplinary Studies | 34 | 0.8% |
| Science & Technology | 249 | 6.1% |
| Business | 537 | 13.1% |
| Education | 730 | 17.8% |
| Literature & Languages | 147 | 3.6% |
| Liberal Arts & History | 395 | 9.6% |
| Visual & Performing Arts | 22 | 0.5% |
| Communications | 36 | 0.9% |
| Arts & Humanities | 87 | 2.1% |
| Total | 4,106 | 100.0% |
Transportation & Commute in Crook County
Vehicle Availability by Sex in Crook County
The most prevalent vehicle ownership categories in Crook County are males with 3 vehicles (1,941, accounting for 33.0%) and females with 3 vehicles (1,717, making up 37.8%).
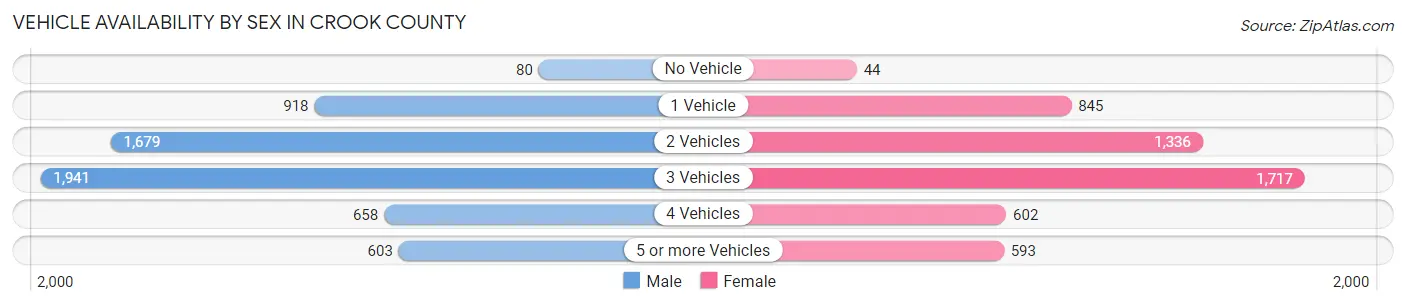
| Vehicles Available | Male | Female |
| No Vehicle | 80 (1.4%) | 44 (0.9%) |
| 1 Vehicle | 918 (15.6%) | 845 (16.5%) |
| 2 Vehicles | 1,679 (28.6%) | 1,336 (26.0%) |
| 3 Vehicles | 1,941 (33.0%) | 1,717 (33.4%) |
| 4 Vehicles | 658 (11.2%) | 602 (11.7%) |
| 5 or more Vehicles | 603 (10.3%) | 593 (11.5%) |
| Total | 5,879 (100.0%) | 5,137 (100.0%) |
Commute Time in Crook County
The most frequently occuring commute durations in Crook County are 5 to 9 minutes (1,937 commuters, 19.6%), 20 to 24 minutes (1,131 commuters, 11.4%), and 30 to 34 minutes (1,110 commuters, 11.2%).
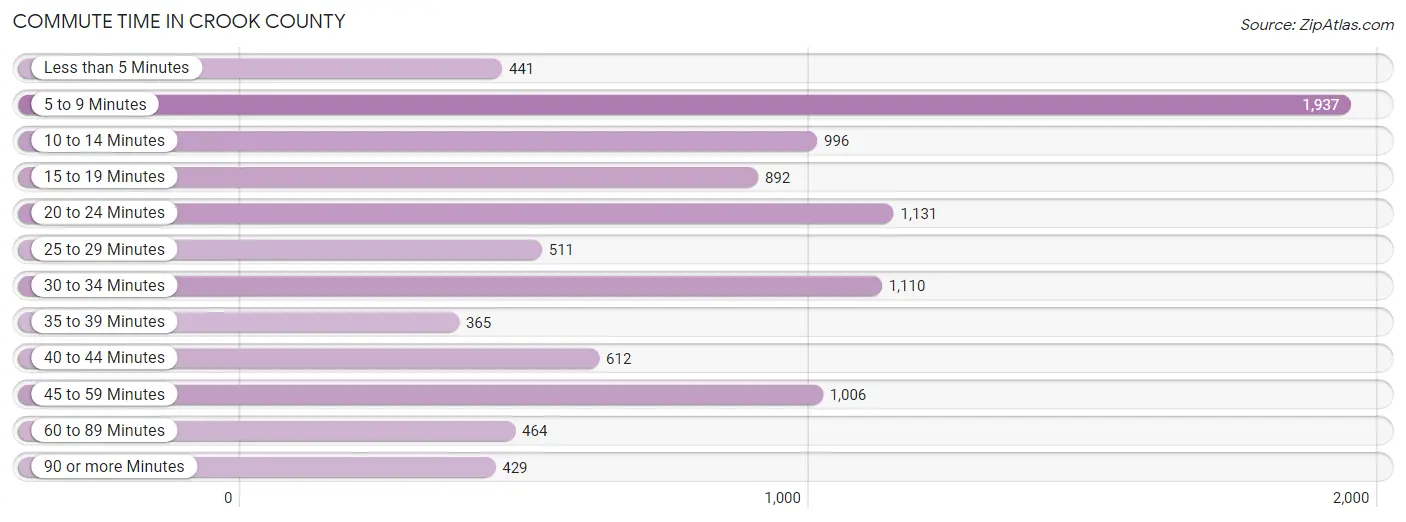
| Commute Time | # Commuters | % Commuters |
| Less than 5 Minutes | 441 | 4.5% |
| 5 to 9 Minutes | 1,937 | 19.6% |
| 10 to 14 Minutes | 996 | 10.1% |
| 15 to 19 Minutes | 892 | 9.0% |
| 20 to 24 Minutes | 1,131 | 11.4% |
| 25 to 29 Minutes | 511 | 5.2% |
| 30 to 34 Minutes | 1,110 | 11.2% |
| 35 to 39 Minutes | 365 | 3.7% |
| 40 to 44 Minutes | 612 | 6.2% |
| 45 to 59 Minutes | 1,006 | 10.2% |
| 60 to 89 Minutes | 464 | 4.7% |
| 90 or more Minutes | 429 | 4.3% |
Commute Time by Sex in Crook County
The most common commute times in Crook County are 5 to 9 minutes (838 commuters, 15.7%) for males and 5 to 9 minutes (1,099 commuters, 24.2%) for females.
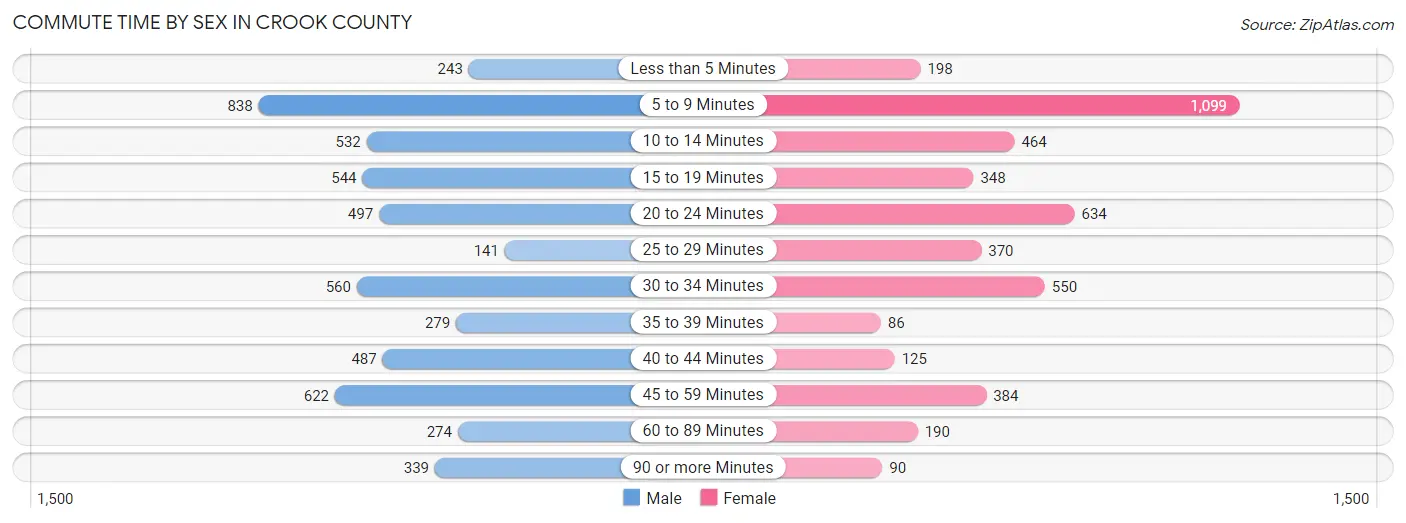
| Commute Time | Male | Female |
| Less than 5 Minutes | 243 (4.5%) | 198 (4.4%) |
| 5 to 9 Minutes | 838 (15.7%) | 1,099 (24.2%) |
| 10 to 14 Minutes | 532 (9.9%) | 464 (10.2%) |
| 15 to 19 Minutes | 544 (10.2%) | 348 (7.7%) |
| 20 to 24 Minutes | 497 (9.3%) | 634 (14.0%) |
| 25 to 29 Minutes | 141 (2.6%) | 370 (8.2%) |
| 30 to 34 Minutes | 560 (10.5%) | 550 (12.1%) |
| 35 to 39 Minutes | 279 (5.2%) | 86 (1.9%) |
| 40 to 44 Minutes | 487 (9.1%) | 125 (2.8%) |
| 45 to 59 Minutes | 622 (11.6%) | 384 (8.5%) |
| 60 to 89 Minutes | 274 (5.1%) | 190 (4.2%) |
| 90 or more Minutes | 339 (6.3%) | 90 (2.0%) |
Time of Departure to Work by Sex in Crook County
The most frequent times of departure to work in Crook County are 6:30 AM to 6:59 AM (758, 14.1%) for males and 7:30 AM to 7:59 AM (855, 18.8%) for females.
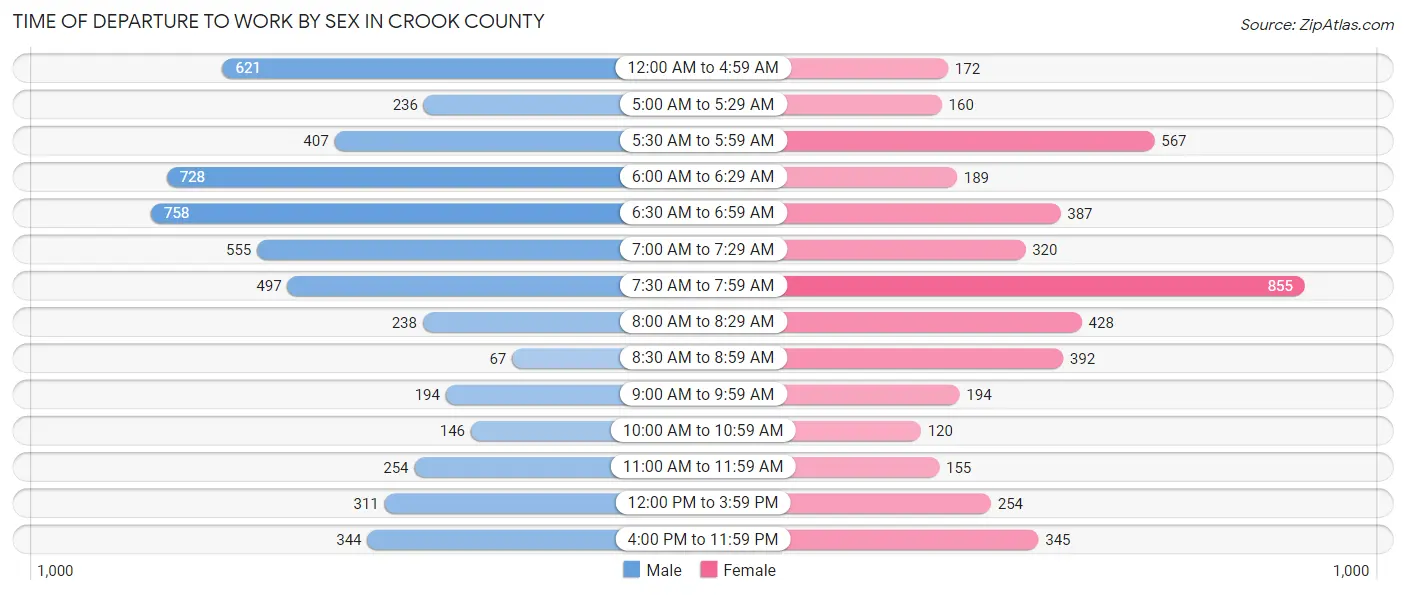
| Time of Departure | Male | Female |
| 12:00 AM to 4:59 AM | 621 (11.6%) | 172 (3.8%) |
| 5:00 AM to 5:29 AM | 236 (4.4%) | 160 (3.5%) |
| 5:30 AM to 5:59 AM | 407 (7.6%) | 567 (12.5%) |
| 6:00 AM to 6:29 AM | 728 (13.6%) | 189 (4.2%) |
| 6:30 AM to 6:59 AM | 758 (14.1%) | 387 (8.5%) |
| 7:00 AM to 7:29 AM | 555 (10.4%) | 320 (7.0%) |
| 7:30 AM to 7:59 AM | 497 (9.3%) | 855 (18.8%) |
| 8:00 AM to 8:29 AM | 238 (4.4%) | 428 (9.4%) |
| 8:30 AM to 8:59 AM | 67 (1.3%) | 392 (8.6%) |
| 9:00 AM to 9:59 AM | 194 (3.6%) | 194 (4.3%) |
| 10:00 AM to 10:59 AM | 146 (2.7%) | 120 (2.6%) |
| 11:00 AM to 11:59 AM | 254 (4.7%) | 155 (3.4%) |
| 12:00 PM to 3:59 PM | 311 (5.8%) | 254 (5.6%) |
| 4:00 PM to 11:59 PM | 344 (6.4%) | 345 (7.6%) |
| Total | 5,356 (100.0%) | 4,538 (100.0%) |
Housing Occupancy in Crook County
Occupancy by Ownership in Crook County
Of the total 10,291 dwellings in Crook County, owner-occupied units account for 7,749 (75.3%), while renter-occupied units make up 2,542 (24.7%).
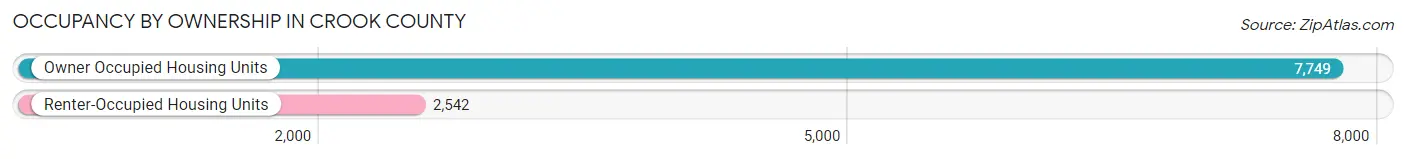
| Occupancy | # Housing Units | % Housing Units |
| Owner Occupied Housing Units | 7,749 | 75.3% |
| Renter-Occupied Housing Units | 2,542 | 24.7% |
| Total Occupied Housing Units | 10,291 | 100.0% |
Occupancy by Household Size in Crook County
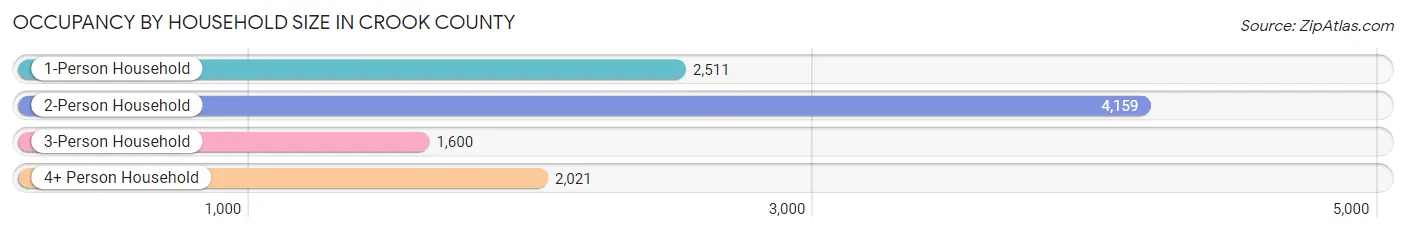
| Household Size | # Housing Units | % Housing Units |
| 1-Person Household | 2,511 | 24.4% |
| 2-Person Household | 4,159 | 40.4% |
| 3-Person Household | 1,600 | 15.5% |
| 4+ Person Household | 2,021 | 19.6% |
| Total Housing Units | 10,291 | 100.0% |
Occupancy by Ownership by Household Size in Crook County
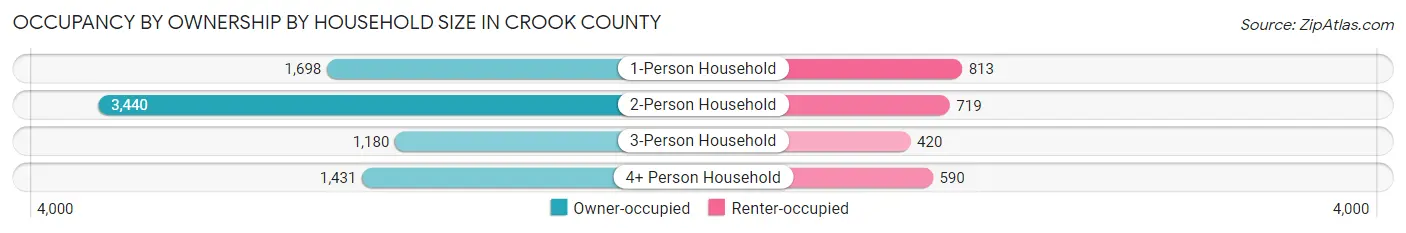
| Household Size | Owner-occupied | Renter-occupied |
| 1-Person Household | 1,698 (67.6%) | 813 (32.4%) |
| 2-Person Household | 3,440 (82.7%) | 719 (17.3%) |
| 3-Person Household | 1,180 (73.8%) | 420 (26.3%) |
| 4+ Person Household | 1,431 (70.8%) | 590 (29.2%) |
| Total Housing Units | 7,749 (75.3%) | 2,542 (24.7%) |
Occupancy by Educational Attainment in Crook County
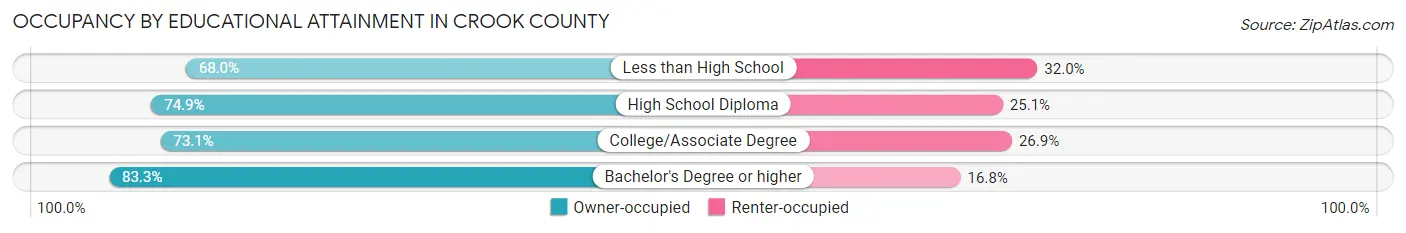
| Household Size | Owner-occupied | Renter-occupied |
| Less than High School | 666 (68.0%) | 313 (32.0%) |
| High School Diploma | 2,056 (74.9%) | 690 (25.1%) |
| College/Associate Degree | 3,153 (73.1%) | 1,162 (26.9%) |
| Bachelor's Degree or higher | 1,874 (83.3%) | 377 (16.8%) |
Occupancy by Age of Householder in Crook County
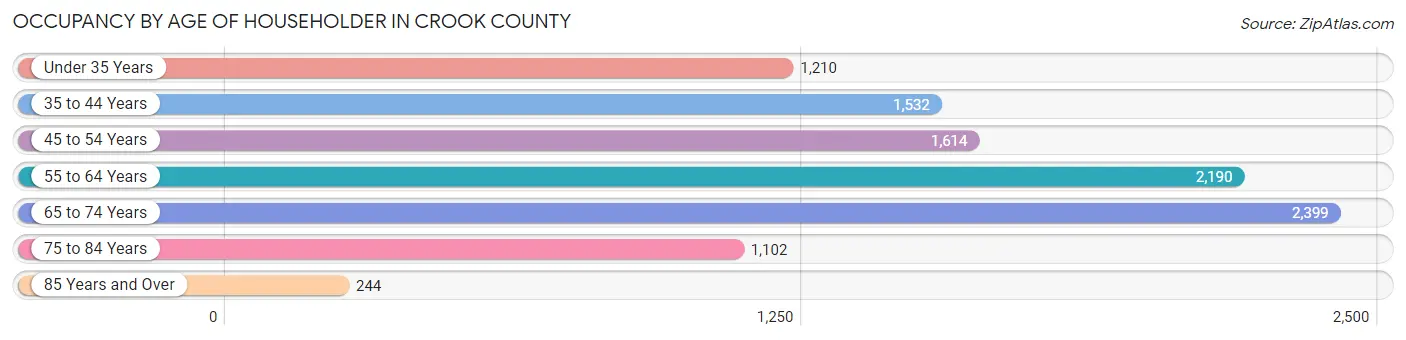
| Age Bracket | # Households | % Households |
| Under 35 Years | 1,210 | 11.8% |
| 35 to 44 Years | 1,532 | 14.9% |
| 45 to 54 Years | 1,614 | 15.7% |
| 55 to 64 Years | 2,190 | 21.3% |
| 65 to 74 Years | 2,399 | 23.3% |
| 75 to 84 Years | 1,102 | 10.7% |
| 85 Years and Over | 244 | 2.4% |
| Total | 10,291 | 100.0% |
Housing Finances in Crook County
Median Income by Occupancy in Crook County
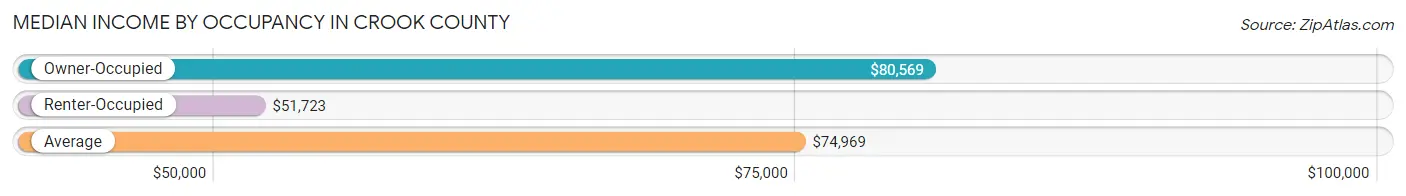
| Occupancy Type | # Households | Median Income |
| Owner-Occupied | 7,749 (75.3%) | $80,569 |
| Renter-Occupied | 2,542 (24.7%) | $51,723 |
| Average | 10,291 (100.0%) | $74,969 |
Occupancy by Householder Income Bracket in Crook County
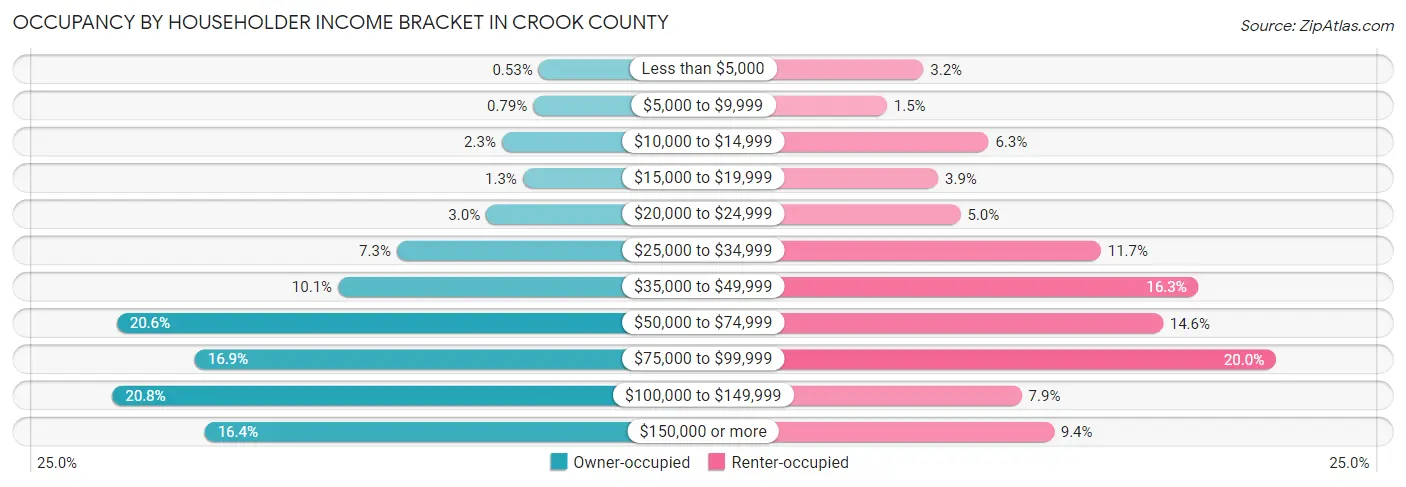
| Income Bracket | Owner-occupied | Renter-occupied |
| Less than $5,000 | 41 (0.5%) | 82 (3.2%) |
| $5,000 to $9,999 | 61 (0.8%) | 38 (1.5%) |
| $10,000 to $14,999 | 177 (2.3%) | 161 (6.3%) |
| $15,000 to $19,999 | 99 (1.3%) | 100 (3.9%) |
| $20,000 to $24,999 | 235 (3.0%) | 127 (5.0%) |
| $25,000 to $34,999 | 564 (7.3%) | 297 (11.7%) |
| $35,000 to $49,999 | 781 (10.1%) | 415 (16.3%) |
| $50,000 to $74,999 | 1,597 (20.6%) | 372 (14.6%) |
| $75,000 to $99,999 | 1,309 (16.9%) | 509 (20.0%) |
| $100,000 to $149,999 | 1,613 (20.8%) | 201 (7.9%) |
| $150,000 or more | 1,272 (16.4%) | 240 (9.4%) |
| Total | 7,749 (100.0%) | 2,542 (100.0%) |
Monthly Housing Cost Tiers in Crook County
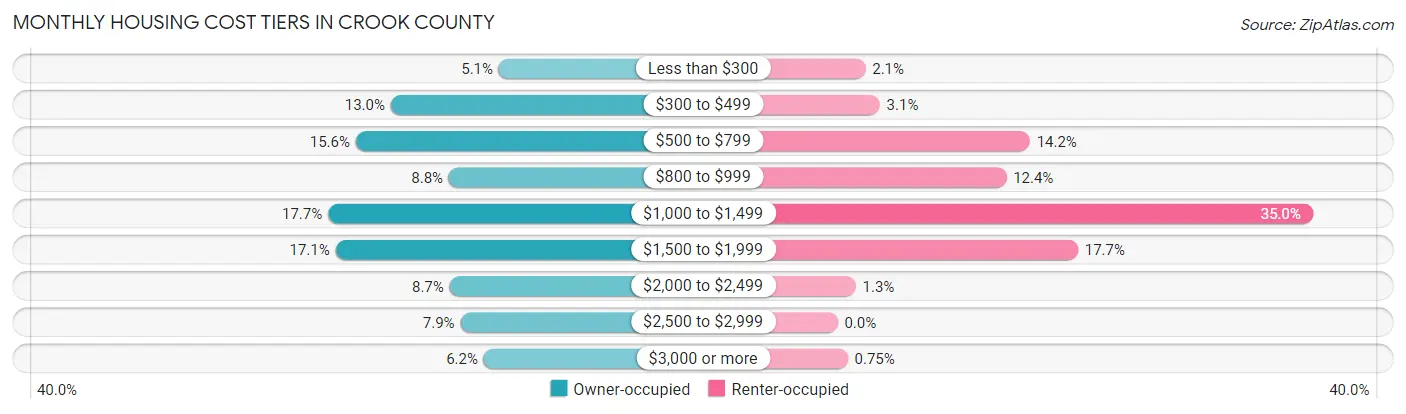
| Monthly Cost | Owner-occupied | Renter-occupied |
| Less than $300 | 393 (5.1%) | 52 (2.1%) |
| $300 to $499 | 1,010 (13.0%) | 79 (3.1%) |
| $500 to $799 | 1,210 (15.6%) | 360 (14.2%) |
| $800 to $999 | 678 (8.7%) | 316 (12.4%) |
| $1,000 to $1,499 | 1,368 (17.6%) | 890 (35.0%) |
| $1,500 to $1,999 | 1,325 (17.1%) | 450 (17.7%) |
| $2,000 to $2,499 | 674 (8.7%) | 34 (1.3%) |
| $2,500 to $2,999 | 612 (7.9%) | 0 (0.0%) |
| $3,000 or more | 479 (6.2%) | 19 (0.7%) |
| Total | 7,749 (100.0%) | 2,542 (100.0%) |
Physical Housing Characteristics in Crook County
Housing Structures in Crook County
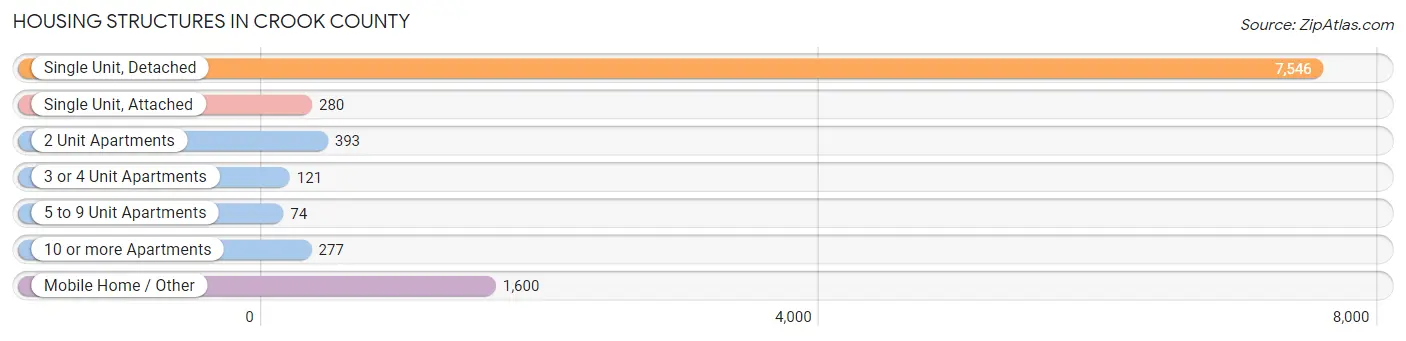
| Structure Type | # Housing Units | % Housing Units |
| Single Unit, Detached | 7,546 | 73.3% |
| Single Unit, Attached | 280 | 2.7% |
| 2 Unit Apartments | 393 | 3.8% |
| 3 or 4 Unit Apartments | 121 | 1.2% |
| 5 to 9 Unit Apartments | 74 | 0.7% |
| 10 or more Apartments | 277 | 2.7% |
| Mobile Home / Other | 1,600 | 15.5% |
| Total | 10,291 | 100.0% |
Housing Structures by Occupancy in Crook County
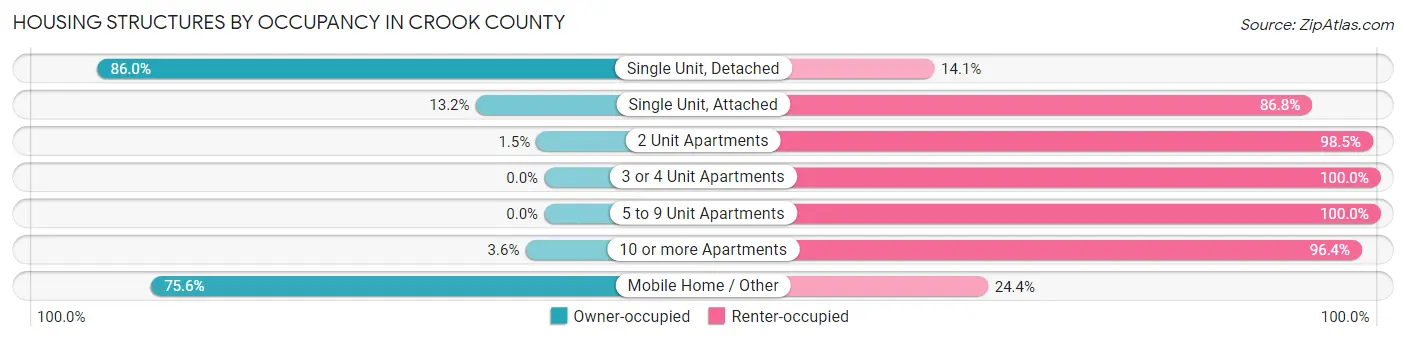
| Structure Type | Owner-occupied | Renter-occupied |
| Single Unit, Detached | 6,486 (86.0%) | 1,060 (14.1%) |
| Single Unit, Attached | 37 (13.2%) | 243 (86.8%) |
| 2 Unit Apartments | 6 (1.5%) | 387 (98.5%) |
| 3 or 4 Unit Apartments | 0 (0.0%) | 121 (100.0%) |
| 5 to 9 Unit Apartments | 0 (0.0%) | 74 (100.0%) |
| 10 or more Apartments | 10 (3.6%) | 267 (96.4%) |
| Mobile Home / Other | 1,210 (75.6%) | 390 (24.4%) |
| Total | 7,749 (75.3%) | 2,542 (24.7%) |
Housing Structures by Number of Rooms in Crook County
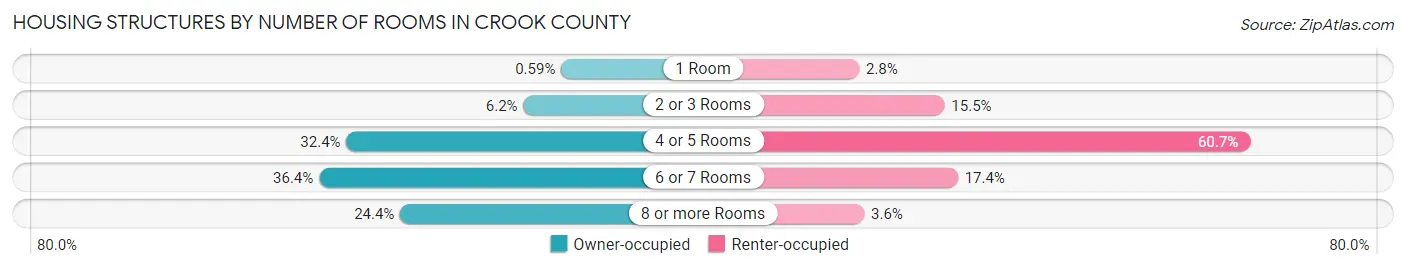
| Number of Rooms | Owner-occupied | Renter-occupied |
| 1 Room | 46 (0.6%) | 72 (2.8%) |
| 2 or 3 Rooms | 480 (6.2%) | 393 (15.5%) |
| 4 or 5 Rooms | 2,509 (32.4%) | 1,543 (60.7%) |
| 6 or 7 Rooms | 2,822 (36.4%) | 443 (17.4%) |
| 8 or more Rooms | 1,892 (24.4%) | 91 (3.6%) |
| Total | 7,749 (100.0%) | 2,542 (100.0%) |
Housing Structure by Heating Type in Crook County
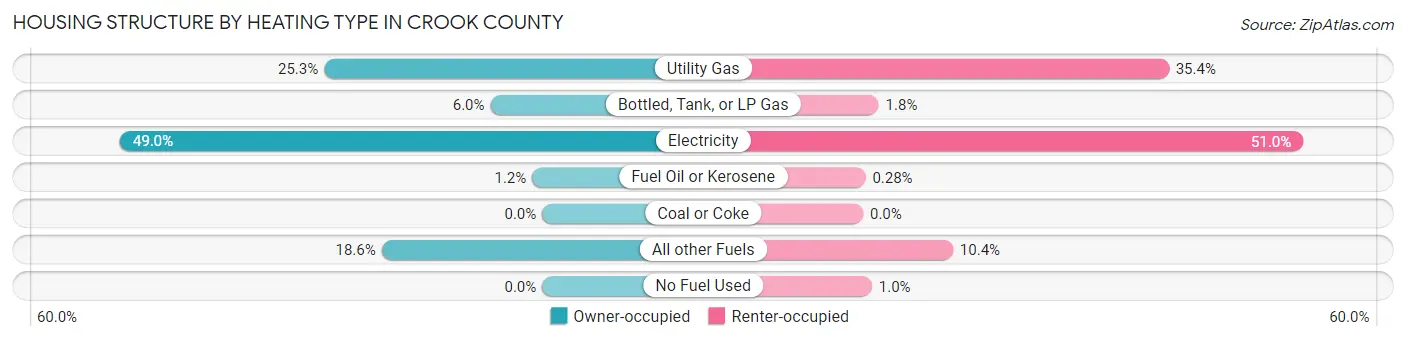
| Heating Type | Owner-occupied | Renter-occupied |
| Utility Gas | 1,959 (25.3%) | 901 (35.4%) |
| Bottled, Tank, or LP Gas | 465 (6.0%) | 46 (1.8%) |
| Electricity | 3,793 (48.9%) | 1,297 (51.0%) |
| Fuel Oil or Kerosene | 90 (1.2%) | 7 (0.3%) |
| Coal or Coke | 0 (0.0%) | 0 (0.0%) |
| All other Fuels | 1,442 (18.6%) | 265 (10.4%) |
| No Fuel Used | 0 (0.0%) | 26 (1.0%) |
| Total | 7,749 (100.0%) | 2,542 (100.0%) |
Household Vehicle Usage in Crook County
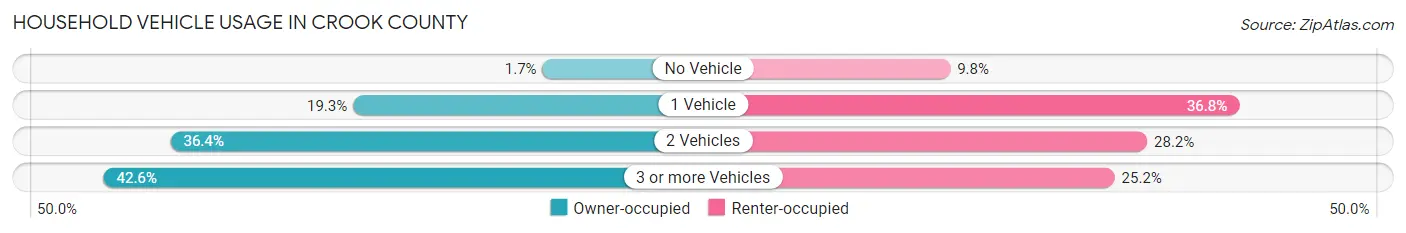
| Vehicles per Household | Owner-occupied | Renter-occupied |
| No Vehicle | 129 (1.7%) | 250 (9.8%) |
| 1 Vehicle | 1,499 (19.3%) | 935 (36.8%) |
| 2 Vehicles | 2,818 (36.4%) | 717 (28.2%) |
| 3 or more Vehicles | 3,303 (42.6%) | 640 (25.2%) |
| Total | 7,749 (100.0%) | 2,542 (100.0%) |
Real Estate & Mortgages in Crook County
Real Estate and Mortgage Overview in Crook County
| Characteristic | Without Mortgage | With Mortgage |
| Housing Units | 2,758 | 4,991 |
| Median Property Value | $307,500 | $396,500 |
| Median Household Income | $61,865 | $1,015 |
| Monthly Housing Costs | $496 | $458 |
| Real Estate Taxes | $2,148 | $65 |
Property Value by Mortgage Status in Crook County
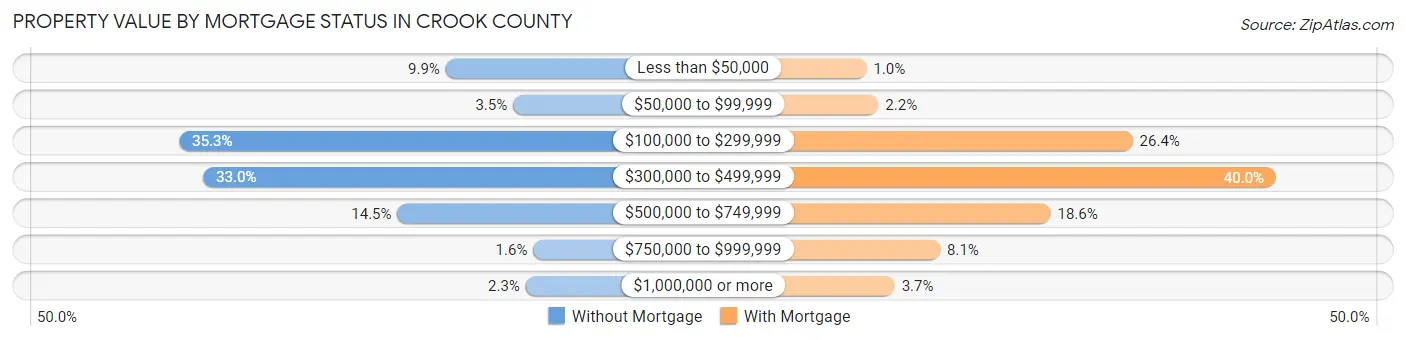
| Property Value | Without Mortgage | With Mortgage |
| Less than $50,000 | 273 (9.9%) | 52 (1.0%) |
| $50,000 to $99,999 | 96 (3.5%) | 109 (2.2%) |
| $100,000 to $299,999 | 973 (35.3%) | 1,317 (26.4%) |
| $300,000 to $499,999 | 910 (33.0%) | 1,998 (40.0%) |
| $500,000 to $749,999 | 400 (14.5%) | 927 (18.6%) |
| $750,000 to $999,999 | 43 (1.6%) | 402 (8.1%) |
| $1,000,000 or more | 63 (2.3%) | 186 (3.7%) |
| Total | 2,758 (100.0%) | 4,991 (100.0%) |
Household Income by Mortgage Status in Crook County
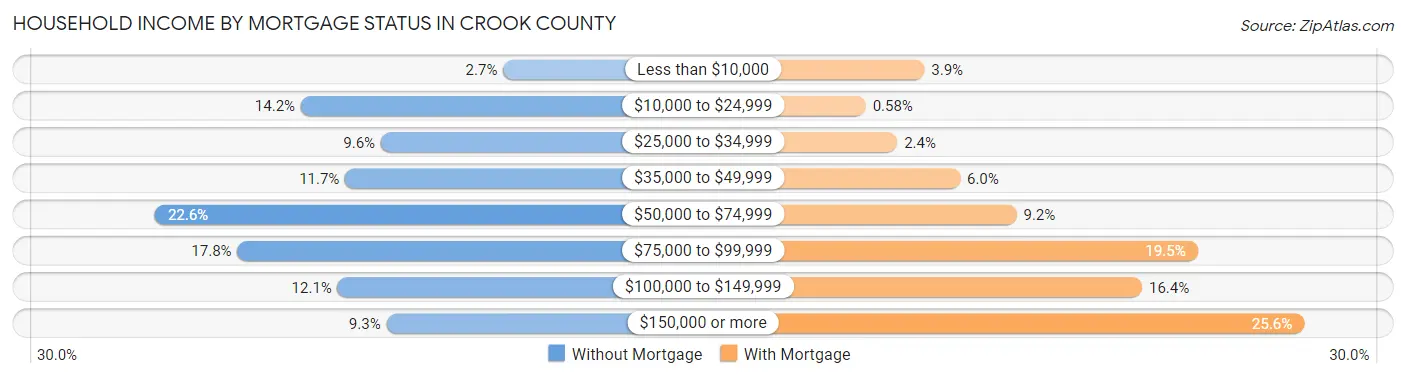
| Household Income | Without Mortgage | With Mortgage |
| Less than $10,000 | 73 (2.6%) | 196 (3.9%) |
| $10,000 to $24,999 | 392 (14.2%) | 29 (0.6%) |
| $25,000 to $34,999 | 266 (9.6%) | 119 (2.4%) |
| $35,000 to $49,999 | 322 (11.7%) | 298 (6.0%) |
| $50,000 to $74,999 | 622 (22.6%) | 459 (9.2%) |
| $75,000 to $99,999 | 492 (17.8%) | 975 (19.5%) |
| $100,000 to $149,999 | 334 (12.1%) | 817 (16.4%) |
| $150,000 or more | 257 (9.3%) | 1,279 (25.6%) |
| Total | 2,758 (100.0%) | 4,991 (100.0%) |
Property Value to Household Income Ratio in Crook County
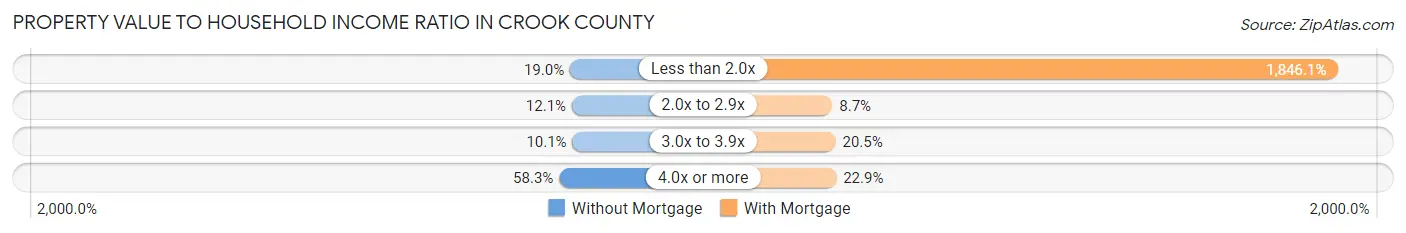
| Value-to-Income Ratio | Without Mortgage | With Mortgage |
| Less than 2.0x | 523 (19.0%) | 92,141 (1,846.1%) |
| 2.0x to 2.9x | 333 (12.1%) | 436 (8.7%) |
| 3.0x to 3.9x | 279 (10.1%) | 1,025 (20.5%) |
| 4.0x or more | 1,609 (58.3%) | 1,142 (22.9%) |
| Total | 2,758 (100.0%) | 4,991 (100.0%) |
Real Estate Taxes by Mortgage Status in Crook County

| Property Taxes | Without Mortgage | With Mortgage |
| Less than $800 | 385 (14.0%) | 0 (0.0%) |
| $800 to $1,499 | 389 (14.1%) | 208 (4.2%) |
| $800 to $1,499 | 1,746 (63.3%) | 440 (8.8%) |
| Total | 2,758 (100.0%) | 4,991 (100.0%) |
Health & Disability in Crook County
Health Insurance Coverage by Age in Crook County
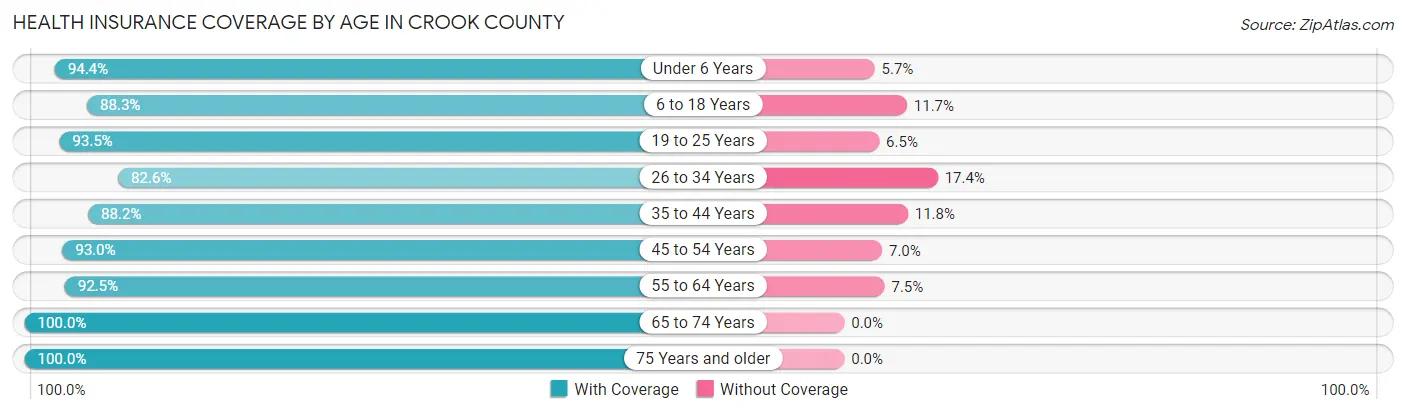
| Age Bracket | With Coverage | Without Coverage |
| Under 6 Years | 1,470 (94.4%) | 88 (5.7%) |
| 6 to 18 Years | 3,194 (88.3%) | 422 (11.7%) |
| 19 to 25 Years | 1,337 (93.5%) | 93 (6.5%) |
| 26 to 34 Years | 1,873 (82.6%) | 395 (17.4%) |
| 35 to 44 Years | 2,666 (88.2%) | 358 (11.8%) |
| 45 to 54 Years | 2,799 (93.0%) | 212 (7.0%) |
| 55 to 64 Years | 3,594 (92.5%) | 292 (7.5%) |
| 65 to 74 Years | 3,849 (100.0%) | 0 (0.0%) |
| 75 Years and older | 2,275 (100.0%) | 0 (0.0%) |
| Total | 23,057 (92.5%) | 1,860 (7.5%) |
Health Insurance Coverage by Citizenship Status in Crook County

| Citizenship Status | With Coverage | Without Coverage |
| Native Born | 1,470 (94.4%) | 88 (5.7%) |
| Foreign Born, Citizen | 3,194 (88.3%) | 422 (11.7%) |
| Foreign Born, not a Citizen | 1,337 (93.5%) | 93 (6.5%) |
Health Insurance Coverage by Household Income in Crook County
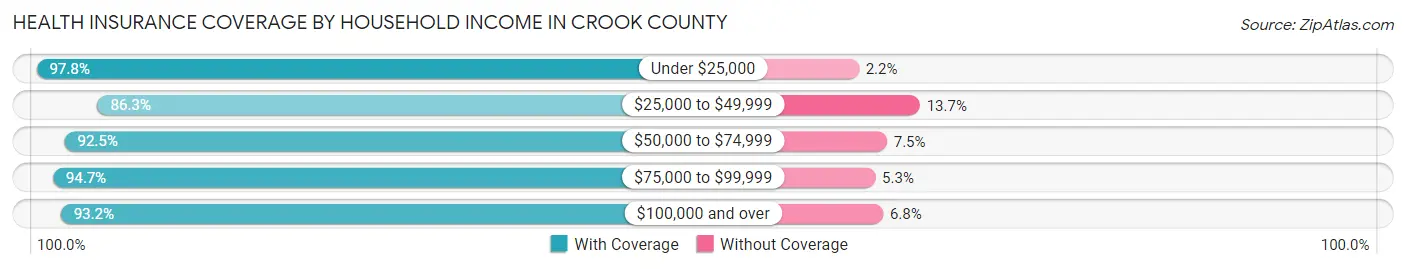
| Household Income | With Coverage | Without Coverage |
| Under $25,000 | 1,707 (97.8%) | 39 (2.2%) |
| $25,000 to $49,999 | 3,608 (86.3%) | 571 (13.7%) |
| $50,000 to $74,999 | 4,012 (92.5%) | 325 (7.5%) |
| $75,000 to $99,999 | 4,212 (94.7%) | 236 (5.3%) |
| $100,000 and over | 9,434 (93.2%) | 686 (6.8%) |
Public vs Private Health Insurance Coverage by Age in Crook County
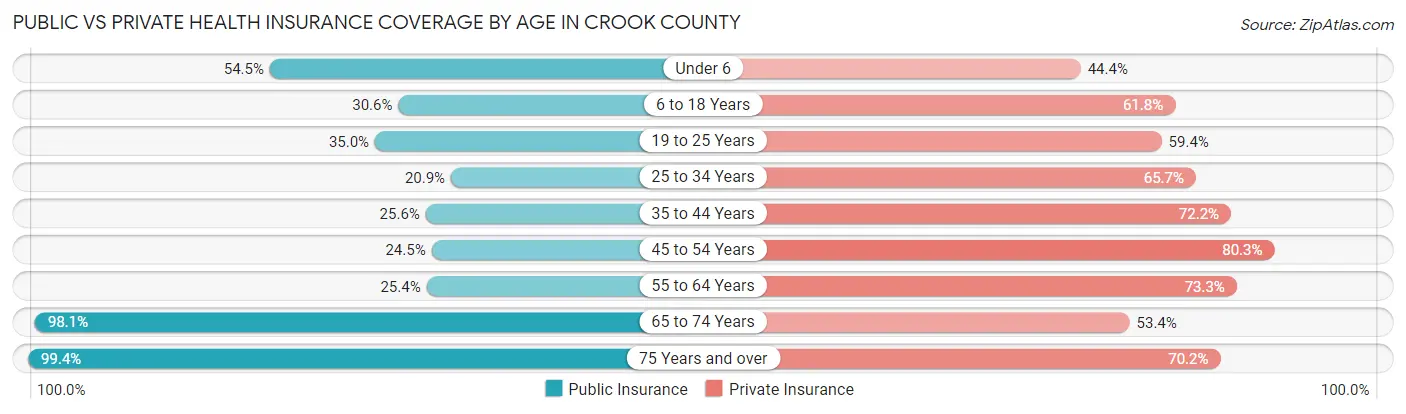
| Age Bracket | Public Insurance | Private Insurance |
| Under 6 | 849 (54.5%) | 691 (44.4%) |
| 6 to 18 Years | 1,108 (30.6%) | 2,236 (61.8%) |
| 19 to 25 Years | 500 (35.0%) | 849 (59.4%) |
| 25 to 34 Years | 473 (20.9%) | 1,490 (65.7%) |
| 35 to 44 Years | 773 (25.6%) | 2,184 (72.2%) |
| 45 to 54 Years | 737 (24.5%) | 2,417 (80.3%) |
| 55 to 64 Years | 987 (25.4%) | 2,848 (73.3%) |
| 65 to 74 Years | 3,776 (98.1%) | 2,056 (53.4%) |
| 75 Years and over | 2,261 (99.4%) | 1,598 (70.2%) |
| Total | 11,464 (46.0%) | 16,369 (65.7%) |
Disability Status by Sex by Age in Crook County
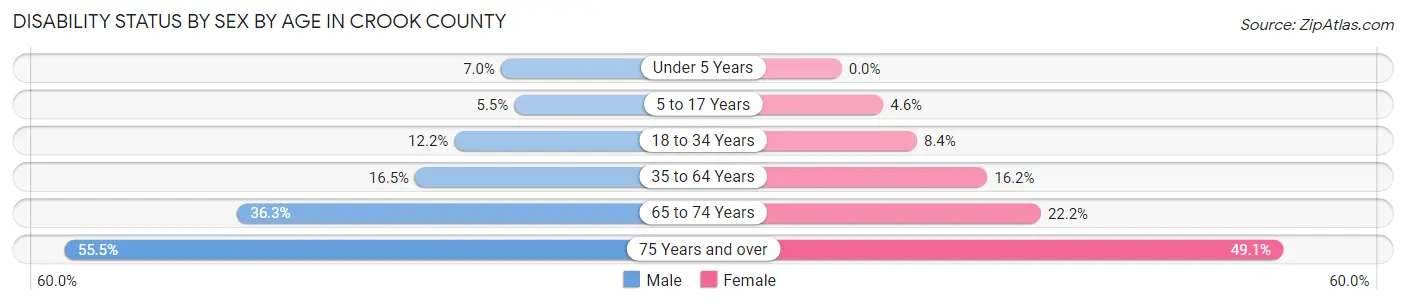
| Age Bracket | Male | Female |
| Under 5 Years | 44 (7.0%) | 0 (0.0%) |
| 5 to 17 Years | 99 (5.5%) | 83 (4.6%) |
| 18 to 34 Years | 242 (12.2%) | 164 (8.4%) |
| 35 to 64 Years | 817 (16.5%) | 807 (16.2%) |
| 65 to 74 Years | 700 (36.3%) | 426 (22.2%) |
| 75 Years and over | 629 (55.5%) | 561 (49.1%) |
Disability Class by Sex by Age in Crook County
Disability Class: Hearing Difficulty
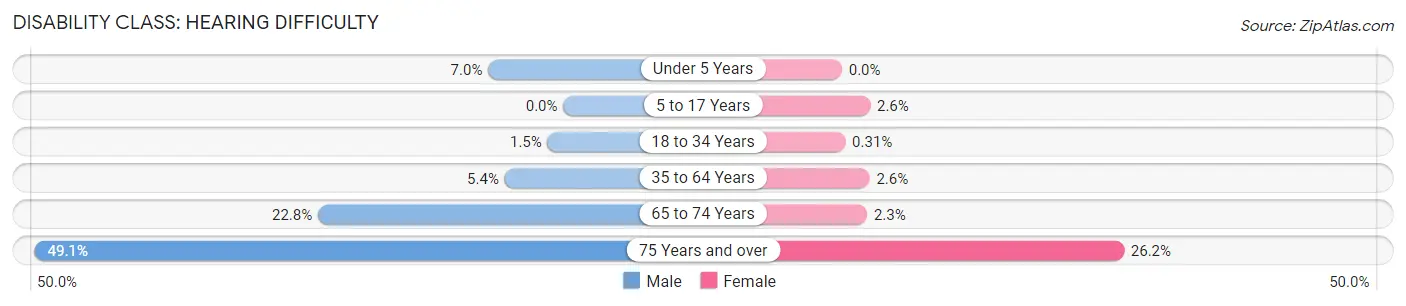
| Age Bracket | Male | Female |
| Under 5 Years | 44 (7.0%) | 0 (0.0%) |
| 5 to 17 Years | 0 (0.0%) | 47 (2.6%) |
| 18 to 34 Years | 29 (1.5%) | 6 (0.3%) |
| 35 to 64 Years | 269 (5.4%) | 128 (2.6%) |
| 65 to 74 Years | 439 (22.8%) | 45 (2.3%) |
| 75 Years and over | 556 (49.1%) | 299 (26.2%) |
Disability Class: Vision Difficulty
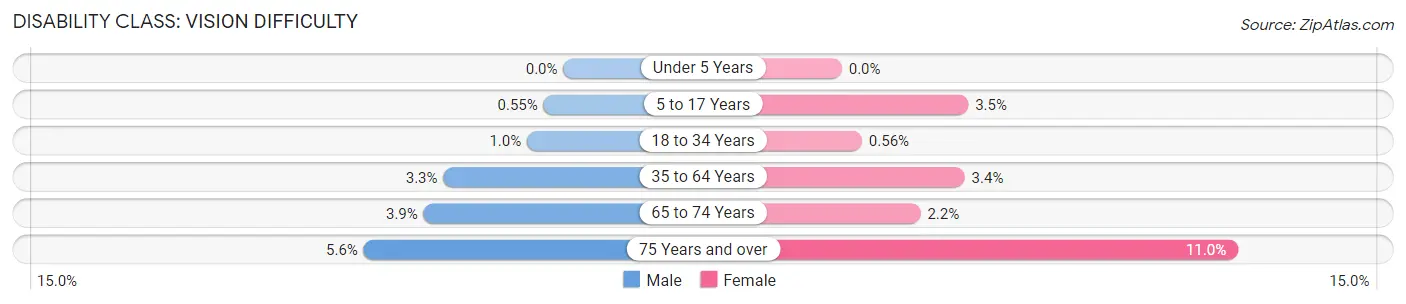
| Age Bracket | Male | Female |
| Under 5 Years | 0 (0.0%) | 0 (0.0%) |
| 5 to 17 Years | 10 (0.5%) | 63 (3.5%) |
| 18 to 34 Years | 20 (1.0%) | 11 (0.6%) |
| 35 to 64 Years | 165 (3.3%) | 170 (3.4%) |
| 65 to 74 Years | 75 (3.9%) | 42 (2.2%) |
| 75 Years and over | 63 (5.6%) | 126 (11.0%) |
Disability Class: Cognitive Difficulty
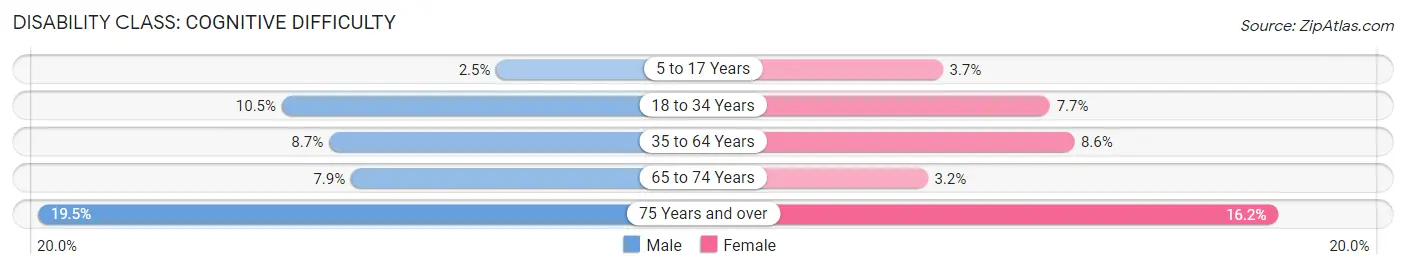
| Age Bracket | Male | Female |
| 5 to 17 Years | 45 (2.5%) | 67 (3.7%) |
| 18 to 34 Years | 208 (10.4%) | 151 (7.7%) |
| 35 to 64 Years | 430 (8.7%) | 429 (8.6%) |
| 65 to 74 Years | 152 (7.9%) | 61 (3.2%) |
| 75 Years and over | 221 (19.5%) | 185 (16.2%) |
Disability Class: Ambulatory Difficulty
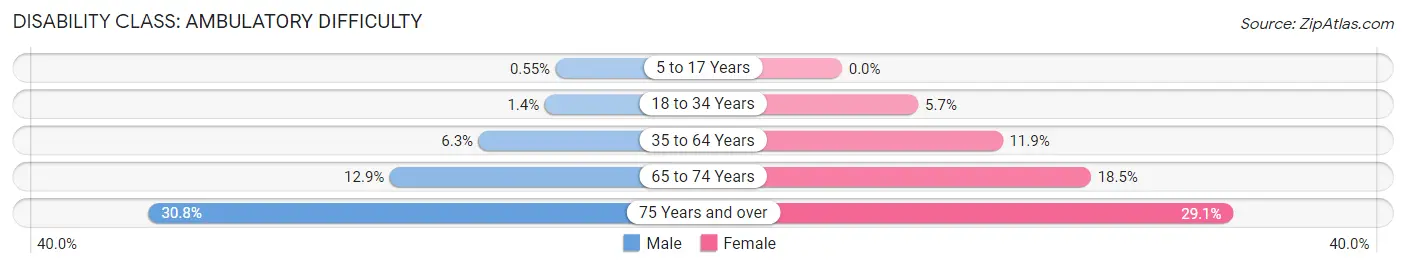
| Age Bracket | Male | Female |
| 5 to 17 Years | 10 (0.5%) | 0 (0.0%) |
| 18 to 34 Years | 27 (1.4%) | 111 (5.7%) |
| 35 to 64 Years | 310 (6.3%) | 594 (11.9%) |
| 65 to 74 Years | 248 (12.9%) | 355 (18.5%) |
| 75 Years and over | 349 (30.8%) | 332 (29.1%) |
Disability Class: Self-Care Difficulty

| Age Bracket | Male | Female |
| 5 to 17 Years | 64 (3.5%) | 0 (0.0%) |
| 18 to 34 Years | 12 (0.6%) | 27 (1.4%) |
| 35 to 64 Years | 222 (4.5%) | 161 (3.2%) |
| 65 to 74 Years | 106 (5.5%) | 14 (0.7%) |
| 75 Years and over | 103 (9.1%) | 124 (10.9%) |
Technology Access in Crook County
Computing Device Access in Crook County
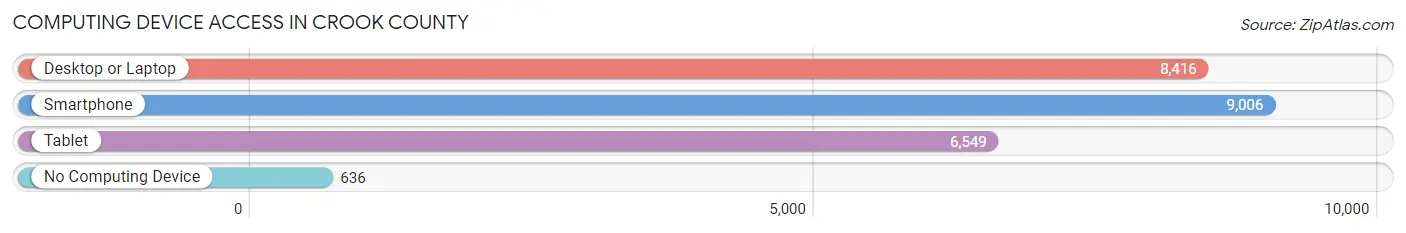
| Device Type | # Households | % Households |
| Desktop or Laptop | 8,416 | 81.8% |
| Smartphone | 9,006 | 87.5% |
| Tablet | 6,549 | 63.6% |
| No Computing Device | 636 | 6.2% |
| Total | 10,291 | 100.0% |
Internet Access in Crook County
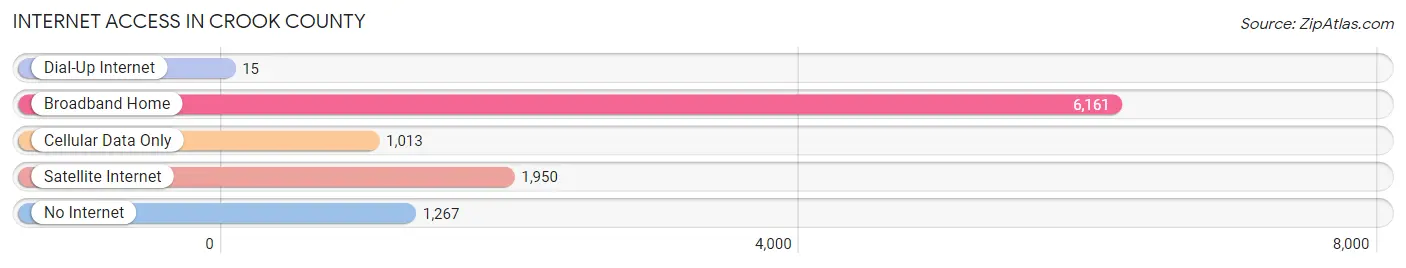
| Internet Type | # Households | % Households |
| Dial-Up Internet | 15 | 0.2% |
| Broadband Home | 6,161 | 59.9% |
| Cellular Data Only | 1,013 | 9.8% |
| Satellite Internet | 1,950 | 19.0% |
| No Internet | 1,267 | 12.3% |
| Total | 10,291 | 100.0% |
Crook County Summary
Crook County, Oregon is located in the central part of the state and is part of the High Desert region. It is bordered by Deschutes County to the north, Jefferson County to the east, Wheeler County to the south, and Harney County to the west. The county seat is Prineville, and the largest city is Prineville. The county was named after George Crook, a general in the United States Army.
Geography
Crook County covers an area of 2,955 square miles and is the fifth largest county in Oregon. It is located in the High Desert region of the state and is characterized by its dry climate and rugged terrain. The county is home to the Ochoco National Forest, which covers 1,735 square miles and is the largest national forest in Oregon. The forest is home to a variety of wildlife, including elk, deer, and bighorn sheep. The county also contains the Crooked River National Grassland, which covers an area of 1,735 square miles and is managed by the United States Forest Service.
The county is home to several mountain ranges, including the Ochoco Mountains, the Maury Mountains, and the Crooked River Mountains. The highest point in the county is the summit of Lookout Mountain, which has an elevation of 6,945 feet. The county also contains several lakes, including Prineville Reservoir, Ochoco Reservoir, and Crescent Lake.
Economy
The economy of Crook County is largely based on agriculture and timber. The county is home to several large timber companies, including Weyerhaeuser, Stimson Lumber Company, and Ochoco Lumber Company. Agriculture is also an important part of the economy, with the county producing hay, wheat, barley, and other crops.
The county is also home to several manufacturing companies, including Crook County Manufacturing, which produces wood products, and Prineville Fabrication, which produces metal products. The county is also home to several technology companies, including Facebook, which has a data center in Prineville.
Demographics
As of the 2010 census, the population of Crook County was 20,978. The population is predominantly white (93.2%), with small percentages of Native American (2.2%), Asian (1.2%), and African American (0.7%) populations. The median household income in the county is $45,945, and the median age is 40.
The county is home to several small towns, including Prineville, which is the county seat and largest city, and Mitchell, which is the second largest city. Other towns in the county include Powell Butte, Post, and Paulina.
Conclusion
Crook County, Oregon is a large county located in the High Desert region of the state. It is home to a variety of wildlife, including elk, deer, and bighorn sheep. The economy of the county is largely based on agriculture and timber, and the county is home to several technology companies, including Facebook. The population of the county is predominantly white, with small percentages of Native American, Asian, and African American populations.
Common Questions
What is the Total Population of Crook County?
Total Population of Crook County is 24,987.
What is the Total Male Population of Crook County?
Total Male Population of Crook County is 12,493.
What is the Total Female Population of Crook County?
Total Female Population of Crook County is 12,494.
What is the Ratio of Males per 100 Females in Crook County?
There are 99.99 Males per 100 Females in Crook County.
What is the Ratio of Females per 100 Males in Crook County?
There are 100.01 Females per 100 Males in Crook County.
What is the Median Population Age in Crook County?
Median Population Age in Crook County is 47.0 Years.
What is the Average Family Size in Crook County
Average Family Size in Crook County is 2.8 People.
What is the Average Household Size in Crook County
Average Household Size in Crook County is 2.4 People.
What is Per Capita Income in Crook County?
Per Capita income in Crook County is $38,484.
What is the Median Family Income in Crook County?
Median Family Income in Crook County is $85,708.
What is the Median Household income in Crook County?
Median Household Income in Crook County is $74,969.
What is Income or Wage Gap in Crook County?
Income or Wage Gap in Crook County is 25.2%.
Women in Crook County earn 74.8 cents for every dollar earned by a man.
What is Inequality or Gini Index in Crook County?
Inequality or Gini Index in Crook County is 0.41.
How Large is the Labor Force in Crook County?
There are 11,774 People in the Labor Forcein in Crook County.
What is the Percentage of People in the Labor Force in Crook County?
57.2% of People are in the Labor Force in Crook County.
What is the Unemployment Rate in Crook County?
Unemployment Rate in Crook County is 4.1%.