Coos County, OR
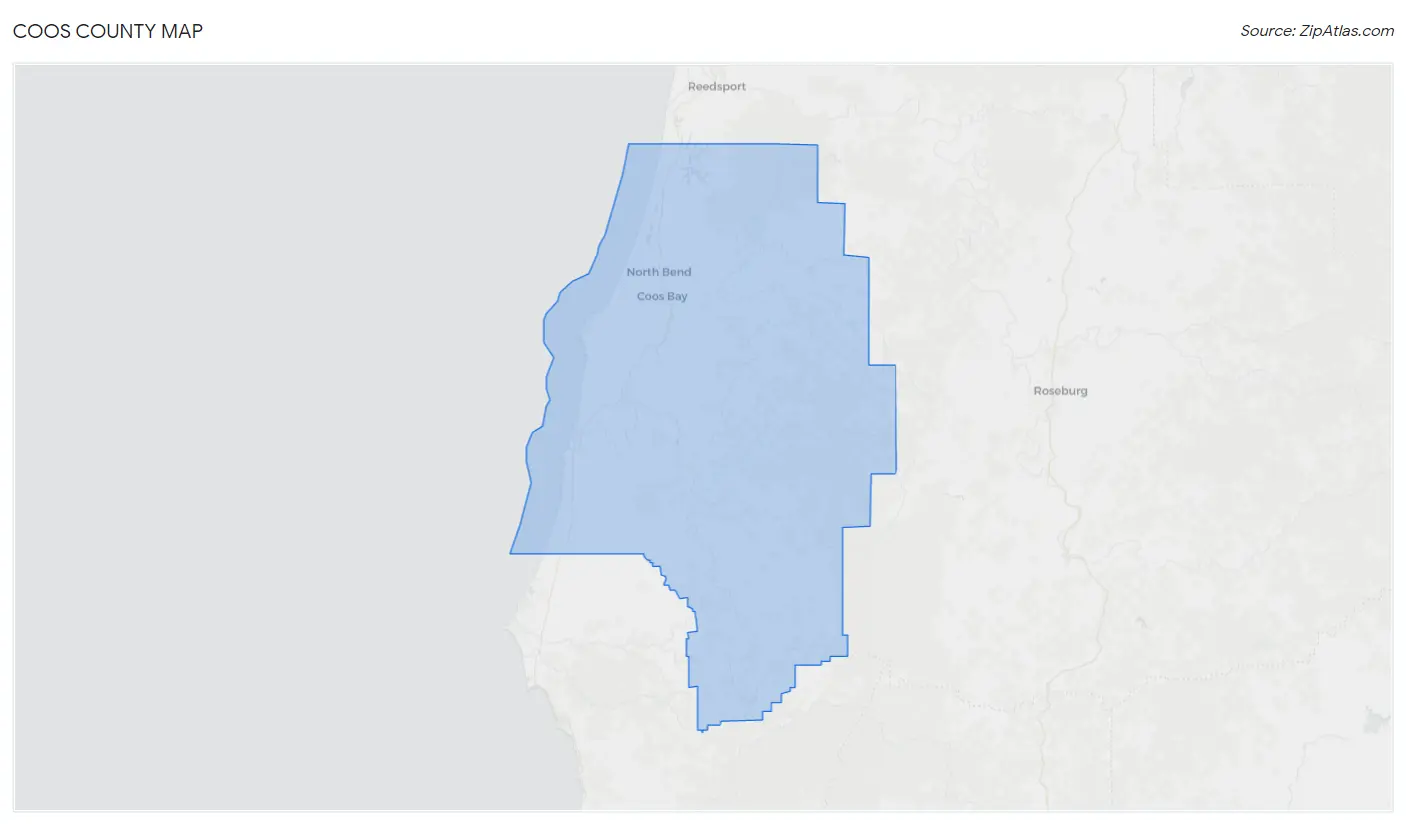
Coos County Map
Coos County Overview
64,908
TOTAL POPULATION
32,219
MALE POPULATION
32,689
FEMALE POPULATION
98.56
MALES / 100 FEMALES
101.46
FEMALES / 100 MALES
48.4
MEDIAN AGE
2.8
AVG FAMILY SIZE
2.3
AVG HOUSEHOLD SIZE
$33,572
PER CAPITA INCOME
$73,947
AVG FAMILY INCOME
$57,563
AVG HOUSEHOLD INCOME
33.9%
WAGE / INCOME GAP [ % ]
66.1¢/ $1
WAGE / INCOME GAP [ $ ]
$10,758
FAMILY INCOME DEFICIT
0.45
INEQUALITY / GINI INDEX
27,697
LABOR FORCE [ PEOPLE ]
50.8%
PERCENT IN LABOR FORCE
5.8%
UNEMPLOYMENT RATE
Coos County Area Codes
Race in Coos County
The most populous races in Coos County are White / Caucasian (56,258 | 86.7%), Two or more Races (5,029 | 7.7%), and Hispanic or Latino (4,618 | 7.1%).
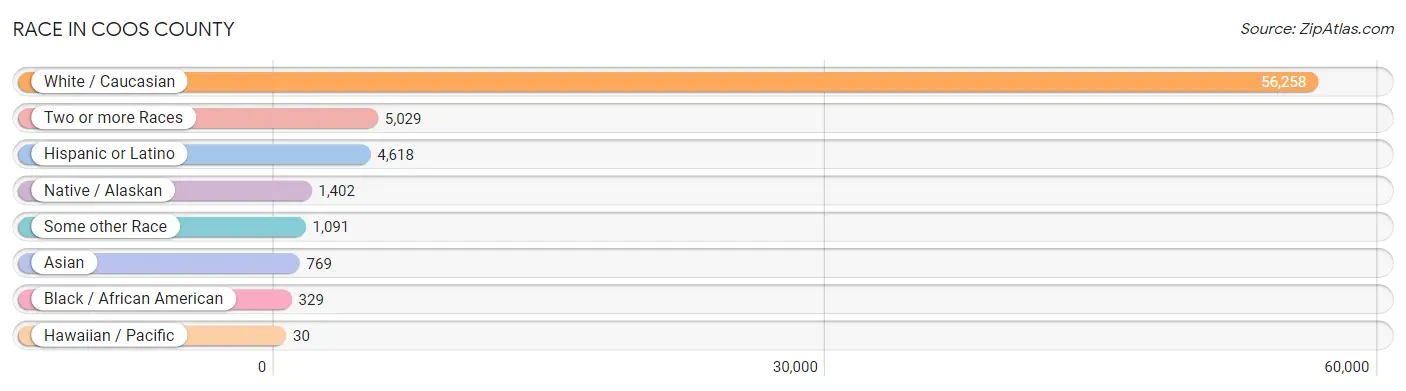
| Race | # Population | % Population |
| Asian | 769 | 1.2% |
| Black / African American | 329 | 0.5% |
| Hawaiian / Pacific | 30 | 0.1% |
| Hispanic or Latino | 4,618 | 7.1% |
| Native / Alaskan | 1,402 | 2.2% |
| White / Caucasian | 56,258 | 86.7% |
| Two or more Races | 5,029 | 7.7% |
| Some other Race | 1,091 | 1.7% |
| Total | 64,908 | 100.0% |
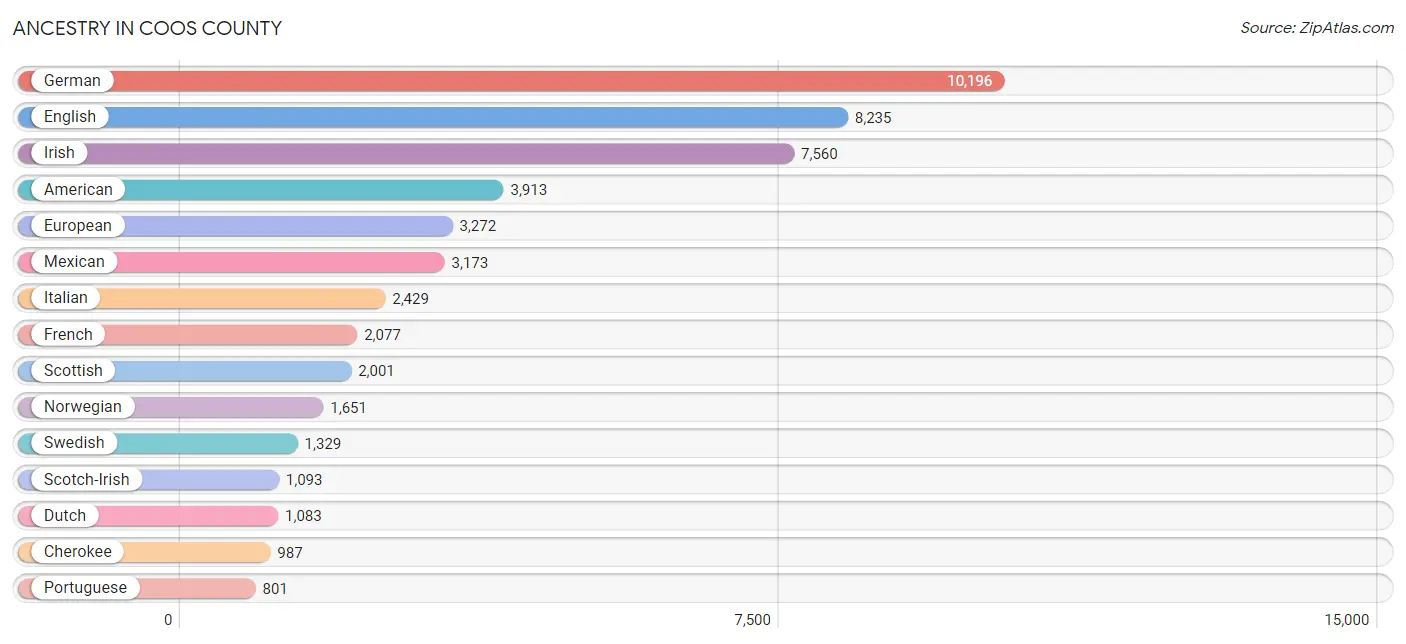
Ancestry in Coos County
The most populous ancestries reported in Coos County are German (10,196 | 15.7%), English (8,235 | 12.7%), Irish (7,560 | 11.7%), American (3,913 | 6.0%), and European (3,272 | 5.0%), together accounting for 51.1% of all Coos County residents.
| Ancestry | # Population | % Population |
| African | 43 | 0.1% |
| Albanian | 52 | 0.1% |
| Aleut | 8 | 0.0% |
| American | 3,913 | 6.0% |
| Apache | 14 | 0.0% |
| Arab | 169 | 0.3% |
| Armenian | 74 | 0.1% |
| Australian | 33 | 0.1% |
| Austrian | 83 | 0.1% |
| Basque | 147 | 0.2% |
| Belgian | 65 | 0.1% |
| Bhutanese | 196 | 0.3% |
| Blackfeet | 242 | 0.4% |
| Brazilian | 4 | 0.0% |
| British | 432 | 0.7% |
| Bulgarian | 29 | 0.0% |
| Burmese | 57 | 0.1% |
| Cajun | 160 | 0.3% |
| Canadian | 82 | 0.1% |
| Celtic | 7 | 0.0% |
| Central American | 262 | 0.4% |
| Cherokee | 987 | 1.5% |
| Chickasaw | 31 | 0.1% |
| Chilean | 15 | 0.0% |
| Chinese | 18 | 0.0% |
| Chippewa | 46 | 0.1% |
| Choctaw | 173 | 0.3% |
| Colombian | 47 | 0.1% |
| Creek | 13 | 0.0% |
| Crow | 13 | 0.0% |
| Cuban | 128 | 0.2% |
| Czech | 428 | 0.7% |
| Czechoslovakian | 16 | 0.0% |
| Danish | 577 | 0.9% |
| Dutch | 1,083 | 1.7% |
| Eastern European | 133 | 0.2% |
| Ecuadorian | 1 | 0.0% |
| English | 8,235 | 12.7% |
| Estonian | 6 | 0.0% |
| European | 3,272 | 5.0% |
| Fijian | 9 | 0.0% |
| Filipino | 1 | 0.0% |
| Finnish | 329 | 0.5% |
| French | 2,077 | 3.2% |
| French American Indian | 47 | 0.1% |
| French Canadian | 403 | 0.6% |
| German | 10,196 | 15.7% |
| Greek | 247 | 0.4% |
| Guamanian / Chamorro | 5 | 0.0% |
| Guatemalan | 192 | 0.3% |
| Haitian | 7 | 0.0% |
| Honduran | 58 | 0.1% |
| Hungarian | 143 | 0.2% |
| Indian (Asian) | 317 | 0.5% |
| Indonesian | 117 | 0.2% |
| Inupiat | 65 | 0.1% |
| Iranian | 18 | 0.0% |
| Irish | 7,560 | 11.7% |
| Iroquois | 5 | 0.0% |
| Israeli | 7 | 0.0% |
| Italian | 2,429 | 3.7% |
| Jamaican | 24 | 0.0% |
| Korean | 441 | 0.7% |
| Latvian | 23 | 0.0% |
| Lebanese | 135 | 0.2% |
| Lithuanian | 19 | 0.0% |
| Malaysian | 3 | 0.0% |
| Mexican | 3,173 | 4.9% |
| Mexican American Indian | 240 | 0.4% |
| Native Hawaiian | 64 | 0.1% |
| Navajo | 60 | 0.1% |
| New Zealander | 5 | 0.0% |
| Northern European | 236 | 0.4% |
| Norwegian | 1,651 | 2.5% |
| Osage | 8 | 0.0% |
| Paiute | 14 | 0.0% |
| Pakistani | 34 | 0.1% |
| Panamanian | 12 | 0.0% |
| Paraguayan | 24 | 0.0% |
| Pennsylvania German | 13 | 0.0% |
| Polish | 727 | 1.1% |
| Portuguese | 801 | 1.2% |
| Pueblo | 21 | 0.0% |
| Puerto Rican | 99 | 0.2% |
| Puget Sound Salish | 72 | 0.1% |
| Romanian | 32 | 0.1% |
| Russian | 226 | 0.4% |
| Samoan | 74 | 0.1% |
| Scandinavian | 568 | 0.9% |
| Scotch-Irish | 1,093 | 1.7% |
| Scottish | 2,001 | 3.1% |
| Seminole | 28 | 0.0% |
| Serbian | 10 | 0.0% |
| Sioux | 135 | 0.2% |
| Slavic | 39 | 0.1% |
| Slovak | 10 | 0.0% |
| Slovene | 32 | 0.1% |
| South American | 87 | 0.1% |
| Spaniard | 504 | 0.8% |
| Spanish | 171 | 0.3% |
| Sri Lankan | 119 | 0.2% |
| Subsaharan African | 43 | 0.1% |
| Swedish | 1,329 | 2.1% |
| Swiss | 174 | 0.3% |
| Thai | 140 | 0.2% |
| Tlingit-Haida | 25 | 0.0% |
| Trinidadian and Tobagonian | 25 | 0.0% |
| Turkish | 13 | 0.0% |
| Ukrainian | 24 | 0.0% |
| Ute | 7 | 0.0% |
| Vietnamese | 61 | 0.1% |
| Welsh | 387 | 0.6% |
| Yaqui | 20 | 0.0% |
| Yugoslavian | 10 | 0.0% |
| Yup'ik | 59 | 0.1% | View All 115 Rows |
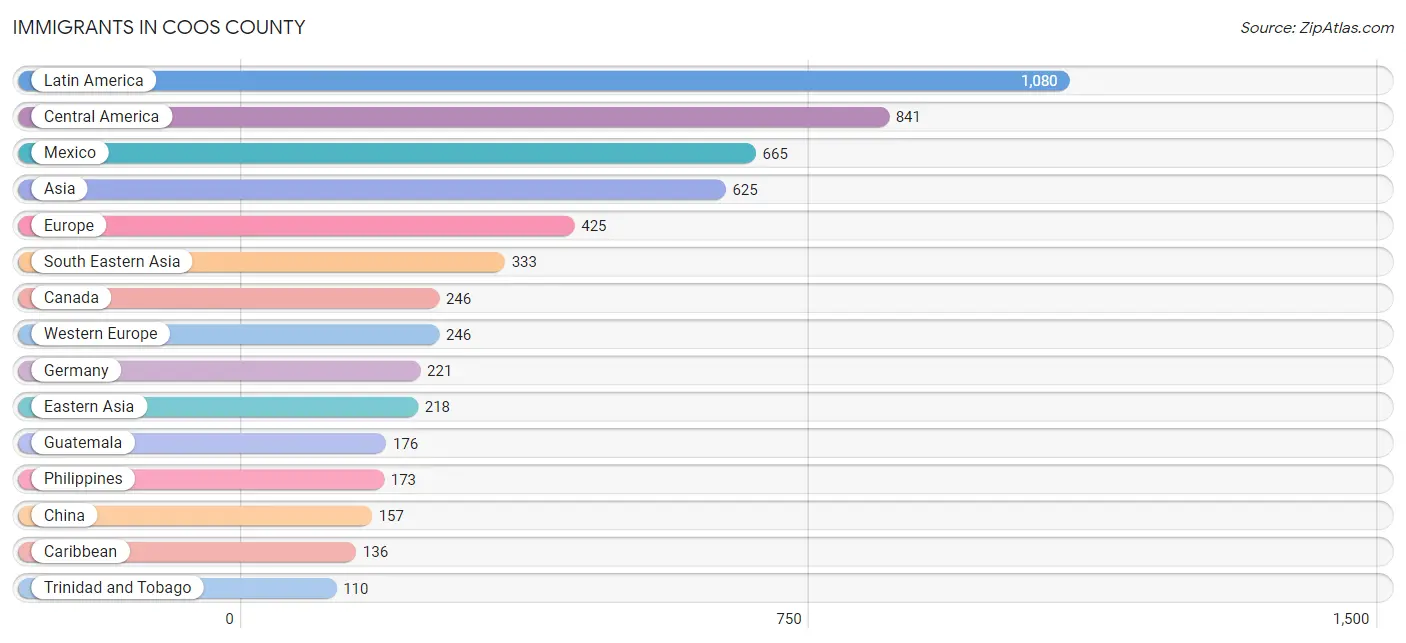
Immigrants in Coos County
The most numerous immigrant groups reported in Coos County came from Latin America (1,080 | 1.7%), Central America (841 | 1.3%), Mexico (665 | 1.0%), Asia (625 | 1.0%), and Europe (425 | 0.6%), together accounting for 5.6% of all Coos County residents.
| Immigration Origin | # Population | % Population |
| Africa | 18 | 0.0% |
| Argentina | 17 | 0.0% |
| Asia | 625 | 1.0% |
| Australia | 17 | 0.0% |
| Austria | 5 | 0.0% |
| Bangladesh | 61 | 0.1% |
| Brazil | 25 | 0.0% |
| Bulgaria | 9 | 0.0% |
| Canada | 246 | 0.4% |
| Caribbean | 136 | 0.2% |
| Central America | 841 | 1.3% |
| Chile | 4 | 0.0% |
| China | 157 | 0.2% |
| Colombia | 9 | 0.0% |
| Cuba | 13 | 0.0% |
| Eastern Africa | 18 | 0.0% |
| Eastern Asia | 218 | 0.3% |
| Eastern Europe | 89 | 0.1% |
| Ecuador | 5 | 0.0% |
| England | 37 | 0.1% |
| Europe | 425 | 0.6% |
| Fiji | 73 | 0.1% |
| France | 11 | 0.0% |
| Germany | 221 | 0.3% |
| Greece | 15 | 0.0% |
| Guatemala | 176 | 0.3% |
| Haiti | 13 | 0.0% |
| Israel | 13 | 0.0% |
| Italy | 12 | 0.0% |
| Japan | 33 | 0.1% |
| Korea | 28 | 0.0% |
| Laos | 3 | 0.0% |
| Latin America | 1,080 | 1.7% |
| Mexico | 665 | 1.0% |
| Northern Europe | 63 | 0.1% |
| Oceania | 98 | 0.2% |
| Peru | 19 | 0.0% |
| Philippines | 173 | 0.3% |
| Poland | 53 | 0.1% |
| Russia | 11 | 0.0% |
| South America | 103 | 0.2% |
| South Central Asia | 61 | 0.1% |
| South Eastern Asia | 333 | 0.5% |
| Southern Europe | 27 | 0.0% |
| Switzerland | 9 | 0.0% |
| Thailand | 13 | 0.0% |
| Trinidad and Tobago | 110 | 0.2% |
| Ukraine | 16 | 0.0% |
| Vietnam | 92 | 0.1% |
| Western Asia | 13 | 0.0% |
| Western Europe | 246 | 0.4% |
| Zimbabwe | 18 | 0.0% | View All 52 Rows |
Sex and Age in Coos County
Sex and Age in Coos County
The most populous age groups in Coos County are 65 to 69 Years (2,629 | 8.2%) for men and 60 to 64 Years (2,806 | 8.6%) for women.
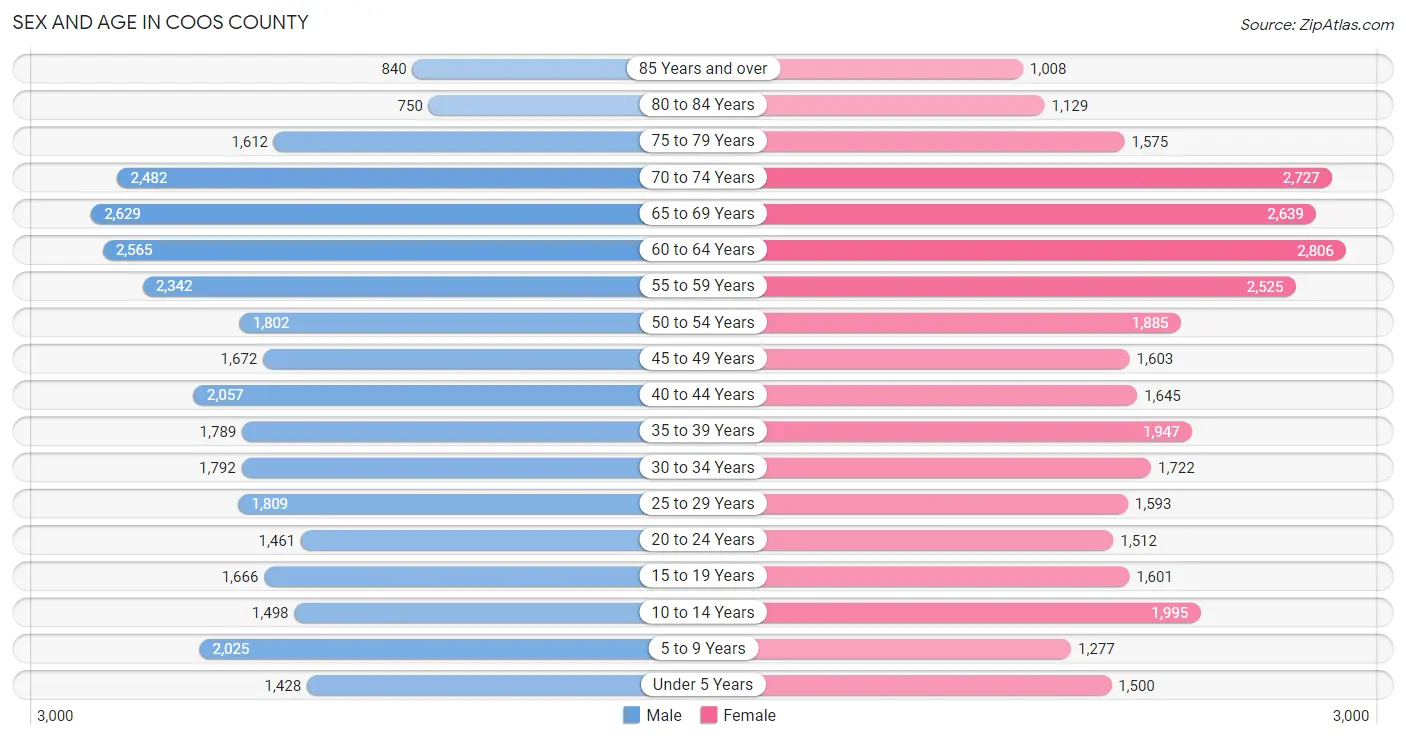
| Age Bracket | Male | Female |
| Under 5 Years | 1,428 (4.4%) | 1,500 (4.6%) |
| 5 to 9 Years | 2,025 (6.3%) | 1,277 (3.9%) |
| 10 to 14 Years | 1,498 (4.6%) | 1,995 (6.1%) |
| 15 to 19 Years | 1,666 (5.2%) | 1,601 (4.9%) |
| 20 to 24 Years | 1,461 (4.5%) | 1,512 (4.6%) |
| 25 to 29 Years | 1,809 (5.6%) | 1,593 (4.9%) |
| 30 to 34 Years | 1,792 (5.6%) | 1,722 (5.3%) |
| 35 to 39 Years | 1,789 (5.6%) | 1,947 (6.0%) |
| 40 to 44 Years | 2,057 (6.4%) | 1,645 (5.0%) |
| 45 to 49 Years | 1,672 (5.2%) | 1,603 (4.9%) |
| 50 to 54 Years | 1,802 (5.6%) | 1,885 (5.8%) |
| 55 to 59 Years | 2,342 (7.3%) | 2,525 (7.7%) |
| 60 to 64 Years | 2,565 (8.0%) | 2,806 (8.6%) |
| 65 to 69 Years | 2,629 (8.2%) | 2,639 (8.1%) |
| 70 to 74 Years | 2,482 (7.7%) | 2,727 (8.3%) |
| 75 to 79 Years | 1,612 (5.0%) | 1,575 (4.8%) |
| 80 to 84 Years | 750 (2.3%) | 1,129 (3.5%) |
| 85 Years and over | 840 (2.6%) | 1,008 (3.1%) |
| Total | 32,219 (100.0%) | 32,689 (100.0%) |
Families and Households in Coos County
Median Family Size in Coos County
The median family size in Coos County is 2.79 persons per family, with married-couple families (12,598 | 74.3%) accounting for the largest median family size of 2.83 persons per family. On the other hand, single male/father families (1,320 | 7.8%) represent the smallest median family size with 2.64 persons per family.
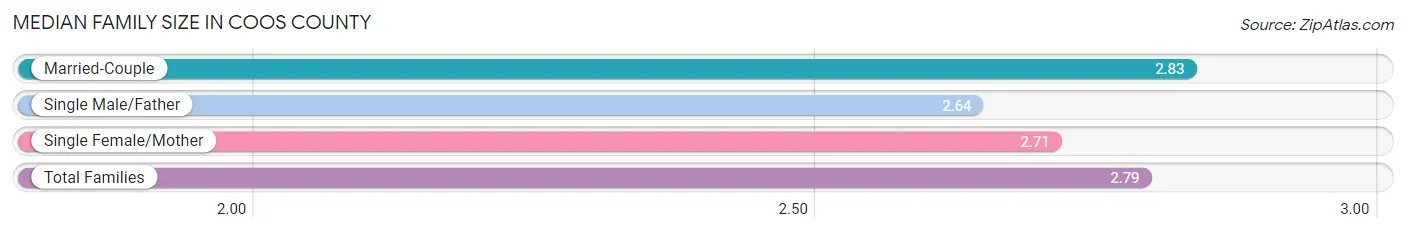
| Family Type | # Families | Family Size |
| Married-Couple | 12,598 (74.3%) | 2.83 |
| Single Male/Father | 1,320 (7.8%) | 2.64 |
| Single Female/Mother | 3,037 (17.9%) | 2.71 |
| Total Families | 16,955 (100.0%) | 2.79 |
Median Household Size in Coos County
The median household size in Coos County is 2.27 persons per household, with single male/father households (1,320 | 4.7%) accounting for the largest median household size of 3.15 persons per household. non-family households (11,120 | 39.6%) represent the smallest median household size with 1.25 persons per household.
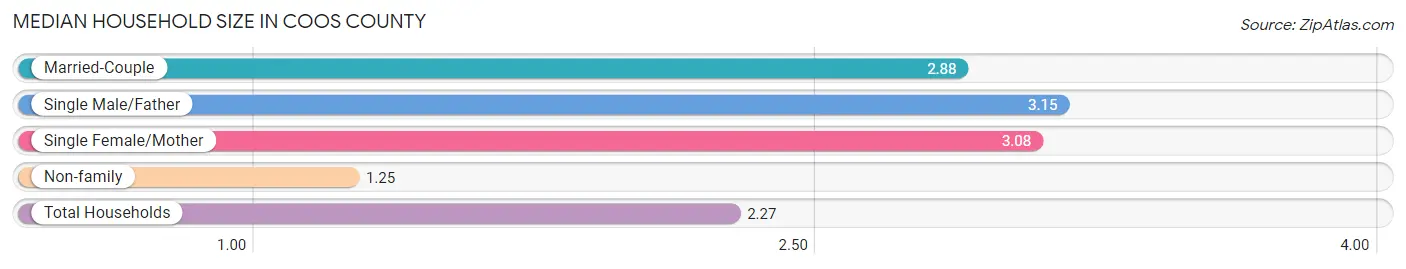
| Household Type | # Households | Household Size |
| Married-Couple | 12,598 (44.9%) | 2.88 |
| Single Male/Father | 1,320 (4.7%) | 3.15 |
| Single Female/Mother | 3,037 (10.8%) | 3.08 |
| Non-family | 11,120 (39.6%) | 1.25 |
| Total Households | 28,075 (100.0%) | 2.27 |
Household Size by Marriage Status in Coos County
Out of a total of 28,075 households in Coos County, 16,955 (60.4%) are family households, while 11,120 (39.6%) are nonfamily households. The most numerous type of family households are 2-person households, comprising 9,062, and the most common type of nonfamily households are 1-person households, comprising 8,702.
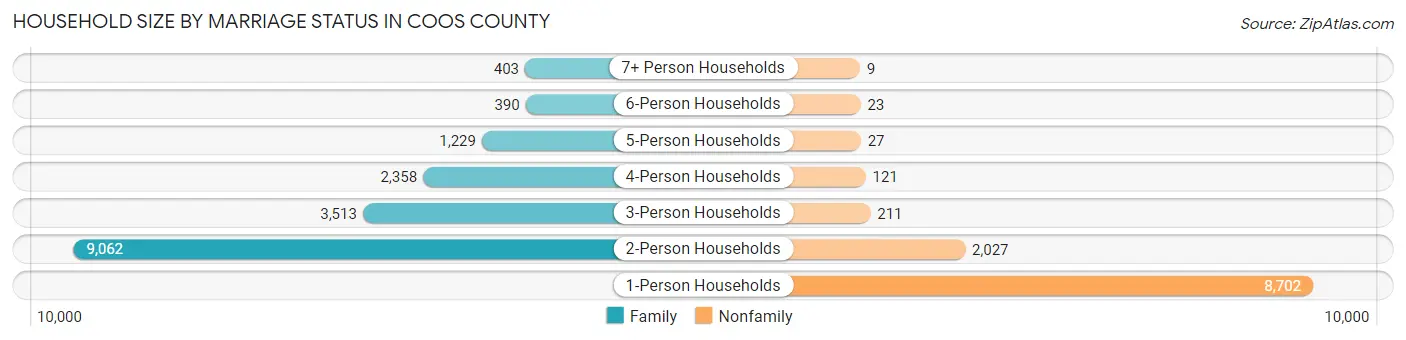
| Household Size | Family Households | Nonfamily Households |
| 1-Person Households | - | 8,702 (31.0%) |
| 2-Person Households | 9,062 (32.3%) | 2,027 (7.2%) |
| 3-Person Households | 3,513 (12.5%) | 211 (0.7%) |
| 4-Person Households | 2,358 (8.4%) | 121 (0.4%) |
| 5-Person Households | 1,229 (4.4%) | 27 (0.1%) |
| 6-Person Households | 390 (1.4%) | 23 (0.1%) |
| 7+ Person Households | 403 (1.4%) | 9 (0.0%) |
| Total | 16,955 (60.4%) | 11,120 (39.6%) |
Female Fertility in Coos County
Fertility by Age in Coos County
Average fertility rate in Coos County is 43.0 births per 1,000 women. Women in the age bracket of 20 to 34 years have the highest fertility rate with 82.0 births per 1,000 women. Women in the age bracket of 20 to 34 years acount for 77.3% of all women with births.
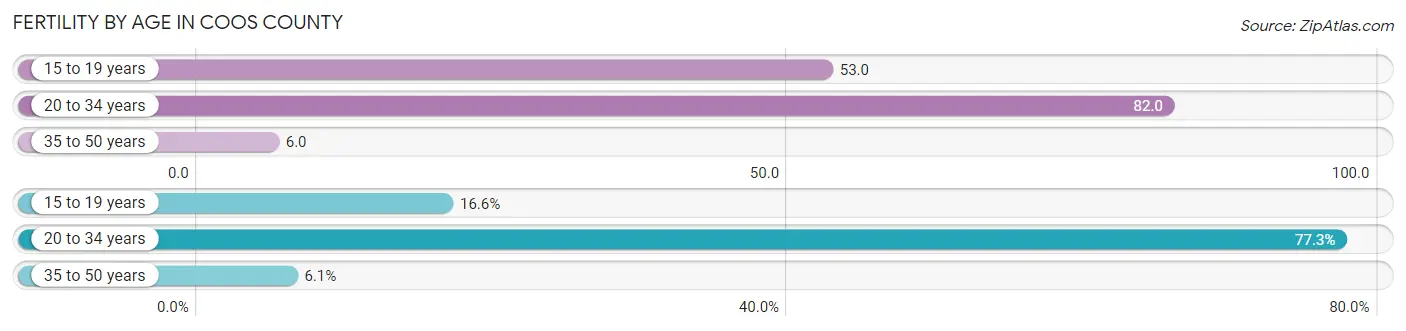
| Age Bracket | Women with Births | Births / 1,000 Women |
| 15 to 19 years | 85 (16.6%) | 53.0 |
| 20 to 34 years | 395 (77.3%) | 82.0 |
| 35 to 50 years | 31 (6.1%) | 6.0 |
| Total | 511 (100.0%) | 43.0 |
Fertility by Age by Marriage Status in Coos County
62.0% of women with births (511) in Coos County are married. The highest percentage of unmarried women with births falls into 15 to 19 years age bracket with 100.0% of them unmarried at the time of birth, while the lowest percentage of unmarried women with births belong to 20 to 34 years age bracket with 22.3% of them unmarried.
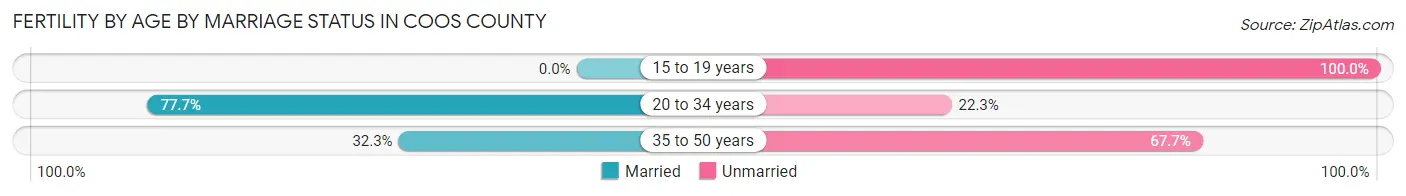
| Age Bracket | Married | Unmarried |
| 15 to 19 years | 0 (0.0%) | 85 (100.0%) |
| 20 to 34 years | 307 (77.7%) | 88 (22.3%) |
| 35 to 50 years | 10 (32.3%) | 21 (67.7%) |
| Total | 317 (62.0%) | 194 (38.0%) |
Fertility by Education in Coos County
Average fertility rate in Coos County is 43.0 births per 1,000 women. Women with the education attainment of less than high school have the highest fertility rate of 70.0 births per 1,000 women, while women with the education attainment of graduate degree have the lowest fertility at 6.0 births per 1,000 women. Women with the education attainment of college or associate's degree represent 39.1% of all women with births.
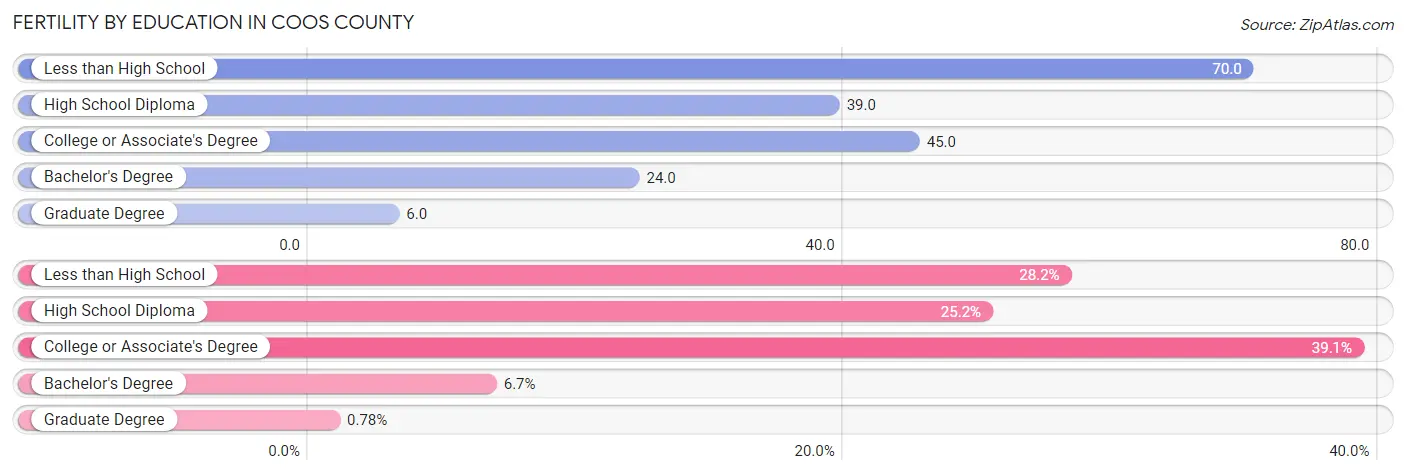
| Educational Attainment | Women with Births | Births / 1,000 Women |
| Less than High School | 144 (28.2%) | 70.0 |
| High School Diploma | 129 (25.2%) | 39.0 |
| College or Associate's Degree | 200 (39.1%) | 45.0 |
| Bachelor's Degree | 34 (6.7%) | 24.0 |
| Graduate Degree | 4 (0.8%) | 6.0 |
| Total | 511 (100.0%) | 43.0 |
Fertility by Education by Marriage Status in Coos County
38.0% of women with births in Coos County are unmarried. Women with the educational attainment of bachelor's degree are most likely to be married with 100.0% of them married at childbirth, while women with the educational attainment of less than high school are least likely to be married with 85.4% of them unmarried at childbirth.
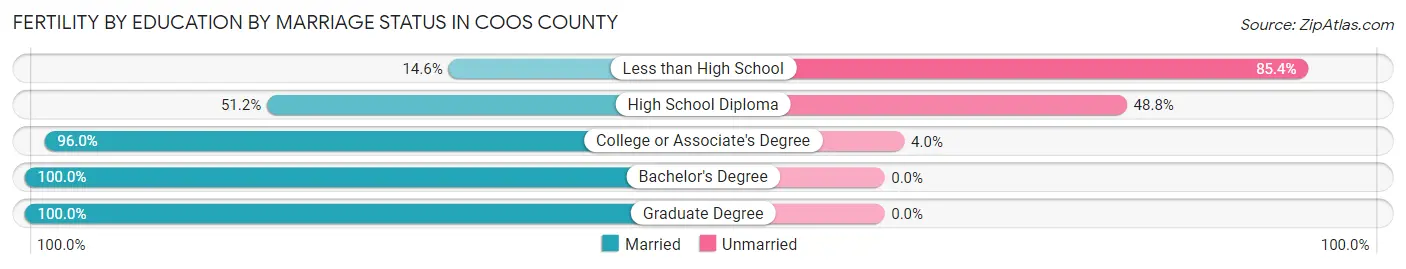
| Educational Attainment | Married | Unmarried |
| Less than High School | 21 (14.6%) | 123 (85.4%) |
| High School Diploma | 66 (51.2%) | 63 (48.8%) |
| College or Associate's Degree | 192 (96.0%) | 8 (4.0%) |
| Bachelor's Degree | 34 (100.0%) | 0 (0.0%) |
| Graduate Degree | 4 (100.0%) | 0 (0.0%) |
| Total | 317 (62.0%) | 194 (38.0%) |
Income in Coos County
Income Overview in Coos County
Per Capita Income in Coos County is $33,572, while median incomes of families and households are $73,947 and $57,563 respectively.
| Characteristic | Number | Measure |
| Per Capita Income | 64,908 | $33,572 |
| Median Family Income | 16,955 | $73,947 |
| Mean Family Income | 16,955 | $92,315 |
| Median Household Income | 28,075 | $57,563 |
| Mean Household Income | 28,075 | $76,312 |
| Income Deficit | 16,955 | $10,758 |
| Wage / Income Gap (%) | 64,908 | 33.95% |
| Wage / Income Gap ($) | 64,908 | 66.05¢ per $1 |
| Gini / Inequality Index | 64,908 | 0.45 |
Earnings by Sex in Coos County
Average Earnings in Coos County are $33,403, $41,627 for men and $27,496 for women, a difference of 34.0%.
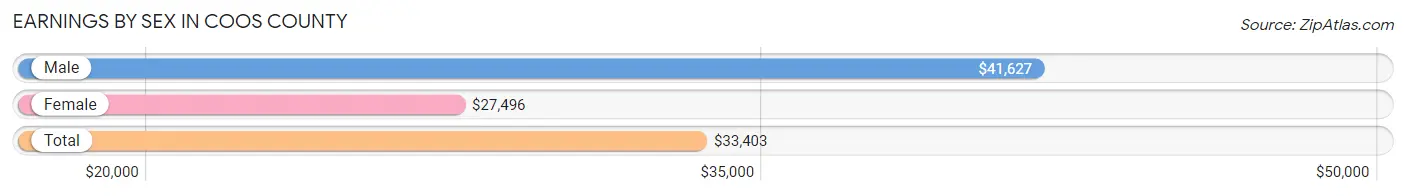
| Sex | Number | Average Earnings |
| Male | 14,975 (51.1%) | $41,627 |
| Female | 14,327 (48.9%) | $27,496 |
| Total | 29,302 (100.0%) | $33,403 |
Earnings by Sex by Income Bracket in Coos County
The most common earnings brackets in Coos County are $100,000+ for men (1,700 | 11.4%) and $25,000 to $29,999 for women (1,148 | 8.0%).
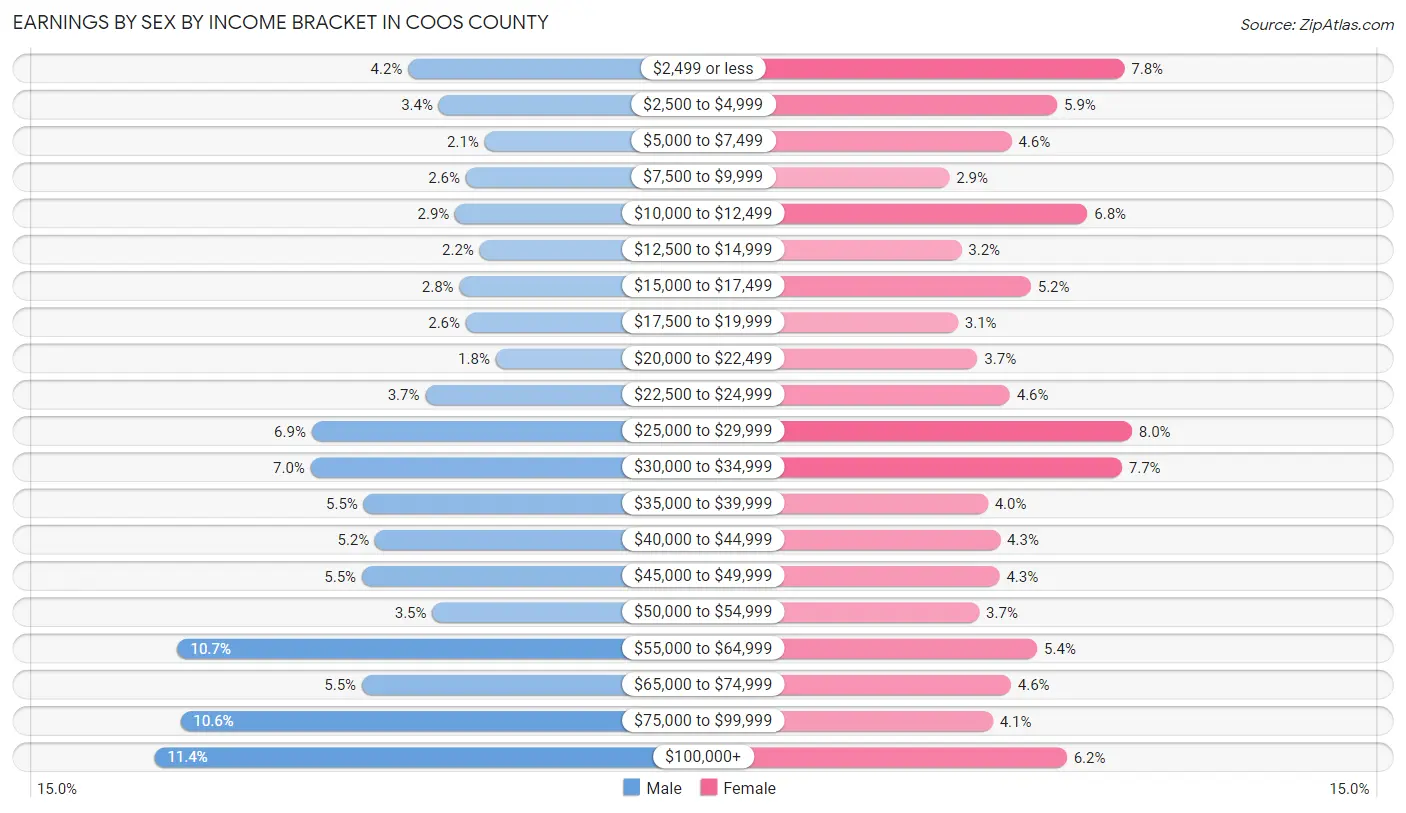
| Income | Male | Female |
| $2,499 or less | 632 (4.2%) | 1,118 (7.8%) |
| $2,500 to $4,999 | 503 (3.4%) | 847 (5.9%) |
| $5,000 to $7,499 | 310 (2.1%) | 663 (4.6%) |
| $7,500 to $9,999 | 389 (2.6%) | 412 (2.9%) |
| $10,000 to $12,499 | 434 (2.9%) | 969 (6.8%) |
| $12,500 to $14,999 | 331 (2.2%) | 461 (3.2%) |
| $15,000 to $17,499 | 417 (2.8%) | 740 (5.2%) |
| $17,500 to $19,999 | 389 (2.6%) | 447 (3.1%) |
| $20,000 to $22,499 | 263 (1.8%) | 526 (3.7%) |
| $22,500 to $24,999 | 560 (3.7%) | 656 (4.6%) |
| $25,000 to $29,999 | 1,038 (6.9%) | 1,148 (8.0%) |
| $30,000 to $34,999 | 1,042 (7.0%) | 1,107 (7.7%) |
| $35,000 to $39,999 | 819 (5.5%) | 568 (4.0%) |
| $40,000 to $44,999 | 771 (5.1%) | 618 (4.3%) |
| $45,000 to $49,999 | 827 (5.5%) | 615 (4.3%) |
| $50,000 to $54,999 | 530 (3.5%) | 533 (3.7%) |
| $55,000 to $64,999 | 1,603 (10.7%) | 766 (5.3%) |
| $65,000 to $74,999 | 826 (5.5%) | 660 (4.6%) |
| $75,000 to $99,999 | 1,591 (10.6%) | 588 (4.1%) |
| $100,000+ | 1,700 (11.4%) | 885 (6.2%) |
| Total | 14,975 (100.0%) | 14,327 (100.0%) |
Earnings by Sex by Educational Attainment in Coos County
Average earnings in Coos County are $47,853 for men and $29,720 for women, a difference of 37.9%. Men with an educational attainment of graduate degree enjoy the highest average annual earnings of $71,406, while those with less than high school education earn the least with $33,090. Women with an educational attainment of bachelor's degree earn the most with the average annual earnings of $58,666, while those with high school diploma education have the smallest earnings of $24,087.
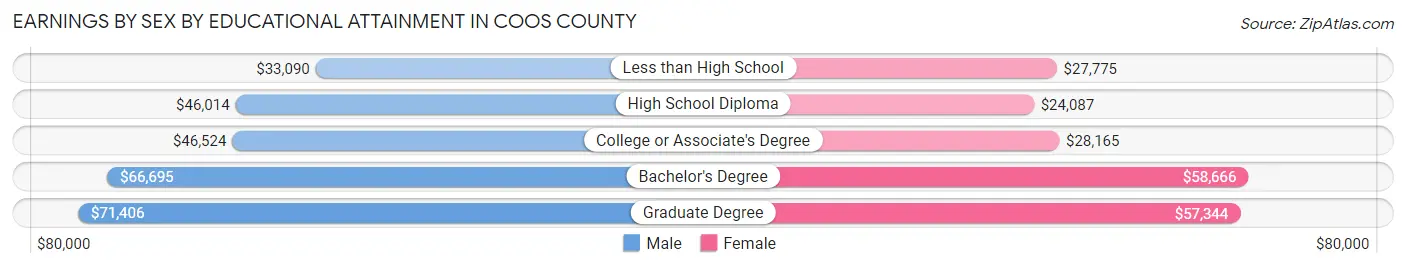
| Educational Attainment | Male Income | Female Income |
| Less than High School | $33,090 | $27,775 |
| High School Diploma | $46,014 | $24,087 |
| College or Associate's Degree | $46,524 | $28,165 |
| Bachelor's Degree | $66,695 | $58,666 |
| Graduate Degree | $71,406 | $57,344 |
| Total | $47,853 | $29,720 |
Family Income in Coos County
Family Income Brackets in Coos County
According to the Coos County family income data, there are 3,306 families falling into the $100,000 to $149,999 income range, which is the most common income bracket and makes up 19.5% of all families. Conversely, the $10,000 to $14,999 income bracket is the least frequent group with only 509 families (3.0%) belonging to this category.
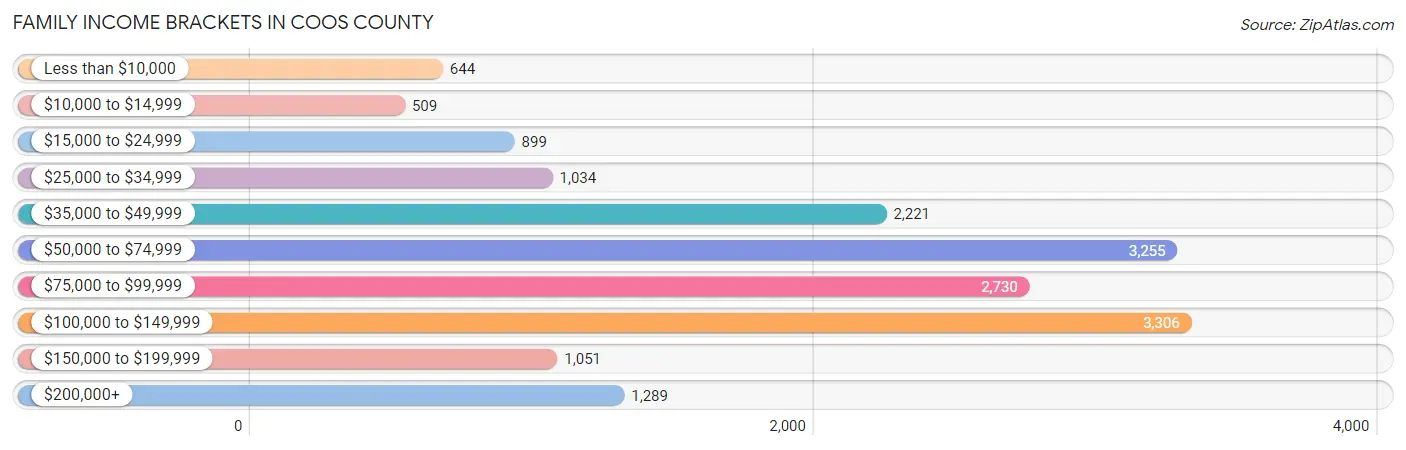
| Income Bracket | # Families | % Families |
| Less than $10,000 | 644 | 3.8% |
| $10,000 to $14,999 | 509 | 3.0% |
| $15,000 to $24,999 | 899 | 5.3% |
| $25,000 to $34,999 | 1,034 | 6.1% |
| $35,000 to $49,999 | 2,221 | 13.1% |
| $50,000 to $74,999 | 3,255 | 19.2% |
| $75,000 to $99,999 | 2,730 | 16.1% |
| $100,000 to $149,999 | 3,306 | 19.5% |
| $150,000 to $199,999 | 1,051 | 6.2% |
| $200,000+ | 1,289 | 7.6% |
Family Income by Famaliy Size in Coos County
4-person families (1,872 | 11.0%) account for the highest median family income in Coos County with $91,316 per family, while 2-person families (9,918 | 58.5%) have the highest median income of $34,757 per family member.
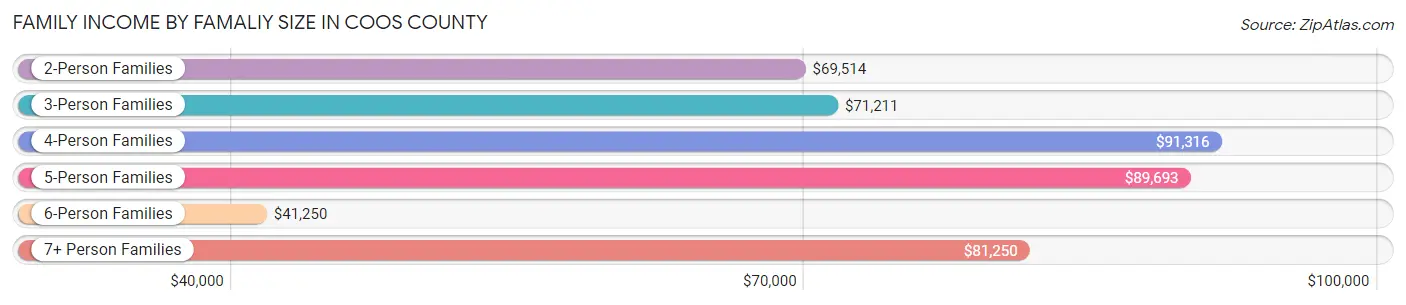
| Income Bracket | # Families | Median Income |
| 2-Person Families | 9,918 (58.5%) | $69,514 |
| 3-Person Families | 3,498 (20.6%) | $71,211 |
| 4-Person Families | 1,872 (11.0%) | $91,316 |
| 5-Person Families | 1,017 (6.0%) | $89,693 |
| 6-Person Families | 400 (2.4%) | $41,250 |
| 7+ Person Families | 250 (1.5%) | $81,250 |
| Total | 16,955 (100.0%) | $73,947 |
Family Income by Number of Earners in Coos County
The median family income in Coos County is $73,947, with families comprising 3+ earners (1,362) having the highest median family income of $121,846, while families with no earners (4,591) have the lowest median family income of $51,602, accounting for 8.0% and 27.1% of families, respectively.
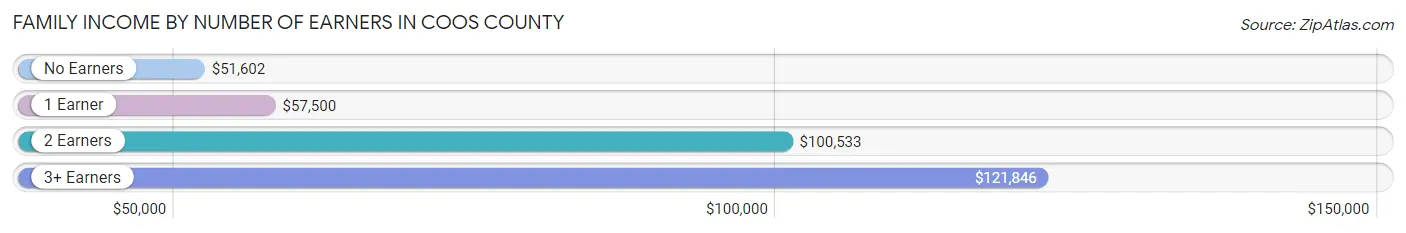
| Number of Earners | # Families | Median Income |
| No Earners | 4,591 (27.1%) | $51,602 |
| 1 Earner | 5,490 (32.4%) | $57,500 |
| 2 Earners | 5,512 (32.5%) | $100,533 |
| 3+ Earners | 1,362 (8.0%) | $121,846 |
| Total | 16,955 (100.0%) | $73,947 |
Household Income in Coos County
Household Income Brackets in Coos County
With 5,166 households falling in the category, the $50,000 to $74,999 income range is the most frequent in Coos County, accounting for 18.4% of all households. In contrast, only 1,235 households (4.4%) fall into the $150,000 to $199,999 income bracket, making it the least populous group.
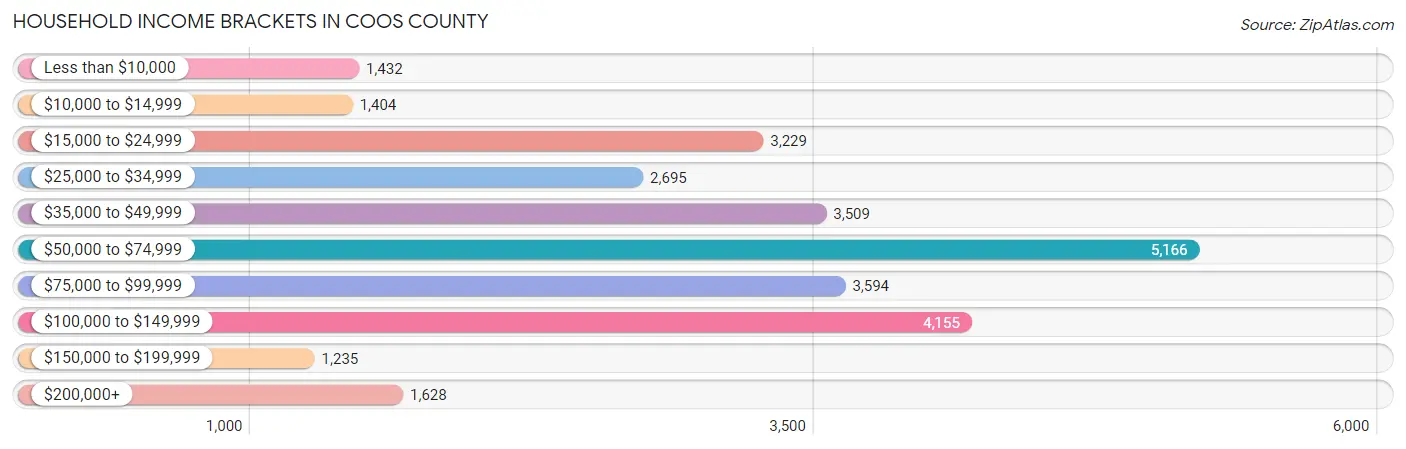
| Income Bracket | # Households | % Households |
| Less than $10,000 | 1,432 | 5.1% |
| $10,000 to $14,999 | 1,404 | 5.0% |
| $15,000 to $24,999 | 3,229 | 11.5% |
| $25,000 to $34,999 | 2,695 | 9.6% |
| $35,000 to $49,999 | 3,509 | 12.5% |
| $50,000 to $74,999 | 5,166 | 18.4% |
| $75,000 to $99,999 | 3,594 | 12.8% |
| $100,000 to $149,999 | 4,155 | 14.8% |
| $150,000 to $199,999 | 1,235 | 4.4% |
| $200,000+ | 1,628 | 5.8% |
Household Income by Householder Age in Coos County
The median household income in Coos County is $57,563, with the highest median household income of $66,875 found in the 45 to 64 years age bracket for the primary householder. A total of 9,496 households (33.8%) fall into this category. Meanwhile, the 15 to 24 years age bracket for the primary householder has the lowest median household income of $46,435, with 899 households (3.2%) in this group.
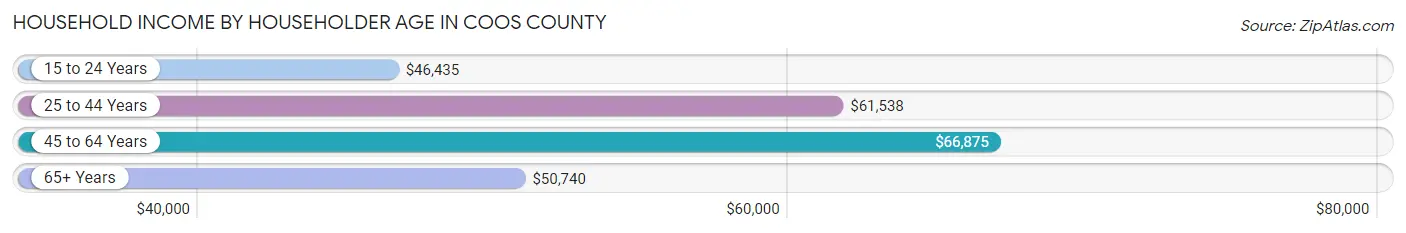
| Income Bracket | # Households | Median Income |
| 15 to 24 Years | 899 (3.2%) | $46,435 |
| 25 to 44 Years | 6,527 (23.3%) | $61,538 |
| 45 to 64 Years | 9,496 (33.8%) | $66,875 |
| 65+ Years | 11,153 (39.7%) | $50,740 |
| Total | 28,075 (100.0%) | $57,563 |
Poverty in Coos County
Income Below Poverty by Sex and Age in Coos County
With 14.1% poverty level for males and 18.1% for females among the residents of Coos County, 5 year old males and 5 year old females are the most vulnerable to poverty, with 108 males (31.4%) and 40 females (54.0%) in their respective age groups living below the poverty level.
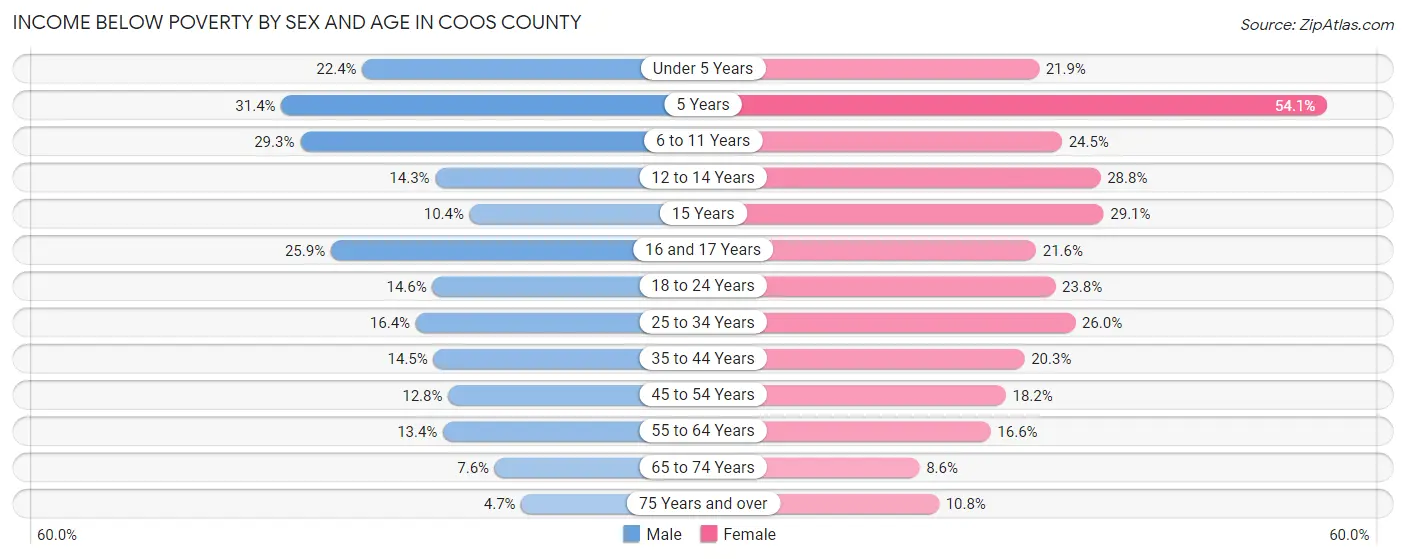
| Age Bracket | Male | Female |
| Under 5 Years | 316 (22.4%) | 327 (21.9%) |
| 5 Years | 108 (31.4%) | 40 (54.0%) |
| 6 to 11 Years | 653 (29.3%) | 480 (24.5%) |
| 12 to 14 Years | 109 (14.2%) | 331 (28.8%) |
| 15 Years | 37 (10.4%) | 90 (29.1%) |
| 16 and 17 Years | 177 (25.9%) | 134 (21.6%) |
| 18 to 24 Years | 294 (14.6%) | 484 (23.7%) |
| 25 to 34 Years | 577 (16.4%) | 861 (26.0%) |
| 35 to 44 Years | 540 (14.4%) | 728 (20.3%) |
| 45 to 54 Years | 441 (12.8%) | 634 (18.2%) |
| 55 to 64 Years | 654 (13.4%) | 880 (16.6%) |
| 65 to 74 Years | 387 (7.6%) | 457 (8.6%) |
| 75 Years and over | 146 (4.7%) | 390 (10.8%) |
| Total | 4,439 (14.1%) | 5,836 (18.1%) |
Income Above Poverty by Sex and Age in Coos County
According to the poverty statistics in Coos County, males aged 75 years and over and females aged 65 to 74 years are the age groups that are most secure financially, with 95.3% of males and 91.4% of females in these age groups living above the poverty line.
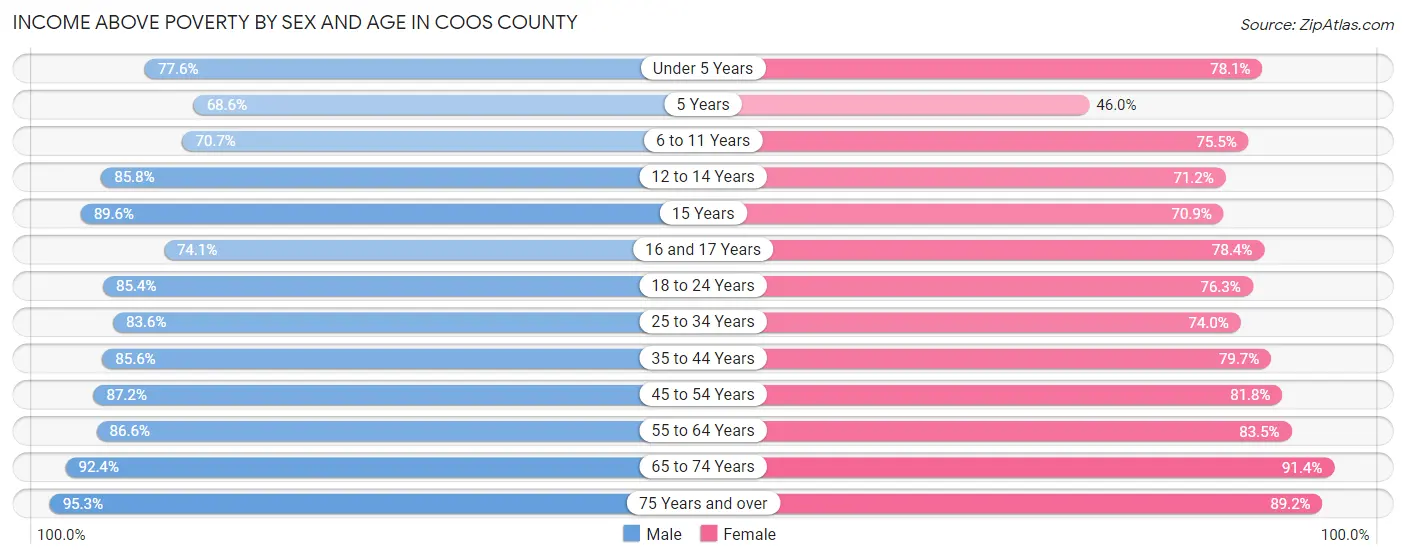
| Age Bracket | Male | Female |
| Under 5 Years | 1,096 (77.6%) | 1,164 (78.1%) |
| 5 Years | 236 (68.6%) | 34 (46.0%) |
| 6 to 11 Years | 1,576 (70.7%) | 1,480 (75.5%) |
| 12 to 14 Years | 656 (85.8%) | 819 (71.2%) |
| 15 Years | 318 (89.6%) | 219 (70.9%) |
| 16 and 17 Years | 507 (74.1%) | 486 (78.4%) |
| 18 to 24 Years | 1,724 (85.4%) | 1,554 (76.2%) |
| 25 to 34 Years | 2,938 (83.6%) | 2,454 (74.0%) |
| 35 to 44 Years | 3,198 (85.6%) | 2,855 (79.7%) |
| 45 to 54 Years | 3,002 (87.2%) | 2,842 (81.8%) |
| 55 to 64 Years | 4,234 (86.6%) | 4,438 (83.5%) |
| 65 to 74 Years | 4,693 (92.4%) | 4,844 (91.4%) |
| 75 Years and over | 2,983 (95.3%) | 3,223 (89.2%) |
| Total | 27,161 (86.0%) | 26,412 (81.9%) |
Income Below Poverty Among Married-Couple Families in Coos County
The poverty statistics for married-couple families in Coos County show that 5.4% or 683 of the total 12,598 families live below the poverty line. Families with 3 or 4 children have the highest poverty rate of 24.9%, comprising of 151 families. On the other hand, families with 5 or more children have the lowest poverty rate of 0.0%, which includes 0 families.
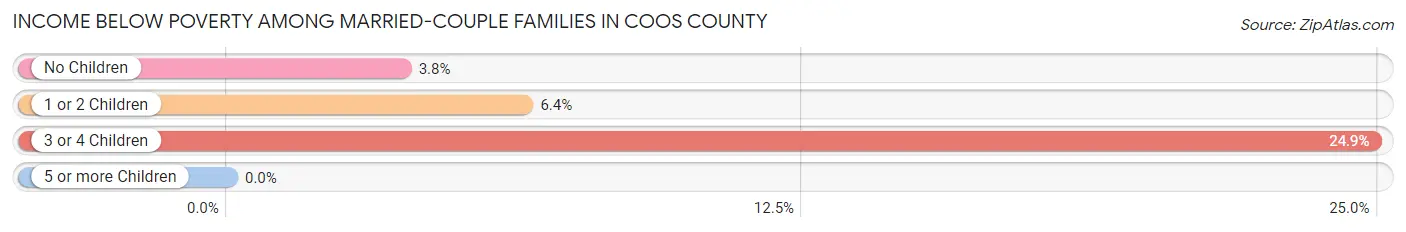
| Children | Above Poverty | Below Poverty |
| No Children | 8,601 (96.2%) | 338 (3.8%) |
| 1 or 2 Children | 2,821 (93.6%) | 194 (6.4%) |
| 3 or 4 Children | 456 (75.1%) | 151 (24.9%) |
| 5 or more Children | 37 (100.0%) | 0 (0.0%) |
| Total | 11,915 (94.6%) | 683 (5.4%) |
Income Below Poverty Among Single-Parent Households in Coos County
According to the poverty data in Coos County, 19.9% or 262 single-father households and 29.8% or 906 single-mother households are living below the poverty line. Among single-father households, those with 5 or more children have the highest poverty rate, with 35 households (100.0%) experiencing poverty. Likewise, among single-mother households, those with 5 or more children have the highest poverty rate, with 91 households (100.0%) falling below the poverty line.
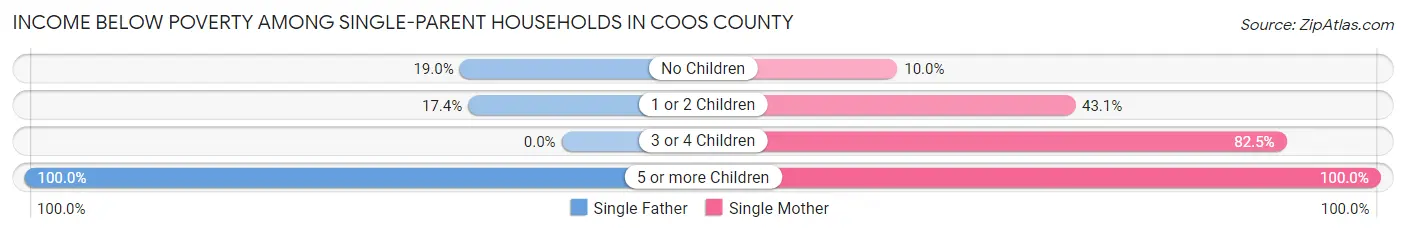
| Children | Single Father | Single Mother |
| No Children | 99 (19.0%) | 144 (10.0%) |
| 1 or 2 Children | 128 (17.4%) | 624 (43.1%) |
| 3 or 4 Children | 0 (0.0%) | 47 (82.5%) |
| 5 or more Children | 35 (100.0%) | 91 (100.0%) |
| Total | 262 (19.9%) | 906 (29.8%) |
Income Below Poverty Among Married-Couple vs Single-Parent Households in Coos County
The poverty data for Coos County shows that 683 of the married-couple family households (5.4%) and 1,168 of the single-parent households (26.8%) are living below the poverty level. Within the married-couple family households, those with 3 or 4 children have the highest poverty rate, with 151 households (24.9%) falling below the poverty line. Among the single-parent households, those with 5 or more children have the highest poverty rate, with 126 household (100.0%) living below poverty.
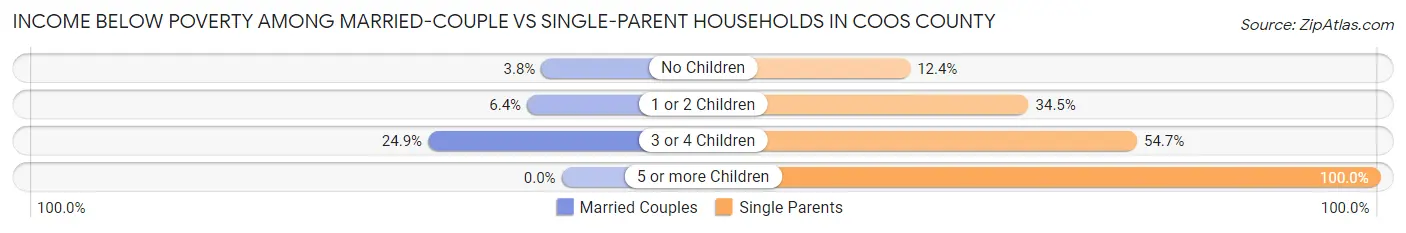
| Children | Married-Couple Families | Single-Parent Households |
| No Children | 338 (3.8%) | 243 (12.4%) |
| 1 or 2 Children | 194 (6.4%) | 752 (34.4%) |
| 3 or 4 Children | 151 (24.9%) | 47 (54.6%) |
| 5 or more Children | 0 (0.0%) | 126 (100.0%) |
| Total | 683 (5.4%) | 1,168 (26.8%) |
Employment Characteristics in Coos County
Employment by Class of Employer in Coos County
Among the 25,253 employed individuals in Coos County, private company employees (15,280 | 60.5%), self-employed (not incorporated) (2,375 | 9.4%), and not-for-profit organizations (2,159 | 8.6%) make up the most common classes of employment.
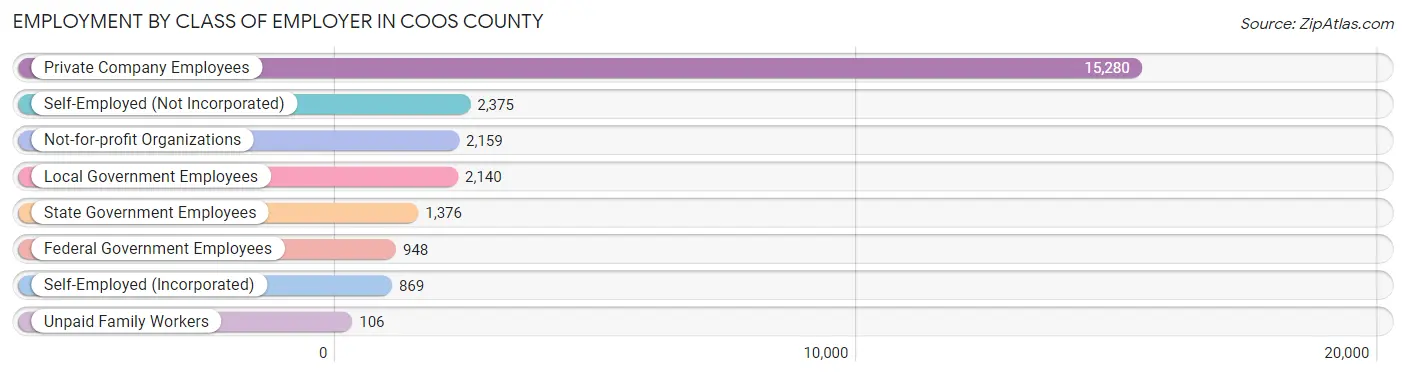
| Employer Class | # Employees | % Employees |
| Private Company Employees | 15,280 | 60.5% |
| Self-Employed (Incorporated) | 869 | 3.4% |
| Self-Employed (Not Incorporated) | 2,375 | 9.4% |
| Not-for-profit Organizations | 2,159 | 8.6% |
| Local Government Employees | 2,140 | 8.5% |
| State Government Employees | 1,376 | 5.4% |
| Federal Government Employees | 948 | 3.7% |
| Unpaid Family Workers | 106 | 0.4% |
| Total | 25,253 | 100.0% |
Employment Status by Age in Coos County
According to the labor force statistics for Coos County, out of the total population over 16 years of age (54,521), 50.8% or 27,697 individuals are in the labor force, with 5.8% or 1,606 of them unemployed. The age group with the highest labor force participation rate is 20 to 24 years, with 78.4% or 2,331 individuals in the labor force. Within the labor force, the 75 years and over age range has the highest percentage of unemployed individuals, with 37.1% or 128 of them being unemployed.
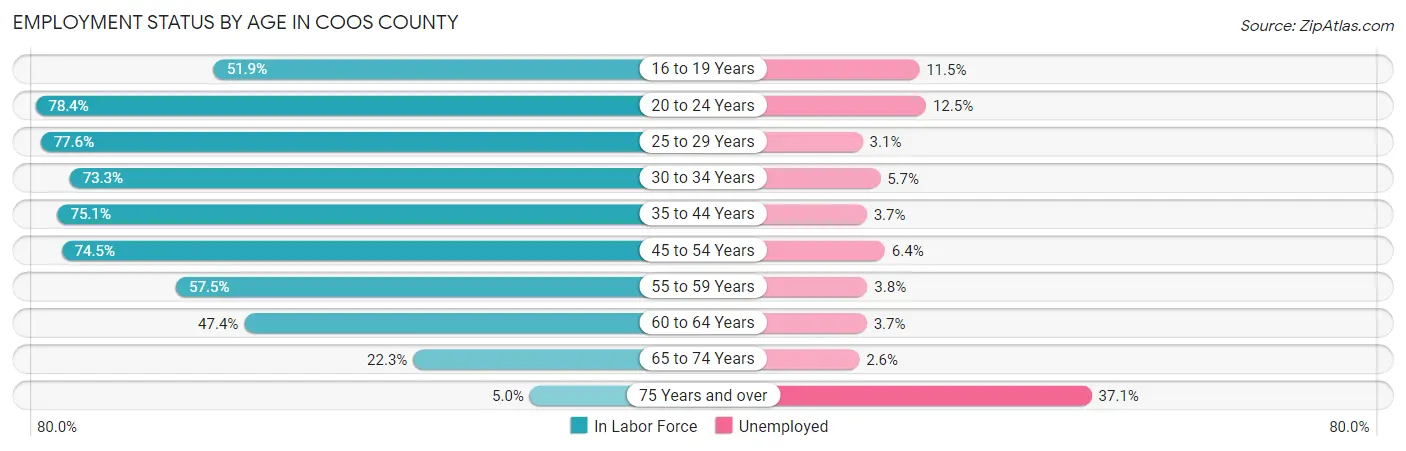
| Age Bracket | In Labor Force | Unemployed |
| 16 to 19 Years | 1,351 (51.9%) | 155 (11.5%) |
| 20 to 24 Years | 2,331 (78.4%) | 291 (12.5%) |
| 25 to 29 Years | 2,640 (77.6%) | 82 (3.1%) |
| 30 to 34 Years | 2,576 (73.3%) | 147 (5.7%) |
| 35 to 44 Years | 5,586 (75.1%) | 207 (3.7%) |
| 45 to 54 Years | 5,187 (74.5%) | 332 (6.4%) |
| 55 to 59 Years | 2,799 (57.5%) | 106 (3.8%) |
| 60 to 64 Years | 2,546 (47.4%) | 94 (3.7%) |
| 65 to 74 Years | 2,336 (22.3%) | 61 (2.6%) |
| 75 Years and over | 346 (5.0%) | 128 (37.1%) |
| Total | 27,697 (50.8%) | 1,606 (5.8%) |
Employment Status by Educational Attainment in Coos County
According to labor force statistics for Coos County, 67.6% of individuals (21,331) out of the total population between 25 and 64 years of age (31,554) are in the labor force, with 4.5% or 960 of them being unemployed. The group with the highest labor force participation rate are those with the educational attainment of bachelor's degree or higher, with 79.2% or 4,435 individuals in the labor force. Within the labor force, individuals with less than high school education have the highest percentage of unemployment, with 7.0% or 124 of them being unemployed.
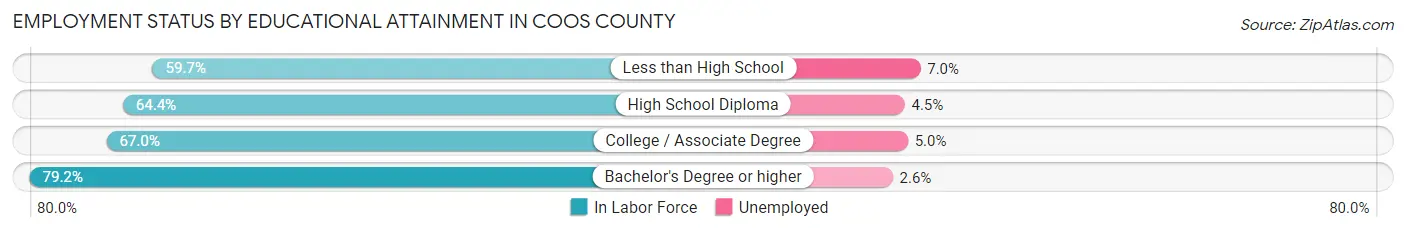
| Educational Attainment | In Labor Force | Unemployed |
| Less than High School | 1,770 (59.7%) | 207 (7.0%) |
| High School Diploma | 6,848 (64.4%) | 479 (4.5%) |
| College / Associate Degree | 8,279 (67.0%) | 618 (5.0%) |
| Bachelor's Degree or higher | 4,435 (79.2%) | 146 (2.6%) |
| Total | 21,331 (67.6%) | 1,420 (4.5%) |
Employment Occupations by Sex in Coos County
Management, Business, Science and Arts Occupations
The most common Management, Business, Science and Arts occupations in Coos County are Community & Social Service (3,313 | 12.8%), Management (2,064 | 8.0%), Education Instruction & Library (1,611 | 6.2%), Health Diagnosing & Treating (1,130 | 4.3%), and Education, Arts & Media (978 | 3.8%).
Management, Business, Science and Arts Occupations by Sex
Within the Management, Business, Science and Arts occupations in Coos County, the most male-oriented occupations are Computers & Mathematics (86.1%), Architecture & Engineering (75.9%), and Computers, Engineering & Science (67.4%), while the most female-oriented occupations are Health Diagnosing & Treating (82.1%), Education, Arts & Media (80.5%), and Health Technologists (79.7%).
| Occupation | Male | Female |
| Management | 1,179 (57.1%) | 885 (42.9%) |
| Business & Financial | 288 (56.6%) | 221 (43.4%) |
| Computers, Engineering & Science | 482 (67.4%) | 233 (32.6%) |
| Computers & Mathematics | 136 (86.1%) | 22 (13.9%) |
| Architecture & Engineering | 186 (75.9%) | 59 (24.1%) |
| Life, Physical & Social Science | 160 (51.3%) | 152 (48.7%) |
| Community & Social Service | 877 (26.5%) | 2,436 (73.5%) |
| Education, Arts & Media | 191 (19.5%) | 787 (80.5%) |
| Legal Services & Support | 73 (42.4%) | 99 (57.6%) |
| Education Instruction & Library | 366 (22.7%) | 1,245 (77.3%) |
| Arts, Media & Entertainment | 247 (44.8%) | 305 (55.2%) |
| Health Diagnosing & Treating | 202 (17.9%) | 928 (82.1%) |
| Health Technologists | 142 (20.3%) | 559 (79.7%) |
| Total (Category) | 3,028 (39.2%) | 4,703 (60.8%) |
| Total (Overall) | 13,434 (51.7%) | 12,526 (48.2%) |
Services Occupations
The most common Services occupations in Coos County are Food Preparation & Serving (2,278 | 8.8%), Healthcare Support (1,619 | 6.2%), Cleaning & Maintenance (1,132 | 4.4%), Personal Care & Service (1,083 | 4.2%), and Security & Protection (744 | 2.9%).
Services Occupations by Sex
Within the Services occupations in Coos County, the most male-oriented occupations are Law Enforcement (96.3%), Security & Protection (95.2%), and Firefighting & Prevention (94.6%), while the most female-oriented occupations are Healthcare Support (77.4%), Personal Care & Service (66.2%), and Food Preparation & Serving (57.2%).
| Occupation | Male | Female |
| Healthcare Support | 366 (22.6%) | 1,253 (77.4%) |
| Security & Protection | 708 (95.2%) | 36 (4.8%) |
| Firefighting & Prevention | 471 (94.6%) | 27 (5.4%) |
| Law Enforcement | 237 (96.3%) | 9 (3.7%) |
| Food Preparation & Serving | 974 (42.8%) | 1,304 (57.2%) |
| Cleaning & Maintenance | 577 (51.0%) | 555 (49.0%) |
| Personal Care & Service | 366 (33.8%) | 717 (66.2%) |
| Total (Category) | 2,991 (43.6%) | 3,865 (56.4%) |
| Total (Overall) | 13,434 (51.7%) | 12,526 (48.2%) |
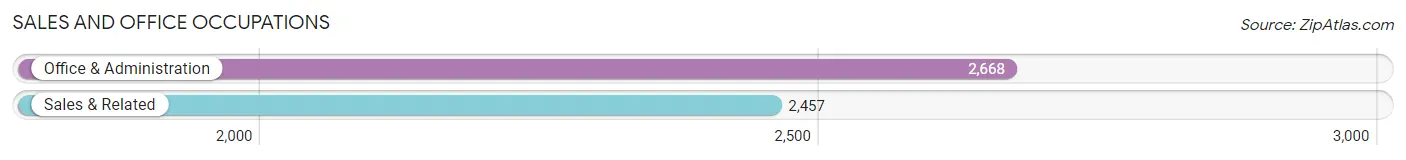
Sales and Office Occupations
The most common Sales and Office occupations in Coos County are Office & Administration (2,668 | 10.3%), and Sales & Related (2,457 | 9.5%).
Sales and Office Occupations by Sex
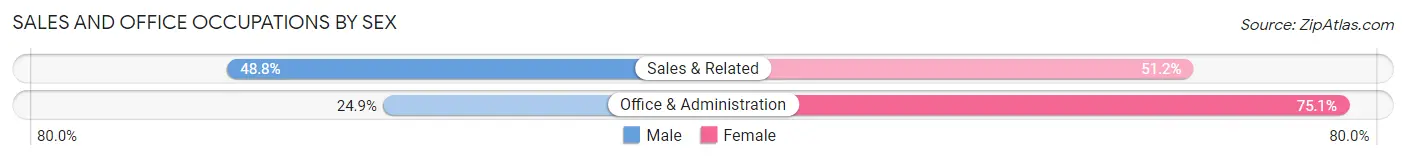
| Occupation | Male | Female |
| Sales & Related | 1,199 (48.8%) | 1,258 (51.2%) |
| Office & Administration | 664 (24.9%) | 2,004 (75.1%) |
| Total (Category) | 1,863 (36.3%) | 3,262 (63.6%) |
| Total (Overall) | 13,434 (51.7%) | 12,526 (48.2%) |
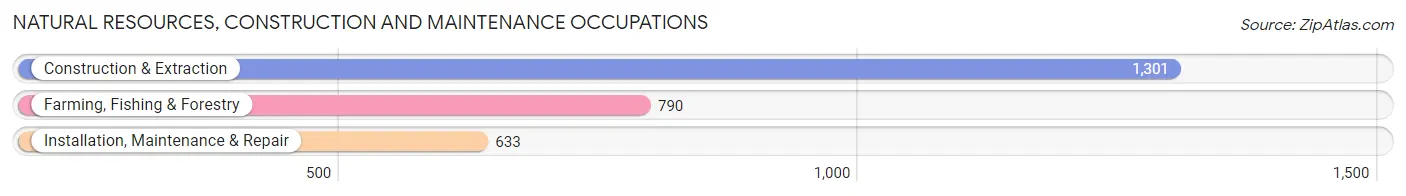
Natural Resources, Construction and Maintenance Occupations
The most common Natural Resources, Construction and Maintenance occupations in Coos County are Construction & Extraction (1,301 | 5.0%), Farming, Fishing & Forestry (790 | 3.0%), and Installation, Maintenance & Repair (633 | 2.4%).
Natural Resources, Construction and Maintenance Occupations by Sex
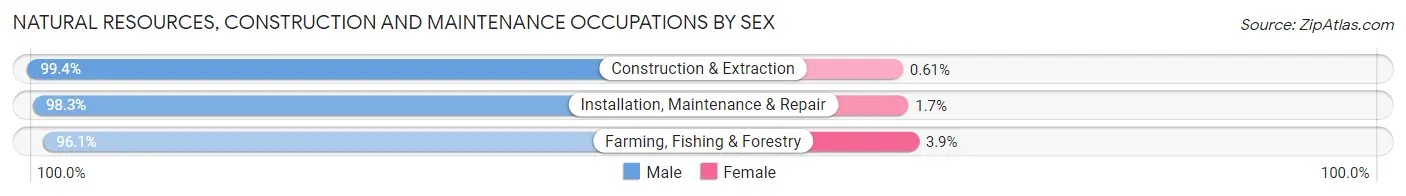
| Occupation | Male | Female |
| Farming, Fishing & Forestry | 759 (96.1%) | 31 (3.9%) |
| Construction & Extraction | 1,293 (99.4%) | 8 (0.6%) |
| Installation, Maintenance & Repair | 622 (98.3%) | 11 (1.7%) |
| Total (Category) | 2,674 (98.2%) | 50 (1.8%) |
| Total (Overall) | 13,434 (51.7%) | 12,526 (48.2%) |
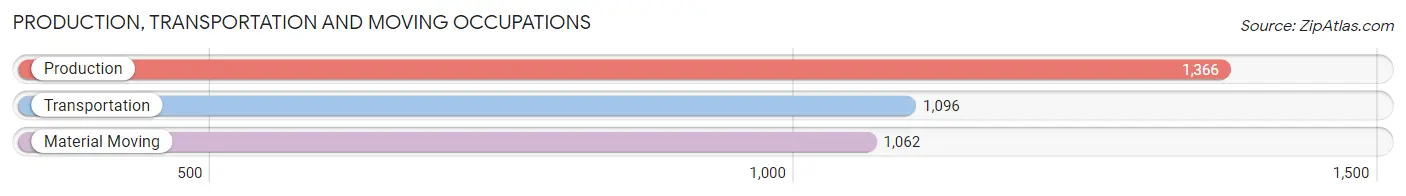
Production, Transportation and Moving Occupations
The most common Production, Transportation and Moving occupations in Coos County are Production (1,366 | 5.3%), Transportation (1,096 | 4.2%), and Material Moving (1,062 | 4.1%).
Production, Transportation and Moving Occupations by Sex
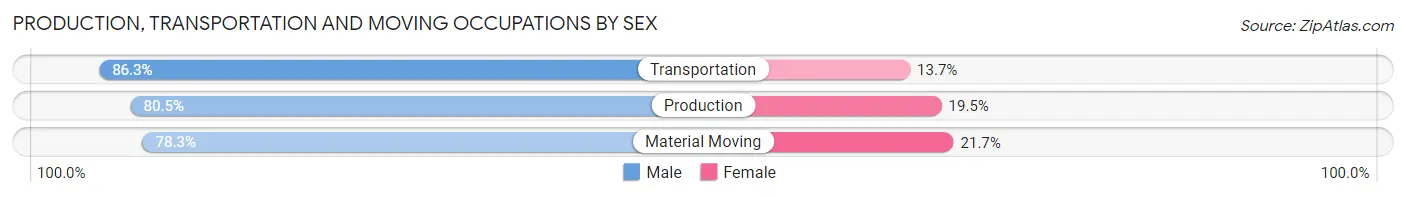
| Occupation | Male | Female |
| Production | 1,100 (80.5%) | 266 (19.5%) |
| Transportation | 946 (86.3%) | 150 (13.7%) |
| Material Moving | 832 (78.3%) | 230 (21.7%) |
| Total (Category) | 2,878 (81.7%) | 646 (18.3%) |
| Total (Overall) | 13,434 (51.7%) | 12,526 (48.2%) |
Employment Industries by Sex in Coos County
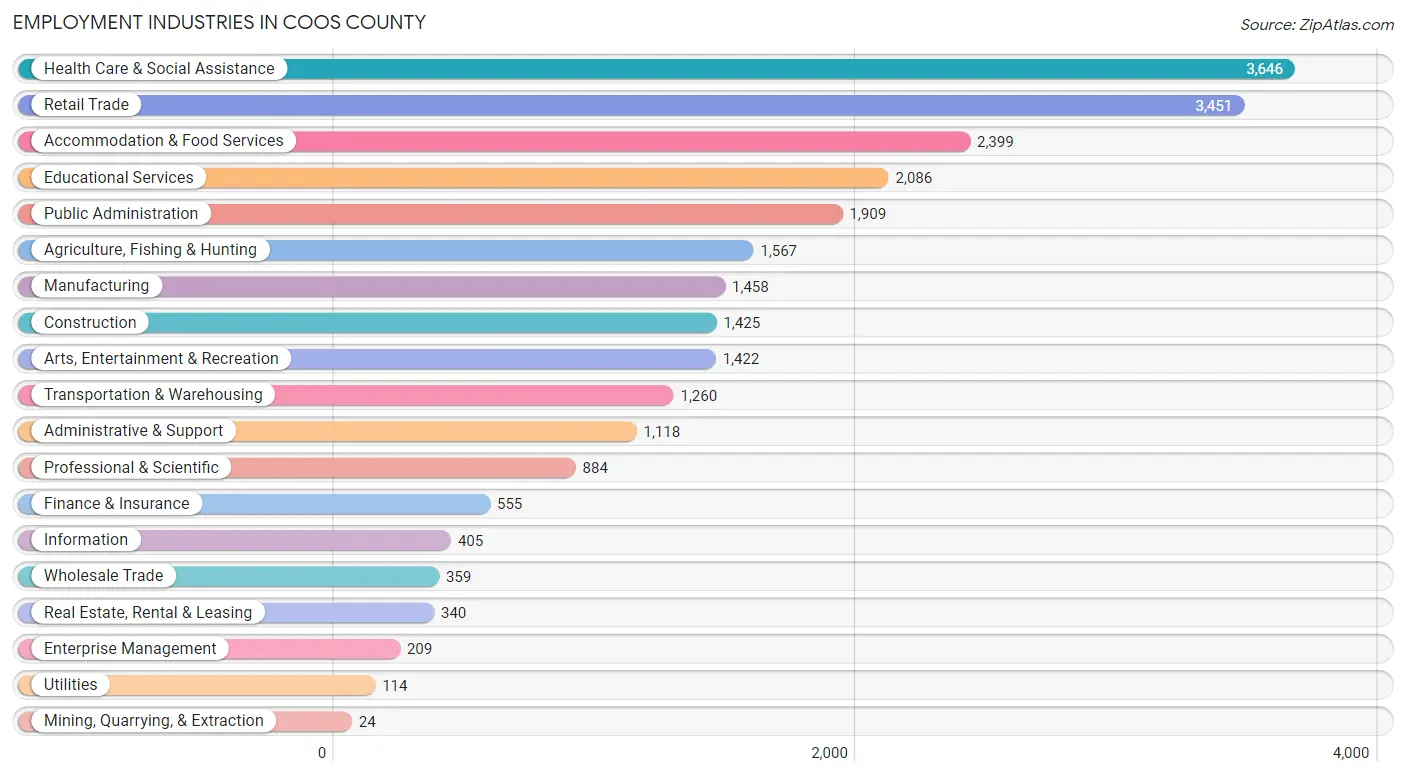
Employment Industries in Coos County
The major employment industries in Coos County include Health Care & Social Assistance (3,646 | 14.0%), Retail Trade (3,451 | 13.3%), Accommodation & Food Services (2,399 | 9.2%), Educational Services (2,086 | 8.0%), and Public Administration (1,909 | 7.3%).
Employment Industries by Sex in Coos County
The Coos County industries that see more men than women are Construction (92.0%), Agriculture, Fishing & Hunting (91.8%), and Wholesale Trade (80.5%), whereas the industries that tend to have a higher number of women are Enterprise Management (100.0%), Finance & Insurance (80.9%), and Health Care & Social Assistance (76.4%).
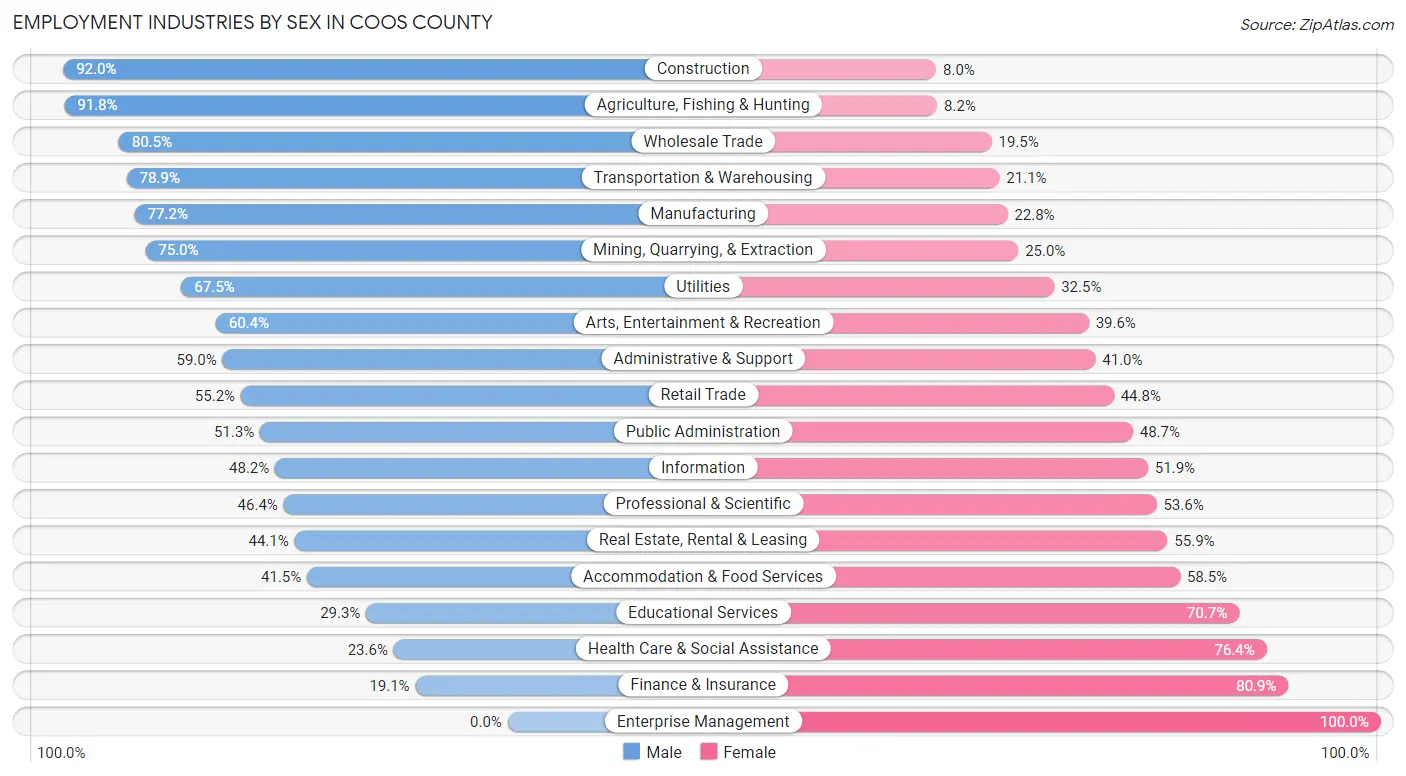
| Industry | Male | Female |
| Agriculture, Fishing & Hunting | 1,438 (91.8%) | 129 (8.2%) |
| Mining, Quarrying, & Extraction | 18 (75.0%) | 6 (25.0%) |
| Construction | 1,311 (92.0%) | 114 (8.0%) |
| Manufacturing | 1,126 (77.2%) | 332 (22.8%) |
| Wholesale Trade | 289 (80.5%) | 70 (19.5%) |
| Retail Trade | 1,906 (55.2%) | 1,545 (44.8%) |
| Transportation & Warehousing | 994 (78.9%) | 266 (21.1%) |
| Utilities | 77 (67.5%) | 37 (32.5%) |
| Information | 195 (48.1%) | 210 (51.8%) |
| Finance & Insurance | 106 (19.1%) | 449 (80.9%) |
| Real Estate, Rental & Leasing | 150 (44.1%) | 190 (55.9%) |
| Professional & Scientific | 410 (46.4%) | 474 (53.6%) |
| Enterprise Management | 0 (0.0%) | 209 (100.0%) |
| Administrative & Support | 660 (59.0%) | 458 (41.0%) |
| Educational Services | 611 (29.3%) | 1,475 (70.7%) |
| Health Care & Social Assistance | 860 (23.6%) | 2,786 (76.4%) |
| Arts, Entertainment & Recreation | 859 (60.4%) | 563 (39.6%) |
| Accommodation & Food Services | 996 (41.5%) | 1,403 (58.5%) |
| Public Administration | 979 (51.3%) | 930 (48.7%) |
| Total | 13,434 (51.7%) | 12,526 (48.2%) |
Education in Coos County
School Enrollment in Coos County
The most common levels of schooling among the 11,202 students in Coos County are middle school (3,013 | 26.9%), elementary school (2,654 | 23.7%), and high school (2,586 | 23.1%).
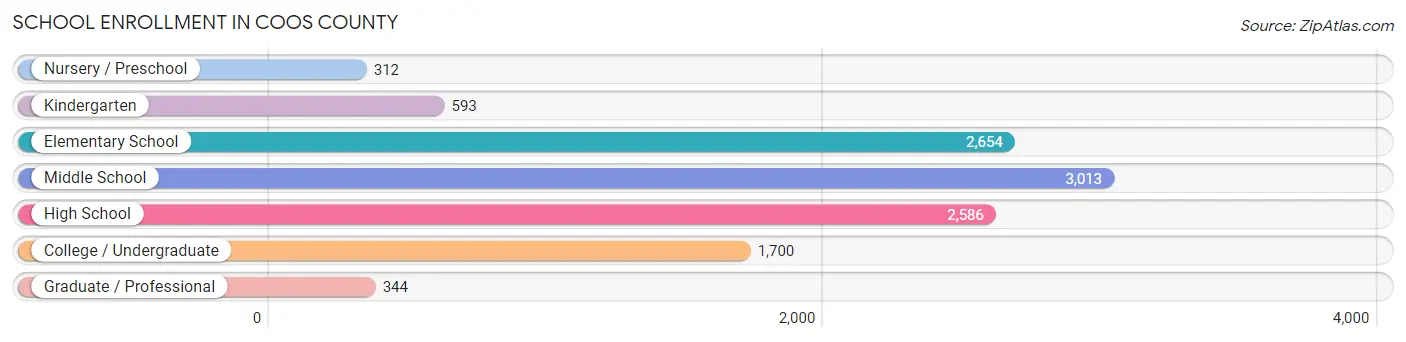
| School Level | # Students | % Students |
| Nursery / Preschool | 312 | 2.8% |
| Kindergarten | 593 | 5.3% |
| Elementary School | 2,654 | 23.7% |
| Middle School | 3,013 | 26.9% |
| High School | 2,586 | 23.1% |
| College / Undergraduate | 1,700 | 15.2% |
| Graduate / Professional | 344 | 3.1% |
| Total | 11,202 | 100.0% |
School Enrollment by Age by Funding Source in Coos County
Out of a total of 11,202 students who are enrolled in schools in Coos County, 1,120 (10.0%) attend a private institution, while the remaining 10,082 (90.0%) are enrolled in public schools. The age group of 35 years and over has the highest likelihood of being enrolled in private schools, with 139 (22.0% in the age bracket) enrolled. Conversely, the age group of 10 to 14 year olds has the lowest likelihood of being enrolled in a private school, with 3,307 (95.2% in the age bracket) attending a public institution.
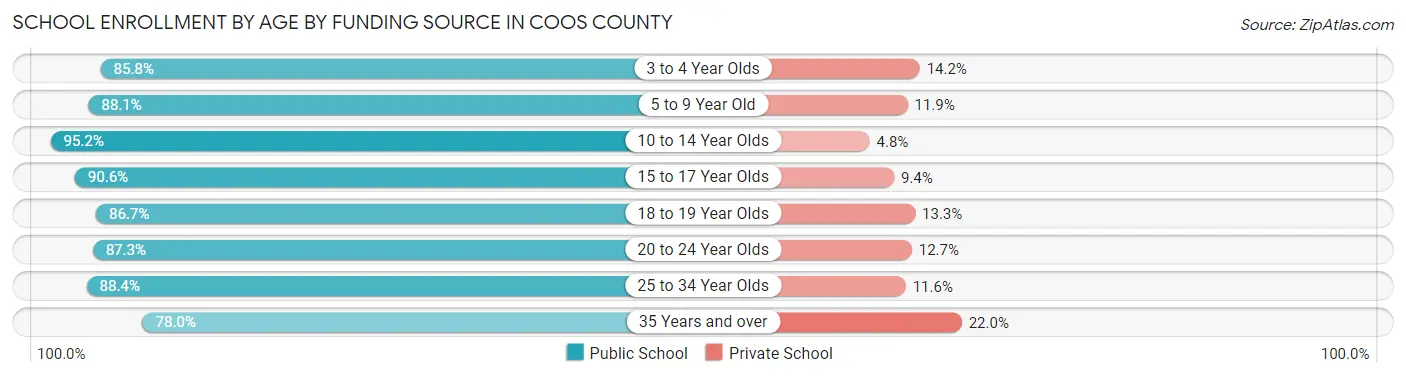
| Age Bracket | Public School | Private School |
| 3 to 4 Year Olds | 194 (85.8%) | 32 (14.2%) |
| 5 to 9 Year Old | 2,741 (88.1%) | 370 (11.9%) |
| 10 to 14 Year Olds | 3,307 (95.2%) | 168 (4.8%) |
| 15 to 17 Year Olds | 1,710 (90.6%) | 177 (9.4%) |
| 18 to 19 Year Olds | 710 (86.7%) | 109 (13.3%) |
| 20 to 24 Year Olds | 571 (87.3%) | 83 (12.7%) |
| 25 to 34 Year Olds | 352 (88.4%) | 46 (11.6%) |
| 35 Years and over | 493 (78.0%) | 139 (22.0%) |
| Total | 10,082 (90.0%) | 1,120 (10.0%) |
Educational Attainment by Field of Study in Coos County
Education (1,506 | 13.8%), science & technology (1,283 | 11.7%), business (1,209 | 11.1%), bio, nature & agricultural (1,110 | 10.2%), and social sciences (1,006 | 9.2%) are the most common fields of study among 10,936 individuals in Coos County who have obtained a bachelor's degree or higher.
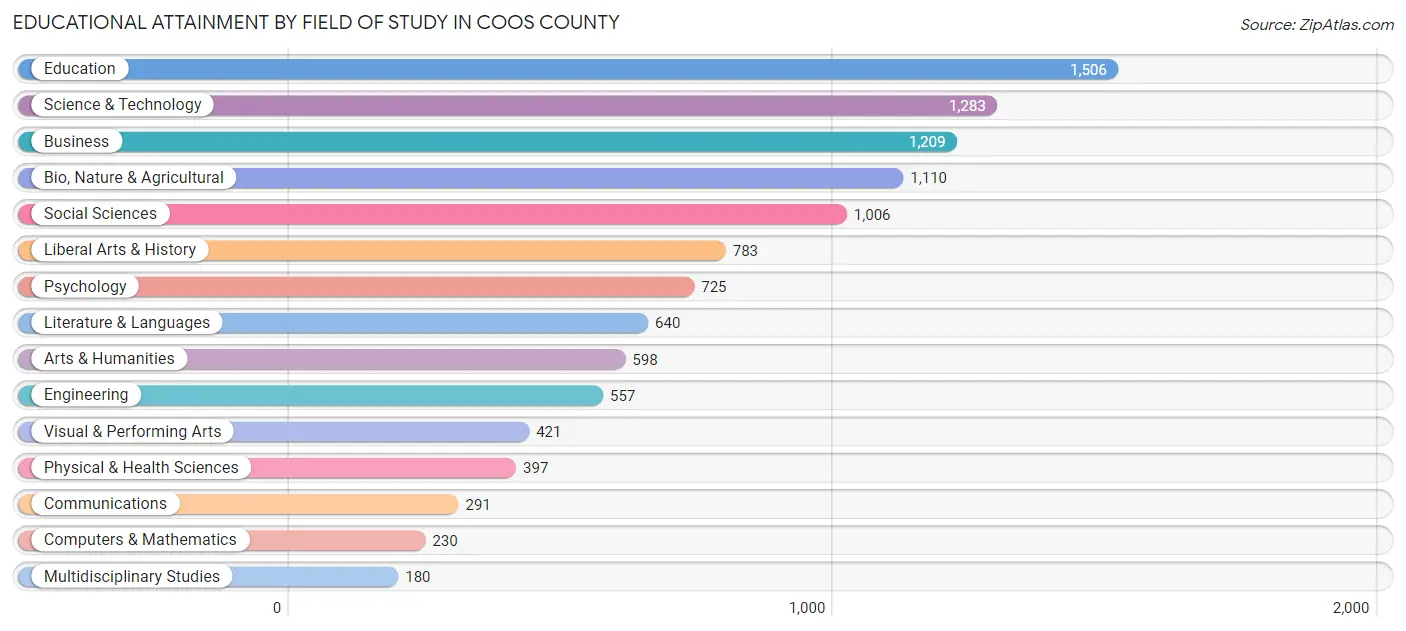
| Field of Study | # Graduates | % Graduates |
| Computers & Mathematics | 230 | 2.1% |
| Bio, Nature & Agricultural | 1,110 | 10.2% |
| Physical & Health Sciences | 397 | 3.6% |
| Psychology | 725 | 6.6% |
| Social Sciences | 1,006 | 9.2% |
| Engineering | 557 | 5.1% |
| Multidisciplinary Studies | 180 | 1.7% |
| Science & Technology | 1,283 | 11.7% |
| Business | 1,209 | 11.1% |
| Education | 1,506 | 13.8% |
| Literature & Languages | 640 | 5.9% |
| Liberal Arts & History | 783 | 7.2% |
| Visual & Performing Arts | 421 | 3.8% |
| Communications | 291 | 2.7% |
| Arts & Humanities | 598 | 5.5% |
| Total | 10,936 | 100.0% |
Transportation & Commute in Coos County
Vehicle Availability by Sex in Coos County
The most prevalent vehicle ownership categories in Coos County are males with 2 vehicles (5,010, accounting for 38.6%) and females with 2 vehicles (4,736, making up 41.3%).
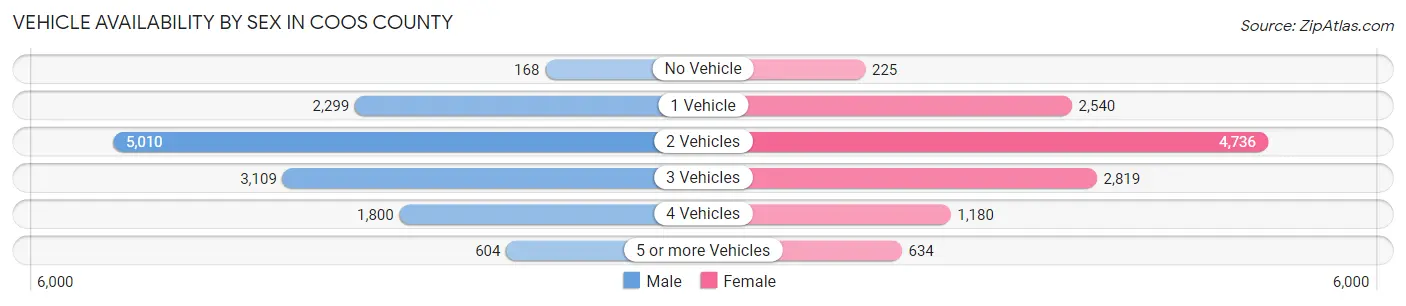
| Vehicles Available | Male | Female |
| No Vehicle | 168 (1.3%) | 225 (1.8%) |
| 1 Vehicle | 2,299 (17.7%) | 2,540 (20.9%) |
| 2 Vehicles | 5,010 (38.6%) | 4,736 (39.0%) |
| 3 Vehicles | 3,109 (23.9%) | 2,819 (23.2%) |
| 4 Vehicles | 1,800 (13.9%) | 1,180 (9.7%) |
| 5 or more Vehicles | 604 (4.6%) | 634 (5.2%) |
| Total | 12,990 (100.0%) | 12,134 (100.0%) |
Commute Time in Coos County
The most frequently occuring commute durations in Coos County are 5 to 9 minutes (5,142 commuters, 22.0%), 15 to 19 minutes (4,528 commuters, 19.4%), and 10 to 14 minutes (3,764 commuters, 16.1%).
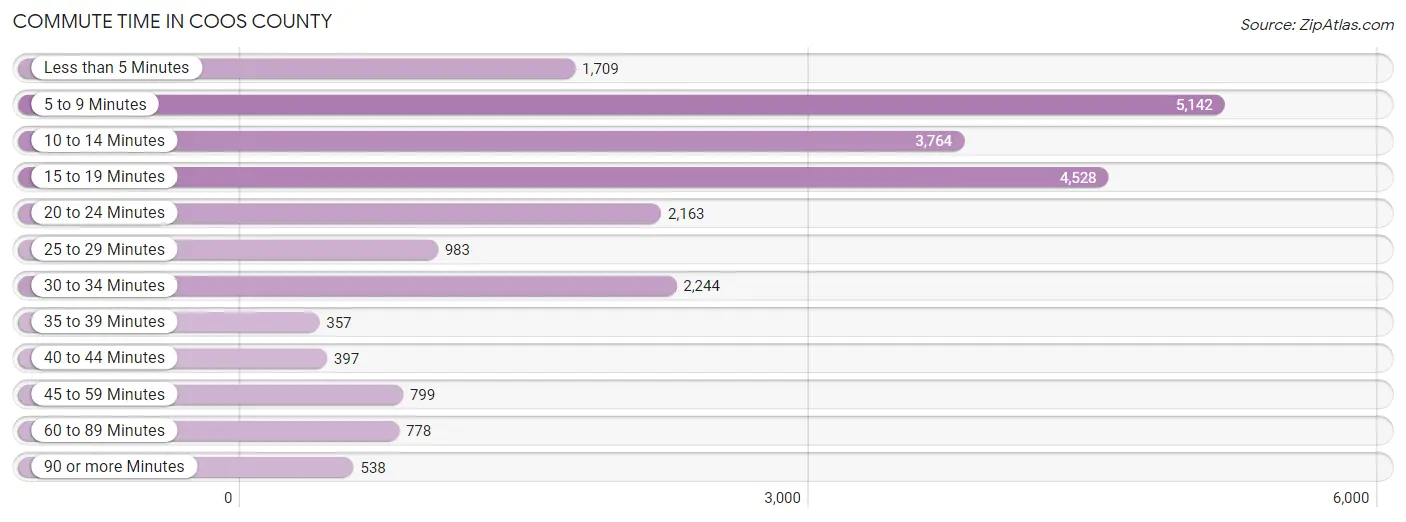
| Commute Time | # Commuters | % Commuters |
| Less than 5 Minutes | 1,709 | 7.3% |
| 5 to 9 Minutes | 5,142 | 22.0% |
| 10 to 14 Minutes | 3,764 | 16.1% |
| 15 to 19 Minutes | 4,528 | 19.4% |
| 20 to 24 Minutes | 2,163 | 9.2% |
| 25 to 29 Minutes | 983 | 4.2% |
| 30 to 34 Minutes | 2,244 | 9.6% |
| 35 to 39 Minutes | 357 | 1.5% |
| 40 to 44 Minutes | 397 | 1.7% |
| 45 to 59 Minutes | 799 | 3.4% |
| 60 to 89 Minutes | 778 | 3.3% |
| 90 or more Minutes | 538 | 2.3% |
Commute Time by Sex in Coos County
The most common commute times in Coos County are 5 to 9 minutes (2,418 commuters, 19.9%) for males and 5 to 9 minutes (2,724 commuters, 24.2%) for females.
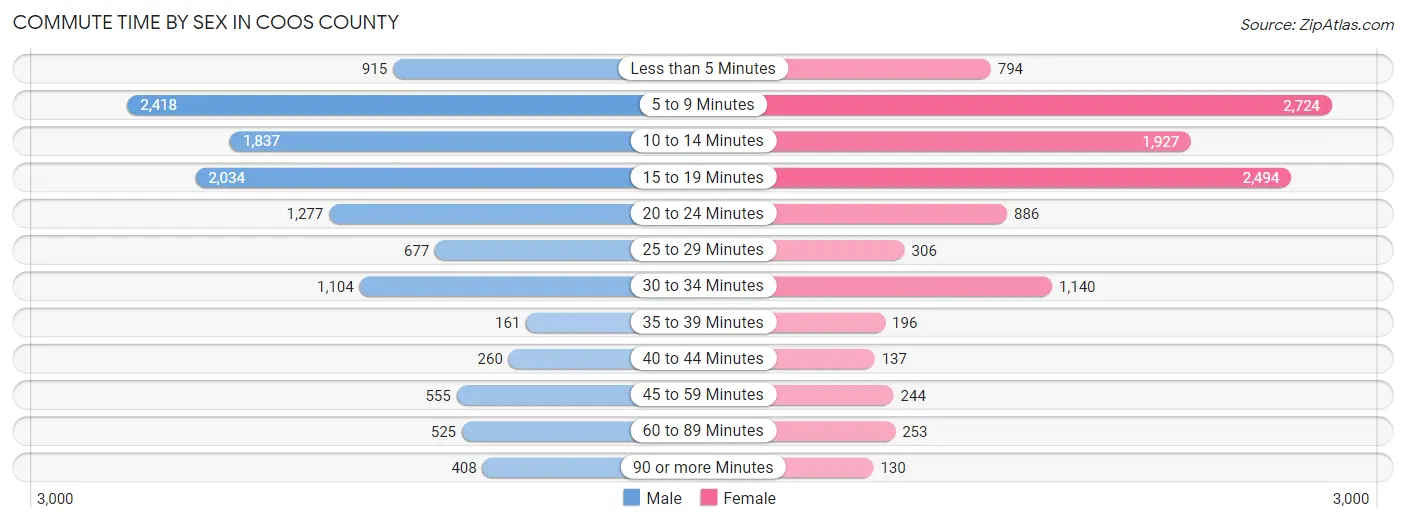
| Commute Time | Male | Female |
| Less than 5 Minutes | 915 (7.5%) | 794 (7.1%) |
| 5 to 9 Minutes | 2,418 (19.9%) | 2,724 (24.2%) |
| 10 to 14 Minutes | 1,837 (15.1%) | 1,927 (17.2%) |
| 15 to 19 Minutes | 2,034 (16.7%) | 2,494 (22.2%) |
| 20 to 24 Minutes | 1,277 (10.5%) | 886 (7.9%) |
| 25 to 29 Minutes | 677 (5.6%) | 306 (2.7%) |
| 30 to 34 Minutes | 1,104 (9.1%) | 1,140 (10.2%) |
| 35 to 39 Minutes | 161 (1.3%) | 196 (1.8%) |
| 40 to 44 Minutes | 260 (2.1%) | 137 (1.2%) |
| 45 to 59 Minutes | 555 (4.6%) | 244 (2.2%) |
| 60 to 89 Minutes | 525 (4.3%) | 253 (2.2%) |
| 90 or more Minutes | 408 (3.4%) | 130 (1.2%) |
Time of Departure to Work by Sex in Coos County
The most frequent times of departure to work in Coos County are 7:00 AM to 7:29 AM (2,040, 16.8%) for males and 7:30 AM to 7:59 AM (1,817, 16.2%) for females.
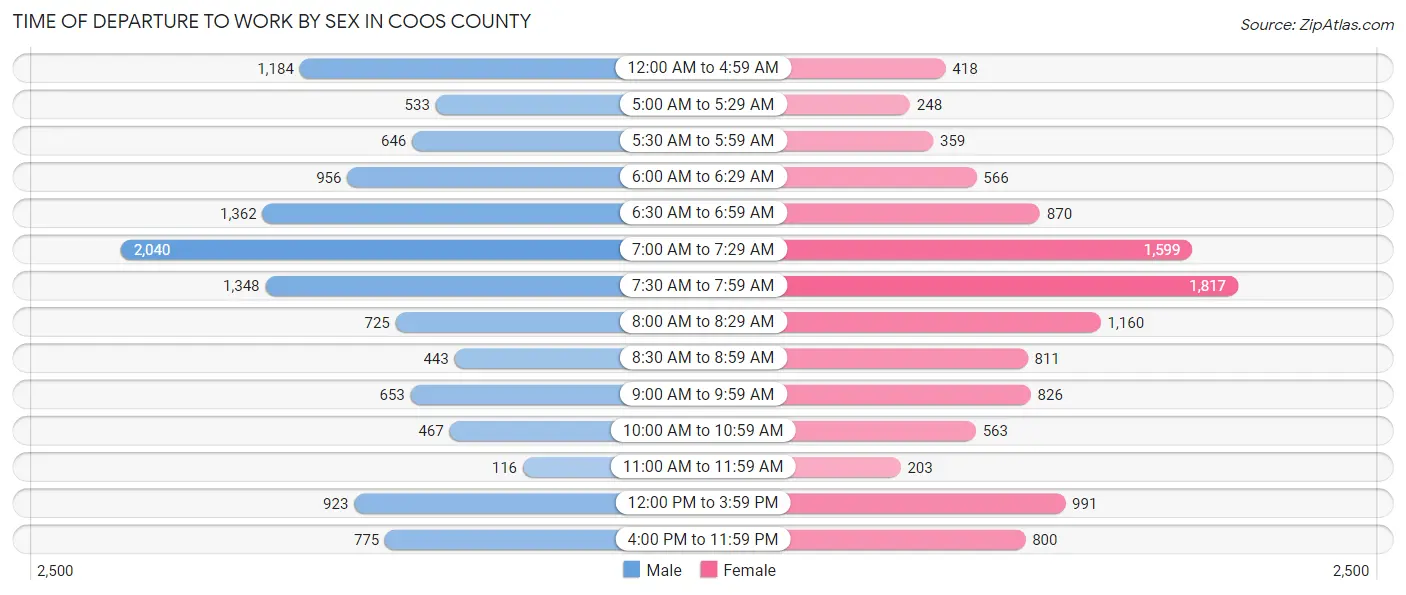
| Time of Departure | Male | Female |
| 12:00 AM to 4:59 AM | 1,184 (9.7%) | 418 (3.7%) |
| 5:00 AM to 5:29 AM | 533 (4.4%) | 248 (2.2%) |
| 5:30 AM to 5:59 AM | 646 (5.3%) | 359 (3.2%) |
| 6:00 AM to 6:29 AM | 956 (7.9%) | 566 (5.0%) |
| 6:30 AM to 6:59 AM | 1,362 (11.2%) | 870 (7.7%) |
| 7:00 AM to 7:29 AM | 2,040 (16.8%) | 1,599 (14.2%) |
| 7:30 AM to 7:59 AM | 1,348 (11.1%) | 1,817 (16.2%) |
| 8:00 AM to 8:29 AM | 725 (6.0%) | 1,160 (10.3%) |
| 8:30 AM to 8:59 AM | 443 (3.6%) | 811 (7.2%) |
| 9:00 AM to 9:59 AM | 653 (5.4%) | 826 (7.3%) |
| 10:00 AM to 10:59 AM | 467 (3.8%) | 563 (5.0%) |
| 11:00 AM to 11:59 AM | 116 (0.9%) | 203 (1.8%) |
| 12:00 PM to 3:59 PM | 923 (7.6%) | 991 (8.8%) |
| 4:00 PM to 11:59 PM | 775 (6.4%) | 800 (7.1%) |
| Total | 12,171 (100.0%) | 11,231 (100.0%) |
Housing Occupancy in Coos County
Occupancy by Ownership in Coos County
Of the total 28,075 dwellings in Coos County, owner-occupied units account for 19,418 (69.2%), while renter-occupied units make up 8,657 (30.8%).
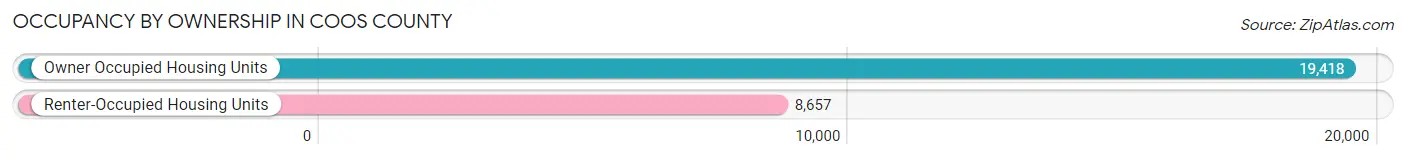
| Occupancy | # Housing Units | % Housing Units |
| Owner Occupied Housing Units | 19,418 | 69.2% |
| Renter-Occupied Housing Units | 8,657 | 30.8% |
| Total Occupied Housing Units | 28,075 | 100.0% |
Occupancy by Household Size in Coos County
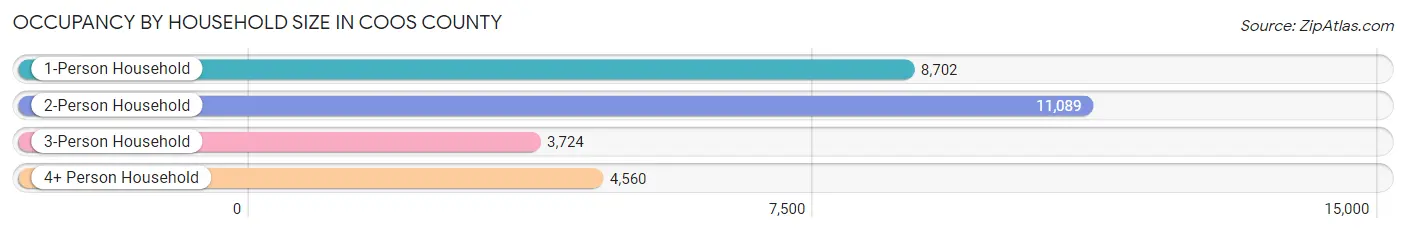
| Household Size | # Housing Units | % Housing Units |
| 1-Person Household | 8,702 | 31.0% |
| 2-Person Household | 11,089 | 39.5% |
| 3-Person Household | 3,724 | 13.3% |
| 4+ Person Household | 4,560 | 16.2% |
| Total Housing Units | 28,075 | 100.0% |
Occupancy by Ownership by Household Size in Coos County
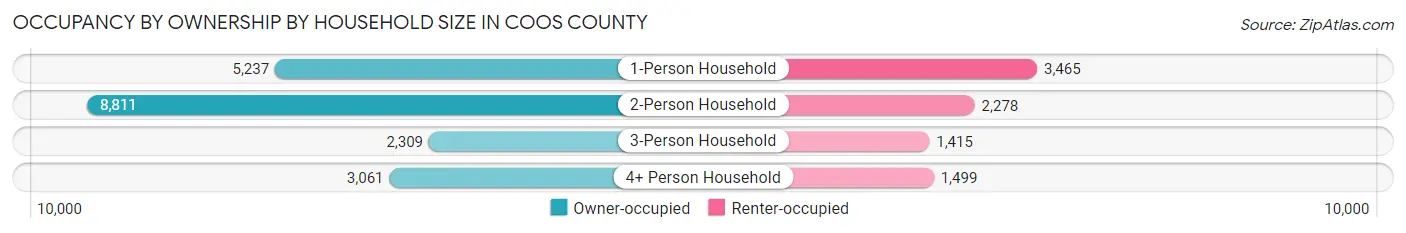
| Household Size | Owner-occupied | Renter-occupied |
| 1-Person Household | 5,237 (60.2%) | 3,465 (39.8%) |
| 2-Person Household | 8,811 (79.5%) | 2,278 (20.5%) |
| 3-Person Household | 2,309 (62.0%) | 1,415 (38.0%) |
| 4+ Person Household | 3,061 (67.1%) | 1,499 (32.9%) |
| Total Housing Units | 19,418 (69.2%) | 8,657 (30.8%) |
Occupancy by Educational Attainment in Coos County
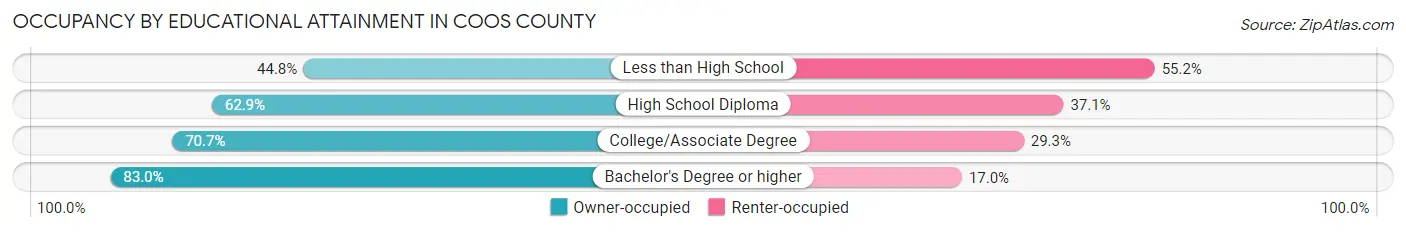
| Household Size | Owner-occupied | Renter-occupied |
| Less than High School | 1,067 (44.8%) | 1,316 (55.2%) |
| High School Diploma | 4,705 (62.9%) | 2,779 (37.1%) |
| College/Associate Degree | 8,451 (70.7%) | 3,497 (29.3%) |
| Bachelor's Degree or higher | 5,195 (83.0%) | 1,065 (17.0%) |
Occupancy by Age of Householder in Coos County
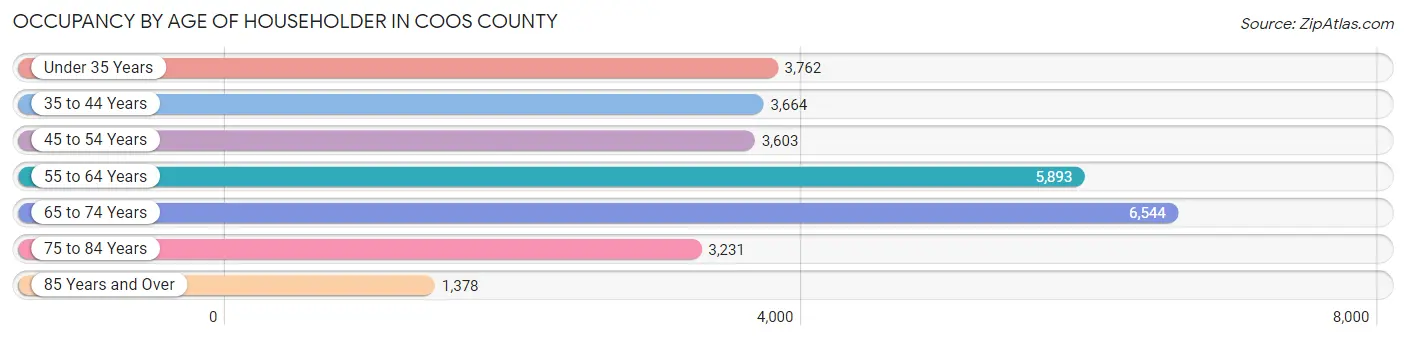
| Age Bracket | # Households | % Households |
| Under 35 Years | 3,762 | 13.4% |
| 35 to 44 Years | 3,664 | 13.1% |
| 45 to 54 Years | 3,603 | 12.8% |
| 55 to 64 Years | 5,893 | 21.0% |
| 65 to 74 Years | 6,544 | 23.3% |
| 75 to 84 Years | 3,231 | 11.5% |
| 85 Years and Over | 1,378 | 4.9% |
| Total | 28,075 | 100.0% |
Housing Finances in Coos County
Median Income by Occupancy in Coos County
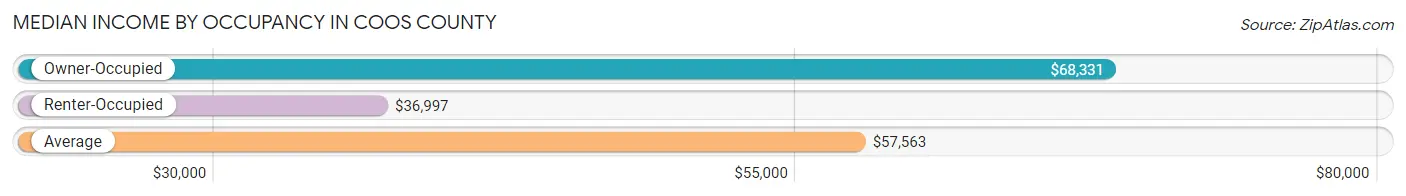
| Occupancy Type | # Households | Median Income |
| Owner-Occupied | 19,418 (69.2%) | $68,331 |
| Renter-Occupied | 8,657 (30.8%) | $36,997 |
| Average | 28,075 (100.0%) | $57,563 |
Occupancy by Householder Income Bracket in Coos County
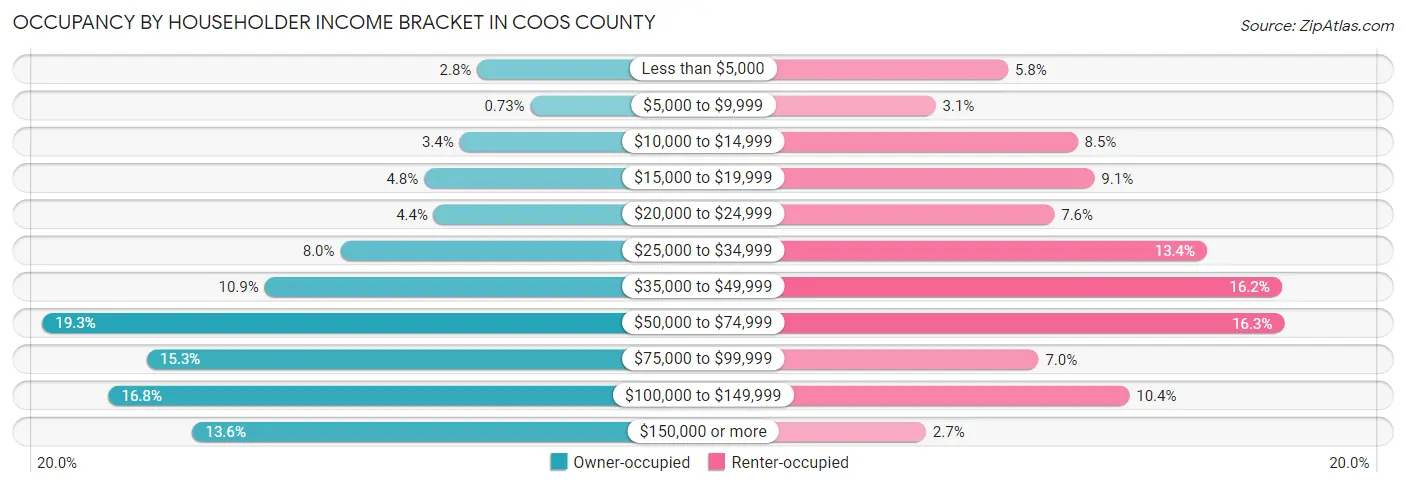
| Income Bracket | Owner-occupied | Renter-occupied |
| Less than $5,000 | 536 (2.8%) | 503 (5.8%) |
| $5,000 to $9,999 | 141 (0.7%) | 264 (3.0%) |
| $10,000 to $14,999 | 666 (3.4%) | 732 (8.5%) |
| $15,000 to $19,999 | 928 (4.8%) | 788 (9.1%) |
| $20,000 to $24,999 | 857 (4.4%) | 655 (7.6%) |
| $25,000 to $34,999 | 1,548 (8.0%) | 1,158 (13.4%) |
| $35,000 to $49,999 | 2,109 (10.9%) | 1,405 (16.2%) |
| $50,000 to $74,999 | 3,752 (19.3%) | 1,414 (16.3%) |
| $75,000 to $99,999 | 2,978 (15.3%) | 603 (7.0%) |
| $100,000 to $149,999 | 3,262 (16.8%) | 903 (10.4%) |
| $150,000 or more | 2,641 (13.6%) | 232 (2.7%) |
| Total | 19,418 (100.0%) | 8,657 (100.0%) |
Monthly Housing Cost Tiers in Coos County
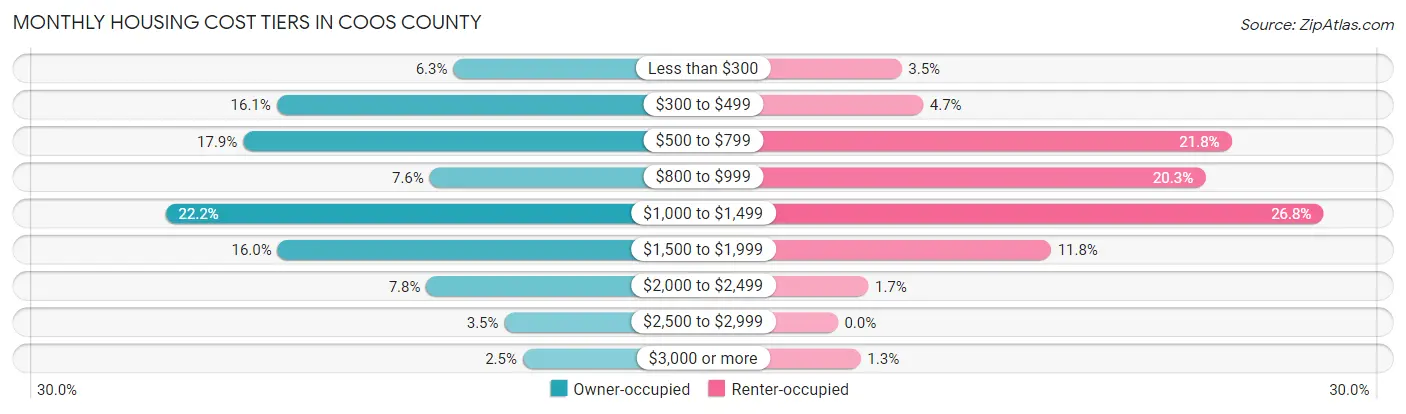
| Monthly Cost | Owner-occupied | Renter-occupied |
| Less than $300 | 1,228 (6.3%) | 306 (3.5%) |
| $300 to $499 | 3,123 (16.1%) | 409 (4.7%) |
| $500 to $799 | 3,481 (17.9%) | 1,884 (21.8%) |
| $800 to $999 | 1,481 (7.6%) | 1,757 (20.3%) |
| $1,000 to $1,499 | 4,314 (22.2%) | 2,323 (26.8%) |
| $1,500 to $1,999 | 3,112 (16.0%) | 1,020 (11.8%) |
| $2,000 to $2,499 | 1,517 (7.8%) | 146 (1.7%) |
| $2,500 to $2,999 | 680 (3.5%) | 0 (0.0%) |
| $3,000 or more | 482 (2.5%) | 110 (1.3%) |
| Total | 19,418 (100.0%) | 8,657 (100.0%) |
Physical Housing Characteristics in Coos County
Housing Structures in Coos County
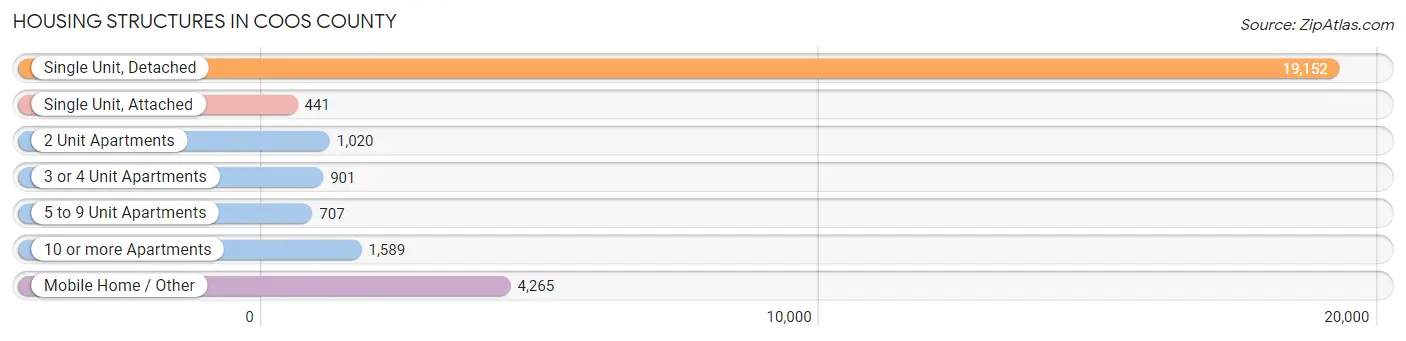
| Structure Type | # Housing Units | % Housing Units |
| Single Unit, Detached | 19,152 | 68.2% |
| Single Unit, Attached | 441 | 1.6% |
| 2 Unit Apartments | 1,020 | 3.6% |
| 3 or 4 Unit Apartments | 901 | 3.2% |
| 5 to 9 Unit Apartments | 707 | 2.5% |
| 10 or more Apartments | 1,589 | 5.7% |
| Mobile Home / Other | 4,265 | 15.2% |
| Total | 28,075 | 100.0% |
Housing Structures by Occupancy in Coos County
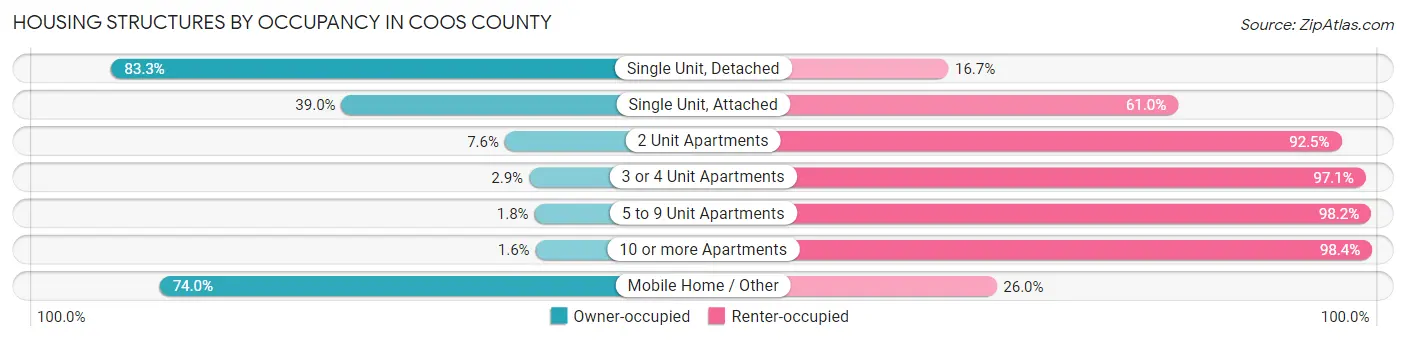
| Structure Type | Owner-occupied | Renter-occupied |
| Single Unit, Detached | 15,949 (83.3%) | 3,203 (16.7%) |
| Single Unit, Attached | 172 (39.0%) | 269 (61.0%) |
| 2 Unit Apartments | 77 (7.5%) | 943 (92.4%) |
| 3 or 4 Unit Apartments | 26 (2.9%) | 875 (97.1%) |
| 5 to 9 Unit Apartments | 13 (1.8%) | 694 (98.2%) |
| 10 or more Apartments | 26 (1.6%) | 1,563 (98.4%) |
| Mobile Home / Other | 3,155 (74.0%) | 1,110 (26.0%) |
| Total | 19,418 (69.2%) | 8,657 (30.8%) |
Housing Structures by Number of Rooms in Coos County
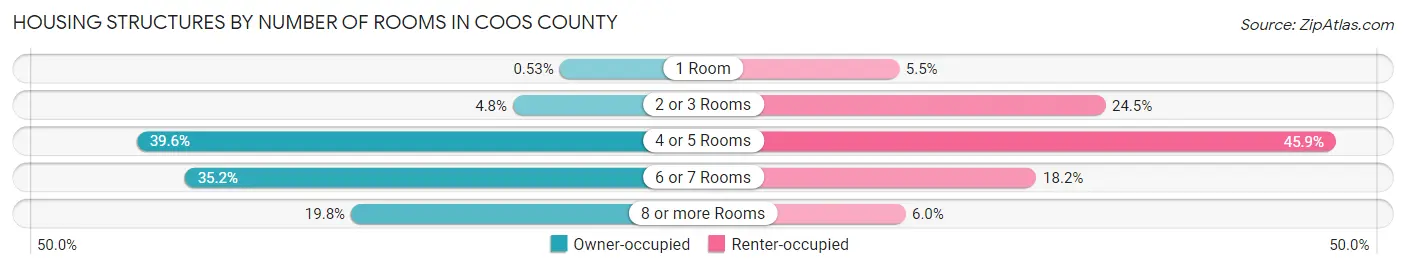
| Number of Rooms | Owner-occupied | Renter-occupied |
| 1 Room | 102 (0.5%) | 472 (5.4%) |
| 2 or 3 Rooms | 939 (4.8%) | 2,123 (24.5%) |
| 4 or 5 Rooms | 7,696 (39.6%) | 3,970 (45.9%) |
| 6 or 7 Rooms | 6,833 (35.2%) | 1,571 (18.1%) |
| 8 or more Rooms | 3,848 (19.8%) | 521 (6.0%) |
| Total | 19,418 (100.0%) | 8,657 (100.0%) |
Housing Structure by Heating Type in Coos County
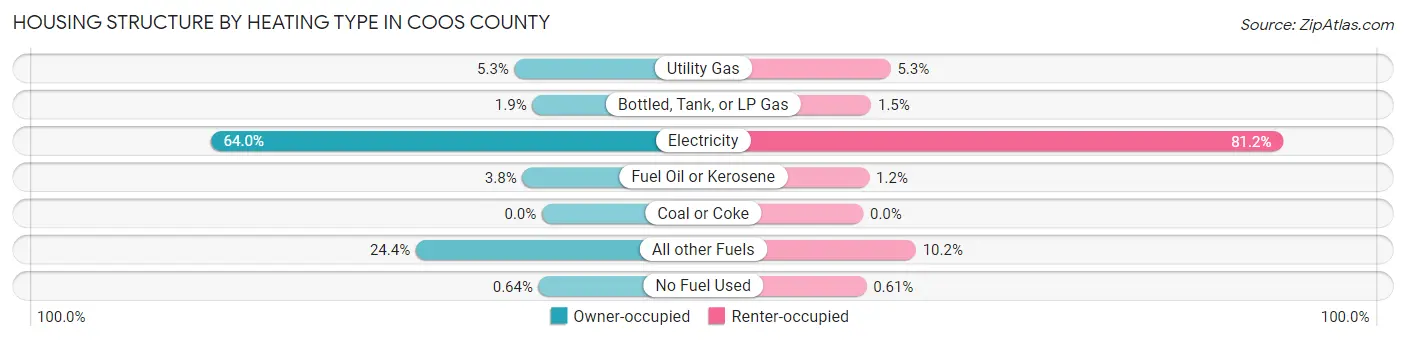
| Heating Type | Owner-occupied | Renter-occupied |
| Utility Gas | 1,029 (5.3%) | 459 (5.3%) |
| Bottled, Tank, or LP Gas | 361 (1.9%) | 133 (1.5%) |
| Electricity | 12,435 (64.0%) | 7,029 (81.2%) |
| Fuel Oil or Kerosene | 736 (3.8%) | 102 (1.2%) |
| Coal or Coke | 0 (0.0%) | 0 (0.0%) |
| All other Fuels | 4,732 (24.4%) | 881 (10.2%) |
| No Fuel Used | 125 (0.6%) | 53 (0.6%) |
| Total | 19,418 (100.0%) | 8,657 (100.0%) |
Household Vehicle Usage in Coos County
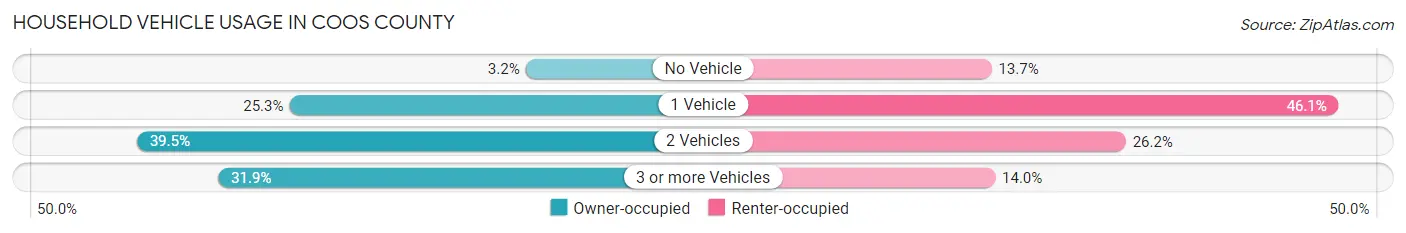
| Vehicles per Household | Owner-occupied | Renter-occupied |
| No Vehicle | 630 (3.2%) | 1,184 (13.7%) |
| 1 Vehicle | 4,910 (25.3%) | 3,990 (46.1%) |
| 2 Vehicles | 7,676 (39.5%) | 2,269 (26.2%) |
| 3 or more Vehicles | 6,202 (31.9%) | 1,214 (14.0%) |
| Total | 19,418 (100.0%) | 8,657 (100.0%) |
Real Estate & Mortgages in Coos County
Real Estate and Mortgage Overview in Coos County
| Characteristic | Without Mortgage | With Mortgage |
| Housing Units | 8,271 | 11,147 |
| Median Property Value | $257,000 | $287,700 |
| Median Household Income | $51,532 | $1,880 |
| Monthly Housing Costs | $490 | $440 |
| Real Estate Taxes | $1,975 | $333 |
Property Value by Mortgage Status in Coos County
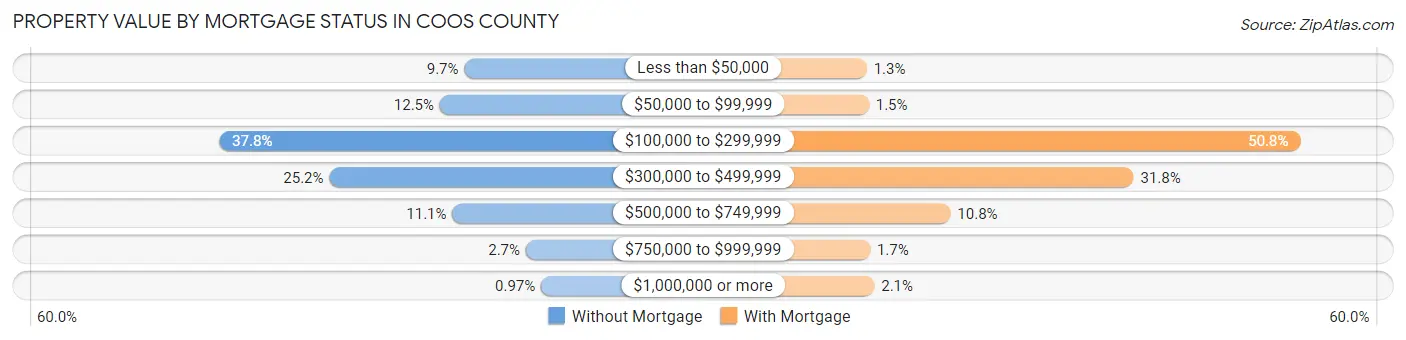
| Property Value | Without Mortgage | With Mortgage |
| Less than $50,000 | 806 (9.7%) | 143 (1.3%) |
| $50,000 to $99,999 | 1,037 (12.5%) | 168 (1.5%) |
| $100,000 to $299,999 | 3,123 (37.8%) | 5,665 (50.8%) |
| $300,000 to $499,999 | 2,082 (25.2%) | 3,541 (31.8%) |
| $500,000 to $749,999 | 919 (11.1%) | 1,208 (10.8%) |
| $750,000 to $999,999 | 224 (2.7%) | 184 (1.7%) |
| $1,000,000 or more | 80 (1.0%) | 238 (2.1%) |
| Total | 8,271 (100.0%) | 11,147 (100.0%) |
Household Income by Mortgage Status in Coos County
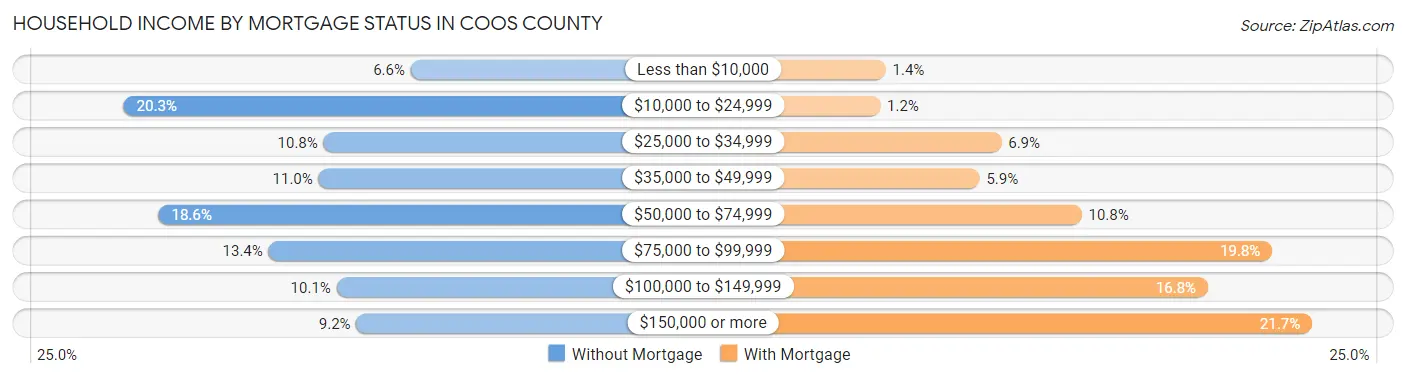
| Household Income | Without Mortgage | With Mortgage |
| Less than $10,000 | 547 (6.6%) | 159 (1.4%) |
| $10,000 to $24,999 | 1,677 (20.3%) | 130 (1.2%) |
| $25,000 to $34,999 | 890 (10.8%) | 774 (6.9%) |
| $35,000 to $49,999 | 910 (11.0%) | 658 (5.9%) |
| $50,000 to $74,999 | 1,540 (18.6%) | 1,199 (10.8%) |
| $75,000 to $99,999 | 1,107 (13.4%) | 2,212 (19.8%) |
| $100,000 to $149,999 | 839 (10.1%) | 1,871 (16.8%) |
| $150,000 or more | 761 (9.2%) | 2,423 (21.7%) |
| Total | 8,271 (100.0%) | 11,147 (100.0%) |
Property Value to Household Income Ratio in Coos County
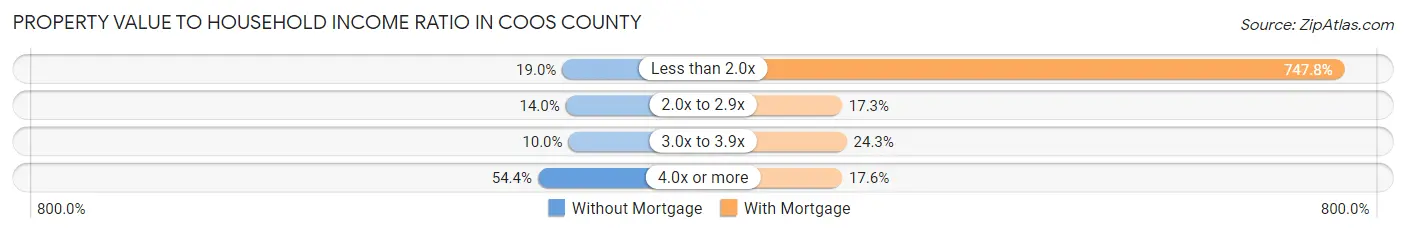
| Value-to-Income Ratio | Without Mortgage | With Mortgage |
| Less than 2.0x | 1,568 (19.0%) | 83,359 (747.8%) |
| 2.0x to 2.9x | 1,160 (14.0%) | 1,931 (17.3%) |
| 3.0x to 3.9x | 827 (10.0%) | 2,706 (24.3%) |
| 4.0x or more | 4,497 (54.4%) | 1,961 (17.6%) |
| Total | 8,271 (100.0%) | 11,147 (100.0%) |
Real Estate Taxes by Mortgage Status in Coos County
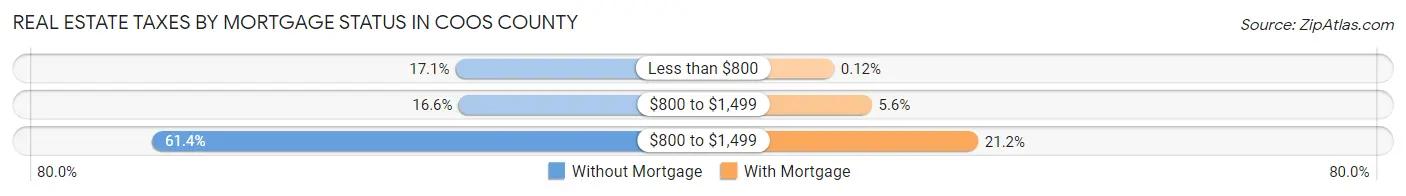
| Property Taxes | Without Mortgage | With Mortgage |
| Less than $800 | 1,412 (17.1%) | 13 (0.1%) |
| $800 to $1,499 | 1,375 (16.6%) | 627 (5.6%) |
| $800 to $1,499 | 5,076 (61.4%) | 2,359 (21.2%) |
| Total | 8,271 (100.0%) | 11,147 (100.0%) |
Health & Disability in Coos County
Health Insurance Coverage by Age in Coos County
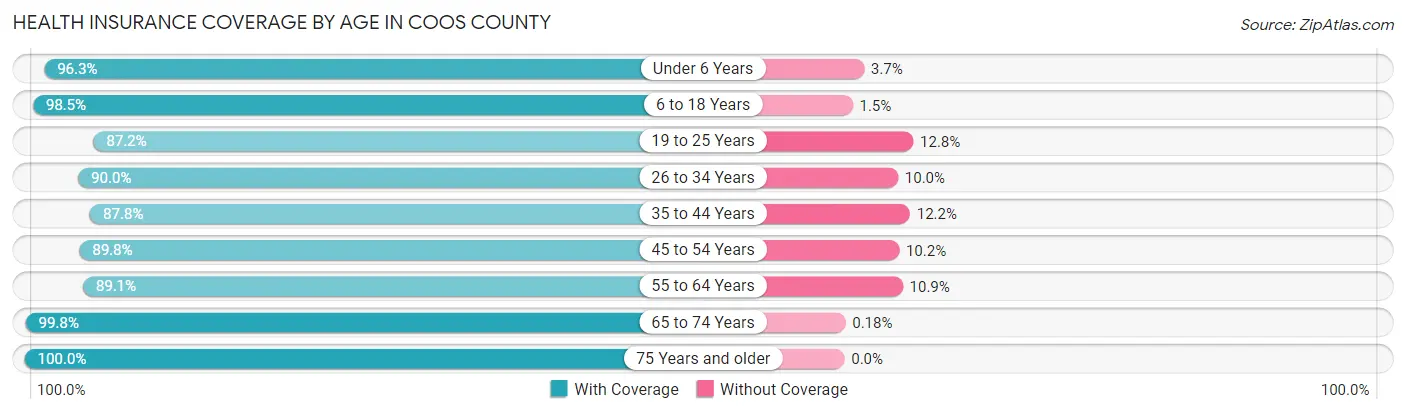
| Age Bracket | With Coverage | Without Coverage |
| Under 6 Years | 3,234 (96.3%) | 123 (3.7%) |
| 6 to 18 Years | 8,895 (98.5%) | 139 (1.5%) |
| 19 to 25 Years | 3,901 (87.2%) | 574 (12.8%) |
| 26 to 34 Years | 5,208 (90.0%) | 578 (10.0%) |
| 35 to 44 Years | 6,394 (87.8%) | 889 (12.2%) |
| 45 to 54 Years | 6,206 (89.8%) | 705 (10.2%) |
| 55 to 64 Years | 9,097 (89.1%) | 1,109 (10.9%) |
| 65 to 74 Years | 10,362 (99.8%) | 19 (0.2%) |
| 75 Years and older | 6,742 (100.0%) | 0 (0.0%) |
| Total | 60,039 (93.6%) | 4,136 (6.4%) |
Health Insurance Coverage by Citizenship Status in Coos County
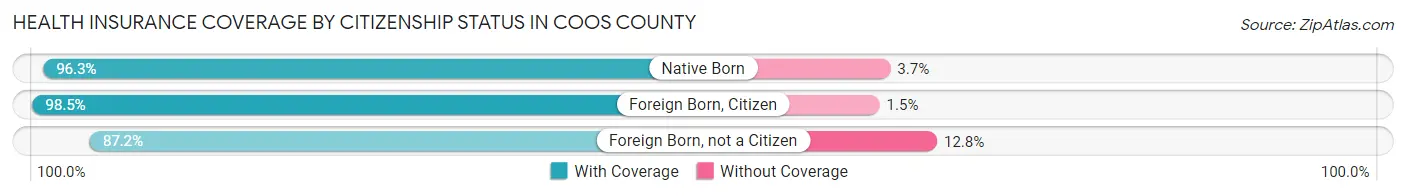
| Citizenship Status | With Coverage | Without Coverage |
| Native Born | 3,234 (96.3%) | 123 (3.7%) |
| Foreign Born, Citizen | 8,895 (98.5%) | 139 (1.5%) |
| Foreign Born, not a Citizen | 3,901 (87.2%) | 574 (12.8%) |
Health Insurance Coverage by Household Income in Coos County
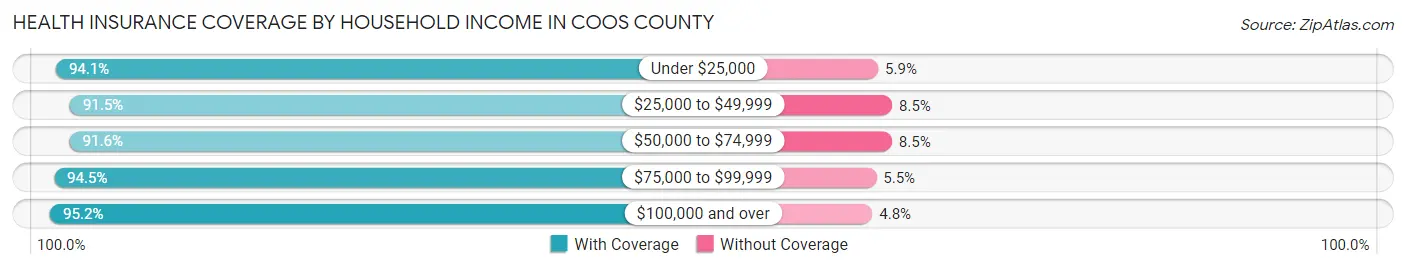
| Household Income | With Coverage | Without Coverage |
| Under $25,000 | 8,842 (94.1%) | 552 (5.9%) |
| $25,000 to $49,999 | 11,647 (91.5%) | 1,080 (8.5%) |
| $50,000 to $74,999 | 10,809 (91.5%) | 998 (8.5%) |
| $75,000 to $99,999 | 8,929 (94.5%) | 523 (5.5%) |
| $100,000 and over | 19,228 (95.2%) | 968 (4.8%) |
Public vs Private Health Insurance Coverage by Age in Coos County
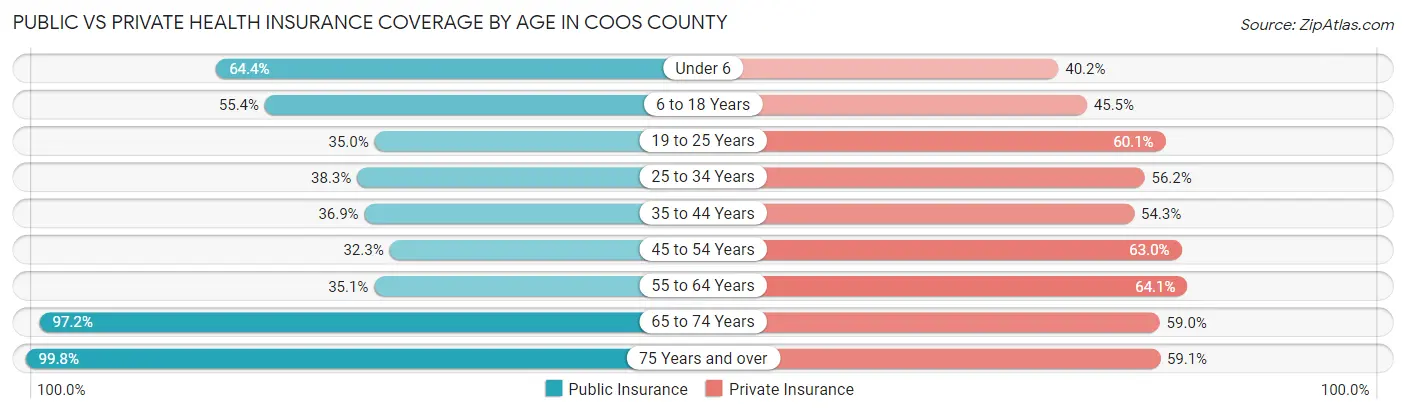
| Age Bracket | Public Insurance | Private Insurance |
| Under 6 | 2,163 (64.4%) | 1,349 (40.2%) |
| 6 to 18 Years | 5,005 (55.4%) | 4,110 (45.5%) |
| 19 to 25 Years | 1,568 (35.0%) | 2,688 (60.1%) |
| 25 to 34 Years | 2,215 (38.3%) | 3,252 (56.2%) |
| 35 to 44 Years | 2,689 (36.9%) | 3,951 (54.2%) |
| 45 to 54 Years | 2,230 (32.3%) | 4,356 (63.0%) |
| 55 to 64 Years | 3,583 (35.1%) | 6,545 (64.1%) |
| 65 to 74 Years | 10,092 (97.2%) | 6,125 (59.0%) |
| 75 Years and over | 6,729 (99.8%) | 3,981 (59.1%) |
| Total | 36,274 (56.5%) | 36,357 (56.7%) |
Disability Status by Sex by Age in Coos County
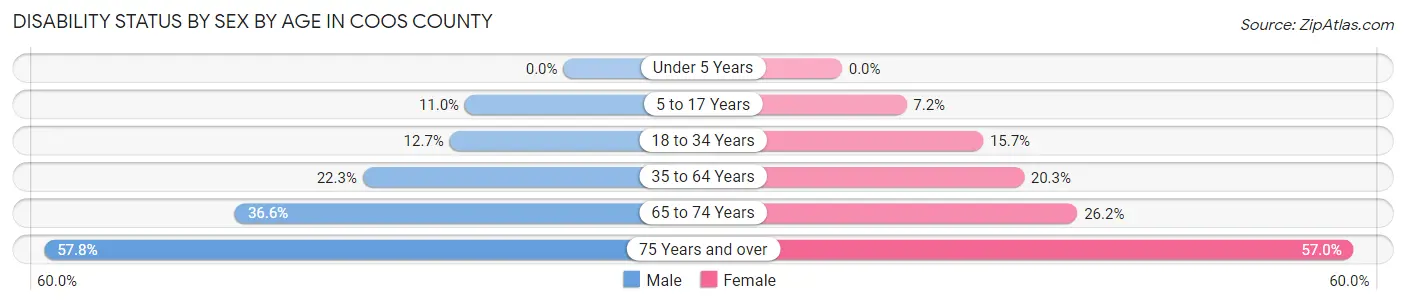
| Age Bracket | Male | Female |
| Under 5 Years | 0 (0.0%) | 0 (0.0%) |
| 5 to 17 Years | 500 (11.0%) | 302 (7.2%) |
| 18 to 34 Years | 696 (12.7%) | 859 (15.7%) |
| 35 to 64 Years | 2,686 (22.3%) | 2,509 (20.3%) |
| 65 to 74 Years | 1,858 (36.6%) | 1,390 (26.2%) |
| 75 Years and over | 1,809 (57.8%) | 2,059 (57.0%) |
Disability Class by Sex by Age in Coos County
Disability Class: Hearing Difficulty
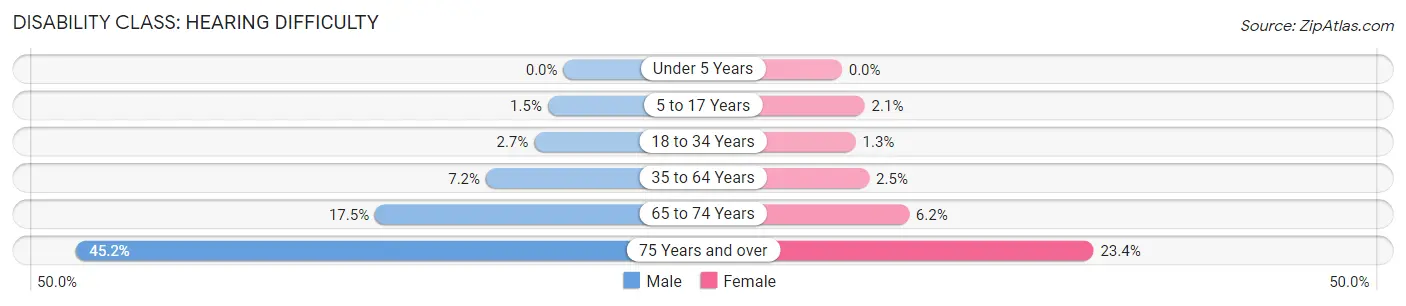
| Age Bracket | Male | Female |
| Under 5 Years | 0 (0.0%) | 0 (0.0%) |
| 5 to 17 Years | 66 (1.5%) | 89 (2.1%) |
| 18 to 34 Years | 149 (2.7%) | 70 (1.3%) |
| 35 to 64 Years | 864 (7.2%) | 314 (2.5%) |
| 65 to 74 Years | 888 (17.5%) | 330 (6.2%) |
| 75 Years and over | 1,414 (45.2%) | 844 (23.4%) |
Disability Class: Vision Difficulty
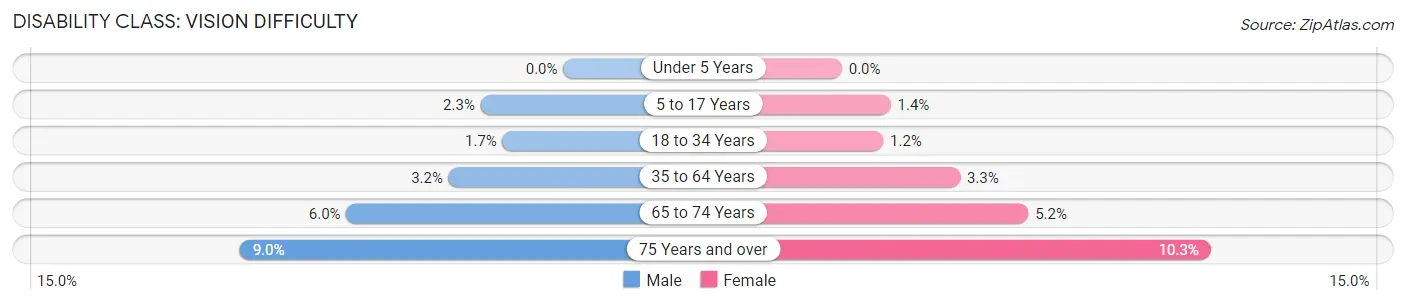
| Age Bracket | Male | Female |
| Under 5 Years | 0 (0.0%) | 0 (0.0%) |
| 5 to 17 Years | 105 (2.3%) | 57 (1.4%) |
| 18 to 34 Years | 93 (1.7%) | 63 (1.1%) |
| 35 to 64 Years | 384 (3.2%) | 407 (3.3%) |
| 65 to 74 Years | 307 (6.0%) | 275 (5.2%) |
| 75 Years and over | 282 (9.0%) | 371 (10.3%) |
Disability Class: Cognitive Difficulty
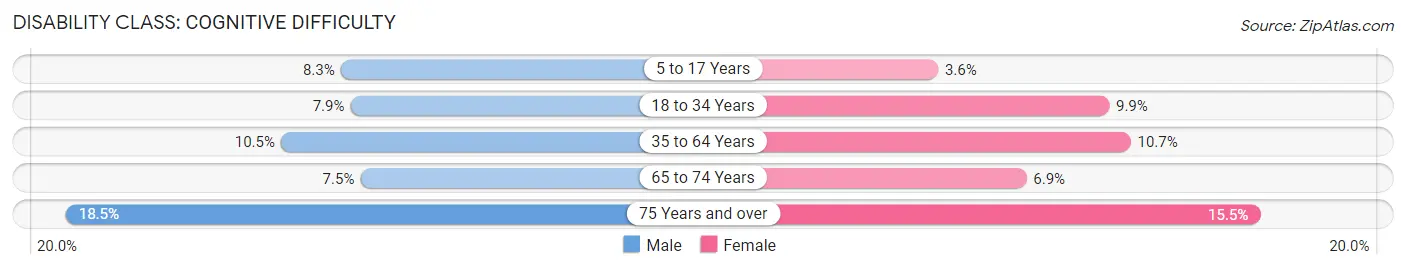
| Age Bracket | Male | Female |
| 5 to 17 Years | 377 (8.3%) | 150 (3.6%) |
| 18 to 34 Years | 435 (7.9%) | 542 (9.9%) |
| 35 to 64 Years | 1,261 (10.5%) | 1,327 (10.7%) |
| 65 to 74 Years | 383 (7.5%) | 363 (6.9%) |
| 75 Years and over | 578 (18.5%) | 561 (15.5%) |
Disability Class: Ambulatory Difficulty
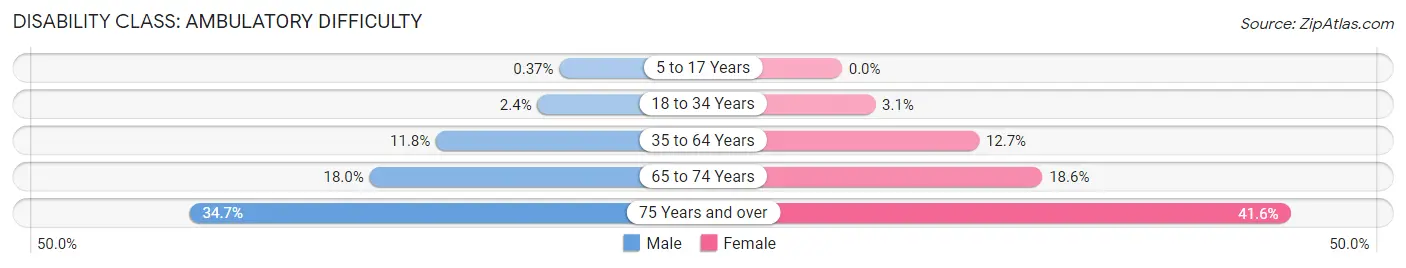
| Age Bracket | Male | Female |
| 5 to 17 Years | 17 (0.4%) | 0 (0.0%) |
| 18 to 34 Years | 132 (2.4%) | 169 (3.1%) |
| 35 to 64 Years | 1,420 (11.8%) | 1,576 (12.7%) |
| 65 to 74 Years | 914 (18.0%) | 986 (18.6%) |
| 75 Years and over | 1,085 (34.7%) | 1,504 (41.6%) |
Disability Class: Self-Care Difficulty
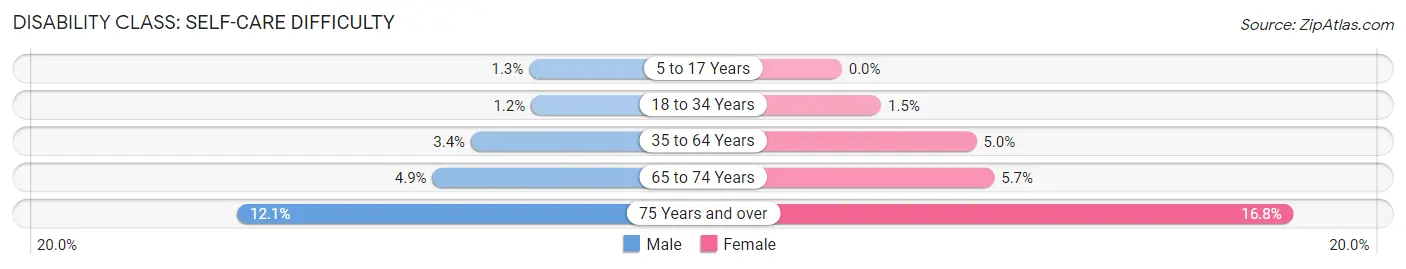
| Age Bracket | Male | Female |
| 5 to 17 Years | 58 (1.3%) | 0 (0.0%) |
| 18 to 34 Years | 66 (1.2%) | 80 (1.5%) |
| 35 to 64 Years | 412 (3.4%) | 619 (5.0%) |
| 65 to 74 Years | 247 (4.9%) | 300 (5.7%) |
| 75 Years and over | 379 (12.1%) | 606 (16.8%) |
Technology Access in Coos County
Computing Device Access in Coos County
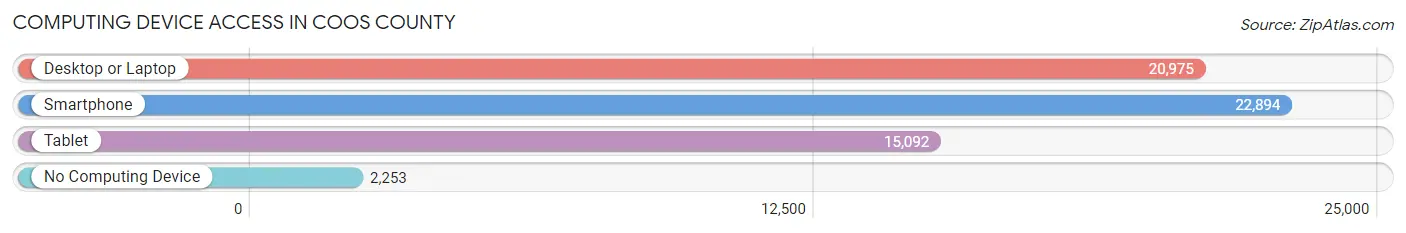
| Device Type | # Households | % Households |
| Desktop or Laptop | 20,975 | 74.7% |
| Smartphone | 22,894 | 81.6% |
| Tablet | 15,092 | 53.8% |
| No Computing Device | 2,253 | 8.0% |
| Total | 28,075 | 100.0% |
Internet Access in Coos County
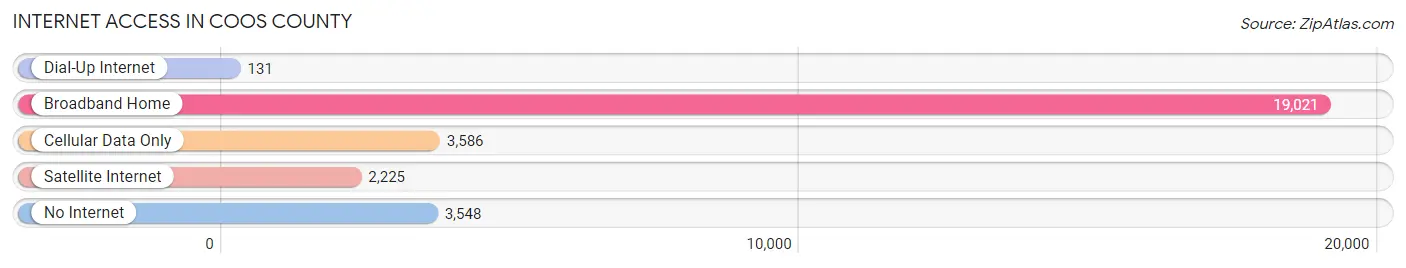
| Internet Type | # Households | % Households |
| Dial-Up Internet | 131 | 0.5% |
| Broadband Home | 19,021 | 67.7% |
| Cellular Data Only | 3,586 | 12.8% |
| Satellite Internet | 2,225 | 7.9% |
| No Internet | 3,548 | 12.6% |
| Total | 28,075 | 100.0% |
Coos County Summary
Coos County is located in the southwestern corner of Oregon, along the Pacific Ocean. It is bordered by Curry County to the south, Douglas County to the east, and the Pacific Ocean to the west. The county seat is Coquille, and the largest city is North Bend. The county covers an area of 1,614 square miles and has a population of 63,043 as of the 2020 census.
History
The first inhabitants of Coos County were Native American tribes, including the Coos, Lower Umpqua, Siuslaw, and Coquille. The first European settlers arrived in the area in the early 1800s, and the county was officially established in 1853. The county was named after the Coos tribe, which was the dominant tribe in the area at the time.
The county was initially a logging and fishing economy, with the first sawmill being built in 1854. The county also had a thriving shipbuilding industry, with the first ship being built in 1856. The county also had a thriving agricultural industry, with the first crops being planted in 1858.
In the late 1800s, the county experienced a population boom due to the discovery of gold in the area. This led to the establishment of several towns, including Coquille, North Bend, and Bandon.
Geography
Coos County is located in the southwestern corner of Oregon, along the Pacific Ocean. It is bordered by Curry County to the south, Douglas County to the east, and the Pacific Ocean to the west. The county covers an area of 1,614 square miles and has a population of 63,043 as of the 2020 census.
The county is mostly mountainous, with the highest point being Mount Hebo at an elevation of 3,717 feet. The county also has several rivers, including the Coos, Coquille, and Umpqua. The climate is mild and temperate, with an average annual temperature of 54 degrees Fahrenheit.
Economy
Coos County has a diverse economy, with the largest industries being timber, fishing, and tourism. The county is home to several timber companies, including Weyerhaeuser and Georgia-Pacific. The county also has a thriving fishing industry, with the most popular species being salmon, halibut, and crab.
The county also has a thriving tourism industry, with the most popular attractions being the Oregon Dunes National Recreation Area, the Coos Bay Boardwalk, and the Oregon Coast Aquarium. The county also has several museums, including the Coos History Museum and the Coos Art Museum.
Demographics
As of the 2020 census, Coos County had a population of 63,043. The racial makeup of the county was 87.3% White, 4.2% Hispanic or Latino, 2.2% Native American, 1.3% Asian, 0.7% Black or African American, and 0.5% Pacific Islander. The median household income was $45,845, and the median home value was $219,400.
The largest cities in the county are Coquille (population 5,945), North Bend (population 9,845), and Bandon (population 3,717). The county also has several smaller towns, including Coos Bay (population 15,967), Lakeside (population 1,845), and Charleston (population 1,717).
Common Questions
What is the Total Population of Coos County?
Total Population of Coos County is 64,908.
What is the Total Male Population of Coos County?
Total Male Population of Coos County is 32,219.
What is the Total Female Population of Coos County?
Total Female Population of Coos County is 32,689.
What is the Ratio of Males per 100 Females in Coos County?
There are 98.56 Males per 100 Females in Coos County.
What is the Ratio of Females per 100 Males in Coos County?
There are 101.46 Females per 100 Males in Coos County.
What is the Median Population Age in Coos County?
Median Population Age in Coos County is 48.4 Years.
What is the Average Family Size in Coos County
Average Family Size in Coos County is 2.8 People.
What is the Average Household Size in Coos County
Average Household Size in Coos County is 2.3 People.
What is Per Capita Income in Coos County?
Per Capita income in Coos County is $33,572.
What is the Median Family Income in Coos County?
Median Family Income in Coos County is $73,947.
What is the Median Household income in Coos County?
Median Household Income in Coos County is $57,563.
What is Income or Wage Gap in Coos County?
Income or Wage Gap in Coos County is 33.9%.
Women in Coos County earn 66.1 cents for every dollar earned by a man.
What is Family Income Deficit in Coos County?
Family Income Deficit in Coos County is $10,758.
Families that are below poverty line in Coos County earn $10,758 less on average than the poverty threshold level.
What is Inequality or Gini Index in Coos County?
Inequality or Gini Index in Coos County is 0.45.
How Large is the Labor Force in Coos County?
There are 27,697 People in the Labor Forcein in Coos County.
What is the Percentage of People in the Labor Force in Coos County?
50.8% of People are in the Labor Force in Coos County.
What is the Unemployment Rate in Coos County?
Unemployment Rate in Coos County is 5.8%.