Columbia County, OR
Columbia County Map
Columbia County Overview
52,865
TOTAL POPULATION
26,965
MALE POPULATION
25,900
FEMALE POPULATION
104.11
MALES / 100 FEMALES
96.05
FEMALES / 100 MALES
43.1
MEDIAN AGE
3.0
AVG FAMILY SIZE
2.6
AVG HOUSEHOLD SIZE
$37,986
PER CAPITA INCOME
$94,162
AVG FAMILY INCOME
$83,265
AVG HOUSEHOLD INCOME
38.5%
WAGE / INCOME GAP [ % ]
61.5¢/ $1
WAGE / INCOME GAP [ $ ]
$10,190
FAMILY INCOME DEFICIT
0.41
INEQUALITY / GINI INDEX
25,535
LABOR FORCE [ PEOPLE ]
59.1%
PERCENT IN LABOR FORCE
4.5%
UNEMPLOYMENT RATE
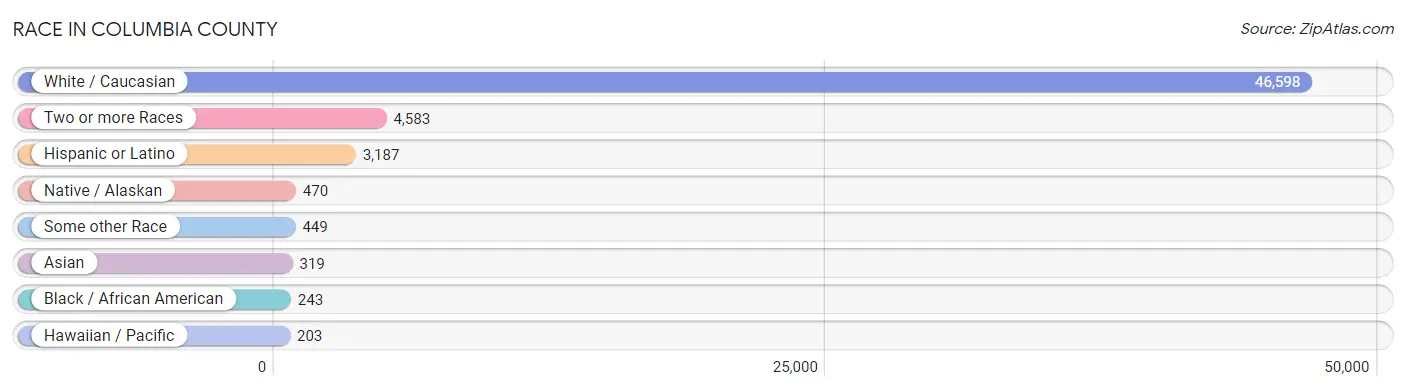
Race in Columbia County
The most populous races in Columbia County are White / Caucasian (46,598 | 88.1%), Two or more Races (4,583 | 8.7%), and Hispanic or Latino (3,187 | 6.0%).
| Race | # Population | % Population |
| Asian | 319 | 0.6% |
| Black / African American | 243 | 0.5% |
| Hawaiian / Pacific | 203 | 0.4% |
| Hispanic or Latino | 3,187 | 6.0% |
| Native / Alaskan | 470 | 0.9% |
| White / Caucasian | 46,598 | 88.1% |
| Two or more Races | 4,583 | 8.7% |
| Some other Race | 449 | 0.9% |
| Total | 52,865 | 100.0% |
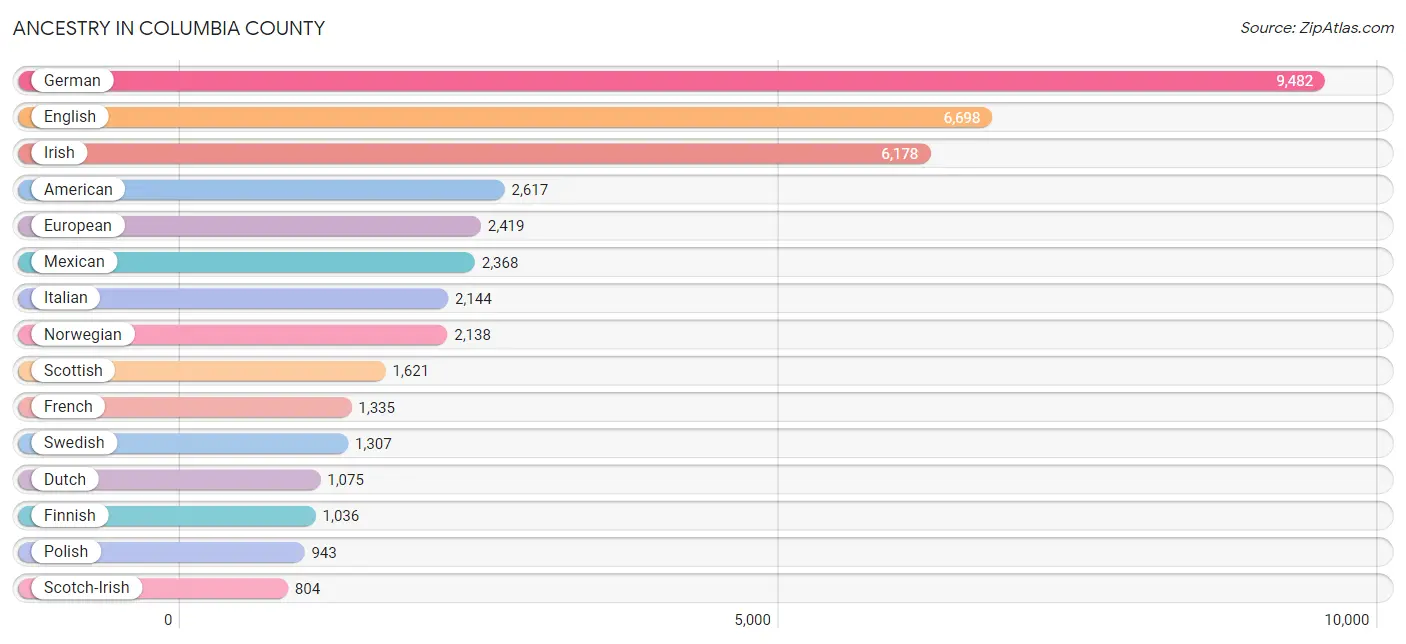
Ancestry in Columbia County
The most populous ancestries reported in Columbia County are German (9,482 | 17.9%), English (6,698 | 12.7%), Irish (6,178 | 11.7%), American (2,617 | 5.0%), and European (2,419 | 4.6%), together accounting for 51.8% of all Columbia County residents.
| Ancestry | # Population | % Population |
| African | 66 | 0.1% |
| Aleut | 43 | 0.1% |
| Alsatian | 32 | 0.1% |
| American | 2,617 | 5.0% |
| Arab | 45 | 0.1% |
| Australian | 85 | 0.2% |
| Austrian | 218 | 0.4% |
| Belgian | 137 | 0.3% |
| Bhutanese | 483 | 0.9% |
| Blackfeet | 13 | 0.0% |
| Bolivian | 27 | 0.1% |
| Brazilian | 33 | 0.1% |
| British | 314 | 0.6% |
| Burmese | 173 | 0.3% |
| Canadian | 307 | 0.6% |
| Celtic | 11 | 0.0% |
| Central American | 192 | 0.4% |
| Cherokee | 317 | 0.6% |
| Chickasaw | 43 | 0.1% |
| Chilean | 24 | 0.1% |
| Chippewa | 161 | 0.3% |
| Choctaw | 26 | 0.1% |
| Colombian | 8 | 0.0% |
| Creek | 27 | 0.1% |
| Croatian | 87 | 0.2% |
| Cuban | 63 | 0.1% |
| Czech | 223 | 0.4% |
| Czechoslovakian | 76 | 0.1% |
| Danish | 374 | 0.7% |
| Dutch | 1,075 | 2.0% |
| Eastern European | 66 | 0.1% |
| Ecuadorian | 7 | 0.0% |
| English | 6,698 | 12.7% |
| European | 2,419 | 4.6% |
| Fijian | 9 | 0.0% |
| Finnish | 1,036 | 2.0% |
| French | 1,335 | 2.5% |
| French Canadian | 475 | 0.9% |
| German | 9,482 | 17.9% |
| Greek | 104 | 0.2% |
| Guamanian / Chamorro | 72 | 0.1% |
| Honduran | 36 | 0.1% |
| Hungarian | 105 | 0.2% |
| Indian (Asian) | 108 | 0.2% |
| Iranian | 5 | 0.0% |
| Irish | 6,178 | 11.7% |
| Iroquois | 27 | 0.1% |
| Italian | 2,144 | 4.1% |
| Japanese | 50 | 0.1% |
| Korean | 308 | 0.6% |
| Latvian | 50 | 0.1% |
| Lebanese | 38 | 0.1% |
| Lithuanian | 52 | 0.1% |
| Malaysian | 26 | 0.1% |
| Marshallese | 8 | 0.0% |
| Mexican | 2,368 | 4.5% |
| Mexican American Indian | 32 | 0.1% |
| Native Hawaiian | 22 | 0.0% |
| Navajo | 4 | 0.0% |
| Nicaraguan | 102 | 0.2% |
| Nigerian | 21 | 0.0% |
| Northern European | 154 | 0.3% |
| Norwegian | 2,138 | 4.0% |
| Pakistani | 37 | 0.1% |
| Palestinian | 7 | 0.0% |
| Panamanian | 43 | 0.1% |
| Pennsylvania German | 12 | 0.0% |
| Peruvian | 31 | 0.1% |
| Polish | 943 | 1.8% |
| Portuguese | 206 | 0.4% |
| Potawatomi | 5 | 0.0% |
| Puerto Rican | 154 | 0.3% |
| Puget Sound Salish | 3 | 0.0% |
| Romanian | 16 | 0.0% |
| Russian | 257 | 0.5% |
| Salvadoran | 11 | 0.0% |
| Scandinavian | 629 | 1.2% |
| Scotch-Irish | 804 | 1.5% |
| Scottish | 1,621 | 3.1% |
| Sioux | 143 | 0.3% |
| Slavic | 22 | 0.0% |
| Slovak | 28 | 0.1% |
| Slovene | 16 | 0.0% |
| South African | 5 | 0.0% |
| South American | 97 | 0.2% |
| Spaniard | 48 | 0.1% |
| Spanish | 131 | 0.3% |
| Sri Lankan | 35 | 0.1% |
| Subsaharan African | 92 | 0.2% |
| Swedish | 1,307 | 2.5% |
| Swiss | 518 | 1.0% |
| Thai | 29 | 0.1% |
| Tsimshian | 7 | 0.0% |
| Turkish | 5 | 0.0% |
| Ukrainian | 38 | 0.1% |
| Welsh | 691 | 1.3% |
| Yakama | 8 | 0.0% |
| Yaqui | 35 | 0.1% |
| Yugoslavian | 161 | 0.3% | View All 99 Rows |
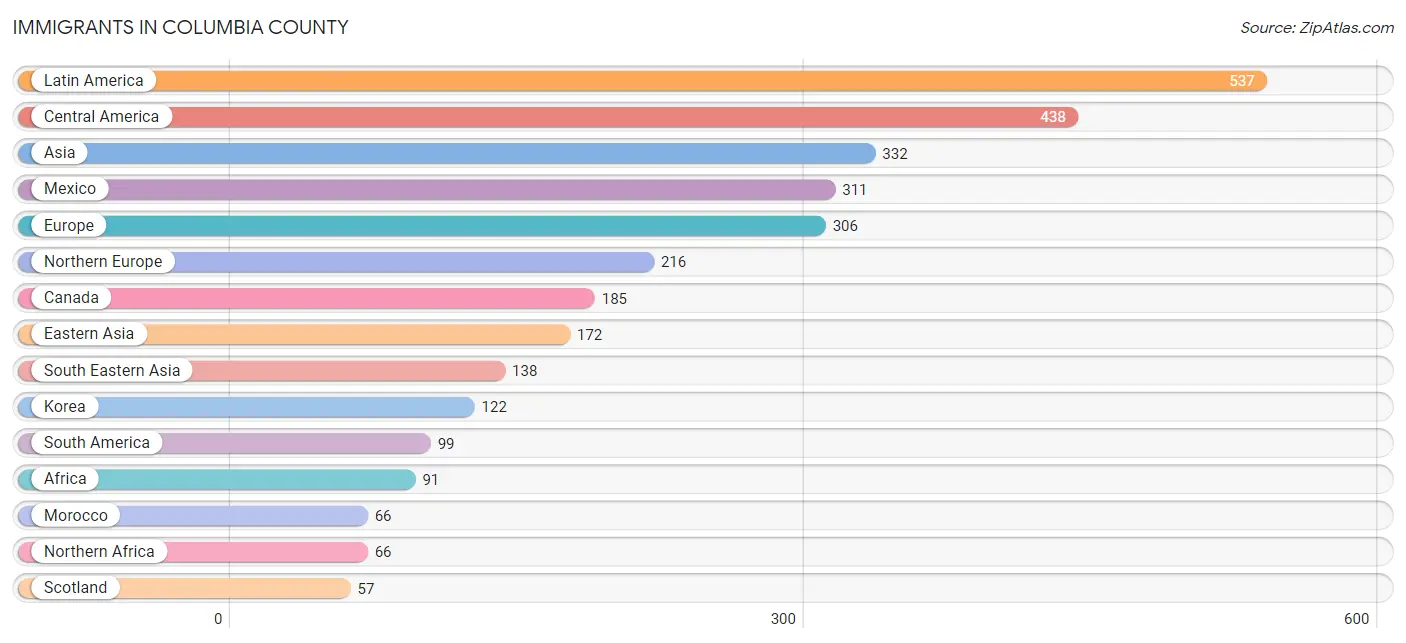
Immigrants in Columbia County
The most numerous immigrant groups reported in Columbia County came from Latin America (537 | 1.0%), Central America (438 | 0.8%), Asia (332 | 0.6%), Mexico (311 | 0.6%), and Europe (306 | 0.6%), together accounting for 3.7% of all Columbia County residents.
| Immigration Origin | # Population | % Population |
| Africa | 91 | 0.2% |
| Argentina | 25 | 0.1% |
| Asia | 332 | 0.6% |
| Australia | 23 | 0.0% |
| Belgium | 22 | 0.0% |
| Bolivia | 27 | 0.1% |
| Brazil | 12 | 0.0% |
| Cambodia | 33 | 0.1% |
| Canada | 185 | 0.4% |
| Central America | 438 | 0.8% |
| Chile | 27 | 0.1% |
| China | 20 | 0.0% |
| Czechoslovakia | 17 | 0.0% |
| Eastern Asia | 172 | 0.3% |
| Eastern Europe | 48 | 0.1% |
| England | 33 | 0.1% |
| Europe | 306 | 0.6% |
| Fiji | 6 | 0.0% |
| Germany | 20 | 0.0% |
| Honduras | 36 | 0.1% |
| India | 17 | 0.0% |
| Iran | 5 | 0.0% |
| Ireland | 26 | 0.1% |
| Japan | 30 | 0.1% |
| Korea | 122 | 0.2% |
| Latin America | 537 | 1.0% |
| Mexico | 311 | 0.6% |
| Morocco | 66 | 0.1% |
| Nicaragua | 55 | 0.1% |
| Nigeria | 21 | 0.0% |
| Northern Africa | 66 | 0.1% |
| Northern Europe | 216 | 0.4% |
| Oceania | 29 | 0.1% |
| Panama | 36 | 0.1% |
| Philippines | 48 | 0.1% |
| Scotland | 57 | 0.1% |
| South Africa | 4 | 0.0% |
| South America | 99 | 0.2% |
| South Central Asia | 22 | 0.0% |
| South Eastern Asia | 138 | 0.3% |
| Sweden | 4 | 0.0% |
| Thailand | 22 | 0.0% |
| Venezuela | 8 | 0.0% |
| Vietnam | 35 | 0.1% |
| Western Africa | 21 | 0.0% |
| Western Europe | 42 | 0.1% | View All 46 Rows |
Sex and Age in Columbia County
Sex and Age in Columbia County
The most populous age groups in Columbia County are 55 to 59 Years (1,988 | 7.4%) for men and 60 to 64 Years (2,173 | 8.4%) for women.
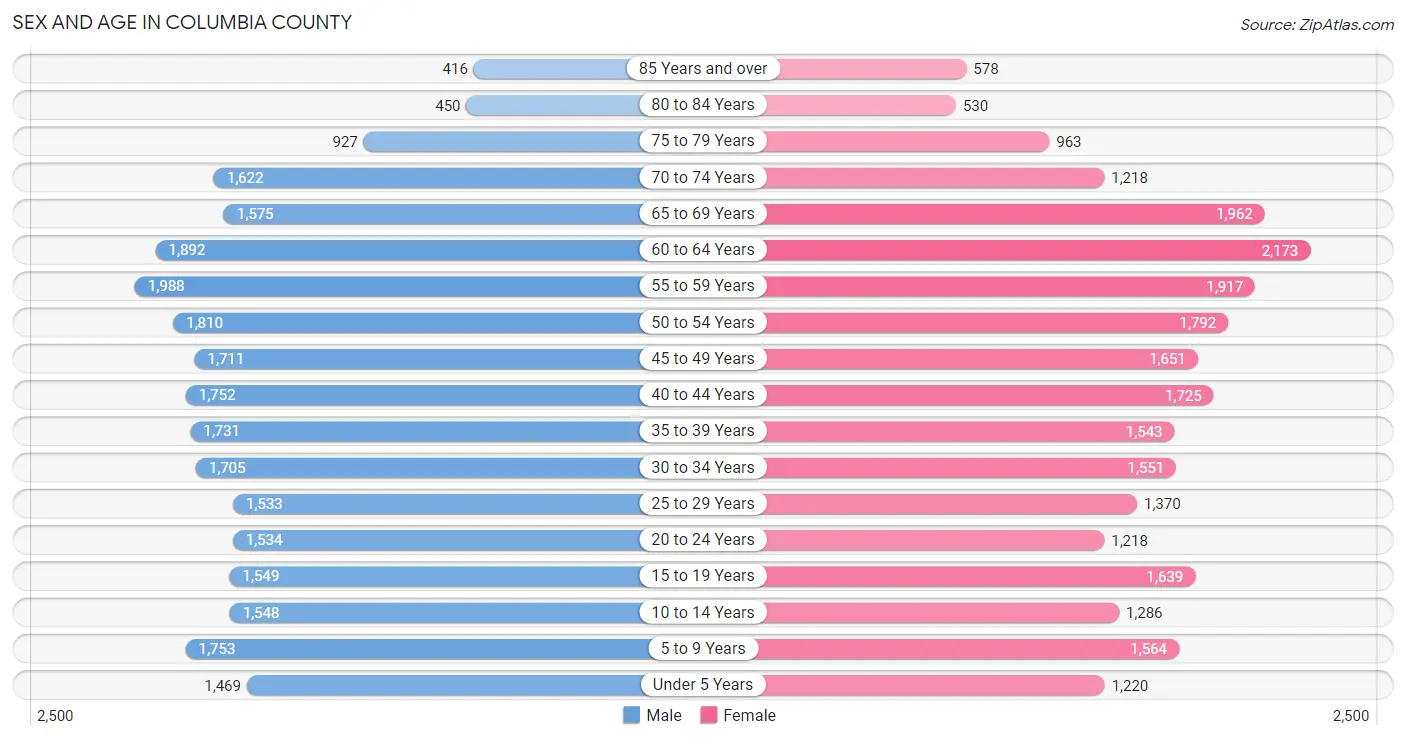
| Age Bracket | Male | Female |
| Under 5 Years | 1,469 (5.4%) | 1,220 (4.7%) |
| 5 to 9 Years | 1,753 (6.5%) | 1,564 (6.0%) |
| 10 to 14 Years | 1,548 (5.7%) | 1,286 (5.0%) |
| 15 to 19 Years | 1,549 (5.7%) | 1,639 (6.3%) |
| 20 to 24 Years | 1,534 (5.7%) | 1,218 (4.7%) |
| 25 to 29 Years | 1,533 (5.7%) | 1,370 (5.3%) |
| 30 to 34 Years | 1,705 (6.3%) | 1,551 (6.0%) |
| 35 to 39 Years | 1,731 (6.4%) | 1,543 (6.0%) |
| 40 to 44 Years | 1,752 (6.5%) | 1,725 (6.7%) |
| 45 to 49 Years | 1,711 (6.4%) | 1,651 (6.4%) |
| 50 to 54 Years | 1,810 (6.7%) | 1,792 (6.9%) |
| 55 to 59 Years | 1,988 (7.4%) | 1,917 (7.4%) |
| 60 to 64 Years | 1,892 (7.0%) | 2,173 (8.4%) |
| 65 to 69 Years | 1,575 (5.8%) | 1,962 (7.6%) |
| 70 to 74 Years | 1,622 (6.0%) | 1,218 (4.7%) |
| 75 to 79 Years | 927 (3.4%) | 963 (3.7%) |
| 80 to 84 Years | 450 (1.7%) | 530 (2.1%) |
| 85 Years and over | 416 (1.5%) | 578 (2.2%) |
| Total | 26,965 (100.0%) | 25,900 (100.0%) |
Families and Households in Columbia County
Median Family Size in Columbia County
The median family size in Columbia County is 2.99 persons per family, with single female/mother families (1,970 | 14.0%) accounting for the largest median family size of 3.08 persons per family. On the other hand, single male/father families (1,181 | 8.4%) represent the smallest median family size with 2.56 persons per family.
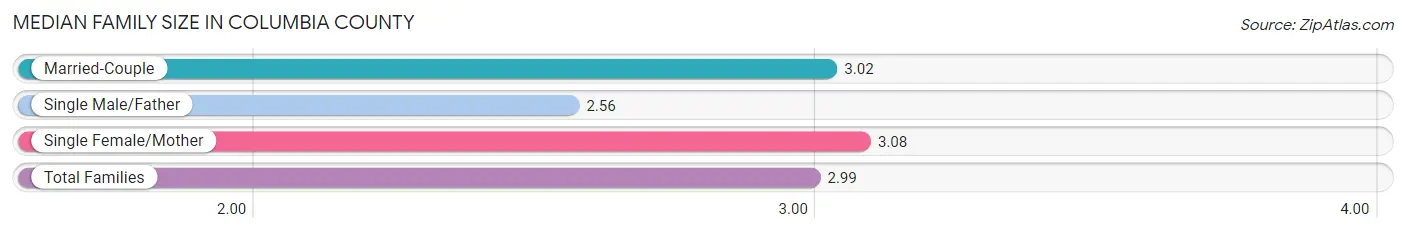
| Family Type | # Families | Family Size |
| Married-Couple | 10,917 (77.6%) | 3.02 |
| Single Male/Father | 1,181 (8.4%) | 2.56 |
| Single Female/Mother | 1,970 (14.0%) | 3.08 |
| Total Families | 14,068 (100.0%) | 2.99 |
Median Household Size in Columbia County
The median household size in Columbia County is 2.58 persons per household, with single female/mother households (1,970 | 9.7%) accounting for the largest median household size of 3.47 persons per household. non-family households (6,267 | 30.8%) represent the smallest median household size with 1.32 persons per household.
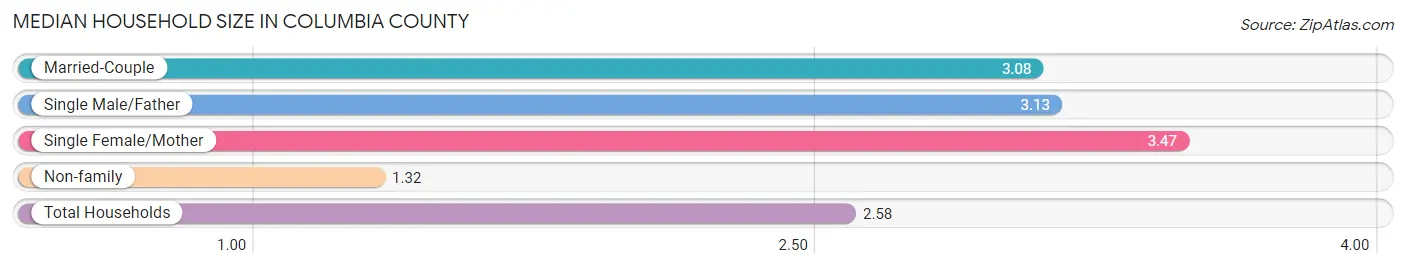
| Household Type | # Households | Household Size |
| Married-Couple | 10,917 (53.7%) | 3.08 |
| Single Male/Father | 1,181 (5.8%) | 3.13 |
| Single Female/Mother | 1,970 (9.7%) | 3.47 |
| Non-family | 6,267 (30.8%) | 1.32 |
| Total Households | 20,335 (100.0%) | 2.58 |
Household Size by Marriage Status in Columbia County
Out of a total of 20,335 households in Columbia County, 14,068 (69.2%) are family households, while 6,267 (30.8%) are nonfamily households. The most numerous type of family households are 2-person households, comprising 6,312, and the most common type of nonfamily households are 1-person households, comprising 4,721.
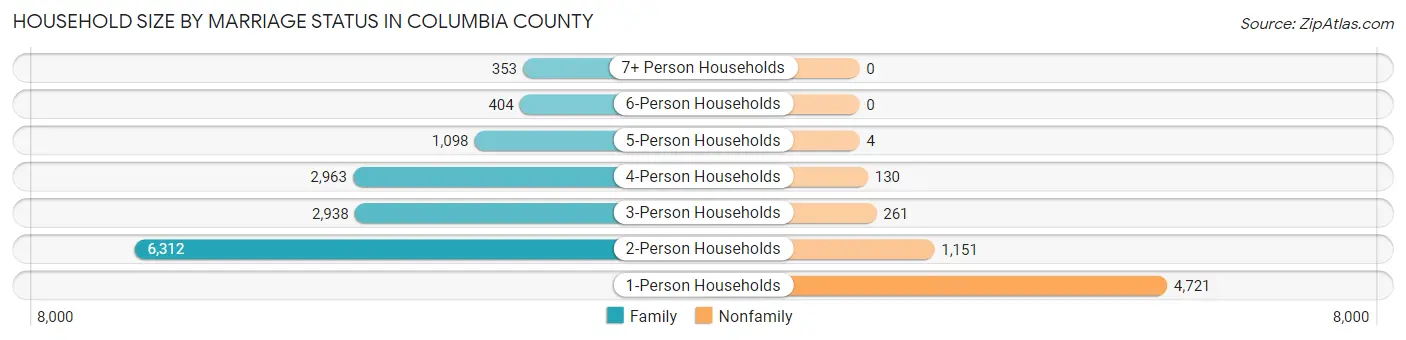
| Household Size | Family Households | Nonfamily Households |
| 1-Person Households | - | 4,721 (23.2%) |
| 2-Person Households | 6,312 (31.0%) | 1,151 (5.7%) |
| 3-Person Households | 2,938 (14.4%) | 261 (1.3%) |
| 4-Person Households | 2,963 (14.6%) | 130 (0.6%) |
| 5-Person Households | 1,098 (5.4%) | 4 (0.0%) |
| 6-Person Households | 404 (2.0%) | 0 (0.0%) |
| 7+ Person Households | 353 (1.7%) | 0 (0.0%) |
| Total | 14,068 (69.2%) | 6,267 (30.8%) |
Female Fertility in Columbia County
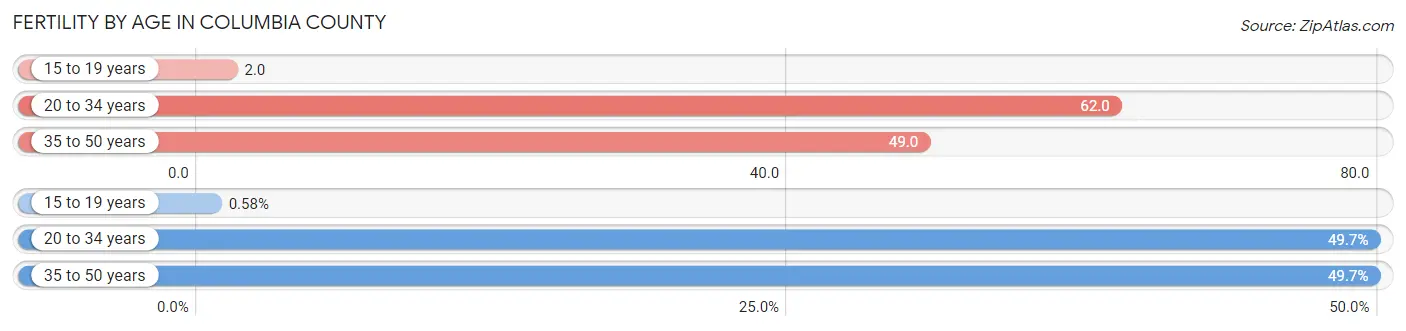
Fertility by Age in Columbia County
Average fertility rate in Columbia County is 47.0 births per 1,000 women. Women in the age bracket of 20 to 34 years have the highest fertility rate with 62.0 births per 1,000 women. Women in the age bracket of 20 to 34 years acount for 49.7% of all women with births.
| Age Bracket | Women with Births | Births / 1,000 Women |
| 15 to 19 years | 3 (0.6%) | 2.0 |
| 20 to 34 years | 257 (49.7%) | 62.0 |
| 35 to 50 years | 257 (49.7%) | 49.0 |
| Total | 517 (100.0%) | 47.0 |
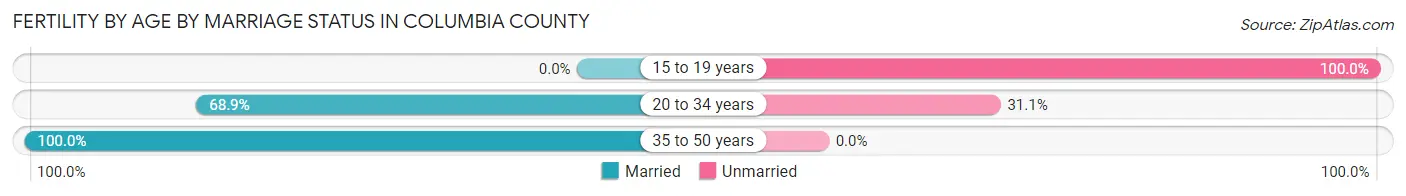
Fertility by Age by Marriage Status in Columbia County
83.9% of women with births (517) in Columbia County are married. The highest percentage of unmarried women with births falls into 15 to 19 years age bracket with 100.0% of them unmarried at the time of birth, while the lowest percentage of unmarried women with births belong to 35 to 50 years age bracket with 0.0% of them unmarried.
| Age Bracket | Married | Unmarried |
| 15 to 19 years | 0 (0.0%) | 3 (100.0%) |
| 20 to 34 years | 177 (68.9%) | 80 (31.1%) |
| 35 to 50 years | 257 (100.0%) | 0 (0.0%) |
| Total | 434 (84.0%) | 83 (16.1%) |
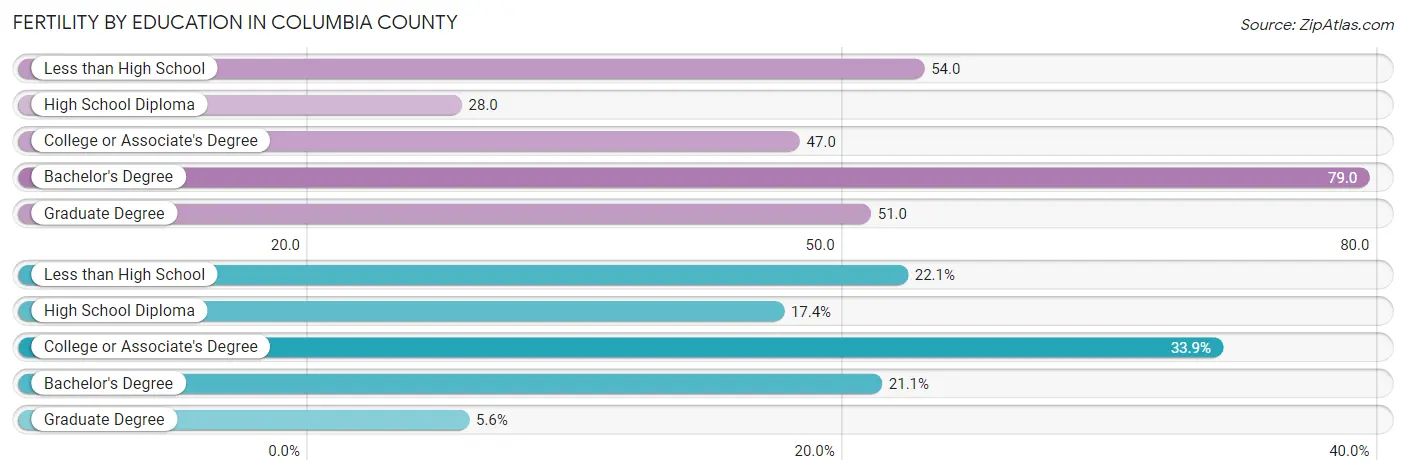
Fertility by Education in Columbia County
Average fertility rate in Columbia County is 47.0 births per 1,000 women. Women with the education attainment of bachelor's degree have the highest fertility rate of 79.0 births per 1,000 women, while women with the education attainment of high school diploma have the lowest fertility at 28.0 births per 1,000 women. Women with the education attainment of college or associate's degree represent 33.9% of all women with births.
| Educational Attainment | Women with Births | Births / 1,000 Women |
| Less than High School | 114 (22.1%) | 54.0 |
| High School Diploma | 90 (17.4%) | 28.0 |
| College or Associate's Degree | 175 (33.9%) | 47.0 |
| Bachelor's Degree | 109 (21.1%) | 79.0 |
| Graduate Degree | 29 (5.6%) | 51.0 |
| Total | 517 (100.0%) | 47.0 |
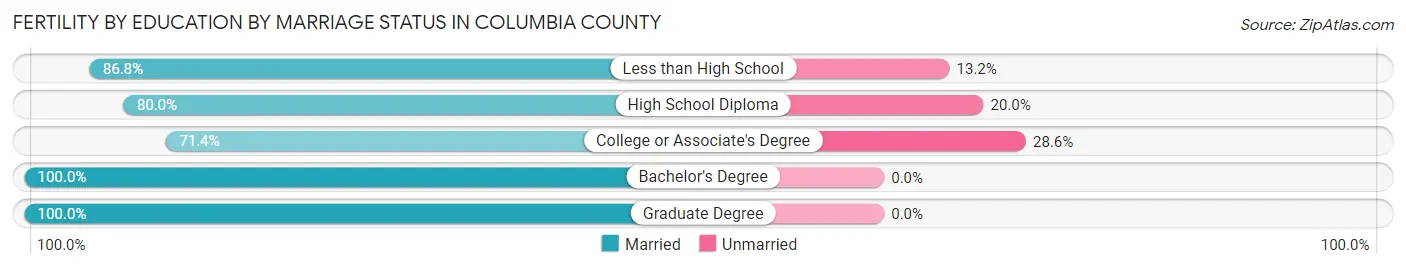
Fertility by Education by Marriage Status in Columbia County
16.1% of women with births in Columbia County are unmarried. Women with the educational attainment of bachelor's degree are most likely to be married with 100.0% of them married at childbirth, while women with the educational attainment of college or associate's degree are least likely to be married with 28.6% of them unmarried at childbirth.
| Educational Attainment | Married | Unmarried |
| Less than High School | 99 (86.8%) | 15 (13.2%) |
| High School Diploma | 72 (80.0%) | 18 (20.0%) |
| College or Associate's Degree | 125 (71.4%) | 50 (28.6%) |
| Bachelor's Degree | 109 (100.0%) | 0 (0.0%) |
| Graduate Degree | 29 (100.0%) | 0 (0.0%) |
| Total | 434 (84.0%) | 83 (16.1%) |
Income in Columbia County
Income Overview in Columbia County
Per Capita Income in Columbia County is $37,986, while median incomes of families and households are $94,162 and $83,265 respectively.
| Characteristic | Number | Measure |
| Per Capita Income | 52,865 | $37,986 |
| Median Family Income | 14,068 | $94,162 |
| Mean Family Income | 14,068 | $112,011 |
| Median Household Income | 20,335 | $83,265 |
| Mean Household Income | 20,335 | $98,502 |
| Income Deficit | 14,068 | $10,190 |
| Wage / Income Gap (%) | 52,865 | 38.52% |
| Wage / Income Gap ($) | 52,865 | 61.48¢ per $1 |
| Gini / Inequality Index | 52,865 | 0.41 |
Earnings by Sex in Columbia County
Average Earnings in Columbia County are $43,367, $53,786 for men and $33,069 for women, a difference of 38.5%.
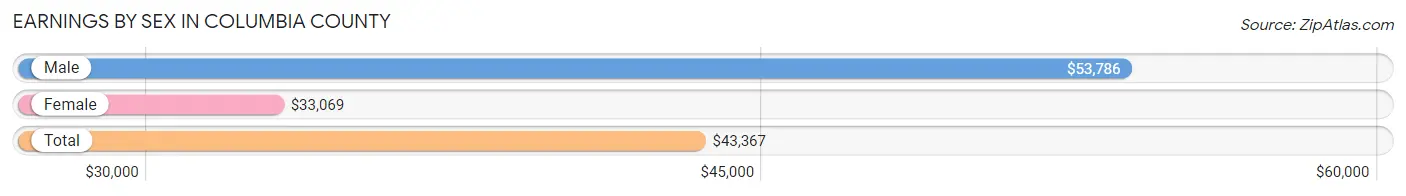
| Sex | Number | Average Earnings |
| Male | 14,883 (55.8%) | $53,786 |
| Female | 11,791 (44.2%) | $33,069 |
| Total | 26,674 (100.0%) | $43,367 |
Earnings by Sex by Income Bracket in Columbia County
The most common earnings brackets in Columbia County are $100,000+ for men (2,658 | 17.9%) and $25,000 to $29,999 for women (1,060 | 9.0%).
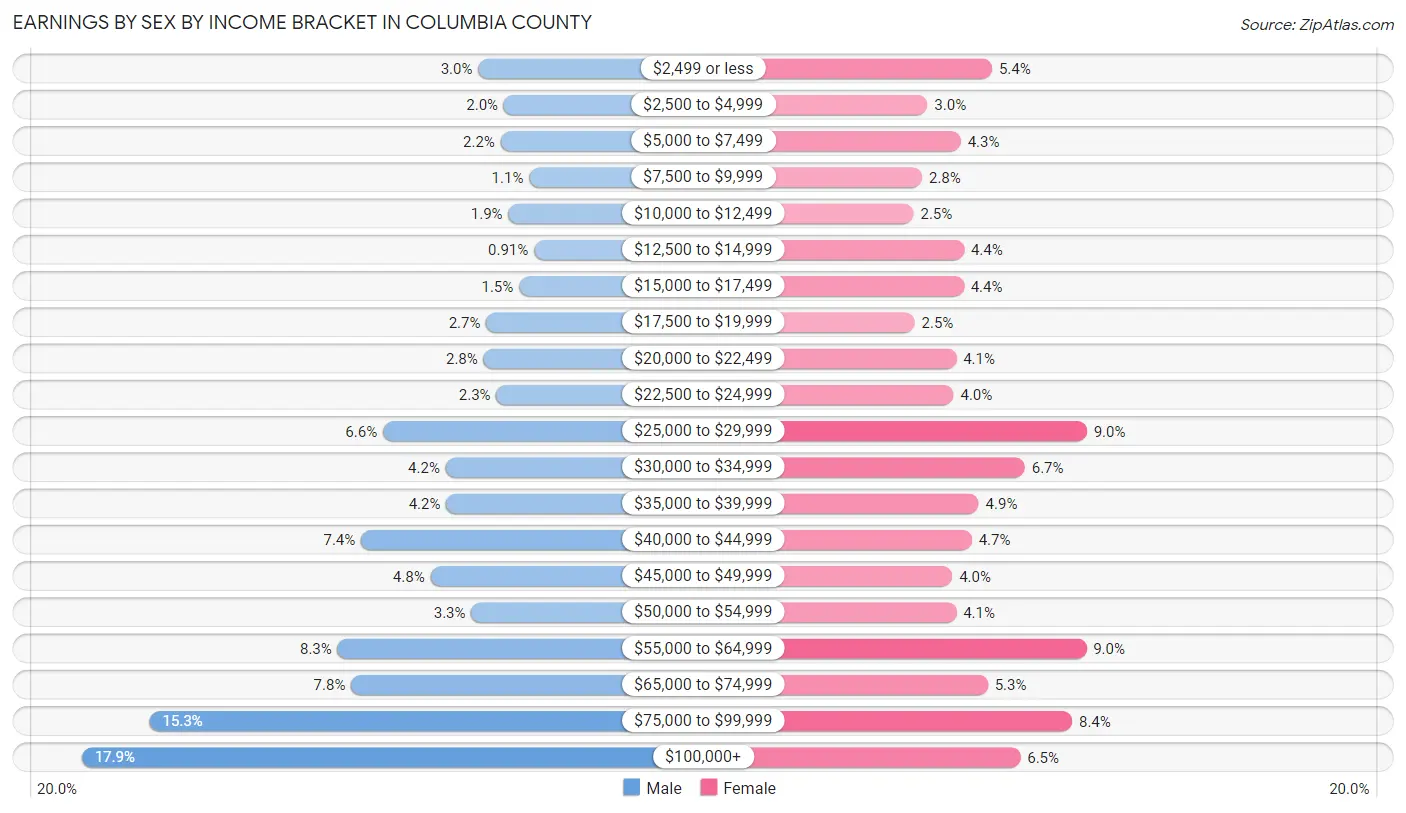
| Income | Male | Female |
| $2,499 or less | 446 (3.0%) | 642 (5.4%) |
| $2,500 to $4,999 | 303 (2.0%) | 356 (3.0%) |
| $5,000 to $7,499 | 321 (2.2%) | 503 (4.3%) |
| $7,500 to $9,999 | 162 (1.1%) | 333 (2.8%) |
| $10,000 to $12,499 | 278 (1.9%) | 295 (2.5%) |
| $12,500 to $14,999 | 136 (0.9%) | 518 (4.4%) |
| $15,000 to $17,499 | 219 (1.5%) | 516 (4.4%) |
| $17,500 to $19,999 | 402 (2.7%) | 299 (2.5%) |
| $20,000 to $22,499 | 417 (2.8%) | 484 (4.1%) |
| $22,500 to $24,999 | 346 (2.3%) | 472 (4.0%) |
| $25,000 to $29,999 | 978 (6.6%) | 1,060 (9.0%) |
| $30,000 to $34,999 | 628 (4.2%) | 786 (6.7%) |
| $35,000 to $39,999 | 625 (4.2%) | 582 (4.9%) |
| $40,000 to $44,999 | 1,100 (7.4%) | 552 (4.7%) |
| $45,000 to $49,999 | 713 (4.8%) | 466 (4.0%) |
| $50,000 to $54,999 | 485 (3.3%) | 484 (4.1%) |
| $55,000 to $64,999 | 1,231 (8.3%) | 1,058 (9.0%) |
| $65,000 to $74,999 | 1,155 (7.8%) | 623 (5.3%) |
| $75,000 to $99,999 | 2,280 (15.3%) | 995 (8.4%) |
| $100,000+ | 2,658 (17.9%) | 767 (6.5%) |
| Total | 14,883 (100.0%) | 11,791 (100.0%) |
Earnings by Sex by Educational Attainment in Columbia County
Average earnings in Columbia County are $59,800 for men and $36,197 for women, a difference of 39.5%. Men with an educational attainment of graduate degree enjoy the highest average annual earnings of $89,196, while those with less than high school education earn the least with $41,954. Women with an educational attainment of graduate degree earn the most with the average annual earnings of $77,734, while those with less than high school education have the smallest earnings of $28,458.
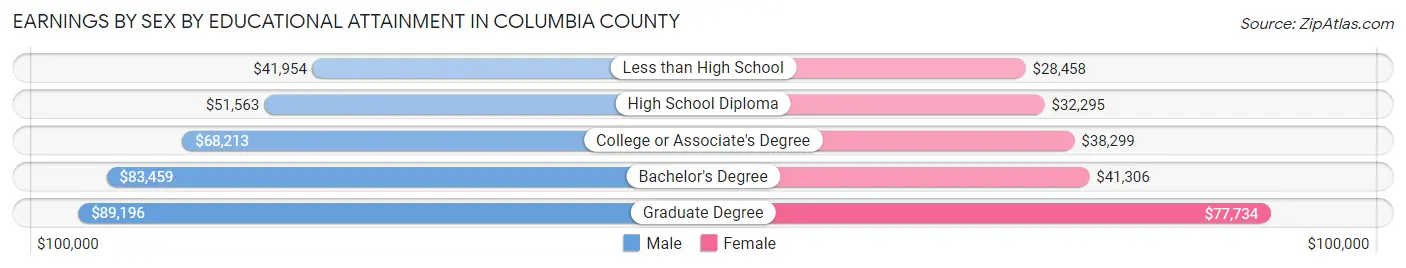
| Educational Attainment | Male Income | Female Income |
| Less than High School | $41,954 | $28,458 |
| High School Diploma | $51,563 | $32,295 |
| College or Associate's Degree | $68,213 | $38,299 |
| Bachelor's Degree | $83,459 | $41,306 |
| Graduate Degree | $89,196 | $77,734 |
| Total | $59,800 | $36,197 |
Family Income in Columbia County
Family Income Brackets in Columbia County
According to the Columbia County family income data, there are 3,700 families falling into the $100,000 to $149,999 income range, which is the most common income bracket and makes up 26.3% of all families. Conversely, the $10,000 to $14,999 income bracket is the least frequent group with only 169 families (1.2%) belonging to this category.
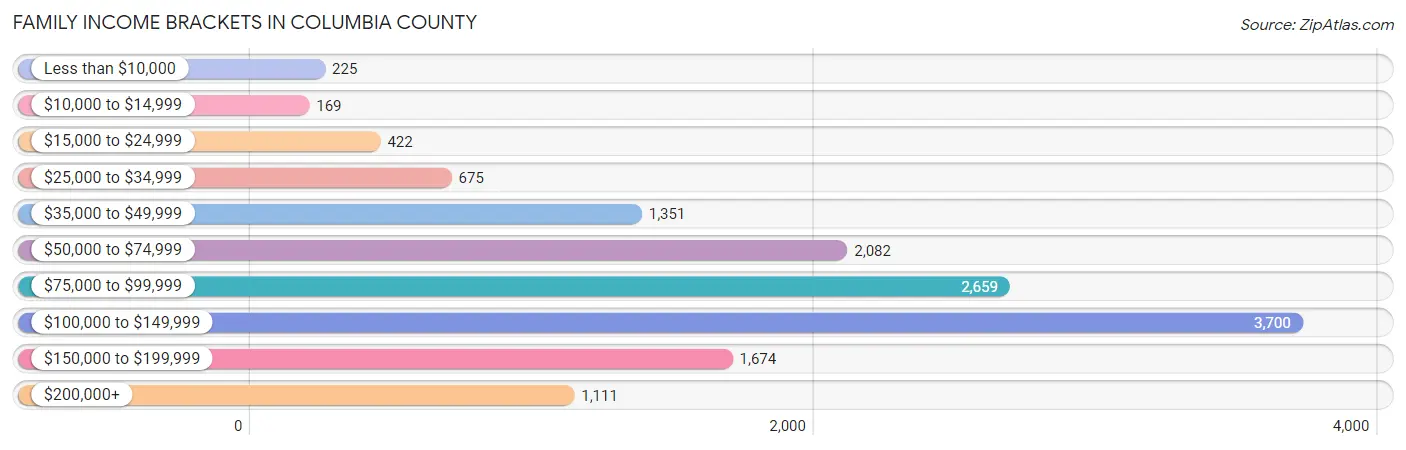
| Income Bracket | # Families | % Families |
| Less than $10,000 | 225 | 1.6% |
| $10,000 to $14,999 | 169 | 1.2% |
| $15,000 to $24,999 | 422 | 3.0% |
| $25,000 to $34,999 | 675 | 4.8% |
| $35,000 to $49,999 | 1,351 | 9.6% |
| $50,000 to $74,999 | 2,082 | 14.8% |
| $75,000 to $99,999 | 2,659 | 18.9% |
| $100,000 to $149,999 | 3,700 | 26.3% |
| $150,000 to $199,999 | 1,674 | 11.9% |
| $200,000+ | 1,111 | 7.9% |
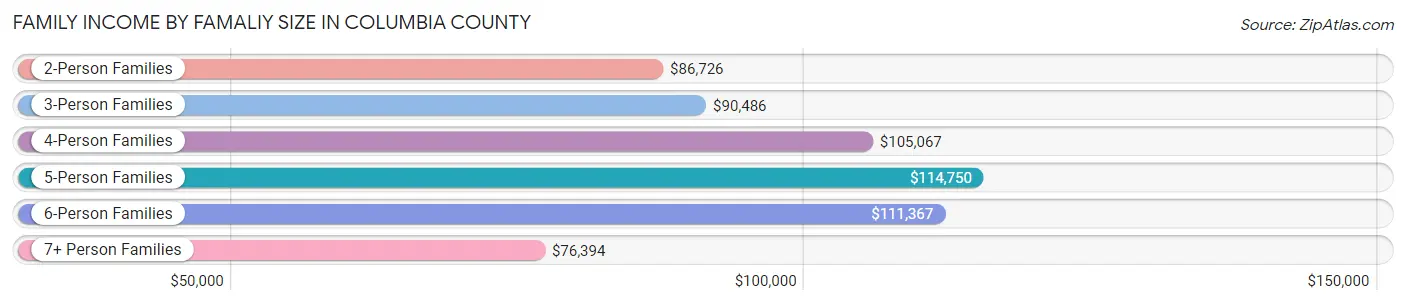
Family Income by Famaliy Size in Columbia County
5-person families (883 | 6.3%) account for the highest median family income in Columbia County with $114,750 per family, while 2-person families (6,879 | 48.9%) have the highest median income of $43,363 per family member.
| Income Bracket | # Families | Median Income |
| 2-Person Families | 6,879 (48.9%) | $86,726 |
| 3-Person Families | 2,983 (21.2%) | $90,486 |
| 4-Person Families | 2,688 (19.1%) | $105,067 |
| 5-Person Families | 883 (6.3%) | $114,750 |
| 6-Person Families | 476 (3.4%) | $111,367 |
| 7+ Person Families | 159 (1.1%) | $76,394 |
| Total | 14,068 (100.0%) | $94,162 |
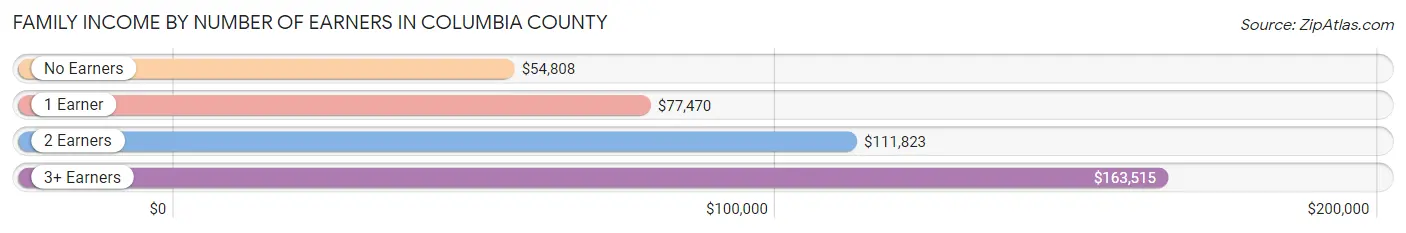
Family Income by Number of Earners in Columbia County
The median family income in Columbia County is $94,162, with families comprising 3+ earners (1,789) having the highest median family income of $163,515, while families with no earners (2,734) have the lowest median family income of $54,808, accounting for 12.7% and 19.4% of families, respectively.
| Number of Earners | # Families | Median Income |
| No Earners | 2,734 (19.4%) | $54,808 |
| 1 Earner | 4,493 (31.9%) | $77,470 |
| 2 Earners | 5,052 (35.9%) | $111,823 |
| 3+ Earners | 1,789 (12.7%) | $163,515 |
| Total | 14,068 (100.0%) | $94,162 |
Household Income in Columbia County
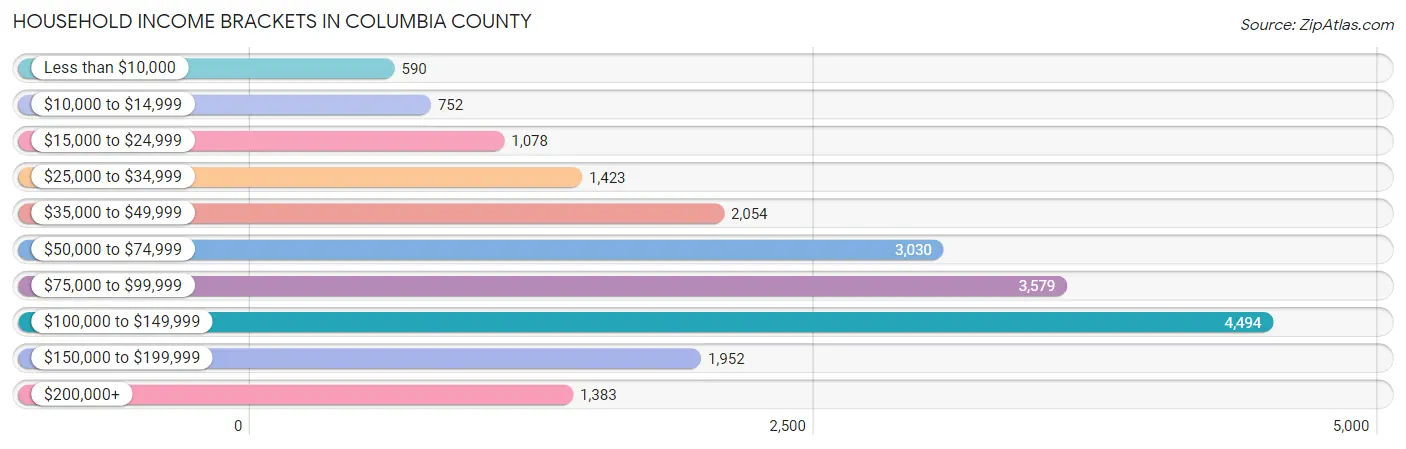
Household Income Brackets in Columbia County
With 4,494 households falling in the category, the $100,000 to $149,999 income range is the most frequent in Columbia County, accounting for 22.1% of all households. In contrast, only 590 households (2.9%) fall into the less than $10,000 income bracket, making it the least populous group.
| Income Bracket | # Households | % Households |
| Less than $10,000 | 590 | 2.9% |
| $10,000 to $14,999 | 752 | 3.7% |
| $15,000 to $24,999 | 1,078 | 5.3% |
| $25,000 to $34,999 | 1,423 | 7.0% |
| $35,000 to $49,999 | 2,054 | 10.1% |
| $50,000 to $74,999 | 3,030 | 14.9% |
| $75,000 to $99,999 | 3,579 | 17.6% |
| $100,000 to $149,999 | 4,494 | 22.1% |
| $150,000 to $199,999 | 1,952 | 9.6% |
| $200,000+ | 1,383 | 6.8% |
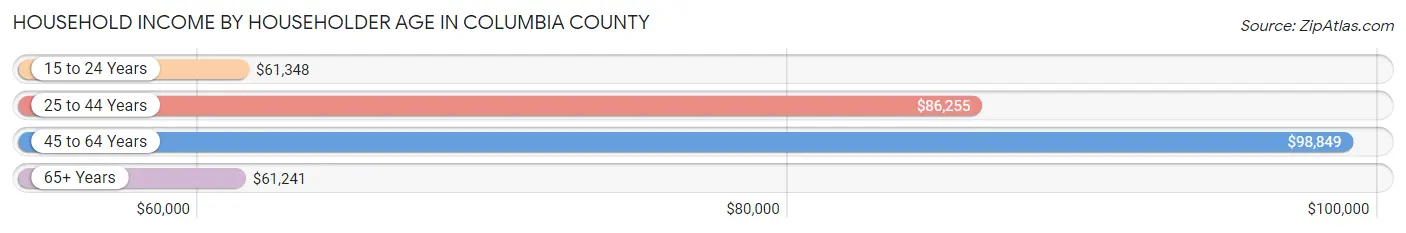
Household Income by Householder Age in Columbia County
The median household income in Columbia County is $83,265, with the highest median household income of $98,849 found in the 45 to 64 years age bracket for the primary householder. A total of 8,085 households (39.8%) fall into this category. Meanwhile, the 65+ years age bracket for the primary householder has the lowest median household income of $61,241, with 6,039 households (29.7%) in this group.
| Income Bracket | # Households | Median Income |
| 15 to 24 Years | 525 (2.6%) | $61,348 |
| 25 to 44 Years | 5,686 (28.0%) | $86,255 |
| 45 to 64 Years | 8,085 (39.8%) | $98,849 |
| 65+ Years | 6,039 (29.7%) | $61,241 |
| Total | 20,335 (100.0%) | $83,265 |
Poverty in Columbia County
Income Below Poverty by Sex and Age in Columbia County
With 7.3% poverty level for males and 11.0% for females among the residents of Columbia County, 15 year old males and 5 year old females are the most vulnerable to poverty, with 74 males (22.0%) and 37 females (22.8%) in their respective age groups living below the poverty level.
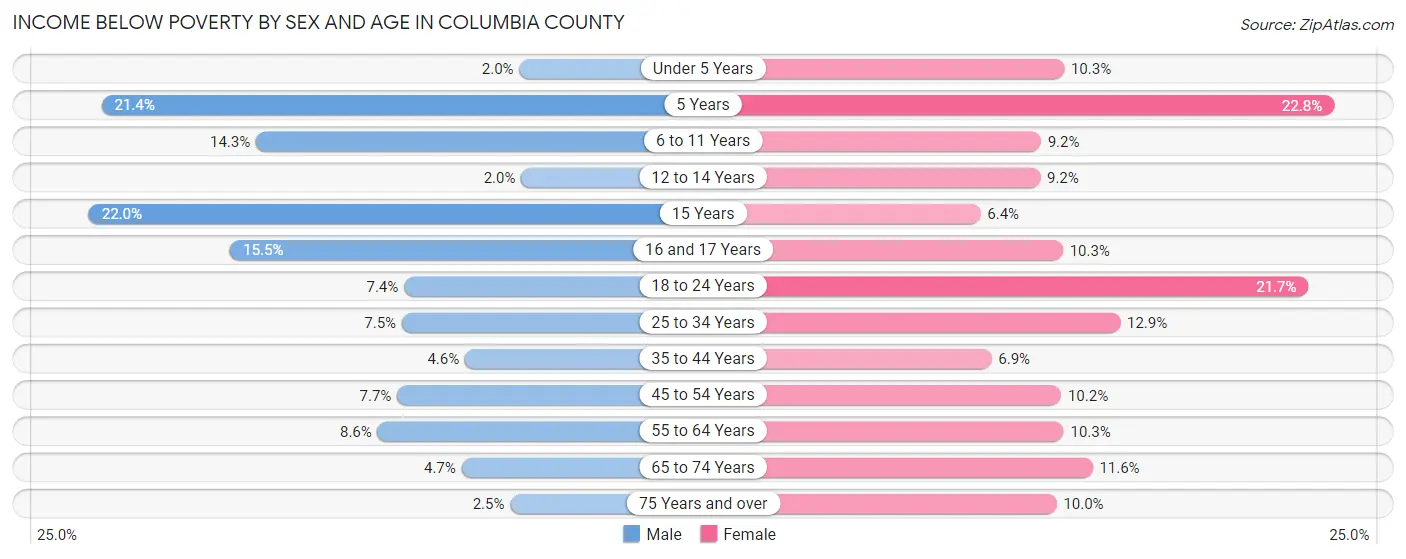
| Age Bracket | Male | Female |
| Under 5 Years | 28 (2.0%) | 120 (10.3%) |
| 5 Years | 78 (21.4%) | 37 (22.8%) |
| 6 to 11 Years | 303 (14.3%) | 155 (9.2%) |
| 12 to 14 Years | 14 (1.9%) | 76 (9.2%) |
| 15 Years | 74 (22.0%) | 31 (6.4%) |
| 16 and 17 Years | 100 (15.5%) | 54 (10.2%) |
| 18 to 24 Years | 153 (7.4%) | 400 (21.6%) |
| 25 to 34 Years | 238 (7.5%) | 377 (12.9%) |
| 35 to 44 Years | 157 (4.6%) | 226 (6.9%) |
| 45 to 54 Years | 270 (7.7%) | 350 (10.2%) |
| 55 to 64 Years | 333 (8.6%) | 420 (10.3%) |
| 65 to 74 Years | 150 (4.7%) | 369 (11.6%) |
| 75 Years and over | 44 (2.5%) | 203 (10.0%) |
| Total | 1,942 (7.3%) | 2,818 (11.0%) |
Income Above Poverty by Sex and Age in Columbia County
According to the poverty statistics in Columbia County, males aged 12 to 14 years and females aged 15 years are the age groups that are most secure financially, with 98.1% of males and 93.6% of females in these age groups living above the poverty line.
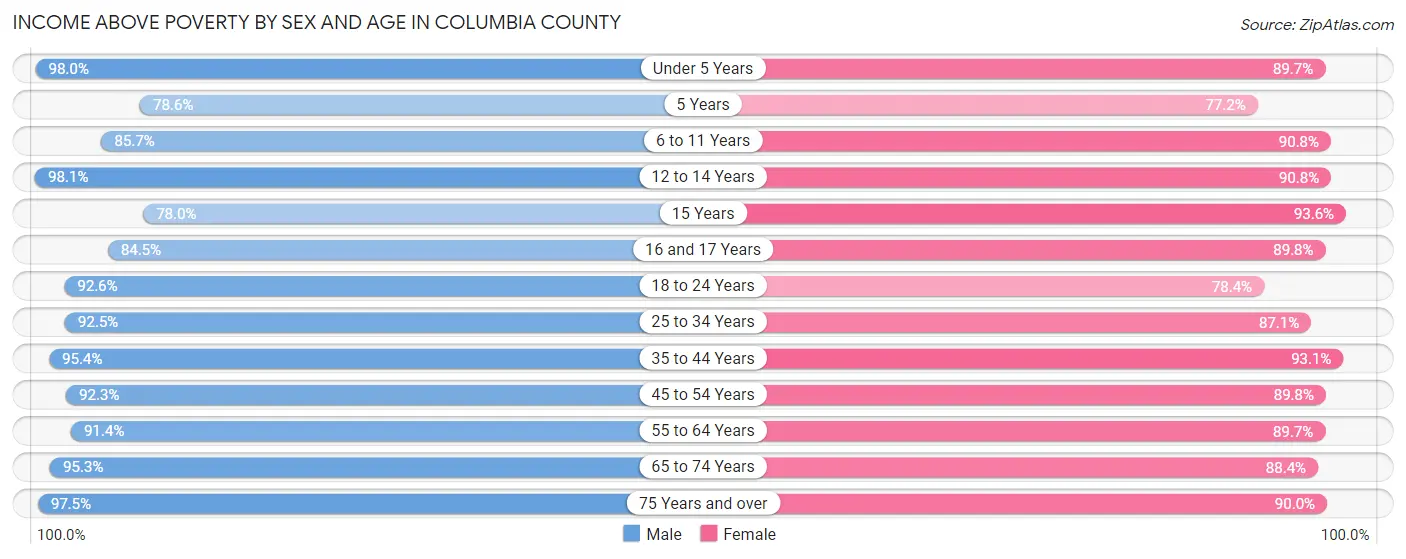
| Age Bracket | Male | Female |
| Under 5 Years | 1,347 (98.0%) | 1,044 (89.7%) |
| 5 Years | 286 (78.6%) | 125 (77.2%) |
| 6 to 11 Years | 1,822 (85.7%) | 1,525 (90.8%) |
| 12 to 14 Years | 703 (98.1%) | 750 (90.8%) |
| 15 Years | 262 (78.0%) | 451 (93.6%) |
| 16 and 17 Years | 547 (84.5%) | 473 (89.7%) |
| 18 to 24 Years | 1,916 (92.6%) | 1,448 (78.3%) |
| 25 to 34 Years | 2,940 (92.5%) | 2,544 (87.1%) |
| 35 to 44 Years | 3,285 (95.4%) | 3,032 (93.1%) |
| 45 to 54 Years | 3,232 (92.3%) | 3,093 (89.8%) |
| 55 to 64 Years | 3,528 (91.4%) | 3,663 (89.7%) |
| 65 to 74 Years | 3,028 (95.3%) | 2,803 (88.4%) |
| 75 Years and over | 1,748 (97.5%) | 1,835 (90.0%) |
| Total | 24,644 (92.7%) | 22,786 (89.0%) |
Income Below Poverty Among Married-Couple Families in Columbia County
The poverty statistics for married-couple families in Columbia County show that 2.2% or 245 of the total 10,917 families live below the poverty line. Families with 5 or more children have the highest poverty rate of 61.9%, comprising of 26 families. On the other hand, families with 1 or 2 children have the lowest poverty rate of 1.3%, which includes 38 families.
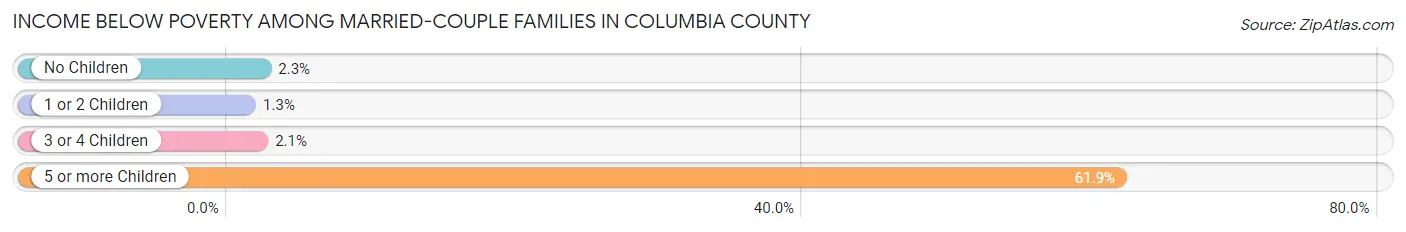
| Children | Above Poverty | Below Poverty |
| No Children | 7,072 (97.7%) | 168 (2.3%) |
| 1 or 2 Children | 2,977 (98.7%) | 38 (1.3%) |
| 3 or 4 Children | 607 (97.9%) | 13 (2.1%) |
| 5 or more Children | 16 (38.1%) | 26 (61.9%) |
| Total | 10,672 (97.8%) | 245 (2.2%) |
Income Below Poverty Among Single-Parent Households in Columbia County
According to the poverty data in Columbia County, 3.4% or 40 single-father households and 18.8% or 371 single-mother households are living below the poverty line. Among single-father households, those with no children have the highest poverty rate, with 21 households (4.3%) experiencing poverty. Likewise, among single-mother households, those with 3 or 4 children have the highest poverty rate, with 82 households (54.3%) falling below the poverty line.
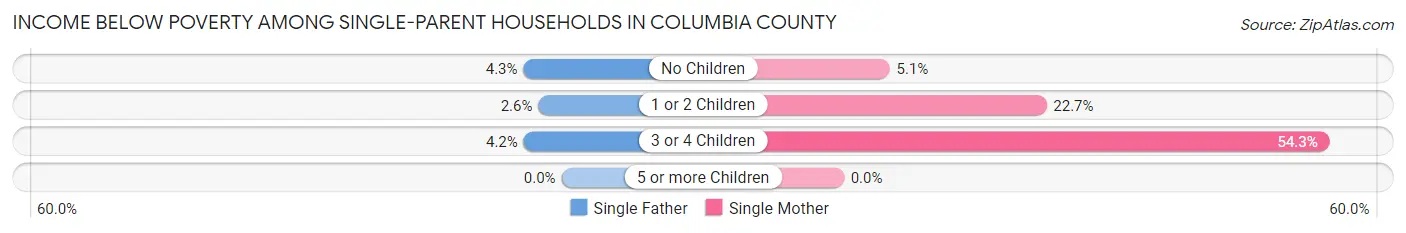
| Children | Single Father | Single Mother |
| No Children | 21 (4.3%) | 36 (5.1%) |
| 1 or 2 Children | 16 (2.6%) | 253 (22.7%) |
| 3 or 4 Children | 3 (4.2%) | 82 (54.3%) |
| 5 or more Children | 0 (0.0%) | 0 (0.0%) |
| Total | 40 (3.4%) | 371 (18.8%) |
Income Below Poverty Among Married-Couple vs Single-Parent Households in Columbia County
The poverty data for Columbia County shows that 245 of the married-couple family households (2.2%) and 411 of the single-parent households (13.0%) are living below the poverty level. Within the married-couple family households, those with 5 or more children have the highest poverty rate, with 26 households (61.9%) falling below the poverty line. Among the single-parent households, those with 3 or 4 children have the highest poverty rate, with 85 household (38.3%) living below poverty.
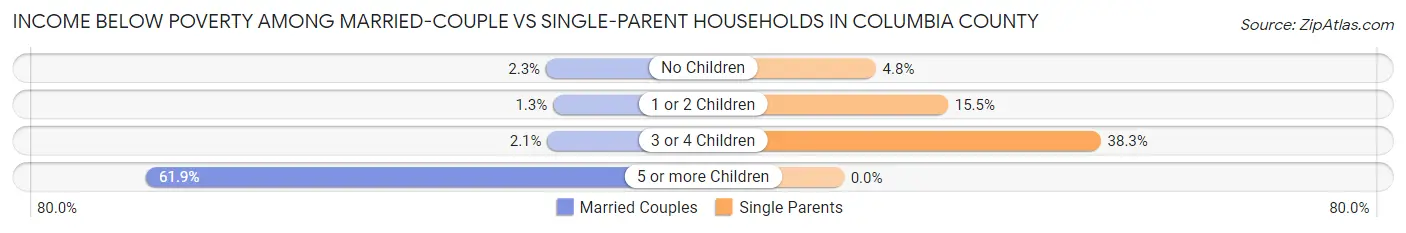
| Children | Married-Couple Families | Single-Parent Households |
| No Children | 168 (2.3%) | 57 (4.8%) |
| 1 or 2 Children | 38 (1.3%) | 269 (15.5%) |
| 3 or 4 Children | 13 (2.1%) | 85 (38.3%) |
| 5 or more Children | 26 (61.9%) | 0 (0.0%) |
| Total | 245 (2.2%) | 411 (13.0%) |
Employment Characteristics in Columbia County
Employment by Class of Employer in Columbia County
Among the 23,814 employed individuals in Columbia County, private company employees (16,822 | 70.6%), local government employees (1,761 | 7.4%), and not-for-profit organizations (1,760 | 7.4%) make up the most common classes of employment.
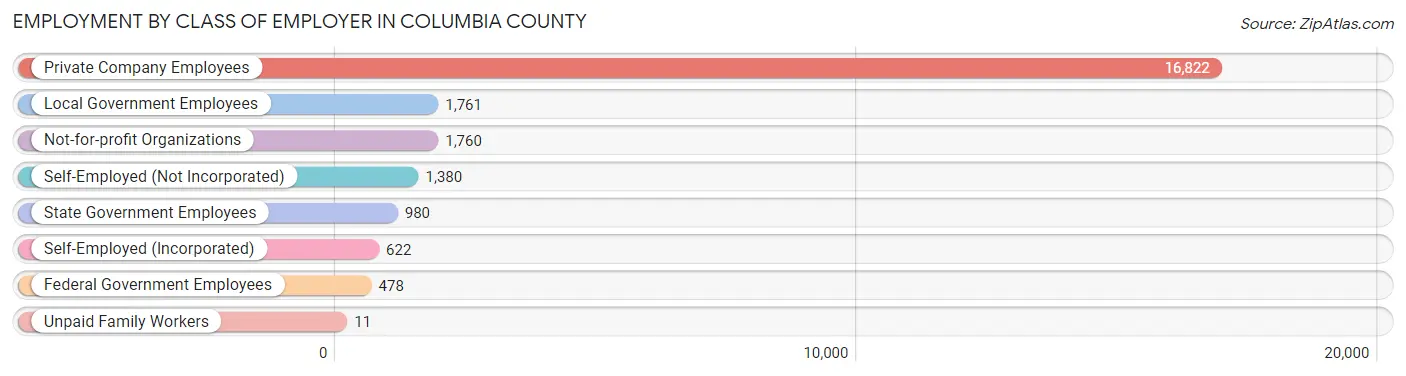
| Employer Class | # Employees | % Employees |
| Private Company Employees | 16,822 | 70.6% |
| Self-Employed (Incorporated) | 622 | 2.6% |
| Self-Employed (Not Incorporated) | 1,380 | 5.8% |
| Not-for-profit Organizations | 1,760 | 7.4% |
| Local Government Employees | 1,761 | 7.4% |
| State Government Employees | 980 | 4.1% |
| Federal Government Employees | 478 | 2.0% |
| Unpaid Family Workers | 11 | 0.1% |
| Total | 23,814 | 100.0% |
Employment Status by Age in Columbia County
According to the labor force statistics for Columbia County, out of the total population over 16 years of age (43,207), 59.1% or 25,535 individuals are in the labor force, with 4.5% or 1,149 of them unemployed. The age group with the highest labor force participation rate is 20 to 24 years, with 84.0% or 2,312 individuals in the labor force. Within the labor force, the 16 to 19 years age range has the highest percentage of unemployed individuals, with 19.4% or 177 of them being unemployed.
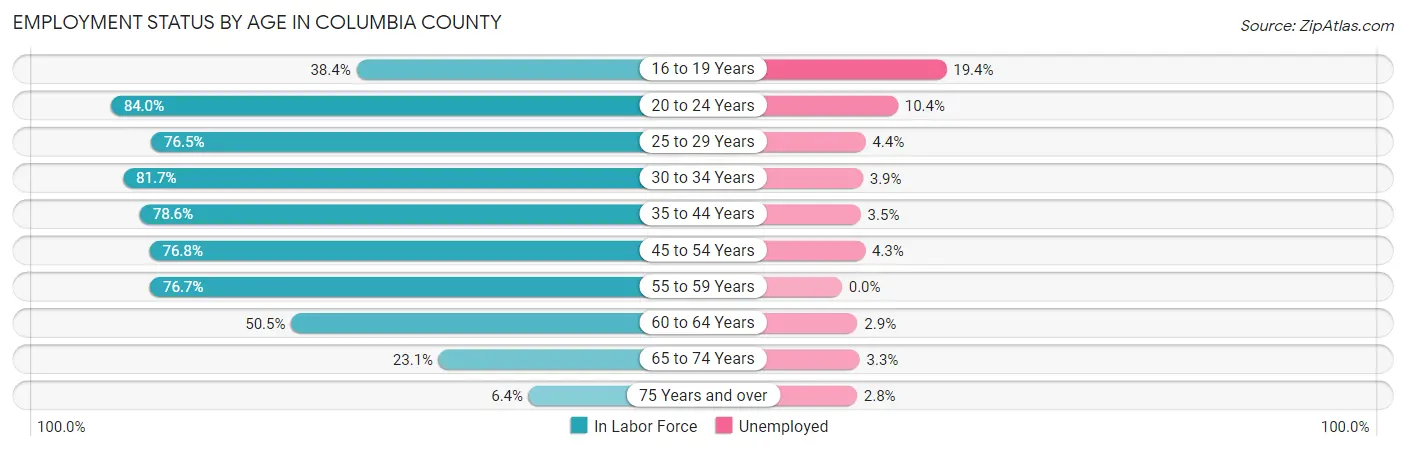
| Age Bracket | In Labor Force | Unemployed |
| 16 to 19 Years | 910 (38.4%) | 177 (19.4%) |
| 20 to 24 Years | 2,312 (84.0%) | 240 (10.4%) |
| 25 to 29 Years | 2,221 (76.5%) | 98 (4.4%) |
| 30 to 34 Years | 2,660 (81.7%) | 104 (3.9%) |
| 35 to 44 Years | 5,306 (78.6%) | 186 (3.5%) |
| 45 to 54 Years | 5,348 (76.8%) | 230 (4.3%) |
| 55 to 59 Years | 2,995 (76.7%) | 0 (0.0%) |
| 60 to 64 Years | 2,053 (50.5%) | 60 (2.9%) |
| 65 to 74 Years | 1,473 (23.1%) | 49 (3.3%) |
| 75 Years and over | 247 (6.4%) | 7 (2.8%) |
| Total | 25,535 (59.1%) | 1,149 (4.5%) |
Employment Status by Educational Attainment in Columbia County
According to labor force statistics for Columbia County, 73.9% of individuals (20,577) out of the total population between 25 and 64 years of age (27,844) are in the labor force, with 3.3% or 679 of them being unemployed. The group with the highest labor force participation rate are those with the educational attainment of bachelor's degree or higher, with 82.2% or 3,960 individuals in the labor force. Within the labor force, individuals with less than high school education have the highest percentage of unemployment, with 7.0% or 133 of them being unemployed.
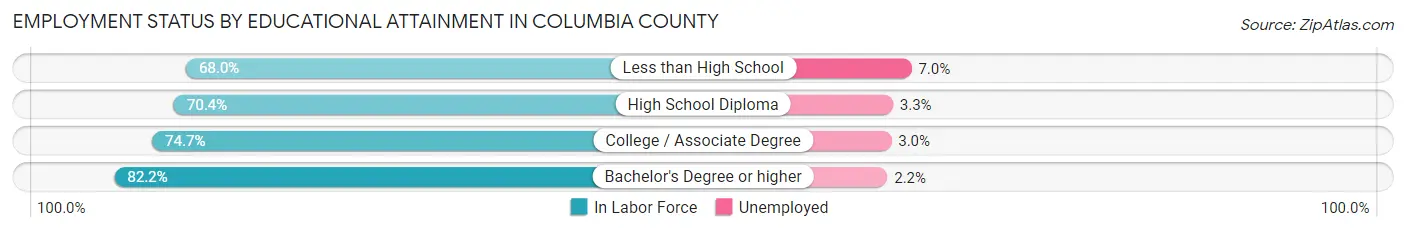
| Educational Attainment | In Labor Force | Unemployed |
| Less than High School | 1,903 (68.0%) | 196 (7.0%) |
| High School Diploma | 6,495 (70.4%) | 304 (3.3%) |
| College / Associate Degree | 8,218 (74.7%) | 330 (3.0%) |
| Bachelor's Degree or higher | 3,960 (82.2%) | 106 (2.2%) |
| Total | 20,577 (73.9%) | 919 (3.3%) |
Employment Occupations by Sex in Columbia County
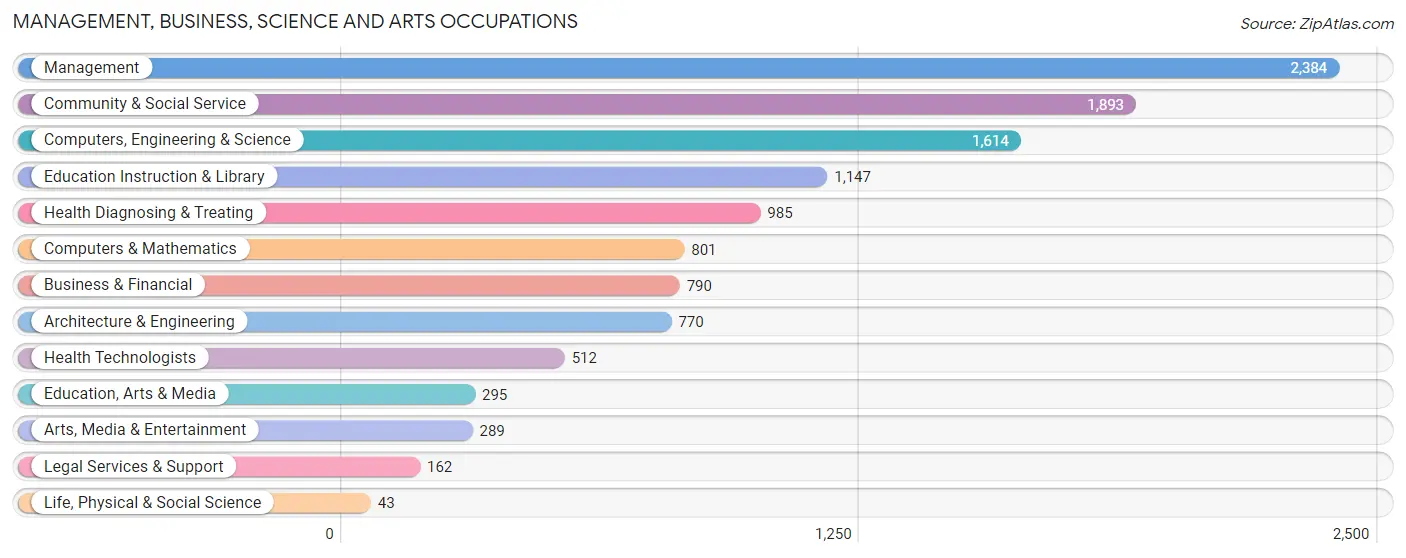
Management, Business, Science and Arts Occupations
The most common Management, Business, Science and Arts occupations in Columbia County are Management (2,384 | 9.8%), Community & Social Service (1,893 | 7.8%), Computers, Engineering & Science (1,614 | 6.6%), Education Instruction & Library (1,147 | 4.7%), and Health Diagnosing & Treating (985 | 4.0%).
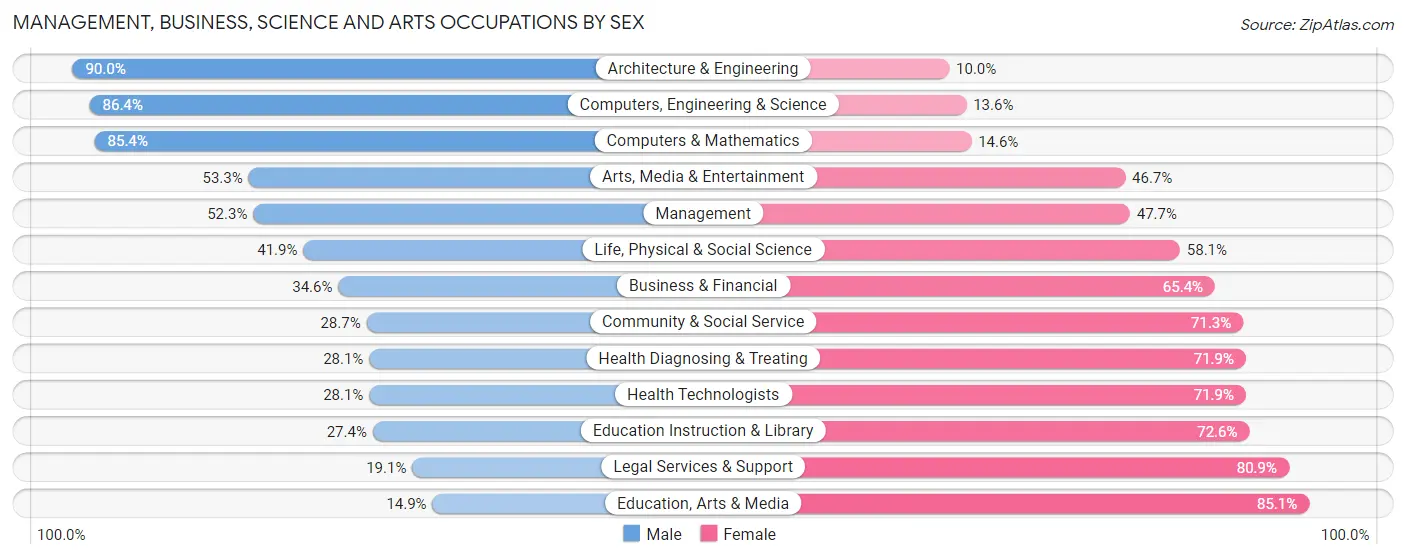
Management, Business, Science and Arts Occupations by Sex
Within the Management, Business, Science and Arts occupations in Columbia County, the most male-oriented occupations are Architecture & Engineering (90.0%), Computers, Engineering & Science (86.4%), and Computers & Mathematics (85.4%), while the most female-oriented occupations are Education, Arts & Media (85.1%), Legal Services & Support (80.9%), and Education Instruction & Library (72.6%).
| Occupation | Male | Female |
| Management | 1,247 (52.3%) | 1,137 (47.7%) |
| Business & Financial | 273 (34.6%) | 517 (65.4%) |
| Computers, Engineering & Science | 1,395 (86.4%) | 219 (13.6%) |
| Computers & Mathematics | 684 (85.4%) | 117 (14.6%) |
| Architecture & Engineering | 693 (90.0%) | 77 (10.0%) |
| Life, Physical & Social Science | 18 (41.9%) | 25 (58.1%) |
| Community & Social Service | 543 (28.7%) | 1,350 (71.3%) |
| Education, Arts & Media | 44 (14.9%) | 251 (85.1%) |
| Legal Services & Support | 31 (19.1%) | 131 (80.9%) |
| Education Instruction & Library | 314 (27.4%) | 833 (72.6%) |
| Arts, Media & Entertainment | 154 (53.3%) | 135 (46.7%) |
| Health Diagnosing & Treating | 277 (28.1%) | 708 (71.9%) |
| Health Technologists | 144 (28.1%) | 368 (71.9%) |
| Total (Category) | 3,735 (48.7%) | 3,931 (51.3%) |
| Total (Overall) | 13,693 (56.2%) | 10,668 (43.8%) |
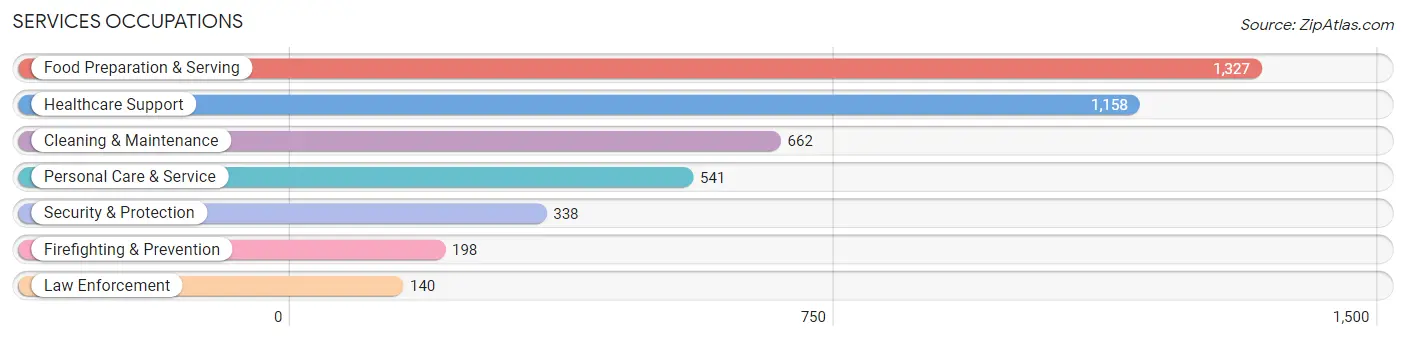
Services Occupations
The most common Services occupations in Columbia County are Food Preparation & Serving (1,327 | 5.4%), Healthcare Support (1,158 | 4.8%), Cleaning & Maintenance (662 | 2.7%), Personal Care & Service (541 | 2.2%), and Security & Protection (338 | 1.4%).
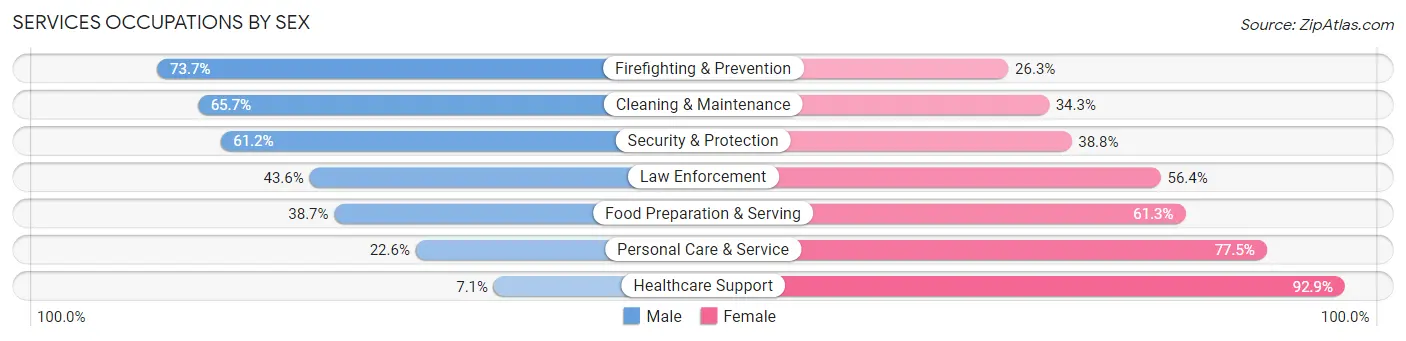
Services Occupations by Sex
Within the Services occupations in Columbia County, the most male-oriented occupations are Firefighting & Prevention (73.7%), Cleaning & Maintenance (65.7%), and Security & Protection (61.2%), while the most female-oriented occupations are Healthcare Support (92.9%), Personal Care & Service (77.4%), and Food Preparation & Serving (61.3%).
| Occupation | Male | Female |
| Healthcare Support | 82 (7.1%) | 1,076 (92.9%) |
| Security & Protection | 207 (61.2%) | 131 (38.8%) |
| Firefighting & Prevention | 146 (73.7%) | 52 (26.3%) |
| Law Enforcement | 61 (43.6%) | 79 (56.4%) |
| Food Preparation & Serving | 513 (38.7%) | 814 (61.3%) |
| Cleaning & Maintenance | 435 (65.7%) | 227 (34.3%) |
| Personal Care & Service | 122 (22.6%) | 419 (77.4%) |
| Total (Category) | 1,359 (33.8%) | 2,667 (66.2%) |
| Total (Overall) | 13,693 (56.2%) | 10,668 (43.8%) |
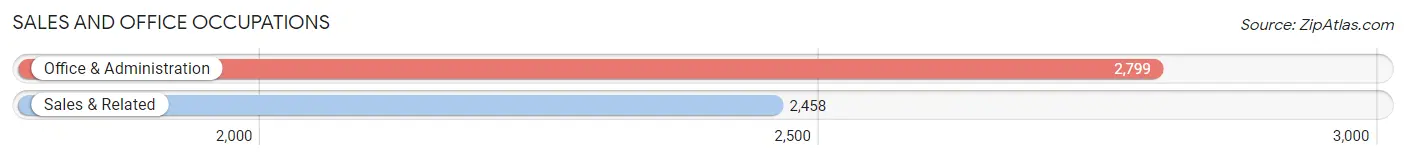
Sales and Office Occupations
The most common Sales and Office occupations in Columbia County are Office & Administration (2,799 | 11.5%), and Sales & Related (2,458 | 10.1%).
Sales and Office Occupations by Sex
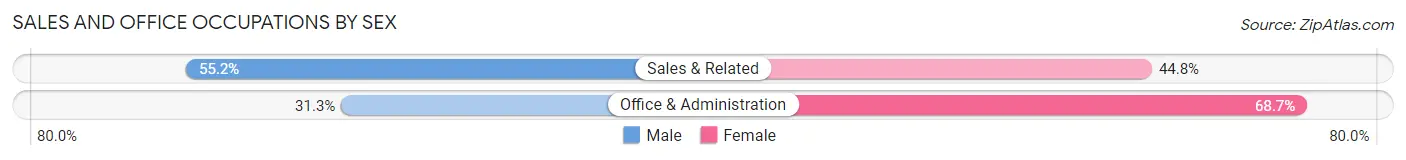
| Occupation | Male | Female |
| Sales & Related | 1,356 (55.2%) | 1,102 (44.8%) |
| Office & Administration | 876 (31.3%) | 1,923 (68.7%) |
| Total (Category) | 2,232 (42.5%) | 3,025 (57.5%) |
| Total (Overall) | 13,693 (56.2%) | 10,668 (43.8%) |
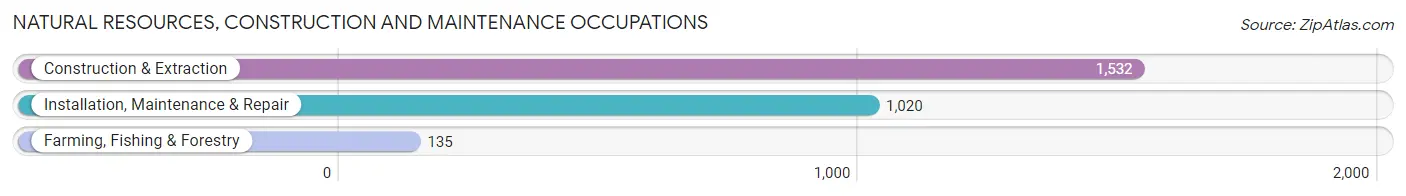
Natural Resources, Construction and Maintenance Occupations
The most common Natural Resources, Construction and Maintenance occupations in Columbia County are Construction & Extraction (1,532 | 6.3%), Installation, Maintenance & Repair (1,020 | 4.2%), and Farming, Fishing & Forestry (135 | 0.5%).
Natural Resources, Construction and Maintenance Occupations by Sex
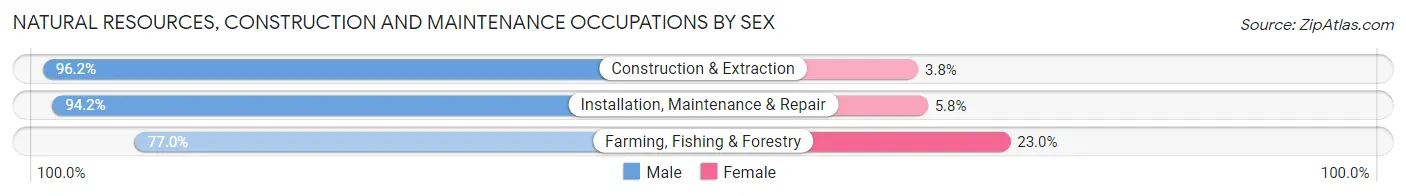
| Occupation | Male | Female |
| Farming, Fishing & Forestry | 104 (77.0%) | 31 (23.0%) |
| Construction & Extraction | 1,474 (96.2%) | 58 (3.8%) |
| Installation, Maintenance & Repair | 961 (94.2%) | 59 (5.8%) |
| Total (Category) | 2,539 (94.5%) | 148 (5.5%) |
| Total (Overall) | 13,693 (56.2%) | 10,668 (43.8%) |
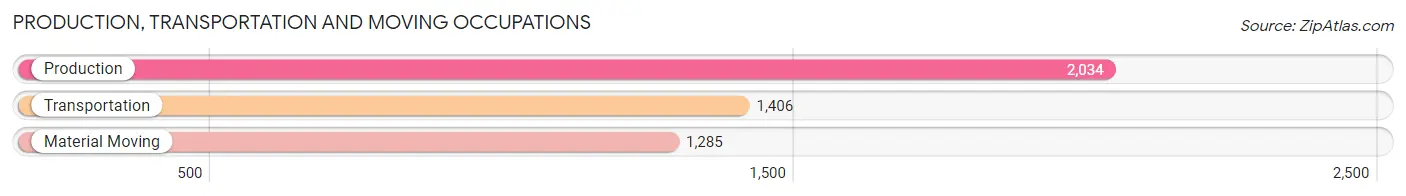
Production, Transportation and Moving Occupations
The most common Production, Transportation and Moving occupations in Columbia County are Production (2,034 | 8.4%), Transportation (1,406 | 5.8%), and Material Moving (1,285 | 5.3%).
Production, Transportation and Moving Occupations by Sex
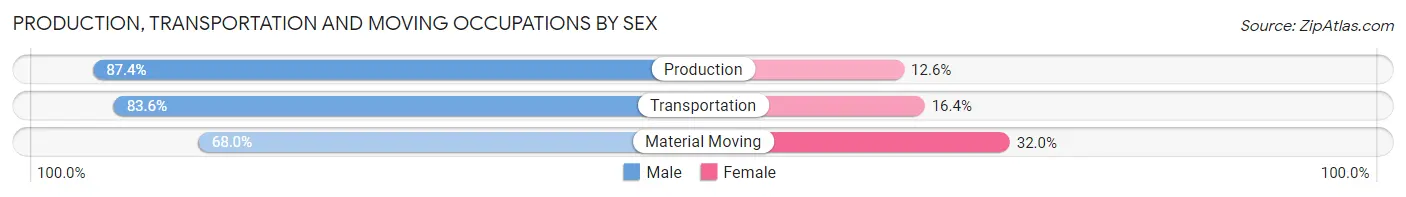
| Occupation | Male | Female |
| Production | 1,778 (87.4%) | 256 (12.6%) |
| Transportation | 1,176 (83.6%) | 230 (16.4%) |
| Material Moving | 874 (68.0%) | 411 (32.0%) |
| Total (Category) | 3,828 (81.0%) | 897 (19.0%) |
| Total (Overall) | 13,693 (56.2%) | 10,668 (43.8%) |
Employment Industries by Sex in Columbia County
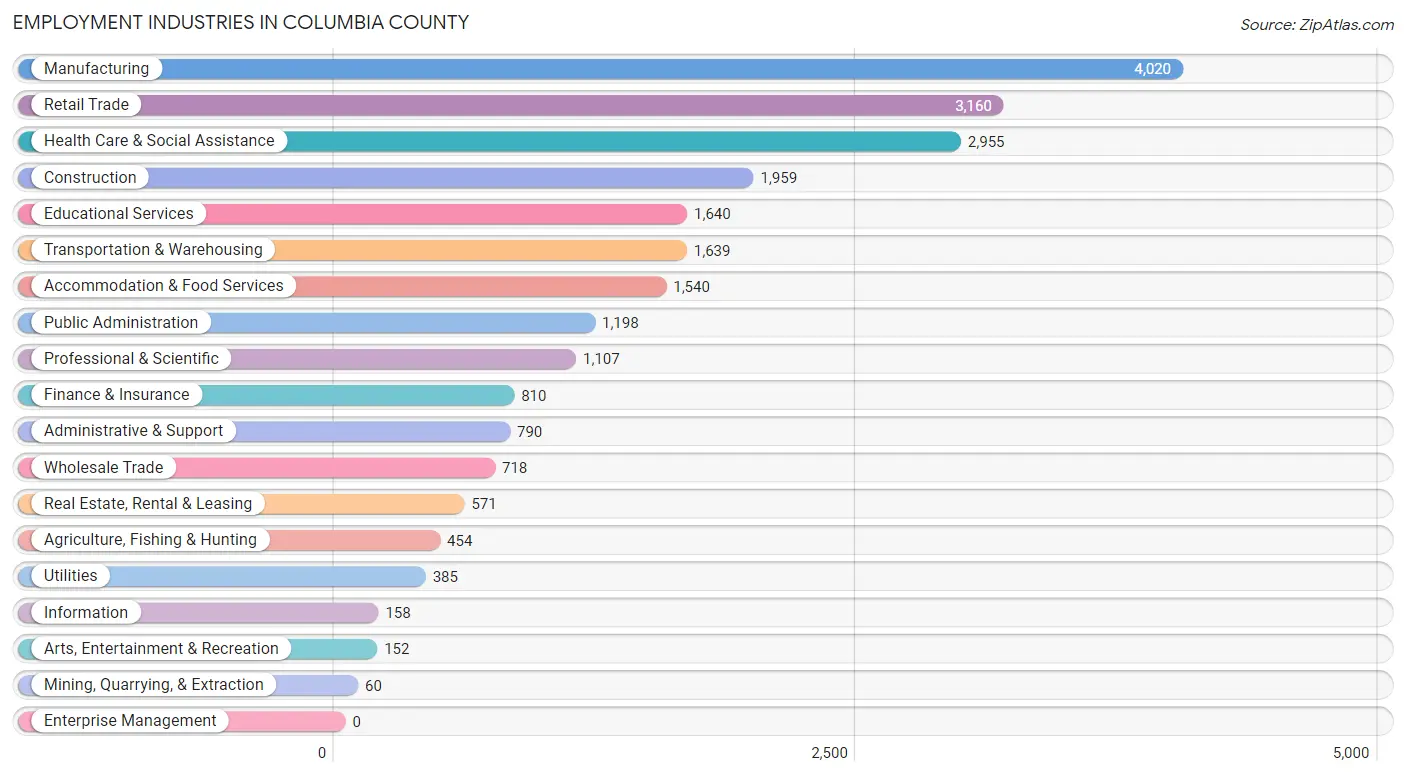
Employment Industries in Columbia County
The major employment industries in Columbia County include Manufacturing (4,020 | 16.5%), Retail Trade (3,160 | 13.0%), Health Care & Social Assistance (2,955 | 12.1%), Construction (1,959 | 8.0%), and Educational Services (1,640 | 6.7%).
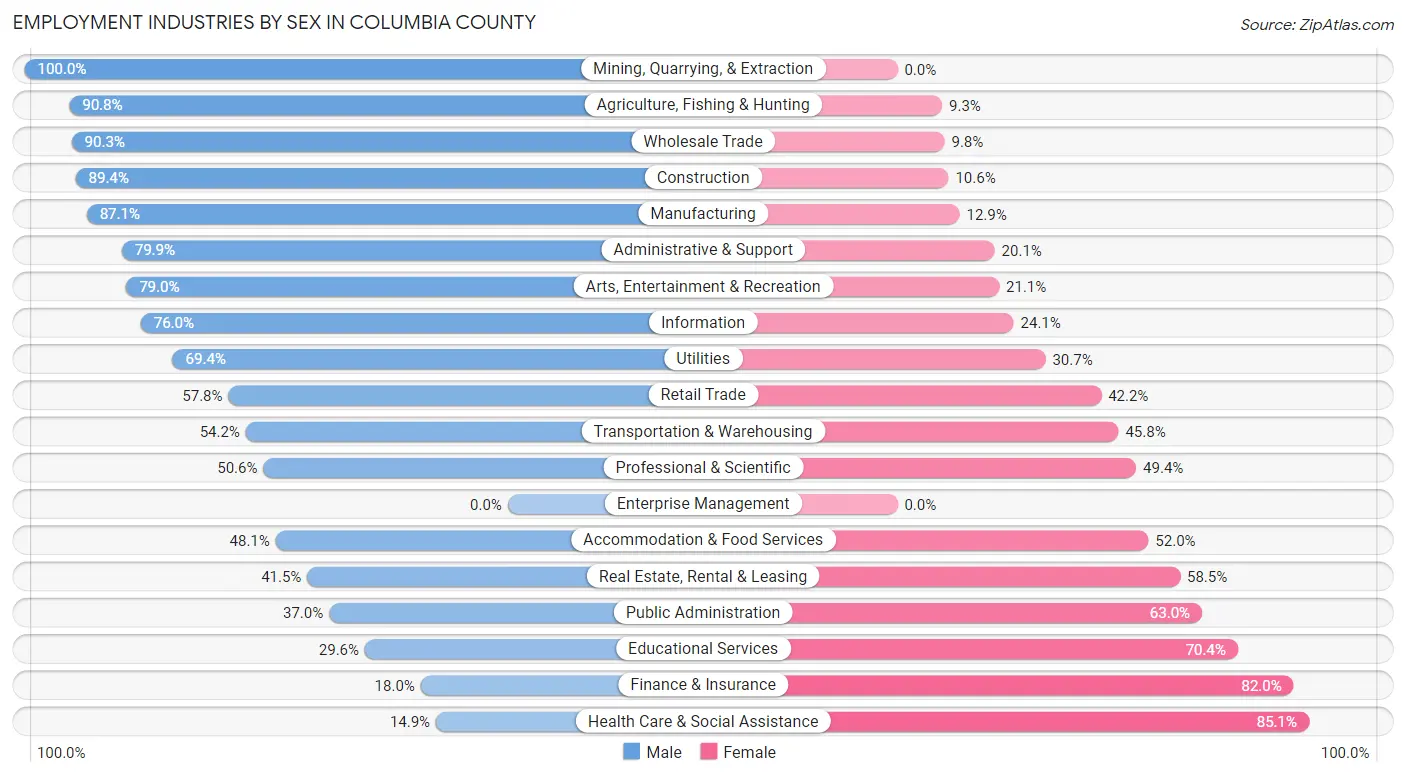
Employment Industries by Sex in Columbia County
The Columbia County industries that see more men than women are Mining, Quarrying, & Extraction (100.0%), Agriculture, Fishing & Hunting (90.7%), and Wholesale Trade (90.2%), whereas the industries that tend to have a higher number of women are Health Care & Social Assistance (85.1%), Finance & Insurance (82.0%), and Educational Services (70.4%).
| Industry | Male | Female |
| Agriculture, Fishing & Hunting | 412 (90.7%) | 42 (9.2%) |
| Mining, Quarrying, & Extraction | 60 (100.0%) | 0 (0.0%) |
| Construction | 1,752 (89.4%) | 207 (10.6%) |
| Manufacturing | 3,503 (87.1%) | 517 (12.9%) |
| Wholesale Trade | 648 (90.2%) | 70 (9.8%) |
| Retail Trade | 1,827 (57.8%) | 1,333 (42.2%) |
| Transportation & Warehousing | 889 (54.2%) | 750 (45.8%) |
| Utilities | 267 (69.4%) | 118 (30.6%) |
| Information | 120 (75.9%) | 38 (24.0%) |
| Finance & Insurance | 146 (18.0%) | 664 (82.0%) |
| Real Estate, Rental & Leasing | 237 (41.5%) | 334 (58.5%) |
| Professional & Scientific | 560 (50.6%) | 547 (49.4%) |
| Enterprise Management | 0 (0.0%) | 0 (0.0%) |
| Administrative & Support | 631 (79.9%) | 159 (20.1%) |
| Educational Services | 485 (29.6%) | 1,155 (70.4%) |
| Health Care & Social Assistance | 439 (14.9%) | 2,516 (85.1%) |
| Arts, Entertainment & Recreation | 120 (78.9%) | 32 (21.0%) |
| Accommodation & Food Services | 740 (48.0%) | 800 (51.9%) |
| Public Administration | 443 (37.0%) | 755 (63.0%) |
| Total | 13,693 (56.2%) | 10,668 (43.8%) |
Education in Columbia County
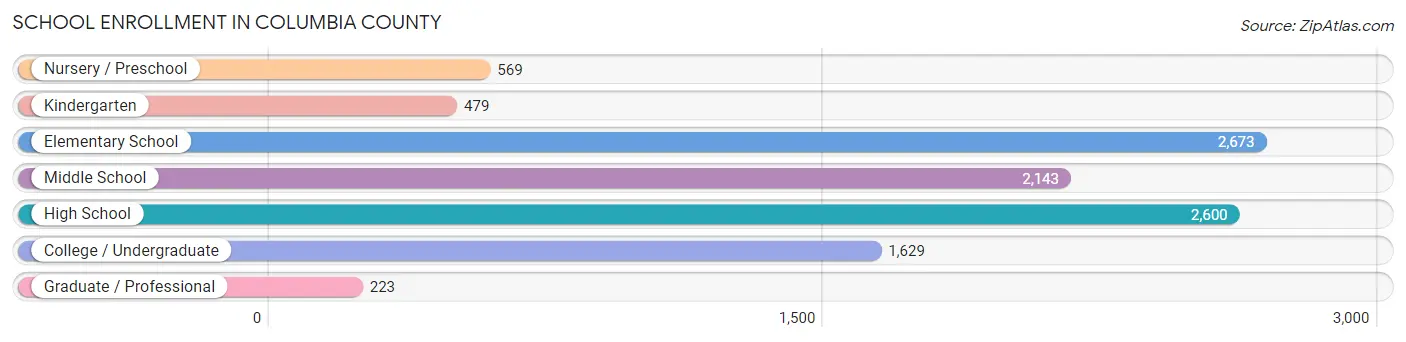
School Enrollment in Columbia County
The most common levels of schooling among the 10,316 students in Columbia County are elementary school (2,673 | 25.9%), high school (2,600 | 25.2%), and middle school (2,143 | 20.8%).
| School Level | # Students | % Students |
| Nursery / Preschool | 569 | 5.5% |
| Kindergarten | 479 | 4.6% |
| Elementary School | 2,673 | 25.9% |
| Middle School | 2,143 | 20.8% |
| High School | 2,600 | 25.2% |
| College / Undergraduate | 1,629 | 15.8% |
| Graduate / Professional | 223 | 2.2% |
| Total | 10,316 | 100.0% |
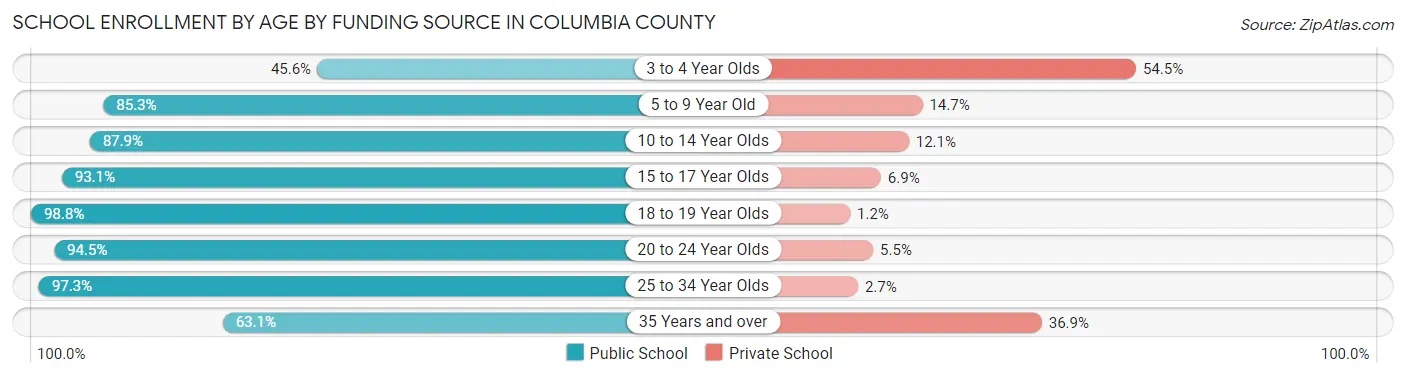
School Enrollment by Age by Funding Source in Columbia County
Out of a total of 10,316 students who are enrolled in schools in Columbia County, 1,393 (13.5%) attend a private institution, while the remaining 8,923 (86.5%) are enrolled in public schools. The age group of 3 to 4 year olds has the highest likelihood of being enrolled in private schools, with 257 (54.4% in the age bracket) enrolled. Conversely, the age group of 18 to 19 year olds has the lowest likelihood of being enrolled in a private school, with 743 (98.8% in the age bracket) attending a public institution.
| Age Bracket | Public School | Private School |
| 3 to 4 Year Olds | 215 (45.6%) | 257 (54.4%) |
| 5 to 9 Year Old | 2,441 (85.3%) | 420 (14.7%) |
| 10 to 14 Year Olds | 2,471 (87.9%) | 341 (12.1%) |
| 15 to 17 Year Olds | 1,798 (93.1%) | 134 (6.9%) |
| 18 to 19 Year Olds | 743 (98.8%) | 9 (1.2%) |
| 20 to 24 Year Olds | 602 (94.5%) | 35 (5.5%) |
| 25 to 34 Year Olds | 329 (97.3%) | 9 (2.7%) |
| 35 Years and over | 323 (63.1%) | 189 (36.9%) |
| Total | 8,923 (86.5%) | 1,393 (13.5%) |
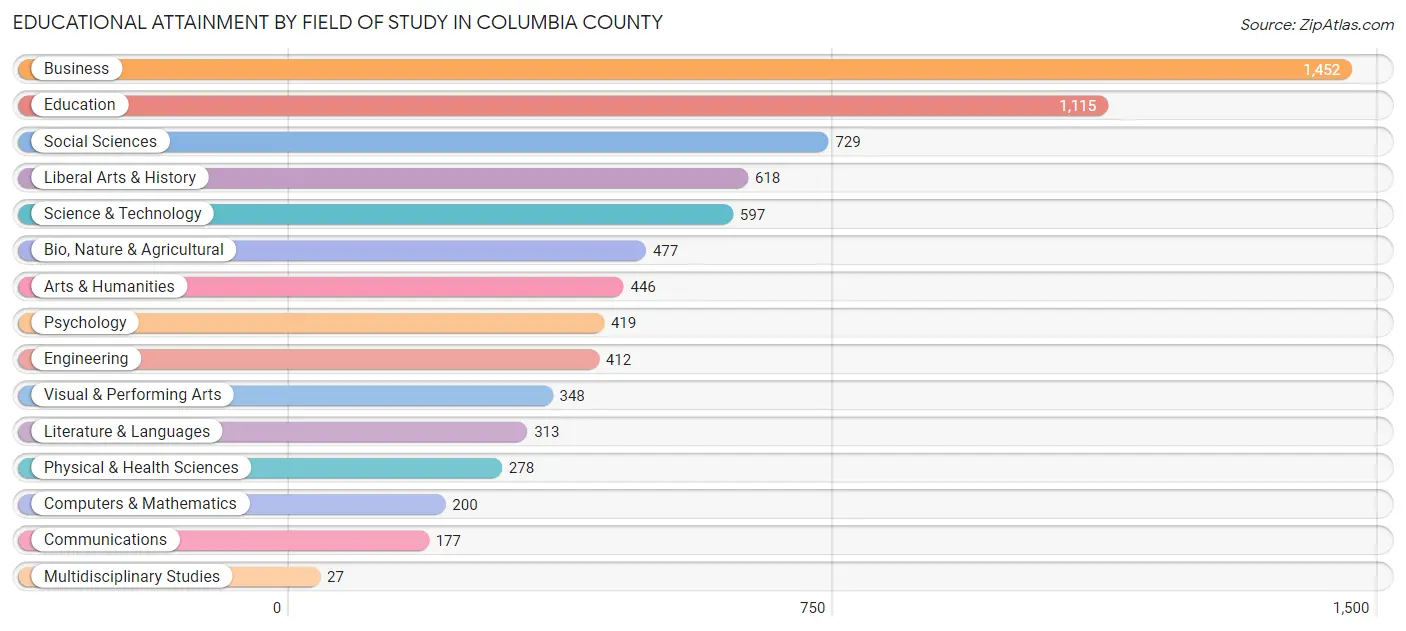
Educational Attainment by Field of Study in Columbia County
Business (1,452 | 19.1%), education (1,115 | 14.7%), social sciences (729 | 9.6%), liberal arts & history (618 | 8.1%), and science & technology (597 | 7.9%) are the most common fields of study among 7,608 individuals in Columbia County who have obtained a bachelor's degree or higher.
| Field of Study | # Graduates | % Graduates |
| Computers & Mathematics | 200 | 2.6% |
| Bio, Nature & Agricultural | 477 | 6.3% |
| Physical & Health Sciences | 278 | 3.6% |
| Psychology | 419 | 5.5% |
| Social Sciences | 729 | 9.6% |
| Engineering | 412 | 5.4% |
| Multidisciplinary Studies | 27 | 0.4% |
| Science & Technology | 597 | 7.9% |
| Business | 1,452 | 19.1% |
| Education | 1,115 | 14.7% |
| Literature & Languages | 313 | 4.1% |
| Liberal Arts & History | 618 | 8.1% |
| Visual & Performing Arts | 348 | 4.6% |
| Communications | 177 | 2.3% |
| Arts & Humanities | 446 | 5.9% |
| Total | 7,608 | 100.0% |
Transportation & Commute in Columbia County
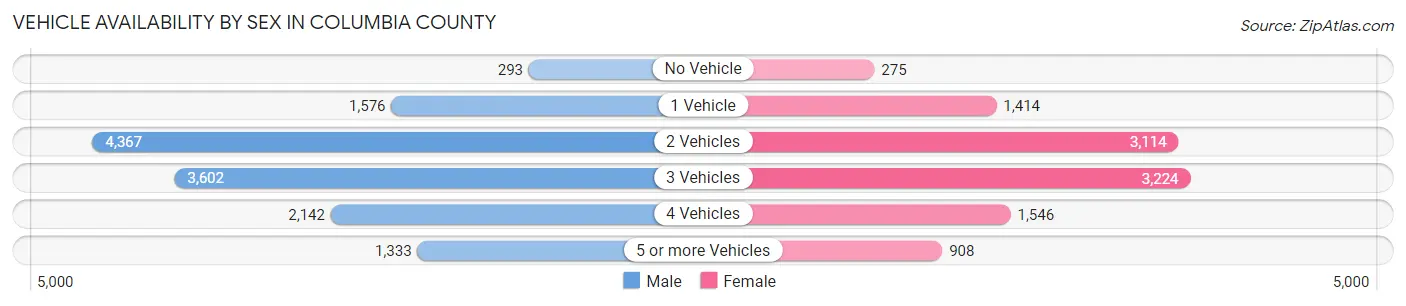
Vehicle Availability by Sex in Columbia County
The most prevalent vehicle ownership categories in Columbia County are males with 2 vehicles (4,367, accounting for 32.8%) and females with 2 vehicles (3,114, making up 41.7%).
| Vehicles Available | Male | Female |
| No Vehicle | 293 (2.2%) | 275 (2.6%) |
| 1 Vehicle | 1,576 (11.8%) | 1,414 (13.5%) |
| 2 Vehicles | 4,367 (32.8%) | 3,114 (29.7%) |
| 3 Vehicles | 3,602 (27.1%) | 3,224 (30.8%) |
| 4 Vehicles | 2,142 (16.1%) | 1,546 (14.7%) |
| 5 or more Vehicles | 1,333 (10.0%) | 908 (8.7%) |
| Total | 13,313 (100.0%) | 10,481 (100.0%) |
Commute Time in Columbia County
The most frequently occuring commute durations in Columbia County are 45 to 59 minutes (4,445 commuters, 20.7%), 60 to 89 minutes (3,085 commuters, 14.3%), and 5 to 9 minutes (2,351 commuters, 10.9%).
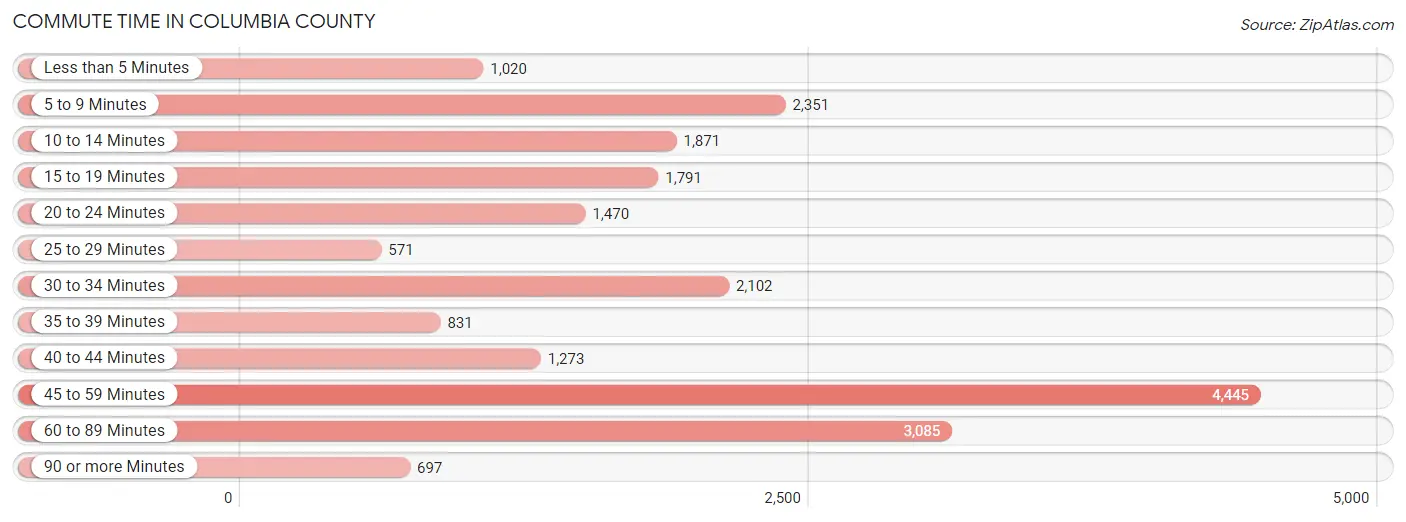
| Commute Time | # Commuters | % Commuters |
| Less than 5 Minutes | 1,020 | 4.7% |
| 5 to 9 Minutes | 2,351 | 10.9% |
| 10 to 14 Minutes | 1,871 | 8.7% |
| 15 to 19 Minutes | 1,791 | 8.3% |
| 20 to 24 Minutes | 1,470 | 6.8% |
| 25 to 29 Minutes | 571 | 2.6% |
| 30 to 34 Minutes | 2,102 | 9.8% |
| 35 to 39 Minutes | 831 | 3.9% |
| 40 to 44 Minutes | 1,273 | 5.9% |
| 45 to 59 Minutes | 4,445 | 20.7% |
| 60 to 89 Minutes | 3,085 | 14.3% |
| 90 or more Minutes | 697 | 3.2% |
Commute Time by Sex in Columbia County
The most common commute times in Columbia County are 45 to 59 minutes (2,238 commuters, 18.2%) for males and 45 to 59 minutes (2,207 commuters, 24.0%) for females.
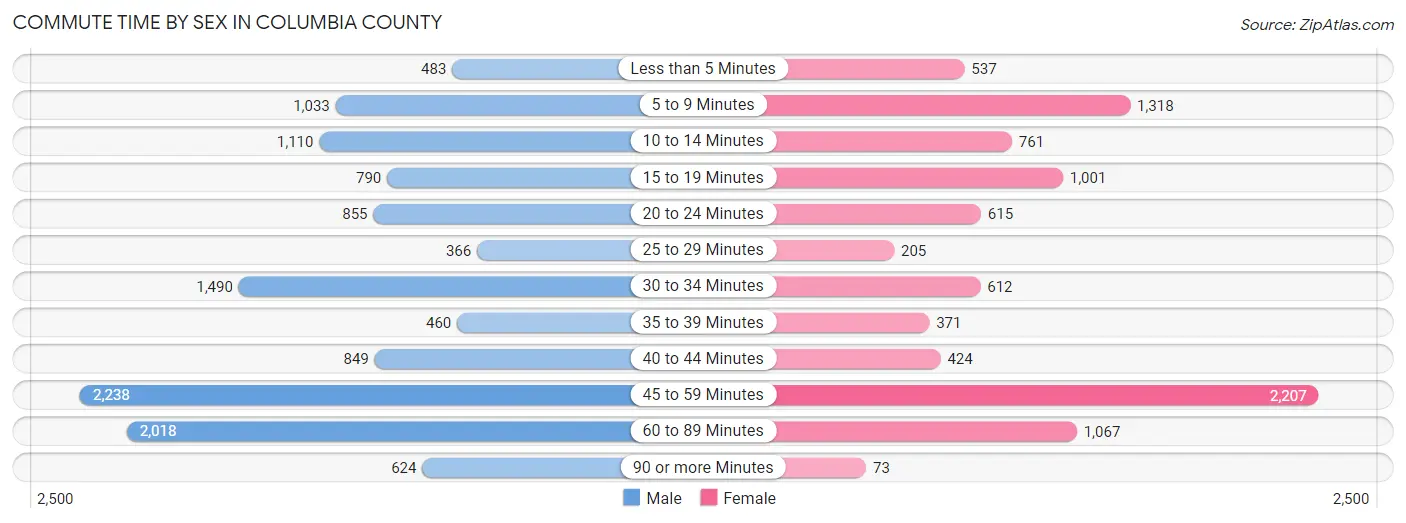
| Commute Time | Male | Female |
| Less than 5 Minutes | 483 (3.9%) | 537 (5.8%) |
| 5 to 9 Minutes | 1,033 (8.4%) | 1,318 (14.3%) |
| 10 to 14 Minutes | 1,110 (9.0%) | 761 (8.3%) |
| 15 to 19 Minutes | 790 (6.4%) | 1,001 (10.9%) |
| 20 to 24 Minutes | 855 (6.9%) | 615 (6.7%) |
| 25 to 29 Minutes | 366 (3.0%) | 205 (2.2%) |
| 30 to 34 Minutes | 1,490 (12.1%) | 612 (6.7%) |
| 35 to 39 Minutes | 460 (3.7%) | 371 (4.0%) |
| 40 to 44 Minutes | 849 (6.9%) | 424 (4.6%) |
| 45 to 59 Minutes | 2,238 (18.2%) | 2,207 (24.0%) |
| 60 to 89 Minutes | 2,018 (16.4%) | 1,067 (11.6%) |
| 90 or more Minutes | 624 (5.1%) | 73 (0.8%) |
Time of Departure to Work by Sex in Columbia County
The most frequent times of departure to work in Columbia County are 12:00 AM to 4:59 AM (1,603, 13.0%) for males and 7:30 AM to 7:59 AM (1,340, 14.6%) for females.
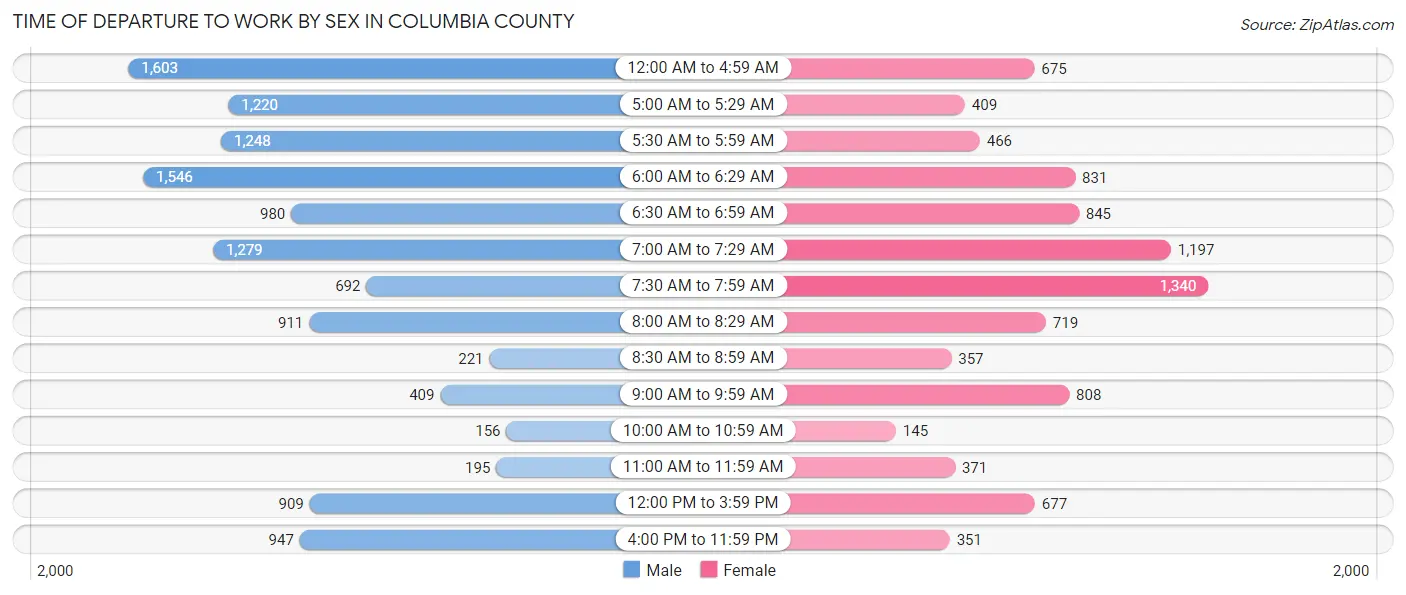
| Time of Departure | Male | Female |
| 12:00 AM to 4:59 AM | 1,603 (13.0%) | 675 (7.3%) |
| 5:00 AM to 5:29 AM | 1,220 (9.9%) | 409 (4.4%) |
| 5:30 AM to 5:59 AM | 1,248 (10.1%) | 466 (5.1%) |
| 6:00 AM to 6:29 AM | 1,546 (12.6%) | 831 (9.0%) |
| 6:30 AM to 6:59 AM | 980 (8.0%) | 845 (9.2%) |
| 7:00 AM to 7:29 AM | 1,279 (10.4%) | 1,197 (13.0%) |
| 7:30 AM to 7:59 AM | 692 (5.6%) | 1,340 (14.6%) |
| 8:00 AM to 8:29 AM | 911 (7.4%) | 719 (7.8%) |
| 8:30 AM to 8:59 AM | 221 (1.8%) | 357 (3.9%) |
| 9:00 AM to 9:59 AM | 409 (3.3%) | 808 (8.8%) |
| 10:00 AM to 10:59 AM | 156 (1.3%) | 145 (1.6%) |
| 11:00 AM to 11:59 AM | 195 (1.6%) | 371 (4.0%) |
| 12:00 PM to 3:59 PM | 909 (7.4%) | 677 (7.4%) |
| 4:00 PM to 11:59 PM | 947 (7.7%) | 351 (3.8%) |
| Total | 12,316 (100.0%) | 9,191 (100.0%) |
Housing Occupancy in Columbia County
Occupancy by Ownership in Columbia County
Of the total 20,335 dwellings in Columbia County, owner-occupied units account for 15,577 (76.6%), while renter-occupied units make up 4,758 (23.4%).
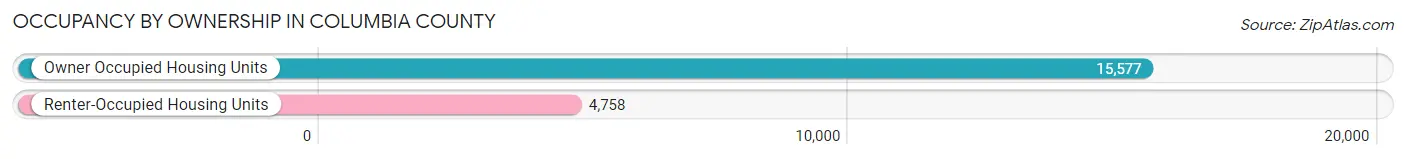
| Occupancy | # Housing Units | % Housing Units |
| Owner Occupied Housing Units | 15,577 | 76.6% |
| Renter-Occupied Housing Units | 4,758 | 23.4% |
| Total Occupied Housing Units | 20,335 | 100.0% |
Occupancy by Household Size in Columbia County
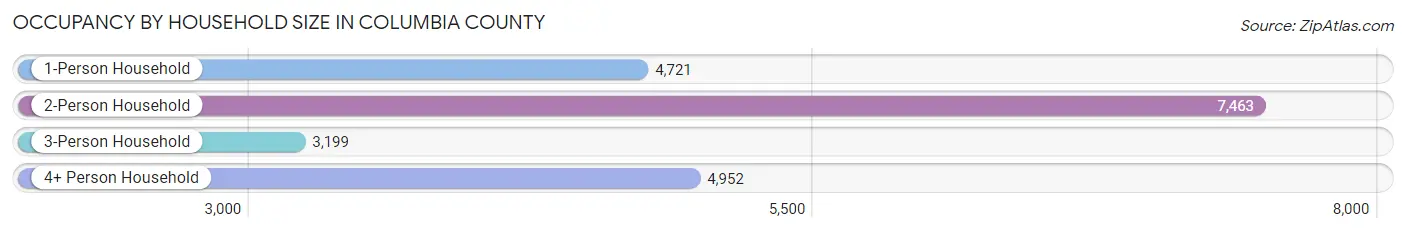
| Household Size | # Housing Units | % Housing Units |
| 1-Person Household | 4,721 | 23.2% |
| 2-Person Household | 7,463 | 36.7% |
| 3-Person Household | 3,199 | 15.7% |
| 4+ Person Household | 4,952 | 24.3% |
| Total Housing Units | 20,335 | 100.0% |
Occupancy by Ownership by Household Size in Columbia County
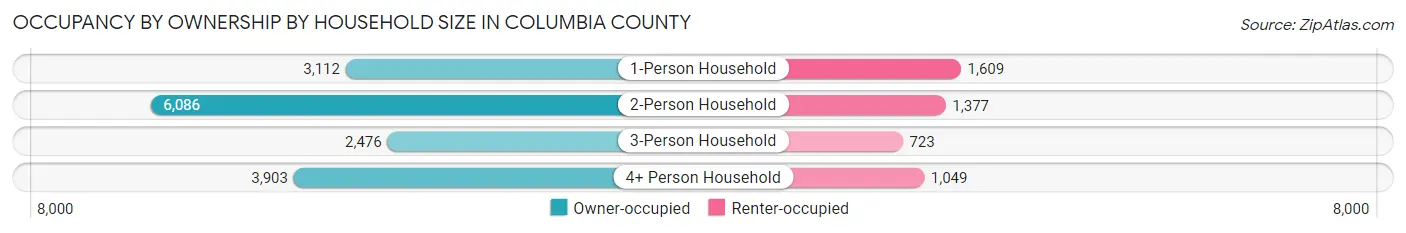
| Household Size | Owner-occupied | Renter-occupied |
| 1-Person Household | 3,112 (65.9%) | 1,609 (34.1%) |
| 2-Person Household | 6,086 (81.6%) | 1,377 (18.4%) |
| 3-Person Household | 2,476 (77.4%) | 723 (22.6%) |
| 4+ Person Household | 3,903 (78.8%) | 1,049 (21.2%) |
| Total Housing Units | 15,577 (76.6%) | 4,758 (23.4%) |
Occupancy by Educational Attainment in Columbia County
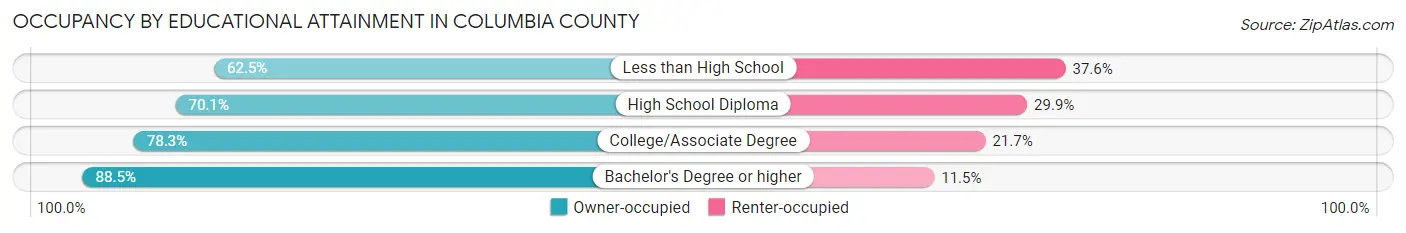
| Household Size | Owner-occupied | Renter-occupied |
| Less than High School | 1,011 (62.5%) | 608 (37.6%) |
| High School Diploma | 4,253 (70.1%) | 1,817 (29.9%) |
| College/Associate Degree | 6,758 (78.3%) | 1,870 (21.7%) |
| Bachelor's Degree or higher | 3,555 (88.5%) | 463 (11.5%) |
Occupancy by Age of Householder in Columbia County
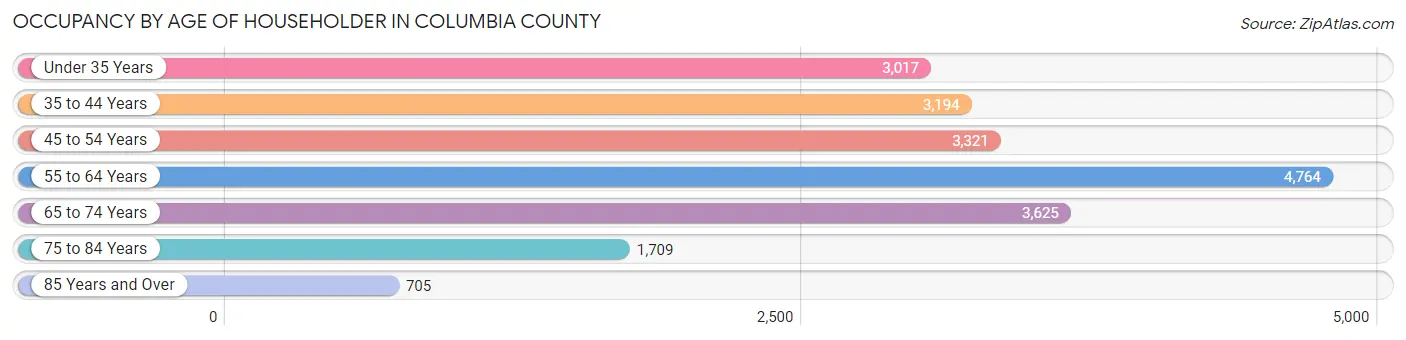
| Age Bracket | # Households | % Households |
| Under 35 Years | 3,017 | 14.8% |
| 35 to 44 Years | 3,194 | 15.7% |
| 45 to 54 Years | 3,321 | 16.3% |
| 55 to 64 Years | 4,764 | 23.4% |
| 65 to 74 Years | 3,625 | 17.8% |
| 75 to 84 Years | 1,709 | 8.4% |
| 85 Years and Over | 705 | 3.5% |
| Total | 20,335 | 100.0% |
Housing Finances in Columbia County
Median Income by Occupancy in Columbia County
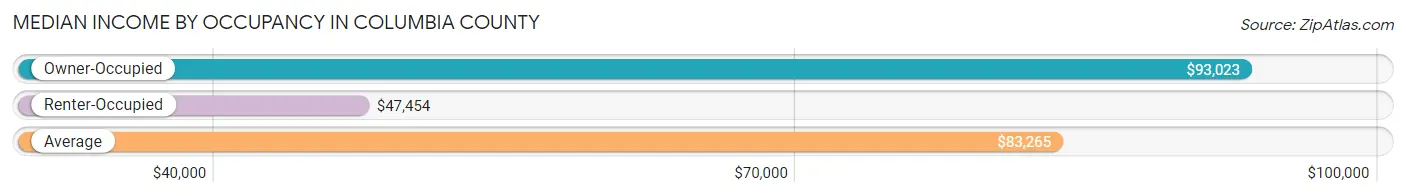
| Occupancy Type | # Households | Median Income |
| Owner-Occupied | 15,577 (76.6%) | $93,023 |
| Renter-Occupied | 4,758 (23.4%) | $47,454 |
| Average | 20,335 (100.0%) | $83,265 |
Occupancy by Householder Income Bracket in Columbia County
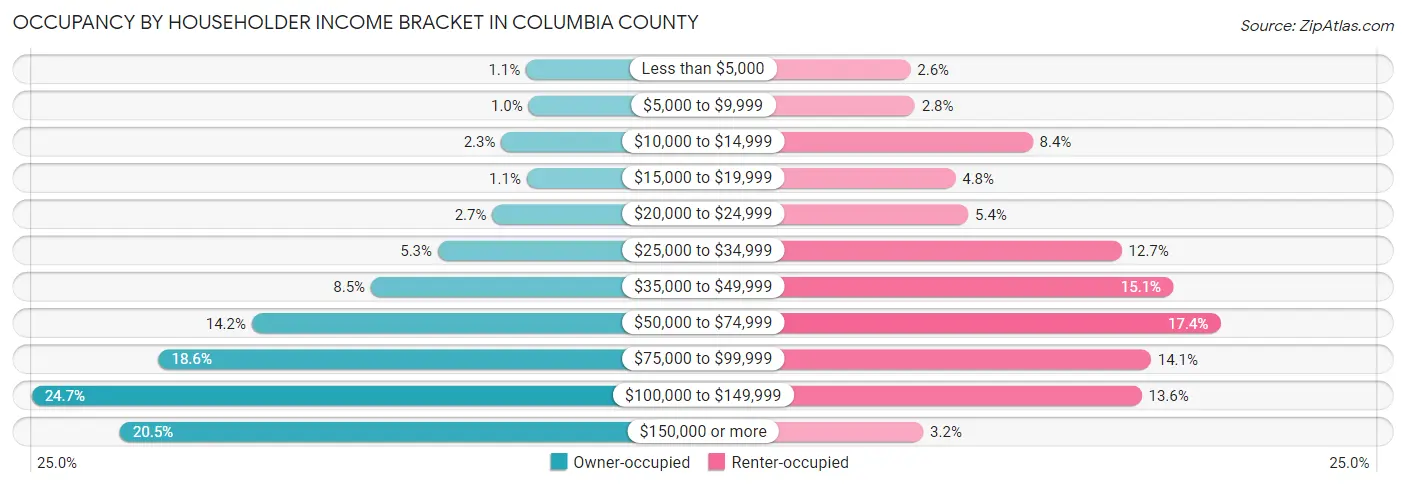
| Income Bracket | Owner-occupied | Renter-occupied |
| Less than $5,000 | 175 (1.1%) | 124 (2.6%) |
| $5,000 to $9,999 | 155 (1.0%) | 134 (2.8%) |
| $10,000 to $14,999 | 359 (2.3%) | 401 (8.4%) |
| $15,000 to $19,999 | 170 (1.1%) | 226 (4.8%) |
| $20,000 to $24,999 | 426 (2.7%) | 255 (5.4%) |
| $25,000 to $34,999 | 829 (5.3%) | 603 (12.7%) |
| $35,000 to $49,999 | 1,326 (8.5%) | 719 (15.1%) |
| $50,000 to $74,999 | 2,209 (14.2%) | 826 (17.4%) |
| $75,000 to $99,999 | 2,900 (18.6%) | 669 (14.1%) |
| $100,000 to $149,999 | 3,841 (24.7%) | 648 (13.6%) |
| $150,000 or more | 3,187 (20.5%) | 153 (3.2%) |
| Total | 15,577 (100.0%) | 4,758 (100.0%) |
Monthly Housing Cost Tiers in Columbia County
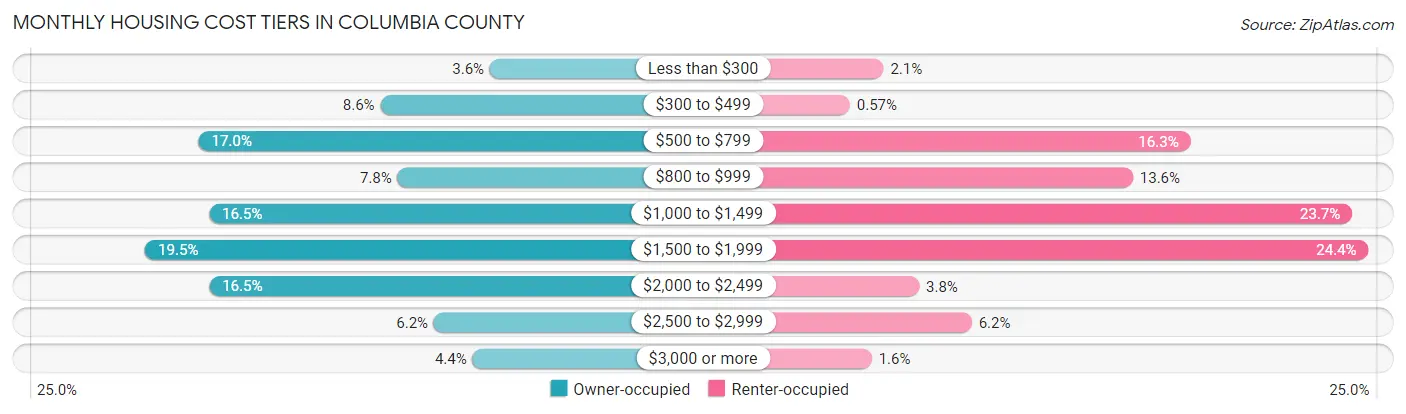
| Monthly Cost | Owner-occupied | Renter-occupied |
| Less than $300 | 557 (3.6%) | 101 (2.1%) |
| $300 to $499 | 1,343 (8.6%) | 27 (0.6%) |
| $500 to $799 | 2,646 (17.0%) | 773 (16.3%) |
| $800 to $999 | 1,219 (7.8%) | 647 (13.6%) |
| $1,000 to $1,499 | 2,571 (16.5%) | 1,127 (23.7%) |
| $1,500 to $1,999 | 3,030 (19.5%) | 1,163 (24.4%) |
| $2,000 to $2,499 | 2,570 (16.5%) | 179 (3.8%) |
| $2,500 to $2,999 | 959 (6.2%) | 294 (6.2%) |
| $3,000 or more | 682 (4.4%) | 75 (1.6%) |
| Total | 15,577 (100.0%) | 4,758 (100.0%) |
Physical Housing Characteristics in Columbia County
Housing Structures in Columbia County
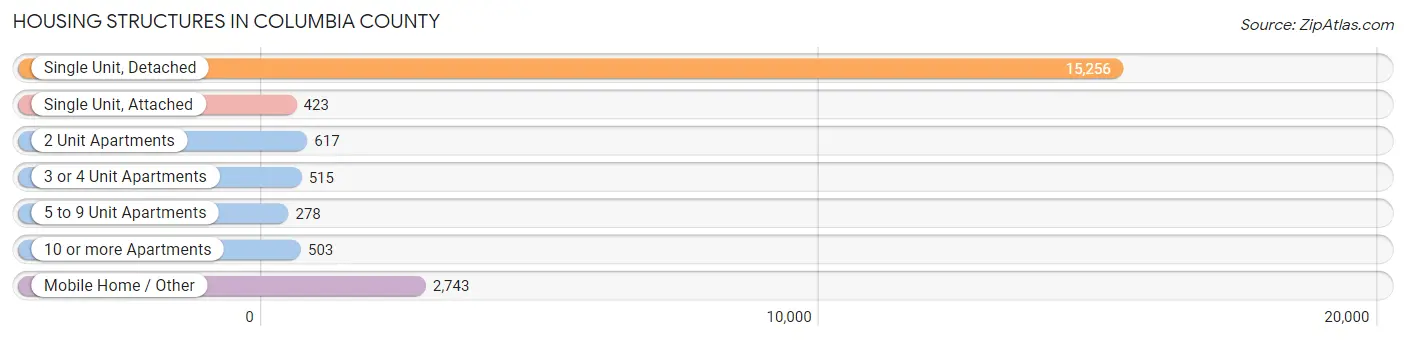
| Structure Type | # Housing Units | % Housing Units |
| Single Unit, Detached | 15,256 | 75.0% |
| Single Unit, Attached | 423 | 2.1% |
| 2 Unit Apartments | 617 | 3.0% |
| 3 or 4 Unit Apartments | 515 | 2.5% |
| 5 to 9 Unit Apartments | 278 | 1.4% |
| 10 or more Apartments | 503 | 2.5% |
| Mobile Home / Other | 2,743 | 13.5% |
| Total | 20,335 | 100.0% |
Housing Structures by Occupancy in Columbia County
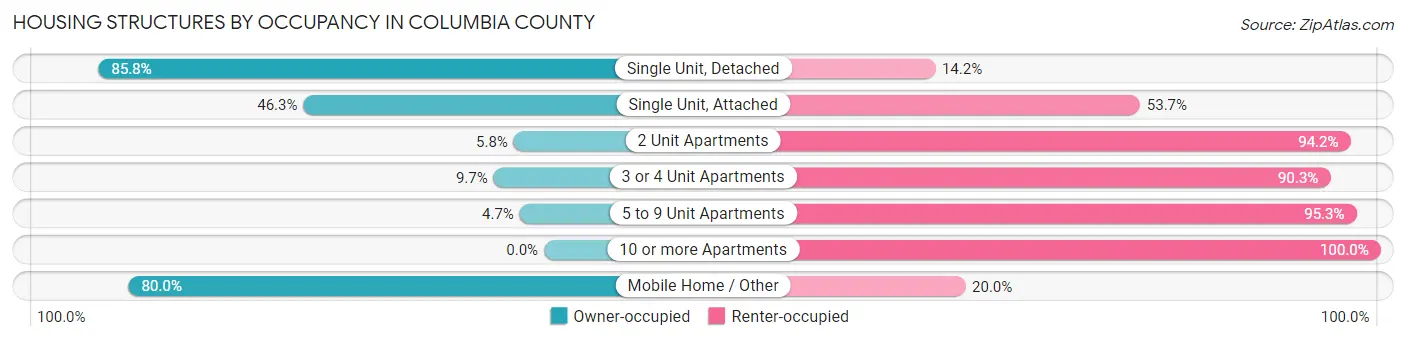
| Structure Type | Owner-occupied | Renter-occupied |
| Single Unit, Detached | 13,088 (85.8%) | 2,168 (14.2%) |
| Single Unit, Attached | 196 (46.3%) | 227 (53.7%) |
| 2 Unit Apartments | 36 (5.8%) | 581 (94.2%) |
| 3 or 4 Unit Apartments | 50 (9.7%) | 465 (90.3%) |
| 5 to 9 Unit Apartments | 13 (4.7%) | 265 (95.3%) |
| 10 or more Apartments | 0 (0.0%) | 503 (100.0%) |
| Mobile Home / Other | 2,194 (80.0%) | 549 (20.0%) |
| Total | 15,577 (76.6%) | 4,758 (23.4%) |
Housing Structures by Number of Rooms in Columbia County
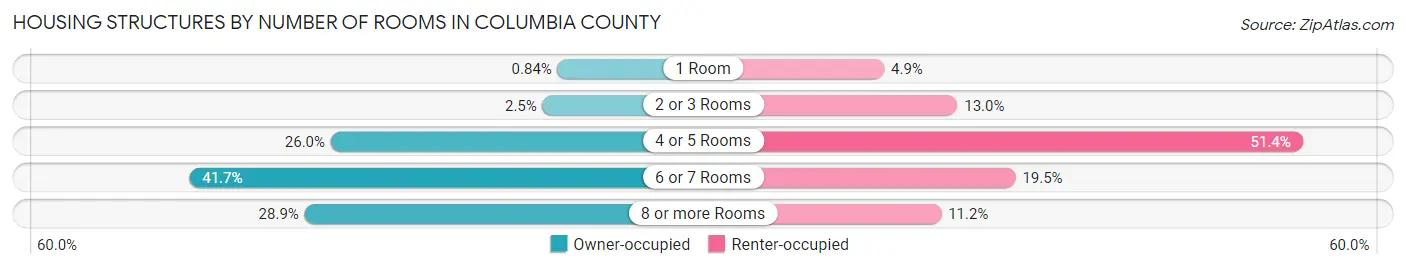
| Number of Rooms | Owner-occupied | Renter-occupied |
| 1 Room | 131 (0.8%) | 233 (4.9%) |
| 2 or 3 Rooms | 391 (2.5%) | 620 (13.0%) |
| 4 or 5 Rooms | 4,051 (26.0%) | 2,443 (51.3%) |
| 6 or 7 Rooms | 6,499 (41.7%) | 927 (19.5%) |
| 8 or more Rooms | 4,505 (28.9%) | 535 (11.2%) |
| Total | 15,577 (100.0%) | 4,758 (100.0%) |
Housing Structure by Heating Type in Columbia County
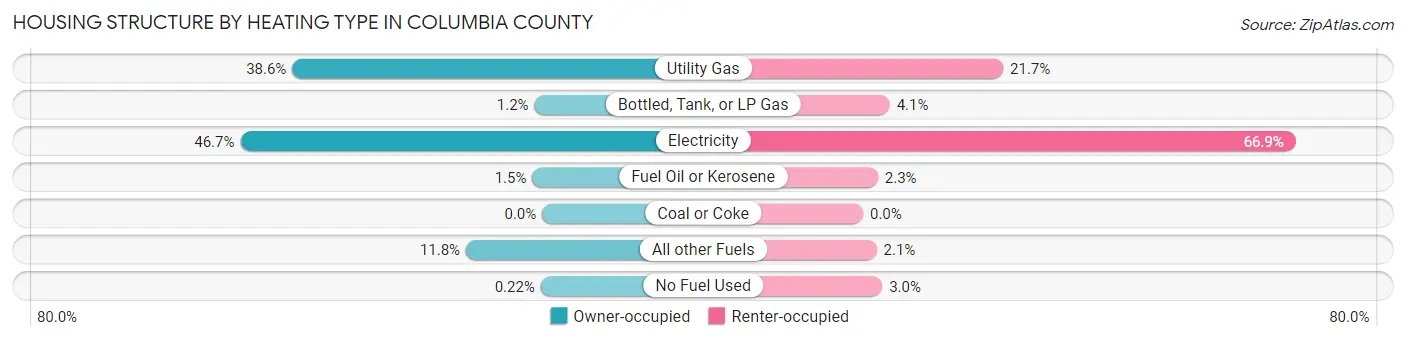
| Heating Type | Owner-occupied | Renter-occupied |
| Utility Gas | 6,018 (38.6%) | 1,030 (21.6%) |
| Bottled, Tank, or LP Gas | 185 (1.2%) | 196 (4.1%) |
| Electricity | 7,269 (46.7%) | 3,182 (66.9%) |
| Fuel Oil or Kerosene | 237 (1.5%) | 109 (2.3%) |
| Coal or Coke | 0 (0.0%) | 0 (0.0%) |
| All other Fuels | 1,833 (11.8%) | 100 (2.1%) |
| No Fuel Used | 35 (0.2%) | 141 (3.0%) |
| Total | 15,577 (100.0%) | 4,758 (100.0%) |
Household Vehicle Usage in Columbia County
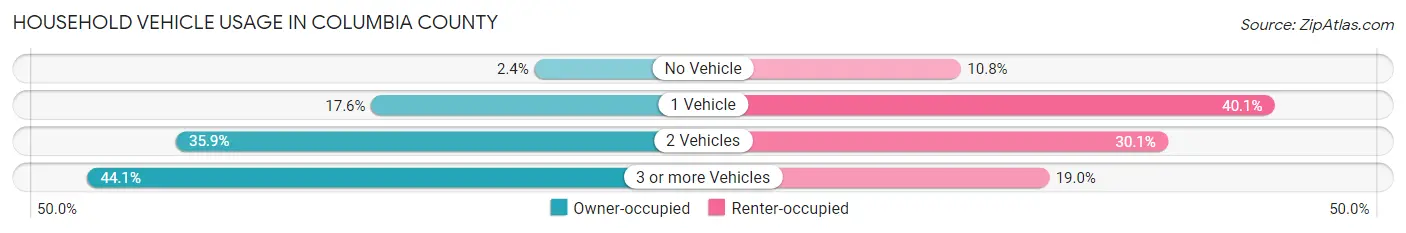
| Vehicles per Household | Owner-occupied | Renter-occupied |
| No Vehicle | 373 (2.4%) | 513 (10.8%) |
| 1 Vehicle | 2,746 (17.6%) | 1,907 (40.1%) |
| 2 Vehicles | 5,586 (35.9%) | 1,433 (30.1%) |
| 3 or more Vehicles | 6,872 (44.1%) | 905 (19.0%) |
| Total | 15,577 (100.0%) | 4,758 (100.0%) |
Real Estate & Mortgages in Columbia County
Real Estate and Mortgage Overview in Columbia County
| Characteristic | Without Mortgage | With Mortgage |
| Housing Units | 5,014 | 10,563 |
| Median Property Value | $361,300 | $366,200 |
| Median Household Income | $64,726 | $2,535 |
| Monthly Housing Costs | $588 | $682 |
| Real Estate Taxes | $2,981 | $120 |
Property Value by Mortgage Status in Columbia County
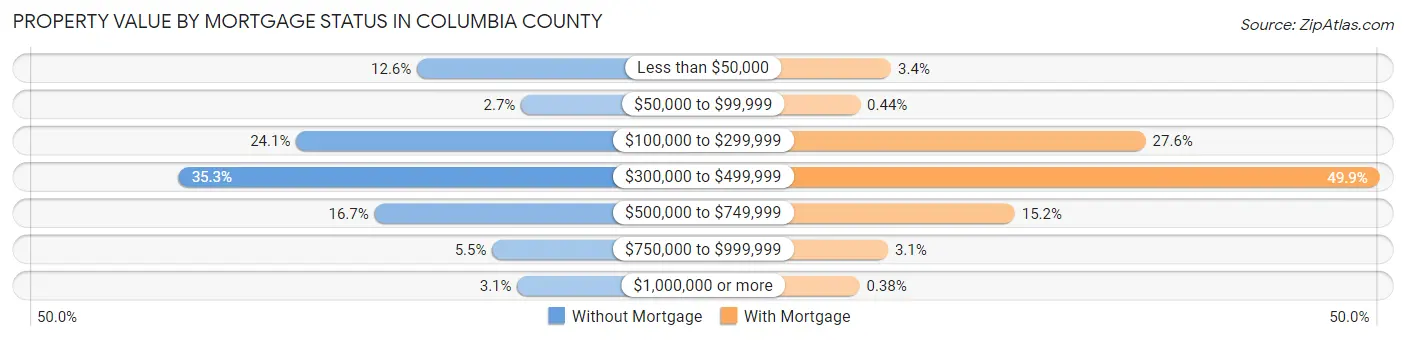
| Property Value | Without Mortgage | With Mortgage |
| Less than $50,000 | 633 (12.6%) | 358 (3.4%) |
| $50,000 to $99,999 | 136 (2.7%) | 46 (0.4%) |
| $100,000 to $299,999 | 1,210 (24.1%) | 2,919 (27.6%) |
| $300,000 to $499,999 | 1,771 (35.3%) | 5,272 (49.9%) |
| $500,000 to $749,999 | 836 (16.7%) | 1,602 (15.2%) |
| $750,000 to $999,999 | 274 (5.5%) | 326 (3.1%) |
| $1,000,000 or more | 154 (3.1%) | 40 (0.4%) |
| Total | 5,014 (100.0%) | 10,563 (100.0%) |
Household Income by Mortgage Status in Columbia County
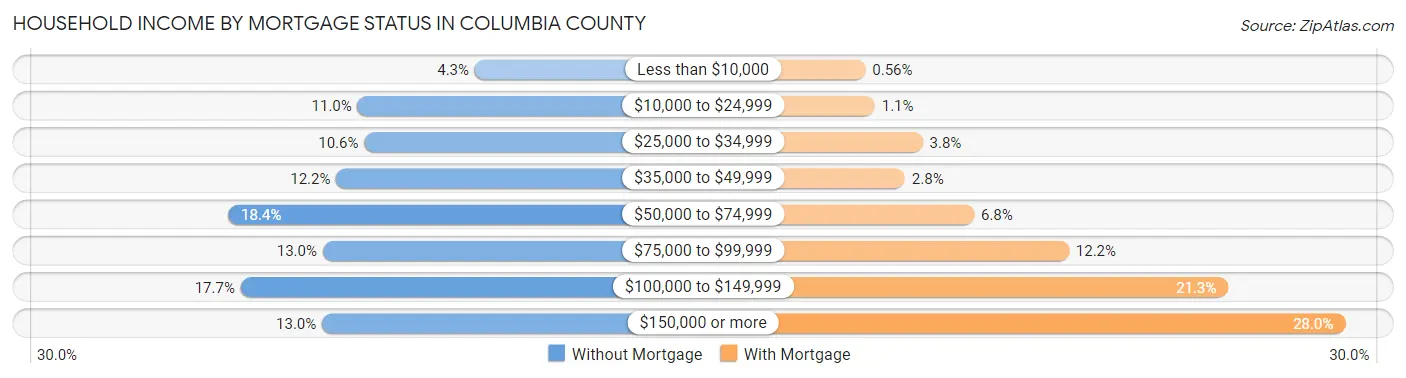
| Household Income | Without Mortgage | With Mortgage |
| Less than $10,000 | 214 (4.3%) | 59 (0.6%) |
| $10,000 to $24,999 | 550 (11.0%) | 116 (1.1%) |
| $25,000 to $34,999 | 531 (10.6%) | 405 (3.8%) |
| $35,000 to $49,999 | 611 (12.2%) | 298 (2.8%) |
| $50,000 to $74,999 | 921 (18.4%) | 715 (6.8%) |
| $75,000 to $99,999 | 650 (13.0%) | 1,288 (12.2%) |
| $100,000 to $149,999 | 885 (17.6%) | 2,250 (21.3%) |
| $150,000 or more | 652 (13.0%) | 2,956 (28.0%) |
| Total | 5,014 (100.0%) | 10,563 (100.0%) |
Property Value to Household Income Ratio in Columbia County
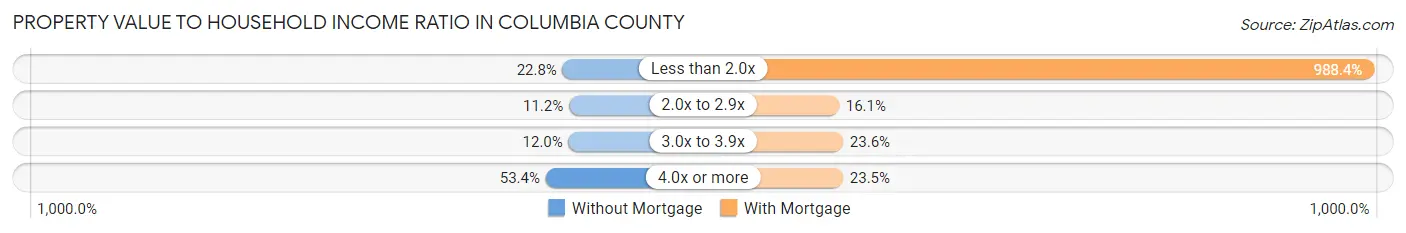
| Value-to-Income Ratio | Without Mortgage | With Mortgage |
| Less than 2.0x | 1,141 (22.8%) | 104,403 (988.4%) |
| 2.0x to 2.9x | 562 (11.2%) | 1,695 (16.1%) |
| 3.0x to 3.9x | 601 (12.0%) | 2,494 (23.6%) |
| 4.0x or more | 2,678 (53.4%) | 2,479 (23.5%) |
| Total | 5,014 (100.0%) | 10,563 (100.0%) |
Real Estate Taxes by Mortgage Status in Columbia County
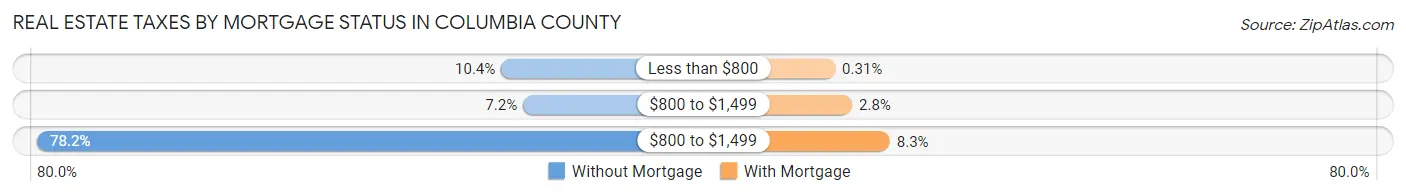
| Property Taxes | Without Mortgage | With Mortgage |
| Less than $800 | 520 (10.4%) | 33 (0.3%) |
| $800 to $1,499 | 360 (7.2%) | 294 (2.8%) |
| $800 to $1,499 | 3,919 (78.2%) | 877 (8.3%) |
| Total | 5,014 (100.0%) | 10,563 (100.0%) |
Health & Disability in Columbia County
Health Insurance Coverage by Age in Columbia County
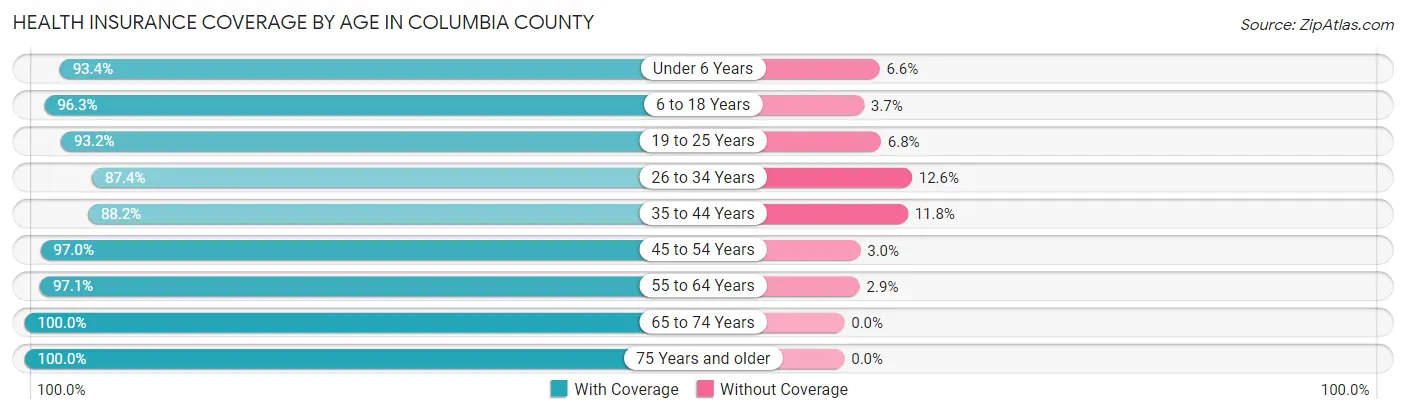
| Age Bracket | With Coverage | Without Coverage |
| Under 6 Years | 3,064 (93.4%) | 215 (6.6%) |
| 6 to 18 Years | 7,695 (96.3%) | 292 (3.7%) |
| 19 to 25 Years | 3,755 (93.2%) | 275 (6.8%) |
| 26 to 34 Years | 4,845 (87.4%) | 698 (12.6%) |
| 35 to 44 Years | 5,908 (88.2%) | 792 (11.8%) |
| 45 to 54 Years | 6,738 (97.0%) | 207 (3.0%) |
| 55 to 64 Years | 7,716 (97.1%) | 228 (2.9%) |
| 65 to 74 Years | 6,350 (100.0%) | 0 (0.0%) |
| 75 Years and older | 3,830 (100.0%) | 0 (0.0%) |
| Total | 49,901 (94.9%) | 2,707 (5.1%) |
Health Insurance Coverage by Citizenship Status in Columbia County
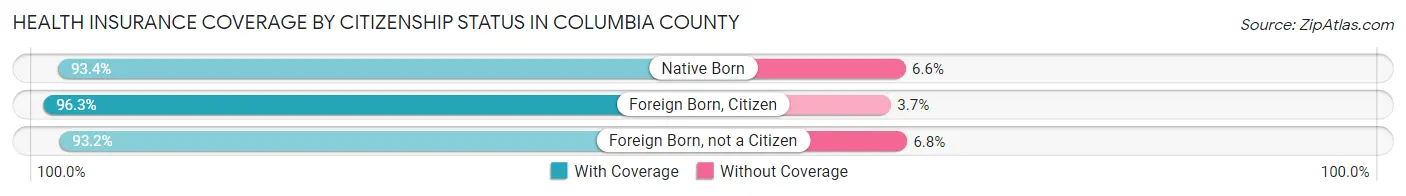
| Citizenship Status | With Coverage | Without Coverage |
| Native Born | 3,064 (93.4%) | 215 (6.6%) |
| Foreign Born, Citizen | 7,695 (96.3%) | 292 (3.7%) |
| Foreign Born, not a Citizen | 3,755 (93.2%) | 275 (6.8%) |
Health Insurance Coverage by Household Income in Columbia County
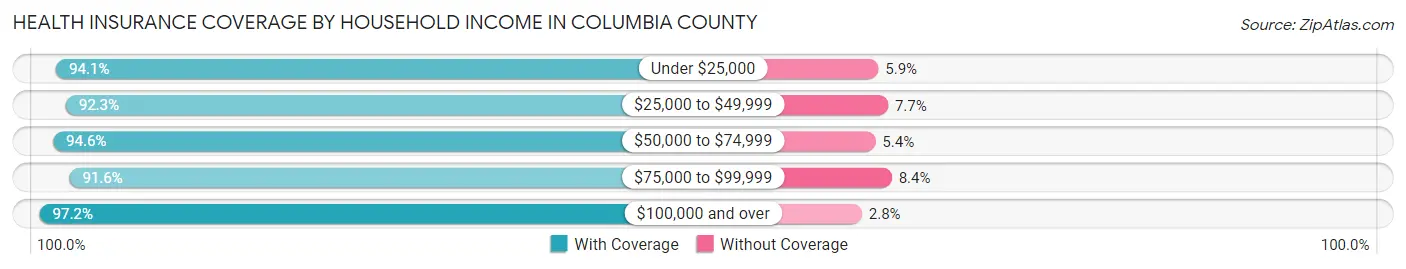
| Household Income | With Coverage | Without Coverage |
| Under $25,000 | 3,326 (94.1%) | 209 (5.9%) |
| $25,000 to $49,999 | 6,514 (92.3%) | 545 (7.7%) |
| $50,000 to $74,999 | 7,236 (94.6%) | 410 (5.4%) |
| $75,000 to $99,999 | 9,482 (91.6%) | 871 (8.4%) |
| $100,000 and over | 23,152 (97.2%) | 671 (2.8%) |
Public vs Private Health Insurance Coverage by Age in Columbia County
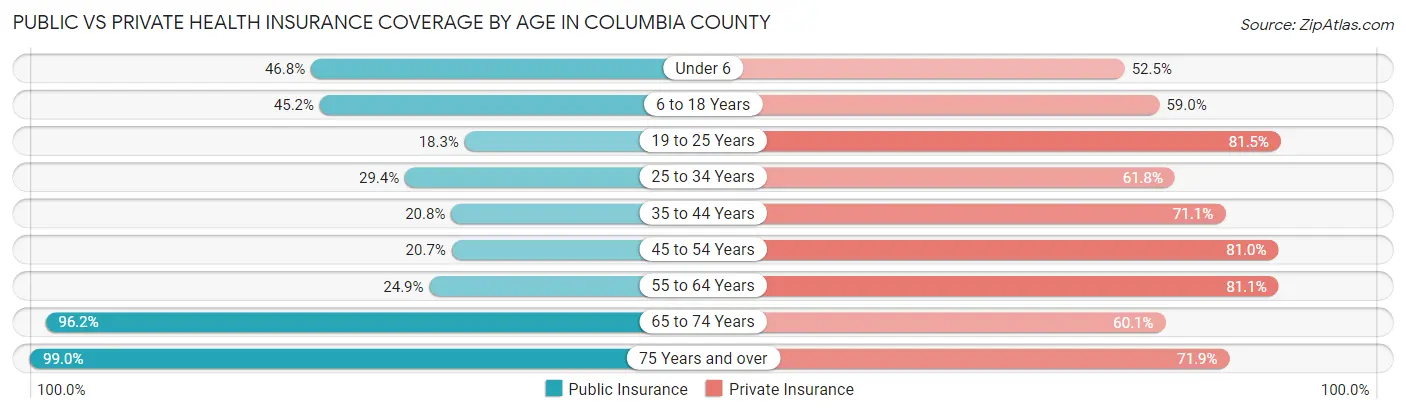
| Age Bracket | Public Insurance | Private Insurance |
| Under 6 | 1,536 (46.8%) | 1,722 (52.5%) |
| 6 to 18 Years | 3,610 (45.2%) | 4,710 (59.0%) |
| 19 to 25 Years | 738 (18.3%) | 3,284 (81.5%) |
| 25 to 34 Years | 1,629 (29.4%) | 3,426 (61.8%) |
| 35 to 44 Years | 1,394 (20.8%) | 4,765 (71.1%) |
| 45 to 54 Years | 1,440 (20.7%) | 5,626 (81.0%) |
| 55 to 64 Years | 1,976 (24.9%) | 6,439 (81.0%) |
| 65 to 74 Years | 6,106 (96.2%) | 3,813 (60.1%) |
| 75 Years and over | 3,791 (99.0%) | 2,755 (71.9%) |
| Total | 22,220 (42.2%) | 36,540 (69.5%) |
Disability Status by Sex by Age in Columbia County
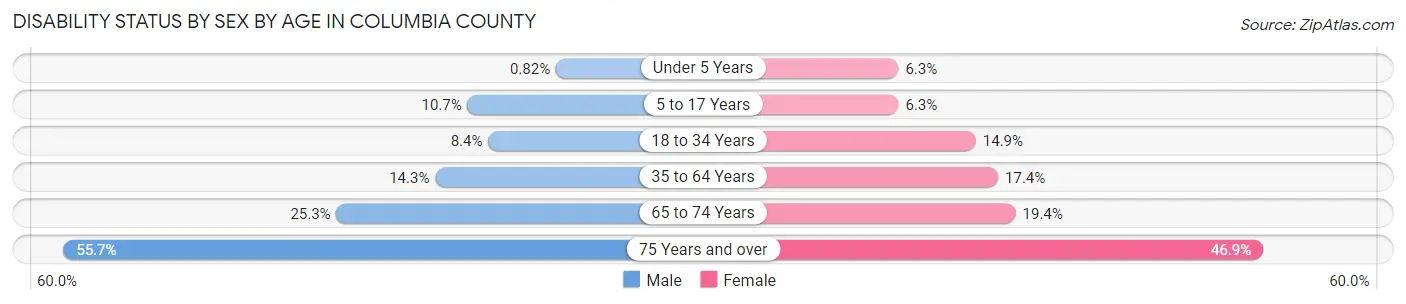
| Age Bracket | Male | Female |
| Under 5 Years | 12 (0.8%) | 77 (6.3%) |
| 5 to 17 Years | 457 (10.7%) | 244 (6.3%) |
| 18 to 34 Years | 438 (8.4%) | 712 (14.9%) |
| 35 to 64 Years | 1,542 (14.3%) | 1,877 (17.4%) |
| 65 to 74 Years | 803 (25.3%) | 614 (19.4%) |
| 75 Years and over | 998 (55.7%) | 956 (46.9%) |
Disability Class by Sex by Age in Columbia County
Disability Class: Hearing Difficulty
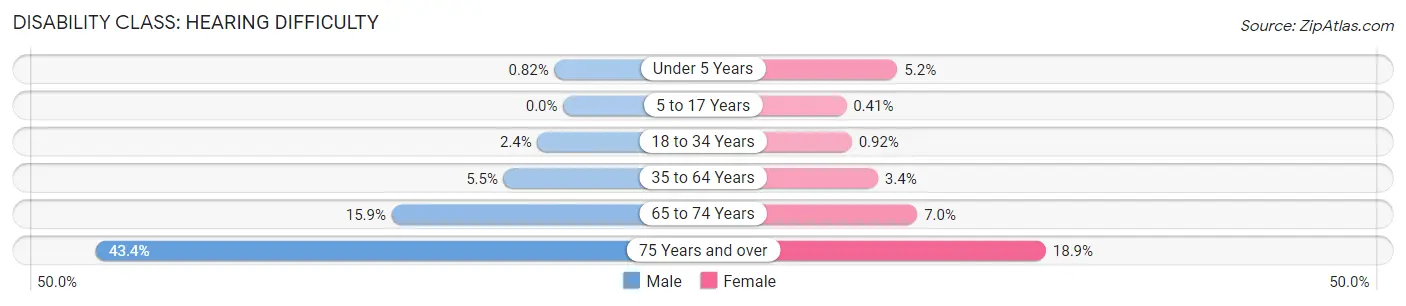
| Age Bracket | Male | Female |
| Under 5 Years | 12 (0.8%) | 63 (5.2%) |
| 5 to 17 Years | 0 (0.0%) | 16 (0.4%) |
| 18 to 34 Years | 125 (2.4%) | 44 (0.9%) |
| 35 to 64 Years | 597 (5.5%) | 361 (3.4%) |
| 65 to 74 Years | 506 (15.9%) | 222 (7.0%) |
| 75 Years and over | 777 (43.4%) | 386 (18.9%) |
Disability Class: Vision Difficulty
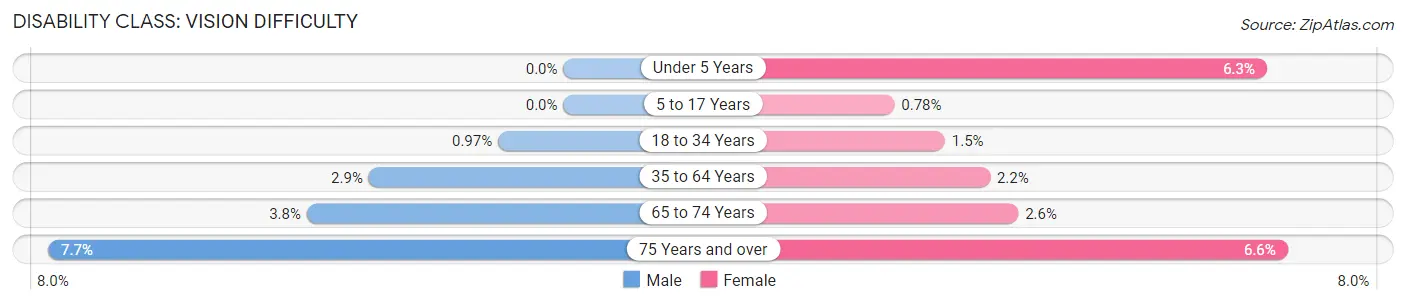
| Age Bracket | Male | Female |
| Under 5 Years | 0 (0.0%) | 77 (6.3%) |
| 5 to 17 Years | 0 (0.0%) | 30 (0.8%) |
| 18 to 34 Years | 51 (1.0%) | 73 (1.5%) |
| 35 to 64 Years | 312 (2.9%) | 237 (2.2%) |
| 65 to 74 Years | 121 (3.8%) | 83 (2.6%) |
| 75 Years and over | 137 (7.6%) | 135 (6.6%) |
Disability Class: Cognitive Difficulty
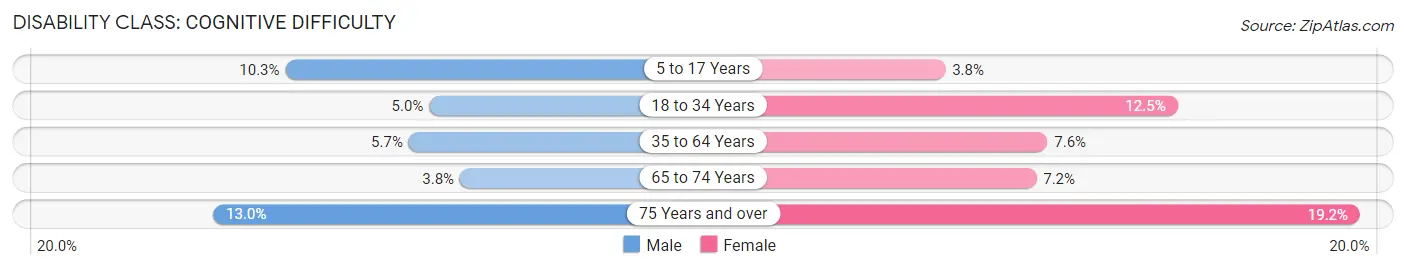
| Age Bracket | Male | Female |
| 5 to 17 Years | 442 (10.3%) | 148 (3.8%) |
| 18 to 34 Years | 261 (5.0%) | 594 (12.5%) |
| 35 to 64 Years | 620 (5.7%) | 823 (7.6%) |
| 65 to 74 Years | 122 (3.8%) | 229 (7.2%) |
| 75 Years and over | 233 (13.0%) | 392 (19.2%) |
Disability Class: Ambulatory Difficulty
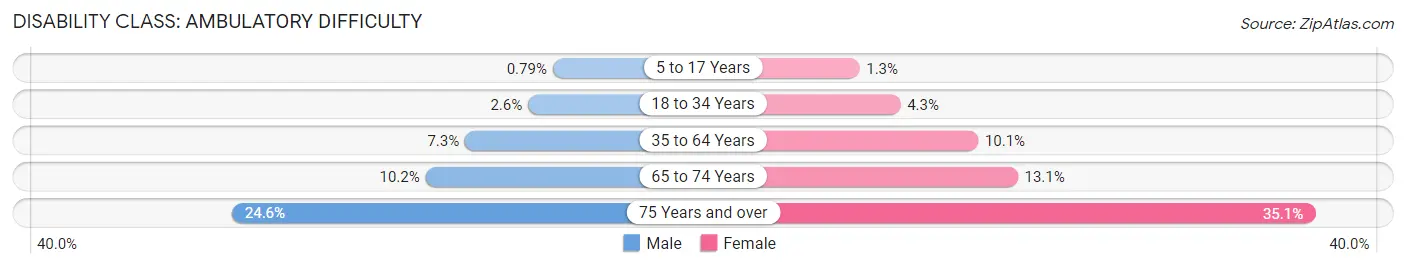
| Age Bracket | Male | Female |
| 5 to 17 Years | 34 (0.8%) | 50 (1.3%) |
| 18 to 34 Years | 137 (2.6%) | 207 (4.3%) |
| 35 to 64 Years | 789 (7.3%) | 1,090 (10.1%) |
| 65 to 74 Years | 325 (10.2%) | 414 (13.1%) |
| 75 Years and over | 441 (24.6%) | 716 (35.1%) |
Disability Class: Self-Care Difficulty
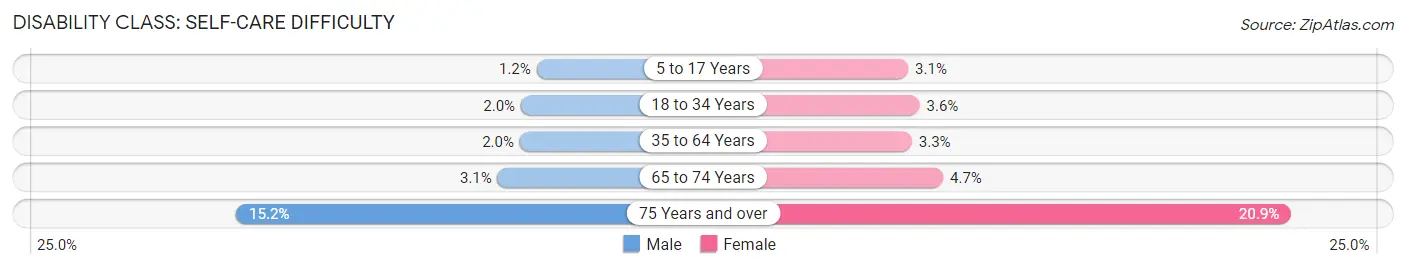
| Age Bracket | Male | Female |
| 5 to 17 Years | 53 (1.2%) | 119 (3.1%) |
| 18 to 34 Years | 103 (2.0%) | 172 (3.6%) |
| 35 to 64 Years | 218 (2.0%) | 350 (3.3%) |
| 65 to 74 Years | 97 (3.0%) | 149 (4.7%) |
| 75 Years and over | 272 (15.2%) | 425 (20.8%) |
Technology Access in Columbia County
Computing Device Access in Columbia County
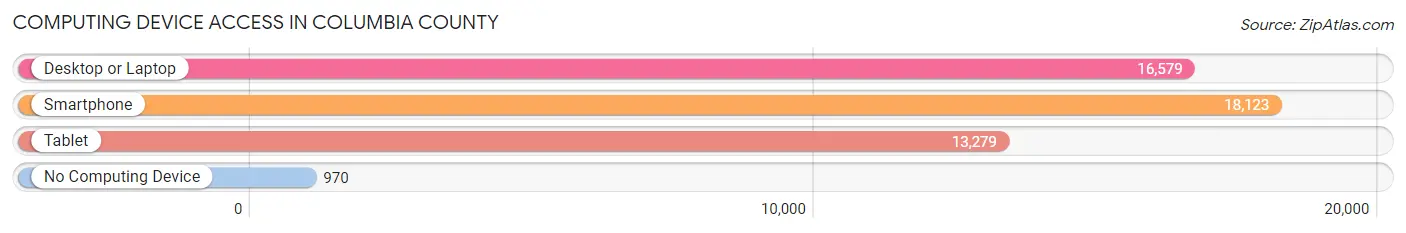
| Device Type | # Households | % Households |
| Desktop or Laptop | 16,579 | 81.5% |
| Smartphone | 18,123 | 89.1% |
| Tablet | 13,279 | 65.3% |
| No Computing Device | 970 | 4.8% |
| Total | 20,335 | 100.0% |
Internet Access in Columbia County
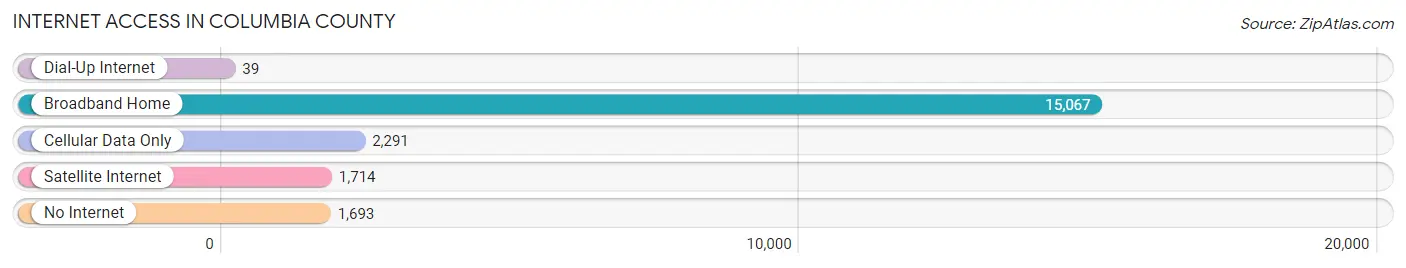
| Internet Type | # Households | % Households |
| Dial-Up Internet | 39 | 0.2% |
| Broadband Home | 15,067 | 74.1% |
| Cellular Data Only | 2,291 | 11.3% |
| Satellite Internet | 1,714 | 8.4% |
| No Internet | 1,693 | 8.3% |
| Total | 20,335 | 100.0% |
Columbia County Summary
Columbia County is located in the northwest corner of Oregon, and is bordered by the Columbia River to the north, Washington to the east, Multnomah County to the south, and Clatsop County to the west. The county seat is St. Helens, and the largest city is Scappoose. Columbia County is part of the Portland-Vancouver-Hillsboro Metropolitan Statistical Area.
History
The area that is now Columbia County was originally inhabited by the Chinook and Clatsop Native American tribes. The first European settlers arrived in the area in the early 1800s, and the county was officially established in 1854. The county was named after the Columbia River, which forms its northern border.
In the late 1800s, the county was a major producer of timber, and the lumber industry was the primary source of employment for many of the county’s residents. The timber industry declined in the early 1900s, and the county’s economy shifted to agriculture and manufacturing.
Geography
Columbia County covers an area of 1,072 square miles, and is located in the northwest corner of Oregon. The county is bordered by the Columbia River to the north, Washington to the east, Multnomah County to the south, and Clatsop County to the west. The county is mostly rural, with the majority of the population living in small towns and unincorporated communities.
The county is home to several rivers, including the Columbia, Willamette, and Clatskanie Rivers. The county is also home to several lakes, including Horseshoe Lake, Henry Hagg Lake, and Scappoose Bay. The county is mostly forested, with the majority of the land being managed by the Oregon Department of Forestry.
Economy
The economy of Columbia County is largely based on agriculture and manufacturing. The county is home to several large agricultural operations, including dairy farms, fruit orchards, and vegetable farms. The county is also home to several manufacturing companies, including Columbia Forest Products, which produces wood products, and Columbia Machine, which produces industrial machinery.
The county is also home to several small businesses, including restaurants, retail stores, and service providers. The county is also home to several tourist attractions, including the Columbia River Maritime Museum and the Columbia County Fairgrounds.
Demographics
As of the 2010 census, Columbia County had a population of 49,351. The population is mostly white (90.2%), with small percentages of Hispanic (4.2%), Asian (2.2%), and African American (1.2%) residents. The median household income is $50,945, and the median home value is $219,400.
The county is home to several small towns and unincorporated communities, including St. Helens, Scappoose, Rainier, and Clatskanie. The county is also home to several Native American reservations, including the Chinook Indian Reservation and the Clatsop Indian Reservation.
Common Questions
What is the Total Population of Columbia County?
Total Population of Columbia County is 52,865.
What is the Total Male Population of Columbia County?
Total Male Population of Columbia County is 26,965.
What is the Total Female Population of Columbia County?
Total Female Population of Columbia County is 25,900.
What is the Ratio of Males per 100 Females in Columbia County?
There are 104.11 Males per 100 Females in Columbia County.
What is the Ratio of Females per 100 Males in Columbia County?
There are 96.05 Females per 100 Males in Columbia County.
What is the Median Population Age in Columbia County?
Median Population Age in Columbia County is 43.1 Years.
What is the Average Family Size in Columbia County
Average Family Size in Columbia County is 3.0 People.
What is the Average Household Size in Columbia County
Average Household Size in Columbia County is 2.6 People.
What is Per Capita Income in Columbia County?
Per Capita income in Columbia County is $37,986.
What is the Median Family Income in Columbia County?
Median Family Income in Columbia County is $94,162.
What is the Median Household income in Columbia County?
Median Household Income in Columbia County is $83,265.
What is Income or Wage Gap in Columbia County?
Income or Wage Gap in Columbia County is 38.5%.
Women in Columbia County earn 61.5 cents for every dollar earned by a man.
What is Family Income Deficit in Columbia County?
Family Income Deficit in Columbia County is $10,190.
Families that are below poverty line in Columbia County earn $10,190 less on average than the poverty threshold level.
What is Inequality or Gini Index in Columbia County?
Inequality or Gini Index in Columbia County is 0.41.
How Large is the Labor Force in Columbia County?
There are 25,535 People in the Labor Forcein in Columbia County.
What is the Percentage of People in the Labor Force in Columbia County?
59.1% of People are in the Labor Force in Columbia County.
What is the Unemployment Rate in Columbia County?
Unemployment Rate in Columbia County is 4.5%.