Clatsop County, OR
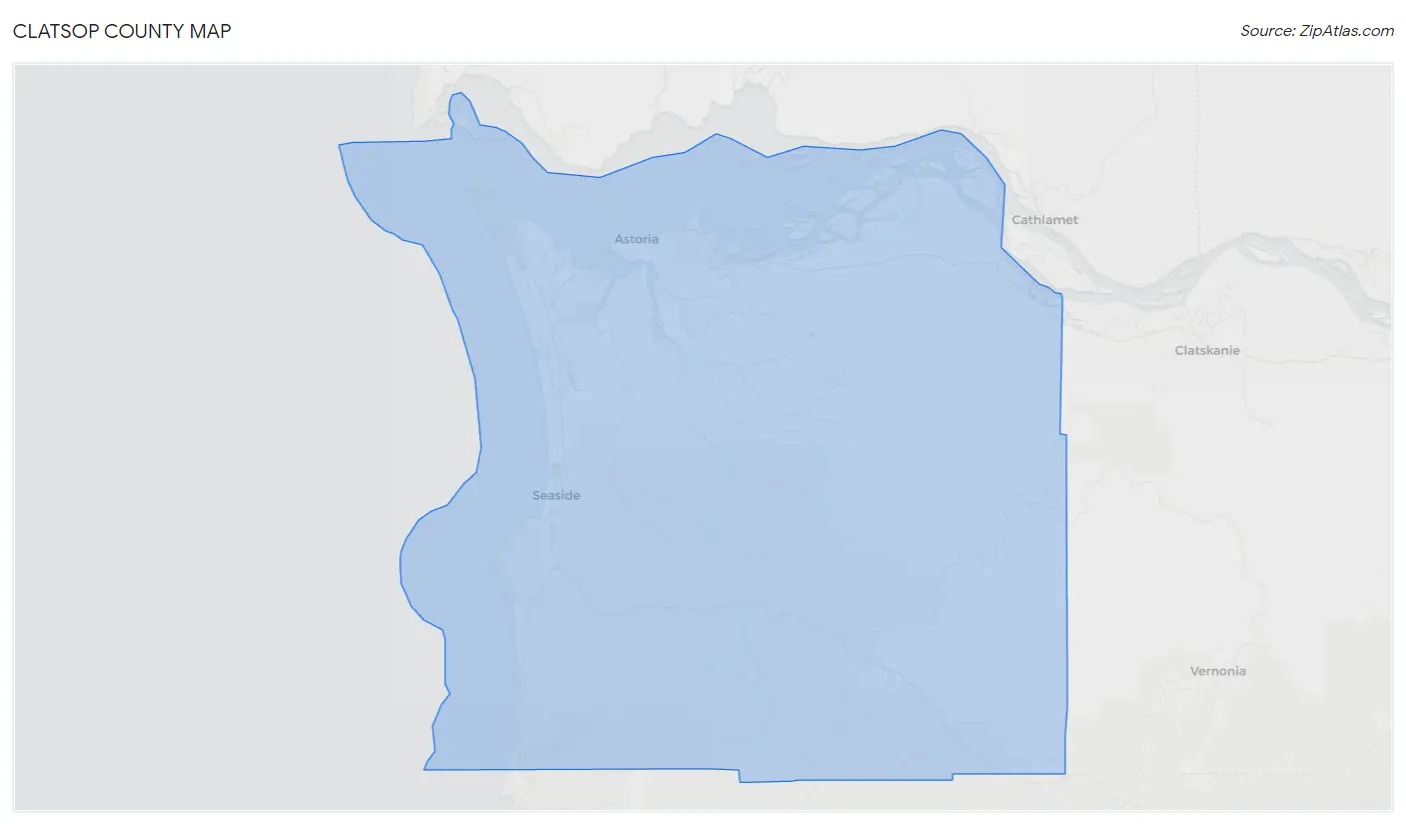
Clatsop County Map
Clatsop County Overview
41,190
TOTAL POPULATION
20,435
MALE POPULATION
20,755
FEMALE POPULATION
98.46
MALES / 100 FEMALES
101.57
FEMALES / 100 MALES
44.9
MEDIAN AGE
3.0
AVG FAMILY SIZE
2.3
AVG HOUSEHOLD SIZE
$37,166
PER CAPITA INCOME
$86,961
AVG FAMILY INCOME
$68,025
AVG HOUSEHOLD INCOME
18.5%
WAGE / INCOME GAP [ % ]
81.5¢/ $1
WAGE / INCOME GAP [ $ ]
$11,998
FAMILY INCOME DEFICIT
0.43
INEQUALITY / GINI INDEX
19,875
LABOR FORCE [ PEOPLE ]
57.8%
PERCENT IN LABOR FORCE
4.8%
UNEMPLOYMENT RATE
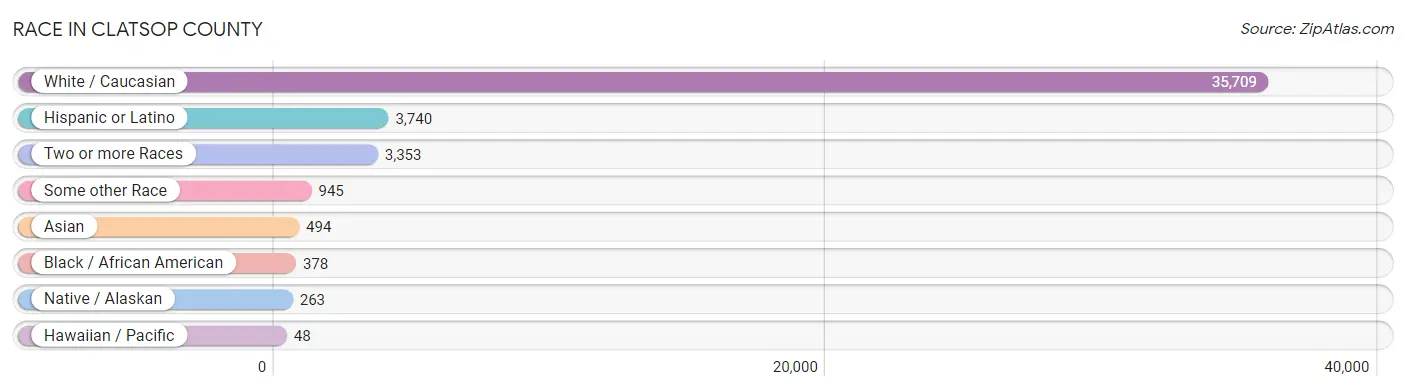
Race in Clatsop County
The most populous races in Clatsop County are White / Caucasian (35,709 | 86.7%), Hispanic or Latino (3,740 | 9.1%), and Two or more Races (3,353 | 8.1%).
| Race | # Population | % Population |
| Asian | 494 | 1.2% |
| Black / African American | 378 | 0.9% |
| Hawaiian / Pacific | 48 | 0.1% |
| Hispanic or Latino | 3,740 | 9.1% |
| Native / Alaskan | 263 | 0.6% |
| White / Caucasian | 35,709 | 86.7% |
| Two or more Races | 3,353 | 8.1% |
| Some other Race | 945 | 2.3% |
| Total | 41,190 | 100.0% |
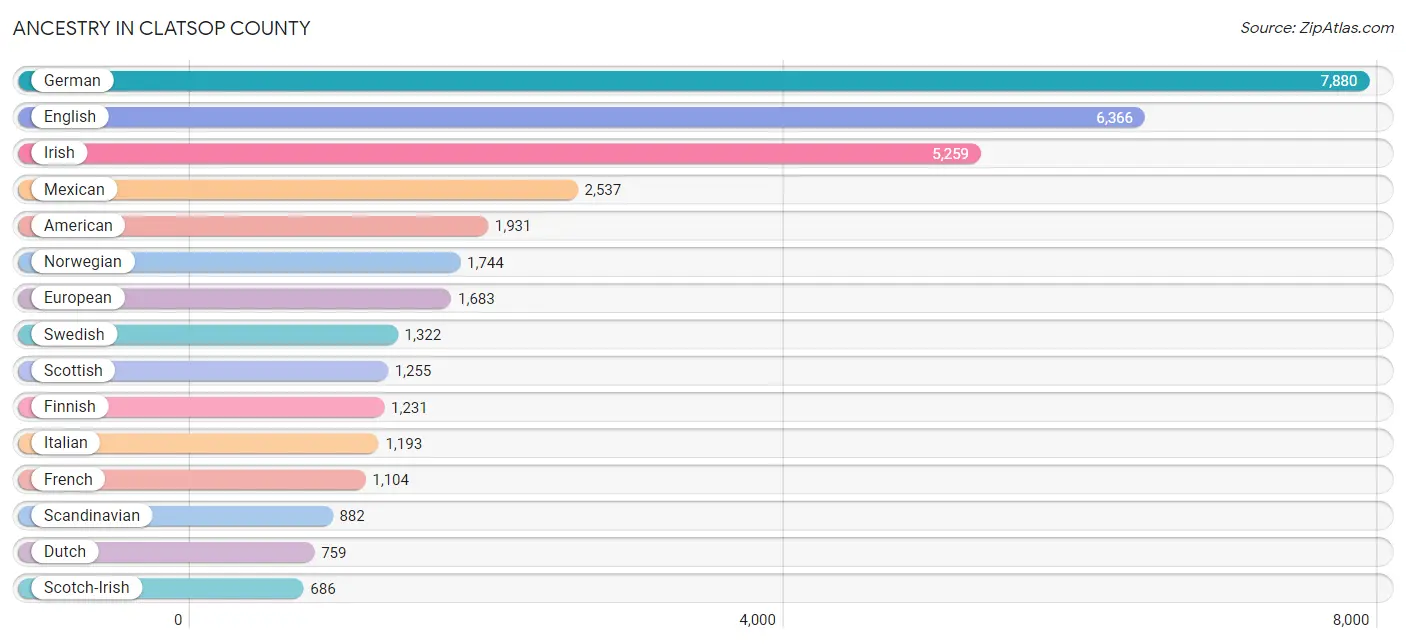
Ancestry in Clatsop County
The most populous ancestries reported in Clatsop County are German (7,880 | 19.1%), English (6,366 | 15.5%), Irish (5,259 | 12.8%), Mexican (2,537 | 6.2%), and American (1,931 | 4.7%), together accounting for 58.2% of all Clatsop County residents.
| Ancestry | # Population | % Population |
| African | 11 | 0.0% |
| American | 1,931 | 4.7% |
| Arab | 20 | 0.1% |
| Armenian | 57 | 0.1% |
| Australian | 18 | 0.0% |
| Austrian | 81 | 0.2% |
| Basque | 14 | 0.0% |
| Belgian | 26 | 0.1% |
| Bhutanese | 120 | 0.3% |
| Blackfeet | 118 | 0.3% |
| Bolivian | 76 | 0.2% |
| Brazilian | 41 | 0.1% |
| British | 494 | 1.2% |
| Bulgarian | 3 | 0.0% |
| Burmese | 67 | 0.2% |
| Cajun | 61 | 0.2% |
| Canadian | 108 | 0.3% |
| Celtic | 4 | 0.0% |
| Central American | 257 | 0.6% |
| Cherokee | 138 | 0.3% |
| Chilean | 43 | 0.1% |
| Chippewa | 39 | 0.1% |
| Colombian | 40 | 0.1% |
| Comanche | 4 | 0.0% |
| Creek | 15 | 0.0% |
| Croatian | 33 | 0.1% |
| Crow | 17 | 0.0% |
| Cuban | 71 | 0.2% |
| Czech | 149 | 0.4% |
| Czechoslovakian | 140 | 0.3% |
| Danish | 581 | 1.4% |
| Dominican | 37 | 0.1% |
| Dutch | 759 | 1.8% |
| Eastern European | 152 | 0.4% |
| Egyptian | 7 | 0.0% |
| English | 6,366 | 15.5% |
| Ethiopian | 9 | 0.0% |
| European | 1,683 | 4.1% |
| Finnish | 1,231 | 3.0% |
| French | 1,104 | 2.7% |
| French Canadian | 263 | 0.6% |
| German | 7,880 | 19.1% |
| German Russian | 9 | 0.0% |
| Greek | 346 | 0.8% |
| Guamanian / Chamorro | 20 | 0.1% |
| Guatemalan | 110 | 0.3% |
| Honduran | 25 | 0.1% |
| Hungarian | 90 | 0.2% |
| Indian (Asian) | 246 | 0.6% |
| Iranian | 36 | 0.1% |
| Irish | 5,259 | 12.8% |
| Iroquois | 30 | 0.1% |
| Italian | 1,193 | 2.9% |
| Korean | 474 | 1.1% |
| Laotian | 29 | 0.1% |
| Lebanese | 10 | 0.0% |
| Lithuanian | 27 | 0.1% |
| Menominee | 15 | 0.0% |
| Mexican | 2,537 | 6.2% |
| Mexican American Indian | 108 | 0.3% |
| Native Hawaiian | 219 | 0.5% |
| Navajo | 2 | 0.0% |
| New Zealander | 13 | 0.0% |
| Nicaraguan | 78 | 0.2% |
| Northern European | 96 | 0.2% |
| Norwegian | 1,744 | 4.2% |
| Osage | 1 | 0.0% |
| Pakistani | 94 | 0.2% |
| Polish | 570 | 1.4% |
| Portuguese | 229 | 0.6% |
| Puerto Rican | 91 | 0.2% |
| Puget Sound Salish | 140 | 0.3% |
| Romanian | 126 | 0.3% |
| Russian | 182 | 0.4% |
| Salvadoran | 44 | 0.1% |
| Scandinavian | 882 | 2.1% |
| Scotch-Irish | 686 | 1.7% |
| Scottish | 1,255 | 3.0% |
| Seminole | 12 | 0.0% |
| Sioux | 38 | 0.1% |
| Slavic | 70 | 0.2% |
| South American | 179 | 0.4% |
| Spaniard | 37 | 0.1% |
| Spanish | 153 | 0.4% |
| Sri Lankan | 73 | 0.2% |
| Subsaharan African | 20 | 0.1% |
| Swedish | 1,322 | 3.2% |
| Swiss | 94 | 0.2% |
| Syrian | 3 | 0.0% |
| Thai | 43 | 0.1% |
| Turkish | 19 | 0.1% |
| Ukrainian | 117 | 0.3% |
| Venezuelan | 20 | 0.1% |
| Welsh | 254 | 0.6% |
| Yugoslavian | 37 | 0.1% | View All 95 Rows |
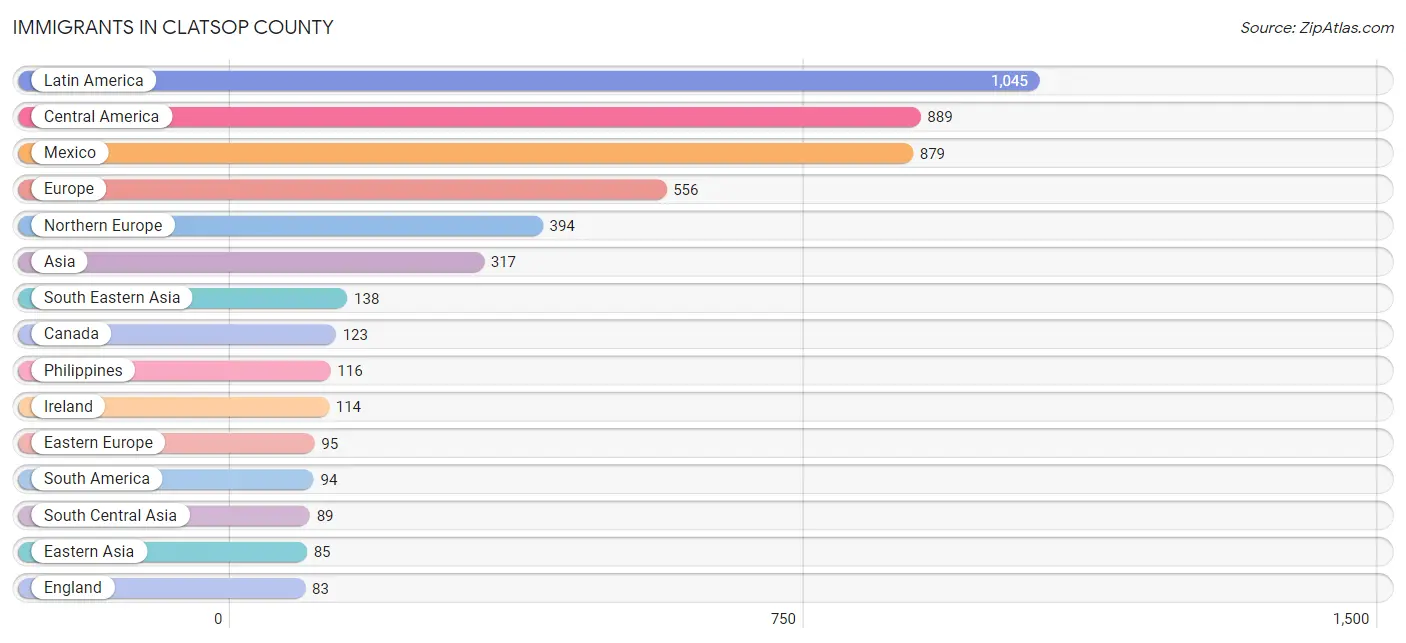
Immigrants in Clatsop County
The most numerous immigrant groups reported in Clatsop County came from Latin America (1,045 | 2.5%), Central America (889 | 2.2%), Mexico (879 | 2.1%), Europe (556 | 1.3%), and Northern Europe (394 | 1.0%), together accounting for 9.1% of all Clatsop County residents.
| Immigration Origin | # Population | % Population |
| Africa | 26 | 0.1% |
| Asia | 317 | 0.8% |
| Australia | 34 | 0.1% |
| Brazil | 11 | 0.0% |
| Cabo Verde | 17 | 0.0% |
| Canada | 123 | 0.3% |
| Caribbean | 62 | 0.2% |
| Central America | 889 | 2.2% |
| Chile | 43 | 0.1% |
| China | 46 | 0.1% |
| Colombia | 20 | 0.1% |
| Cuba | 25 | 0.1% |
| Czechoslovakia | 13 | 0.0% |
| Dominican Republic | 37 | 0.1% |
| Eastern Africa | 9 | 0.0% |
| Eastern Asia | 85 | 0.2% |
| Eastern Europe | 95 | 0.2% |
| El Salvador | 7 | 0.0% |
| England | 83 | 0.2% |
| Ethiopia | 9 | 0.0% |
| Europe | 556 | 1.3% |
| Germany | 23 | 0.1% |
| Greece | 34 | 0.1% |
| Hungary | 8 | 0.0% |
| India | 53 | 0.1% |
| Iran | 36 | 0.1% |
| Ireland | 114 | 0.3% |
| Japan | 30 | 0.1% |
| Korea | 9 | 0.0% |
| Latin America | 1,045 | 2.5% |
| Lebanon | 5 | 0.0% |
| Mexico | 879 | 2.1% |
| Netherlands | 10 | 0.0% |
| Nicaragua | 3 | 0.0% |
| Northern Europe | 394 | 1.0% |
| Norway | 12 | 0.0% |
| Oceania | 34 | 0.1% |
| Philippines | 116 | 0.3% |
| Poland | 10 | 0.0% |
| Romania | 49 | 0.1% |
| Scotland | 26 | 0.1% |
| South America | 94 | 0.2% |
| South Central Asia | 89 | 0.2% |
| South Eastern Asia | 138 | 0.3% |
| Southern Europe | 34 | 0.1% |
| Sweden | 34 | 0.1% |
| Taiwan | 16 | 0.0% |
| Ukraine | 15 | 0.0% |
| Venezuela | 20 | 0.1% |
| Vietnam | 22 | 0.1% |
| Western Africa | 17 | 0.0% |
| Western Asia | 5 | 0.0% |
| Western Europe | 33 | 0.1% | View All 53 Rows |
Sex and Age in Clatsop County
Sex and Age in Clatsop County
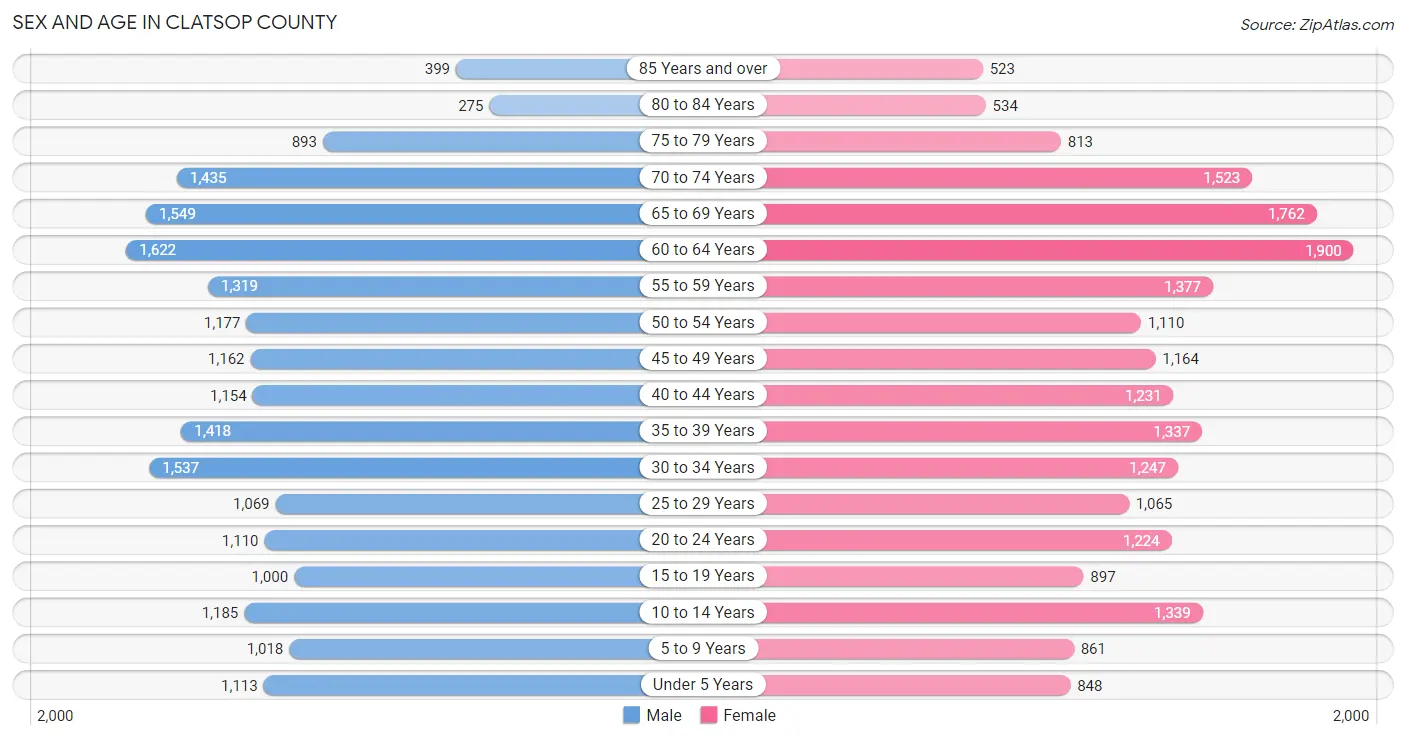
The most populous age groups in Clatsop County are 60 to 64 Years (1,622 | 7.9%) for men and 60 to 64 Years (1,900 | 9.1%) for women.
| Age Bracket | Male | Female |
| Under 5 Years | 1,113 (5.4%) | 848 (4.1%) |
| 5 to 9 Years | 1,018 (5.0%) | 861 (4.2%) |
| 10 to 14 Years | 1,185 (5.8%) | 1,339 (6.5%) |
| 15 to 19 Years | 1,000 (4.9%) | 897 (4.3%) |
| 20 to 24 Years | 1,110 (5.4%) | 1,224 (5.9%) |
| 25 to 29 Years | 1,069 (5.2%) | 1,065 (5.1%) |
| 30 to 34 Years | 1,537 (7.5%) | 1,247 (6.0%) |
| 35 to 39 Years | 1,418 (6.9%) | 1,337 (6.4%) |
| 40 to 44 Years | 1,154 (5.7%) | 1,231 (5.9%) |
| 45 to 49 Years | 1,162 (5.7%) | 1,164 (5.6%) |
| 50 to 54 Years | 1,177 (5.8%) | 1,110 (5.3%) |
| 55 to 59 Years | 1,319 (6.5%) | 1,377 (6.6%) |
| 60 to 64 Years | 1,622 (7.9%) | 1,900 (9.1%) |
| 65 to 69 Years | 1,549 (7.6%) | 1,762 (8.5%) |
| 70 to 74 Years | 1,435 (7.0%) | 1,523 (7.3%) |
| 75 to 79 Years | 893 (4.4%) | 813 (3.9%) |
| 80 to 84 Years | 275 (1.3%) | 534 (2.6%) |
| 85 Years and over | 399 (1.9%) | 523 (2.5%) |
| Total | 20,435 (100.0%) | 20,755 (100.0%) |
Families and Households in Clatsop County
Median Family Size in Clatsop County
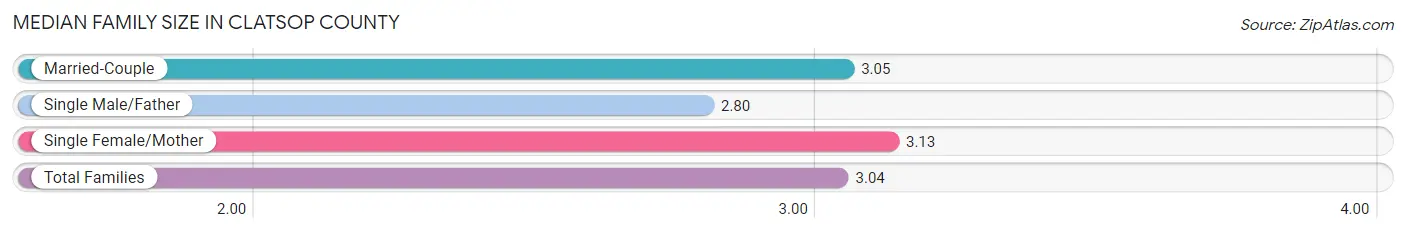
The median family size in Clatsop County is 3.04 persons per family, with single female/mother families (1,292 | 13.1%) accounting for the largest median family size of 3.13 persons per family. On the other hand, single male/father families (857 | 8.7%) represent the smallest median family size with 2.80 persons per family.
| Family Type | # Families | Family Size |
| Married-Couple | 7,752 (78.3%) | 3.05 |
| Single Male/Father | 857 (8.7%) | 2.80 |
| Single Female/Mother | 1,292 (13.1%) | 3.13 |
| Total Families | 9,901 (100.0%) | 3.04 |
Median Household Size in Clatsop County
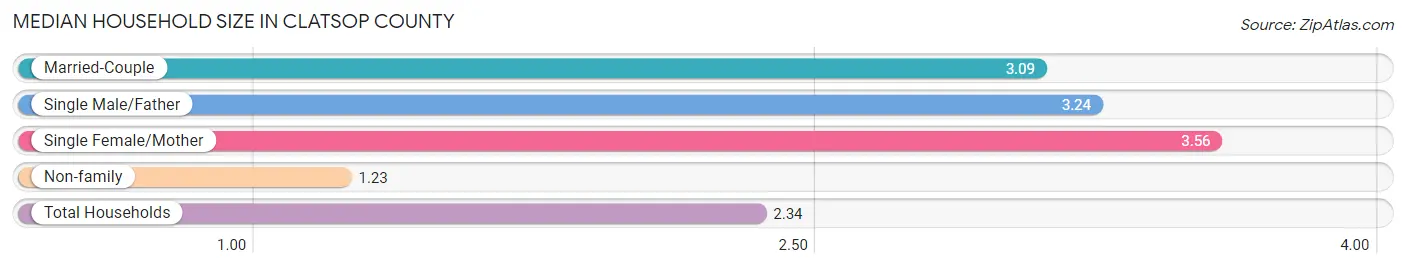
The median household size in Clatsop County is 2.34 persons per household, with single female/mother households (1,292 | 7.5%) accounting for the largest median household size of 3.56 persons per household. non-family households (7,345 | 42.6%) represent the smallest median household size with 1.23 persons per household.
| Household Type | # Households | Household Size |
| Married-Couple | 7,752 (45.0%) | 3.09 |
| Single Male/Father | 857 (5.0%) | 3.24 |
| Single Female/Mother | 1,292 (7.5%) | 3.56 |
| Non-family | 7,345 (42.6%) | 1.23 |
| Total Households | 17,246 (100.0%) | 2.34 |
Household Size by Marriage Status in Clatsop County
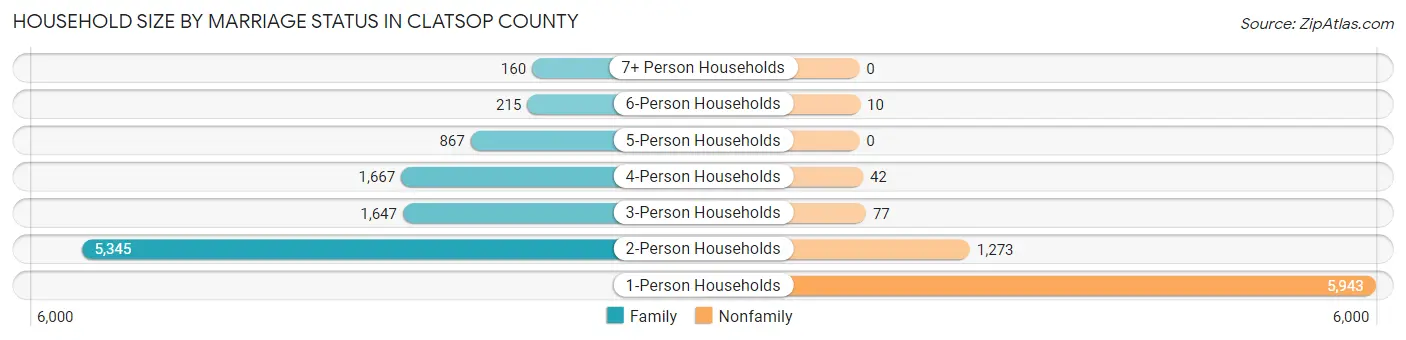
Out of a total of 17,246 households in Clatsop County, 9,901 (57.4%) are family households, while 7,345 (42.6%) are nonfamily households. The most numerous type of family households are 2-person households, comprising 5,345, and the most common type of nonfamily households are 1-person households, comprising 5,943.
| Household Size | Family Households | Nonfamily Households |
| 1-Person Households | - | 5,943 (34.5%) |
| 2-Person Households | 5,345 (31.0%) | 1,273 (7.4%) |
| 3-Person Households | 1,647 (9.6%) | 77 (0.4%) |
| 4-Person Households | 1,667 (9.7%) | 42 (0.2%) |
| 5-Person Households | 867 (5.0%) | 0 (0.0%) |
| 6-Person Households | 215 (1.3%) | 10 (0.1%) |
| 7+ Person Households | 160 (0.9%) | 0 (0.0%) |
| Total | 9,901 (57.4%) | 7,345 (42.6%) |
Female Fertility in Clatsop County
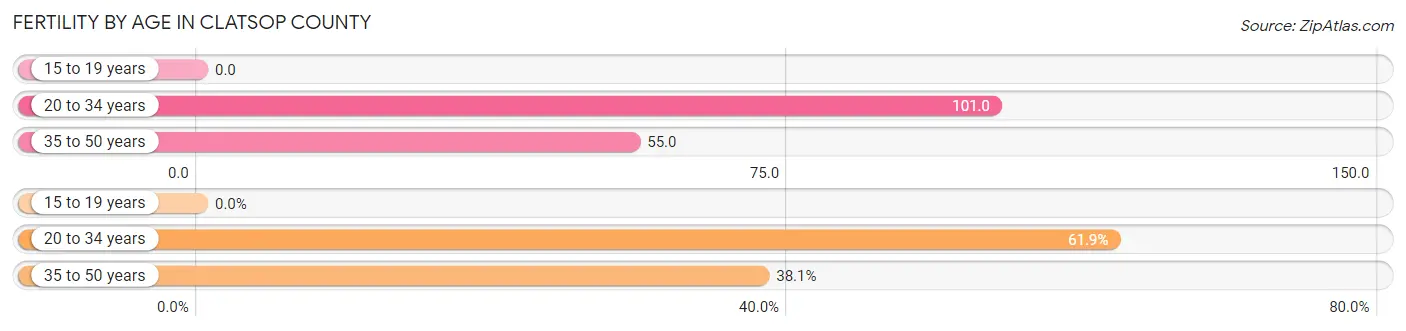
Fertility by Age in Clatsop County
Average fertility rate in Clatsop County is 69.0 births per 1,000 women. Women in the age bracket of 20 to 34 years have the highest fertility rate with 101.0 births per 1,000 women. Women in the age bracket of 20 to 34 years acount for 61.9% of all women with births.
| Age Bracket | Women with Births | Births / 1,000 Women |
| 15 to 19 years | 0 (0.0%) | 0.0 |
| 20 to 34 years | 356 (61.9%) | 101.0 |
| 35 to 50 years | 219 (38.1%) | 55.0 |
| Total | 575 (100.0%) | 69.0 |
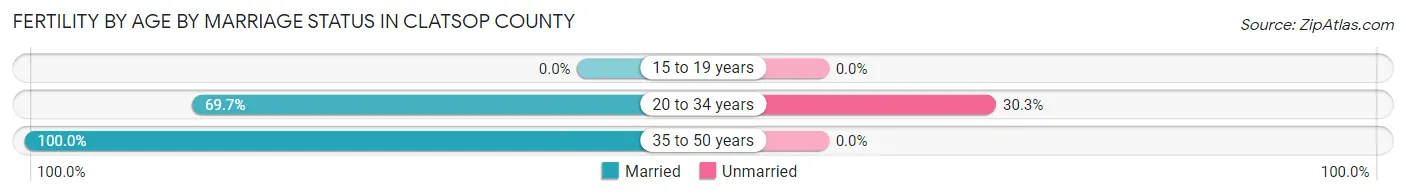
Fertility by Age by Marriage Status in Clatsop County
81.2% of women with births (575) in Clatsop County are married. The highest percentage of unmarried women with births falls into 20 to 34 years age bracket with 30.3% of them unmarried at the time of birth, while the lowest percentage of unmarried women with births belong to 35 to 50 years age bracket with 0.0% of them unmarried.
| Age Bracket | Married | Unmarried |
| 15 to 19 years | 0 (0.0%) | 0 (0.0%) |
| 20 to 34 years | 248 (69.7%) | 108 (30.3%) |
| 35 to 50 years | 219 (100.0%) | 0 (0.0%) |
| Total | 467 (81.2%) | 108 (18.8%) |
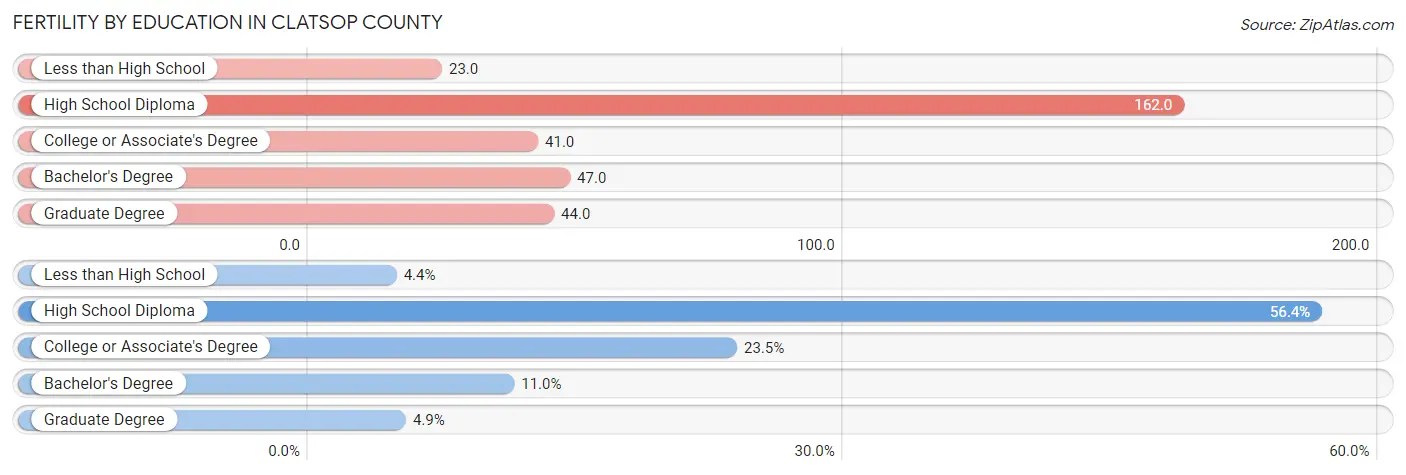
Fertility by Education in Clatsop County
Average fertility rate in Clatsop County is 69.0 births per 1,000 women. Women with the education attainment of high school diploma have the highest fertility rate of 162.0 births per 1,000 women, while women with the education attainment of less than high school have the lowest fertility at 23.0 births per 1,000 women. Women with the education attainment of high school diploma represent 56.4% of all women with births.
| Educational Attainment | Women with Births | Births / 1,000 Women |
| Less than High School | 25 (4.3%) | 23.0 |
| High School Diploma | 324 (56.4%) | 162.0 |
| College or Associate's Degree | 135 (23.5%) | 41.0 |
| Bachelor's Degree | 63 (11.0%) | 47.0 |
| Graduate Degree | 28 (4.9%) | 44.0 |
| Total | 575 (100.0%) | 69.0 |
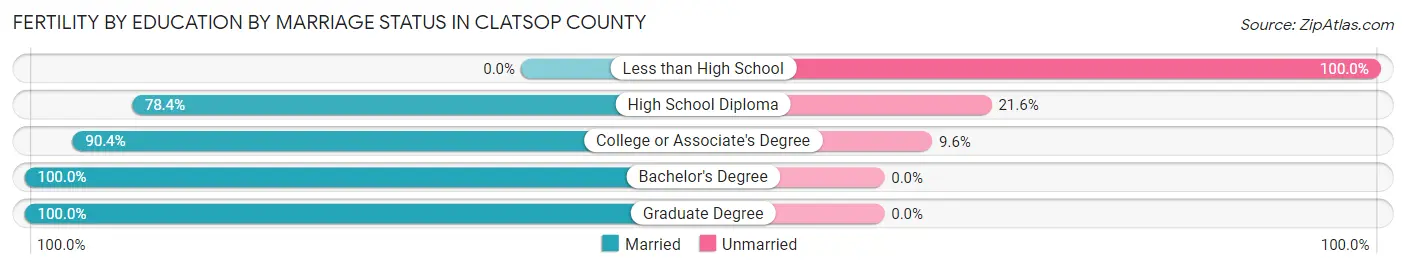
Fertility by Education by Marriage Status in Clatsop County
18.8% of women with births in Clatsop County are unmarried. Women with the educational attainment of bachelor's degree are most likely to be married with 100.0% of them married at childbirth, while women with the educational attainment of less than high school are least likely to be married with 100.0% of them unmarried at childbirth.
| Educational Attainment | Married | Unmarried |
| Less than High School | 0 (0.0%) | 25 (100.0%) |
| High School Diploma | 254 (78.4%) | 70 (21.6%) |
| College or Associate's Degree | 122 (90.4%) | 13 (9.6%) |
| Bachelor's Degree | 63 (100.0%) | 0 (0.0%) |
| Graduate Degree | 28 (100.0%) | 0 (0.0%) |
| Total | 467 (81.2%) | 108 (18.8%) |
Income in Clatsop County
Income Overview in Clatsop County
Per Capita Income in Clatsop County is $37,166, while median incomes of families and households are $86,961 and $68,025 respectively.
| Characteristic | Number | Measure |
| Per Capita Income | 41,190 | $37,166 |
| Median Family Income | 9,901 | $86,961 |
| Mean Family Income | 9,901 | $104,336 |
| Median Household Income | 17,246 | $68,025 |
| Mean Household Income | 17,246 | $86,594 |
| Income Deficit | 9,901 | $11,998 |
| Wage / Income Gap (%) | 41,190 | 18.48% |
| Wage / Income Gap ($) | 41,190 | 81.52¢ per $1 |
| Gini / Inequality Index | 41,190 | 0.43 |
Earnings by Sex in Clatsop County
Average Earnings in Clatsop County are $37,993, $42,334 for men and $34,510 for women, a difference of 18.5%.
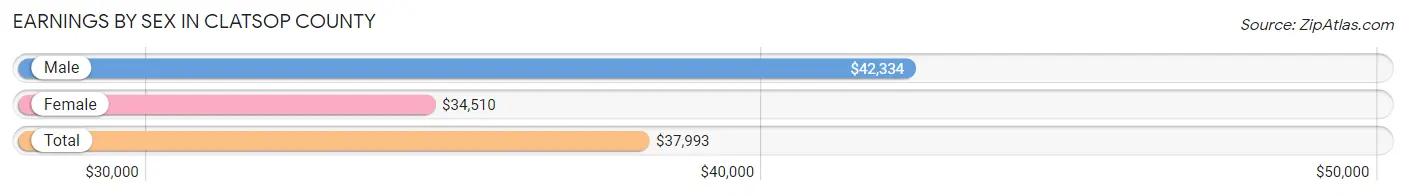
| Sex | Number | Average Earnings |
| Male | 11,187 (53.6%) | $42,334 |
| Female | 9,680 (46.4%) | $34,510 |
| Total | 20,867 (100.0%) | $37,993 |
Earnings by Sex by Income Bracket in Clatsop County
The most common earnings brackets in Clatsop County are $100,000+ for men (1,765 | 15.8%) and $35,000 to $39,999 for women (887 | 9.2%).
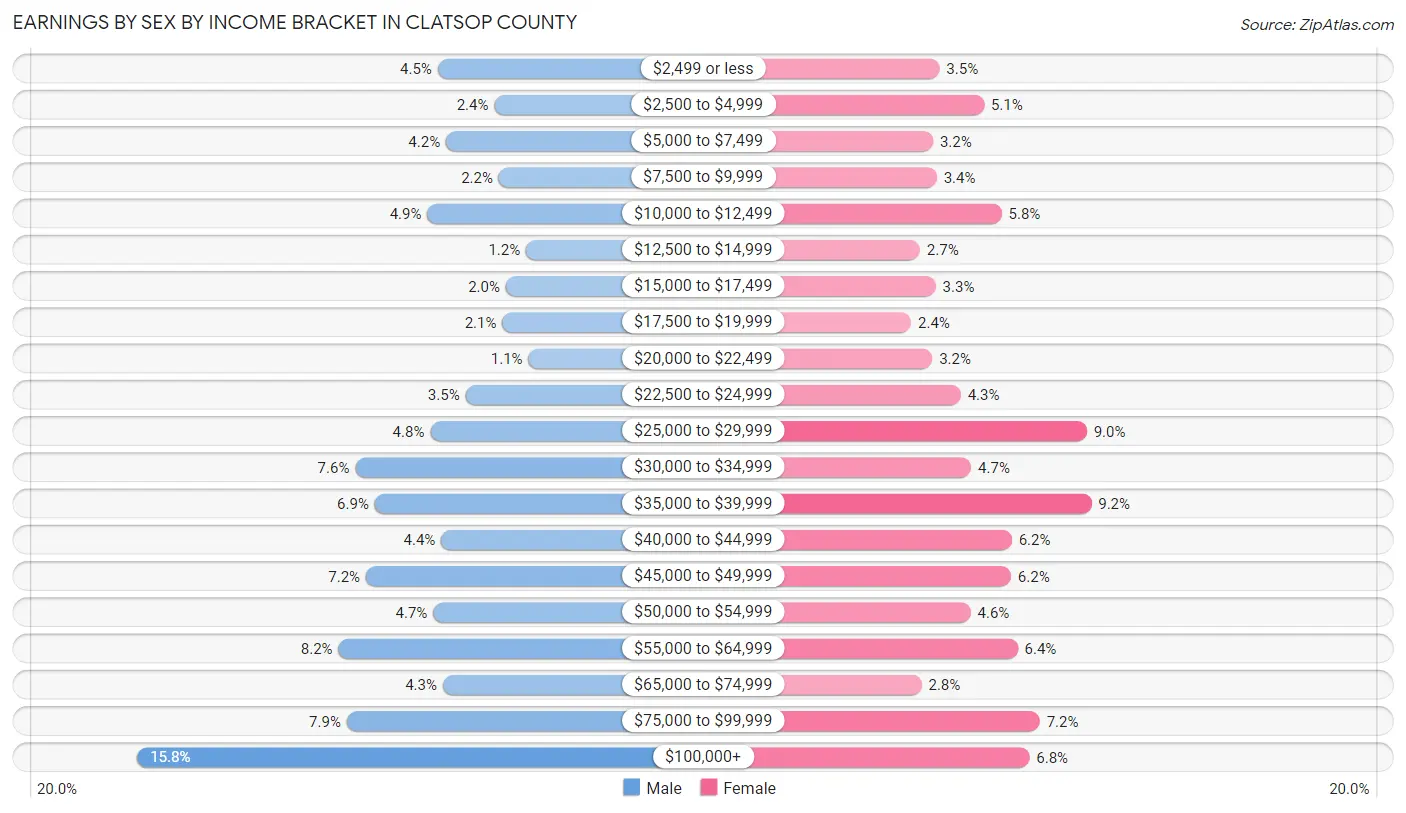
| Income | Male | Female |
| $2,499 or less | 506 (4.5%) | 336 (3.5%) |
| $2,500 to $4,999 | 269 (2.4%) | 498 (5.1%) |
| $5,000 to $7,499 | 471 (4.2%) | 313 (3.2%) |
| $7,500 to $9,999 | 249 (2.2%) | 326 (3.4%) |
| $10,000 to $12,499 | 549 (4.9%) | 561 (5.8%) |
| $12,500 to $14,999 | 135 (1.2%) | 265 (2.7%) |
| $15,000 to $17,499 | 220 (2.0%) | 322 (3.3%) |
| $17,500 to $19,999 | 235 (2.1%) | 233 (2.4%) |
| $20,000 to $22,499 | 125 (1.1%) | 310 (3.2%) |
| $22,500 to $24,999 | 389 (3.5%) | 413 (4.3%) |
| $25,000 to $29,999 | 537 (4.8%) | 870 (9.0%) |
| $30,000 to $34,999 | 851 (7.6%) | 451 (4.7%) |
| $35,000 to $39,999 | 770 (6.9%) | 887 (9.2%) |
| $40,000 to $44,999 | 491 (4.4%) | 598 (6.2%) |
| $45,000 to $49,999 | 807 (7.2%) | 595 (6.1%) |
| $50,000 to $54,999 | 525 (4.7%) | 449 (4.6%) |
| $55,000 to $64,999 | 922 (8.2%) | 620 (6.4%) |
| $65,000 to $74,999 | 484 (4.3%) | 271 (2.8%) |
| $75,000 to $99,999 | 887 (7.9%) | 700 (7.2%) |
| $100,000+ | 1,765 (15.8%) | 662 (6.8%) |
| Total | 11,187 (100.0%) | 9,680 (100.0%) |
Earnings by Sex by Educational Attainment in Clatsop County
Average earnings in Clatsop County are $46,905 for men and $37,844 for women, a difference of 19.3%. Men with an educational attainment of graduate degree enjoy the highest average annual earnings of $101,338, while those with less than high school education earn the least with $30,960. Women with an educational attainment of graduate degree earn the most with the average annual earnings of $60,190, while those with less than high school education have the smallest earnings of $22,450.
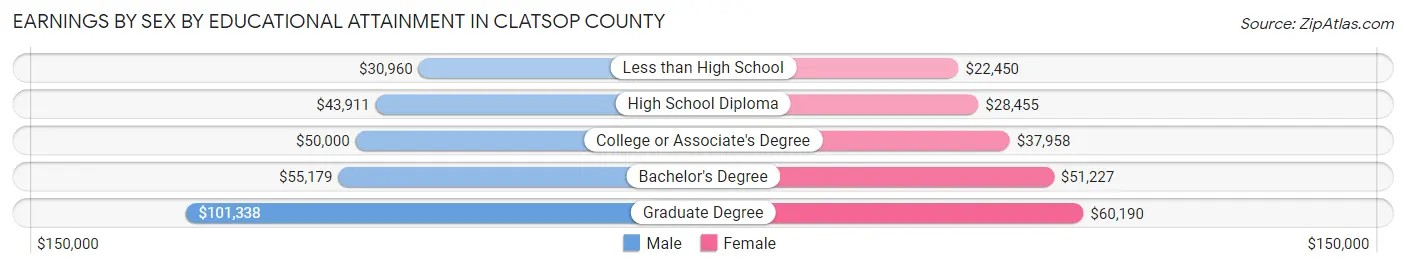
| Educational Attainment | Male Income | Female Income |
| Less than High School | $30,960 | $22,450 |
| High School Diploma | $43,911 | $28,455 |
| College or Associate's Degree | $50,000 | $37,958 |
| Bachelor's Degree | $55,179 | $51,227 |
| Graduate Degree | $101,338 | $60,190 |
| Total | $46,905 | $37,844 |
Family Income in Clatsop County
Family Income Brackets in Clatsop County
According to the Clatsop County family income data, there are 2,267 families falling into the $100,000 to $149,999 income range, which is the most common income bracket and makes up 22.9% of all families. Conversely, the $10,000 to $14,999 income bracket is the least frequent group with only 69 families (0.7%) belonging to this category.
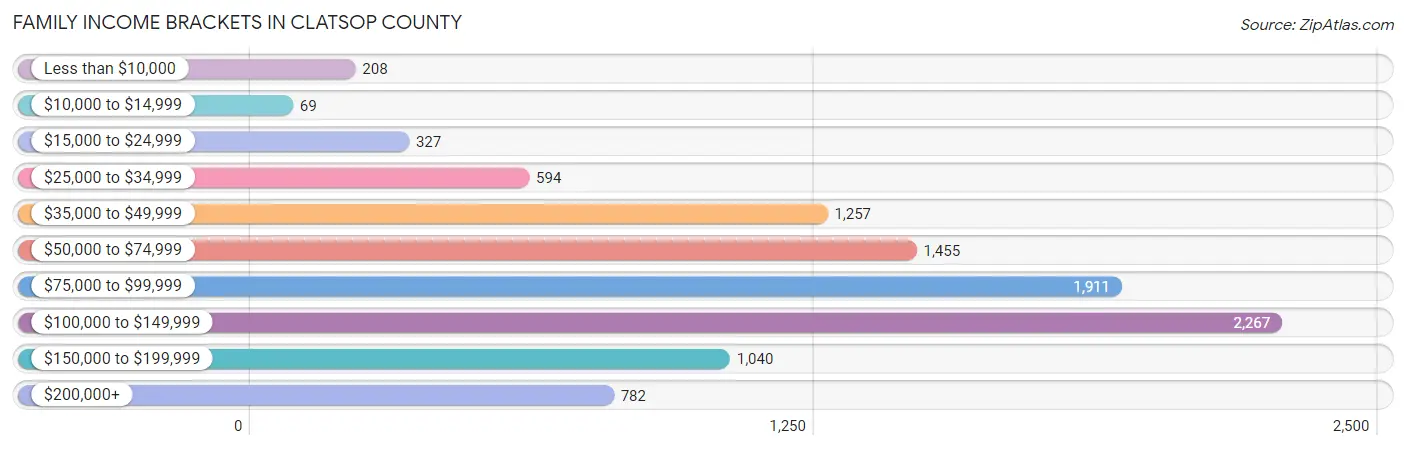
| Income Bracket | # Families | % Families |
| Less than $10,000 | 208 | 2.1% |
| $10,000 to $14,999 | 69 | 0.7% |
| $15,000 to $24,999 | 327 | 3.3% |
| $25,000 to $34,999 | 594 | 6.0% |
| $35,000 to $49,999 | 1,257 | 12.7% |
| $50,000 to $74,999 | 1,455 | 14.7% |
| $75,000 to $99,999 | 1,911 | 19.3% |
| $100,000 to $149,999 | 2,267 | 22.9% |
| $150,000 to $199,999 | 1,040 | 10.5% |
| $200,000+ | 782 | 7.9% |
Family Income by Famaliy Size in Clatsop County
7+ person families (160 | 1.6%) account for the highest median family income in Clatsop County with $136,250 per family, while 2-person families (5,789 | 58.5%) have the highest median income of $39,564 per family member.
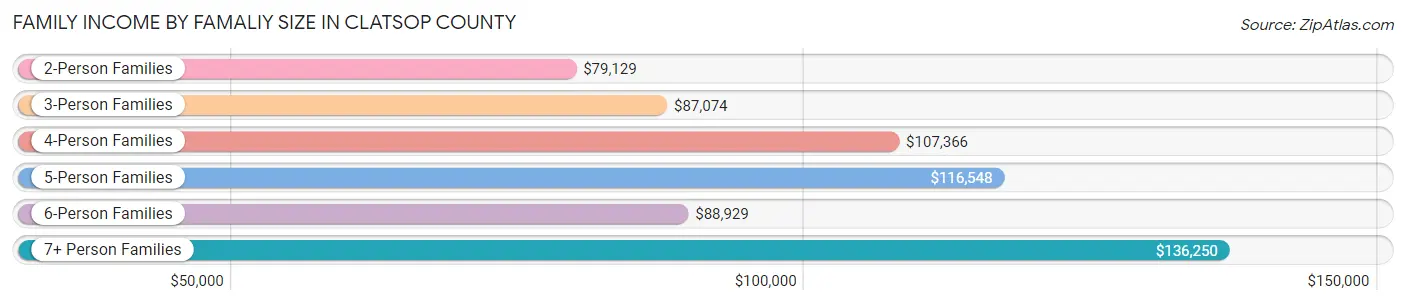
| Income Bracket | # Families | Median Income |
| 2-Person Families | 5,789 (58.5%) | $79,129 |
| 3-Person Families | 1,637 (16.5%) | $87,074 |
| 4-Person Families | 1,393 (14.1%) | $107,366 |
| 5-Person Families | 736 (7.4%) | $116,548 |
| 6-Person Families | 186 (1.9%) | $88,929 |
| 7+ Person Families | 160 (1.6%) | $136,250 |
| Total | 9,901 (100.0%) | $86,961 |
Family Income by Number of Earners in Clatsop County
The median family income in Clatsop County is $86,961, with families comprising 3+ earners (808) having the highest median family income of $147,279, while families with no earners (2,059) have the lowest median family income of $58,574, accounting for 8.2% and 20.8% of families, respectively.
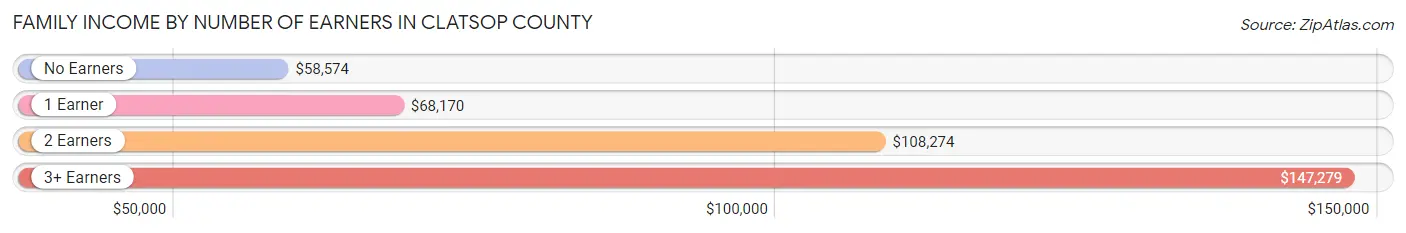
| Number of Earners | # Families | Median Income |
| No Earners | 2,059 (20.8%) | $58,574 |
| 1 Earner | 3,273 (33.1%) | $68,170 |
| 2 Earners | 3,761 (38.0%) | $108,274 |
| 3+ Earners | 808 (8.2%) | $147,279 |
| Total | 9,901 (100.0%) | $86,961 |
Household Income in Clatsop County
Household Income Brackets in Clatsop County
With 2,932 households falling in the category, the $50,000 to $74,999 income range is the most frequent in Clatsop County, accounting for 17.0% of all households. In contrast, only 552 households (3.2%) fall into the $10,000 to $14,999 income bracket, making it the least populous group.
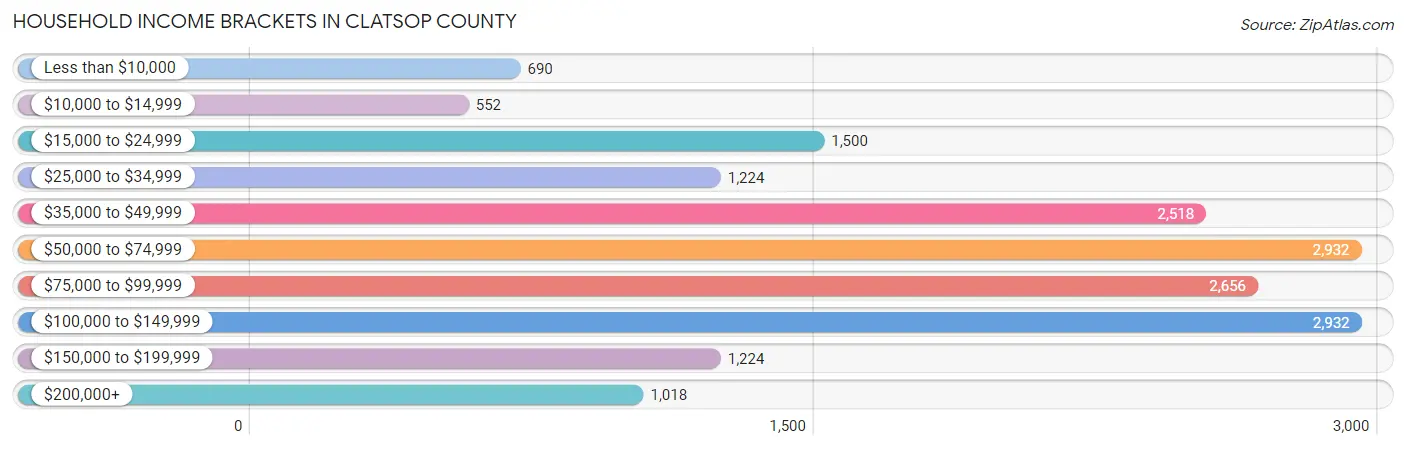
| Income Bracket | # Households | % Households |
| Less than $10,000 | 690 | 4.0% |
| $10,000 to $14,999 | 552 | 3.2% |
| $15,000 to $24,999 | 1,500 | 8.7% |
| $25,000 to $34,999 | 1,224 | 7.1% |
| $35,000 to $49,999 | 2,518 | 14.6% |
| $50,000 to $74,999 | 2,932 | 17.0% |
| $75,000 to $99,999 | 2,656 | 15.4% |
| $100,000 to $149,999 | 2,932 | 17.0% |
| $150,000 to $199,999 | 1,224 | 7.1% |
| $200,000+ | 1,018 | 5.9% |
Household Income by Householder Age in Clatsop County
The median household income in Clatsop County is $68,025, with the highest median household income of $80,647 found in the 25 to 44 years age bracket for the primary householder. A total of 4,728 households (27.4%) fall into this category. Meanwhile, the 15 to 24 years age bracket for the primary householder has the lowest median household income of $46,466, with 334 households (1.9%) in this group.
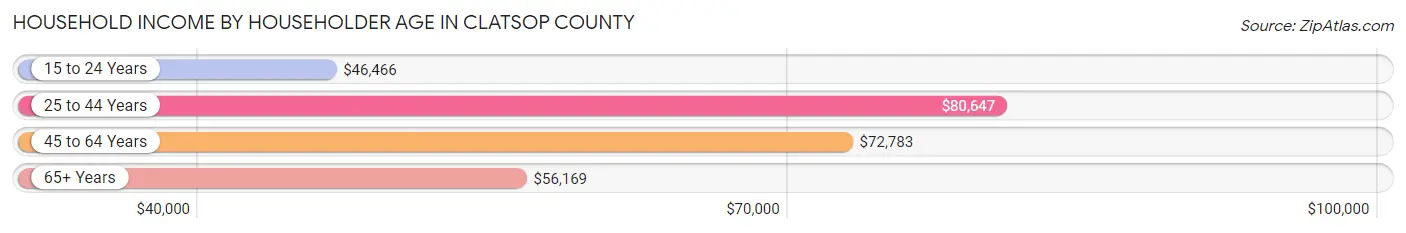
| Income Bracket | # Households | Median Income |
| 15 to 24 Years | 334 (1.9%) | $46,466 |
| 25 to 44 Years | 4,728 (27.4%) | $80,647 |
| 45 to 64 Years | 6,164 (35.7%) | $72,783 |
| 65+ Years | 6,020 (34.9%) | $56,169 |
| Total | 17,246 (100.0%) | $68,025 |
Poverty in Clatsop County
Income Below Poverty by Sex and Age in Clatsop County
With 10.0% poverty level for males and 10.5% for females among the residents of Clatsop County, 5 year old males and 12 to 14 year old females are the most vulnerable to poverty, with 82 males (30.1%) and 217 females (26.2%) in their respective age groups living below the poverty level.
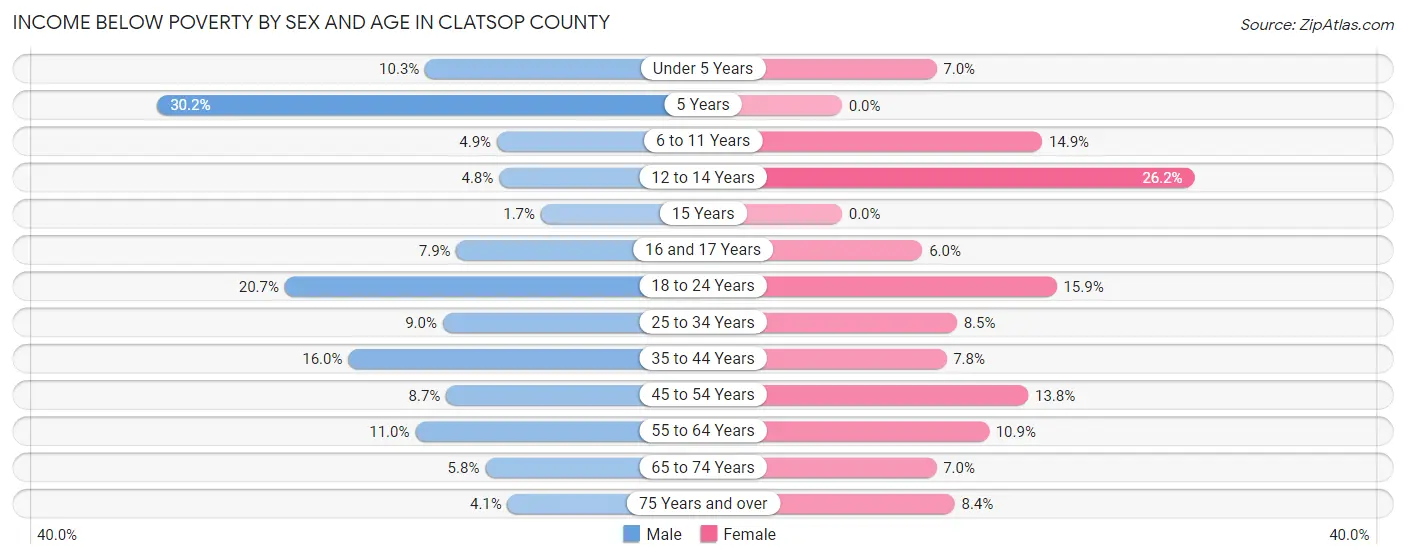
| Age Bracket | Male | Female |
| Under 5 Years | 112 (10.3%) | 59 (7.0%) |
| 5 Years | 82 (30.1%) | 0 (0.0%) |
| 6 to 11 Years | 57 (4.9%) | 180 (14.9%) |
| 12 to 14 Years | 35 (4.8%) | 217 (26.2%) |
| 15 Years | 5 (1.7%) | 0 (0.0%) |
| 16 and 17 Years | 22 (7.9%) | 25 (6.0%) |
| 18 to 24 Years | 296 (20.7%) | 235 (15.9%) |
| 25 to 34 Years | 231 (8.9%) | 197 (8.5%) |
| 35 to 44 Years | 408 (16.0%) | 199 (7.7%) |
| 45 to 54 Years | 203 (8.7%) | 314 (13.8%) |
| 55 to 64 Years | 322 (11.0%) | 357 (10.9%) |
| 65 to 74 Years | 173 (5.8%) | 230 (7.0%) |
| 75 Years and over | 63 (4.1%) | 154 (8.4%) |
| Total | 2,009 (10.0%) | 2,167 (10.5%) |
Income Above Poverty by Sex and Age in Clatsop County
According to the poverty statistics in Clatsop County, males aged 15 years and females aged 5 years are the age groups that are most secure financially, with 98.3% of males and 100.0% of females in these age groups living above the poverty line.
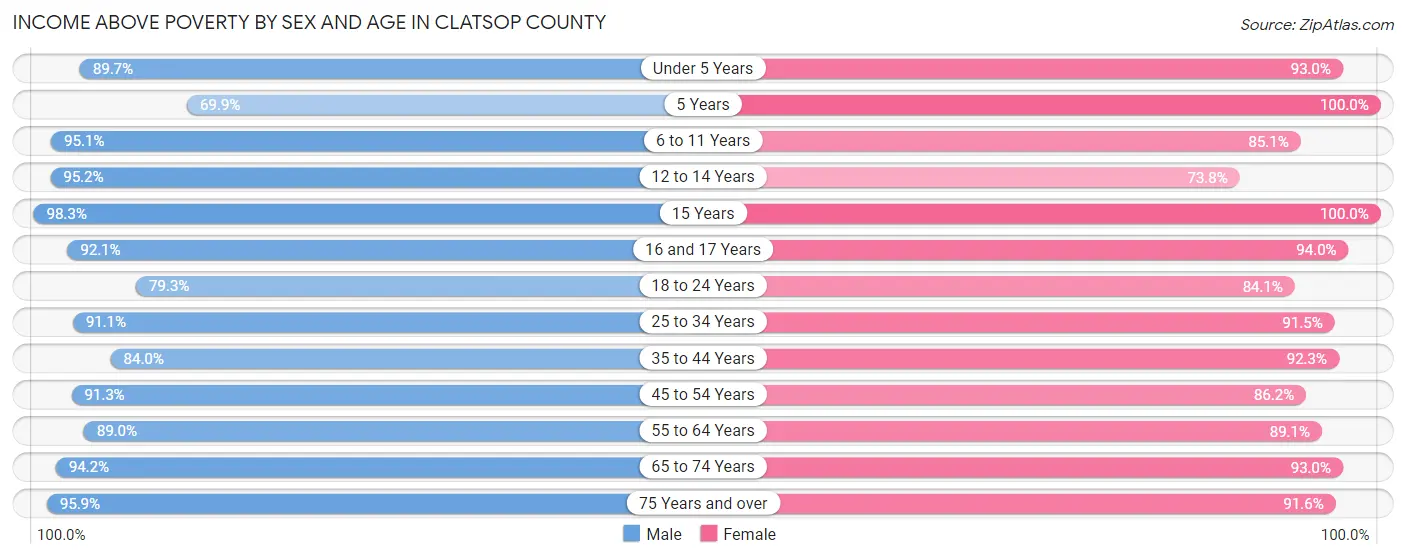
| Age Bracket | Male | Female |
| Under 5 Years | 980 (89.7%) | 781 (93.0%) |
| 5 Years | 190 (69.9%) | 141 (100.0%) |
| 6 to 11 Years | 1,100 (95.1%) | 1,031 (85.1%) |
| 12 to 14 Years | 698 (95.2%) | 612 (73.8%) |
| 15 Years | 294 (98.3%) | 142 (100.0%) |
| 16 and 17 Years | 255 (92.1%) | 394 (94.0%) |
| 18 to 24 Years | 1,135 (79.3%) | 1,239 (84.1%) |
| 25 to 34 Years | 2,350 (91.0%) | 2,112 (91.5%) |
| 35 to 44 Years | 2,146 (84.0%) | 2,369 (92.2%) |
| 45 to 54 Years | 2,129 (91.3%) | 1,956 (86.2%) |
| 55 to 64 Years | 2,609 (89.0%) | 2,915 (89.1%) |
| 65 to 74 Years | 2,808 (94.2%) | 3,053 (93.0%) |
| 75 Years and over | 1,460 (95.9%) | 1,687 (91.6%) |
| Total | 18,154 (90.0%) | 18,432 (89.5%) |
Income Below Poverty Among Married-Couple Families in Clatsop County
The poverty statistics for married-couple families in Clatsop County show that 3.3% or 256 of the total 7,752 families live below the poverty line. Families with 1 or 2 children have the highest poverty rate of 5.7%, comprising of 118 families. On the other hand, families with 5 or more children have the lowest poverty rate of 0.0%, which includes 0 families.
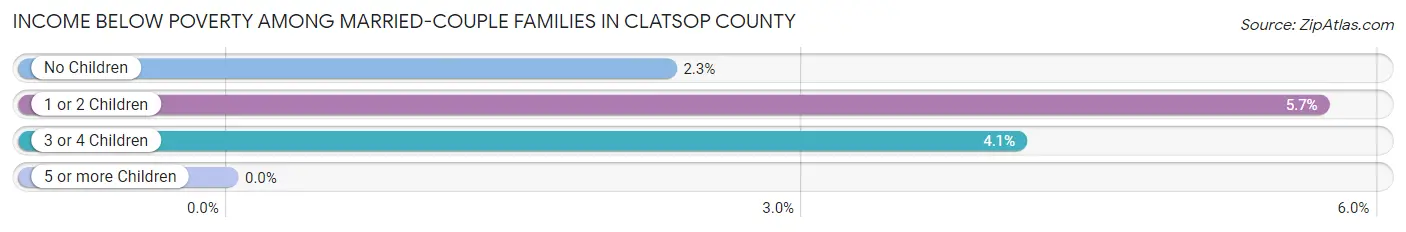
| Children | Above Poverty | Below Poverty |
| No Children | 4,999 (97.7%) | 117 (2.3%) |
| 1 or 2 Children | 1,952 (94.3%) | 118 (5.7%) |
| 3 or 4 Children | 489 (95.9%) | 21 (4.1%) |
| 5 or more Children | 56 (100.0%) | 0 (0.0%) |
| Total | 7,496 (96.7%) | 256 (3.3%) |
Income Below Poverty Among Single-Parent Households in Clatsop County
According to the poverty data in Clatsop County, 7.3% or 63 single-father households and 8.4% or 109 single-mother households are living below the poverty line. Among single-father households, those with 1 or 2 children have the highest poverty rate, with 60 households (13.5%) experiencing poverty. Likewise, among single-mother households, those with no children have the highest poverty rate, with 79 households (9.8%) falling below the poverty line.
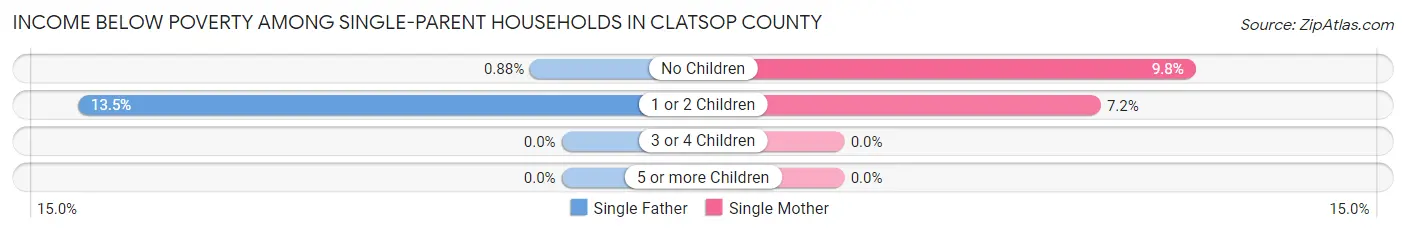
| Children | Single Father | Single Mother |
| No Children | 3 (0.9%) | 79 (9.8%) |
| 1 or 2 Children | 60 (13.5%) | 30 (7.2%) |
| 3 or 4 Children | 0 (0.0%) | 0 (0.0%) |
| 5 or more Children | 0 (0.0%) | 0 (0.0%) |
| Total | 63 (7.3%) | 109 (8.4%) |
Income Below Poverty Among Married-Couple vs Single-Parent Households in Clatsop County
The poverty data for Clatsop County shows that 256 of the married-couple family households (3.3%) and 172 of the single-parent households (8.0%) are living below the poverty level. Within the married-couple family households, those with 1 or 2 children have the highest poverty rate, with 118 households (5.7%) falling below the poverty line. Among the single-parent households, those with 1 or 2 children have the highest poverty rate, with 90 household (10.4%) living below poverty.
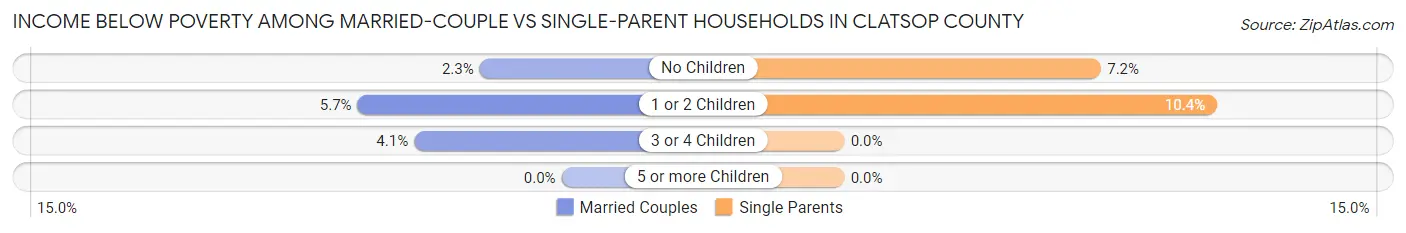
| Children | Married-Couple Families | Single-Parent Households |
| No Children | 117 (2.3%) | 82 (7.2%) |
| 1 or 2 Children | 118 (5.7%) | 90 (10.4%) |
| 3 or 4 Children | 21 (4.1%) | 0 (0.0%) |
| 5 or more Children | 0 (0.0%) | 0 (0.0%) |
| Total | 256 (3.3%) | 172 (8.0%) |
Employment Characteristics in Clatsop County
Employment by Class of Employer in Clatsop County
Among the 18,276 employed individuals in Clatsop County, private company employees (11,107 | 60.8%), not-for-profit organizations (1,772 | 9.7%), and self-employed (not incorporated) (1,514 | 8.3%) make up the most common classes of employment.
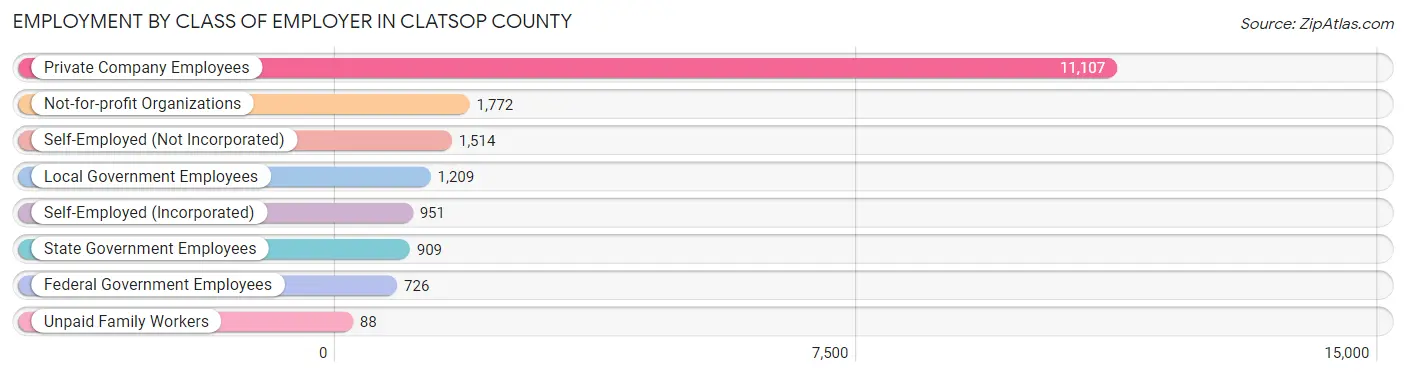
| Employer Class | # Employees | % Employees |
| Private Company Employees | 11,107 | 60.8% |
| Self-Employed (Incorporated) | 951 | 5.2% |
| Self-Employed (Not Incorporated) | 1,514 | 8.3% |
| Not-for-profit Organizations | 1,772 | 9.7% |
| Local Government Employees | 1,209 | 6.6% |
| State Government Employees | 909 | 5.0% |
| Federal Government Employees | 726 | 4.0% |
| Unpaid Family Workers | 88 | 0.5% |
| Total | 18,276 | 100.0% |
Employment Status by Age in Clatsop County
According to the labor force statistics for Clatsop County, out of the total population over 16 years of age (34,385), 57.8% or 19,875 individuals are in the labor force, with 4.8% or 954 of them unemployed. The age group with the highest labor force participation rate is 30 to 34 years, with 88.3% or 2,458 individuals in the labor force. Within the labor force, the 20 to 24 years age range has the highest percentage of unemployed individuals, with 11.5% or 224 of them being unemployed.
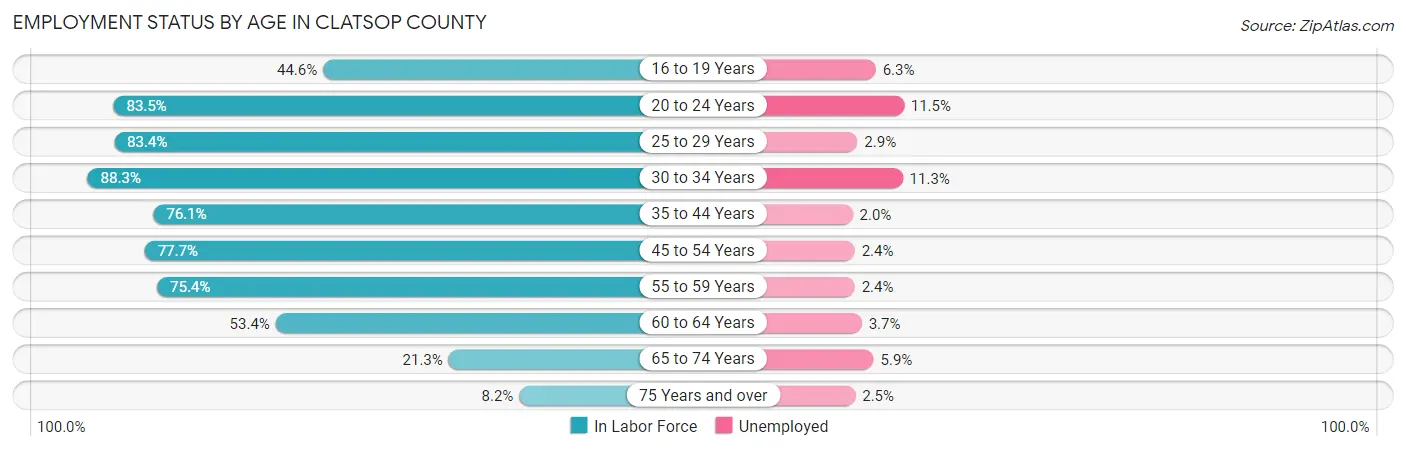
| Age Bracket | In Labor Force | Unemployed |
| 16 to 19 Years | 649 (44.6%) | 41 (6.3%) |
| 20 to 24 Years | 1,949 (83.5%) | 224 (11.5%) |
| 25 to 29 Years | 1,780 (83.4%) | 52 (2.9%) |
| 30 to 34 Years | 2,458 (88.3%) | 278 (11.3%) |
| 35 to 44 Years | 3,912 (76.1%) | 78 (2.0%) |
| 45 to 54 Years | 3,584 (77.7%) | 86 (2.4%) |
| 55 to 59 Years | 2,033 (75.4%) | 49 (2.4%) |
| 60 to 64 Years | 1,881 (53.4%) | 70 (3.7%) |
| 65 to 74 Years | 1,335 (21.3%) | 79 (5.9%) |
| 75 Years and over | 282 (8.2%) | 7 (2.5%) |
| Total | 19,875 (57.8%) | 954 (4.8%) |
Employment Status by Educational Attainment in Clatsop County
According to labor force statistics for Clatsop County, 74.9% of individuals (15,646) out of the total population between 25 and 64 years of age (20,889) are in the labor force, with 3.9% or 610 of them being unemployed. The group with the highest labor force participation rate are those with the educational attainment of bachelor's degree or higher, with 84.6% or 4,242 individuals in the labor force. Within the labor force, individuals with bachelor's degree or higher education have the highest percentage of unemployment, with 5.4% or 229 of them being unemployed.
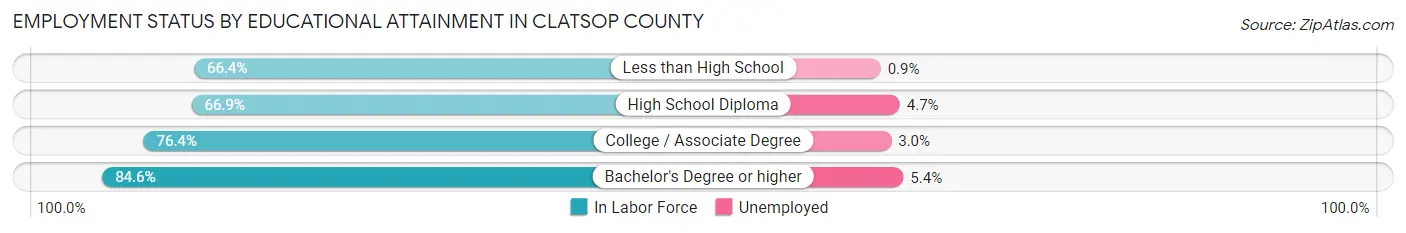
| Educational Attainment | In Labor Force | Unemployed |
| Less than High School | 1,274 (66.4%) | 17 (0.9%) |
| High School Diploma | 3,795 (66.9%) | 267 (4.7%) |
| College / Associate Degree | 6,329 (76.4%) | 249 (3.0%) |
| Bachelor's Degree or higher | 4,242 (84.6%) | 271 (5.4%) |
| Total | 15,646 (74.9%) | 815 (3.9%) |
Employment Occupations by Sex in Clatsop County
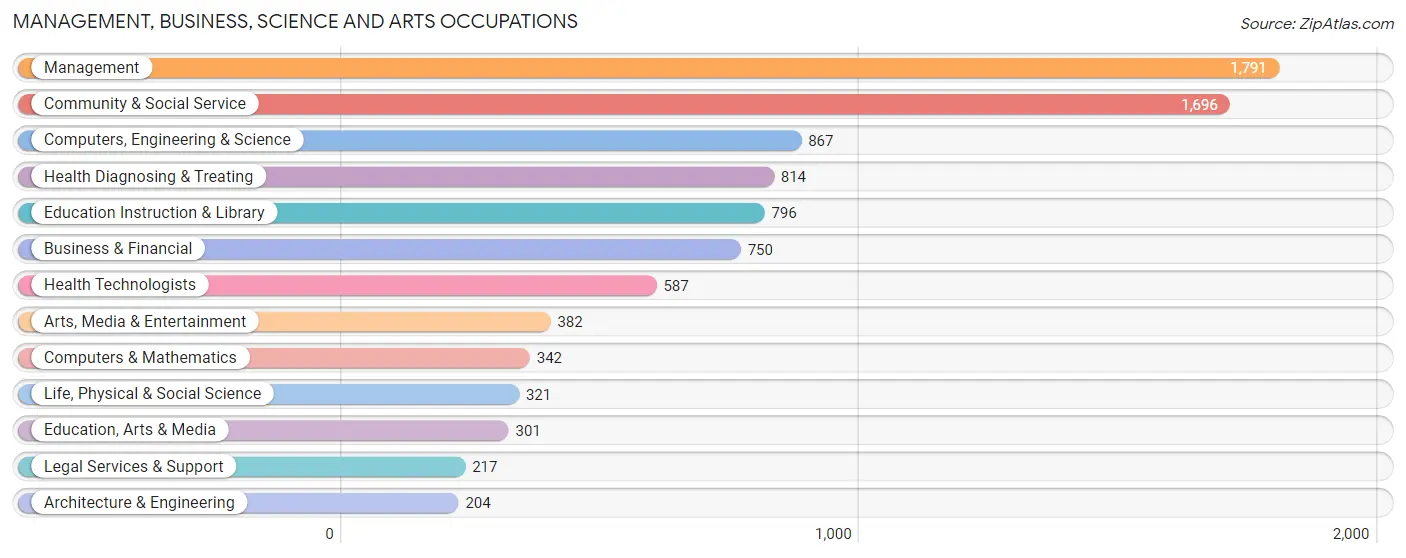
Management, Business, Science and Arts Occupations
The most common Management, Business, Science and Arts occupations in Clatsop County are Management (1,791 | 9.7%), Community & Social Service (1,696 | 9.1%), Computers, Engineering & Science (867 | 4.7%), Health Diagnosing & Treating (814 | 4.4%), and Education Instruction & Library (796 | 4.3%).
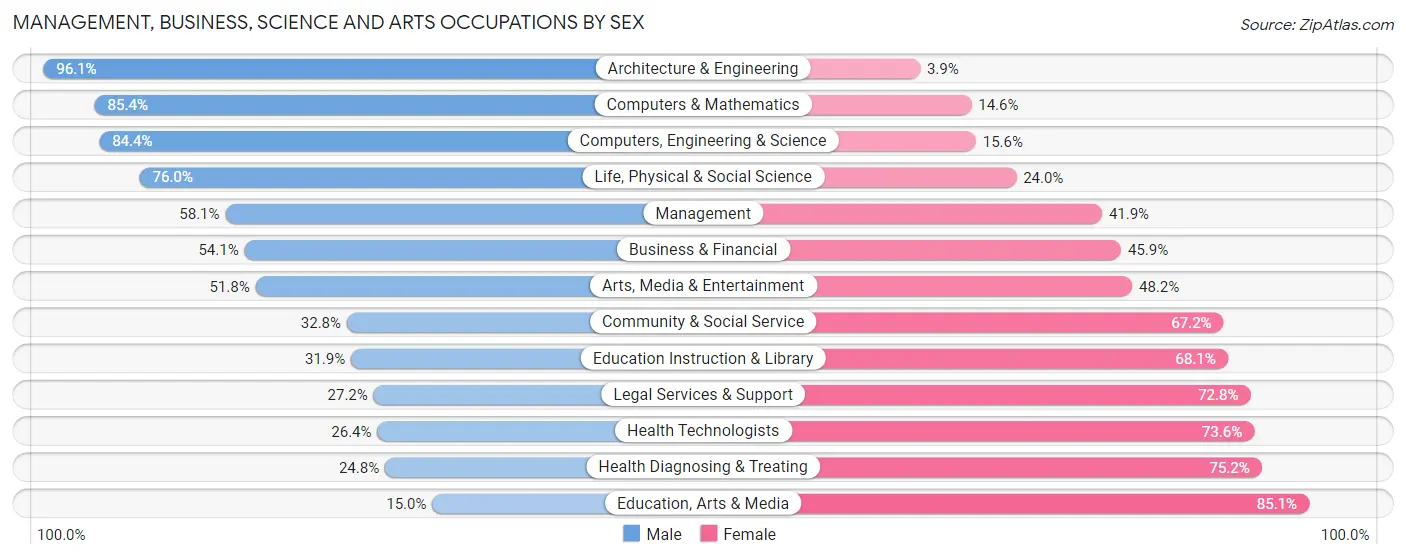
Management, Business, Science and Arts Occupations by Sex
Within the Management, Business, Science and Arts occupations in Clatsop County, the most male-oriented occupations are Architecture & Engineering (96.1%), Computers & Mathematics (85.4%), and Computers, Engineering & Science (84.4%), while the most female-oriented occupations are Education, Arts & Media (85.1%), Health Diagnosing & Treating (75.2%), and Health Technologists (73.6%).
| Occupation | Male | Female |
| Management | 1,041 (58.1%) | 750 (41.9%) |
| Business & Financial | 406 (54.1%) | 344 (45.9%) |
| Computers, Engineering & Science | 732 (84.4%) | 135 (15.6%) |
| Computers & Mathematics | 292 (85.4%) | 50 (14.6%) |
| Architecture & Engineering | 196 (96.1%) | 8 (3.9%) |
| Life, Physical & Social Science | 244 (76.0%) | 77 (24.0%) |
| Community & Social Service | 556 (32.8%) | 1,140 (67.2%) |
| Education, Arts & Media | 45 (14.9%) | 256 (85.1%) |
| Legal Services & Support | 59 (27.2%) | 158 (72.8%) |
| Education Instruction & Library | 254 (31.9%) | 542 (68.1%) |
| Arts, Media & Entertainment | 198 (51.8%) | 184 (48.2%) |
| Health Diagnosing & Treating | 202 (24.8%) | 612 (75.2%) |
| Health Technologists | 155 (26.4%) | 432 (73.6%) |
| Total (Category) | 2,937 (49.6%) | 2,981 (50.4%) |
| Total (Overall) | 9,869 (53.2%) | 8,689 (46.8%) |
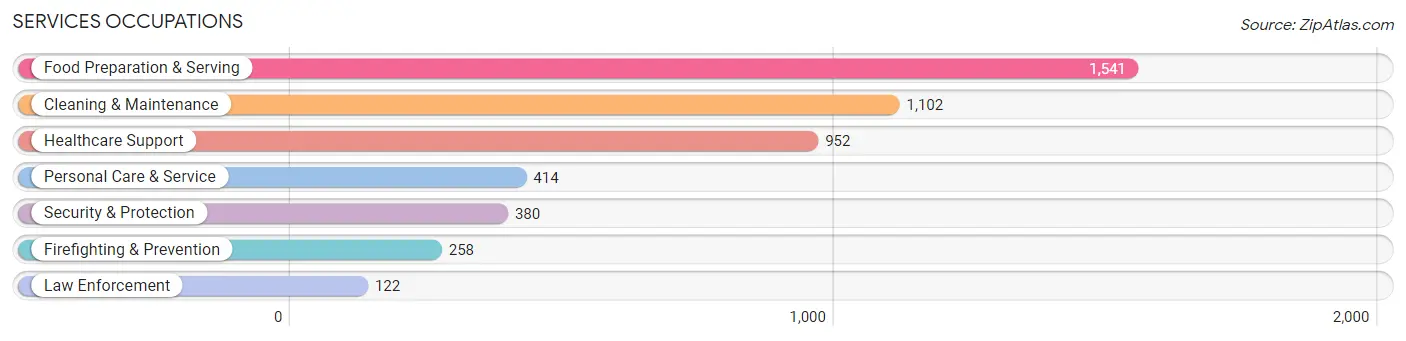
Services Occupations
The most common Services occupations in Clatsop County are Food Preparation & Serving (1,541 | 8.3%), Cleaning & Maintenance (1,102 | 5.9%), Healthcare Support (952 | 5.1%), Personal Care & Service (414 | 2.2%), and Security & Protection (380 | 2.1%).
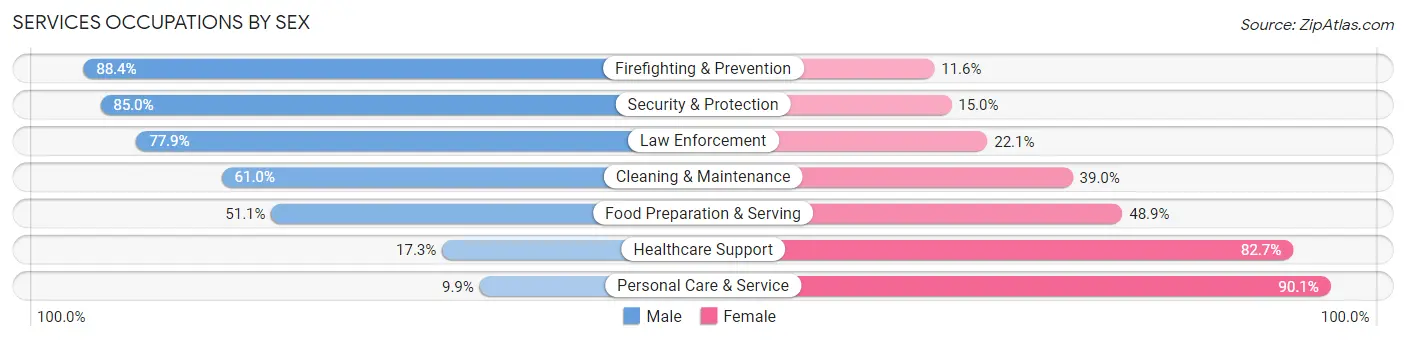
Services Occupations by Sex
Within the Services occupations in Clatsop County, the most male-oriented occupations are Firefighting & Prevention (88.4%), Security & Protection (85.0%), and Law Enforcement (77.9%), while the most female-oriented occupations are Personal Care & Service (90.1%), Healthcare Support (82.7%), and Food Preparation & Serving (48.9%).
| Occupation | Male | Female |
| Healthcare Support | 165 (17.3%) | 787 (82.7%) |
| Security & Protection | 323 (85.0%) | 57 (15.0%) |
| Firefighting & Prevention | 228 (88.4%) | 30 (11.6%) |
| Law Enforcement | 95 (77.9%) | 27 (22.1%) |
| Food Preparation & Serving | 788 (51.1%) | 753 (48.9%) |
| Cleaning & Maintenance | 672 (61.0%) | 430 (39.0%) |
| Personal Care & Service | 41 (9.9%) | 373 (90.1%) |
| Total (Category) | 1,989 (45.3%) | 2,400 (54.7%) |
| Total (Overall) | 9,869 (53.2%) | 8,689 (46.8%) |
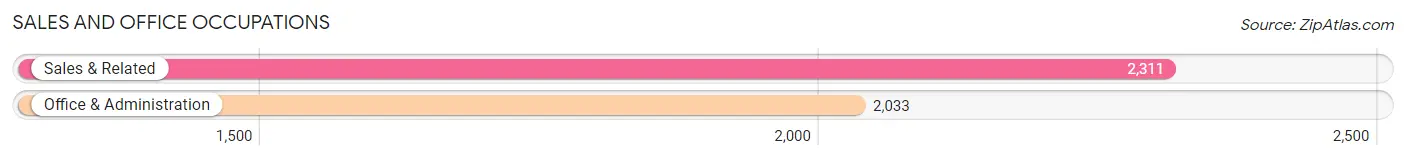
Sales and Office Occupations
The most common Sales and Office occupations in Clatsop County are Sales & Related (2,311 | 12.4%), and Office & Administration (2,033 | 11.0%).
Sales and Office Occupations by Sex
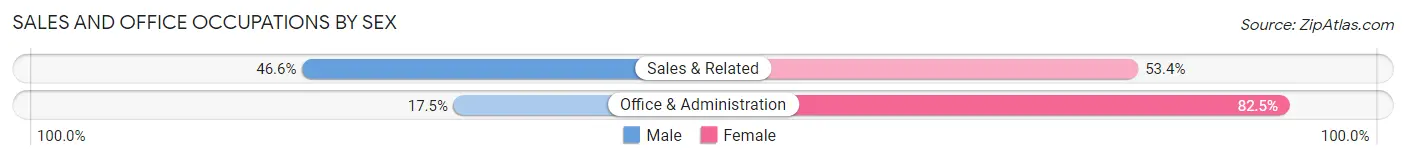
| Occupation | Male | Female |
| Sales & Related | 1,077 (46.6%) | 1,234 (53.4%) |
| Office & Administration | 355 (17.5%) | 1,678 (82.5%) |
| Total (Category) | 1,432 (33.0%) | 2,912 (67.0%) |
| Total (Overall) | 9,869 (53.2%) | 8,689 (46.8%) |
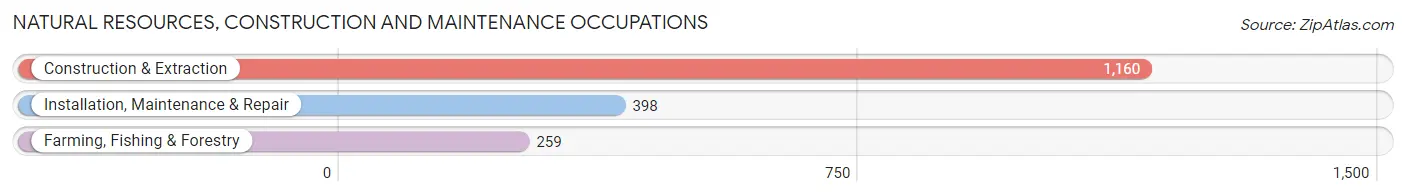
Natural Resources, Construction and Maintenance Occupations
The most common Natural Resources, Construction and Maintenance occupations in Clatsop County are Construction & Extraction (1,160 | 6.2%), Installation, Maintenance & Repair (398 | 2.1%), and Farming, Fishing & Forestry (259 | 1.4%).
Natural Resources, Construction and Maintenance Occupations by Sex
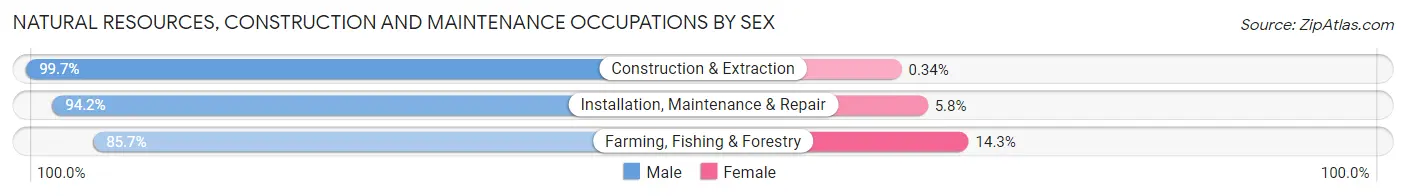
| Occupation | Male | Female |
| Farming, Fishing & Forestry | 222 (85.7%) | 37 (14.3%) |
| Construction & Extraction | 1,156 (99.7%) | 4 (0.3%) |
| Installation, Maintenance & Repair | 375 (94.2%) | 23 (5.8%) |
| Total (Category) | 1,753 (96.5%) | 64 (3.5%) |
| Total (Overall) | 9,869 (53.2%) | 8,689 (46.8%) |
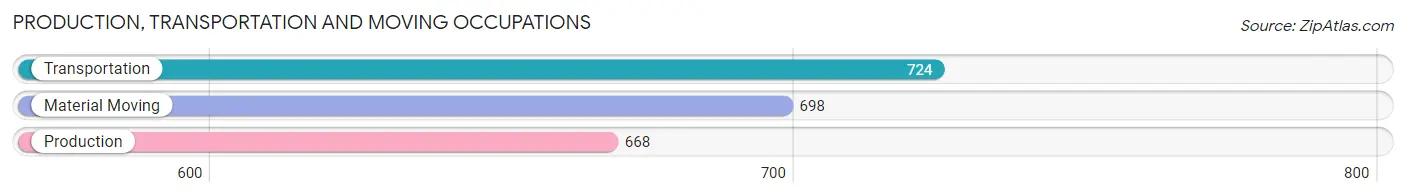
Production, Transportation and Moving Occupations
The most common Production, Transportation and Moving occupations in Clatsop County are Transportation (724 | 3.9%), Material Moving (698 | 3.8%), and Production (668 | 3.6%).
Production, Transportation and Moving Occupations by Sex
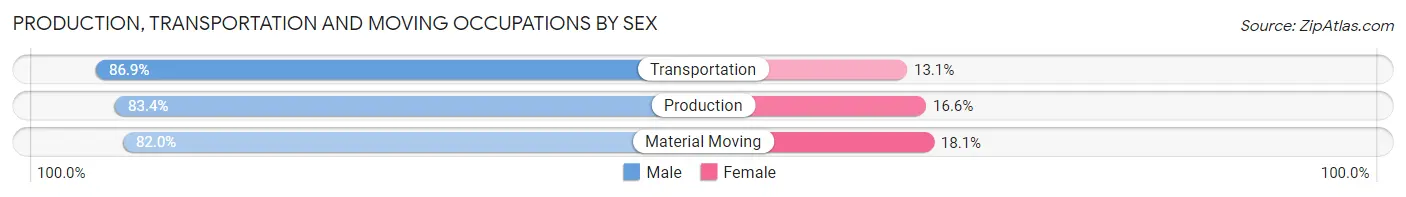
| Occupation | Male | Female |
| Production | 557 (83.4%) | 111 (16.6%) |
| Transportation | 629 (86.9%) | 95 (13.1%) |
| Material Moving | 572 (82.0%) | 126 (18.0%) |
| Total (Category) | 1,758 (84.1%) | 332 (15.9%) |
| Total (Overall) | 9,869 (53.2%) | 8,689 (46.8%) |
Employment Industries by Sex in Clatsop County
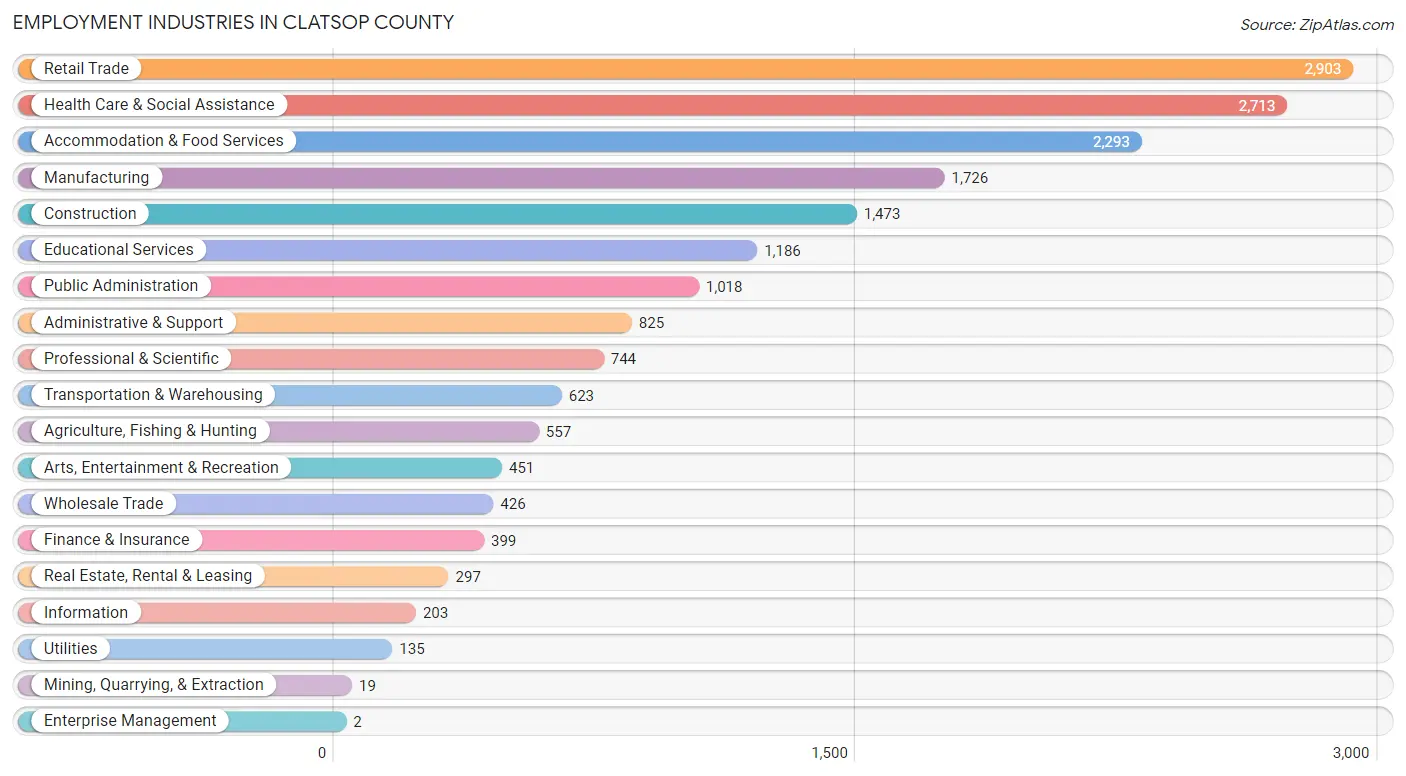
Employment Industries in Clatsop County
The major employment industries in Clatsop County include Retail Trade (2,903 | 15.6%), Health Care & Social Assistance (2,713 | 14.6%), Accommodation & Food Services (2,293 | 12.4%), Manufacturing (1,726 | 9.3%), and Construction (1,473 | 7.9%).
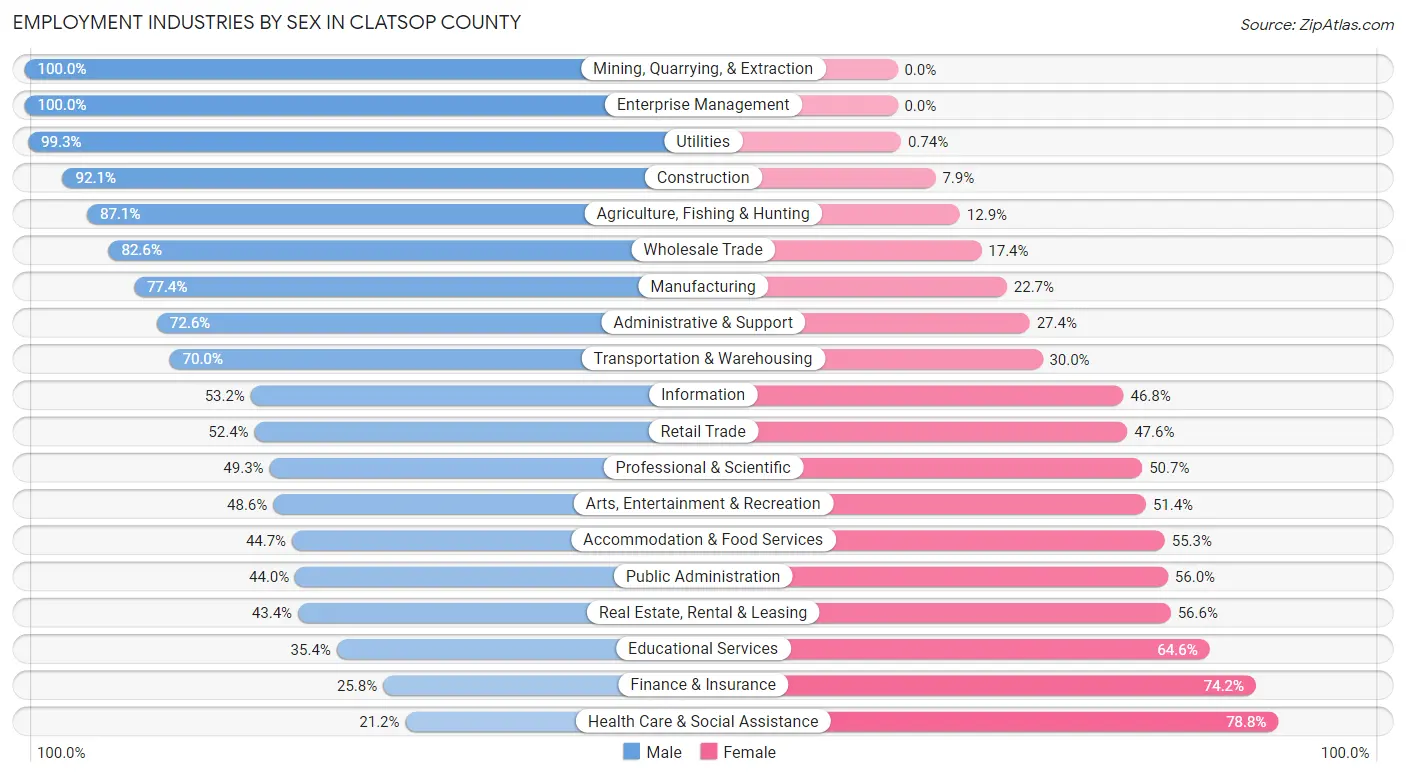
Employment Industries by Sex in Clatsop County
The Clatsop County industries that see more men than women are Mining, Quarrying, & Extraction (100.0%), Enterprise Management (100.0%), and Utilities (99.3%), whereas the industries that tend to have a higher number of women are Health Care & Social Assistance (78.8%), Finance & Insurance (74.2%), and Educational Services (64.6%).
| Industry | Male | Female |
| Agriculture, Fishing & Hunting | 485 (87.1%) | 72 (12.9%) |
| Mining, Quarrying, & Extraction | 19 (100.0%) | 0 (0.0%) |
| Construction | 1,357 (92.1%) | 116 (7.9%) |
| Manufacturing | 1,335 (77.3%) | 391 (22.7%) |
| Wholesale Trade | 352 (82.6%) | 74 (17.4%) |
| Retail Trade | 1,522 (52.4%) | 1,381 (47.6%) |
| Transportation & Warehousing | 436 (70.0%) | 187 (30.0%) |
| Utilities | 134 (99.3%) | 1 (0.7%) |
| Information | 108 (53.2%) | 95 (46.8%) |
| Finance & Insurance | 103 (25.8%) | 296 (74.2%) |
| Real Estate, Rental & Leasing | 129 (43.4%) | 168 (56.6%) |
| Professional & Scientific | 367 (49.3%) | 377 (50.7%) |
| Enterprise Management | 2 (100.0%) | 0 (0.0%) |
| Administrative & Support | 599 (72.6%) | 226 (27.4%) |
| Educational Services | 420 (35.4%) | 766 (64.6%) |
| Health Care & Social Assistance | 575 (21.2%) | 2,138 (78.8%) |
| Arts, Entertainment & Recreation | 219 (48.6%) | 232 (51.4%) |
| Accommodation & Food Services | 1,024 (44.7%) | 1,269 (55.3%) |
| Public Administration | 448 (44.0%) | 570 (56.0%) |
| Total | 9,869 (53.2%) | 8,689 (46.8%) |
Education in Clatsop County
School Enrollment in Clatsop County
The most common levels of schooling among the 7,810 students in Clatsop County are middle school (2,106 | 27.0%), college / undergraduate (1,659 | 21.2%), and high school (1,499 | 19.2%).
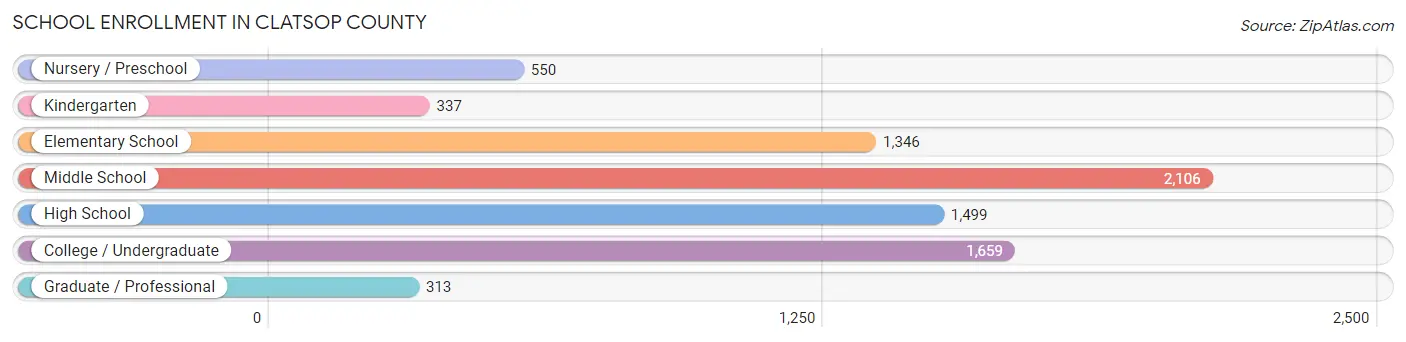
| School Level | # Students | % Students |
| Nursery / Preschool | 550 | 7.0% |
| Kindergarten | 337 | 4.3% |
| Elementary School | 1,346 | 17.2% |
| Middle School | 2,106 | 27.0% |
| High School | 1,499 | 19.2% |
| College / Undergraduate | 1,659 | 21.2% |
| Graduate / Professional | 313 | 4.0% |
| Total | 7,810 | 100.0% |
School Enrollment by Age by Funding Source in Clatsop County
Out of a total of 7,810 students who are enrolled in schools in Clatsop County, 1,336 (17.1%) attend a private institution, while the remaining 6,474 (82.9%) are enrolled in public schools. The age group of 3 to 4 year olds has the highest likelihood of being enrolled in private schools, with 157 (46.7% in the age bracket) enrolled. Conversely, the age group of 18 to 19 year olds has the lowest likelihood of being enrolled in a private school, with 371 (96.6% in the age bracket) attending a public institution.
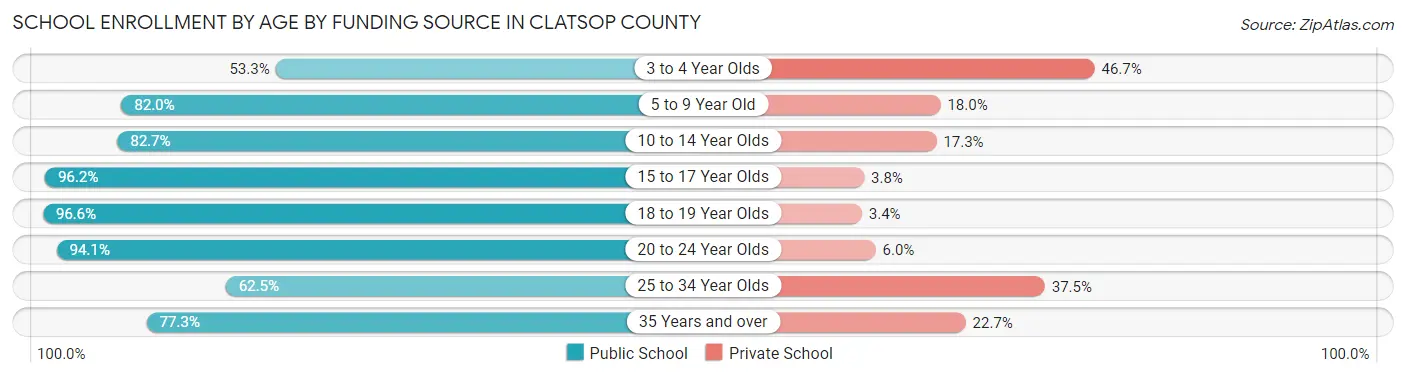
| Age Bracket | Public School | Private School |
| 3 to 4 Year Olds | 179 (53.3%) | 157 (46.7%) |
| 5 to 9 Year Old | 1,437 (82.0%) | 316 (18.0%) |
| 10 to 14 Year Olds | 2,044 (82.7%) | 427 (17.3%) |
| 15 to 17 Year Olds | 1,063 (96.2%) | 42 (3.8%) |
| 18 to 19 Year Olds | 371 (96.6%) | 13 (3.4%) |
| 20 to 24 Year Olds | 537 (94.1%) | 34 (5.9%) |
| 25 to 34 Year Olds | 312 (62.5%) | 187 (37.5%) |
| 35 Years and over | 534 (77.3%) | 157 (22.7%) |
| Total | 6,474 (82.9%) | 1,336 (17.1%) |
Educational Attainment by Field of Study in Clatsop County
Business (1,136 | 13.3%), education (1,113 | 13.0%), bio, nature & agricultural (1,073 | 12.6%), science & technology (894 | 10.4%), and social sciences (687 | 8.0%) are the most common fields of study among 8,551 individuals in Clatsop County who have obtained a bachelor's degree or higher.
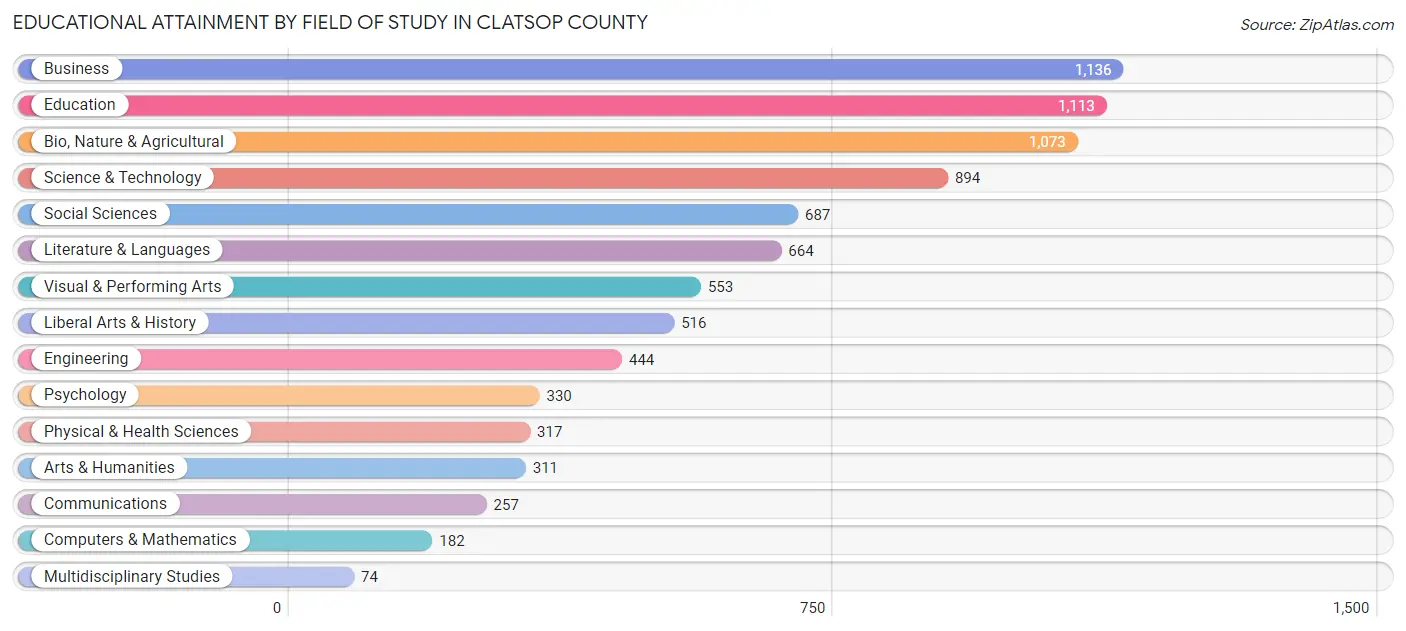
| Field of Study | # Graduates | % Graduates |
| Computers & Mathematics | 182 | 2.1% |
| Bio, Nature & Agricultural | 1,073 | 12.6% |
| Physical & Health Sciences | 317 | 3.7% |
| Psychology | 330 | 3.9% |
| Social Sciences | 687 | 8.0% |
| Engineering | 444 | 5.2% |
| Multidisciplinary Studies | 74 | 0.9% |
| Science & Technology | 894 | 10.4% |
| Business | 1,136 | 13.3% |
| Education | 1,113 | 13.0% |
| Literature & Languages | 664 | 7.8% |
| Liberal Arts & History | 516 | 6.0% |
| Visual & Performing Arts | 553 | 6.5% |
| Communications | 257 | 3.0% |
| Arts & Humanities | 311 | 3.6% |
| Total | 8,551 | 100.0% |
Transportation & Commute in Clatsop County
Vehicle Availability by Sex in Clatsop County
The most prevalent vehicle ownership categories in Clatsop County are males with 2 vehicles (3,480, accounting for 35.5%) and females with 2 vehicles (2,831, making up 42.2%).
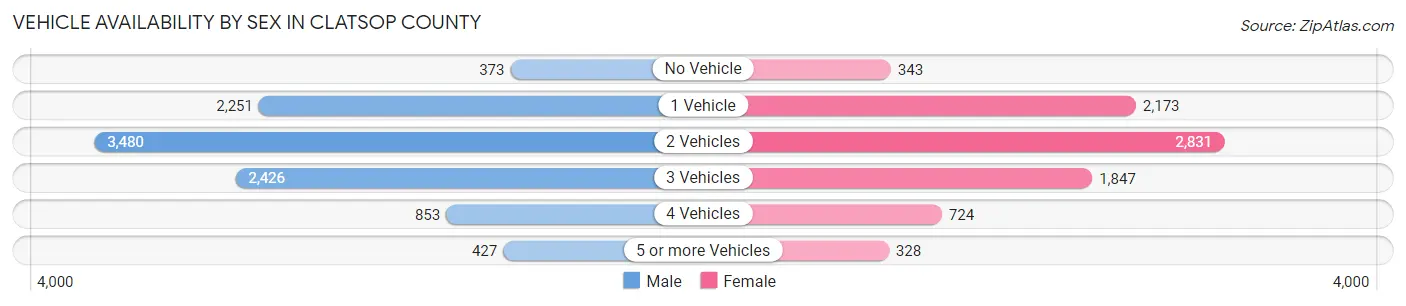
| Vehicles Available | Male | Female |
| No Vehicle | 373 (3.8%) | 343 (4.2%) |
| 1 Vehicle | 2,251 (23.0%) | 2,173 (26.4%) |
| 2 Vehicles | 3,480 (35.5%) | 2,831 (34.3%) |
| 3 Vehicles | 2,426 (24.7%) | 1,847 (22.4%) |
| 4 Vehicles | 853 (8.7%) | 724 (8.8%) |
| 5 or more Vehicles | 427 (4.3%) | 328 (4.0%) |
| Total | 9,810 (100.0%) | 8,246 (100.0%) |
Commute Time in Clatsop County
The most frequently occuring commute durations in Clatsop County are 5 to 9 minutes (3,122 commuters, 19.0%), 10 to 14 minutes (2,933 commuters, 17.9%), and 15 to 19 minutes (2,444 commuters, 14.9%).
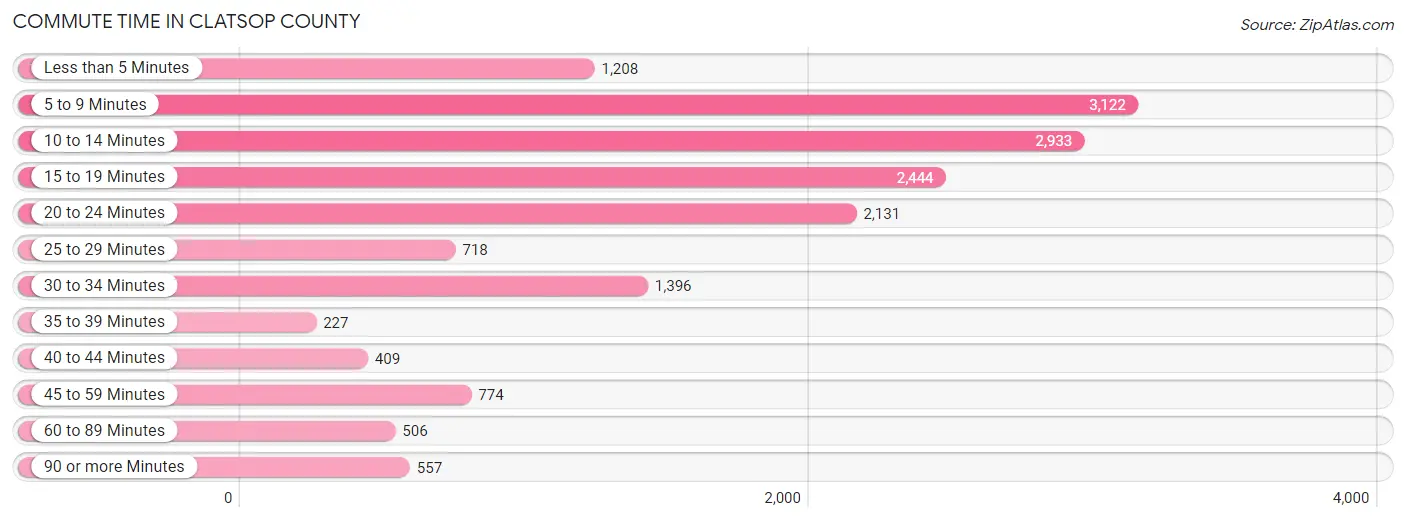
| Commute Time | # Commuters | % Commuters |
| Less than 5 Minutes | 1,208 | 7.3% |
| 5 to 9 Minutes | 3,122 | 19.0% |
| 10 to 14 Minutes | 2,933 | 17.9% |
| 15 to 19 Minutes | 2,444 | 14.9% |
| 20 to 24 Minutes | 2,131 | 13.0% |
| 25 to 29 Minutes | 718 | 4.4% |
| 30 to 34 Minutes | 1,396 | 8.5% |
| 35 to 39 Minutes | 227 | 1.4% |
| 40 to 44 Minutes | 409 | 2.5% |
| 45 to 59 Minutes | 774 | 4.7% |
| 60 to 89 Minutes | 506 | 3.1% |
| 90 or more Minutes | 557 | 3.4% |
Commute Time by Sex in Clatsop County
The most common commute times in Clatsop County are 10 to 14 minutes (1,749 commuters, 19.3%) for males and 5 to 9 minutes (1,689 commuters, 23.0%) for females.
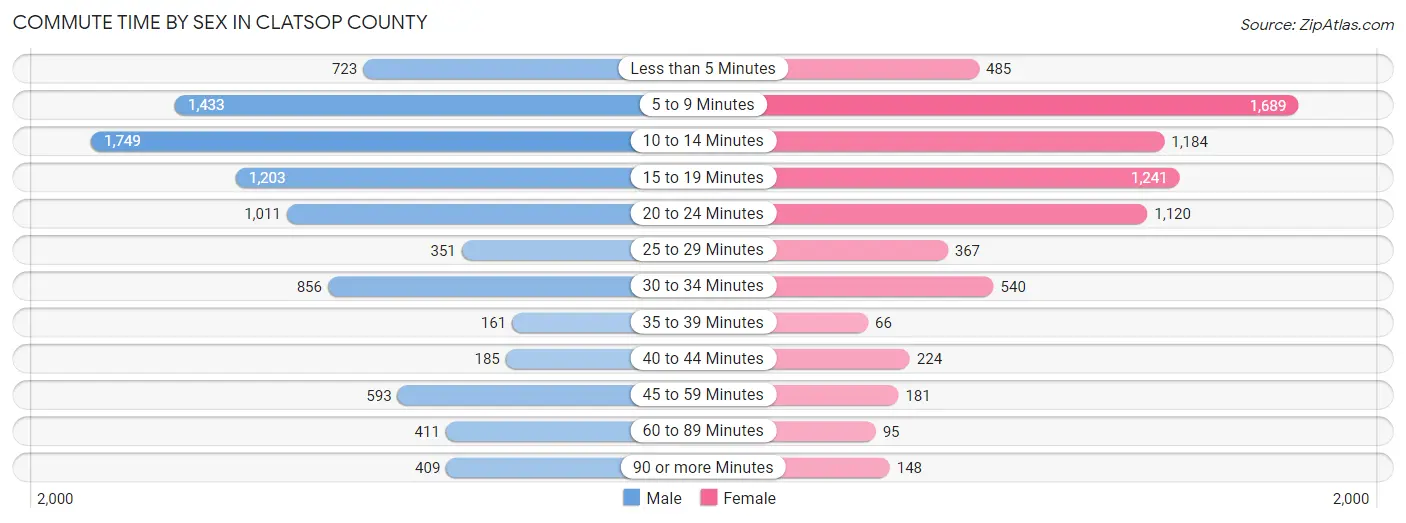
| Commute Time | Male | Female |
| Less than 5 Minutes | 723 (8.0%) | 485 (6.6%) |
| 5 to 9 Minutes | 1,433 (15.8%) | 1,689 (23.0%) |
| 10 to 14 Minutes | 1,749 (19.3%) | 1,184 (16.1%) |
| 15 to 19 Minutes | 1,203 (13.2%) | 1,241 (16.9%) |
| 20 to 24 Minutes | 1,011 (11.1%) | 1,120 (15.3%) |
| 25 to 29 Minutes | 351 (3.9%) | 367 (5.0%) |
| 30 to 34 Minutes | 856 (9.4%) | 540 (7.4%) |
| 35 to 39 Minutes | 161 (1.8%) | 66 (0.9%) |
| 40 to 44 Minutes | 185 (2.0%) | 224 (3.0%) |
| 45 to 59 Minutes | 593 (6.5%) | 181 (2.5%) |
| 60 to 89 Minutes | 411 (4.5%) | 95 (1.3%) |
| 90 or more Minutes | 409 (4.5%) | 148 (2.0%) |
Time of Departure to Work by Sex in Clatsop County
The most frequent times of departure to work in Clatsop County are 7:30 AM to 7:59 AM (1,201, 13.2%) for males and 7:30 AM to 7:59 AM (1,128, 15.4%) for females.
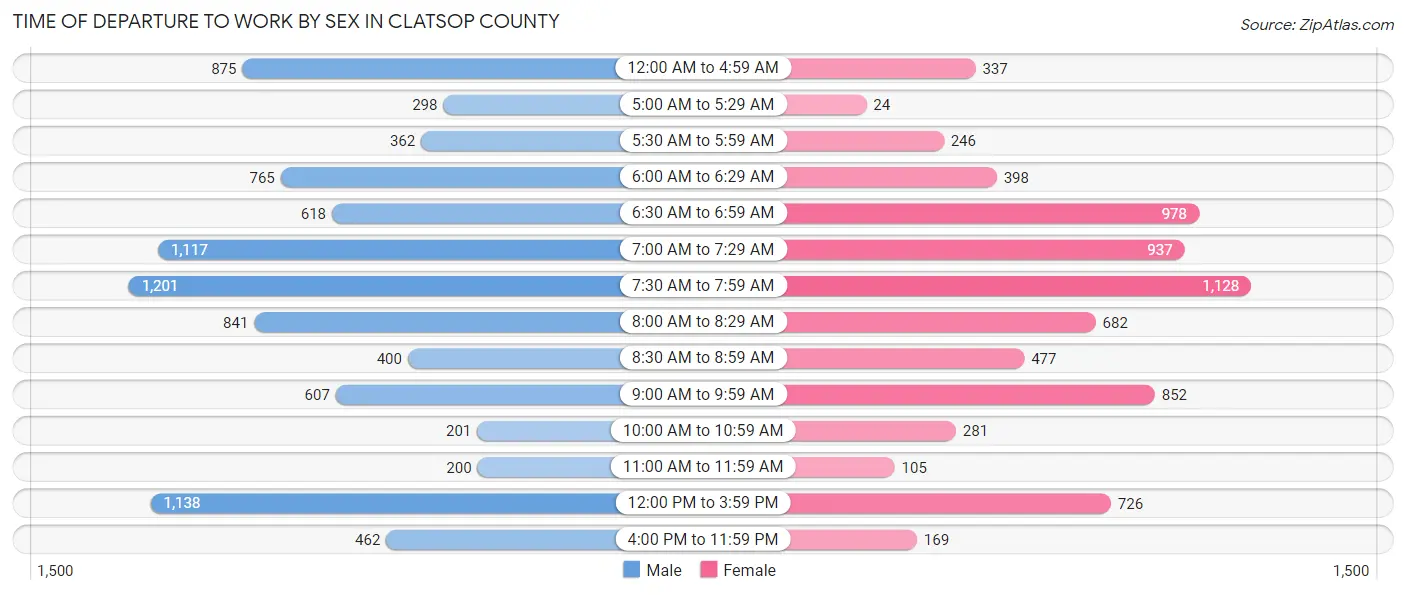
| Time of Departure | Male | Female |
| 12:00 AM to 4:59 AM | 875 (9.6%) | 337 (4.6%) |
| 5:00 AM to 5:29 AM | 298 (3.3%) | 24 (0.3%) |
| 5:30 AM to 5:59 AM | 362 (4.0%) | 246 (3.4%) |
| 6:00 AM to 6:29 AM | 765 (8.4%) | 398 (5.4%) |
| 6:30 AM to 6:59 AM | 618 (6.8%) | 978 (13.3%) |
| 7:00 AM to 7:29 AM | 1,117 (12.3%) | 937 (12.8%) |
| 7:30 AM to 7:59 AM | 1,201 (13.2%) | 1,128 (15.4%) |
| 8:00 AM to 8:29 AM | 841 (9.3%) | 682 (9.3%) |
| 8:30 AM to 8:59 AM | 400 (4.4%) | 477 (6.5%) |
| 9:00 AM to 9:59 AM | 607 (6.7%) | 852 (11.6%) |
| 10:00 AM to 10:59 AM | 201 (2.2%) | 281 (3.8%) |
| 11:00 AM to 11:59 AM | 200 (2.2%) | 105 (1.4%) |
| 12:00 PM to 3:59 PM | 1,138 (12.5%) | 726 (9.9%) |
| 4:00 PM to 11:59 PM | 462 (5.1%) | 169 (2.3%) |
| Total | 9,085 (100.0%) | 7,340 (100.0%) |
Housing Occupancy in Clatsop County
Occupancy by Ownership in Clatsop County
Of the total 17,246 dwellings in Clatsop County, owner-occupied units account for 10,663 (61.8%), while renter-occupied units make up 6,583 (38.2%).
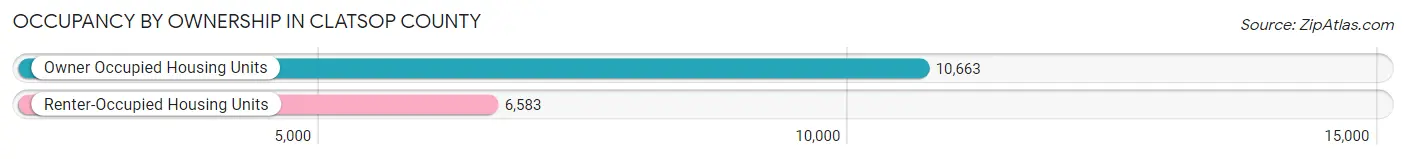
| Occupancy | # Housing Units | % Housing Units |
| Owner Occupied Housing Units | 10,663 | 61.8% |
| Renter-Occupied Housing Units | 6,583 | 38.2% |
| Total Occupied Housing Units | 17,246 | 100.0% |
Occupancy by Household Size in Clatsop County
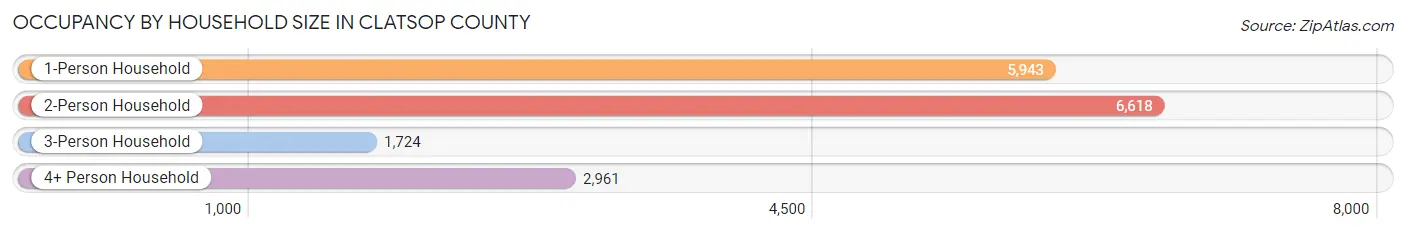
| Household Size | # Housing Units | % Housing Units |
| 1-Person Household | 5,943 | 34.5% |
| 2-Person Household | 6,618 | 38.4% |
| 3-Person Household | 1,724 | 10.0% |
| 4+ Person Household | 2,961 | 17.2% |
| Total Housing Units | 17,246 | 100.0% |
Occupancy by Ownership by Household Size in Clatsop County
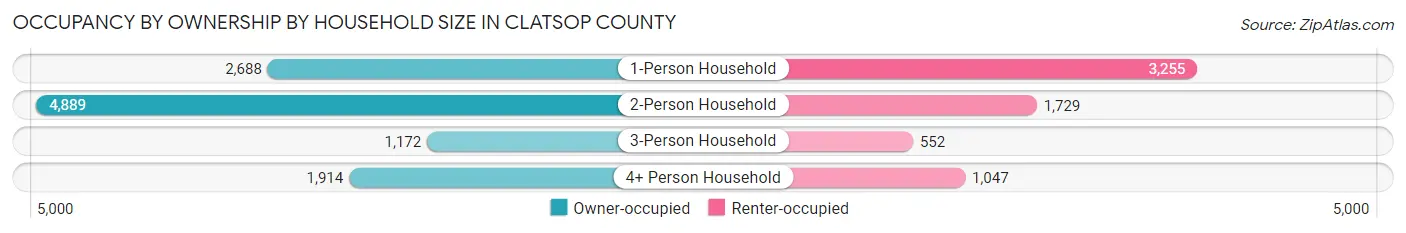
| Household Size | Owner-occupied | Renter-occupied |
| 1-Person Household | 2,688 (45.2%) | 3,255 (54.8%) |
| 2-Person Household | 4,889 (73.9%) | 1,729 (26.1%) |
| 3-Person Household | 1,172 (68.0%) | 552 (32.0%) |
| 4+ Person Household | 1,914 (64.6%) | 1,047 (35.4%) |
| Total Housing Units | 10,663 (61.8%) | 6,583 (38.2%) |
Occupancy by Educational Attainment in Clatsop County
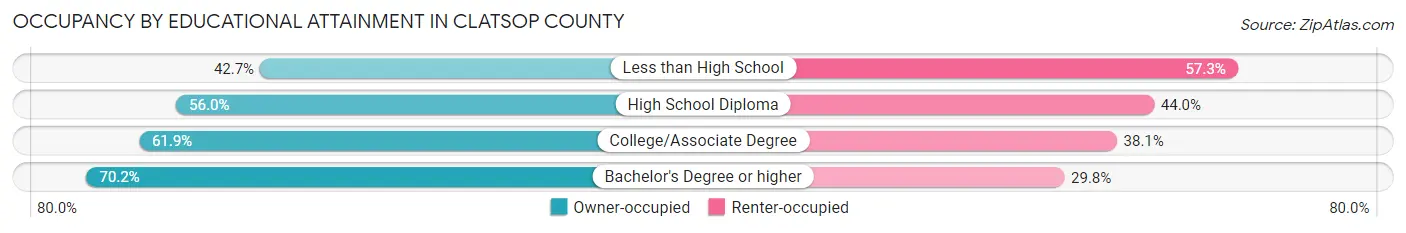
| Household Size | Owner-occupied | Renter-occupied |
| Less than High School | 387 (42.7%) | 520 (57.3%) |
| High School Diploma | 2,266 (56.0%) | 1,783 (44.0%) |
| College/Associate Degree | 4,581 (61.9%) | 2,824 (38.1%) |
| Bachelor's Degree or higher | 3,429 (70.2%) | 1,456 (29.8%) |
Occupancy by Age of Householder in Clatsop County
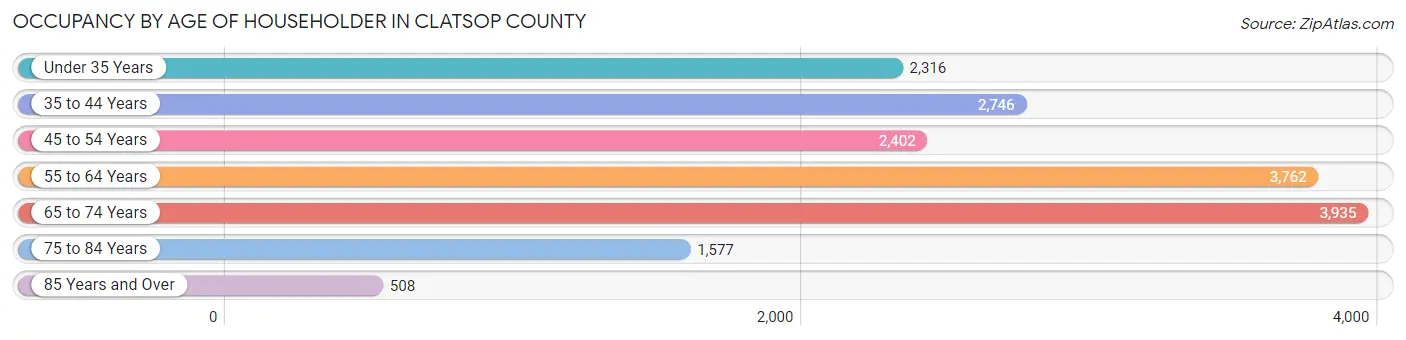
| Age Bracket | # Households | % Households |
| Under 35 Years | 2,316 | 13.4% |
| 35 to 44 Years | 2,746 | 15.9% |
| 45 to 54 Years | 2,402 | 13.9% |
| 55 to 64 Years | 3,762 | 21.8% |
| 65 to 74 Years | 3,935 | 22.8% |
| 75 to 84 Years | 1,577 | 9.1% |
| 85 Years and Over | 508 | 2.9% |
| Total | 17,246 | 100.0% |
Housing Finances in Clatsop County
Median Income by Occupancy in Clatsop County
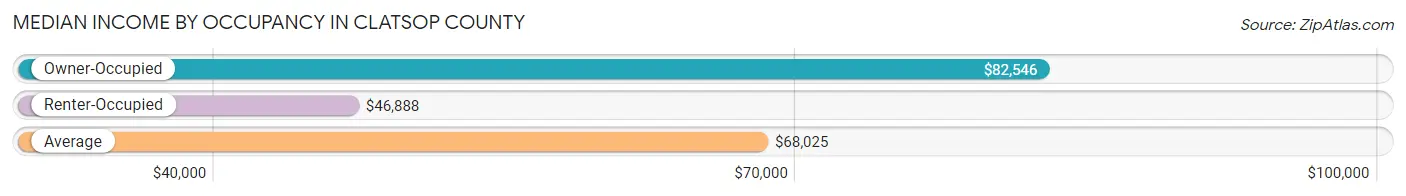
| Occupancy Type | # Households | Median Income |
| Owner-Occupied | 10,663 (61.8%) | $82,546 |
| Renter-Occupied | 6,583 (38.2%) | $46,888 |
| Average | 17,246 (100.0%) | $68,025 |
Occupancy by Householder Income Bracket in Clatsop County
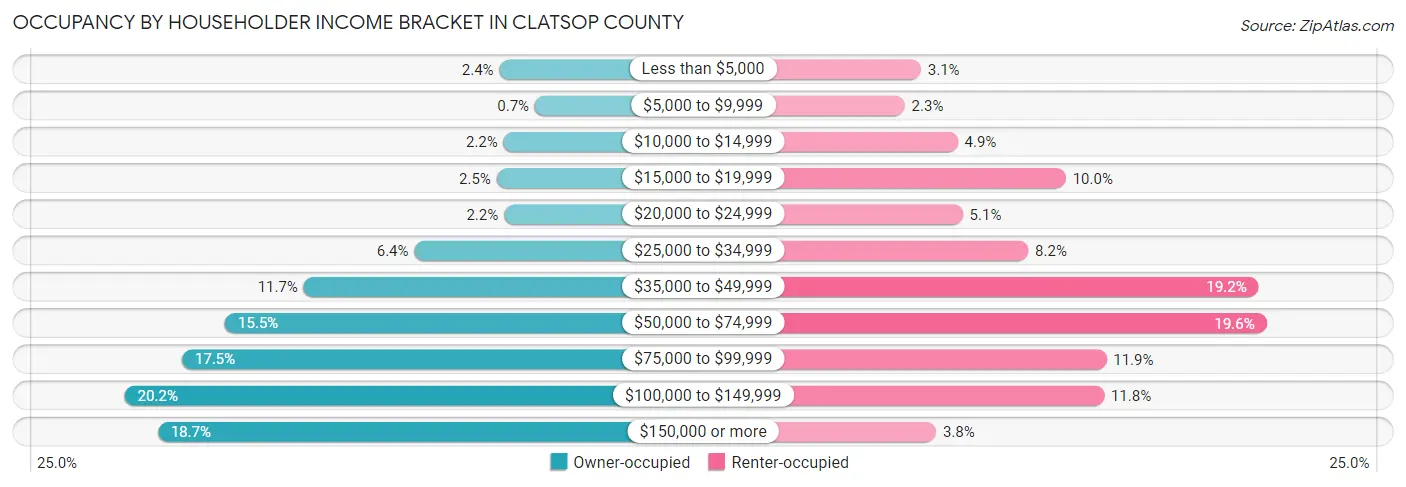
| Income Bracket | Owner-occupied | Renter-occupied |
| Less than $5,000 | 255 (2.4%) | 205 (3.1%) |
| $5,000 to $9,999 | 75 (0.7%) | 154 (2.3%) |
| $10,000 to $14,999 | 234 (2.2%) | 320 (4.9%) |
| $15,000 to $19,999 | 269 (2.5%) | 659 (10.0%) |
| $20,000 to $24,999 | 231 (2.2%) | 336 (5.1%) |
| $25,000 to $34,999 | 687 (6.4%) | 541 (8.2%) |
| $35,000 to $49,999 | 1,249 (11.7%) | 1,263 (19.2%) |
| $50,000 to $74,999 | 1,648 (15.5%) | 1,288 (19.6%) |
| $75,000 to $99,999 | 1,867 (17.5%) | 786 (11.9%) |
| $100,000 to $149,999 | 2,158 (20.2%) | 779 (11.8%) |
| $150,000 or more | 1,990 (18.7%) | 252 (3.8%) |
| Total | 10,663 (100.0%) | 6,583 (100.0%) |
Monthly Housing Cost Tiers in Clatsop County
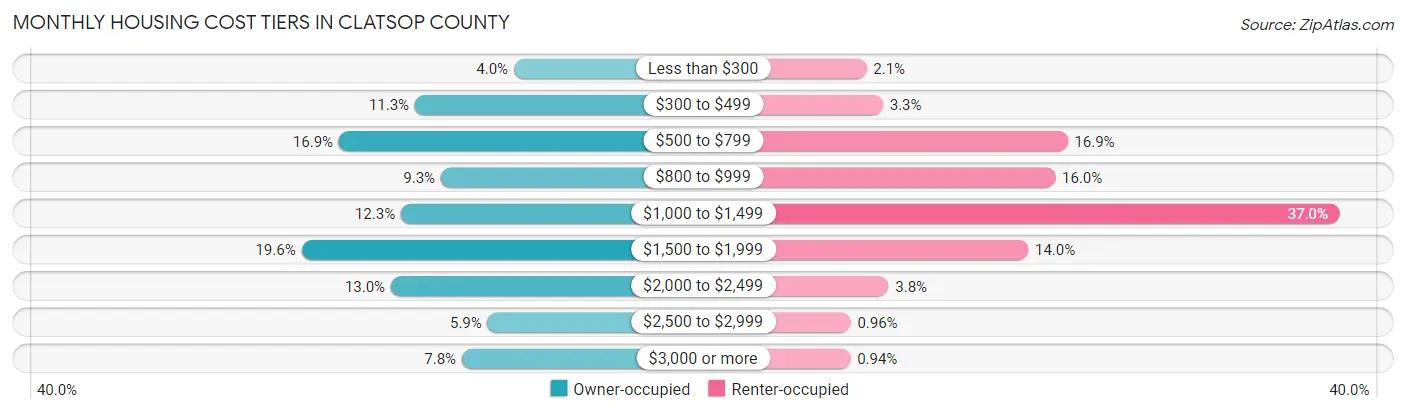
| Monthly Cost | Owner-occupied | Renter-occupied |
| Less than $300 | 422 (4.0%) | 140 (2.1%) |
| $300 to $499 | 1,200 (11.3%) | 220 (3.3%) |
| $500 to $799 | 1,797 (16.9%) | 1,115 (16.9%) |
| $800 to $999 | 996 (9.3%) | 1,055 (16.0%) |
| $1,000 to $1,499 | 1,309 (12.3%) | 2,436 (37.0%) |
| $1,500 to $1,999 | 2,091 (19.6%) | 924 (14.0%) |
| $2,000 to $2,499 | 1,388 (13.0%) | 247 (3.7%) |
| $2,500 to $2,999 | 629 (5.9%) | 63 (1.0%) |
| $3,000 or more | 831 (7.8%) | 62 (0.9%) |
| Total | 10,663 (100.0%) | 6,583 (100.0%) |
Physical Housing Characteristics in Clatsop County
Housing Structures in Clatsop County
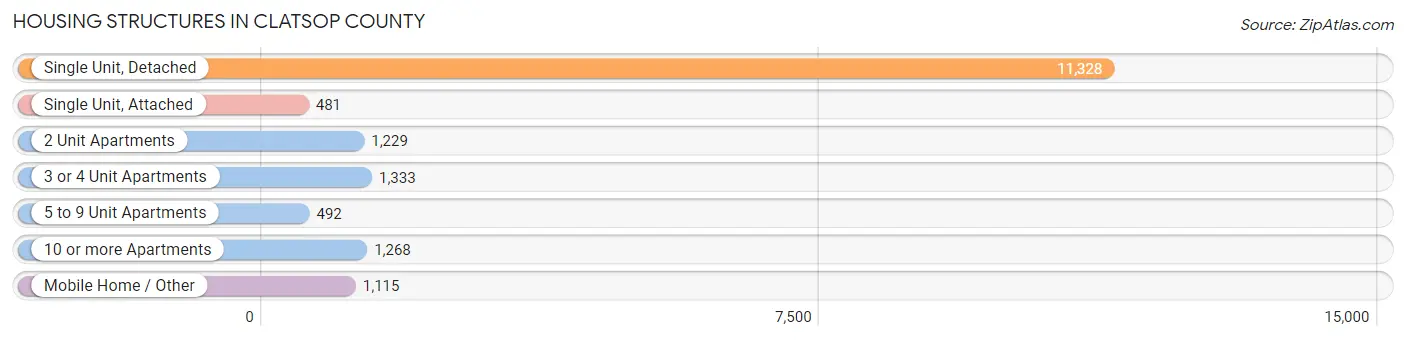
| Structure Type | # Housing Units | % Housing Units |
| Single Unit, Detached | 11,328 | 65.7% |
| Single Unit, Attached | 481 | 2.8% |
| 2 Unit Apartments | 1,229 | 7.1% |
| 3 or 4 Unit Apartments | 1,333 | 7.7% |
| 5 to 9 Unit Apartments | 492 | 2.9% |
| 10 or more Apartments | 1,268 | 7.3% |
| Mobile Home / Other | 1,115 | 6.5% |
| Total | 17,246 | 100.0% |
Housing Structures by Occupancy in Clatsop County
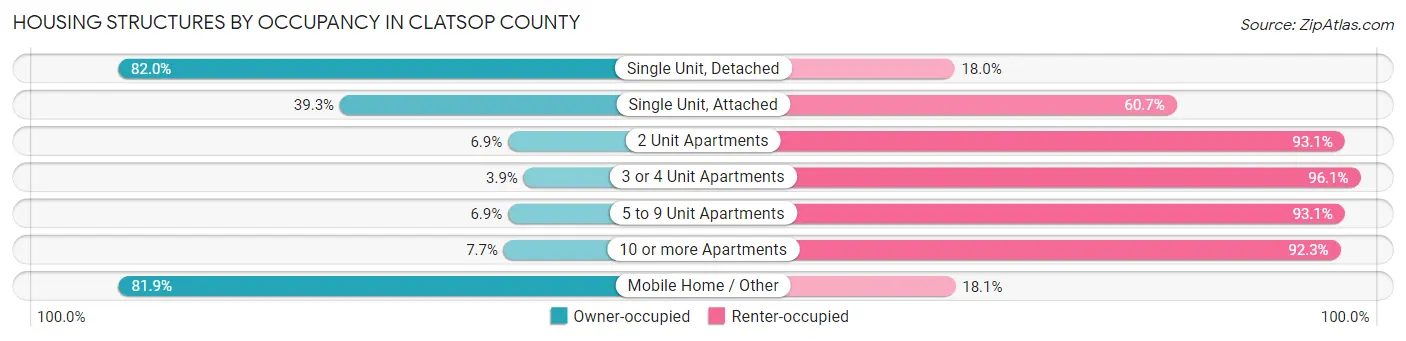
| Structure Type | Owner-occupied | Renter-occupied |
| Single Unit, Detached | 9,292 (82.0%) | 2,036 (18.0%) |
| Single Unit, Attached | 189 (39.3%) | 292 (60.7%) |
| 2 Unit Apartments | 85 (6.9%) | 1,144 (93.1%) |
| 3 or 4 Unit Apartments | 52 (3.9%) | 1,281 (96.1%) |
| 5 to 9 Unit Apartments | 34 (6.9%) | 458 (93.1%) |
| 10 or more Apartments | 98 (7.7%) | 1,170 (92.3%) |
| Mobile Home / Other | 913 (81.9%) | 202 (18.1%) |
| Total | 10,663 (61.8%) | 6,583 (38.2%) |
Housing Structures by Number of Rooms in Clatsop County
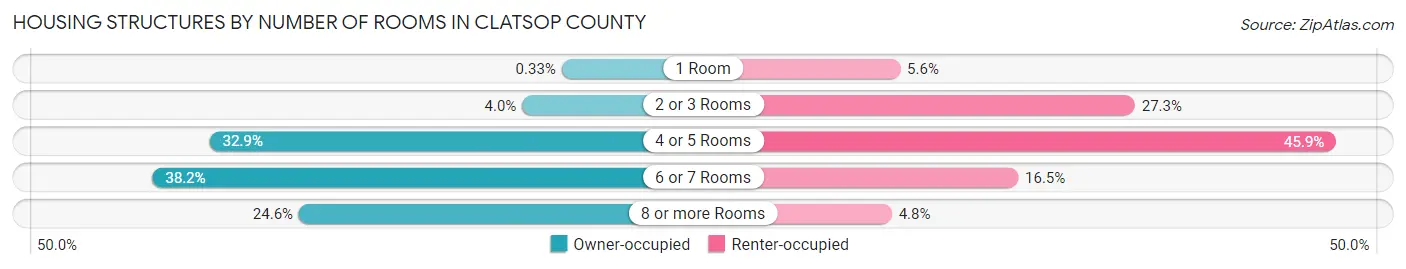
| Number of Rooms | Owner-occupied | Renter-occupied |
| 1 Room | 35 (0.3%) | 367 (5.6%) |
| 2 or 3 Rooms | 424 (4.0%) | 1,795 (27.3%) |
| 4 or 5 Rooms | 3,507 (32.9%) | 3,021 (45.9%) |
| 6 or 7 Rooms | 4,071 (38.2%) | 1,085 (16.5%) |
| 8 or more Rooms | 2,626 (24.6%) | 315 (4.8%) |
| Total | 10,663 (100.0%) | 6,583 (100.0%) |
Housing Structure by Heating Type in Clatsop County
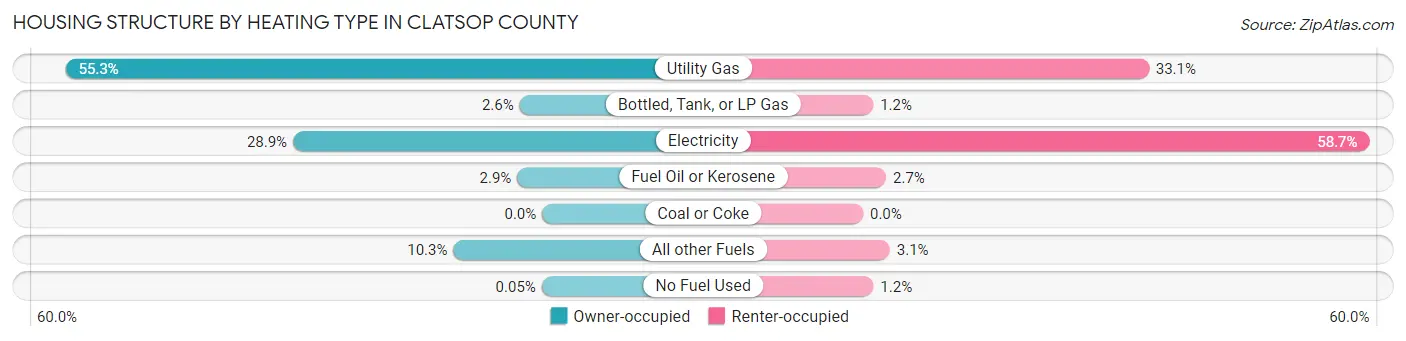
| Heating Type | Owner-occupied | Renter-occupied |
| Utility Gas | 5,892 (55.3%) | 2,181 (33.1%) |
| Bottled, Tank, or LP Gas | 279 (2.6%) | 78 (1.2%) |
| Electricity | 3,081 (28.9%) | 3,864 (58.7%) |
| Fuel Oil or Kerosene | 308 (2.9%) | 176 (2.7%) |
| Coal or Coke | 0 (0.0%) | 0 (0.0%) |
| All other Fuels | 1,098 (10.3%) | 205 (3.1%) |
| No Fuel Used | 5 (0.1%) | 79 (1.2%) |
| Total | 10,663 (100.0%) | 6,583 (100.0%) |
Household Vehicle Usage in Clatsop County
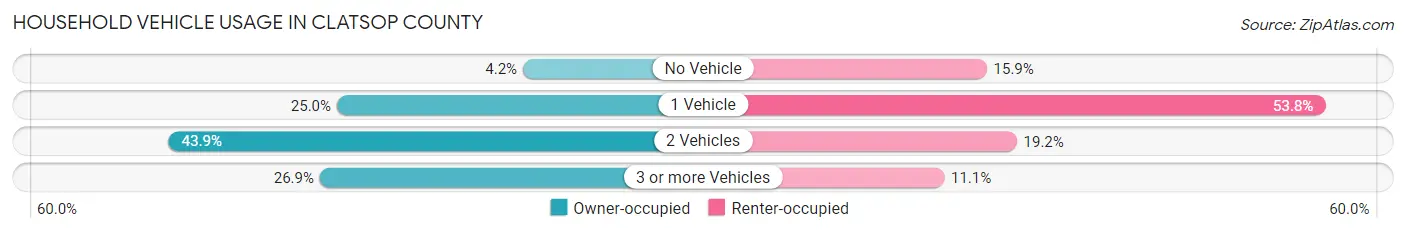
| Vehicles per Household | Owner-occupied | Renter-occupied |
| No Vehicle | 446 (4.2%) | 1,045 (15.9%) |
| 1 Vehicle | 2,668 (25.0%) | 3,541 (53.8%) |
| 2 Vehicles | 4,677 (43.9%) | 1,266 (19.2%) |
| 3 or more Vehicles | 2,872 (26.9%) | 731 (11.1%) |
| Total | 10,663 (100.0%) | 6,583 (100.0%) |
Real Estate & Mortgages in Clatsop County
Real Estate and Mortgage Overview in Clatsop County
| Characteristic | Without Mortgage | With Mortgage |
| Housing Units | 3,968 | 6,695 |
| Median Property Value | $386,800 | $418,500 |
| Median Household Income | $65,278 | $1,500 |
| Monthly Housing Costs | $568 | $827 |
| Real Estate Taxes | $2,924 | $84 |
Property Value by Mortgage Status in Clatsop County
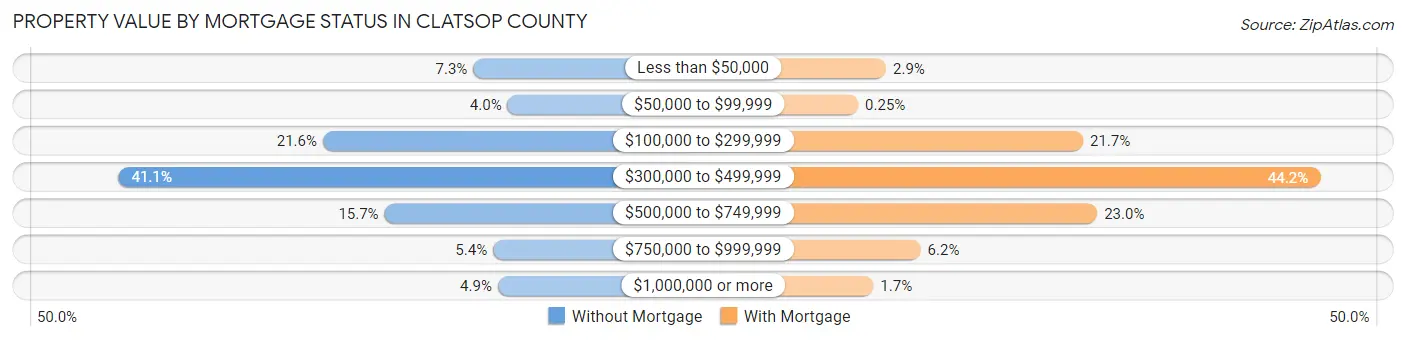
| Property Value | Without Mortgage | With Mortgage |
| Less than $50,000 | 289 (7.3%) | 195 (2.9%) |
| $50,000 to $99,999 | 159 (4.0%) | 17 (0.3%) |
| $100,000 to $299,999 | 857 (21.6%) | 1,451 (21.7%) |
| $300,000 to $499,999 | 1,629 (41.0%) | 2,962 (44.2%) |
| $500,000 to $749,999 | 624 (15.7%) | 1,541 (23.0%) |
| $750,000 to $999,999 | 214 (5.4%) | 415 (6.2%) |
| $1,000,000 or more | 196 (4.9%) | 114 (1.7%) |
| Total | 3,968 (100.0%) | 6,695 (100.0%) |
Household Income by Mortgage Status in Clatsop County
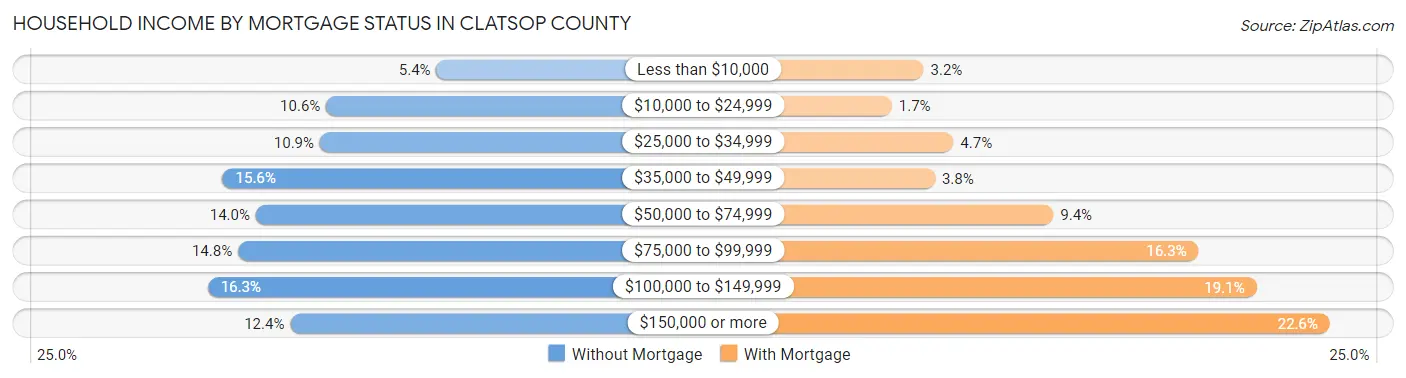
| Household Income | Without Mortgage | With Mortgage |
| Less than $10,000 | 214 (5.4%) | 217 (3.2%) |
| $10,000 to $24,999 | 422 (10.6%) | 116 (1.7%) |
| $25,000 to $34,999 | 434 (10.9%) | 312 (4.7%) |
| $35,000 to $49,999 | 618 (15.6%) | 253 (3.8%) |
| $50,000 to $74,999 | 555 (14.0%) | 631 (9.4%) |
| $75,000 to $99,999 | 589 (14.8%) | 1,093 (16.3%) |
| $100,000 to $149,999 | 646 (16.3%) | 1,278 (19.1%) |
| $150,000 or more | 490 (12.3%) | 1,512 (22.6%) |
| Total | 3,968 (100.0%) | 6,695 (100.0%) |
Property Value to Household Income Ratio in Clatsop County
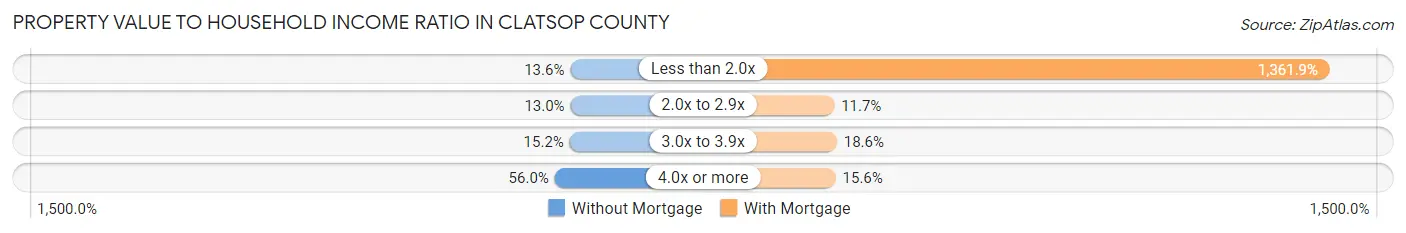
| Value-to-Income Ratio | Without Mortgage | With Mortgage |
| Less than 2.0x | 541 (13.6%) | 91,177 (1,361.9%) |
| 2.0x to 2.9x | 516 (13.0%) | 781 (11.7%) |
| 3.0x to 3.9x | 603 (15.2%) | 1,248 (18.6%) |
| 4.0x or more | 2,223 (56.0%) | 1,041 (15.5%) |
| Total | 3,968 (100.0%) | 6,695 (100.0%) |
Real Estate Taxes by Mortgage Status in Clatsop County
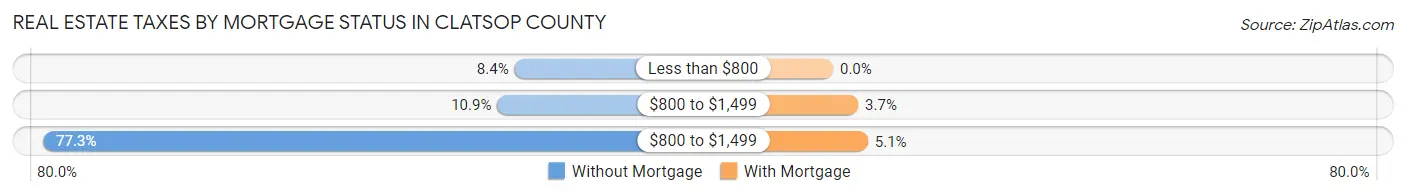
| Property Taxes | Without Mortgage | With Mortgage |
| Less than $800 | 334 (8.4%) | 0 (0.0%) |
| $800 to $1,499 | 434 (10.9%) | 246 (3.7%) |
| $800 to $1,499 | 3,067 (77.3%) | 341 (5.1%) |
| Total | 3,968 (100.0%) | 6,695 (100.0%) |
Health & Disability in Clatsop County
Health Insurance Coverage by Age in Clatsop County
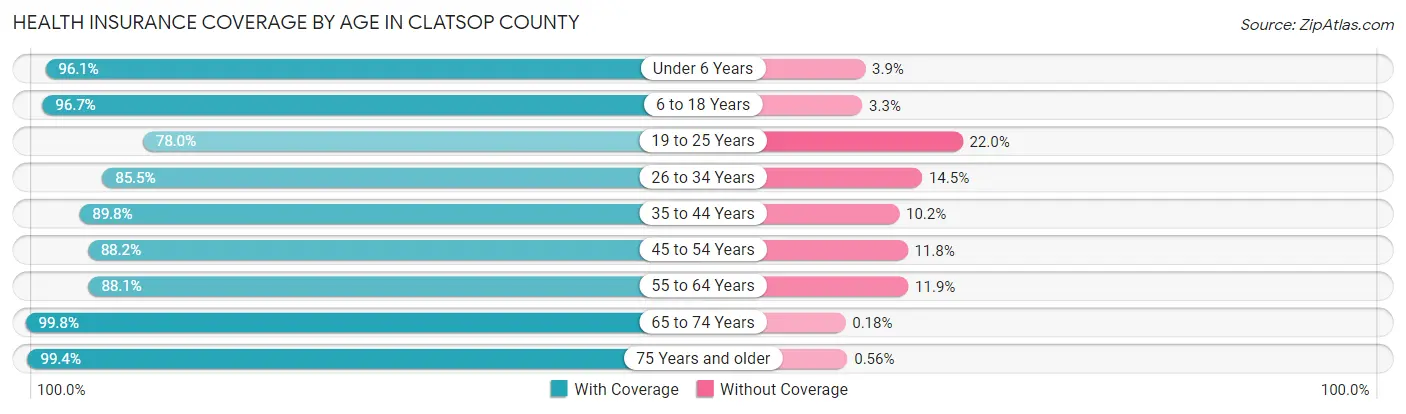
| Age Bracket | With Coverage | Without Coverage |
| Under 6 Years | 2,282 (96.1%) | 92 (3.9%) |
| 6 to 18 Years | 5,228 (96.7%) | 180 (3.3%) |
| 19 to 25 Years | 2,377 (78.0%) | 672 (22.0%) |
| 26 to 34 Years | 3,748 (85.5%) | 635 (14.5%) |
| 35 to 44 Years | 4,494 (89.8%) | 511 (10.2%) |
| 45 to 54 Years | 4,060 (88.2%) | 542 (11.8%) |
| 55 to 64 Years | 5,464 (88.1%) | 739 (11.9%) |
| 65 to 74 Years | 6,253 (99.8%) | 11 (0.2%) |
| 75 Years and older | 3,345 (99.4%) | 19 (0.6%) |
| Total | 37,251 (91.6%) | 3,401 (8.4%) |
Health Insurance Coverage by Citizenship Status in Clatsop County
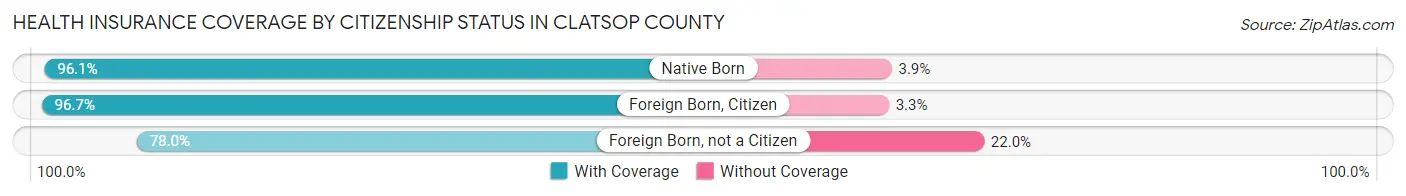
| Citizenship Status | With Coverage | Without Coverage |
| Native Born | 2,282 (96.1%) | 92 (3.9%) |
| Foreign Born, Citizen | 5,228 (96.7%) | 180 (3.3%) |
| Foreign Born, not a Citizen | 2,377 (78.0%) | 672 (22.0%) |
Health Insurance Coverage by Household Income in Clatsop County
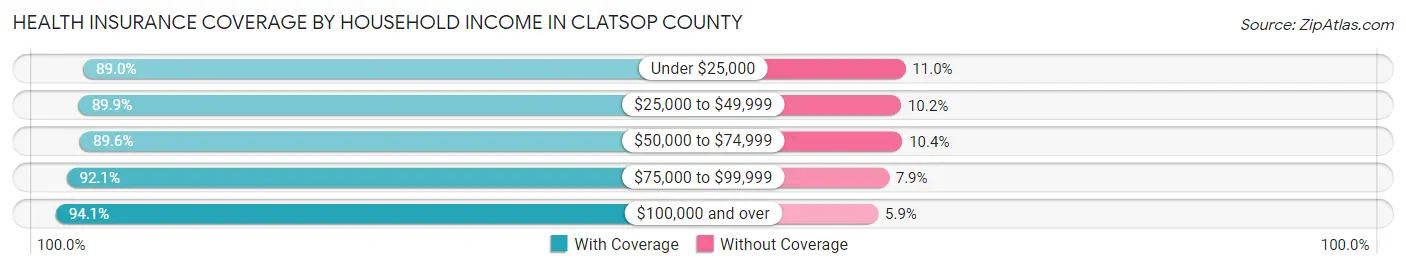
| Household Income | With Coverage | Without Coverage |
| Under $25,000 | 3,671 (89.0%) | 453 (11.0%) |
| $25,000 to $49,999 | 6,335 (89.8%) | 716 (10.2%) |
| $50,000 to $74,999 | 5,623 (89.6%) | 652 (10.4%) |
| $75,000 to $99,999 | 6,651 (92.1%) | 568 (7.9%) |
| $100,000 and over | 14,502 (94.1%) | 903 (5.9%) |
Public vs Private Health Insurance Coverage by Age in Clatsop County
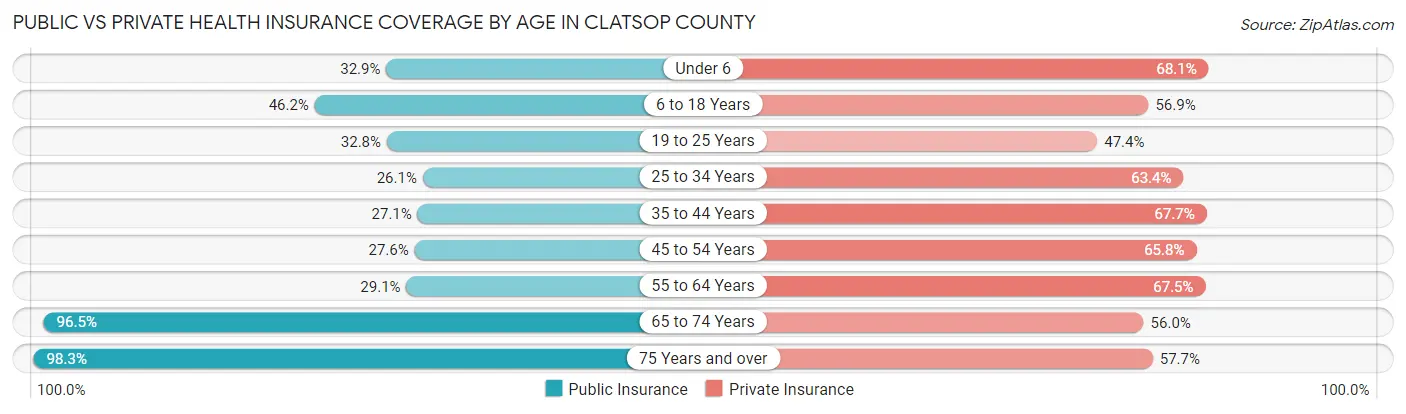
| Age Bracket | Public Insurance | Private Insurance |
| Under 6 | 780 (32.9%) | 1,616 (68.1%) |
| 6 to 18 Years | 2,496 (46.2%) | 3,079 (56.9%) |
| 19 to 25 Years | 999 (32.8%) | 1,446 (47.4%) |
| 25 to 34 Years | 1,144 (26.1%) | 2,778 (63.4%) |
| 35 to 44 Years | 1,354 (27.1%) | 3,389 (67.7%) |
| 45 to 54 Years | 1,271 (27.6%) | 3,027 (65.8%) |
| 55 to 64 Years | 1,807 (29.1%) | 4,186 (67.5%) |
| 65 to 74 Years | 6,042 (96.5%) | 3,510 (56.0%) |
| 75 Years and over | 3,308 (98.3%) | 1,942 (57.7%) |
| Total | 19,201 (47.2%) | 24,973 (61.4%) |
Disability Status by Sex by Age in Clatsop County
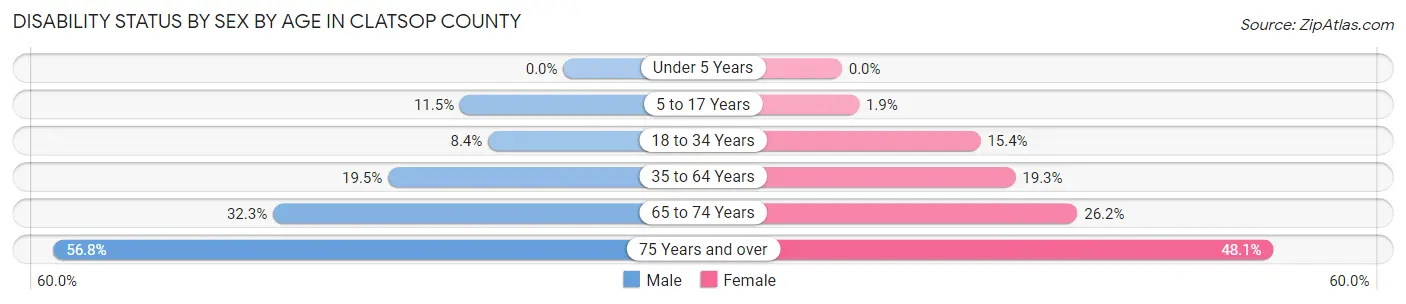
| Age Bracket | Male | Female |
| Under 5 Years | 0 (0.0%) | 0 (0.0%) |
| 5 to 17 Years | 320 (11.5%) | 53 (1.9%) |
| 18 to 34 Years | 327 (8.4%) | 587 (15.4%) |
| 35 to 64 Years | 1,503 (19.5%) | 1,568 (19.3%) |
| 65 to 74 Years | 964 (32.3%) | 861 (26.2%) |
| 75 Years and over | 865 (56.8%) | 885 (48.1%) |
Disability Class by Sex by Age in Clatsop County
Disability Class: Hearing Difficulty
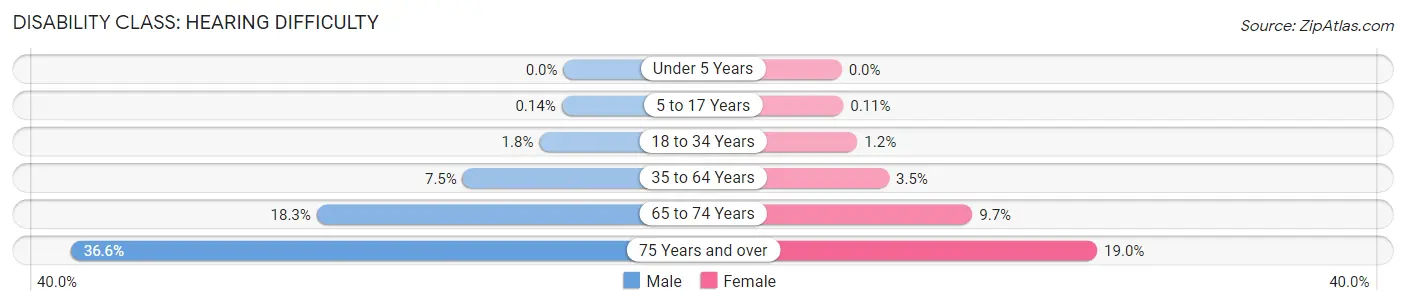
| Age Bracket | Male | Female |
| Under 5 Years | 0 (0.0%) | 0 (0.0%) |
| 5 to 17 Years | 4 (0.1%) | 3 (0.1%) |
| 18 to 34 Years | 70 (1.8%) | 44 (1.2%) |
| 35 to 64 Years | 576 (7.5%) | 285 (3.5%) |
| 65 to 74 Years | 546 (18.3%) | 318 (9.7%) |
| 75 Years and over | 557 (36.6%) | 349 (19.0%) |
Disability Class: Vision Difficulty
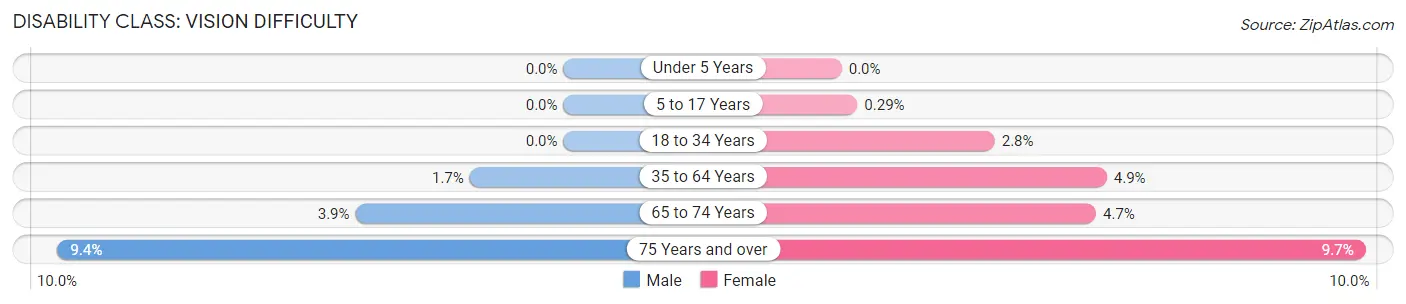
| Age Bracket | Male | Female |
| Under 5 Years | 0 (0.0%) | 0 (0.0%) |
| 5 to 17 Years | 0 (0.0%) | 8 (0.3%) |
| 18 to 34 Years | 0 (0.0%) | 108 (2.8%) |
| 35 to 64 Years | 134 (1.7%) | 399 (4.9%) |
| 65 to 74 Years | 115 (3.9%) | 155 (4.7%) |
| 75 Years and over | 143 (9.4%) | 179 (9.7%) |
Disability Class: Cognitive Difficulty
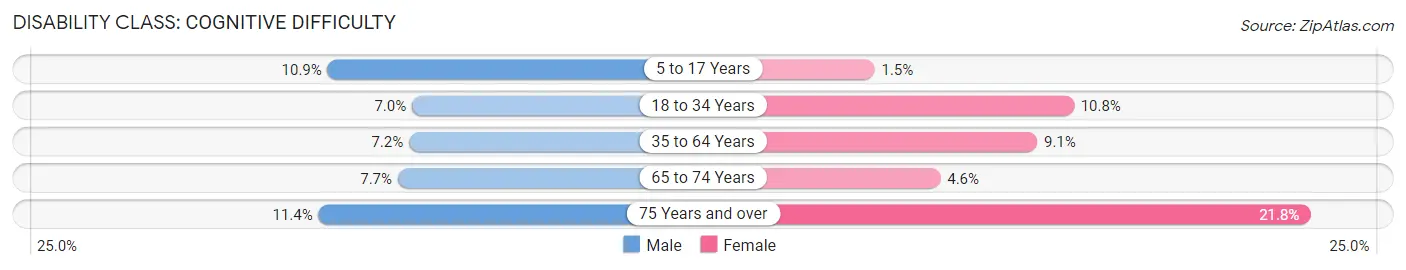
| Age Bracket | Male | Female |
| 5 to 17 Years | 304 (10.9%) | 42 (1.5%) |
| 18 to 34 Years | 274 (7.0%) | 409 (10.8%) |
| 35 to 64 Years | 551 (7.2%) | 735 (9.1%) |
| 65 to 74 Years | 229 (7.7%) | 150 (4.6%) |
| 75 Years and over | 173 (11.4%) | 401 (21.8%) |
Disability Class: Ambulatory Difficulty
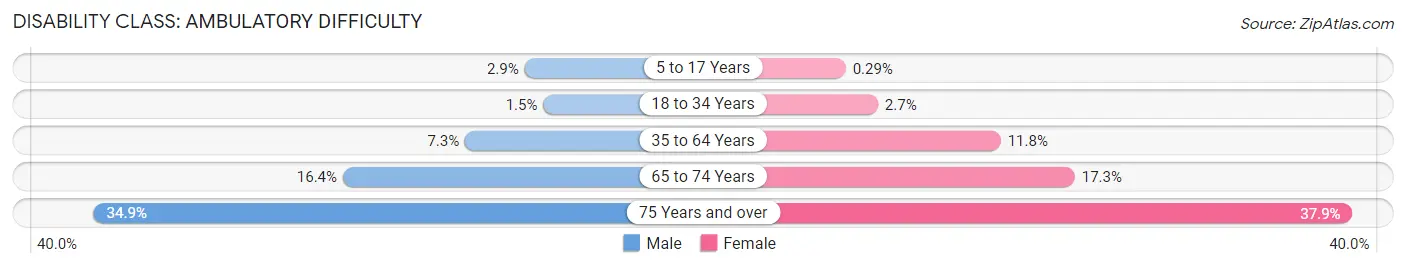
| Age Bracket | Male | Female |
| 5 to 17 Years | 80 (2.9%) | 8 (0.3%) |
| 18 to 34 Years | 58 (1.5%) | 102 (2.7%) |
| 35 to 64 Years | 562 (7.3%) | 957 (11.8%) |
| 65 to 74 Years | 488 (16.4%) | 568 (17.3%) |
| 75 Years and over | 531 (34.9%) | 698 (37.9%) |
Disability Class: Self-Care Difficulty
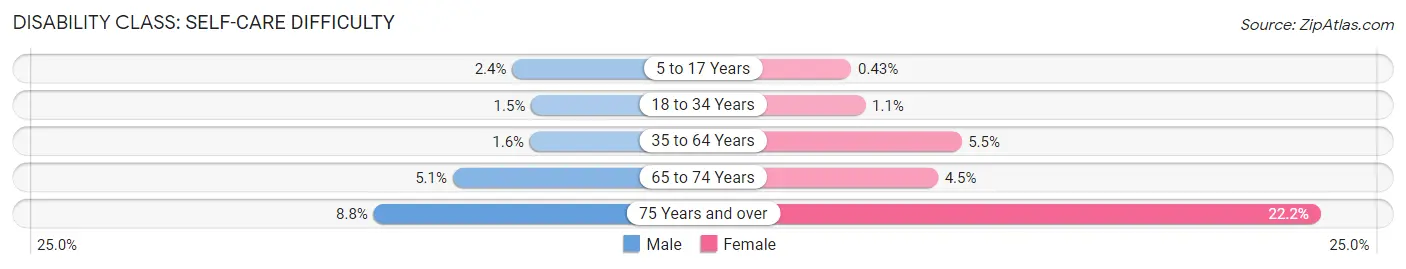
| Age Bracket | Male | Female |
| 5 to 17 Years | 66 (2.4%) | 12 (0.4%) |
| 18 to 34 Years | 58 (1.5%) | 41 (1.1%) |
| 35 to 64 Years | 119 (1.5%) | 449 (5.5%) |
| 65 to 74 Years | 153 (5.1%) | 146 (4.4%) |
| 75 Years and over | 134 (8.8%) | 409 (22.2%) |
Technology Access in Clatsop County
Computing Device Access in Clatsop County
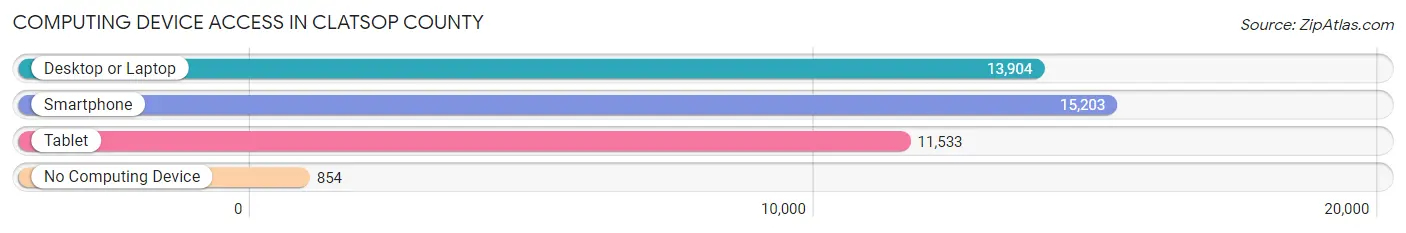
| Device Type | # Households | % Households |
| Desktop or Laptop | 13,904 | 80.6% |
| Smartphone | 15,203 | 88.1% |
| Tablet | 11,533 | 66.9% |
| No Computing Device | 854 | 5.0% |
| Total | 17,246 | 100.0% |
Internet Access in Clatsop County
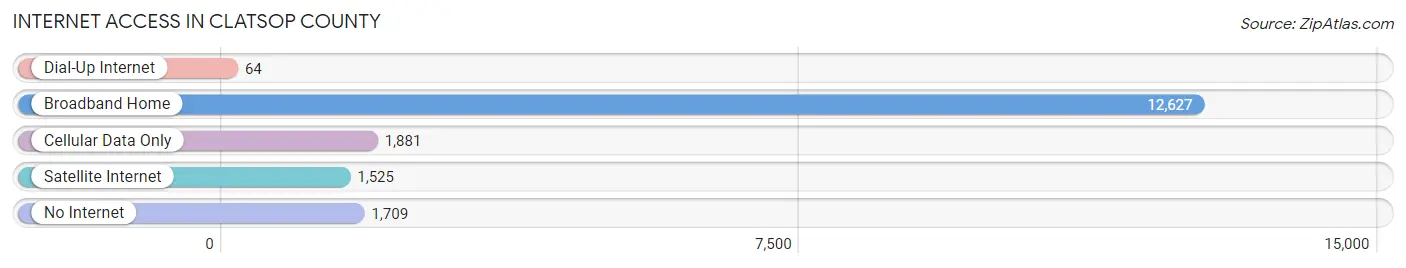
| Internet Type | # Households | % Households |
| Dial-Up Internet | 64 | 0.4% |
| Broadband Home | 12,627 | 73.2% |
| Cellular Data Only | 1,881 | 10.9% |
| Satellite Internet | 1,525 | 8.8% |
| No Internet | 1,709 | 9.9% |
| Total | 17,246 | 100.0% |
Clatsop County Summary
Clatsop County is located in the northwest corner of Oregon, along the Pacific Ocean. It is bordered by the Columbia River to the east, Washington to the north, and the Pacific Ocean to the west. The county seat is Astoria, which is the oldest American settlement west of the Rocky Mountains. Clatsop County is home to a variety of landscapes, from the rugged coastline to the lush forests of the Coast Range.
History
Clatsop County was created in 1844, when the Oregon Territory was divided into four counties. The county was named after the Clatsop tribe, a Native American tribe that lived in the area. The first settlers in the county were fur traders and missionaries, who arrived in the early 1800s. The first permanent settlement was Astoria, which was founded in 1811.
In the late 1800s, the county became a major center for the timber industry. Logging and fishing were the main industries in the county until the mid-1900s, when the timber industry began to decline. In the late 1900s, tourism became an important part of the county’s economy.
Geography
Clatsop County covers an area of 1,092 square miles. The county is divided into two distinct regions: the Coast Range and the Columbia River Valley. The Coast Range is a rugged, mountainous region that is home to dense forests and numerous rivers and streams. The Columbia River Valley is a flat, fertile region that is home to many farms and ranches.
The county is home to several state parks, including Fort Stevens State Park, Ecola State Park, and Fort Clatsop National Memorial. The county also contains several rivers, including the Columbia, Nehalem, and Necanicum.
Economy
The economy of Clatsop County is largely based on tourism, fishing, and timber. The county is home to several tourist attractions, including the Astoria Column, the Columbia River Maritime Museum, and the Lewis and Clark National Historical Park. Fishing is also an important part of the county’s economy, with salmon, crab, and other seafood being harvested from the Columbia River and the Pacific Ocean.
The timber industry is still an important part of the county’s economy, although it has declined in recent years. The county is home to several sawmills and lumber mills, as well as several paper mills.
Demographics
As of the 2010 census, the population of Clatsop County was 37,039. The population is largely white (90.2%), with small percentages of Native American (2.2%), Asian (1.3%), and African American (0.7%) residents. The median household income in the county is $45,845, and the median home value is $219,400.
The largest city in the county is Astoria, which has a population of 9,477. Other cities in the county include Seaside (6,457), Warrenton (5,719), and Gearhart (1,162).
Conclusion
Clatsop County is a diverse and vibrant county located in the northwest corner of Oregon. The county is home to a variety of landscapes, from the rugged coastline to the lush forests of the Coast Range. The economy of the county is largely based on tourism, fishing, and timber, and the population is largely white. Clatsop County is home to several tourist attractions, as well as several state parks and rivers.
Common Questions
What is the Total Population of Clatsop County?
Total Population of Clatsop County is 41,190.
What is the Total Male Population of Clatsop County?
Total Male Population of Clatsop County is 20,435.
What is the Total Female Population of Clatsop County?
Total Female Population of Clatsop County is 20,755.
What is the Ratio of Males per 100 Females in Clatsop County?
There are 98.46 Males per 100 Females in Clatsop County.
What is the Ratio of Females per 100 Males in Clatsop County?
There are 101.57 Females per 100 Males in Clatsop County.
What is the Median Population Age in Clatsop County?
Median Population Age in Clatsop County is 44.9 Years.
What is the Average Family Size in Clatsop County
Average Family Size in Clatsop County is 3.0 People.
What is the Average Household Size in Clatsop County
Average Household Size in Clatsop County is 2.3 People.
What is Per Capita Income in Clatsop County?
Per Capita income in Clatsop County is $37,166.
What is the Median Family Income in Clatsop County?
Median Family Income in Clatsop County is $86,961.
What is the Median Household income in Clatsop County?
Median Household Income in Clatsop County is $68,025.
What is Income or Wage Gap in Clatsop County?
Income or Wage Gap in Clatsop County is 18.5%.
Women in Clatsop County earn 81.5 cents for every dollar earned by a man.
What is Family Income Deficit in Clatsop County?
Family Income Deficit in Clatsop County is $11,998.
Families that are below poverty line in Clatsop County earn $11,998 less on average than the poverty threshold level.
What is Inequality or Gini Index in Clatsop County?
Inequality or Gini Index in Clatsop County is 0.43.
How Large is the Labor Force in Clatsop County?
There are 19,875 People in the Labor Forcein in Clatsop County.
What is the Percentage of People in the Labor Force in Clatsop County?
57.8% of People are in the Labor Force in Clatsop County.
What is the Unemployment Rate in Clatsop County?
Unemployment Rate in Clatsop County is 4.8%.