Clackamas County, OR
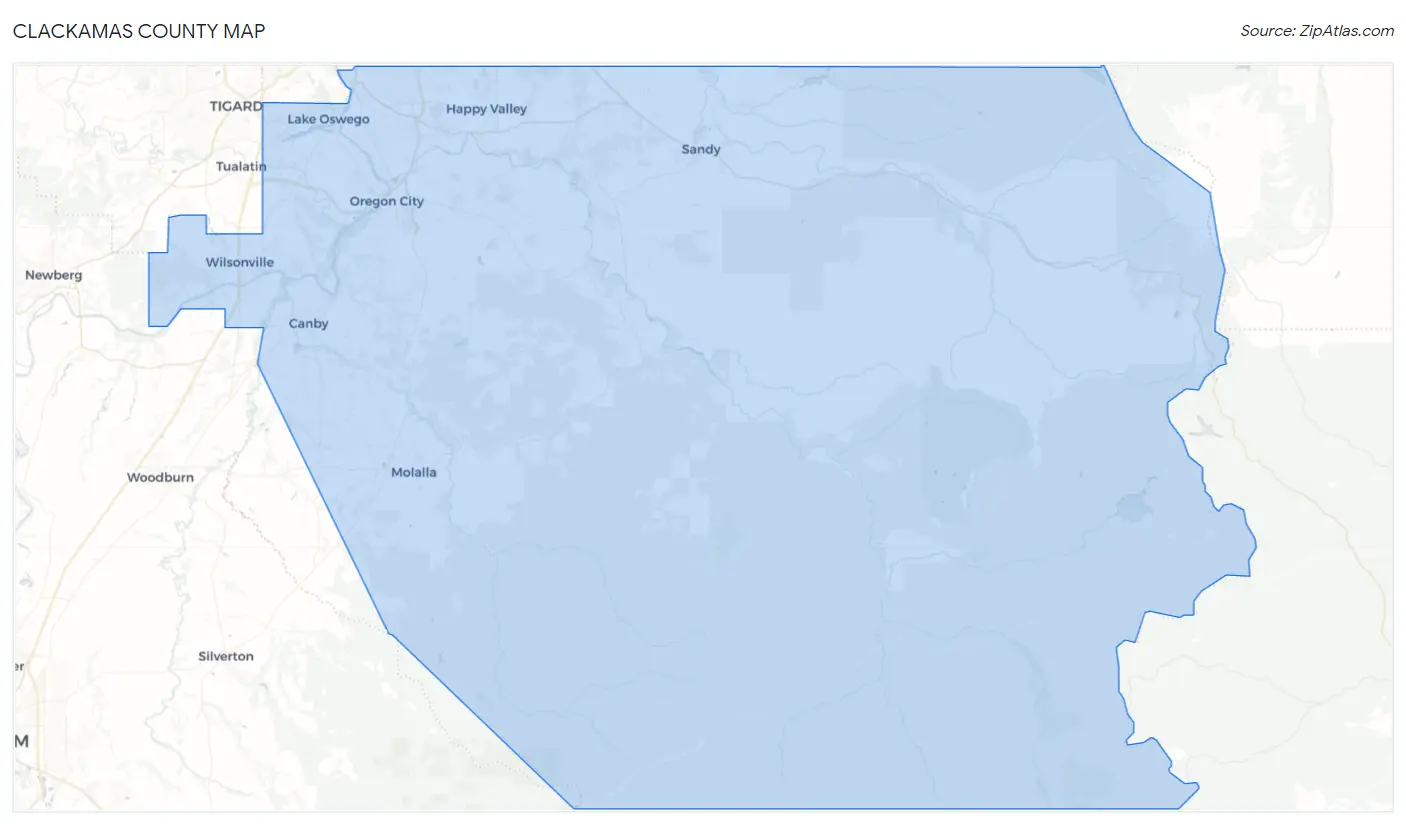
Clackamas County Map
Clackamas County Overview
420,925
TOTAL POPULATION
209,373
MALE POPULATION
211,552
FEMALE POPULATION
98.97
MALES / 100 FEMALES
101.04
FEMALES / 100 MALES
41.9
MEDIAN AGE
3.0
AVG FAMILY SIZE
2.6
AVG HOUSEHOLD SIZE
$49,340
PER CAPITA INCOME
$114,385
AVG FAMILY INCOME
$95,740
AVG HOUSEHOLD INCOME
31.3%
WAGE / INCOME GAP [ % ]
68.7¢/ $1
WAGE / INCOME GAP [ $ ]
$10,474
FAMILY INCOME DEFICIT
0.45
INEQUALITY / GINI INDEX
217,549
LABOR FORCE [ PEOPLE ]
63.4%
PERCENT IN LABOR FORCE
5.0%
UNEMPLOYMENT RATE
Race in Clackamas County
The most populous races in Clackamas County are White / Caucasian (346,783 | 82.4%), Hispanic or Latino (39,282 | 9.3%), and Two or more Races (34,395 | 8.2%).
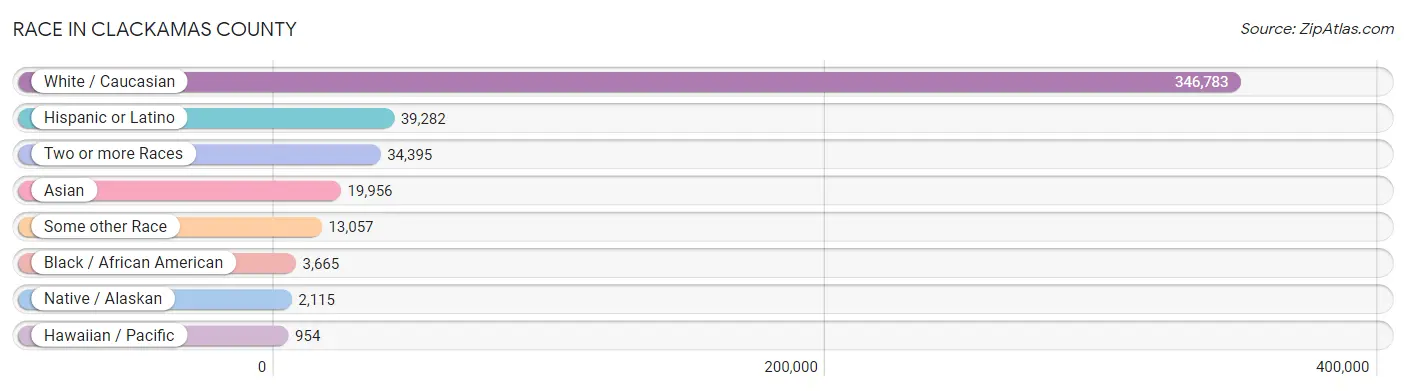
| Race | # Population | % Population |
| Asian | 19,956 | 4.7% |
| Black / African American | 3,665 | 0.9% |
| Hawaiian / Pacific | 954 | 0.2% |
| Hispanic or Latino | 39,282 | 9.3% |
| Native / Alaskan | 2,115 | 0.5% |
| White / Caucasian | 346,783 | 82.4% |
| Two or more Races | 34,395 | 8.2% |
| Some other Race | 13,057 | 3.1% |
| Total | 420,925 | 100.0% |
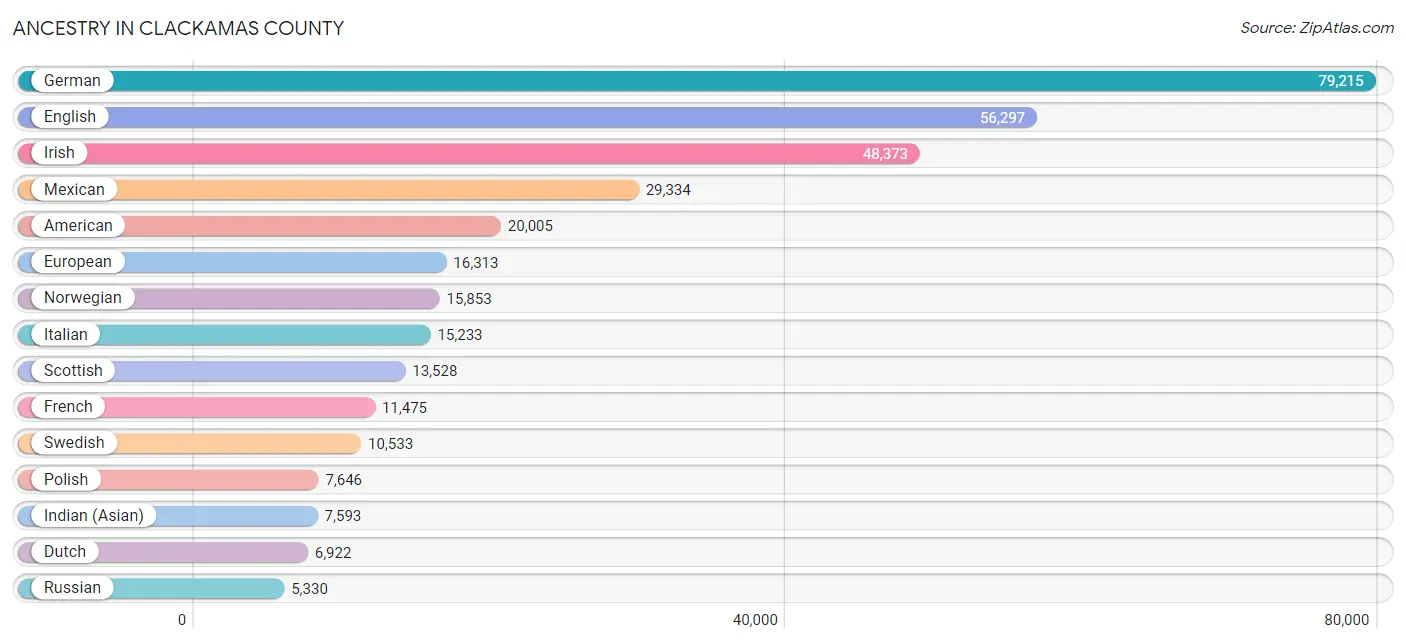
Ancestry in Clackamas County
The most populous ancestries reported in Clackamas County are German (79,215 | 18.8%), English (56,297 | 13.4%), Irish (48,373 | 11.5%), Mexican (29,334 | 7.0%), and American (20,005 | 4.8%), together accounting for 55.4% of all Clackamas County residents.
| Ancestry | # Population | % Population |
| Afghan | 155 | 0.0% |
| African | 191 | 0.1% |
| Alaskan Athabascan | 82 | 0.0% |
| Aleut | 47 | 0.0% |
| Alsatian | 17 | 0.0% |
| American | 20,005 | 4.8% |
| Apache | 330 | 0.1% |
| Arab | 2,154 | 0.5% |
| Argentinean | 66 | 0.0% |
| Armenian | 488 | 0.1% |
| Assyrian / Chaldean / Syriac | 47 | 0.0% |
| Australian | 271 | 0.1% |
| Austrian | 1,129 | 0.3% |
| Bahamian | 18 | 0.0% |
| Bangladeshi | 482 | 0.1% |
| Barbadian | 48 | 0.0% |
| Basque | 110 | 0.0% |
| Belgian | 748 | 0.2% |
| Belizean | 19 | 0.0% |
| Bhutanese | 4,323 | 1.0% |
| Blackfeet | 237 | 0.1% |
| Bolivian | 34 | 0.0% |
| Brazilian | 56 | 0.0% |
| British | 4,297 | 1.0% |
| British West Indian | 63 | 0.0% |
| Bulgarian | 135 | 0.0% |
| Burmese | 3,682 | 0.9% |
| Cajun | 174 | 0.0% |
| Cambodian | 23 | 0.0% |
| Canadian | 1,156 | 0.3% |
| Celtic | 176 | 0.0% |
| Central American | 2,384 | 0.6% |
| Central American Indian | 147 | 0.0% |
| Cherokee | 1,560 | 0.4% |
| Cheyenne | 28 | 0.0% |
| Chickasaw | 53 | 0.0% |
| Chilean | 209 | 0.1% |
| Chinese | 101 | 0.0% |
| Chippewa | 263 | 0.1% |
| Choctaw | 600 | 0.1% |
| Colombian | 587 | 0.1% |
| Colville | 46 | 0.0% |
| Comanche | 9 | 0.0% |
| Costa Rican | 147 | 0.0% |
| Cree | 3 | 0.0% |
| Creek | 75 | 0.0% |
| Croatian | 918 | 0.2% |
| Crow | 21 | 0.0% |
| Cuban | 721 | 0.2% |
| Cypriot | 19 | 0.0% |
| Czech | 2,106 | 0.5% |
| Czechoslovakian | 428 | 0.1% |
| Danish | 3,999 | 0.9% |
| Delaware | 20 | 0.0% |
| Dominican | 130 | 0.0% |
| Dutch | 6,922 | 1.6% |
| Dutch West Indian | 6 | 0.0% |
| Eastern European | 1,795 | 0.4% |
| Ecuadorian | 231 | 0.1% |
| Egyptian | 86 | 0.0% |
| English | 56,297 | 13.4% |
| Estonian | 172 | 0.0% |
| Ethiopian | 456 | 0.1% |
| European | 16,313 | 3.9% |
| Filipino | 442 | 0.1% |
| Finnish | 2,206 | 0.5% |
| French | 11,475 | 2.7% |
| French American Indian | 118 | 0.0% |
| French Canadian | 2,388 | 0.6% |
| German | 79,215 | 18.8% |
| German Russian | 90 | 0.0% |
| Greek | 1,429 | 0.3% |
| Guamanian / Chamorro | 211 | 0.1% |
| Guatemalan | 474 | 0.1% |
| Haitian | 27 | 0.0% |
| Honduran | 441 | 0.1% |
| Hungarian | 1,776 | 0.4% |
| Icelander | 25 | 0.0% |
| Indian (Asian) | 7,593 | 1.8% |
| Indonesian | 192 | 0.1% |
| Inupiat | 94 | 0.0% |
| Iranian | 1,171 | 0.3% |
| Iraqi | 213 | 0.1% |
| Irish | 48,373 | 11.5% |
| Iroquois | 239 | 0.1% |
| Israeli | 46 | 0.0% |
| Italian | 15,233 | 3.6% |
| Jamaican | 148 | 0.0% |
| Japanese | 477 | 0.1% |
| Kenyan | 57 | 0.0% |
| Kiowa | 4 | 0.0% |
| Korean | 4,085 | 1.0% |
| Laotian | 355 | 0.1% |
| Latvian | 154 | 0.0% |
| Lebanese | 664 | 0.2% |
| Lithuanian | 684 | 0.2% |
| Luxembourger | 11 | 0.0% |
| Macedonian | 15 | 0.0% |
| Malaysian | 1,137 | 0.3% |
| Maltese | 71 | 0.0% |
| Marshallese | 96 | 0.0% |
| Menominee | 10 | 0.0% |
| Mexican | 29,334 | 7.0% |
| Mexican American Indian | 554 | 0.1% |
| Mongolian | 51 | 0.0% |
| Moroccan | 240 | 0.1% |
| Native Hawaiian | 1,799 | 0.4% |
| Navajo | 231 | 0.1% |
| Nepalese | 123 | 0.0% |
| New Zealander | 155 | 0.0% |
| Nicaraguan | 292 | 0.1% |
| Nigerian | 221 | 0.1% |
| Northern European | 2,276 | 0.5% |
| Norwegian | 15,853 | 3.8% |
| Okinawan | 2 | 0.0% |
| Osage | 54 | 0.0% |
| Ottawa | 9 | 0.0% |
| Paiute | 7 | 0.0% |
| Pakistani | 668 | 0.2% |
| Palestinian | 82 | 0.0% |
| Panamanian | 207 | 0.1% |
| Pennsylvania German | 103 | 0.0% |
| Peruvian | 567 | 0.1% |
| Polish | 7,646 | 1.8% |
| Portuguese | 1,596 | 0.4% |
| Potawatomi | 14 | 0.0% |
| Pueblo | 26 | 0.0% |
| Puerto Rican | 1,074 | 0.3% |
| Puget Sound Salish | 23 | 0.0% |
| Romanian | 1,996 | 0.5% |
| Russian | 5,330 | 1.3% |
| Salvadoran | 780 | 0.2% |
| Samoan | 40 | 0.0% |
| Scandinavian | 4,353 | 1.0% |
| Scotch-Irish | 3,823 | 0.9% |
| Scottish | 13,528 | 3.2% |
| Seminole | 29 | 0.0% |
| Serbian | 163 | 0.0% |
| Shoshone | 16 | 0.0% |
| Sierra Leonean | 18 | 0.0% |
| Sioux | 327 | 0.1% |
| Slavic | 444 | 0.1% |
| Slovak | 372 | 0.1% |
| Slovene | 222 | 0.1% |
| Somali | 8 | 0.0% |
| South African | 222 | 0.1% |
| South American | 1,871 | 0.4% |
| South American Indian | 28 | 0.0% |
| Soviet Union | 64 | 0.0% |
| Spaniard | 910 | 0.2% |
| Spanish | 1,377 | 0.3% |
| Sri Lankan | 3,837 | 0.9% |
| Subsaharan African | 1,299 | 0.3% |
| Sudanese | 68 | 0.0% |
| Swedish | 10,533 | 2.5% |
| Swiss | 3,445 | 0.8% |
| Syrian | 379 | 0.1% |
| Thai | 2,813 | 0.7% |
| Tlingit-Haida | 117 | 0.0% |
| Tohono O'Odham | 24 | 0.0% |
| Trinidadian and Tobagonian | 50 | 0.0% |
| Turkish | 98 | 0.0% |
| Ukrainian | 4,720 | 1.1% |
| Uruguayan | 54 | 0.0% |
| Ute | 88 | 0.0% |
| Venezuelan | 107 | 0.0% |
| Welsh | 4,177 | 1.0% |
| West Indian | 4 | 0.0% |
| Yakama | 123 | 0.0% |
| Yaqui | 77 | 0.0% |
| Yugoslavian | 184 | 0.0% |
| Yup'ik | 1 | 0.0% |
| Zimbabwean | 24 | 0.0% | View All 173 Rows |
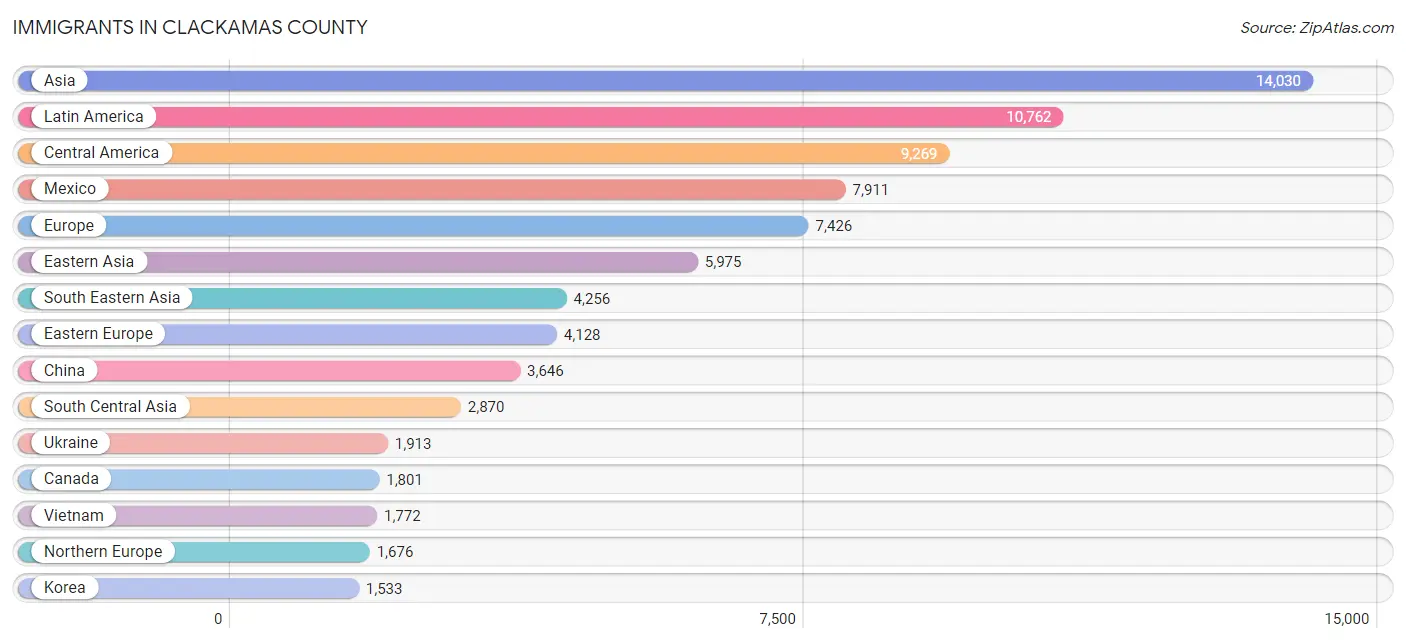
Immigrants in Clackamas County
The most numerous immigrant groups reported in Clackamas County came from Asia (14,030 | 3.3%), Latin America (10,762 | 2.6%), Central America (9,269 | 2.2%), Mexico (7,911 | 1.9%), and Europe (7,426 | 1.8%), together accounting for 11.7% of all Clackamas County residents.
| Immigration Origin | # Population | % Population |
| Afghanistan | 80 | 0.0% |
| Africa | 1,296 | 0.3% |
| Argentina | 69 | 0.0% |
| Armenia | 33 | 0.0% |
| Asia | 14,030 | 3.3% |
| Australia | 122 | 0.0% |
| Austria | 9 | 0.0% |
| Bahamas | 18 | 0.0% |
| Barbados | 25 | 0.0% |
| Belarus | 56 | 0.0% |
| Belgium | 97 | 0.0% |
| Belize | 22 | 0.0% |
| Bolivia | 26 | 0.0% |
| Bosnia and Herzegovina | 18 | 0.0% |
| Brazil | 92 | 0.0% |
| Bulgaria | 84 | 0.0% |
| Cambodia | 211 | 0.1% |
| Canada | 1,801 | 0.4% |
| Caribbean | 372 | 0.1% |
| Central America | 9,269 | 2.2% |
| Chile | 69 | 0.0% |
| China | 3,646 | 0.9% |
| Colombia | 326 | 0.1% |
| Croatia | 89 | 0.0% |
| Cuba | 137 | 0.0% |
| Czechoslovakia | 233 | 0.1% |
| Denmark | 96 | 0.0% |
| Dominican Republic | 61 | 0.0% |
| Eastern Africa | 482 | 0.1% |
| Eastern Asia | 5,975 | 1.4% |
| Eastern Europe | 4,128 | 1.0% |
| Ecuador | 77 | 0.0% |
| Egypt | 26 | 0.0% |
| El Salvador | 449 | 0.1% |
| England | 551 | 0.1% |
| Eritrea | 5 | 0.0% |
| Ethiopia | 316 | 0.1% |
| Europe | 7,426 | 1.8% |
| Fiji | 179 | 0.0% |
| France | 107 | 0.0% |
| Germany | 982 | 0.2% |
| Greece | 36 | 0.0% |
| Grenada | 20 | 0.0% |
| Guatemala | 403 | 0.1% |
| Haiti | 14 | 0.0% |
| Honduras | 330 | 0.1% |
| Hong Kong | 540 | 0.1% |
| Hungary | 119 | 0.0% |
| India | 1,307 | 0.3% |
| Indonesia | 100 | 0.0% |
| Iran | 677 | 0.2% |
| Iraq | 413 | 0.1% |
| Ireland | 12 | 0.0% |
| Israel | 61 | 0.0% |
| Italy | 88 | 0.0% |
| Jamaica | 52 | 0.0% |
| Japan | 796 | 0.2% |
| Jordan | 82 | 0.0% |
| Kazakhstan | 216 | 0.1% |
| Kenya | 108 | 0.0% |
| Korea | 1,533 | 0.4% |
| Kuwait | 13 | 0.0% |
| Laos | 547 | 0.1% |
| Latin America | 10,762 | 2.6% |
| Lebanon | 110 | 0.0% |
| Lithuania | 19 | 0.0% |
| Mexico | 7,911 | 1.9% |
| Micronesia | 100 | 0.0% |
| Moldova | 139 | 0.0% |
| Morocco | 256 | 0.1% |
| Nepal | 289 | 0.1% |
| Netherlands | 188 | 0.0% |
| Nicaragua | 97 | 0.0% |
| Nigeria | 15 | 0.0% |
| Northern Africa | 368 | 0.1% |
| Northern Europe | 1,676 | 0.4% |
| Norway | 29 | 0.0% |
| Oceania | 480 | 0.1% |
| Pakistan | 43 | 0.0% |
| Panama | 57 | 0.0% |
| Peru | 367 | 0.1% |
| Philippines | 1,281 | 0.3% |
| Poland | 35 | 0.0% |
| Portugal | 35 | 0.0% |
| Romania | 699 | 0.2% |
| Russia | 512 | 0.1% |
| Saudi Arabia | 54 | 0.0% |
| Scotland | 141 | 0.0% |
| Serbia | 22 | 0.0% |
| Singapore | 66 | 0.0% |
| Somalia | 8 | 0.0% |
| South Africa | 401 | 0.1% |
| South America | 1,121 | 0.3% |
| South Central Asia | 2,870 | 0.7% |
| South Eastern Asia | 4,256 | 1.0% |
| Southern Europe | 187 | 0.0% |
| Spain | 28 | 0.0% |
| Sri Lanka | 21 | 0.0% |
| Sweden | 40 | 0.0% |
| Switzerland | 52 | 0.0% |
| Syria | 86 | 0.0% |
| Taiwan | 626 | 0.2% |
| Thailand | 267 | 0.1% |
| Trinidad and Tobago | 18 | 0.0% |
| Turkey | 19 | 0.0% |
| Ukraine | 1,913 | 0.4% |
| Uzbekistan | 97 | 0.0% |
| Venezuela | 95 | 0.0% |
| Vietnam | 1,772 | 0.4% |
| West Indies | 27 | 0.0% |
| Western Africa | 29 | 0.0% |
| Western Asia | 929 | 0.2% |
| Western Europe | 1,435 | 0.3% |
| Zimbabwe | 33 | 0.0% | View All 114 Rows |
Sex and Age in Clackamas County
Sex and Age in Clackamas County
The most populous age groups in Clackamas County are 40 to 44 Years (15,140 | 7.2%) for men and 60 to 64 Years (15,055 | 7.1%) for women.
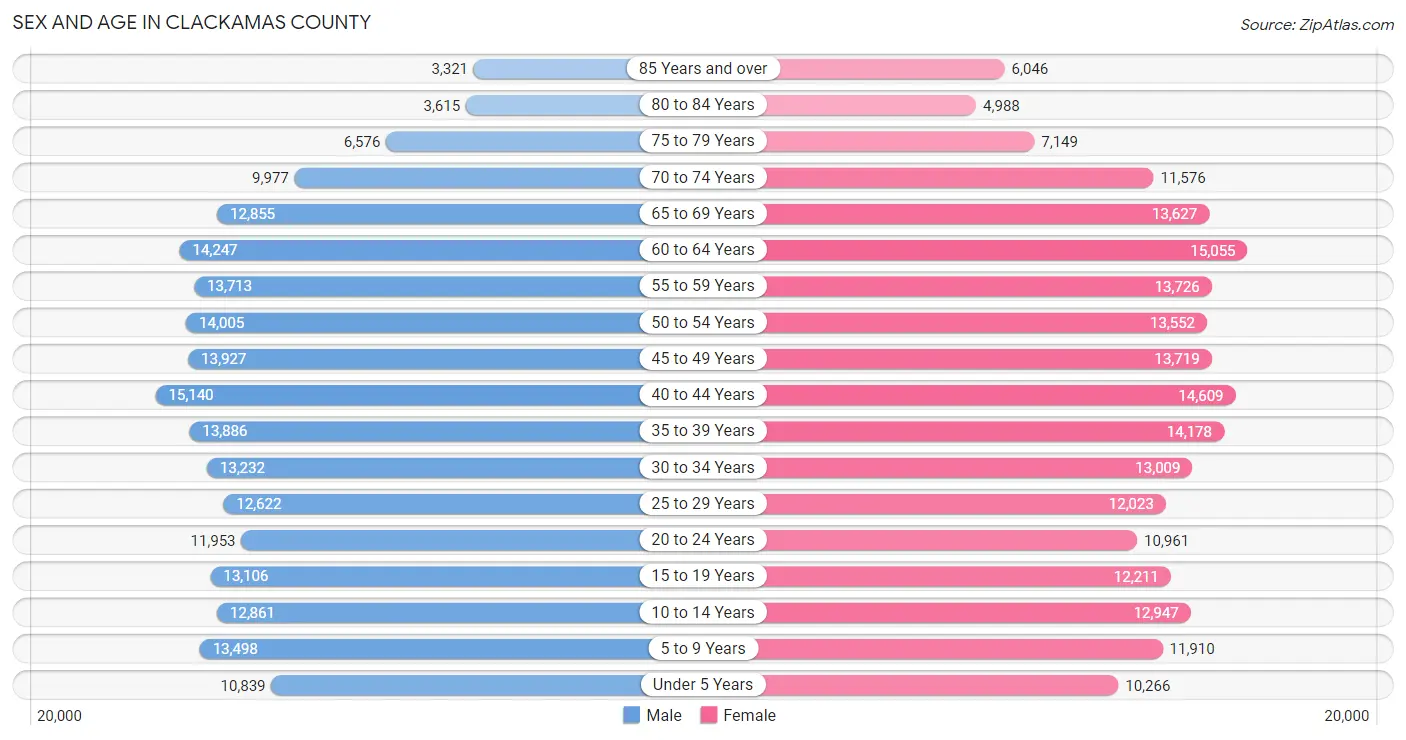
| Age Bracket | Male | Female |
| Under 5 Years | 10,839 (5.2%) | 10,266 (4.9%) |
| 5 to 9 Years | 13,498 (6.5%) | 11,910 (5.6%) |
| 10 to 14 Years | 12,861 (6.1%) | 12,947 (6.1%) |
| 15 to 19 Years | 13,106 (6.3%) | 12,211 (5.8%) |
| 20 to 24 Years | 11,953 (5.7%) | 10,961 (5.2%) |
| 25 to 29 Years | 12,622 (6.0%) | 12,023 (5.7%) |
| 30 to 34 Years | 13,232 (6.3%) | 13,009 (6.1%) |
| 35 to 39 Years | 13,886 (6.6%) | 14,178 (6.7%) |
| 40 to 44 Years | 15,140 (7.2%) | 14,609 (6.9%) |
| 45 to 49 Years | 13,927 (6.7%) | 13,719 (6.5%) |
| 50 to 54 Years | 14,005 (6.7%) | 13,552 (6.4%) |
| 55 to 59 Years | 13,713 (6.6%) | 13,726 (6.5%) |
| 60 to 64 Years | 14,247 (6.8%) | 15,055 (7.1%) |
| 65 to 69 Years | 12,855 (6.1%) | 13,627 (6.4%) |
| 70 to 74 Years | 9,977 (4.8%) | 11,576 (5.5%) |
| 75 to 79 Years | 6,576 (3.1%) | 7,149 (3.4%) |
| 80 to 84 Years | 3,615 (1.7%) | 4,988 (2.4%) |
| 85 Years and over | 3,321 (1.6%) | 6,046 (2.9%) |
| Total | 209,373 (100.0%) | 211,552 (100.0%) |
Families and Households in Clackamas County
Median Family Size in Clackamas County
The median family size in Clackamas County is 3.05 persons per family, with married-couple families (89,759 | 80.4%) accounting for the largest median family size of 3.12 persons per family. On the other hand, single male/father families (7,105 | 6.4%) represent the smallest median family size with 2.63 persons per family.
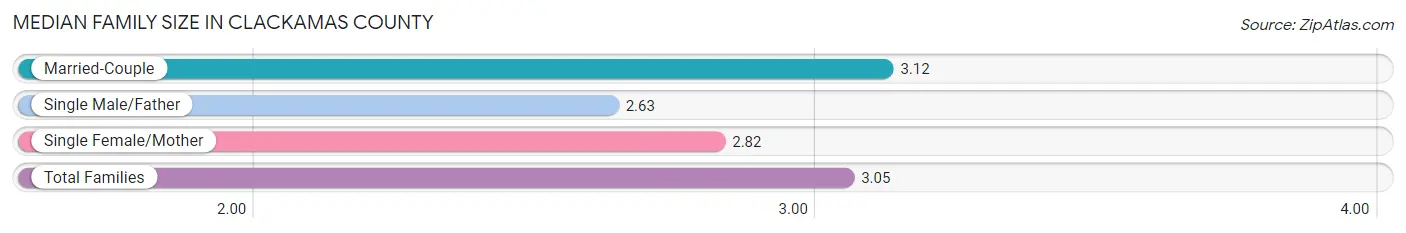
| Family Type | # Families | Family Size |
| Married-Couple | 89,759 (80.4%) | 3.12 |
| Single Male/Father | 7,105 (6.4%) | 2.63 |
| Single Female/Mother | 14,711 (13.2%) | 2.82 |
| Total Families | 111,575 (100.0%) | 3.05 |
Median Household Size in Clackamas County
The median household size in Clackamas County is 2.59 persons per household, with married-couple households (89,759 | 55.8%) accounting for the largest median household size of 3.17 persons per household. non-family households (49,409 | 30.7%) represent the smallest median household size with 1.32 persons per household.
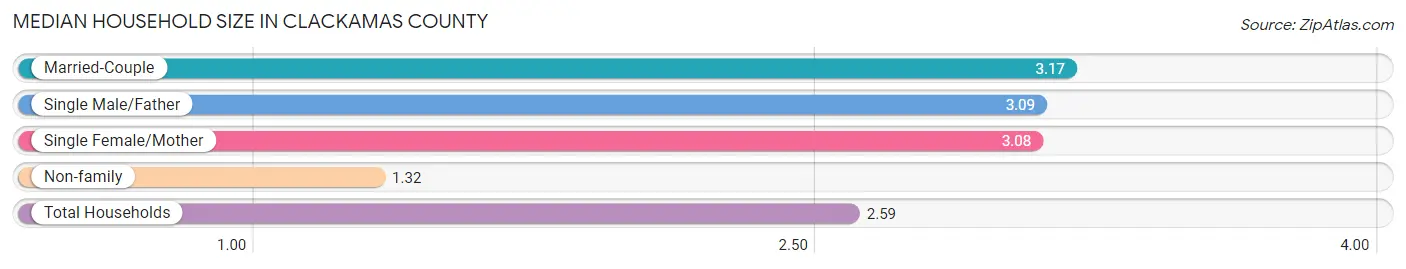
| Household Type | # Households | Household Size |
| Married-Couple | 89,759 (55.8%) | 3.17 |
| Single Male/Father | 7,105 (4.4%) | 3.09 |
| Single Female/Mother | 14,711 (9.1%) | 3.08 |
| Non-family | 49,409 (30.7%) | 1.32 |
| Total Households | 160,984 (100.0%) | 2.59 |
Household Size by Marriage Status in Clackamas County
Out of a total of 160,984 households in Clackamas County, 111,575 (69.3%) are family households, while 49,409 (30.7%) are nonfamily households. The most numerous type of family households are 2-person households, comprising 50,622, and the most common type of nonfamily households are 1-person households, comprising 37,417.
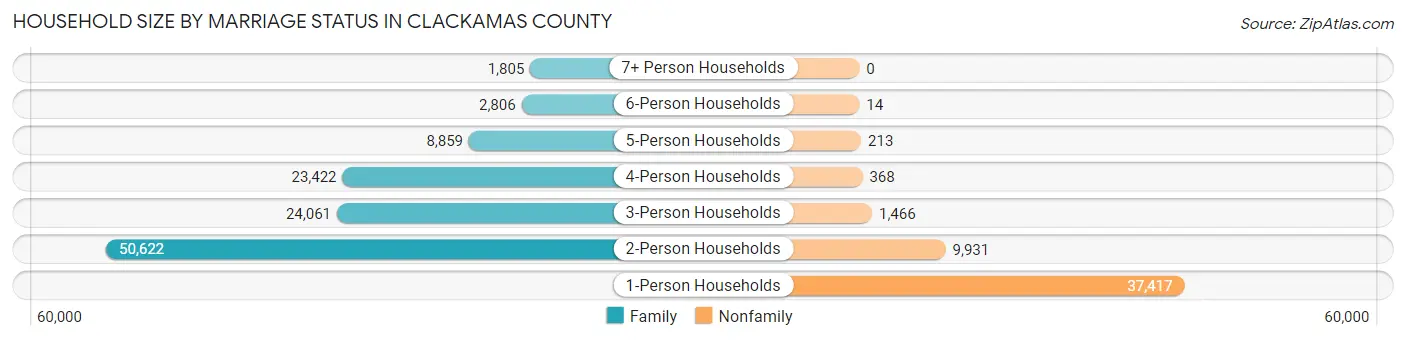
| Household Size | Family Households | Nonfamily Households |
| 1-Person Households | - | 37,417 (23.2%) |
| 2-Person Households | 50,622 (31.5%) | 9,931 (6.2%) |
| 3-Person Households | 24,061 (14.9%) | 1,466 (0.9%) |
| 4-Person Households | 23,422 (14.5%) | 368 (0.2%) |
| 5-Person Households | 8,859 (5.5%) | 213 (0.1%) |
| 6-Person Households | 2,806 (1.7%) | 14 (0.0%) |
| 7+ Person Households | 1,805 (1.1%) | 0 (0.0%) |
| Total | 111,575 (69.3%) | 49,409 (30.7%) |
Female Fertility in Clackamas County
Fertility by Age in Clackamas County
Average fertility rate in Clackamas County is 56.0 births per 1,000 women. Women in the age bracket of 20 to 34 years have the highest fertility rate with 86.0 births per 1,000 women. Women in the age bracket of 20 to 34 years acount for 59.6% of all women with births.
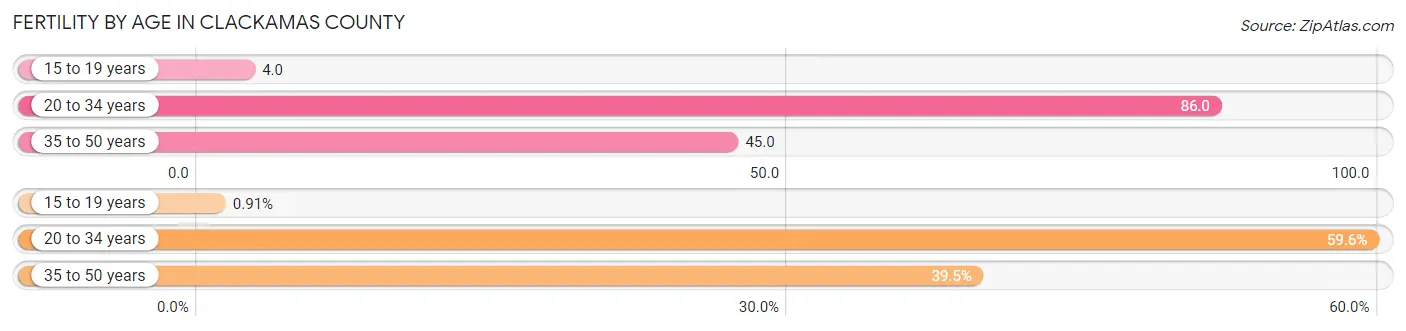
| Age Bracket | Women with Births | Births / 1,000 Women |
| 15 to 19 years | 47 (0.9%) | 4.0 |
| 20 to 34 years | 3,089 (59.6%) | 86.0 |
| 35 to 50 years | 2,046 (39.5%) | 45.0 |
| Total | 5,182 (100.0%) | 56.0 |
Fertility by Age by Marriage Status in Clackamas County
85.5% of women with births (5,182) in Clackamas County are married. The highest percentage of unmarried women with births falls into 15 to 19 years age bracket with 100.0% of them unmarried at the time of birth, while the lowest percentage of unmarried women with births belong to 35 to 50 years age bracket with 9.3% of them unmarried.
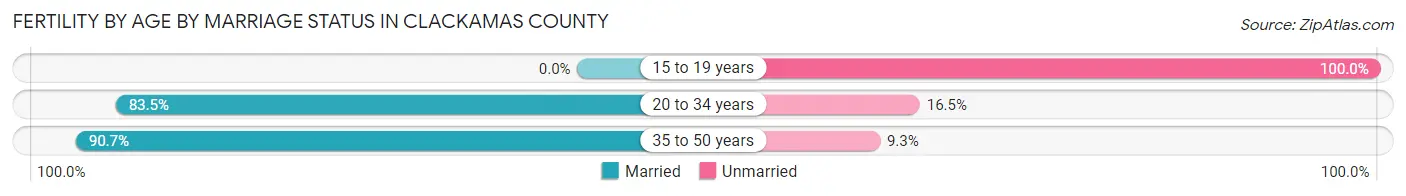
| Age Bracket | Married | Unmarried |
| 15 to 19 years | 0 (0.0%) | 47 (100.0%) |
| 20 to 34 years | 2,579 (83.5%) | 510 (16.5%) |
| 35 to 50 years | 1,856 (90.7%) | 190 (9.3%) |
| Total | 4,431 (85.5%) | 751 (14.5%) |
Fertility by Education in Clackamas County
Average fertility rate in Clackamas County is 56.0 births per 1,000 women. Women with the education attainment of graduate degree have the highest fertility rate of 83.0 births per 1,000 women, while women with the education attainment of less than high school have the lowest fertility at 33.0 births per 1,000 women. Women with the education attainment of college or associate's degree represent 28.5% of all women with births.
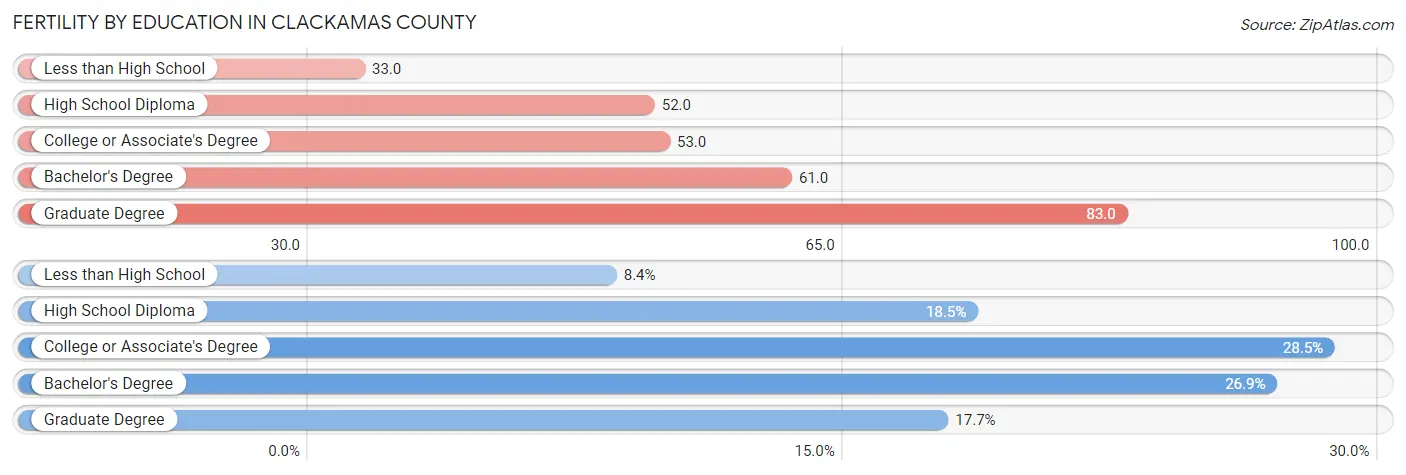
| Educational Attainment | Women with Births | Births / 1,000 Women |
| Less than High School | 433 (8.4%) | 33.0 |
| High School Diploma | 959 (18.5%) | 52.0 |
| College or Associate's Degree | 1,479 (28.5%) | 53.0 |
| Bachelor's Degree | 1,395 (26.9%) | 61.0 |
| Graduate Degree | 916 (17.7%) | 83.0 |
| Total | 5,182 (100.0%) | 56.0 |
Fertility by Education by Marriage Status in Clackamas County
14.5% of women with births in Clackamas County are unmarried. Women with the educational attainment of graduate degree are most likely to be married with 100.0% of them married at childbirth, while women with the educational attainment of high school diploma are least likely to be married with 29.7% of them unmarried at childbirth.
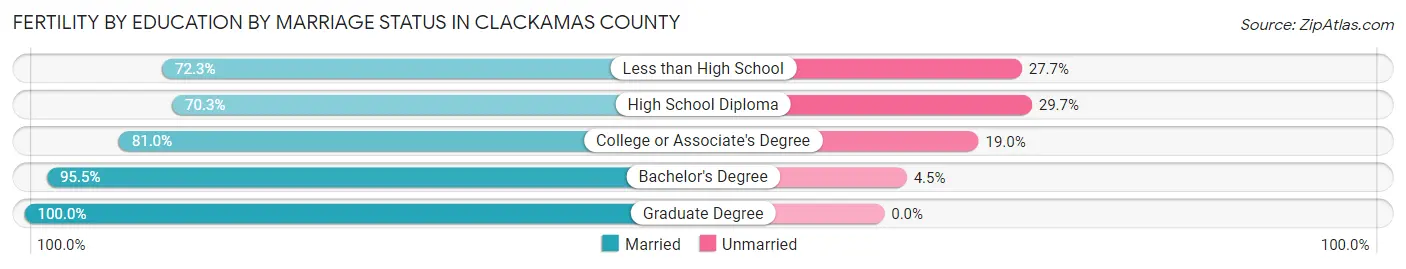
| Educational Attainment | Married | Unmarried |
| Less than High School | 313 (72.3%) | 120 (27.7%) |
| High School Diploma | 674 (70.3%) | 285 (29.7%) |
| College or Associate's Degree | 1,198 (81.0%) | 281 (19.0%) |
| Bachelor's Degree | 1,332 (95.5%) | 63 (4.5%) |
| Graduate Degree | 916 (100.0%) | 0 (0.0%) |
| Total | 4,431 (85.5%) | 751 (14.5%) |
Income in Clackamas County
Income Overview in Clackamas County
Per Capita Income in Clackamas County is $49,340, while median incomes of families and households are $114,385 and $95,740 respectively.
| Characteristic | Number | Measure |
| Per Capita Income | 420,925 | $49,340 |
| Median Family Income | 111,575 | $114,385 |
| Mean Family Income | 111,575 | $146,311 |
| Median Household Income | 160,984 | $95,740 |
| Mean Household Income | 160,984 | $126,719 |
| Income Deficit | 111,575 | $10,474 |
| Wage / Income Gap (%) | 420,925 | 31.29% |
| Wage / Income Gap ($) | 420,925 | 68.71¢ per $1 |
| Gini / Inequality Index | 420,925 | 0.45 |
Earnings by Sex in Clackamas County
Average Earnings in Clackamas County are $48,285, $58,289 for men and $40,049 for women, a difference of 31.3%.
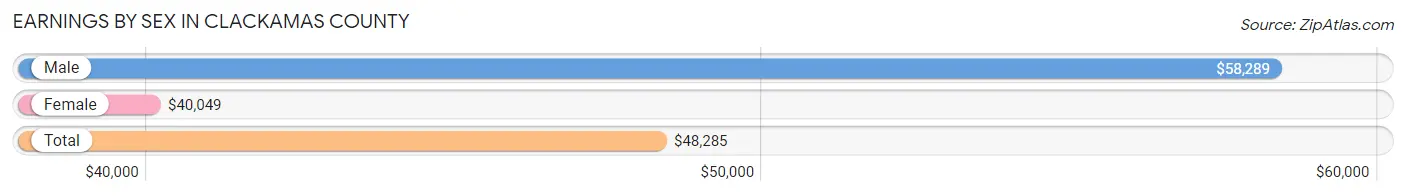
| Sex | Number | Average Earnings |
| Male | 121,833 (53.5%) | $58,289 |
| Female | 105,918 (46.5%) | $40,049 |
| Total | 227,751 (100.0%) | $48,285 |
Earnings by Sex by Income Bracket in Clackamas County
The most common earnings brackets in Clackamas County are $100,000+ for men (32,595 | 26.8%) and $100,000+ for women (13,414 | 12.7%).
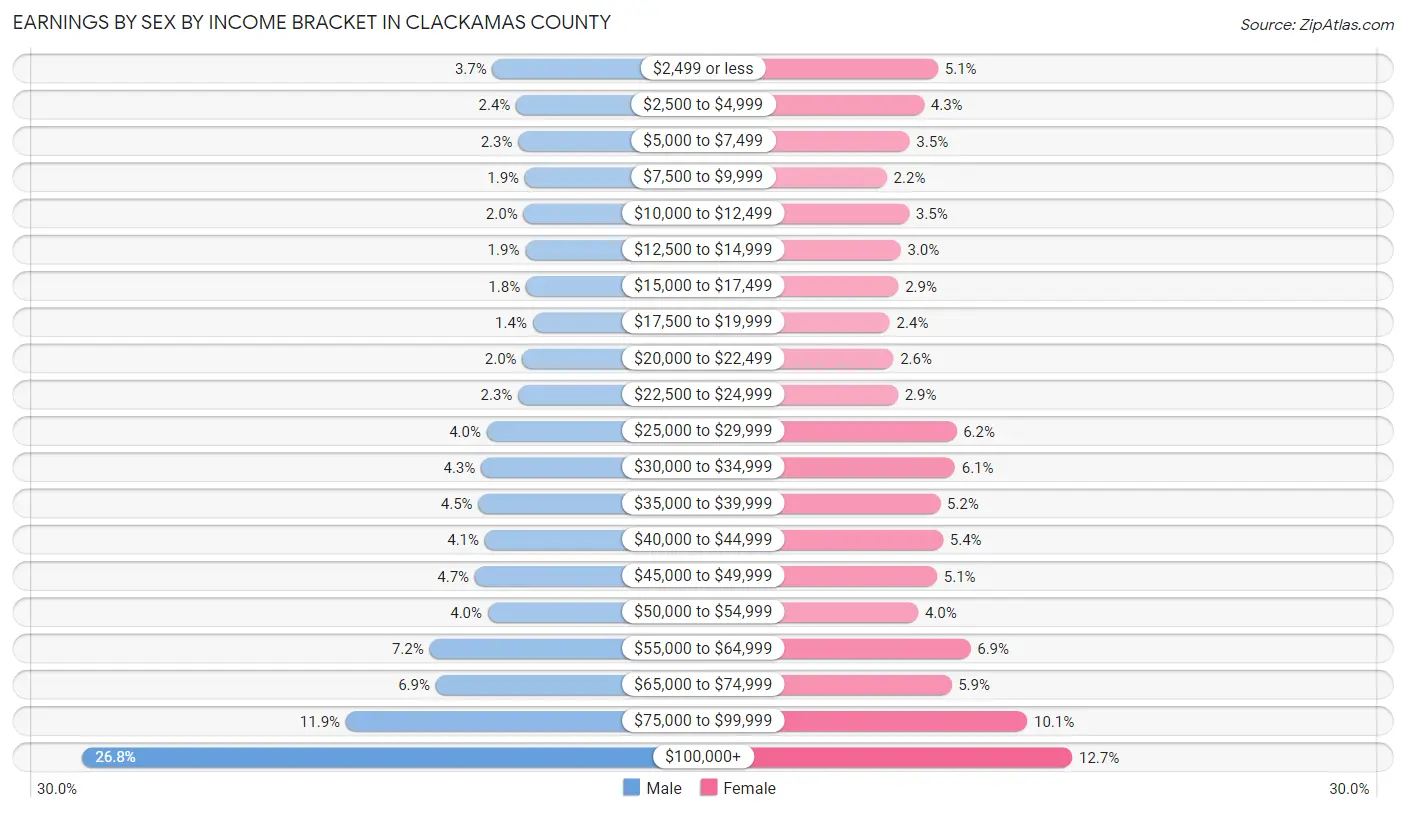
| Income | Male | Female |
| $2,499 or less | 4,506 (3.7%) | 5,425 (5.1%) |
| $2,500 to $4,999 | 2,882 (2.4%) | 4,586 (4.3%) |
| $5,000 to $7,499 | 2,740 (2.2%) | 3,726 (3.5%) |
| $7,500 to $9,999 | 2,288 (1.9%) | 2,370 (2.2%) |
| $10,000 to $12,499 | 2,390 (2.0%) | 3,699 (3.5%) |
| $12,500 to $14,999 | 2,265 (1.9%) | 3,194 (3.0%) |
| $15,000 to $17,499 | 2,217 (1.8%) | 3,060 (2.9%) |
| $17,500 to $19,999 | 1,752 (1.4%) | 2,555 (2.4%) |
| $20,000 to $22,499 | 2,456 (2.0%) | 2,766 (2.6%) |
| $22,500 to $24,999 | 2,756 (2.3%) | 3,030 (2.9%) |
| $25,000 to $29,999 | 4,899 (4.0%) | 6,509 (6.1%) |
| $30,000 to $34,999 | 5,282 (4.3%) | 6,433 (6.1%) |
| $35,000 to $39,999 | 5,474 (4.5%) | 5,549 (5.2%) |
| $40,000 to $44,999 | 5,035 (4.1%) | 5,715 (5.4%) |
| $45,000 to $49,999 | 5,713 (4.7%) | 5,357 (5.1%) |
| $50,000 to $54,999 | 4,822 (4.0%) | 4,234 (4.0%) |
| $55,000 to $64,999 | 8,819 (7.2%) | 7,347 (6.9%) |
| $65,000 to $74,999 | 8,391 (6.9%) | 6,216 (5.9%) |
| $75,000 to $99,999 | 14,551 (11.9%) | 10,733 (10.1%) |
| $100,000+ | 32,595 (26.8%) | 13,414 (12.7%) |
| Total | 121,833 (100.0%) | 105,918 (100.0%) |
Earnings by Sex by Educational Attainment in Clackamas County
Average earnings in Clackamas County are $66,638 for men and $45,434 for women, a difference of 31.8%. Men with an educational attainment of graduate degree enjoy the highest average annual earnings of $115,236, while those with less than high school education earn the least with $39,363. Women with an educational attainment of graduate degree earn the most with the average annual earnings of $76,409, while those with less than high school education have the smallest earnings of $26,006.
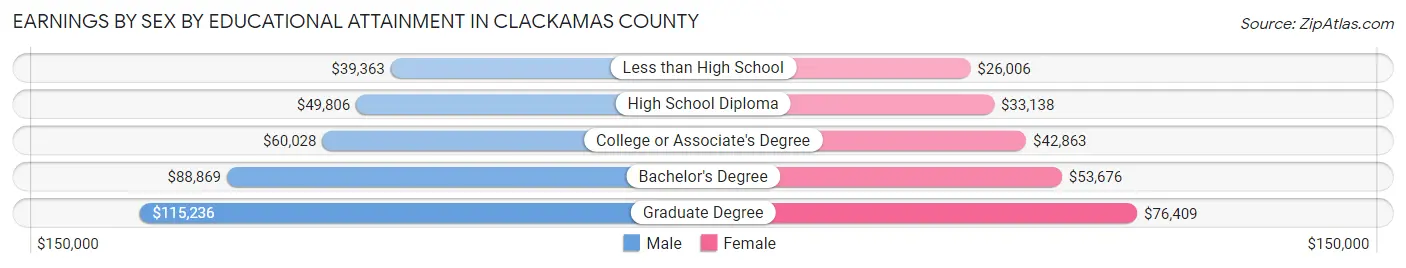
| Educational Attainment | Male Income | Female Income |
| Less than High School | $39,363 | $26,006 |
| High School Diploma | $49,806 | $33,138 |
| College or Associate's Degree | $60,028 | $42,863 |
| Bachelor's Degree | $88,869 | $53,676 |
| Graduate Degree | $115,236 | $76,409 |
| Total | $66,638 | $45,434 |
Family Income in Clackamas County
Family Income Brackets in Clackamas County
According to the Clackamas County family income data, there are 26,109 families falling into the $100,000 to $149,999 income range, which is the most common income bracket and makes up 23.4% of all families. Conversely, the $10,000 to $14,999 income bracket is the least frequent group with only 1,339 families (1.2%) belonging to this category.
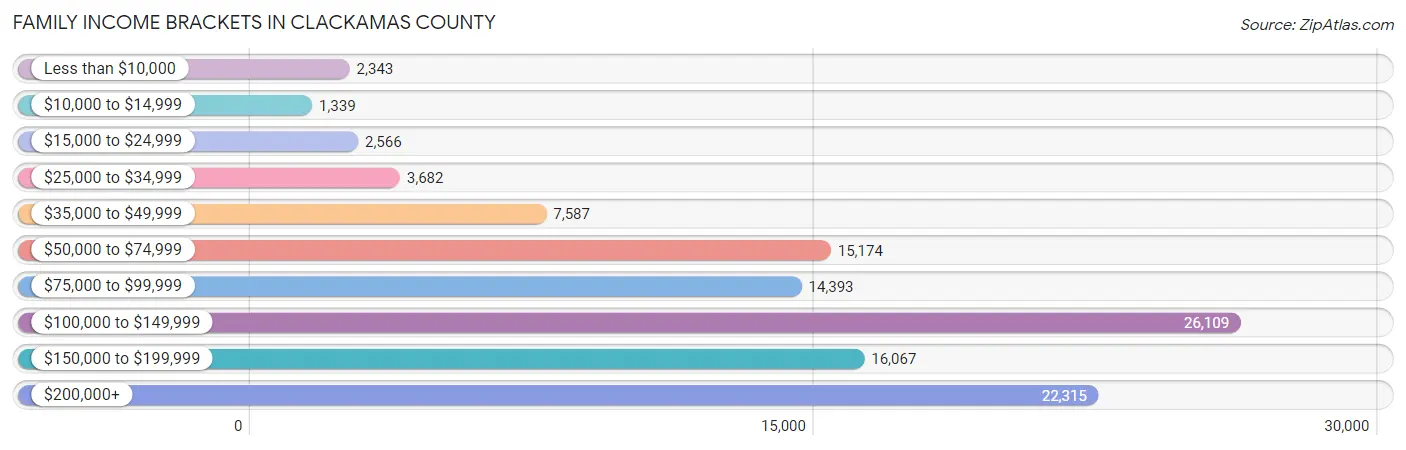
| Income Bracket | # Families | % Families |
| Less than $10,000 | 2,343 | 2.1% |
| $10,000 to $14,999 | 1,339 | 1.2% |
| $15,000 to $24,999 | 2,566 | 2.3% |
| $25,000 to $34,999 | 3,682 | 3.3% |
| $35,000 to $49,999 | 7,587 | 6.8% |
| $50,000 to $74,999 | 15,174 | 13.6% |
| $75,000 to $99,999 | 14,393 | 12.9% |
| $100,000 to $149,999 | 26,109 | 23.4% |
| $150,000 to $199,999 | 16,067 | 14.4% |
| $200,000+ | 22,315 | 20.0% |
Family Income by Famaliy Size in Clackamas County
6-person families (2,211 | 2.0%) account for the highest median family income in Clackamas County with $159,962 per family, while 2-person families (54,276 | 48.6%) have the highest median income of $47,066 per family member.
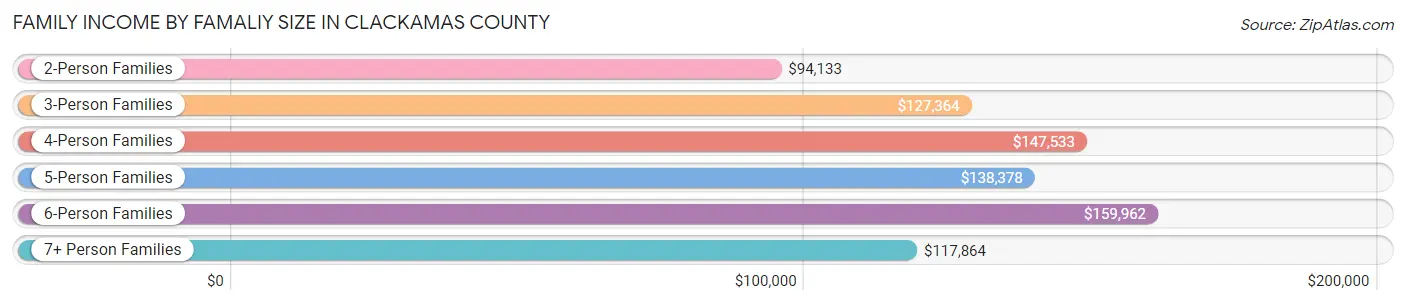
| Income Bracket | # Families | Median Income |
| 2-Person Families | 54,276 (48.6%) | $94,133 |
| 3-Person Families | 23,723 (21.3%) | $127,364 |
| 4-Person Families | 21,857 (19.6%) | $147,533 |
| 5-Person Families | 7,923 (7.1%) | $138,378 |
| 6-Person Families | 2,211 (2.0%) | $159,962 |
| 7+ Person Families | 1,585 (1.4%) | $117,864 |
| Total | 111,575 (100.0%) | $114,385 |
Family Income by Number of Earners in Clackamas County
The median family income in Clackamas County is $114,385, with families comprising 3+ earners (12,696) having the highest median family income of $165,814, while families with no earners (17,844) have the lowest median family income of $67,722, accounting for 11.4% and 16.0% of families, respectively.
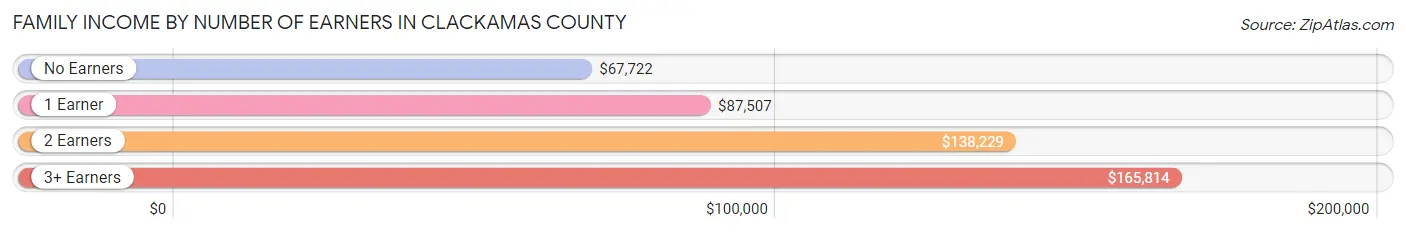
| Number of Earners | # Families | Median Income |
| No Earners | 17,844 (16.0%) | $67,722 |
| 1 Earner | 33,061 (29.6%) | $87,507 |
| 2 Earners | 47,974 (43.0%) | $138,229 |
| 3+ Earners | 12,696 (11.4%) | $165,814 |
| Total | 111,575 (100.0%) | $114,385 |
Household Income in Clackamas County
Household Income Brackets in Clackamas County
With 32,358 households falling in the category, the $100,000 to $149,999 income range is the most frequent in Clackamas County, accounting for 20.1% of all households. In contrast, only 3,542 households (2.2%) fall into the $10,000 to $14,999 income bracket, making it the least populous group.
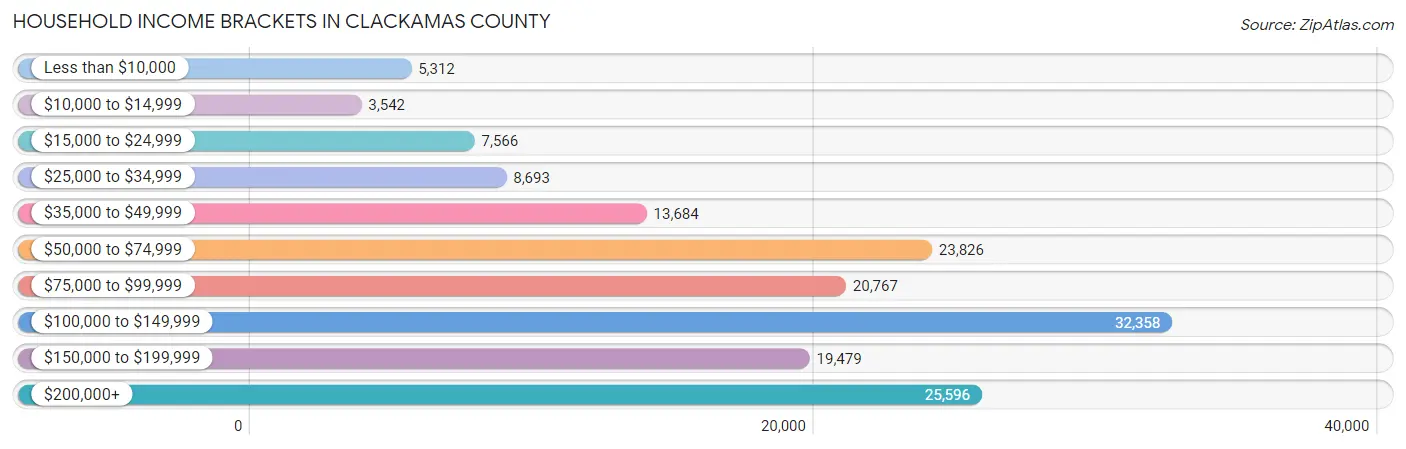
| Income Bracket | # Households | % Households |
| Less than $10,000 | 5,312 | 3.3% |
| $10,000 to $14,999 | 3,542 | 2.2% |
| $15,000 to $24,999 | 7,566 | 4.7% |
| $25,000 to $34,999 | 8,693 | 5.4% |
| $35,000 to $49,999 | 13,684 | 8.5% |
| $50,000 to $74,999 | 23,826 | 14.8% |
| $75,000 to $99,999 | 20,767 | 12.9% |
| $100,000 to $149,999 | 32,358 | 20.1% |
| $150,000 to $199,999 | 19,479 | 12.1% |
| $200,000+ | 25,596 | 15.9% |
Household Income by Householder Age in Clackamas County
The median household income in Clackamas County is $95,740, with the highest median household income of $116,104 found in the 45 to 64 years age bracket for the primary householder. A total of 60,136 households (37.4%) fall into this category. Meanwhile, the 15 to 24 years age bracket for the primary householder has the lowest median household income of $53,544, with 3,456 households (2.1%) in this group.
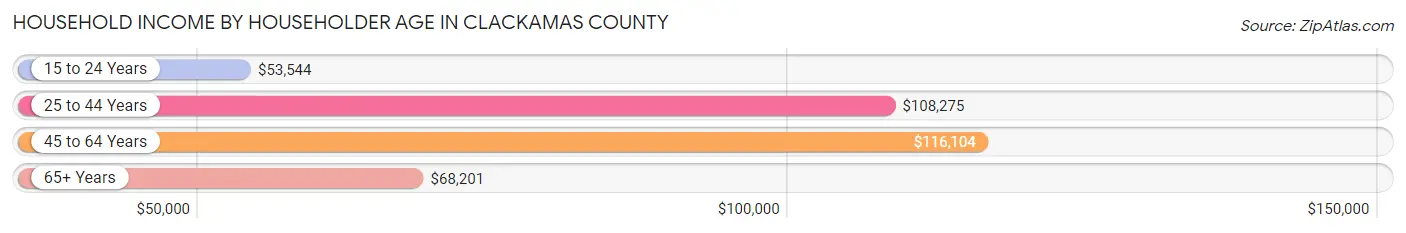
| Income Bracket | # Households | Median Income |
| 15 to 24 Years | 3,456 (2.1%) | $53,544 |
| 25 to 44 Years | 49,263 (30.6%) | $108,275 |
| 45 to 64 Years | 60,136 (37.4%) | $116,104 |
| 65+ Years | 48,129 (29.9%) | $68,201 |
| Total | 160,984 (100.0%) | $95,740 |
Poverty in Clackamas County
Income Below Poverty by Sex and Age in Clackamas County
With 6.7% poverty level for males and 8.5% for females among the residents of Clackamas County, 18 to 24 year old males and 75 year old and over females are the most vulnerable to poverty, with 1,726 males (10.4%) and 2,386 females (13.5%) in their respective age groups living below the poverty level.
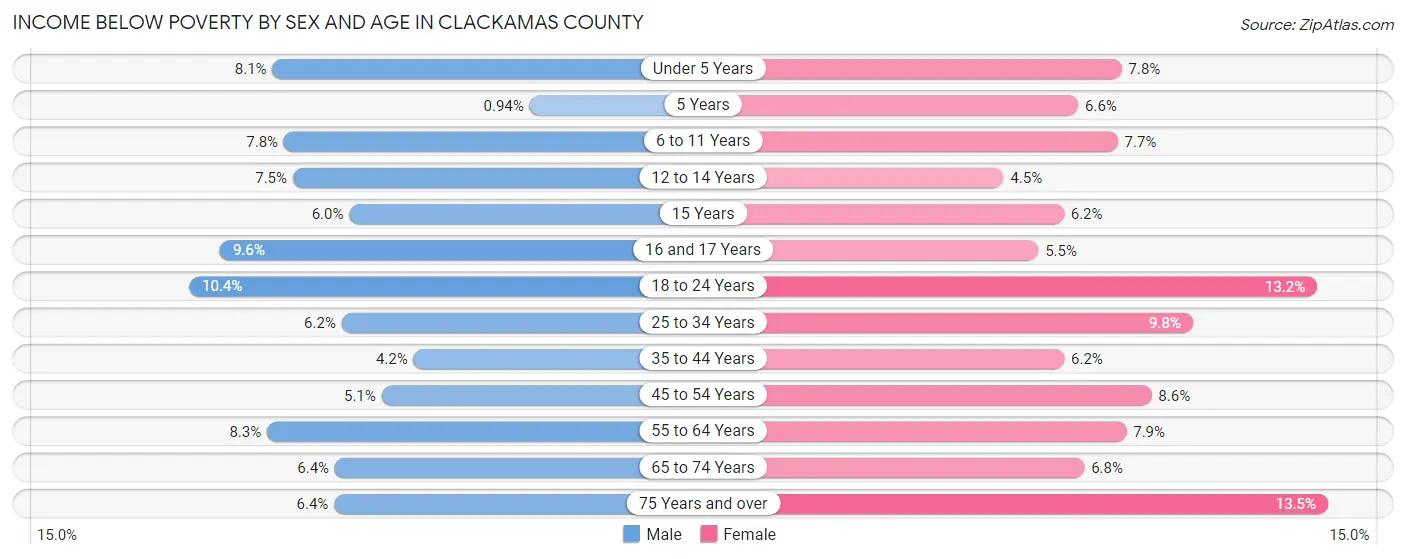
| Age Bracket | Male | Female |
| Under 5 Years | 862 (8.1%) | 784 (7.8%) |
| 5 Years | 23 (0.9%) | 149 (6.6%) |
| 6 to 11 Years | 1,211 (7.8%) | 1,083 (7.7%) |
| 12 to 14 Years | 599 (7.5%) | 368 (4.5%) |
| 15 Years | 178 (6.0%) | 153 (6.2%) |
| 16 and 17 Years | 518 (9.6%) | 301 (5.5%) |
| 18 to 24 Years | 1,726 (10.4%) | 2,006 (13.2%) |
| 25 to 34 Years | 1,591 (6.2%) | 2,442 (9.8%) |
| 35 to 44 Years | 1,206 (4.2%) | 1,779 (6.2%) |
| 45 to 54 Years | 1,410 (5.1%) | 2,348 (8.6%) |
| 55 to 64 Years | 2,300 (8.3%) | 2,267 (7.9%) |
| 65 to 74 Years | 1,444 (6.4%) | 1,694 (6.8%) |
| 75 Years and over | 842 (6.4%) | 2,386 (13.5%) |
| Total | 13,910 (6.7%) | 17,760 (8.5%) |
Income Above Poverty by Sex and Age in Clackamas County
According to the poverty statistics in Clackamas County, males aged 5 years and females aged 12 to 14 years are the age groups that are most secure financially, with 99.1% of males and 95.5% of females in these age groups living above the poverty line.
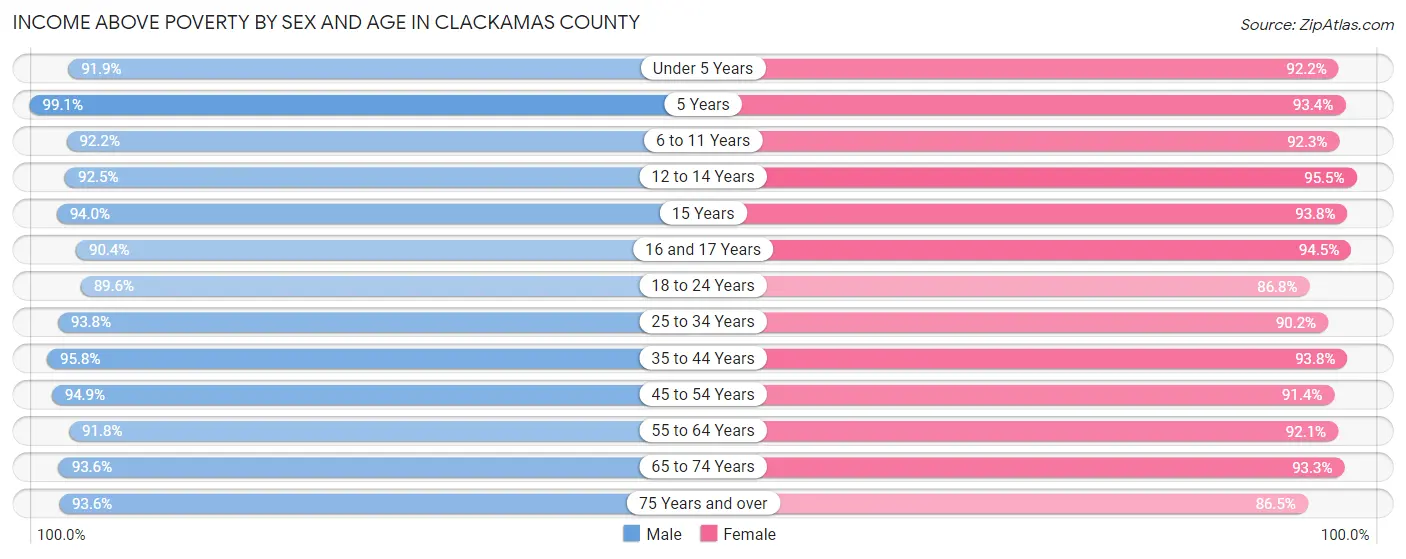
| Age Bracket | Male | Female |
| Under 5 Years | 9,784 (91.9%) | 9,281 (92.2%) |
| 5 Years | 2,423 (99.1%) | 2,117 (93.4%) |
| 6 to 11 Years | 14,348 (92.2%) | 13,011 (92.3%) |
| 12 to 14 Years | 7,351 (92.5%) | 7,815 (95.5%) |
| 15 Years | 2,808 (94.0%) | 2,322 (93.8%) |
| 16 and 17 Years | 4,901 (90.4%) | 5,199 (94.5%) |
| 18 to 24 Years | 14,844 (89.6%) | 13,153 (86.8%) |
| 25 to 34 Years | 24,182 (93.8%) | 22,565 (90.2%) |
| 35 to 44 Years | 27,711 (95.8%) | 26,970 (93.8%) |
| 45 to 54 Years | 26,467 (94.9%) | 24,886 (91.4%) |
| 55 to 64 Years | 25,590 (91.7%) | 26,351 (92.1%) |
| 65 to 74 Years | 21,274 (93.6%) | 23,397 (93.2%) |
| 75 Years and over | 12,347 (93.6%) | 15,245 (86.5%) |
| Total | 194,030 (93.3%) | 192,312 (91.5%) |
Income Below Poverty Among Married-Couple Families in Clackamas County
The poverty statistics for married-couple families in Clackamas County show that 2.6% or 2,362 of the total 89,759 families live below the poverty line. Families with 5 or more children have the highest poverty rate of 5.8%, comprising of 42 families. On the other hand, families with 3 or 4 children have the lowest poverty rate of 2.2%, which includes 134 families.
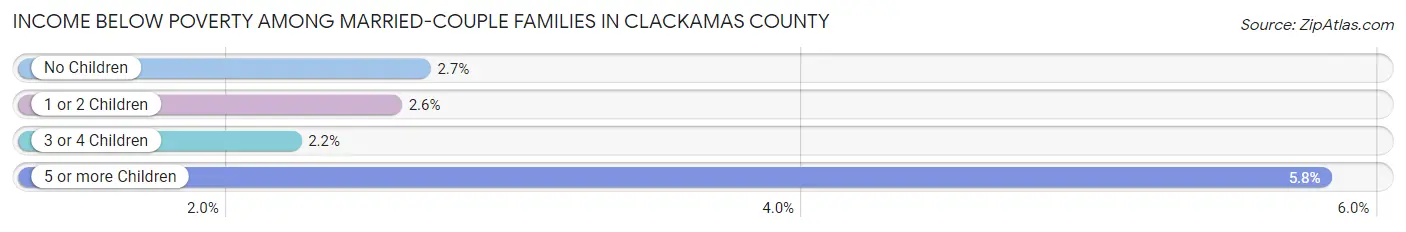
| Children | Above Poverty | Below Poverty |
| No Children | 51,421 (97.3%) | 1,411 (2.7%) |
| 1 or 2 Children | 29,385 (97.4%) | 775 (2.6%) |
| 3 or 4 Children | 5,910 (97.8%) | 134 (2.2%) |
| 5 or more Children | 681 (94.2%) | 42 (5.8%) |
| Total | 87,397 (97.4%) | 2,362 (2.6%) |
Income Below Poverty Among Single-Parent Households in Clackamas County
According to the poverty data in Clackamas County, 6.5% or 460 single-father households and 19.4% or 2,860 single-mother households are living below the poverty line. Among single-father households, those with 3 or 4 children have the highest poverty rate, with 26 households (10.0%) experiencing poverty. Likewise, among single-mother households, those with 5 or more children have the highest poverty rate, with 29 households (72.5%) falling below the poverty line.
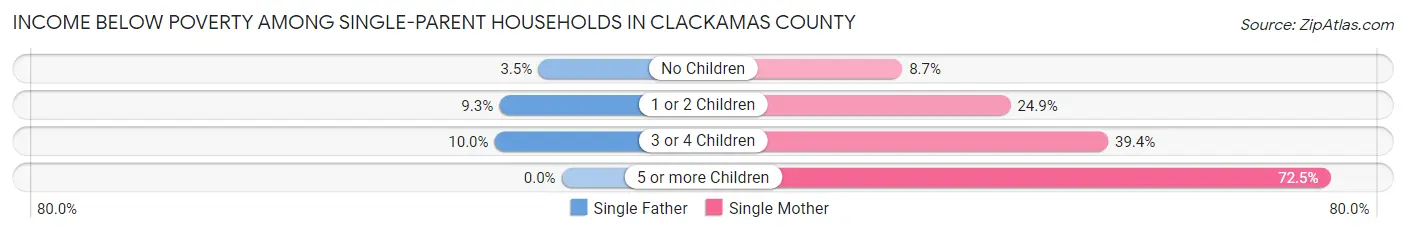
| Children | Single Father | Single Mother |
| No Children | 121 (3.5%) | 495 (8.7%) |
| 1 or 2 Children | 313 (9.3%) | 2,063 (24.9%) |
| 3 or 4 Children | 26 (10.0%) | 273 (39.4%) |
| 5 or more Children | 0 (0.0%) | 29 (72.5%) |
| Total | 460 (6.5%) | 2,860 (19.4%) |
Income Below Poverty Among Married-Couple vs Single-Parent Households in Clackamas County
The poverty data for Clackamas County shows that 2,362 of the married-couple family households (2.6%) and 3,320 of the single-parent households (15.2%) are living below the poverty level. Within the married-couple family households, those with 5 or more children have the highest poverty rate, with 42 households (5.8%) falling below the poverty line. Among the single-parent households, those with 5 or more children have the highest poverty rate, with 29 household (48.3%) living below poverty.
| Children | Married-Couple Families | Single-Parent Households |
| No Children | 1,411 (2.7%) | 616 (6.7%) |
| 1 or 2 Children | 775 (2.6%) | 2,376 (20.4%) |
| 3 or 4 Children | 134 (2.2%) | 299 (31.4%) |
| 5 or more Children | 42 (5.8%) | 29 (48.3%) |
| Total | 2,362 (2.6%) | 3,320 (15.2%) |
Employment Characteristics in Clackamas County
Employment by Class of Employer in Clackamas County
Among the 202,643 employed individuals in Clackamas County, private company employees (135,080 | 66.7%), not-for-profit organizations (18,291 | 9.0%), and local government employees (14,419 | 7.1%) make up the most common classes of employment.
| Employer Class | # Employees | % Employees |
| Private Company Employees | 135,080 | 66.7% |
| Self-Employed (Incorporated) | 10,102 | 5.0% |
| Self-Employed (Not Incorporated) | 13,853 | 6.8% |
| Not-for-profit Organizations | 18,291 | 9.0% |
| Local Government Employees | 14,419 | 7.1% |
| State Government Employees | 7,285 | 3.6% |
| Federal Government Employees | 3,132 | 1.5% |
| Unpaid Family Workers | 481 | 0.2% |
| Total | 202,643 | 100.0% |
Employment Status by Age in Clackamas County
According to the labor force statistics for Clackamas County, out of the total population over 16 years of age (343,137), 63.4% or 217,549 individuals are in the labor force, with 5.0% or 10,877 of them unemployed. The age group with the highest labor force participation rate is 25 to 29 years, with 86.7% or 21,367 individuals in the labor force. Within the labor force, the 16 to 19 years age range has the highest percentage of unemployed individuals, with 11.0% or 893 of them being unemployed.
| Age Bracket | In Labor Force | Unemployed |
| 16 to 19 Years | 8,119 (40.9%) | 893 (11.0%) |
| 20 to 24 Years | 17,827 (77.8%) | 1,729 (9.7%) |
| 25 to 29 Years | 21,367 (86.7%) | 1,090 (5.1%) |
| 30 to 34 Years | 22,121 (84.3%) | 1,084 (4.9%) |
| 35 to 44 Years | 49,488 (85.6%) | 2,425 (4.9%) |
| 45 to 54 Years | 45,598 (82.6%) | 1,778 (3.9%) |
| 55 to 59 Years | 20,552 (74.9%) | 719 (3.5%) |
| 60 to 64 Years | 18,109 (61.8%) | 579 (3.2%) |
| 65 to 74 Years | 12,393 (25.8%) | 421 (3.4%) |
| 75 Years and over | 1,997 (6.3%) | 64 (3.2%) |
| Total | 217,549 (63.4%) | 10,877 (5.0%) |
Employment Status by Educational Attainment in Clackamas County
According to labor force statistics for Clackamas County, 80.3% of individuals (177,176) out of the total population between 25 and 64 years of age (220,643) are in the labor force, with 4.3% or 7,619 of them being unemployed. The group with the highest labor force participation rate are those with the educational attainment of bachelor's degree or higher, with 85.9% or 75,425 individuals in the labor force. Within the labor force, individuals with less than high school education have the highest percentage of unemployment, with 7.8% or 634 of them being unemployed.
| Educational Attainment | In Labor Force | Unemployed |
| Less than High School | 8,129 (64.3%) | 986 (7.8%) |
| High School Diploma | 33,579 (72.4%) | 2,319 (5.0%) |
| College / Associate Degree | 60,085 (81.4%) | 3,986 (5.4%) |
| Bachelor's Degree or higher | 75,425 (85.9%) | 2,459 (2.8%) |
| Total | 177,176 (80.3%) | 9,488 (4.3%) |
Employment Occupations by Sex in Clackamas County
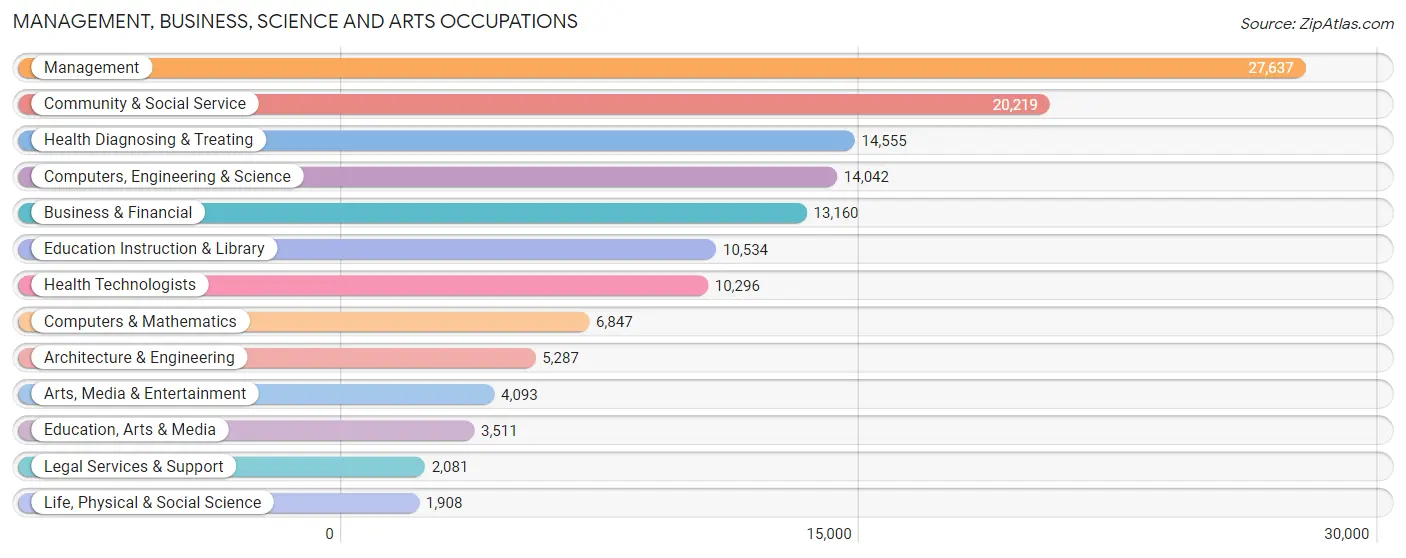
Management, Business, Science and Arts Occupations
The most common Management, Business, Science and Arts occupations in Clackamas County are Management (27,637 | 13.4%), Community & Social Service (20,219 | 9.8%), Health Diagnosing & Treating (14,555 | 7.0%), Computers, Engineering & Science (14,042 | 6.8%), and Business & Financial (13,160 | 6.4%).
Management, Business, Science and Arts Occupations by Sex
Within the Management, Business, Science and Arts occupations in Clackamas County, the most male-oriented occupations are Architecture & Engineering (85.1%), Computers, Engineering & Science (74.1%), and Computers & Mathematics (72.5%), while the most female-oriented occupations are Education Instruction & Library (73.1%), Health Diagnosing & Treating (70.2%), and Education, Arts & Media (69.9%).
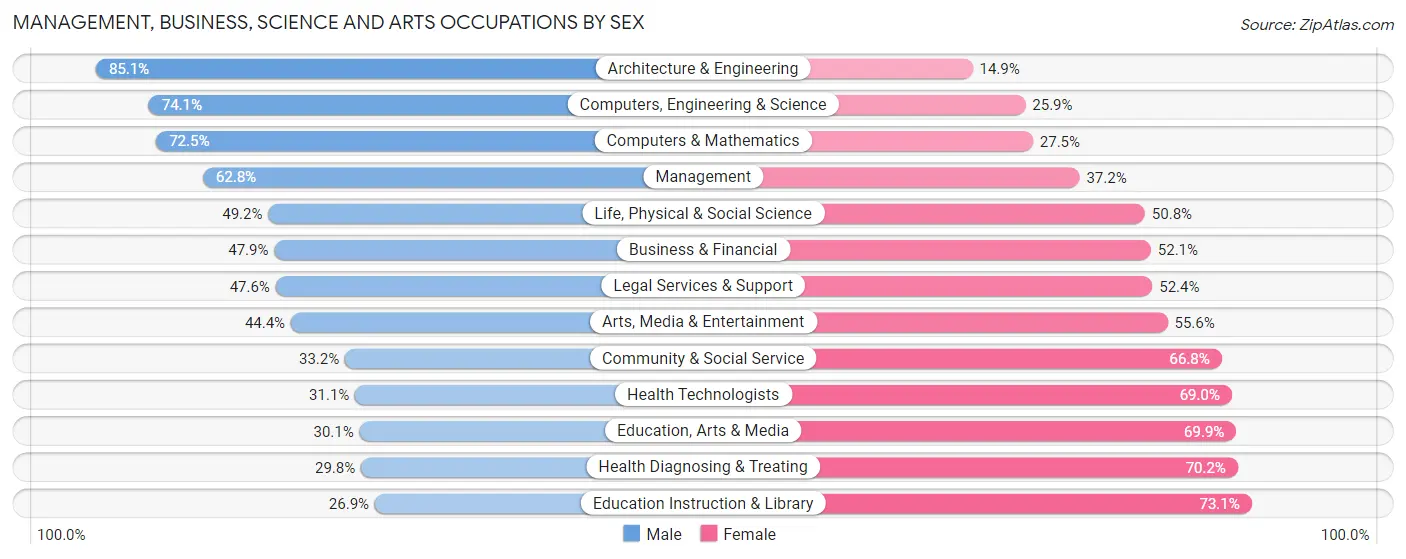
| Occupation | Male | Female |
| Management | 17,356 (62.8%) | 10,281 (37.2%) |
| Business & Financial | 6,305 (47.9%) | 6,855 (52.1%) |
| Computers, Engineering & Science | 10,404 (74.1%) | 3,638 (25.9%) |
| Computers & Mathematics | 4,966 (72.5%) | 1,881 (27.5%) |
| Architecture & Engineering | 4,500 (85.1%) | 787 (14.9%) |
| Life, Physical & Social Science | 938 (49.2%) | 970 (50.8%) |
| Community & Social Service | 6,704 (33.2%) | 13,515 (66.8%) |
| Education, Arts & Media | 1,058 (30.1%) | 2,453 (69.9%) |
| Legal Services & Support | 991 (47.6%) | 1,090 (52.4%) |
| Education Instruction & Library | 2,836 (26.9%) | 7,698 (73.1%) |
| Arts, Media & Entertainment | 1,819 (44.4%) | 2,274 (55.6%) |
| Health Diagnosing & Treating | 4,339 (29.8%) | 10,216 (70.2%) |
| Health Technologists | 3,197 (31.0%) | 7,099 (69.0%) |
| Total (Category) | 45,108 (50.3%) | 44,505 (49.7%) |
| Total (Overall) | 110,730 (53.6%) | 95,882 (46.4%) |
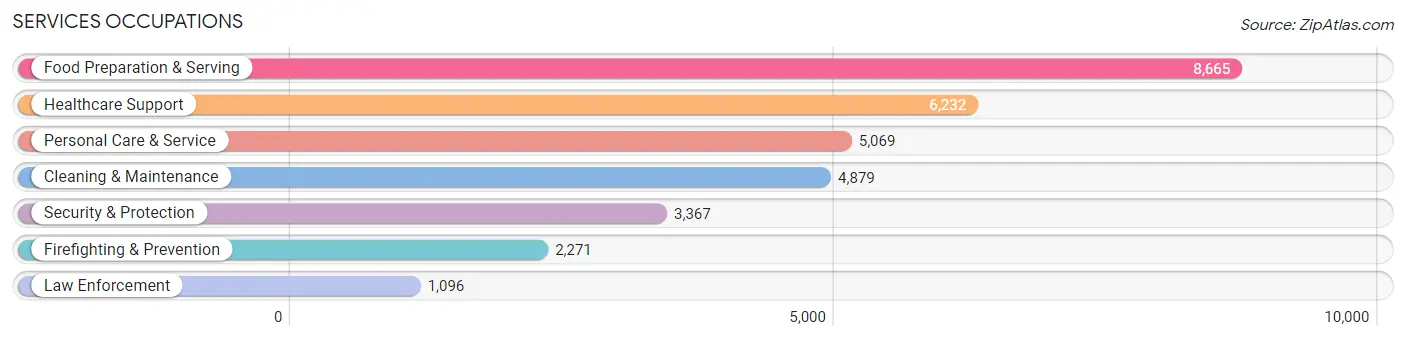
Services Occupations
The most common Services occupations in Clackamas County are Food Preparation & Serving (8,665 | 4.2%), Healthcare Support (6,232 | 3.0%), Personal Care & Service (5,069 | 2.5%), Cleaning & Maintenance (4,879 | 2.4%), and Security & Protection (3,367 | 1.6%).
Services Occupations by Sex
Within the Services occupations in Clackamas County, the most male-oriented occupations are Law Enforcement (80.8%), Security & Protection (79.9%), and Firefighting & Prevention (79.4%), while the most female-oriented occupations are Healthcare Support (86.5%), Personal Care & Service (83.9%), and Food Preparation & Serving (55.9%).
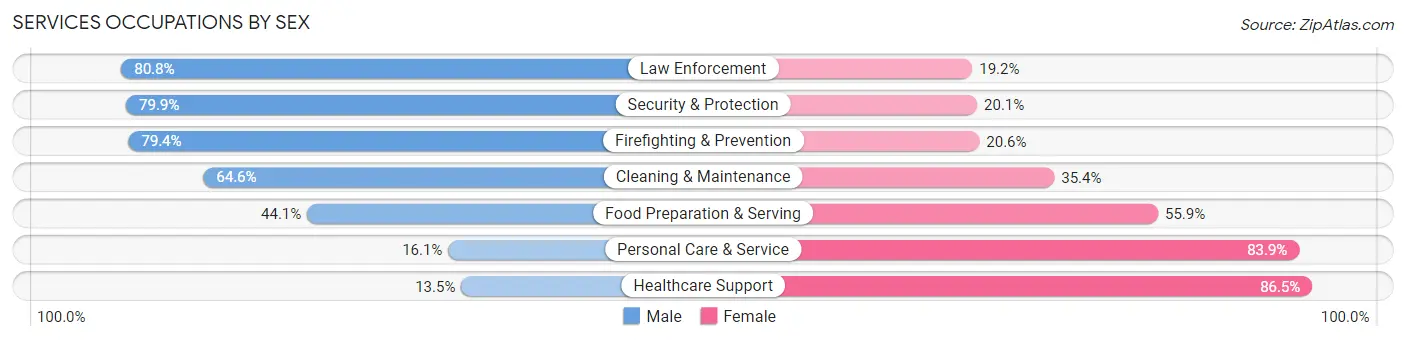
| Occupation | Male | Female |
| Healthcare Support | 844 (13.5%) | 5,388 (86.5%) |
| Security & Protection | 2,690 (79.9%) | 677 (20.1%) |
| Firefighting & Prevention | 1,804 (79.4%) | 467 (20.6%) |
| Law Enforcement | 886 (80.8%) | 210 (19.2%) |
| Food Preparation & Serving | 3,818 (44.1%) | 4,847 (55.9%) |
| Cleaning & Maintenance | 3,152 (64.6%) | 1,727 (35.4%) |
| Personal Care & Service | 817 (16.1%) | 4,252 (83.9%) |
| Total (Category) | 11,321 (40.1%) | 16,891 (59.9%) |
| Total (Overall) | 110,730 (53.6%) | 95,882 (46.4%) |
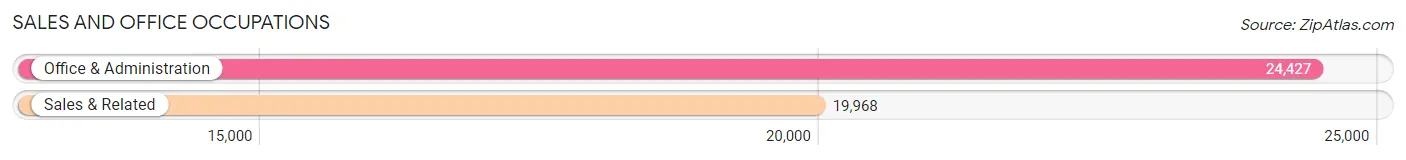
Sales and Office Occupations
The most common Sales and Office occupations in Clackamas County are Office & Administration (24,427 | 11.8%), and Sales & Related (19,968 | 9.7%).
Sales and Office Occupations by Sex
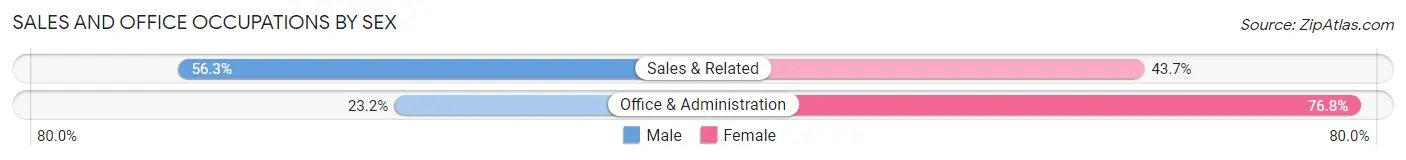
| Occupation | Male | Female |
| Sales & Related | 11,245 (56.3%) | 8,723 (43.7%) |
| Office & Administration | 5,659 (23.2%) | 18,768 (76.8%) |
| Total (Category) | 16,904 (38.1%) | 27,491 (61.9%) |
| Total (Overall) | 110,730 (53.6%) | 95,882 (46.4%) |
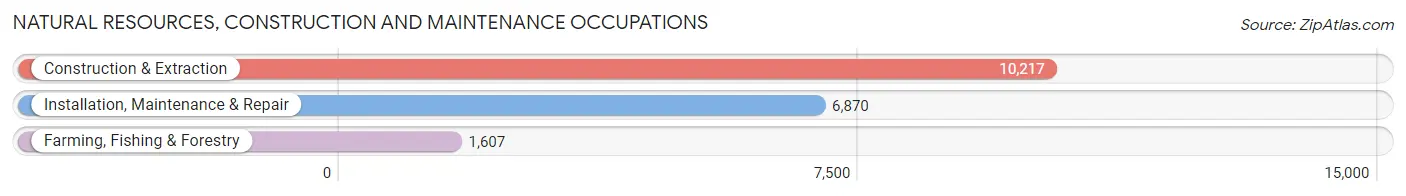
Natural Resources, Construction and Maintenance Occupations
The most common Natural Resources, Construction and Maintenance occupations in Clackamas County are Construction & Extraction (10,217 | 5.0%), Installation, Maintenance & Repair (6,870 | 3.3%), and Farming, Fishing & Forestry (1,607 | 0.8%).
Natural Resources, Construction and Maintenance Occupations by Sex
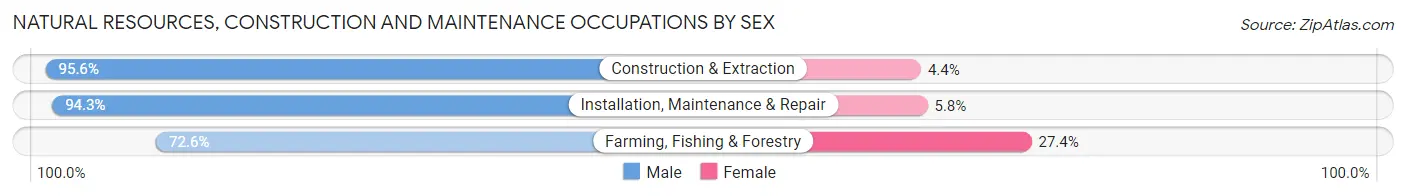
| Occupation | Male | Female |
| Farming, Fishing & Forestry | 1,167 (72.6%) | 440 (27.4%) |
| Construction & Extraction | 9,769 (95.6%) | 448 (4.4%) |
| Installation, Maintenance & Repair | 6,475 (94.3%) | 395 (5.8%) |
| Total (Category) | 17,411 (93.1%) | 1,283 (6.9%) |
| Total (Overall) | 110,730 (53.6%) | 95,882 (46.4%) |
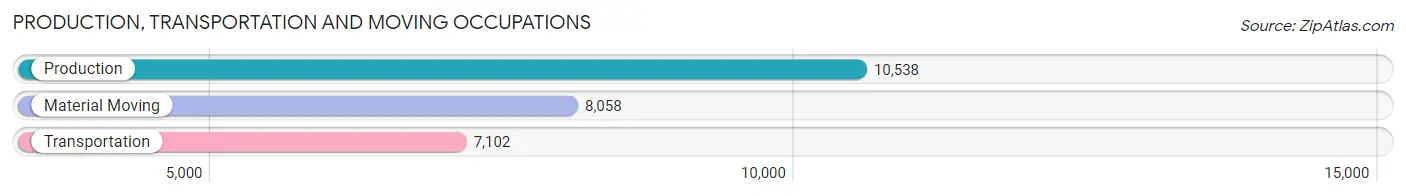
Production, Transportation and Moving Occupations
The most common Production, Transportation and Moving occupations in Clackamas County are Production (10,538 | 5.1%), Material Moving (8,058 | 3.9%), and Transportation (7,102 | 3.4%).
Production, Transportation and Moving Occupations by Sex
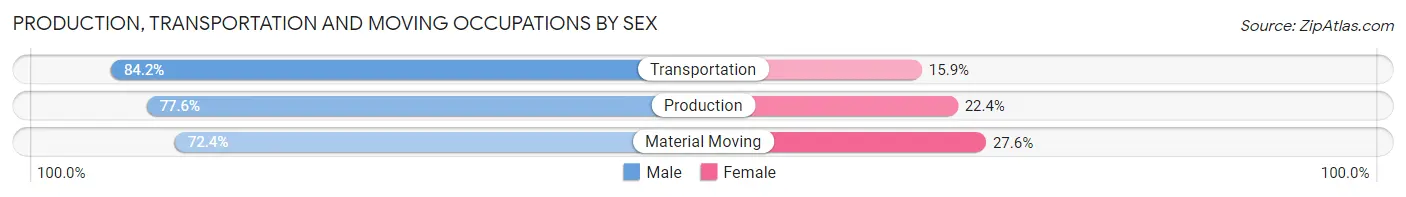
| Occupation | Male | Female |
| Production | 8,176 (77.6%) | 2,362 (22.4%) |
| Transportation | 5,976 (84.2%) | 1,126 (15.9%) |
| Material Moving | 5,834 (72.4%) | 2,224 (27.6%) |
| Total (Category) | 19,986 (77.8%) | 5,712 (22.2%) |
| Total (Overall) | 110,730 (53.6%) | 95,882 (46.4%) |
Employment Industries by Sex in Clackamas County
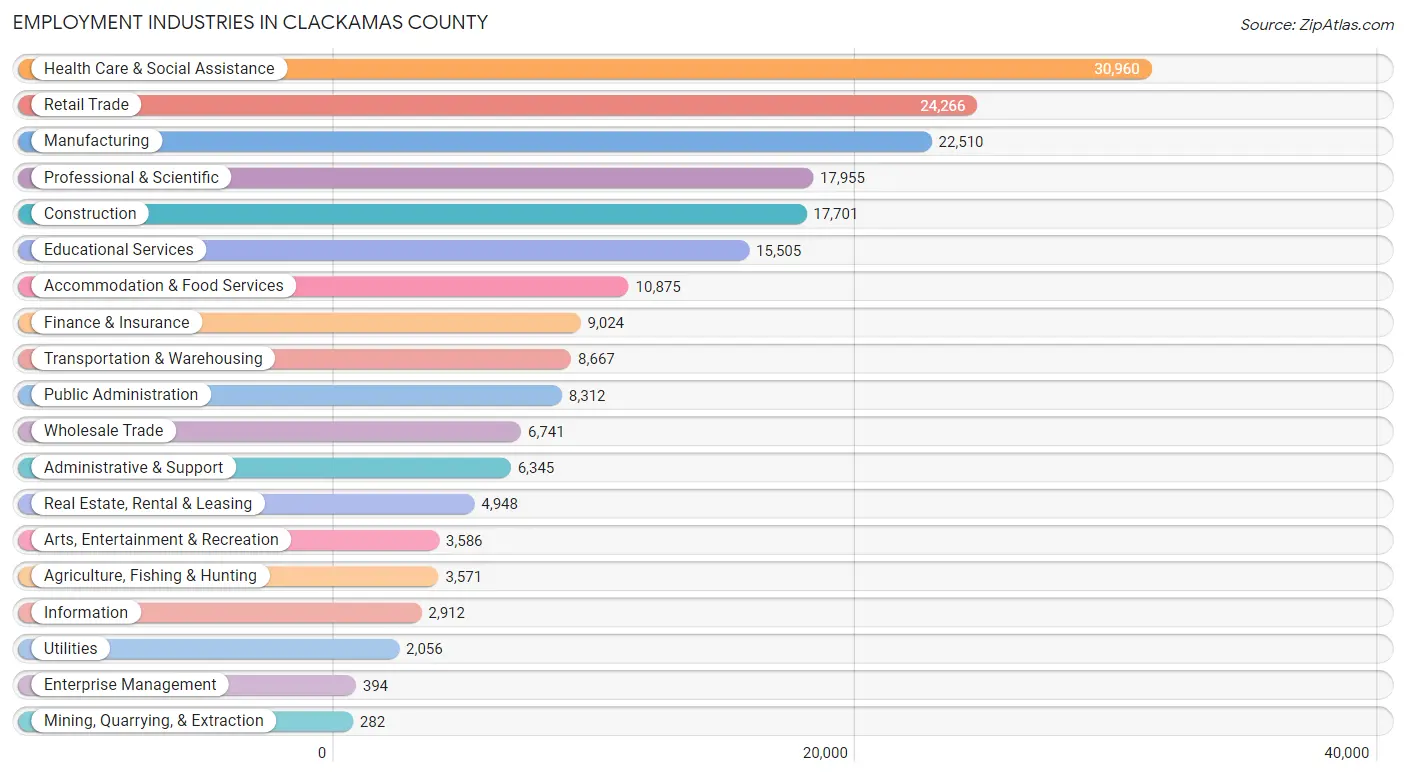
Employment Industries in Clackamas County
The major employment industries in Clackamas County include Health Care & Social Assistance (30,960 | 15.0%), Retail Trade (24,266 | 11.7%), Manufacturing (22,510 | 10.9%), Professional & Scientific (17,955 | 8.7%), and Construction (17,701 | 8.6%).
Employment Industries by Sex in Clackamas County
The Clackamas County industries that see more men than women are Mining, Quarrying, & Extraction (97.5%), Construction (86.5%), and Manufacturing (75.8%), whereas the industries that tend to have a higher number of women are Health Care & Social Assistance (77.3%), Educational Services (70.7%), and Enterprise Management (64.2%).
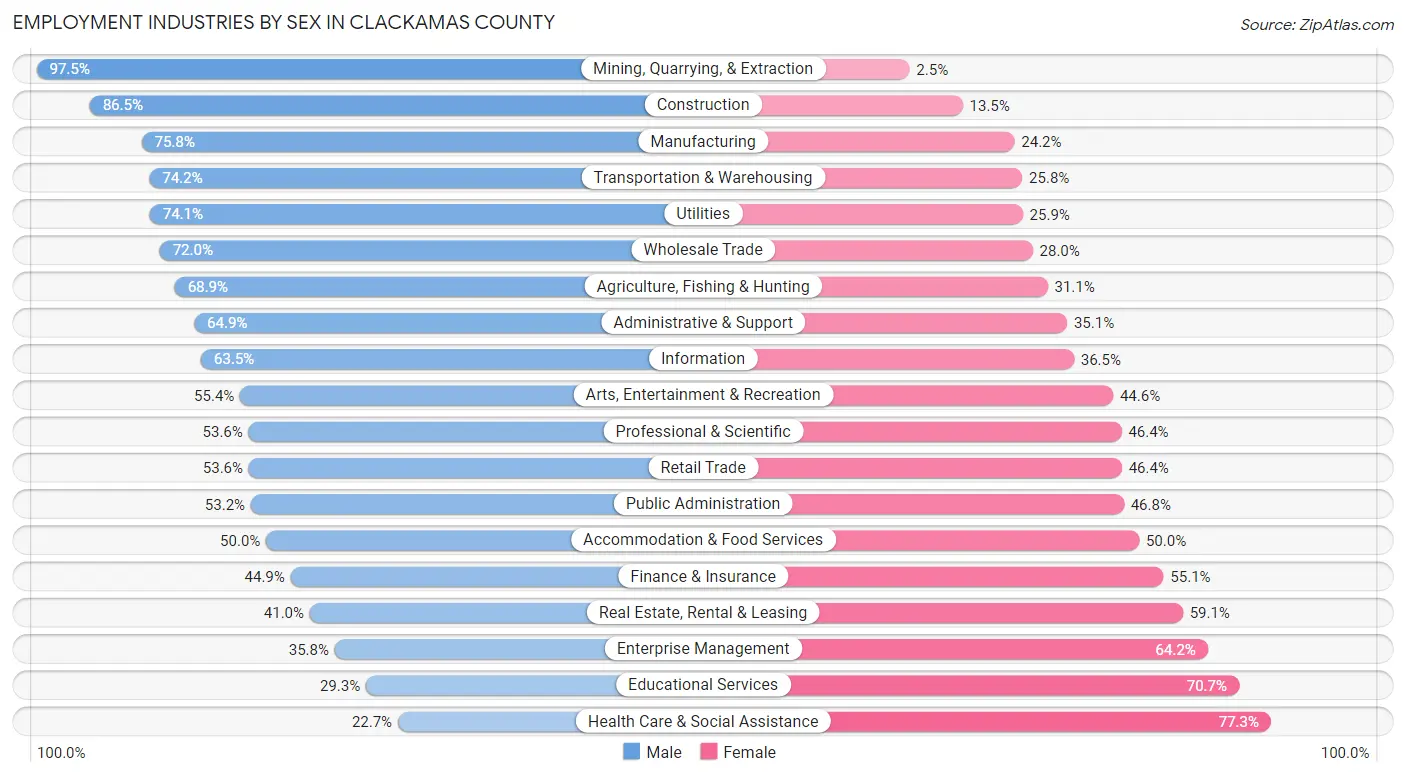
| Industry | Male | Female |
| Agriculture, Fishing & Hunting | 2,461 (68.9%) | 1,110 (31.1%) |
| Mining, Quarrying, & Extraction | 275 (97.5%) | 7 (2.5%) |
| Construction | 15,313 (86.5%) | 2,388 (13.5%) |
| Manufacturing | 17,060 (75.8%) | 5,450 (24.2%) |
| Wholesale Trade | 4,855 (72.0%) | 1,886 (28.0%) |
| Retail Trade | 13,002 (53.6%) | 11,264 (46.4%) |
| Transportation & Warehousing | 6,429 (74.2%) | 2,238 (25.8%) |
| Utilities | 1,523 (74.1%) | 533 (25.9%) |
| Information | 1,849 (63.5%) | 1,063 (36.5%) |
| Finance & Insurance | 4,055 (44.9%) | 4,969 (55.1%) |
| Real Estate, Rental & Leasing | 2,026 (40.9%) | 2,922 (59.1%) |
| Professional & Scientific | 9,629 (53.6%) | 8,326 (46.4%) |
| Enterprise Management | 141 (35.8%) | 253 (64.2%) |
| Administrative & Support | 4,118 (64.9%) | 2,227 (35.1%) |
| Educational Services | 4,549 (29.3%) | 10,956 (70.7%) |
| Health Care & Social Assistance | 7,033 (22.7%) | 23,927 (77.3%) |
| Arts, Entertainment & Recreation | 1,986 (55.4%) | 1,600 (44.6%) |
| Accommodation & Food Services | 5,438 (50.0%) | 5,437 (50.0%) |
| Public Administration | 4,419 (53.2%) | 3,893 (46.8%) |
| Total | 110,730 (53.6%) | 95,882 (46.4%) |
Education in Clackamas County
School Enrollment in Clackamas County
The most common levels of schooling among the 91,155 students in Clackamas County are high school (21,890 | 24.0%), middle school (19,968 | 21.9%), and elementary school (19,802 | 21.7%).
| School Level | # Students | % Students |
| Nursery / Preschool | 4,560 | 5.0% |
| Kindergarten | 5,099 | 5.6% |
| Elementary School | 19,802 | 21.7% |
| Middle School | 19,968 | 21.9% |
| High School | 21,890 | 24.0% |
| College / Undergraduate | 15,277 | 16.8% |
| Graduate / Professional | 4,559 | 5.0% |
| Total | 91,155 | 100.0% |
School Enrollment by Age by Funding Source in Clackamas County
Out of a total of 91,155 students who are enrolled in schools in Clackamas County, 16,955 (18.6%) attend a private institution, while the remaining 74,200 (81.4%) are enrolled in public schools. The age group of 3 to 4 year olds has the highest likelihood of being enrolled in private schools, with 2,090 (64.4% in the age bracket) enrolled. Conversely, the age group of 15 to 17 year olds has the lowest likelihood of being enrolled in a private school, with 13,861 (87.3% in the age bracket) attending a public institution.
| Age Bracket | Public School | Private School |
| 3 to 4 Year Olds | 1,153 (35.5%) | 2,090 (64.4%) |
| 5 to 9 Year Old | 19,587 (82.7%) | 4,108 (17.3%) |
| 10 to 14 Year Olds | 21,734 (86.4%) | 3,437 (13.7%) |
| 15 to 17 Year Olds | 13,861 (87.3%) | 2,014 (12.7%) |
| 18 to 19 Year Olds | 5,142 (87.1%) | 762 (12.9%) |
| 20 to 24 Year Olds | 5,926 (81.2%) | 1,374 (18.8%) |
| 25 to 34 Year Olds | 3,330 (69.6%) | 1,452 (30.4%) |
| 35 Years and over | 3,438 (66.3%) | 1,747 (33.7%) |
| Total | 74,200 (81.4%) | 16,955 (18.6%) |
Educational Attainment by Field of Study in Clackamas County
Business (24,492 | 19.0%), science & technology (12,618 | 9.8%), social sciences (11,943 | 9.2%), education (11,190 | 8.7%), and bio, nature & agricultural (10,316 | 8.0%) are the most common fields of study among 129,200 individuals in Clackamas County who have obtained a bachelor's degree or higher.
| Field of Study | # Graduates | % Graduates |
| Computers & Mathematics | 3,828 | 3.0% |
| Bio, Nature & Agricultural | 10,316 | 8.0% |
| Physical & Health Sciences | 4,486 | 3.5% |
| Psychology | 7,195 | 5.6% |
| Social Sciences | 11,943 | 9.2% |
| Engineering | 9,371 | 7.2% |
| Multidisciplinary Studies | 1,006 | 0.8% |
| Science & Technology | 12,618 | 9.8% |
| Business | 24,492 | 19.0% |
| Education | 11,190 | 8.7% |
| Literature & Languages | 6,500 | 5.0% |
| Liberal Arts & History | 6,888 | 5.3% |
| Visual & Performing Arts | 6,504 | 5.0% |
| Communications | 5,769 | 4.5% |
| Arts & Humanities | 7,094 | 5.5% |
| Total | 129,200 | 100.0% |
Transportation & Commute in Clackamas County
Vehicle Availability by Sex in Clackamas County
The most prevalent vehicle ownership categories in Clackamas County are males with 2 vehicles (44,842, accounting for 41.2%) and females with 2 vehicles (37,685, making up 47.9%).
| Vehicles Available | Male | Female |
| No Vehicle | 1,684 (1.5%) | 1,560 (1.7%) |
| 1 Vehicle | 13,500 (12.4%) | 16,614 (17.8%) |
| 2 Vehicles | 44,842 (41.2%) | 37,685 (40.3%) |
| 3 Vehicles | 29,644 (27.3%) | 22,371 (23.9%) |
| 4 Vehicles | 11,336 (10.4%) | 9,247 (9.9%) |
| 5 or more Vehicles | 7,783 (7.1%) | 6,081 (6.5%) |
| Total | 108,789 (100.0%) | 93,558 (100.0%) |
Commute Time in Clackamas County
The most frequently occuring commute durations in Clackamas County are 30 to 34 minutes (25,773 commuters, 15.2%), 20 to 24 minutes (24,847 commuters, 14.6%), and 15 to 19 minutes (20,809 commuters, 12.2%).
| Commute Time | # Commuters | % Commuters |
| Less than 5 Minutes | 4,500 | 2.6% |
| 5 to 9 Minutes | 15,310 | 9.0% |
| 10 to 14 Minutes | 17,520 | 10.3% |
| 15 to 19 Minutes | 20,809 | 12.2% |
| 20 to 24 Minutes | 24,847 | 14.6% |
| 25 to 29 Minutes | 13,400 | 7.9% |
| 30 to 34 Minutes | 25,773 | 15.2% |
| 35 to 39 Minutes | 7,577 | 4.5% |
| 40 to 44 Minutes | 9,601 | 5.7% |
| 45 to 59 Minutes | 18,730 | 11.0% |
| 60 to 89 Minutes | 9,230 | 5.4% |
| 90 or more Minutes | 2,576 | 1.5% |
Commute Time by Sex in Clackamas County
The most common commute times in Clackamas County are 30 to 34 minutes (15,399 commuters, 16.4%) for males and 20 to 24 minutes (10,694 commuters, 14.1%) for females.
| Commute Time | Male | Female |
| Less than 5 Minutes | 2,184 (2.3%) | 2,316 (3.0%) |
| 5 to 9 Minutes | 7,159 (7.6%) | 8,151 (10.7%) |
| 10 to 14 Minutes | 8,475 (9.0%) | 9,045 (11.9%) |
| 15 to 19 Minutes | 11,368 (12.1%) | 9,441 (12.4%) |
| 20 to 24 Minutes | 14,153 (15.1%) | 10,694 (14.1%) |
| 25 to 29 Minutes | 7,592 (8.1%) | 5,808 (7.6%) |
| 30 to 34 Minutes | 15,399 (16.4%) | 10,374 (13.6%) |
| 35 to 39 Minutes | 4,633 (4.9%) | 2,944 (3.9%) |
| 40 to 44 Minutes | 5,206 (5.6%) | 4,395 (5.8%) |
| 45 to 59 Minutes | 10,456 (11.2%) | 8,274 (10.9%) |
| 60 to 89 Minutes | 5,523 (5.9%) | 3,707 (4.9%) |
| 90 or more Minutes | 1,601 (1.7%) | 975 (1.3%) |
Time of Departure to Work by Sex in Clackamas County
The most frequent times of departure to work in Clackamas County are 7:00 AM to 7:29 AM (12,735, 13.6%) for males and 7:00 AM to 7:29 AM (11,669, 15.3%) for females.
| Time of Departure | Male | Female |
| 12:00 AM to 4:59 AM | 7,663 (8.2%) | 2,245 (2.9%) |
| 5:00 AM to 5:29 AM | 5,734 (6.1%) | 1,645 (2.2%) |
| 5:30 AM to 5:59 AM | 6,550 (7.0%) | 3,612 (4.7%) |
| 6:00 AM to 6:29 AM | 9,479 (10.1%) | 5,910 (7.8%) |
| 6:30 AM to 6:59 AM | 10,995 (11.7%) | 8,469 (11.1%) |
| 7:00 AM to 7:29 AM | 12,735 (13.6%) | 11,669 (15.3%) |
| 7:30 AM to 7:59 AM | 9,357 (10.0%) | 9,889 (13.0%) |
| 8:00 AM to 8:29 AM | 8,702 (9.3%) | 7,639 (10.0%) |
| 8:30 AM to 8:59 AM | 3,795 (4.1%) | 4,584 (6.0%) |
| 9:00 AM to 9:59 AM | 4,589 (4.9%) | 6,119 (8.0%) |
| 10:00 AM to 10:59 AM | 2,380 (2.5%) | 2,976 (3.9%) |
| 11:00 AM to 11:59 AM | 1,219 (1.3%) | 1,424 (1.9%) |
| 12:00 PM to 3:59 PM | 5,488 (5.9%) | 5,427 (7.1%) |
| 4:00 PM to 11:59 PM | 5,063 (5.4%) | 4,516 (5.9%) |
| Total | 93,749 (100.0%) | 76,124 (100.0%) |
Housing Occupancy in Clackamas County
Occupancy by Ownership in Clackamas County
Of the total 160,984 dwellings in Clackamas County, owner-occupied units account for 114,452 (71.1%), while renter-occupied units make up 46,532 (28.9%).
| Occupancy | # Housing Units | % Housing Units |
| Owner Occupied Housing Units | 114,452 | 71.1% |
| Renter-Occupied Housing Units | 46,532 | 28.9% |
| Total Occupied Housing Units | 160,984 | 100.0% |
Occupancy by Household Size in Clackamas County
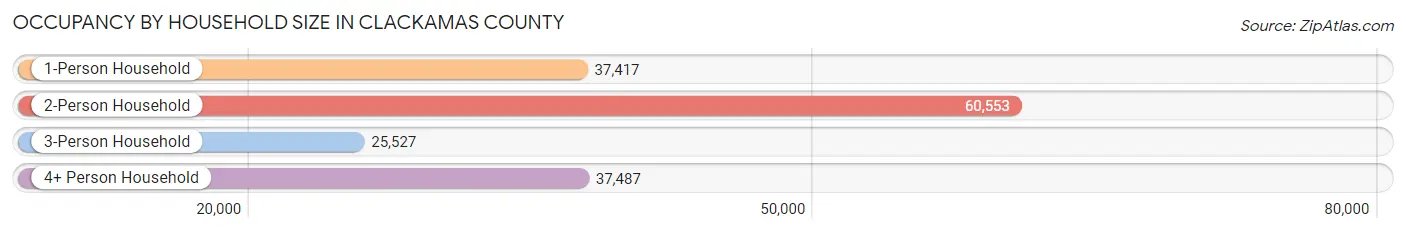
| Household Size | # Housing Units | % Housing Units |
| 1-Person Household | 37,417 | 23.2% |
| 2-Person Household | 60,553 | 37.6% |
| 3-Person Household | 25,527 | 15.9% |
| 4+ Person Household | 37,487 | 23.3% |
| Total Housing Units | 160,984 | 100.0% |
Occupancy by Ownership by Household Size in Clackamas County
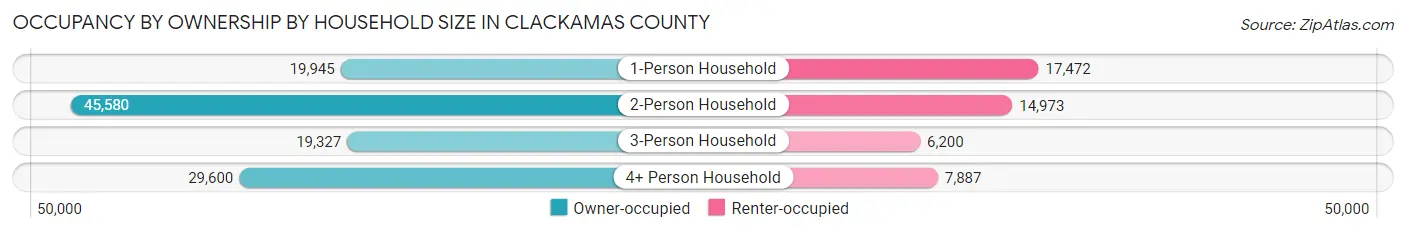
| Household Size | Owner-occupied | Renter-occupied |
| 1-Person Household | 19,945 (53.3%) | 17,472 (46.7%) |
| 2-Person Household | 45,580 (75.3%) | 14,973 (24.7%) |
| 3-Person Household | 19,327 (75.7%) | 6,200 (24.3%) |
| 4+ Person Household | 29,600 (79.0%) | 7,887 (21.0%) |
| Total Housing Units | 114,452 (71.1%) | 46,532 (28.9%) |
Occupancy by Educational Attainment in Clackamas County
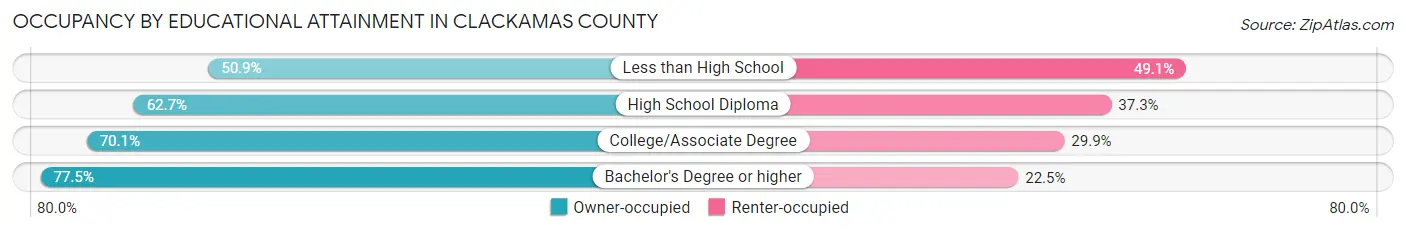
| Household Size | Owner-occupied | Renter-occupied |
| Less than High School | 3,605 (50.9%) | 3,483 (49.1%) |
| High School Diploma | 17,696 (62.7%) | 10,532 (37.3%) |
| College/Associate Degree | 40,210 (70.1%) | 17,115 (29.9%) |
| Bachelor's Degree or higher | 52,941 (77.5%) | 15,402 (22.5%) |
Occupancy by Age of Householder in Clackamas County
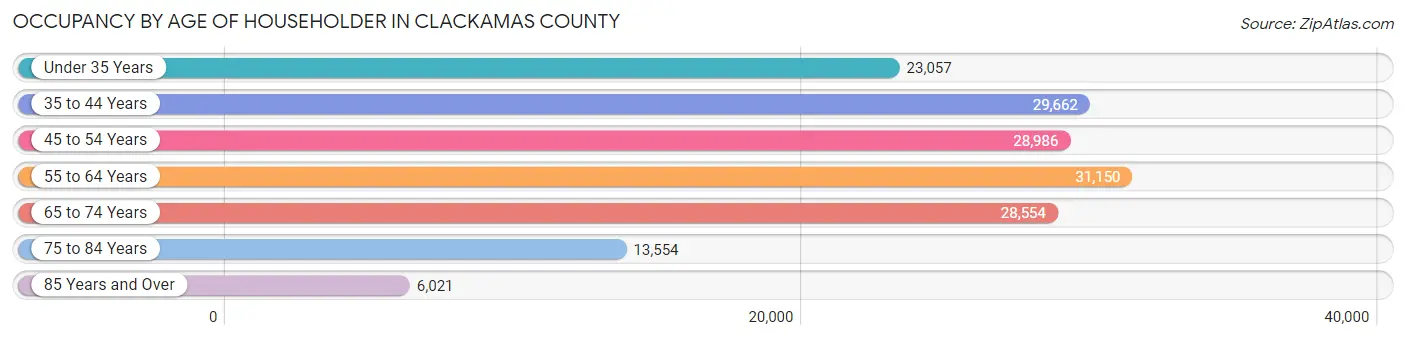
| Age Bracket | # Households | % Households |
| Under 35 Years | 23,057 | 14.3% |
| 35 to 44 Years | 29,662 | 18.4% |
| 45 to 54 Years | 28,986 | 18.0% |
| 55 to 64 Years | 31,150 | 19.4% |
| 65 to 74 Years | 28,554 | 17.7% |
| 75 to 84 Years | 13,554 | 8.4% |
| 85 Years and Over | 6,021 | 3.7% |
| Total | 160,984 | 100.0% |
Housing Finances in Clackamas County
Median Income by Occupancy in Clackamas County
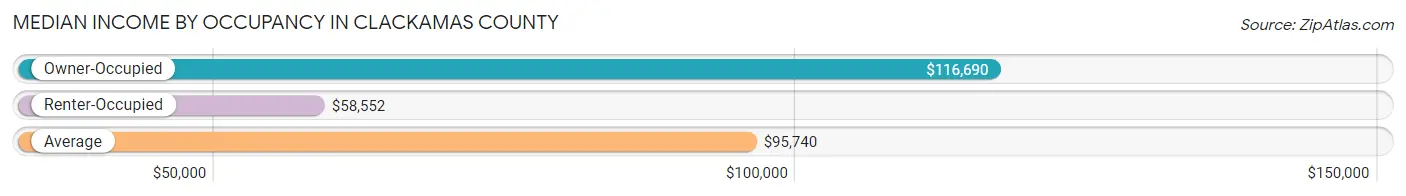
| Occupancy Type | # Households | Median Income |
| Owner-Occupied | 114,452 (71.1%) | $116,690 |
| Renter-Occupied | 46,532 (28.9%) | $58,552 |
| Average | 160,984 (100.0%) | $95,740 |
Occupancy by Householder Income Bracket in Clackamas County
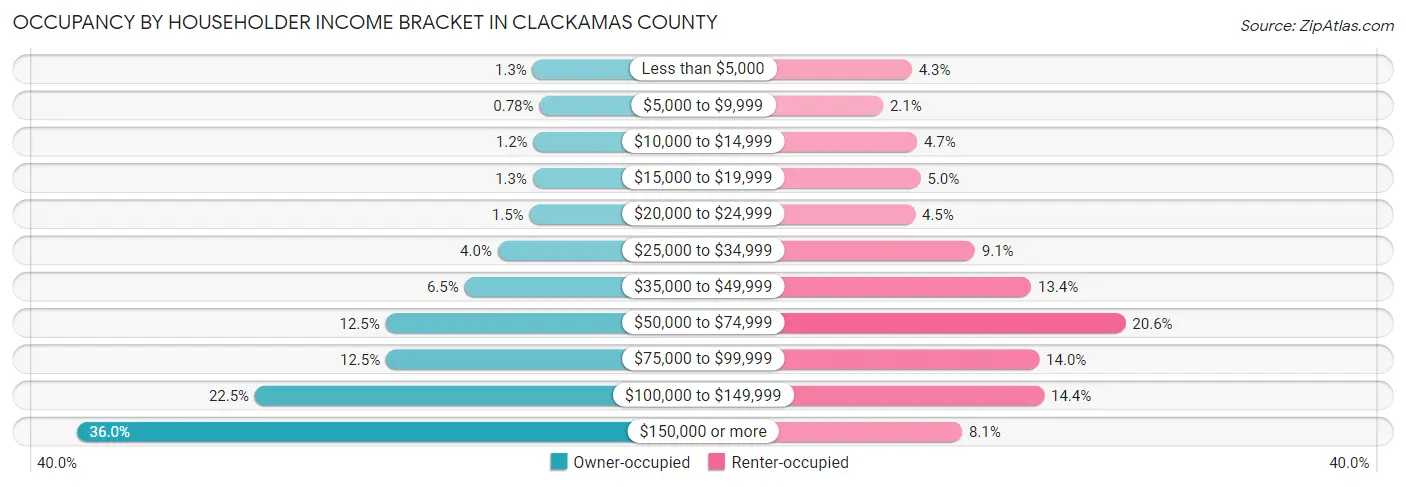
| Income Bracket | Owner-occupied | Renter-occupied |
| Less than $5,000 | 1,481 (1.3%) | 1,991 (4.3%) |
| $5,000 to $9,999 | 891 (0.8%) | 973 (2.1%) |
| $10,000 to $14,999 | 1,409 (1.2%) | 2,176 (4.7%) |
| $15,000 to $19,999 | 1,466 (1.3%) | 2,302 (5.0%) |
| $20,000 to $24,999 | 1,761 (1.5%) | 2,106 (4.5%) |
| $25,000 to $34,999 | 4,526 (4.0%) | 4,228 (9.1%) |
| $35,000 to $49,999 | 7,419 (6.5%) | 6,223 (13.4%) |
| $50,000 to $74,999 | 14,305 (12.5%) | 9,568 (20.6%) |
| $75,000 to $99,999 | 14,260 (12.5%) | 6,509 (14.0%) |
| $100,000 to $149,999 | 25,700 (22.5%) | 6,682 (14.4%) |
| $150,000 or more | 41,234 (36.0%) | 3,774 (8.1%) |
| Total | 114,452 (100.0%) | 46,532 (100.0%) |
Monthly Housing Cost Tiers in Clackamas County
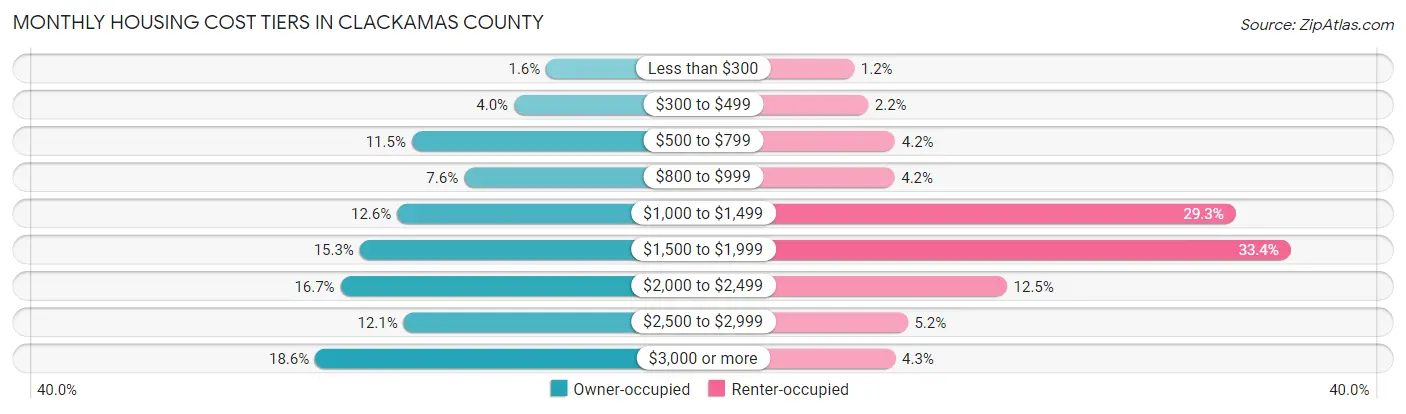
| Monthly Cost | Owner-occupied | Renter-occupied |
| Less than $300 | 1,815 (1.6%) | 561 (1.2%) |
| $300 to $499 | 4,527 (4.0%) | 1,040 (2.2%) |
| $500 to $799 | 13,152 (11.5%) | 1,968 (4.2%) |
| $800 to $999 | 8,744 (7.6%) | 1,952 (4.2%) |
| $1,000 to $1,499 | 14,382 (12.6%) | 13,641 (29.3%) |
| $1,500 to $1,999 | 17,537 (15.3%) | 15,533 (33.4%) |
| $2,000 to $2,499 | 19,161 (16.7%) | 5,799 (12.5%) |
| $2,500 to $2,999 | 13,833 (12.1%) | 2,403 (5.2%) |
| $3,000 or more | 21,301 (18.6%) | 1,979 (4.3%) |
| Total | 114,452 (100.0%) | 46,532 (100.0%) |
Physical Housing Characteristics in Clackamas County
Housing Structures in Clackamas County
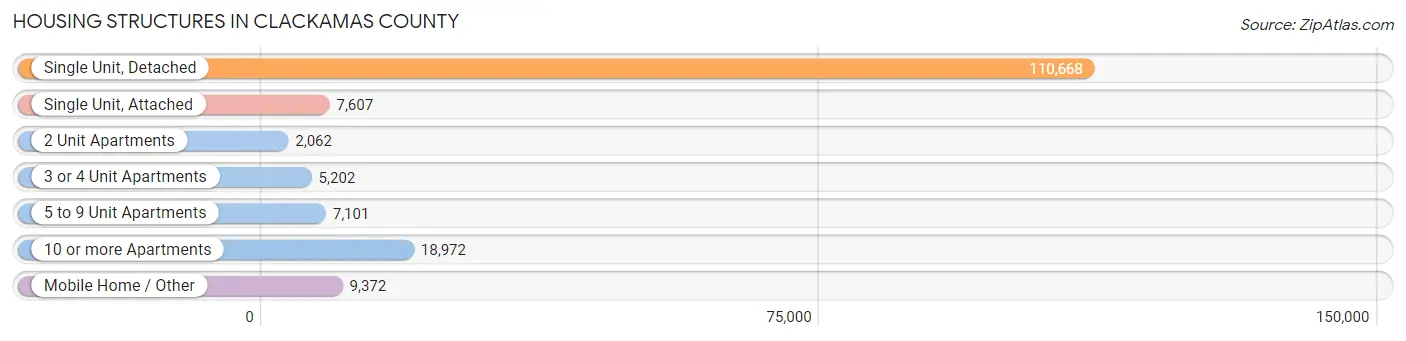
| Structure Type | # Housing Units | % Housing Units |
| Single Unit, Detached | 110,668 | 68.7% |
| Single Unit, Attached | 7,607 | 4.7% |
| 2 Unit Apartments | 2,062 | 1.3% |
| 3 or 4 Unit Apartments | 5,202 | 3.2% |
| 5 to 9 Unit Apartments | 7,101 | 4.4% |
| 10 or more Apartments | 18,972 | 11.8% |
| Mobile Home / Other | 9,372 | 5.8% |
| Total | 160,984 | 100.0% |
Housing Structures by Occupancy in Clackamas County
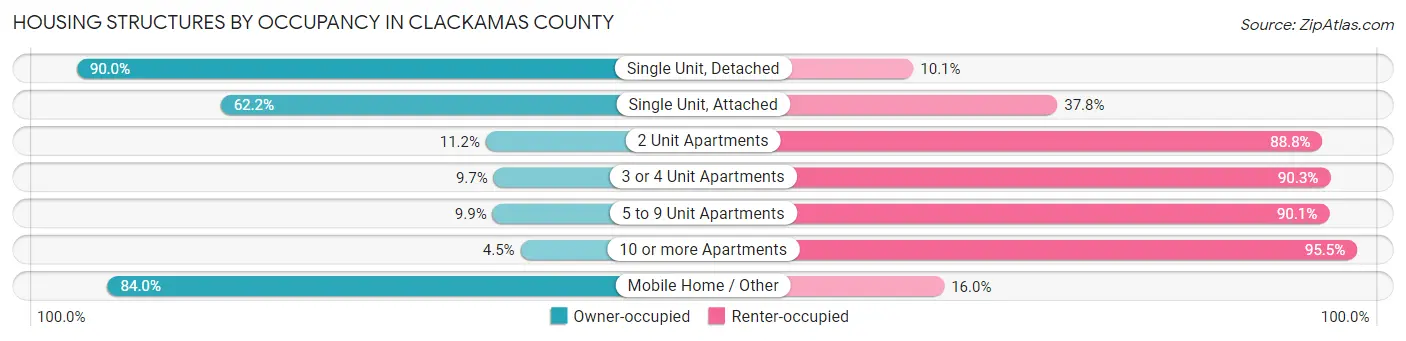
| Structure Type | Owner-occupied | Renter-occupied |
| Single Unit, Detached | 99,546 (89.9%) | 11,122 (10.1%) |
| Single Unit, Attached | 4,734 (62.2%) | 2,873 (37.8%) |
| 2 Unit Apartments | 231 (11.2%) | 1,831 (88.8%) |
| 3 or 4 Unit Apartments | 505 (9.7%) | 4,697 (90.3%) |
| 5 to 9 Unit Apartments | 704 (9.9%) | 6,397 (90.1%) |
| 10 or more Apartments | 859 (4.5%) | 18,113 (95.5%) |
| Mobile Home / Other | 7,873 (84.0%) | 1,499 (16.0%) |
| Total | 114,452 (71.1%) | 46,532 (28.9%) |
Housing Structures by Number of Rooms in Clackamas County
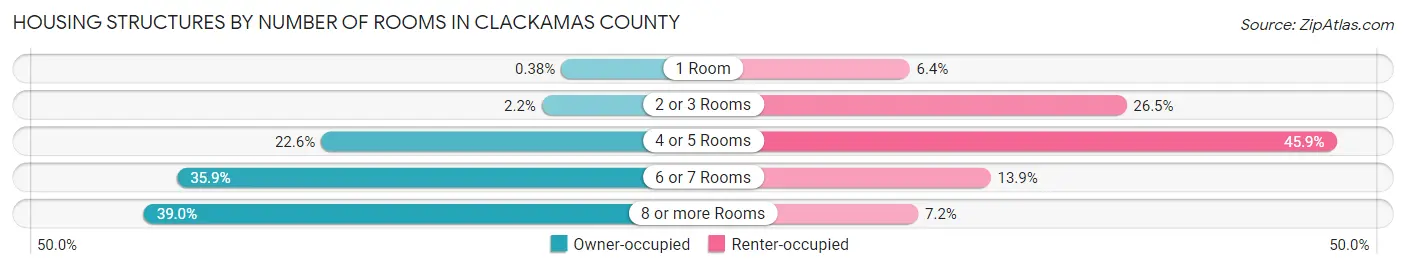
| Number of Rooms | Owner-occupied | Renter-occupied |
| 1 Room | 433 (0.4%) | 2,996 (6.4%) |
| 2 or 3 Rooms | 2,496 (2.2%) | 12,325 (26.5%) |
| 4 or 5 Rooms | 25,854 (22.6%) | 21,365 (45.9%) |
| 6 or 7 Rooms | 41,066 (35.9%) | 6,484 (13.9%) |
| 8 or more Rooms | 44,603 (39.0%) | 3,362 (7.2%) |
| Total | 114,452 (100.0%) | 46,532 (100.0%) |
Housing Structure by Heating Type in Clackamas County
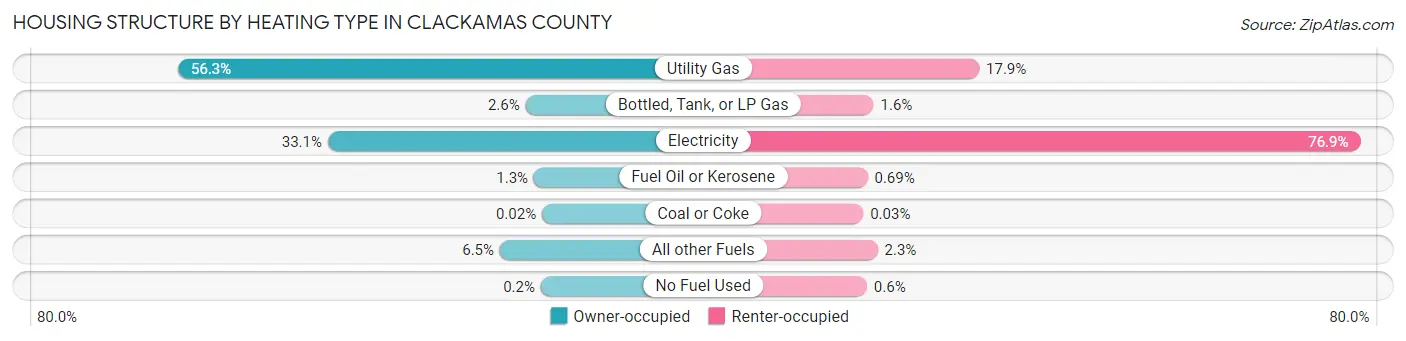
| Heating Type | Owner-occupied | Renter-occupied |
| Utility Gas | 64,433 (56.3%) | 8,348 (17.9%) |
| Bottled, Tank, or LP Gas | 2,935 (2.6%) | 760 (1.6%) |
| Electricity | 37,919 (33.1%) | 35,765 (76.9%) |
| Fuel Oil or Kerosene | 1,441 (1.3%) | 319 (0.7%) |
| Coal or Coke | 23 (0.0%) | 16 (0.0%) |
| All other Fuels | 7,474 (6.5%) | 1,046 (2.2%) |
| No Fuel Used | 227 (0.2%) | 278 (0.6%) |
| Total | 114,452 (100.0%) | 46,532 (100.0%) |
Household Vehicle Usage in Clackamas County
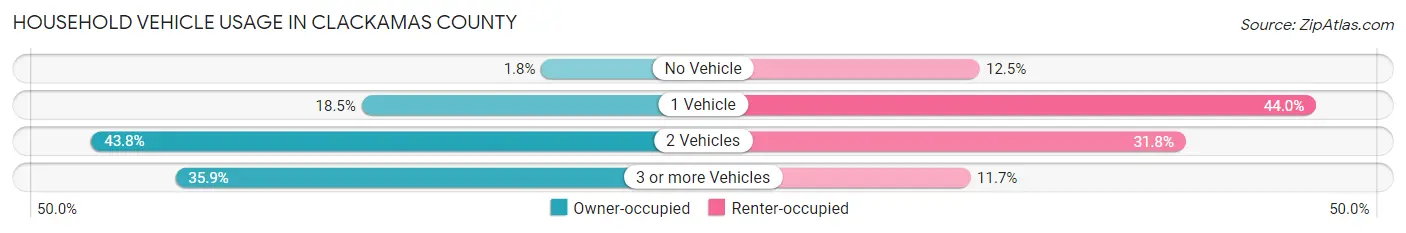
| Vehicles per Household | Owner-occupied | Renter-occupied |
| No Vehicle | 2,024 (1.8%) | 5,827 (12.5%) |
| 1 Vehicle | 21,222 (18.5%) | 20,464 (44.0%) |
| 2 Vehicles | 50,091 (43.8%) | 14,803 (31.8%) |
| 3 or more Vehicles | 41,115 (35.9%) | 5,438 (11.7%) |
| Total | 114,452 (100.0%) | 46,532 (100.0%) |
Real Estate & Mortgages in Clackamas County
Real Estate and Mortgage Overview in Clackamas County
| Characteristic | Without Mortgage | With Mortgage |
| Housing Units | 35,321 | 79,131 |
| Median Property Value | $499,000 | $544,600 |
| Median Household Income | $81,688 | $33,179 |
| Monthly Housing Costs | $783 | $21,138 |
| Real Estate Taxes | $4,680 | $1,214 |
Property Value by Mortgage Status in Clackamas County
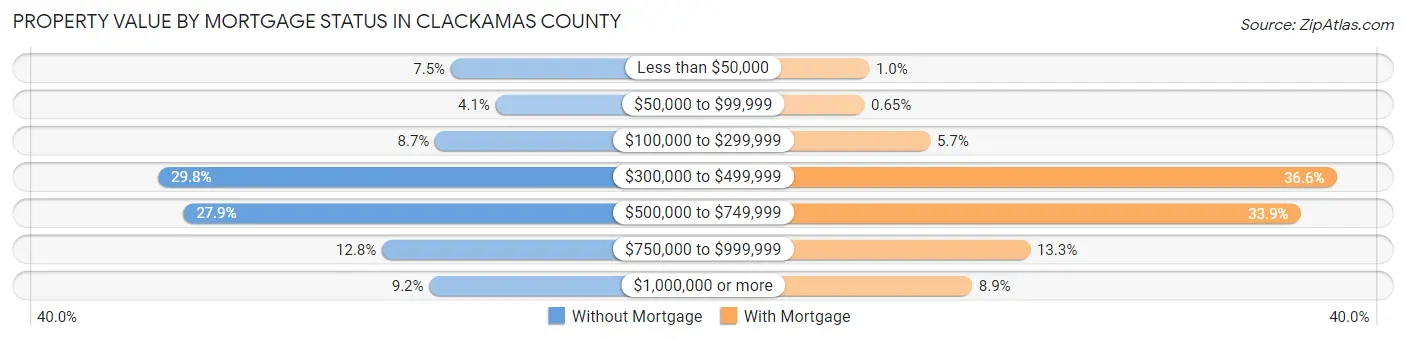
| Property Value | Without Mortgage | With Mortgage |
| Less than $50,000 | 2,656 (7.5%) | 808 (1.0%) |
| $50,000 to $99,999 | 1,451 (4.1%) | 511 (0.6%) |
| $100,000 to $299,999 | 3,080 (8.7%) | 4,486 (5.7%) |
| $300,000 to $499,999 | 10,534 (29.8%) | 28,980 (36.6%) |
| $500,000 to $749,999 | 9,857 (27.9%) | 26,819 (33.9%) |
| $750,000 to $999,999 | 4,507 (12.8%) | 10,513 (13.3%) |
| $1,000,000 or more | 3,236 (9.2%) | 7,014 (8.9%) |
| Total | 35,321 (100.0%) | 79,131 (100.0%) |
Household Income by Mortgage Status in Clackamas County
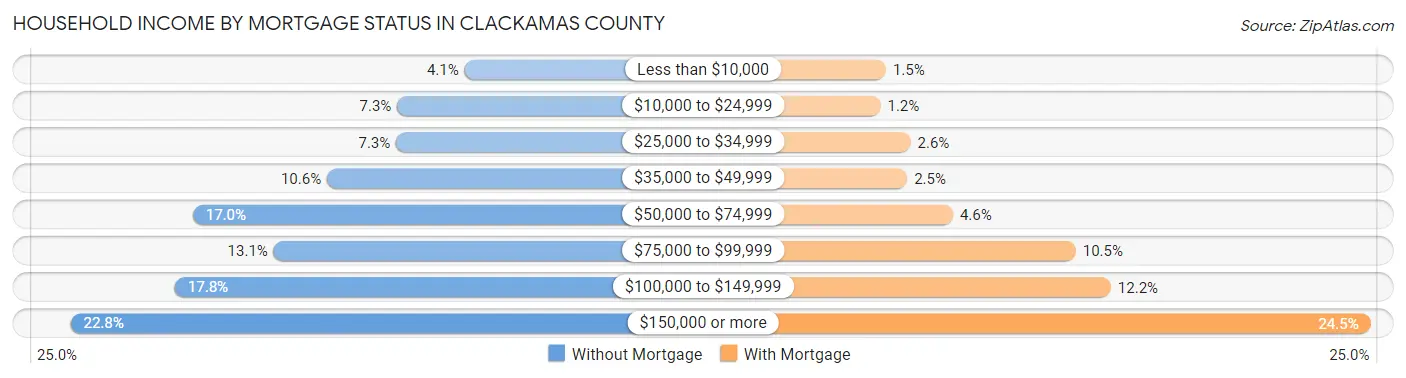
| Household Income | Without Mortgage | With Mortgage |
| Less than $10,000 | 1,432 (4.1%) | 1,144 (1.5%) |
| $10,000 to $24,999 | 2,566 (7.3%) | 940 (1.2%) |
| $25,000 to $34,999 | 2,582 (7.3%) | 2,070 (2.6%) |
| $35,000 to $49,999 | 3,745 (10.6%) | 1,944 (2.5%) |
| $50,000 to $74,999 | 6,001 (17.0%) | 3,674 (4.6%) |
| $75,000 to $99,999 | 4,640 (13.1%) | 8,304 (10.5%) |
| $100,000 to $149,999 | 6,300 (17.8%) | 9,620 (12.2%) |
| $150,000 or more | 8,055 (22.8%) | 19,400 (24.5%) |
| Total | 35,321 (100.0%) | 79,131 (100.0%) |
Property Value to Household Income Ratio in Clackamas County
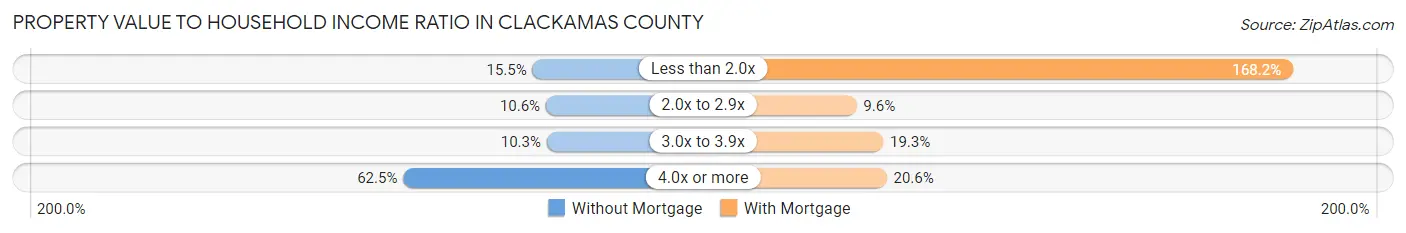
| Value-to-Income Ratio | Without Mortgage | With Mortgage |
| Less than 2.0x | 5,472 (15.5%) | 133,084 (168.2%) |
| 2.0x to 2.9x | 3,753 (10.6%) | 7,611 (9.6%) |
| 3.0x to 3.9x | 3,648 (10.3%) | 15,282 (19.3%) |
| 4.0x or more | 22,066 (62.5%) | 16,288 (20.6%) |
| Total | 35,321 (100.0%) | 79,131 (100.0%) |
Real Estate Taxes by Mortgage Status in Clackamas County
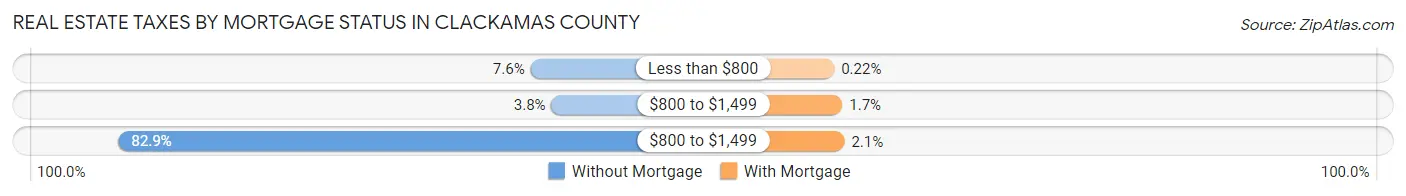
| Property Taxes | Without Mortgage | With Mortgage |
| Less than $800 | 2,686 (7.6%) | 173 (0.2%) |
| $800 to $1,499 | 1,335 (3.8%) | 1,348 (1.7%) |
| $800 to $1,499 | 29,266 (82.9%) | 1,655 (2.1%) |
| Total | 35,321 (100.0%) | 79,131 (100.0%) |
Health & Disability in Clackamas County
Health Insurance Coverage by Age in Clackamas County
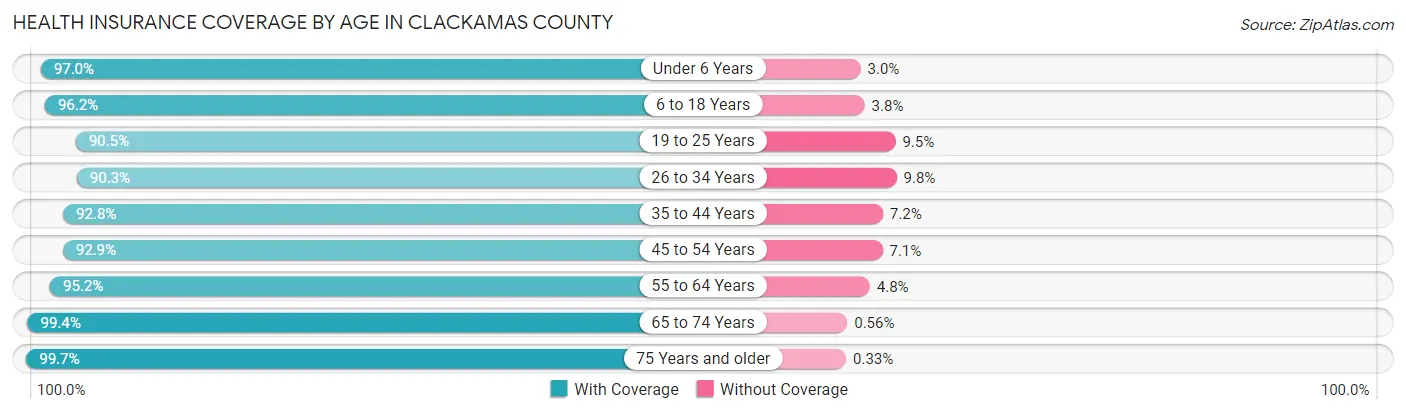
| Age Bracket | With Coverage | Without Coverage |
| Under 6 Years | 25,095 (97.0%) | 788 (3.0%) |
| 6 to 18 Years | 64,661 (96.2%) | 2,556 (3.8%) |
| 19 to 25 Years | 28,521 (90.5%) | 3,009 (9.5%) |
| 26 to 34 Years | 41,908 (90.2%) | 4,529 (9.8%) |
| 35 to 44 Years | 53,453 (92.8%) | 4,147 (7.2%) |
| 45 to 54 Years | 51,179 (92.9%) | 3,932 (7.1%) |
| 55 to 64 Years | 53,821 (95.2%) | 2,687 (4.8%) |
| 65 to 74 Years | 47,540 (99.4%) | 269 (0.6%) |
| 75 Years and older | 30,717 (99.7%) | 103 (0.3%) |
| Total | 396,895 (94.7%) | 22,020 (5.3%) |
Health Insurance Coverage by Citizenship Status in Clackamas County
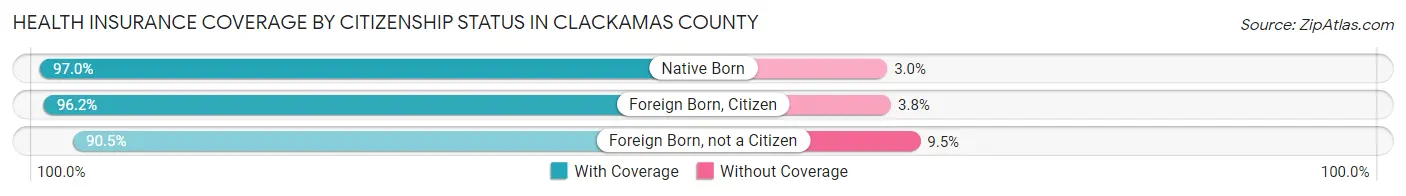
| Citizenship Status | With Coverage | Without Coverage |
| Native Born | 25,095 (97.0%) | 788 (3.0%) |
| Foreign Born, Citizen | 64,661 (96.2%) | 2,556 (3.8%) |
| Foreign Born, not a Citizen | 28,521 (90.5%) | 3,009 (9.5%) |
Health Insurance Coverage by Household Income in Clackamas County
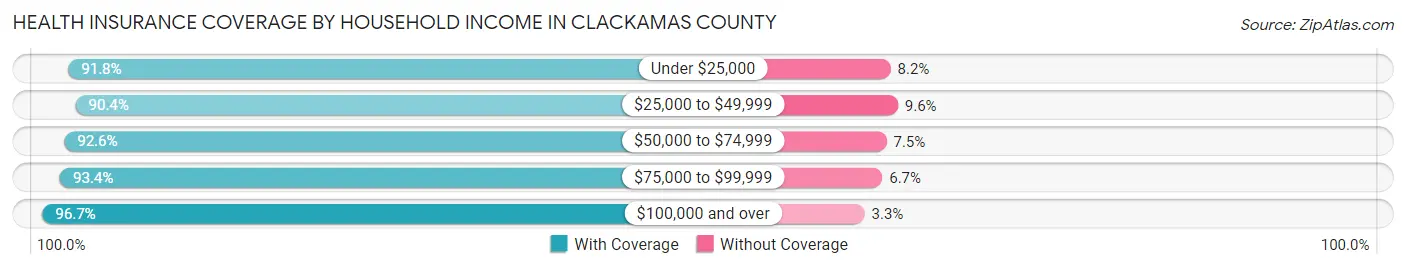
| Household Income | With Coverage | Without Coverage |
| Under $25,000 | 24,242 (91.8%) | 2,169 (8.2%) |
| $25,000 to $49,999 | 39,433 (90.4%) | 4,168 (9.6%) |
| $50,000 to $74,999 | 48,914 (92.5%) | 3,940 (7.4%) |
| $75,000 to $99,999 | 49,446 (93.3%) | 3,525 (6.7%) |
| $100,000 and over | 232,926 (96.7%) | 8,061 (3.3%) |
Public vs Private Health Insurance Coverage by Age in Clackamas County
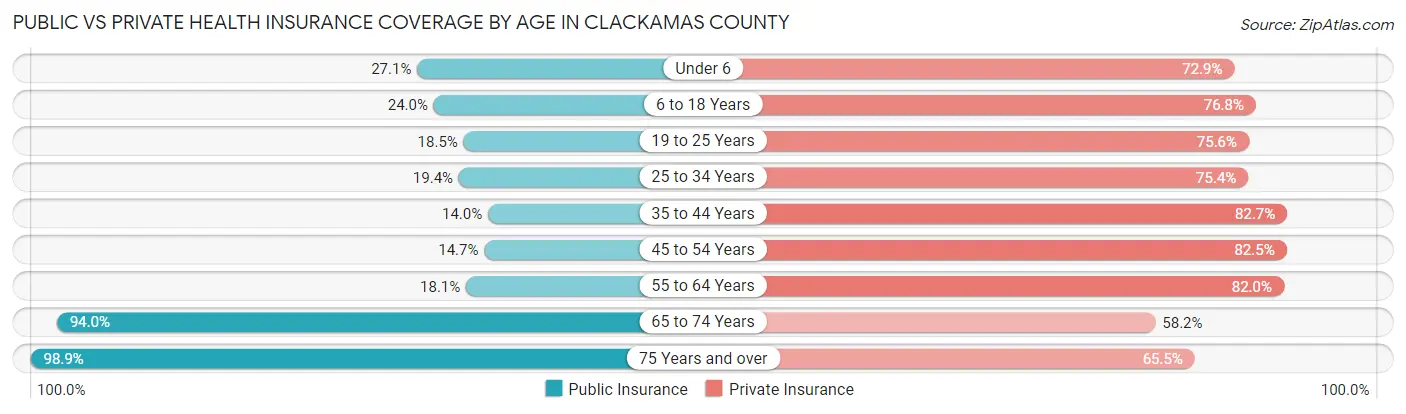
| Age Bracket | Public Insurance | Private Insurance |
| Under 6 | 7,020 (27.1%) | 18,859 (72.9%) |
| 6 to 18 Years | 16,162 (24.0%) | 51,651 (76.8%) |
| 19 to 25 Years | 5,833 (18.5%) | 23,822 (75.5%) |
| 25 to 34 Years | 9,002 (19.4%) | 35,021 (75.4%) |
| 35 to 44 Years | 8,052 (14.0%) | 47,607 (82.7%) |
| 45 to 54 Years | 8,087 (14.7%) | 45,482 (82.5%) |
| 55 to 64 Years | 10,198 (18.0%) | 46,353 (82.0%) |
| 65 to 74 Years | 44,960 (94.0%) | 27,826 (58.2%) |
| 75 Years and over | 30,483 (98.9%) | 20,186 (65.5%) |
| Total | 139,797 (33.4%) | 316,807 (75.6%) |
Disability Status by Sex by Age in Clackamas County
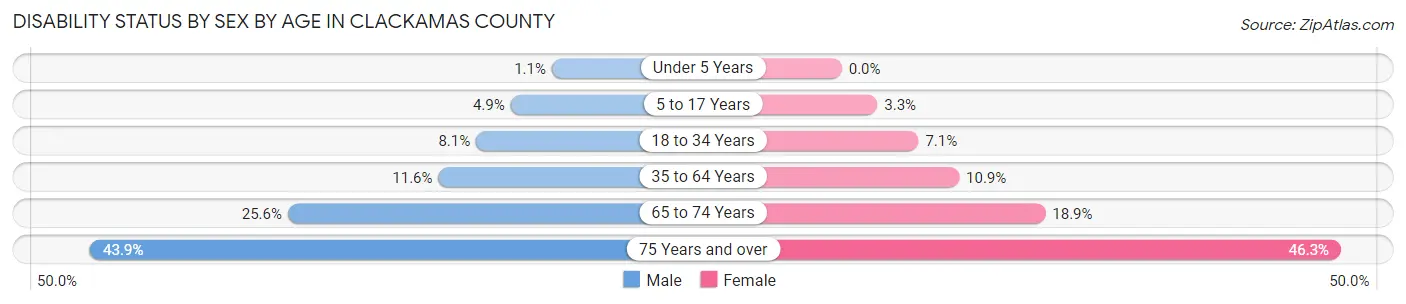
| Age Bracket | Male | Female |
| Under 5 Years | 116 (1.1%) | 0 (0.0%) |
| 5 to 17 Years | 1,702 (4.9%) | 1,082 (3.3%) |
| 18 to 34 Years | 3,421 (8.1%) | 2,860 (7.1%) |
| 35 to 64 Years | 9,815 (11.6%) | 9,215 (10.9%) |
| 65 to 74 Years | 5,810 (25.6%) | 4,739 (18.9%) |
| 75 Years and over | 5,793 (43.9%) | 8,167 (46.3%) |
Disability Class by Sex by Age in Clackamas County
Disability Class: Hearing Difficulty
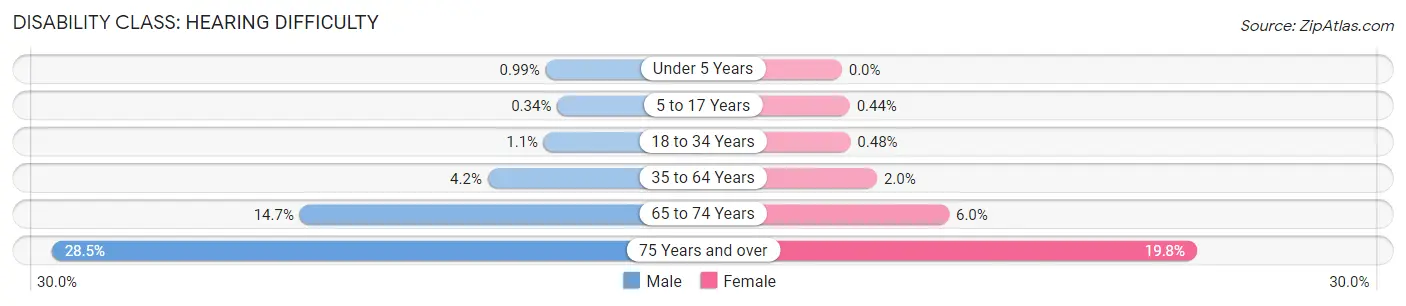
| Age Bracket | Male | Female |
| Under 5 Years | 107 (1.0%) | 0 (0.0%) |
| 5 to 17 Years | 117 (0.3%) | 145 (0.4%) |
| 18 to 34 Years | 454 (1.1%) | 192 (0.5%) |
| 35 to 64 Years | 3,560 (4.2%) | 1,656 (2.0%) |
| 65 to 74 Years | 3,334 (14.7%) | 1,497 (6.0%) |
| 75 Years and over | 3,758 (28.5%) | 3,486 (19.8%) |
Disability Class: Vision Difficulty
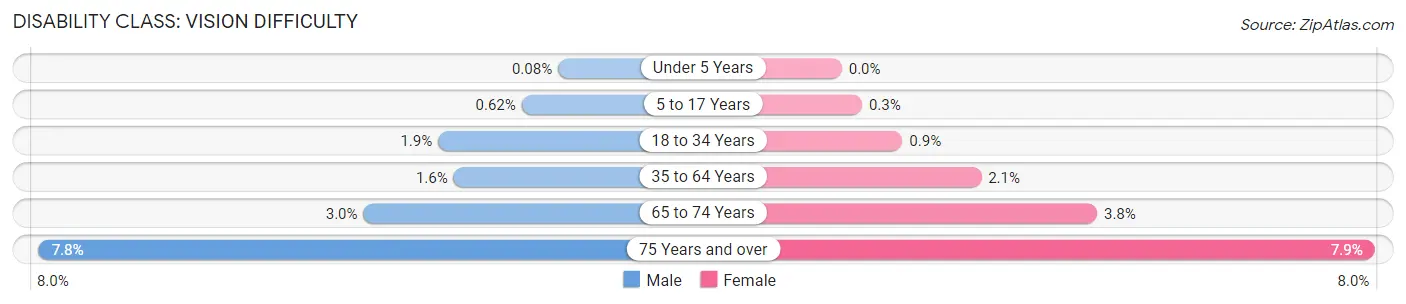
| Age Bracket | Male | Female |
| Under 5 Years | 9 (0.1%) | 0 (0.0%) |
| 5 to 17 Years | 216 (0.6%) | 98 (0.3%) |
| 18 to 34 Years | 786 (1.9%) | 361 (0.9%) |
| 35 to 64 Years | 1,383 (1.6%) | 1,754 (2.1%) |
| 65 to 74 Years | 674 (3.0%) | 952 (3.8%) |
| 75 Years and over | 1,028 (7.8%) | 1,395 (7.9%) |
Disability Class: Cognitive Difficulty
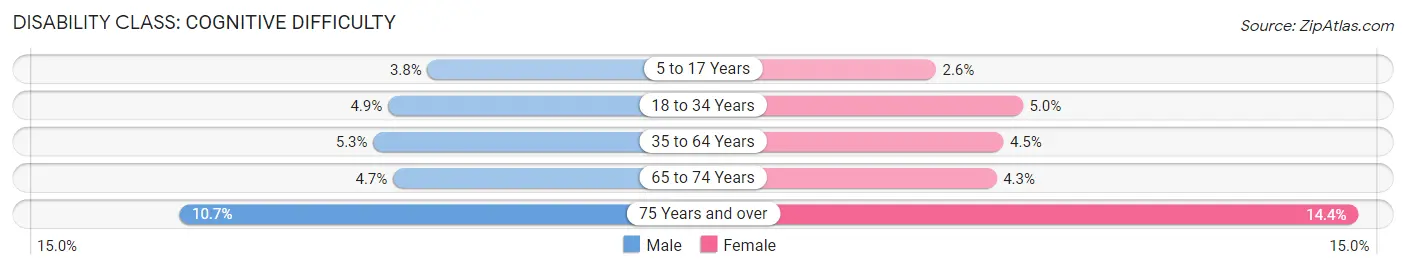
| Age Bracket | Male | Female |
| 5 to 17 Years | 1,314 (3.8%) | 856 (2.6%) |
| 18 to 34 Years | 2,060 (4.9%) | 2,022 (5.0%) |
| 35 to 64 Years | 4,473 (5.3%) | 3,795 (4.5%) |
| 65 to 74 Years | 1,076 (4.7%) | 1,079 (4.3%) |
| 75 Years and over | 1,411 (10.7%) | 2,535 (14.4%) |
Disability Class: Ambulatory Difficulty
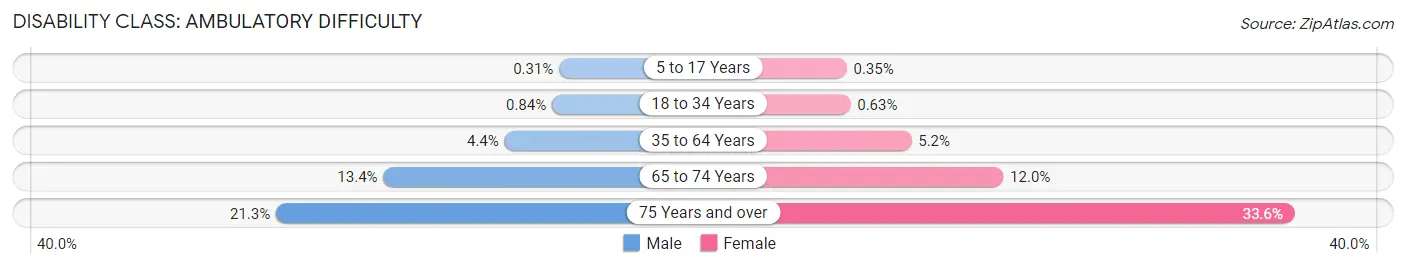
| Age Bracket | Male | Female |
| 5 to 17 Years | 107 (0.3%) | 114 (0.4%) |
| 18 to 34 Years | 353 (0.8%) | 255 (0.6%) |
| 35 to 64 Years | 3,693 (4.4%) | 4,367 (5.2%) |
| 65 to 74 Years | 3,035 (13.4%) | 3,006 (12.0%) |
| 75 Years and over | 2,813 (21.3%) | 5,929 (33.6%) |
Disability Class: Self-Care Difficulty
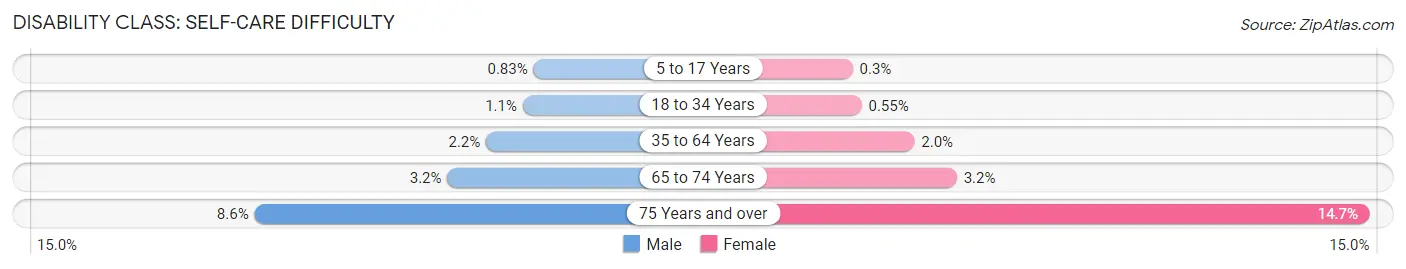
| Age Bracket | Male | Female |
| 5 to 17 Years | 289 (0.8%) | 98 (0.3%) |
| 18 to 34 Years | 476 (1.1%) | 222 (0.5%) |
| 35 to 64 Years | 1,822 (2.1%) | 1,706 (2.0%) |
| 65 to 74 Years | 734 (3.2%) | 802 (3.2%) |
| 75 Years and over | 1,134 (8.6%) | 2,592 (14.7%) |
Technology Access in Clackamas County
Computing Device Access in Clackamas County
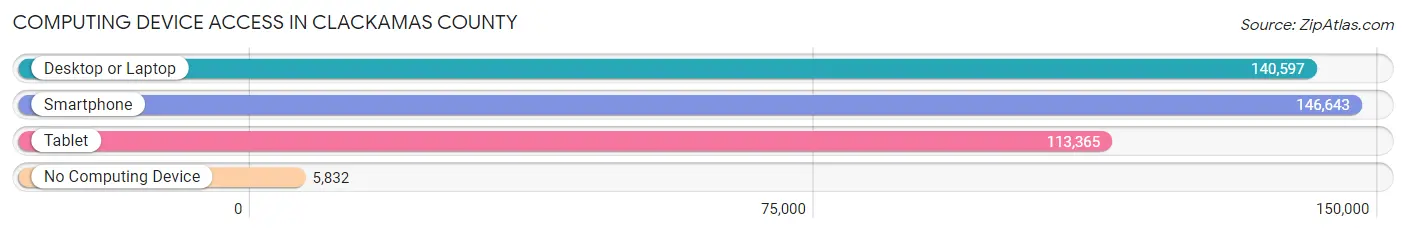
| Device Type | # Households | % Households |
| Desktop or Laptop | 140,597 | 87.3% |
| Smartphone | 146,643 | 91.1% |
| Tablet | 113,365 | 70.4% |
| No Computing Device | 5,832 | 3.6% |
| Total | 160,984 | 100.0% |
Internet Access in Clackamas County
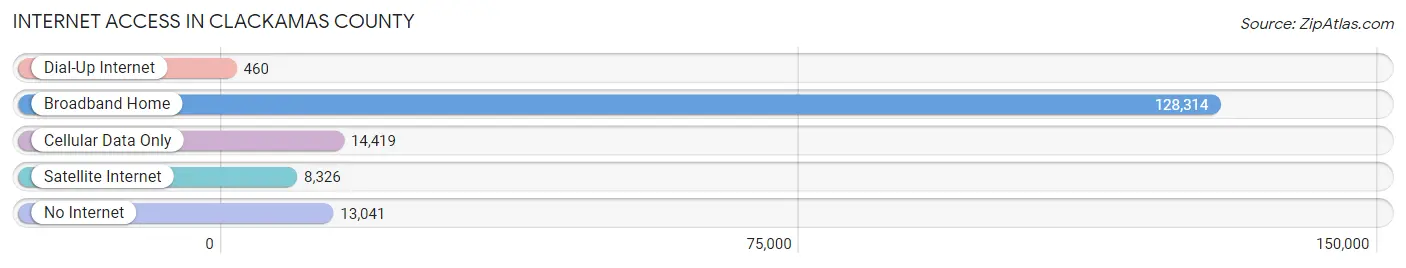
| Internet Type | # Households | % Households |
| Dial-Up Internet | 460 | 0.3% |
| Broadband Home | 128,314 | 79.7% |
| Cellular Data Only | 14,419 | 9.0% |
| Satellite Internet | 8,326 | 5.2% |
| No Internet | 13,041 | 8.1% |
| Total | 160,984 | 100.0% |
Clackamas County Summary
Clackamas County, Oregon is located in the northern part of the state, just south of Portland. It is bordered by Multnomah County to the north, Washington County to the west, Marion County to the south, and Hood River County to the east. The county seat is Oregon City, and the largest city is Happy Valley. The county covers an area of 1,879 square miles and has a population of 411,717 as of 2019.
History
Clackamas County was created in 1843 and was originally part of the Oregon Territory. It was named after the Clackamas Indians, who were the original inhabitants of the area. The county was originally part of the Oregon Trail, and many settlers passed through the area on their way to the Willamette Valley.
In the late 19th century, the county was home to several lumber mills and sawmills, which helped to fuel the local economy. The county also had a thriving agricultural industry, with many farms producing fruits, vegetables, and dairy products.
In the early 20th century, the county saw an influx of immigrants from Europe, particularly from Germany and Scandinavia. This influx of immigrants helped to shape the culture of the county, and many of their descendants still live in the area today.
Geography
Clackamas County is located in the northern part of the state, just south of Portland. It is bordered by Multnomah County to the north, Washington County to the west, Marion County to the south, and Hood River County to the east. The county covers an area of 1,879 square miles and has a population of 411,717 as of 2019.
The county is home to several mountain ranges, including the Cascade Range, the Coast Range, and the Oregon Coast Range. The highest point in the county is Mount Hood, which stands at 11,249 feet. The county also contains several rivers, including the Clackamas River, the Willamette River, and the Sandy River.
Economy
Clackamas County has a diverse economy, with a mix of manufacturing, retail, and service industries. The county is home to several large companies, including Intel, Nike, and Columbia Sportswear. The county also has a thriving agricultural industry, with many farms producing fruits, vegetables, and dairy products.
The county is also home to several tourist attractions, including the Oregon Zoo, the Oregon Trail Interpretive Center, and the End of the Oregon Trail Interpretive Center. These attractions draw visitors from all over the world and help to boost the local economy.
Demographics
As of 2019, Clackamas County had a population of 411,717. The population is made up of a diverse mix of ethnicities, including White (77.2%), Hispanic or Latino (10.2%), Asian (5.2%), African American (3.2%), and Native American (1.2%).
The median household income in the county is $68,845, and the median home value is $372,400. The unemployment rate is 4.2%, and the poverty rate is 8.7%.
Conclusion
Clackamas County, Oregon is a diverse and vibrant county located in the northern part of the state. It is home to a mix of ethnicities, a thriving economy, and a variety of tourist attractions. The county has a rich history and is home to many descendants of the original inhabitants, the Clackamas Indians. The county has a population of 411,717 and a median household income of $68,845.
Common Questions
What is the Total Population of Clackamas County?
Total Population of Clackamas County is 420,925.
What is the Total Male Population of Clackamas County?
Total Male Population of Clackamas County is 209,373.
What is the Total Female Population of Clackamas County?
Total Female Population of Clackamas County is 211,552.
What is the Ratio of Males per 100 Females in Clackamas County?
There are 98.97 Males per 100 Females in Clackamas County.
What is the Ratio of Females per 100 Males in Clackamas County?
There are 101.04 Females per 100 Males in Clackamas County.
What is the Median Population Age in Clackamas County?
Median Population Age in Clackamas County is 41.9 Years.
What is the Average Family Size in Clackamas County
Average Family Size in Clackamas County is 3.0 People.
What is the Average Household Size in Clackamas County
Average Household Size in Clackamas County is 2.6 People.
What is Per Capita Income in Clackamas County?
Per Capita income in Clackamas County is $49,340.
What is the Median Family Income in Clackamas County?
Median Family Income in Clackamas County is $114,385.
What is the Median Household income in Clackamas County?
Median Household Income in Clackamas County is $95,740.
What is Income or Wage Gap in Clackamas County?
Income or Wage Gap in Clackamas County is 31.3%.
Women in Clackamas County earn 68.7 cents for every dollar earned by a man.
What is Family Income Deficit in Clackamas County?
Family Income Deficit in Clackamas County is $10,474.
Families that are below poverty line in Clackamas County earn $10,474 less on average than the poverty threshold level.
What is Inequality or Gini Index in Clackamas County?
Inequality or Gini Index in Clackamas County is 0.45.
How Large is the Labor Force in Clackamas County?
There are 217,549 People in the Labor Forcein in Clackamas County.
What is the Percentage of People in the Labor Force in Clackamas County?
63.4% of People are in the Labor Force in Clackamas County.
What is the Unemployment Rate in Clackamas County?
Unemployment Rate in Clackamas County is 5.0%.