Benton County, OR
Benton County Map
Benton County Overview
95,615
TOTAL POPULATION
48,293
MALE POPULATION
47,322
FEMALE POPULATION
102.05
MALES / 100 FEMALES
97.99
FEMALES / 100 MALES
33.5
MEDIAN AGE
2.8
AVG FAMILY SIZE
2.4
AVG HOUSEHOLD SIZE
$39,940
PER CAPITA INCOME
$106,149
AVG FAMILY INCOME
$72,882
AVG HOUSEHOLD INCOME
27.0%
WAGE / INCOME GAP [ % ]
73.0¢/ $1
WAGE / INCOME GAP [ $ ]
$11,926
FAMILY INCOME DEFICIT
0.47
INEQUALITY / GINI INDEX
49,986
LABOR FORCE [ PEOPLE ]
60.5%
PERCENT IN LABOR FORCE
6.8%
UNEMPLOYMENT RATE
Benton County Area Codes
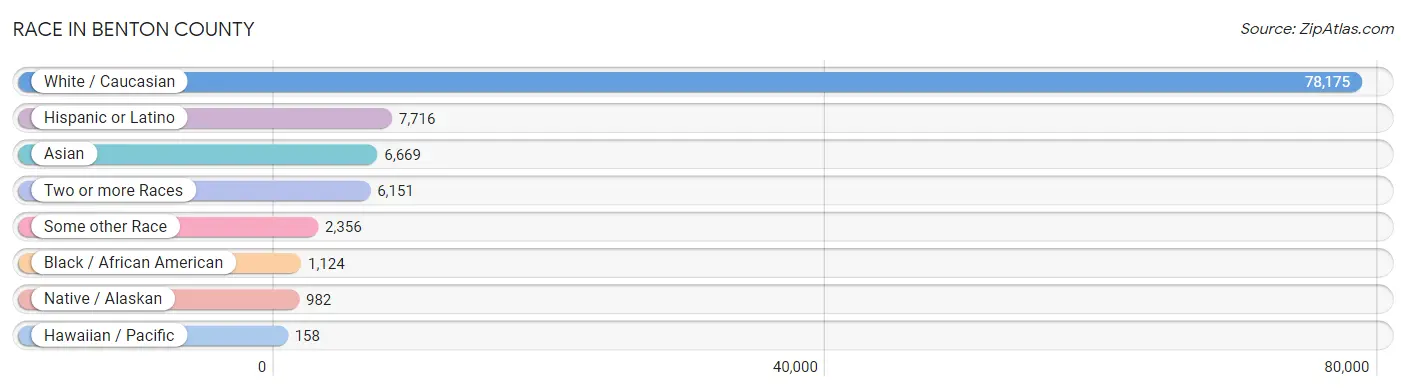
Race in Benton County
The most populous races in Benton County are White / Caucasian (78,175 | 81.8%), Hispanic or Latino (7,716 | 8.1%), and Asian (6,669 | 7.0%).
| Race | # Population | % Population |
| Asian | 6,669 | 7.0% |
| Black / African American | 1,124 | 1.2% |
| Hawaiian / Pacific | 158 | 0.2% |
| Hispanic or Latino | 7,716 | 8.1% |
| Native / Alaskan | 982 | 1.0% |
| White / Caucasian | 78,175 | 81.8% |
| Two or more Races | 6,151 | 6.4% |
| Some other Race | 2,356 | 2.5% |
| Total | 95,615 | 100.0% |
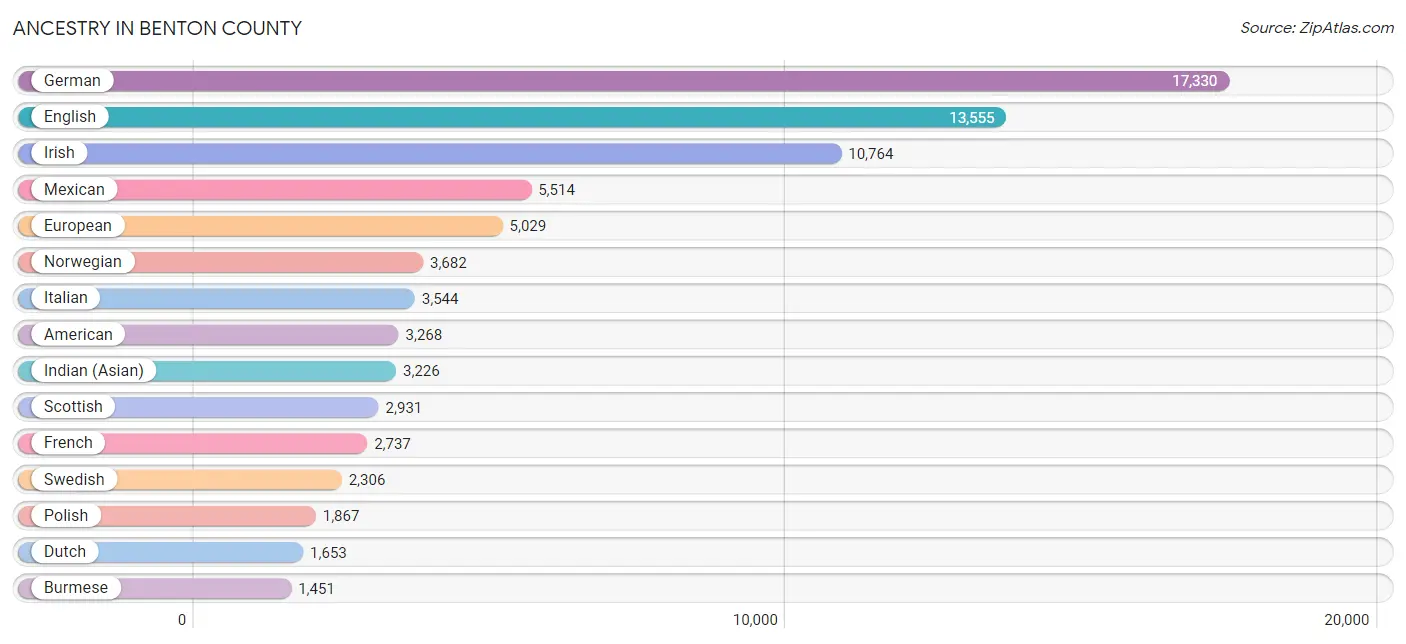
Ancestry in Benton County
The most populous ancestries reported in Benton County are German (17,330 | 18.1%), English (13,555 | 14.2%), Irish (10,764 | 11.3%), Mexican (5,514 | 5.8%), and European (5,029 | 5.3%), together accounting for 54.6% of all Benton County residents.
| Ancestry | # Population | % Population |
| African | 345 | 0.4% |
| Alaskan Athabascan | 38 | 0.0% |
| Albanian | 18 | 0.0% |
| American | 3,268 | 3.4% |
| Apache | 28 | 0.0% |
| Arab | 572 | 0.6% |
| Argentinean | 197 | 0.2% |
| Armenian | 241 | 0.3% |
| Australian | 79 | 0.1% |
| Austrian | 208 | 0.2% |
| Bangladeshi | 20 | 0.0% |
| Basque | 54 | 0.1% |
| Belgian | 225 | 0.2% |
| Bhutanese | 994 | 1.0% |
| Blackfeet | 68 | 0.1% |
| Brazilian | 163 | 0.2% |
| British | 1,255 | 1.3% |
| Bulgarian | 13 | 0.0% |
| Burmese | 1,451 | 1.5% |
| Canadian | 369 | 0.4% |
| Celtic | 14 | 0.0% |
| Central American | 276 | 0.3% |
| Central American Indian | 161 | 0.2% |
| Cherokee | 414 | 0.4% |
| Cheyenne | 42 | 0.0% |
| Chickasaw | 23 | 0.0% |
| Chilean | 177 | 0.2% |
| Chippewa | 36 | 0.0% |
| Choctaw | 162 | 0.2% |
| Colombian | 74 | 0.1% |
| Colville | 24 | 0.0% |
| Creek | 40 | 0.0% |
| Croatian | 154 | 0.2% |
| Cuban | 111 | 0.1% |
| Czech | 416 | 0.4% |
| Czechoslovakian | 142 | 0.2% |
| Danish | 1,173 | 1.2% |
| Dominican | 42 | 0.0% |
| Dutch | 1,653 | 1.7% |
| Eastern European | 360 | 0.4% |
| Ecuadorian | 44 | 0.1% |
| Egyptian | 42 | 0.0% |
| English | 13,555 | 14.2% |
| Estonian | 50 | 0.1% |
| Ethiopian | 9 | 0.0% |
| European | 5,029 | 5.3% |
| Fijian | 28 | 0.0% |
| Filipino | 28 | 0.0% |
| Finnish | 502 | 0.5% |
| French | 2,737 | 2.9% |
| French American Indian | 57 | 0.1% |
| French Canadian | 577 | 0.6% |
| German | 17,330 | 18.1% |
| German Russian | 10 | 0.0% |
| Greek | 393 | 0.4% |
| Guamanian / Chamorro | 131 | 0.1% |
| Guatemalan | 170 | 0.2% |
| Honduran | 5 | 0.0% |
| Hungarian | 276 | 0.3% |
| Icelander | 22 | 0.0% |
| Indian (Asian) | 3,226 | 3.4% |
| Indonesian | 18 | 0.0% |
| Inupiat | 65 | 0.1% |
| Iranian | 85 | 0.1% |
| Irish | 10,764 | 11.3% |
| Iroquois | 73 | 0.1% |
| Israeli | 64 | 0.1% |
| Italian | 3,544 | 3.7% |
| Jamaican | 8 | 0.0% |
| Japanese | 38 | 0.0% |
| Jordanian | 69 | 0.1% |
| Kiowa | 7 | 0.0% |
| Korean | 1,023 | 1.1% |
| Laotian | 121 | 0.1% |
| Latvian | 34 | 0.0% |
| Lebanese | 116 | 0.1% |
| Lithuanian | 279 | 0.3% |
| Luxembourger | 56 | 0.1% |
| Maltese | 15 | 0.0% |
| Mexican | 5,514 | 5.8% |
| Mexican American Indian | 554 | 0.6% |
| Native Hawaiian | 271 | 0.3% |
| Navajo | 16 | 0.0% |
| New Zealander | 18 | 0.0% |
| Nicaraguan | 18 | 0.0% |
| Northern European | 922 | 1.0% |
| Norwegian | 3,682 | 3.8% |
| Okinawan | 13 | 0.0% |
| Osage | 34 | 0.0% |
| Pakistani | 256 | 0.3% |
| Palestinian | 69 | 0.1% |
| Panamanian | 34 | 0.0% |
| Pennsylvania German | 30 | 0.0% |
| Peruvian | 246 | 0.3% |
| Polish | 1,867 | 1.9% |
| Portuguese | 300 | 0.3% |
| Potawatomi | 7 | 0.0% |
| Puerto Rican | 391 | 0.4% |
| Romanian | 137 | 0.1% |
| Russian | 952 | 1.0% |
| Salvadoran | 49 | 0.1% |
| Samoan | 144 | 0.2% |
| Scandinavian | 865 | 0.9% |
| Scotch-Irish | 1,273 | 1.3% |
| Scottish | 2,931 | 3.1% |
| Serbian | 44 | 0.1% |
| Shoshone | 33 | 0.0% |
| Sioux | 22 | 0.0% |
| Slavic | 74 | 0.1% |
| Slovak | 183 | 0.2% |
| South American | 755 | 0.8% |
| Spaniard | 380 | 0.4% |
| Spanish | 76 | 0.1% |
| Sri Lankan | 603 | 0.6% |
| Subsaharan African | 366 | 0.4% |
| Swedish | 2,306 | 2.4% |
| Swiss | 958 | 1.0% |
| Syrian | 27 | 0.0% |
| Thai | 819 | 0.9% |
| Tlingit-Haida | 19 | 0.0% |
| Turkish | 132 | 0.1% |
| Ukrainian | 392 | 0.4% |
| Uruguayan | 3 | 0.0% |
| Venezuelan | 5 | 0.0% |
| Welsh | 1,147 | 1.2% |
| West Indian | 16 | 0.0% |
| Yakama | 19 | 0.0% |
| Yaqui | 15 | 0.0% |
| Yugoslavian | 16 | 0.0% |
| Yup'ik | 25 | 0.0% | View All 130 Rows |
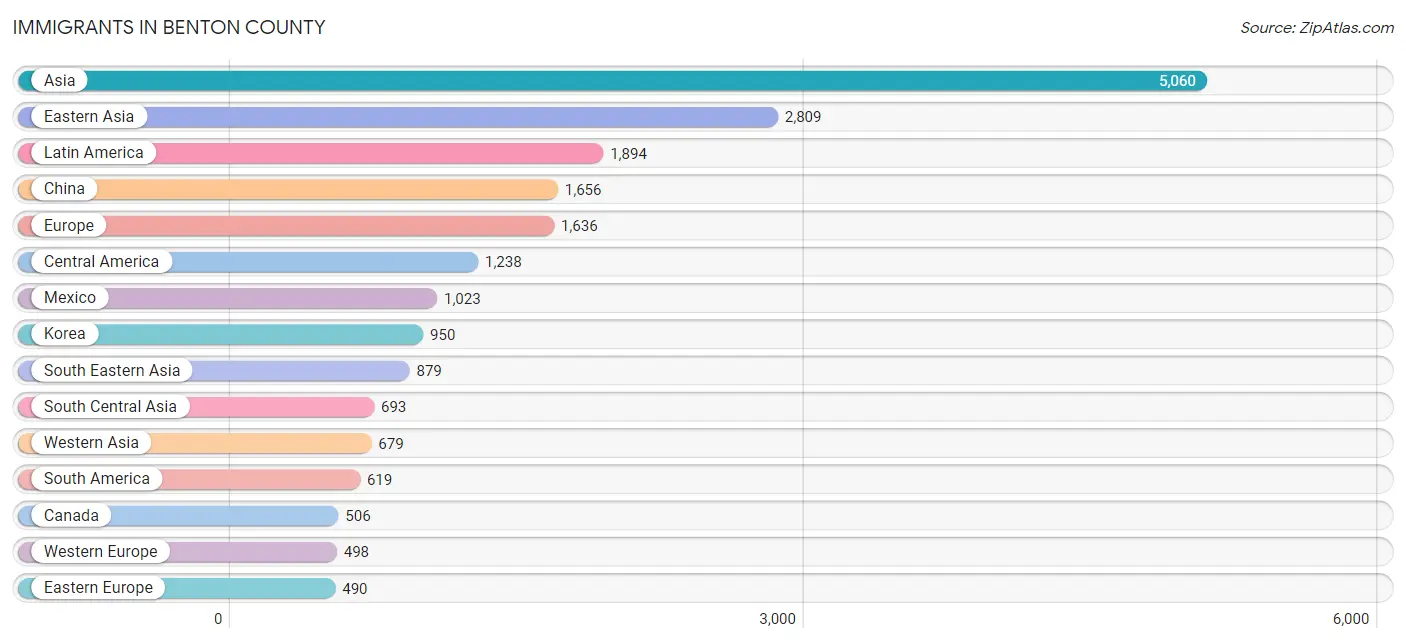
Immigrants in Benton County
The most numerous immigrant groups reported in Benton County came from Asia (5,060 | 5.3%), Eastern Asia (2,809 | 2.9%), Latin America (1,894 | 2.0%), China (1,656 | 1.7%), and Europe (1,636 | 1.7%), together accounting for 13.6% of all Benton County residents.
| Immigration Origin | # Population | % Population |
| Africa | 322 | 0.3% |
| Albania | 9 | 0.0% |
| Argentina | 93 | 0.1% |
| Asia | 5,060 | 5.3% |
| Australia | 58 | 0.1% |
| Belarus | 14 | 0.0% |
| Belize | 100 | 0.1% |
| Bosnia and Herzegovina | 17 | 0.0% |
| Brazil | 47 | 0.1% |
| Cambodia | 17 | 0.0% |
| Canada | 506 | 0.5% |
| Caribbean | 37 | 0.0% |
| Central America | 1,238 | 1.3% |
| Chile | 96 | 0.1% |
| China | 1,656 | 1.7% |
| Colombia | 44 | 0.1% |
| Cuba | 27 | 0.0% |
| Czechoslovakia | 20 | 0.0% |
| Denmark | 29 | 0.0% |
| Dominican Republic | 10 | 0.0% |
| Eastern Africa | 108 | 0.1% |
| Eastern Asia | 2,809 | 2.9% |
| Eastern Europe | 490 | 0.5% |
| Ecuador | 40 | 0.0% |
| Egypt | 28 | 0.0% |
| El Salvador | 5 | 0.0% |
| England | 110 | 0.1% |
| Ethiopia | 96 | 0.1% |
| Europe | 1,636 | 1.7% |
| France | 168 | 0.2% |
| Germany | 113 | 0.1% |
| Guatemala | 71 | 0.1% |
| Hong Kong | 63 | 0.1% |
| India | 359 | 0.4% |
| Indonesia | 48 | 0.1% |
| Iran | 71 | 0.1% |
| Iraq | 84 | 0.1% |
| Ireland | 10 | 0.0% |
| Israel | 77 | 0.1% |
| Italy | 229 | 0.2% |
| Japan | 203 | 0.2% |
| Jordan | 38 | 0.0% |
| Kazakhstan | 170 | 0.2% |
| Korea | 950 | 1.0% |
| Kuwait | 160 | 0.2% |
| Latin America | 1,894 | 2.0% |
| Latvia | 17 | 0.0% |
| Lebanon | 11 | 0.0% |
| Malaysia | 104 | 0.1% |
| Mexico | 1,023 | 1.1% |
| Moldova | 23 | 0.0% |
| Morocco | 48 | 0.1% |
| Nepal | 17 | 0.0% |
| Netherlands | 46 | 0.1% |
| Nicaragua | 6 | 0.0% |
| Nigeria | 14 | 0.0% |
| Northern Africa | 146 | 0.2% |
| Northern Europe | 335 | 0.4% |
| Oceania | 115 | 0.1% |
| Panama | 33 | 0.0% |
| Peru | 269 | 0.3% |
| Philippines | 242 | 0.3% |
| Poland | 142 | 0.2% |
| Romania | 20 | 0.0% |
| Russia | 183 | 0.2% |
| Saudi Arabia | 117 | 0.1% |
| Scotland | 59 | 0.1% |
| Senegal | 14 | 0.0% |
| Singapore | 131 | 0.1% |
| South Africa | 31 | 0.0% |
| South America | 619 | 0.6% |
| South Central Asia | 693 | 0.7% |
| South Eastern Asia | 879 | 0.9% |
| Southern Europe | 313 | 0.3% |
| Spain | 84 | 0.1% |
| Sri Lanka | 29 | 0.0% |
| Sudan | 25 | 0.0% |
| Sweden | 32 | 0.0% |
| Switzerland | 171 | 0.2% |
| Taiwan | 248 | 0.3% |
| Thailand | 220 | 0.2% |
| Turkey | 35 | 0.0% |
| Ukraine | 34 | 0.0% |
| Uruguay | 30 | 0.0% |
| Uzbekistan | 47 | 0.1% |
| Vietnam | 117 | 0.1% |
| Western Africa | 28 | 0.0% |
| Western Asia | 679 | 0.7% |
| Western Europe | 498 | 0.5% |
| Yemen | 1 | 0.0% | View All 90 Rows |
Sex and Age in Benton County
Sex and Age in Benton County
The most populous age groups in Benton County are 20 to 24 Years (8,593 | 17.8%) for men and 20 to 24 Years (7,069 | 14.9%) for women.
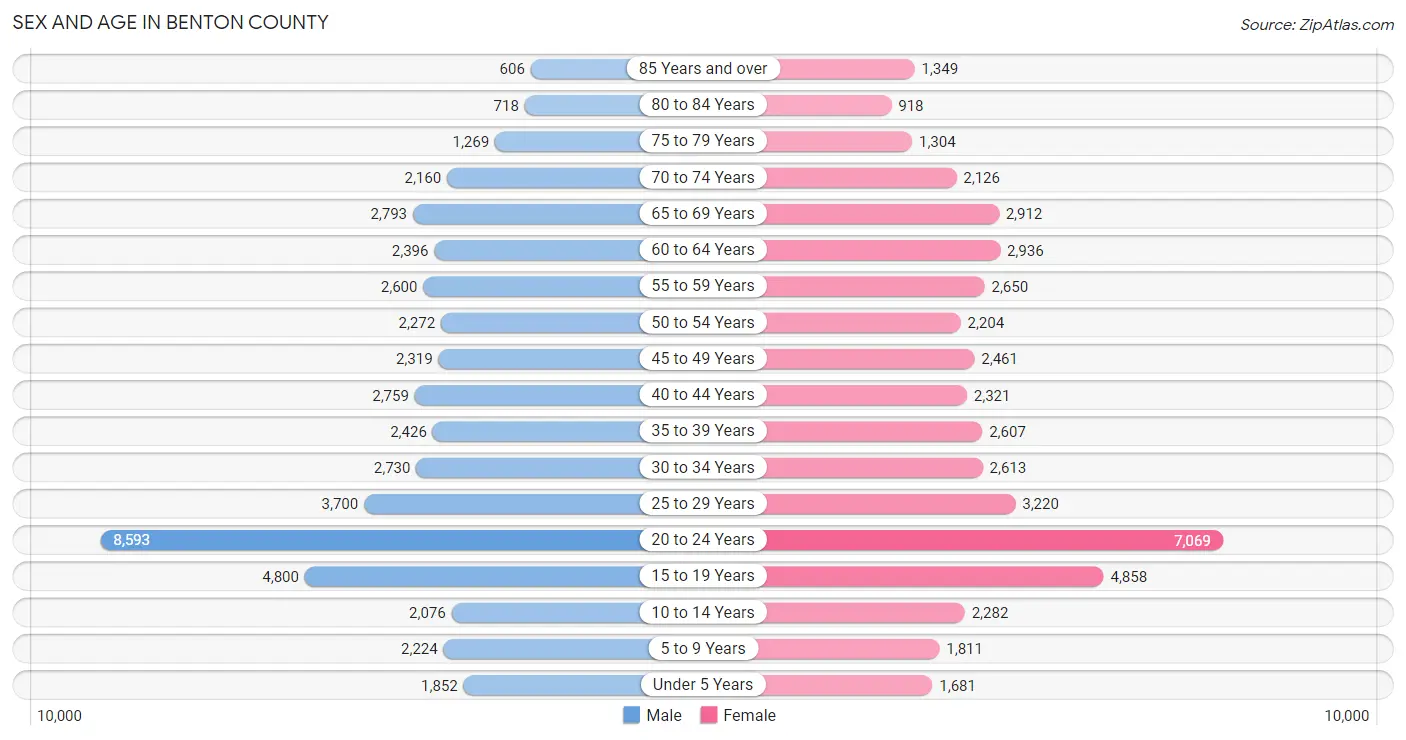
| Age Bracket | Male | Female |
| Under 5 Years | 1,852 (3.8%) | 1,681 (3.5%) |
| 5 to 9 Years | 2,224 (4.6%) | 1,811 (3.8%) |
| 10 to 14 Years | 2,076 (4.3%) | 2,282 (4.8%) |
| 15 to 19 Years | 4,800 (9.9%) | 4,858 (10.3%) |
| 20 to 24 Years | 8,593 (17.8%) | 7,069 (14.9%) |
| 25 to 29 Years | 3,700 (7.7%) | 3,220 (6.8%) |
| 30 to 34 Years | 2,730 (5.7%) | 2,613 (5.5%) |
| 35 to 39 Years | 2,426 (5.0%) | 2,607 (5.5%) |
| 40 to 44 Years | 2,759 (5.7%) | 2,321 (4.9%) |
| 45 to 49 Years | 2,319 (4.8%) | 2,461 (5.2%) |
| 50 to 54 Years | 2,272 (4.7%) | 2,204 (4.7%) |
| 55 to 59 Years | 2,600 (5.4%) | 2,650 (5.6%) |
| 60 to 64 Years | 2,396 (5.0%) | 2,936 (6.2%) |
| 65 to 69 Years | 2,793 (5.8%) | 2,912 (6.1%) |
| 70 to 74 Years | 2,160 (4.5%) | 2,126 (4.5%) |
| 75 to 79 Years | 1,269 (2.6%) | 1,304 (2.8%) |
| 80 to 84 Years | 718 (1.5%) | 918 (1.9%) |
| 85 Years and over | 606 (1.3%) | 1,349 (2.9%) |
| Total | 48,293 (100.0%) | 47,322 (100.0%) |
Families and Households in Benton County
Median Family Size in Benton County
The median family size in Benton County is 2.84 persons per family, with married-couple families (16,704 | 78.7%) accounting for the largest median family size of 2.91 persons per family. On the other hand, single male/father families (1,561 | 7.4%) represent the smallest median family size with 2.43 persons per family.
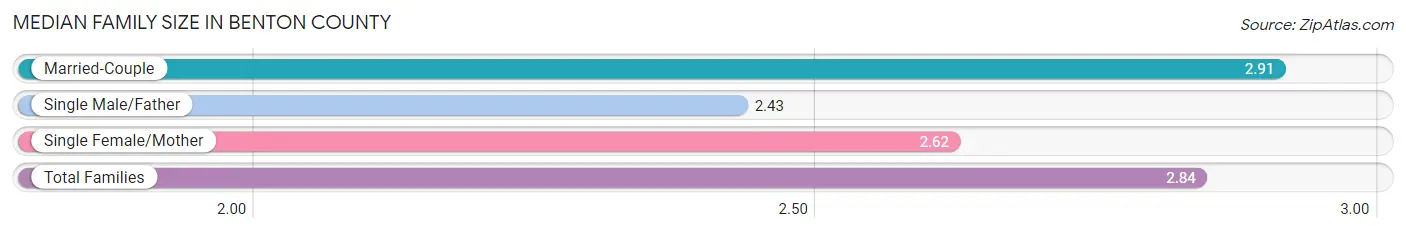
| Family Type | # Families | Family Size |
| Married-Couple | 16,704 (78.7%) | 2.91 |
| Single Male/Father | 1,561 (7.4%) | 2.43 |
| Single Female/Mother | 2,957 (13.9%) | 2.62 |
| Total Families | 21,222 (100.0%) | 2.84 |
Median Household Size in Benton County
The median household size in Benton County is 2.36 persons per household, with single female/mother households (2,957 | 7.8%) accounting for the largest median household size of 3.08 persons per household. non-family households (16,631 | 43.9%) represent the smallest median household size with 1.63 persons per household.
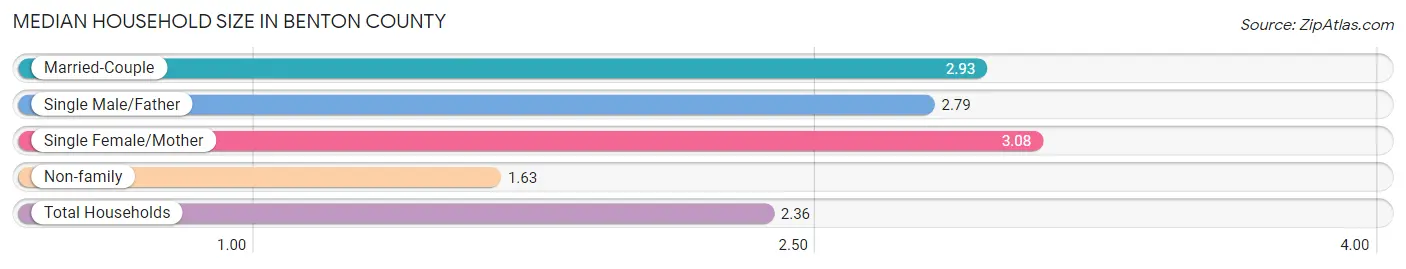
| Household Type | # Households | Household Size |
| Married-Couple | 16,704 (44.1%) | 2.93 |
| Single Male/Father | 1,561 (4.1%) | 2.79 |
| Single Female/Mother | 2,957 (7.8%) | 3.08 |
| Non-family | 16,631 (43.9%) | 1.63 |
| Total Households | 37,853 (100.0%) | 2.36 |
Household Size by Marriage Status in Benton County
Out of a total of 37,853 households in Benton County, 21,222 (56.1%) are family households, while 16,631 (43.9%) are nonfamily households. The most numerous type of family households are 2-person households, comprising 10,518, and the most common type of nonfamily households are 1-person households, comprising 10,438.
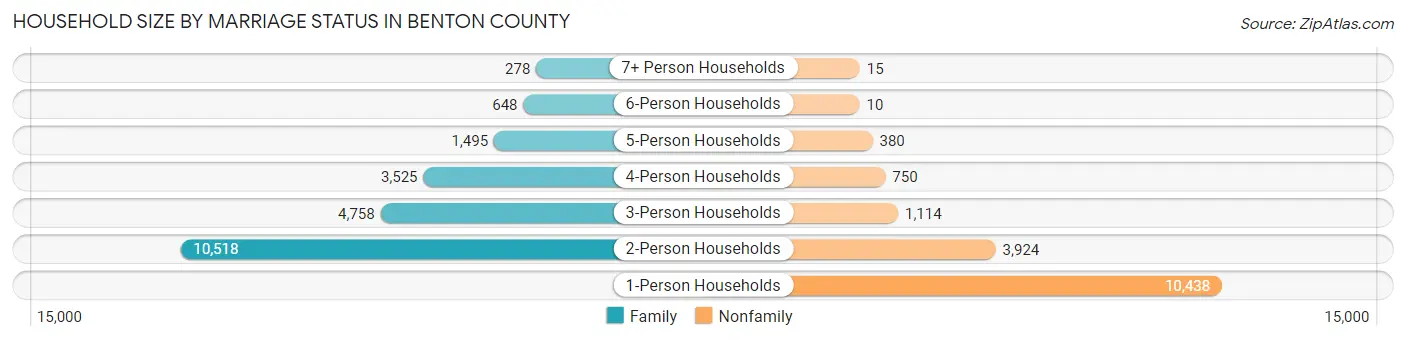
| Household Size | Family Households | Nonfamily Households |
| 1-Person Households | - | 10,438 (27.6%) |
| 2-Person Households | 10,518 (27.8%) | 3,924 (10.4%) |
| 3-Person Households | 4,758 (12.6%) | 1,114 (2.9%) |
| 4-Person Households | 3,525 (9.3%) | 750 (2.0%) |
| 5-Person Households | 1,495 (4.0%) | 380 (1.0%) |
| 6-Person Households | 648 (1.7%) | 10 (0.0%) |
| 7+ Person Households | 278 (0.7%) | 15 (0.0%) |
| Total | 21,222 (56.1%) | 16,631 (43.9%) |
Female Fertility in Benton County
Fertility by Age in Benton County
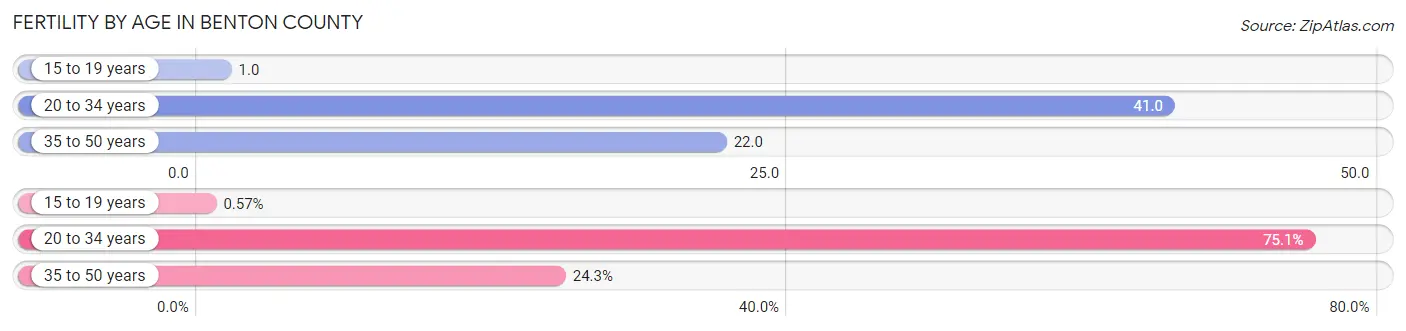
Average fertility rate in Benton County is 27.0 births per 1,000 women. Women in the age bracket of 20 to 34 years have the highest fertility rate with 41.0 births per 1,000 women. Women in the age bracket of 20 to 34 years acount for 75.1% of all women with births.
| Age Bracket | Women with Births | Births / 1,000 Women |
| 15 to 19 years | 4 (0.6%) | 1.0 |
| 20 to 34 years | 523 (75.1%) | 41.0 |
| 35 to 50 years | 169 (24.3%) | 22.0 |
| Total | 696 (100.0%) | 27.0 |
Fertility by Age by Marriage Status in Benton County
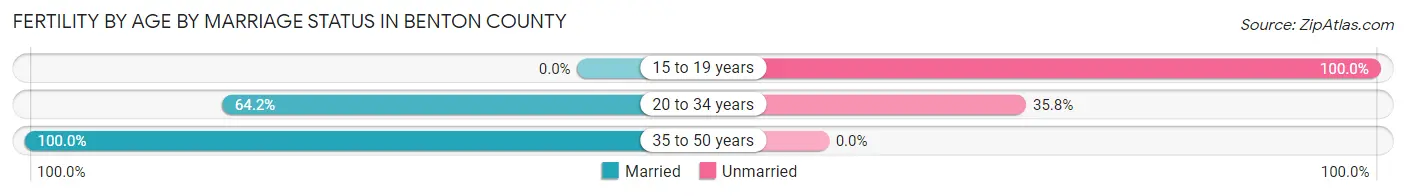
72.6% of women with births (696) in Benton County are married. The highest percentage of unmarried women with births falls into 15 to 19 years age bracket with 100.0% of them unmarried at the time of birth, while the lowest percentage of unmarried women with births belong to 35 to 50 years age bracket with 0.0% of them unmarried.
| Age Bracket | Married | Unmarried |
| 15 to 19 years | 0 (0.0%) | 4 (100.0%) |
| 20 to 34 years | 336 (64.2%) | 187 (35.8%) |
| 35 to 50 years | 169 (100.0%) | 0 (0.0%) |
| Total | 505 (72.6%) | 191 (27.4%) |
Fertility by Education in Benton County
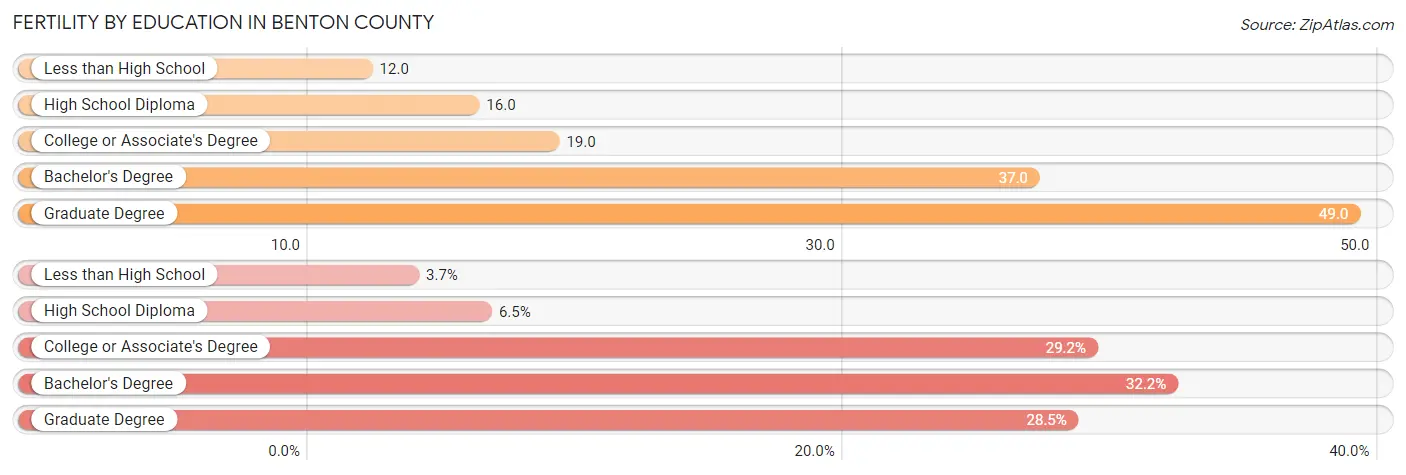
Average fertility rate in Benton County is 27.0 births per 1,000 women. Women with the education attainment of graduate degree have the highest fertility rate of 49.0 births per 1,000 women, while women with the education attainment of less than high school have the lowest fertility at 12.0 births per 1,000 women. Women with the education attainment of bachelor's degree represent 32.2% of all women with births.
| Educational Attainment | Women with Births | Births / 1,000 Women |
| Less than High School | 26 (3.7%) | 12.0 |
| High School Diploma | 45 (6.5%) | 16.0 |
| College or Associate's Degree | 203 (29.2%) | 19.0 |
| Bachelor's Degree | 224 (32.2%) | 37.0 |
| Graduate Degree | 198 (28.4%) | 49.0 |
| Total | 696 (100.0%) | 27.0 |
Fertility by Education by Marriage Status in Benton County
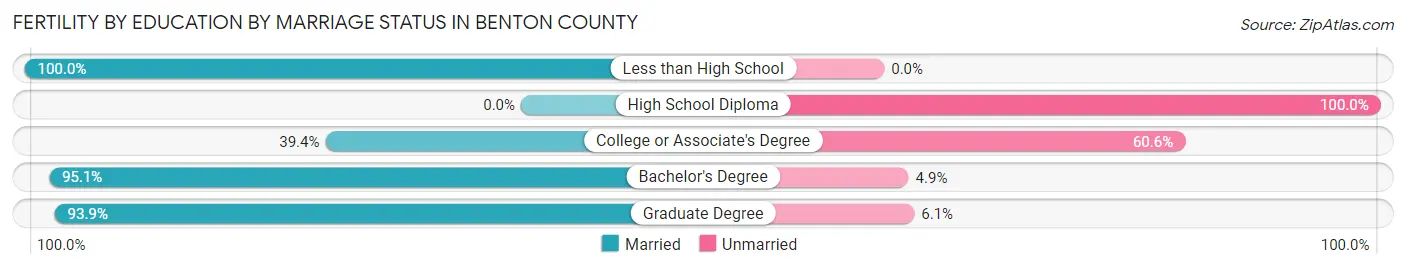
27.4% of women with births in Benton County are unmarried. Women with the educational attainment of less than high school are most likely to be married with 100.0% of them married at childbirth, while women with the educational attainment of high school diploma are least likely to be married with 100.0% of them unmarried at childbirth.
| Educational Attainment | Married | Unmarried |
| Less than High School | 26 (100.0%) | 0 (0.0%) |
| High School Diploma | 0 (0.0%) | 45 (100.0%) |
| College or Associate's Degree | 80 (39.4%) | 123 (60.6%) |
| Bachelor's Degree | 213 (95.1%) | 11 (4.9%) |
| Graduate Degree | 186 (93.9%) | 12 (6.1%) |
| Total | 505 (72.6%) | 191 (27.4%) |
Income in Benton County
Income Overview in Benton County
Per Capita Income in Benton County is $39,940, while median incomes of families and households are $106,149 and $72,882 respectively.
| Characteristic | Number | Measure |
| Per Capita Income | 95,615 | $39,940 |
| Median Family Income | 21,222 | $106,149 |
| Mean Family Income | 21,222 | $130,251 |
| Median Household Income | 37,853 | $72,882 |
| Mean Household Income | 37,853 | $97,953 |
| Income Deficit | 21,222 | $11,926 |
| Wage / Income Gap (%) | 95,615 | 26.99% |
| Wage / Income Gap ($) | 95,615 | 73.01¢ per $1 |
| Gini / Inequality Index | 95,615 | 0.47 |
Earnings by Sex in Benton County
Average Earnings in Benton County are $28,722, $32,974 for men and $24,074 for women, a difference of 27.0%.
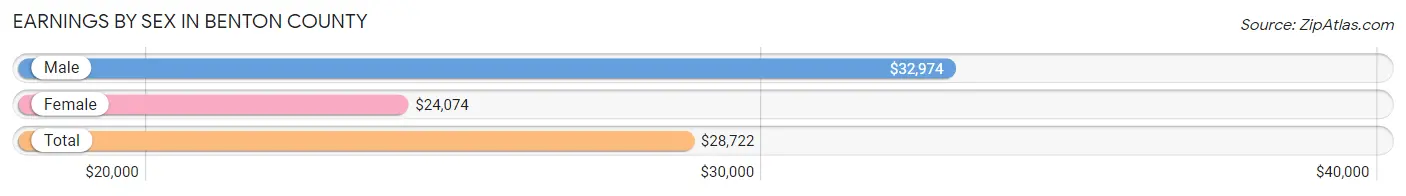
| Sex | Number | Average Earnings |
| Male | 30,158 (53.3%) | $32,974 |
| Female | 26,426 (46.7%) | $24,074 |
| Total | 56,584 (100.0%) | $28,722 |
Earnings by Sex by Income Bracket in Benton County
The most common earnings brackets in Benton County are $100,000+ for men (5,471 | 18.1%) and $2,499 or less for women (2,503 | 9.5%).
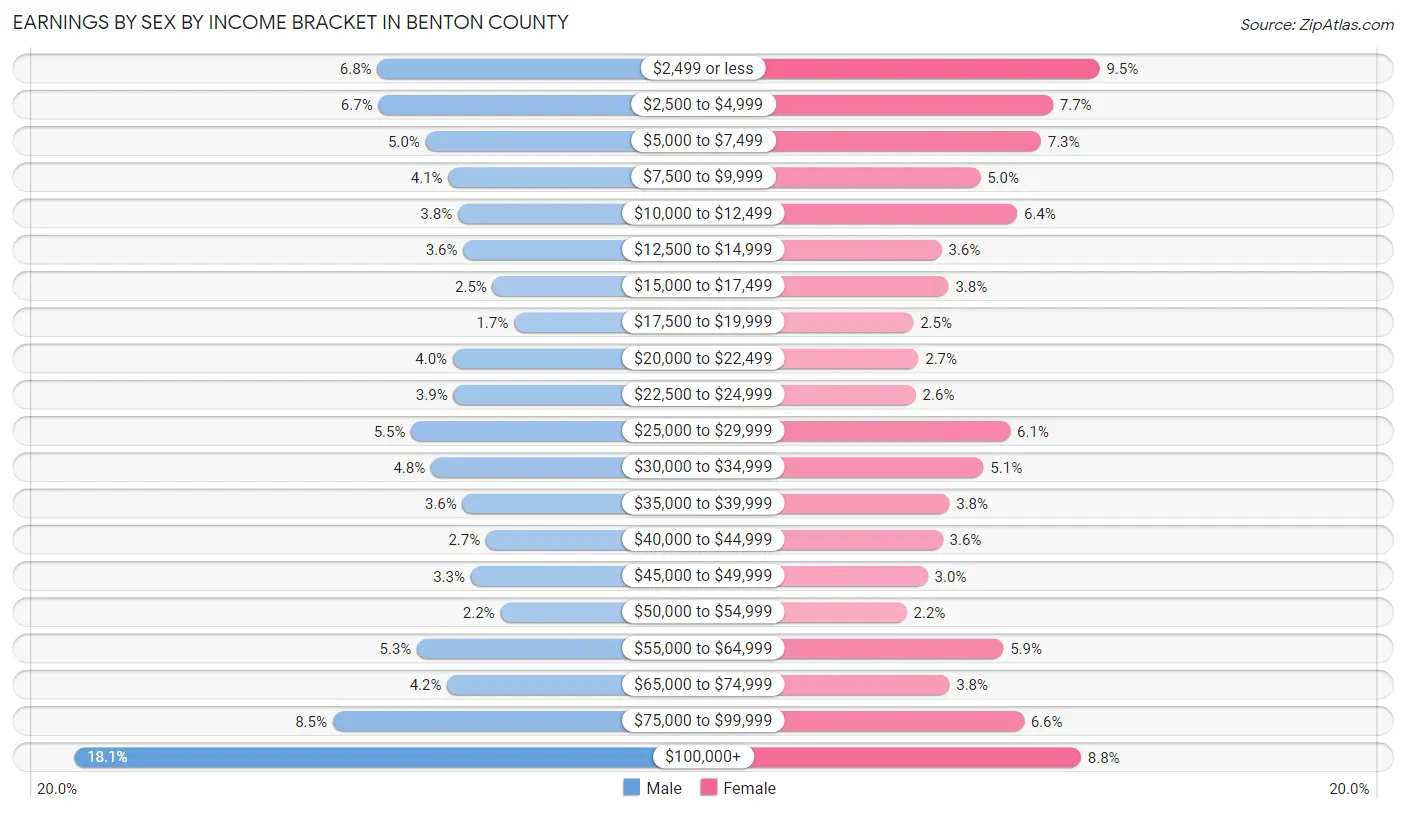
| Income | Male | Female |
| $2,499 or less | 2,046 (6.8%) | 2,503 (9.5%) |
| $2,500 to $4,999 | 2,033 (6.7%) | 2,040 (7.7%) |
| $5,000 to $7,499 | 1,498 (5.0%) | 1,922 (7.3%) |
| $7,500 to $9,999 | 1,243 (4.1%) | 1,320 (5.0%) |
| $10,000 to $12,499 | 1,133 (3.8%) | 1,685 (6.4%) |
| $12,500 to $14,999 | 1,075 (3.6%) | 938 (3.5%) |
| $15,000 to $17,499 | 742 (2.5%) | 1,007 (3.8%) |
| $17,500 to $19,999 | 501 (1.7%) | 659 (2.5%) |
| $20,000 to $22,499 | 1,190 (4.0%) | 709 (2.7%) |
| $22,500 to $24,999 | 1,184 (3.9%) | 683 (2.6%) |
| $25,000 to $29,999 | 1,662 (5.5%) | 1,616 (6.1%) |
| $30,000 to $34,999 | 1,438 (4.8%) | 1,354 (5.1%) |
| $35,000 to $39,999 | 1,083 (3.6%) | 1,014 (3.8%) |
| $40,000 to $44,999 | 818 (2.7%) | 949 (3.6%) |
| $45,000 to $49,999 | 990 (3.3%) | 802 (3.0%) |
| $50,000 to $54,999 | 653 (2.2%) | 593 (2.2%) |
| $55,000 to $64,999 | 1,594 (5.3%) | 1,549 (5.9%) |
| $65,000 to $74,999 | 1,255 (4.2%) | 1,014 (3.8%) |
| $75,000 to $99,999 | 2,549 (8.5%) | 1,752 (6.6%) |
| $100,000+ | 5,471 (18.1%) | 2,317 (8.8%) |
| Total | 30,158 (100.0%) | 26,426 (100.0%) |
Earnings by Sex by Educational Attainment in Benton County
Average earnings in Benton County are $57,512 for men and $38,766 for women, a difference of 32.6%. Men with an educational attainment of graduate degree enjoy the highest average annual earnings of $91,187, while those with less than high school education earn the least with $33,929. Women with an educational attainment of graduate degree earn the most with the average annual earnings of $66,297, while those with high school diploma education have the smallest earnings of $25,613.
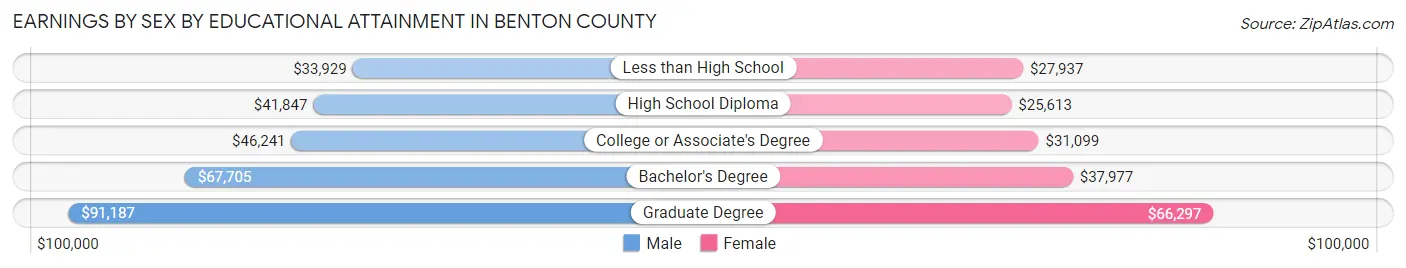
| Educational Attainment | Male Income | Female Income |
| Less than High School | $33,929 | $27,937 |
| High School Diploma | $41,847 | $25,613 |
| College or Associate's Degree | $46,241 | $31,099 |
| Bachelor's Degree | $67,705 | $37,977 |
| Graduate Degree | $91,187 | $66,297 |
| Total | $57,512 | $38,766 |
Family Income in Benton County
Family Income Brackets in Benton County
According to the Benton County family income data, there are 4,881 families falling into the $100,000 to $149,999 income range, which is the most common income bracket and makes up 23.0% of all families. Conversely, the $10,000 to $14,999 income bracket is the least frequent group with only 361 families (1.7%) belonging to this category.
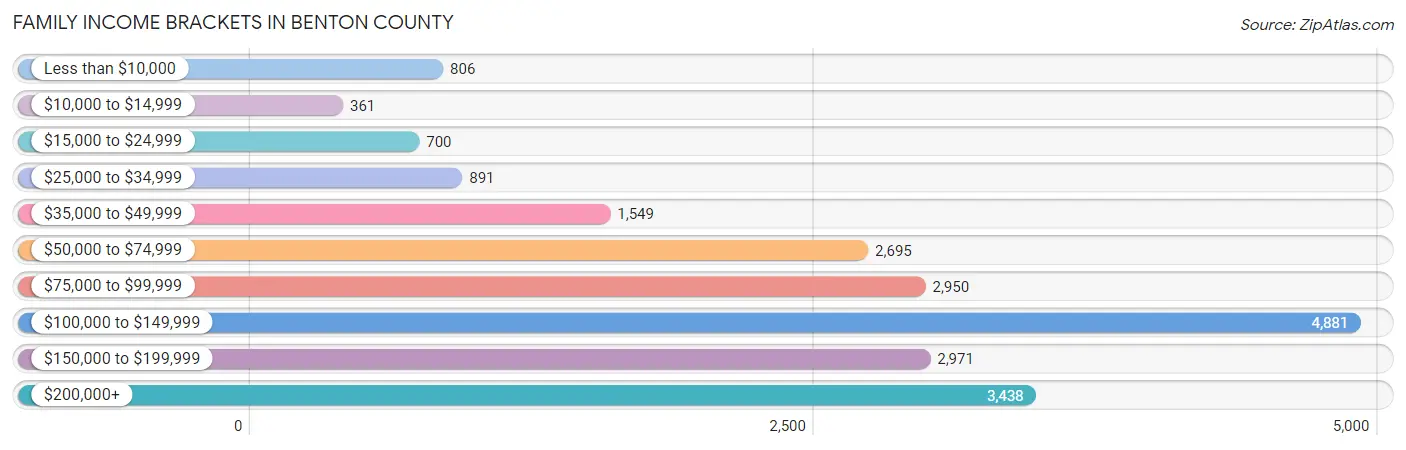
| Income Bracket | # Families | % Families |
| Less than $10,000 | 806 | 3.8% |
| $10,000 to $14,999 | 361 | 1.7% |
| $15,000 to $24,999 | 700 | 3.3% |
| $25,000 to $34,999 | 891 | 4.2% |
| $35,000 to $49,999 | 1,549 | 7.3% |
| $50,000 to $74,999 | 2,695 | 12.7% |
| $75,000 to $99,999 | 2,950 | 13.9% |
| $100,000 to $149,999 | 4,881 | 23.0% |
| $150,000 to $199,999 | 2,971 | 14.0% |
| $200,000+ | 3,438 | 16.2% |
Family Income by Famaliy Size in Benton County
6-person families (430 | 2.0%) account for the highest median family income in Benton County with $133,571 per family, while 2-person families (11,558 | 54.5%) have the highest median income of $46,282 per family member.
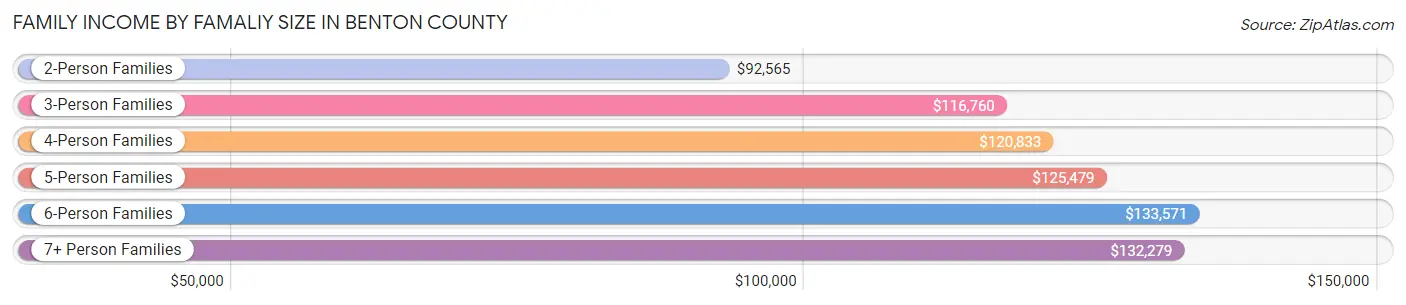
| Income Bracket | # Families | Median Income |
| 2-Person Families | 11,558 (54.5%) | $92,565 |
| 3-Person Families | 4,356 (20.5%) | $116,760 |
| 4-Person Families | 3,380 (15.9%) | $120,833 |
| 5-Person Families | 1,271 (6.0%) | $125,479 |
| 6-Person Families | 430 (2.0%) | $133,571 |
| 7+ Person Families | 227 (1.1%) | $132,279 |
| Total | 21,222 (100.0%) | $106,149 |
Family Income by Number of Earners in Benton County
The median family income in Benton County is $106,149, with families comprising 3+ earners (2,108) having the highest median family income of $153,514, while families with no earners (3,692) have the lowest median family income of $75,202, accounting for 9.9% and 17.4% of families, respectively.
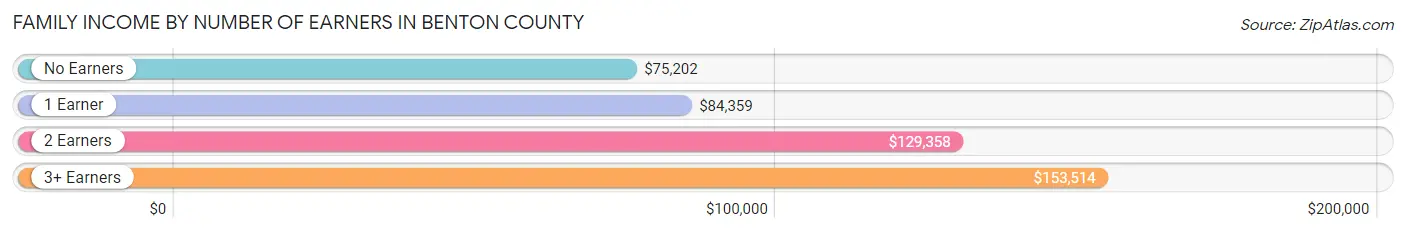
| Number of Earners | # Families | Median Income |
| No Earners | 3,692 (17.4%) | $75,202 |
| 1 Earner | 6,746 (31.8%) | $84,359 |
| 2 Earners | 8,676 (40.9%) | $129,358 |
| 3+ Earners | 2,108 (9.9%) | $153,514 |
| Total | 21,222 (100.0%) | $106,149 |
Household Income in Benton County
Household Income Brackets in Benton County
With 6,586 households falling in the category, the $100,000 to $149,999 income range is the most frequent in Benton County, accounting for 17.4% of all households. In contrast, only 1,552 households (4.1%) fall into the $10,000 to $14,999 income bracket, making it the least populous group.
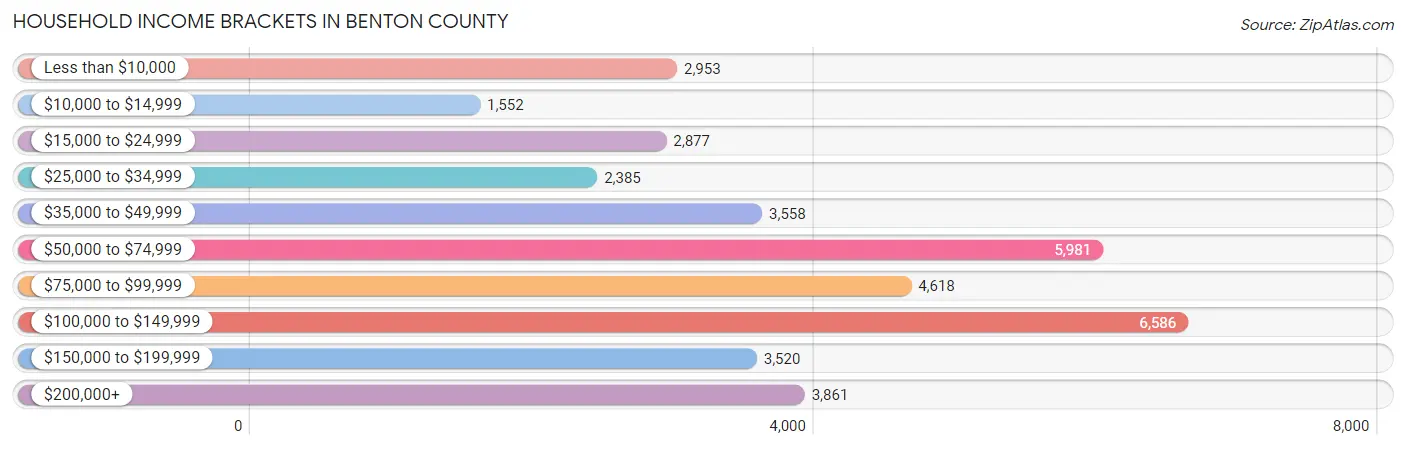
| Income Bracket | # Households | % Households |
| Less than $10,000 | 2,953 | 7.8% |
| $10,000 to $14,999 | 1,552 | 4.1% |
| $15,000 to $24,999 | 2,877 | 7.6% |
| $25,000 to $34,999 | 2,385 | 6.3% |
| $35,000 to $49,999 | 3,558 | 9.4% |
| $50,000 to $74,999 | 5,981 | 15.8% |
| $75,000 to $99,999 | 4,618 | 12.2% |
| $100,000 to $149,999 | 6,586 | 17.4% |
| $150,000 to $199,999 | 3,520 | 9.3% |
| $200,000+ | 3,861 | 10.2% |
Household Income by Householder Age in Benton County
The median household income in Benton County is $72,882, with the highest median household income of $107,892 found in the 45 to 64 years age bracket for the primary householder. A total of 11,175 households (29.5%) fall into this category. Meanwhile, the 15 to 24 years age bracket for the primary householder has the lowest median household income of $24,454, with 5,927 households (15.7%) in this group.
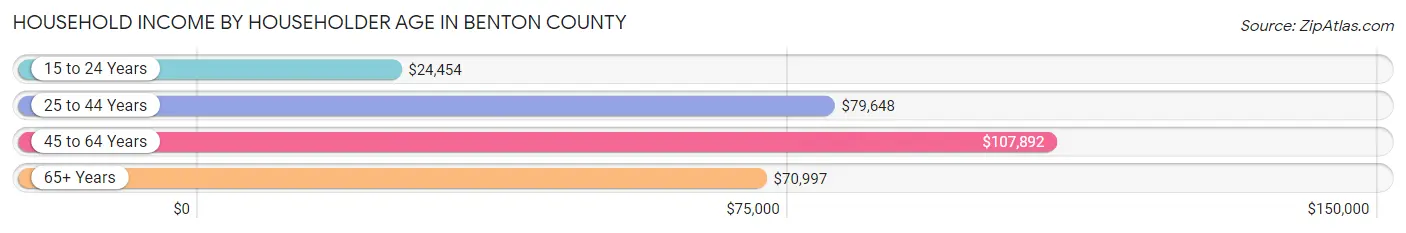
| Income Bracket | # Households | Median Income |
| 15 to 24 Years | 5,927 (15.7%) | $24,454 |
| 25 to 44 Years | 11,086 (29.3%) | $79,648 |
| 45 to 64 Years | 11,175 (29.5%) | $107,892 |
| 65+ Years | 9,665 (25.5%) | $70,997 |
| Total | 37,853 (100.0%) | $72,882 |
Poverty in Benton County
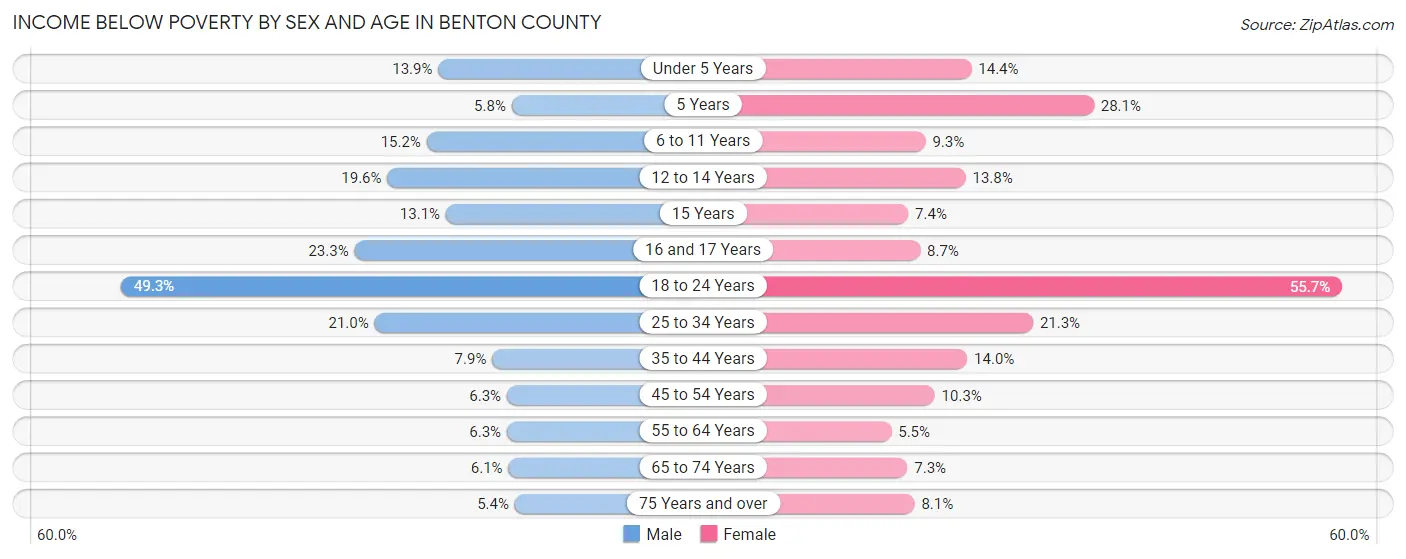
Income Below Poverty by Sex and Age in Benton County
With 18.7% poverty level for males and 19.5% for females among the residents of Benton County, 18 to 24 year old males and 18 to 24 year old females are the most vulnerable to poverty, with 4,460 males (49.3%) and 4,478 females (55.7%) in their respective age groups living below the poverty level.
| Age Bracket | Male | Female |
| Under 5 Years | 258 (13.9%) | 241 (14.4%) |
| 5 Years | 30 (5.8%) | 78 (28.1%) |
| 6 to 11 Years | 386 (15.2%) | 229 (9.3%) |
| 12 to 14 Years | 217 (19.6%) | 179 (13.8%) |
| 15 Years | 76 (13.1%) | 36 (7.4%) |
| 16 and 17 Years | 200 (23.3%) | 77 (8.7%) |
| 18 to 24 Years | 4,460 (49.3%) | 4,478 (55.7%) |
| 25 to 34 Years | 1,335 (21.0%) | 1,242 (21.3%) |
| 35 to 44 Years | 409 (7.9%) | 687 (14.0%) |
| 45 to 54 Years | 288 (6.3%) | 482 (10.3%) |
| 55 to 64 Years | 313 (6.3%) | 307 (5.5%) |
| 65 to 74 Years | 302 (6.1%) | 367 (7.3%) |
| 75 Years and over | 138 (5.4%) | 286 (8.1%) |
| Total | 8,412 (18.7%) | 8,689 (19.5%) |
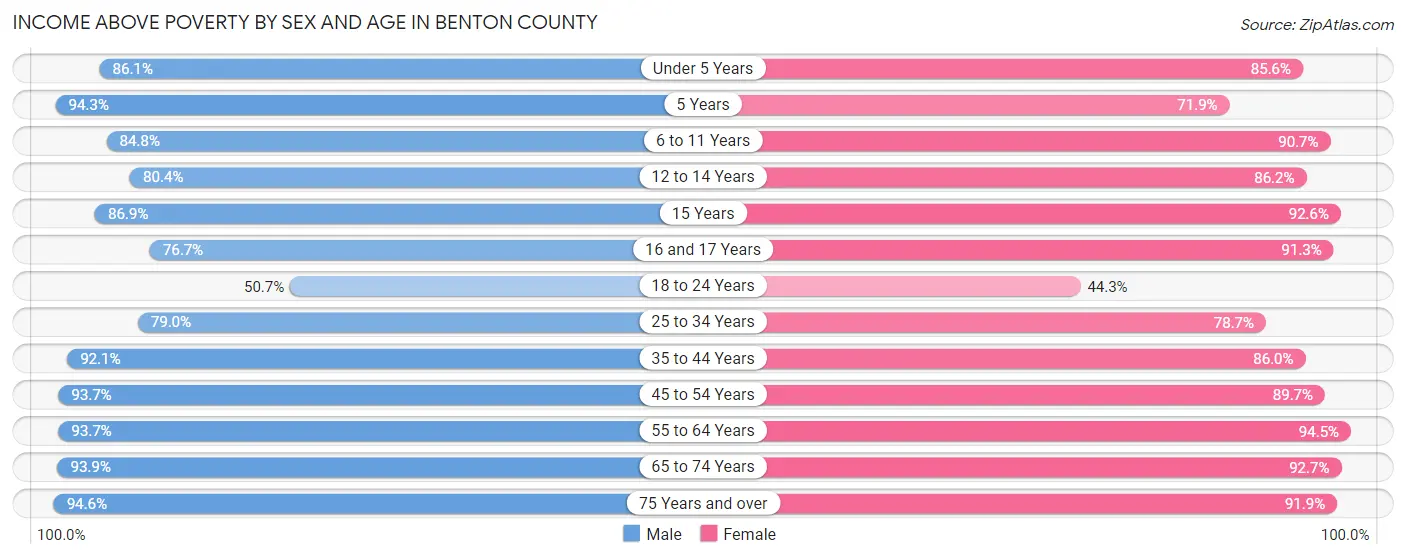
Income Above Poverty by Sex and Age in Benton County
According to the poverty statistics in Benton County, males aged 75 years and over and females aged 55 to 64 years are the age groups that are most secure financially, with 94.6% of males and 94.5% of females in these age groups living above the poverty line.
| Age Bracket | Male | Female |
| Under 5 Years | 1,594 (86.1%) | 1,429 (85.6%) |
| 5 Years | 492 (94.3%) | 200 (71.9%) |
| 6 to 11 Years | 2,150 (84.8%) | 2,227 (90.7%) |
| 12 to 14 Years | 890 (80.4%) | 1,120 (86.2%) |
| 15 Years | 505 (86.9%) | 451 (92.6%) |
| 16 and 17 Years | 660 (76.7%) | 806 (91.3%) |
| 18 to 24 Years | 4,593 (50.7%) | 3,562 (44.3%) |
| 25 to 34 Years | 5,013 (79.0%) | 4,591 (78.7%) |
| 35 to 44 Years | 4,757 (92.1%) | 4,235 (86.0%) |
| 45 to 54 Years | 4,299 (93.7%) | 4,178 (89.7%) |
| 55 to 64 Years | 4,669 (93.7%) | 5,269 (94.5%) |
| 65 to 74 Years | 4,629 (93.9%) | 4,659 (92.7%) |
| 75 Years and over | 2,412 (94.6%) | 3,248 (91.9%) |
| Total | 36,663 (81.3%) | 35,975 (80.5%) |
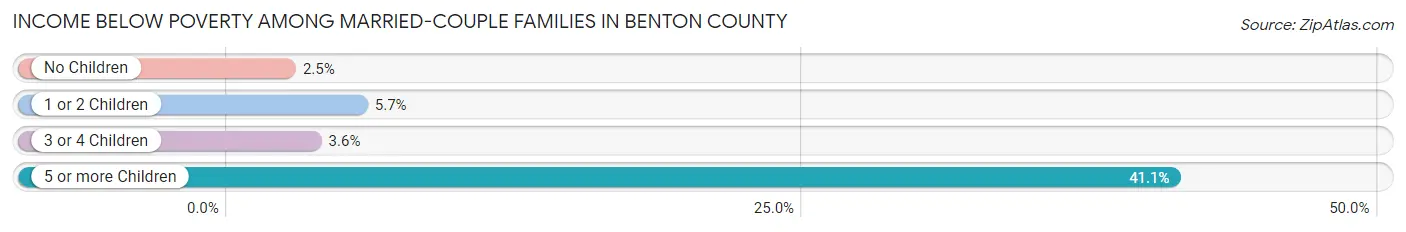
Income Below Poverty Among Married-Couple Families in Benton County
The poverty statistics for married-couple families in Benton County show that 3.7% or 613 of the total 16,704 families live below the poverty line. Families with 5 or more children have the highest poverty rate of 41.0%, comprising of 39 families. On the other hand, families with no children have the lowest poverty rate of 2.5%, which includes 277 families.
| Children | Above Poverty | Below Poverty |
| No Children | 10,732 (97.5%) | 277 (2.5%) |
| 1 or 2 Children | 4,377 (94.4%) | 262 (5.7%) |
| 3 or 4 Children | 926 (96.4%) | 35 (3.6%) |
| 5 or more Children | 56 (59.0%) | 39 (41.0%) |
| Total | 16,091 (96.3%) | 613 (3.7%) |
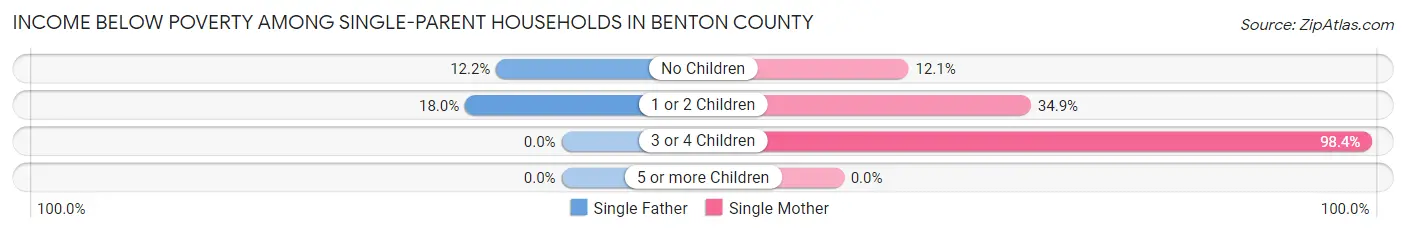
Income Below Poverty Among Single-Parent Households in Benton County
According to the poverty data in Benton County, 14.3% or 224 single-father households and 28.0% or 828 single-mother households are living below the poverty line. Among single-father households, those with 1 or 2 children have the highest poverty rate, with 134 households (18.0%) experiencing poverty. Likewise, among single-mother households, those with 3 or 4 children have the highest poverty rate, with 126 households (98.4%) falling below the poverty line.
| Children | Single Father | Single Mother |
| No Children | 90 (12.2%) | 150 (12.1%) |
| 1 or 2 Children | 134 (18.0%) | 552 (34.9%) |
| 3 or 4 Children | 0 (0.0%) | 126 (98.4%) |
| 5 or more Children | 0 (0.0%) | 0 (0.0%) |
| Total | 224 (14.3%) | 828 (28.0%) |
Income Below Poverty Among Married-Couple vs Single-Parent Households in Benton County
The poverty data for Benton County shows that 613 of the married-couple family households (3.7%) and 1,052 of the single-parent households (23.3%) are living below the poverty level. Within the married-couple family households, those with 5 or more children have the highest poverty rate, with 39 households (41.0%) falling below the poverty line. Among the single-parent households, those with 3 or 4 children have the highest poverty rate, with 126 household (62.1%) living below poverty.
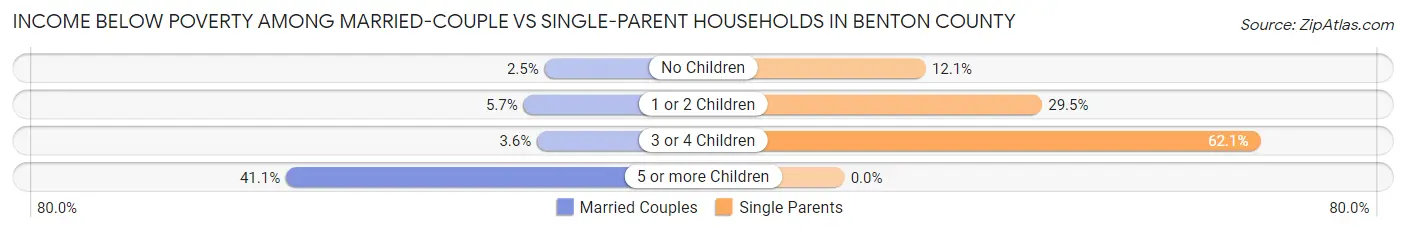
| Children | Married-Couple Families | Single-Parent Households |
| No Children | 277 (2.5%) | 240 (12.1%) |
| 1 or 2 Children | 262 (5.7%) | 686 (29.4%) |
| 3 or 4 Children | 35 (3.6%) | 126 (62.1%) |
| 5 or more Children | 39 (41.0%) | 0 (0.0%) |
| Total | 613 (3.7%) | 1,052 (23.3%) |
Employment Characteristics in Benton County
Employment by Class of Employer in Benton County
Among the 45,707 employed individuals in Benton County, private company employees (23,999 | 52.5%), state government employees (8,171 | 17.9%), and not-for-profit organizations (5,005 | 11.0%) make up the most common classes of employment.
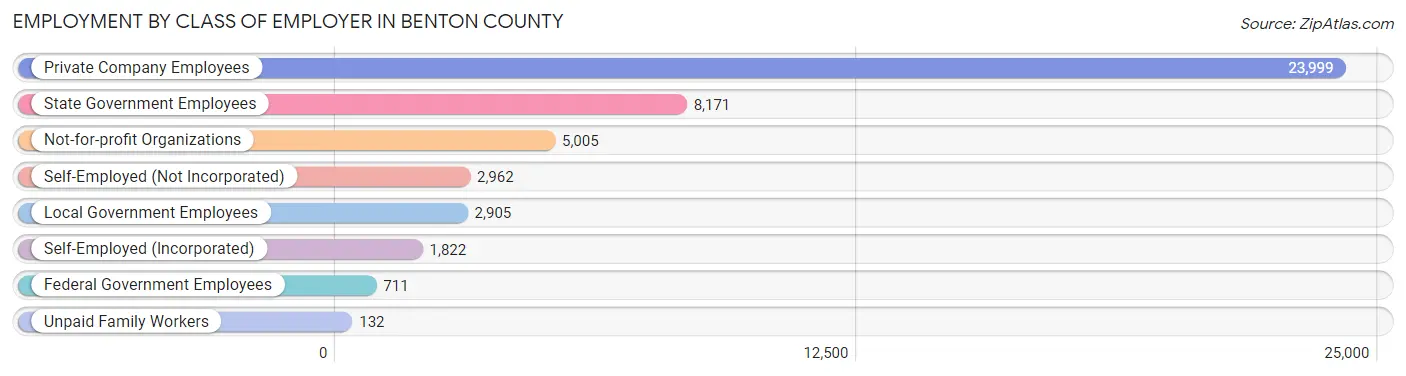
| Employer Class | # Employees | % Employees |
| Private Company Employees | 23,999 | 52.5% |
| Self-Employed (Incorporated) | 1,822 | 4.0% |
| Self-Employed (Not Incorporated) | 2,962 | 6.5% |
| Not-for-profit Organizations | 5,005 | 11.0% |
| Local Government Employees | 2,905 | 6.4% |
| State Government Employees | 8,171 | 17.9% |
| Federal Government Employees | 711 | 1.6% |
| Unpaid Family Workers | 132 | 0.3% |
| Total | 45,707 | 100.0% |
Employment Status by Age in Benton County
According to the labor force statistics for Benton County, out of the total population over 16 years of age (82,621), 60.5% or 49,986 individuals are in the labor force, with 6.8% or 3,399 of them unemployed. The age group with the highest labor force participation rate is 45 to 54 years, with 83.8% or 7,757 individuals in the labor force. Within the labor force, the 16 to 19 years age range has the highest percentage of unemployed individuals, with 26.0% or 793 of them being unemployed.
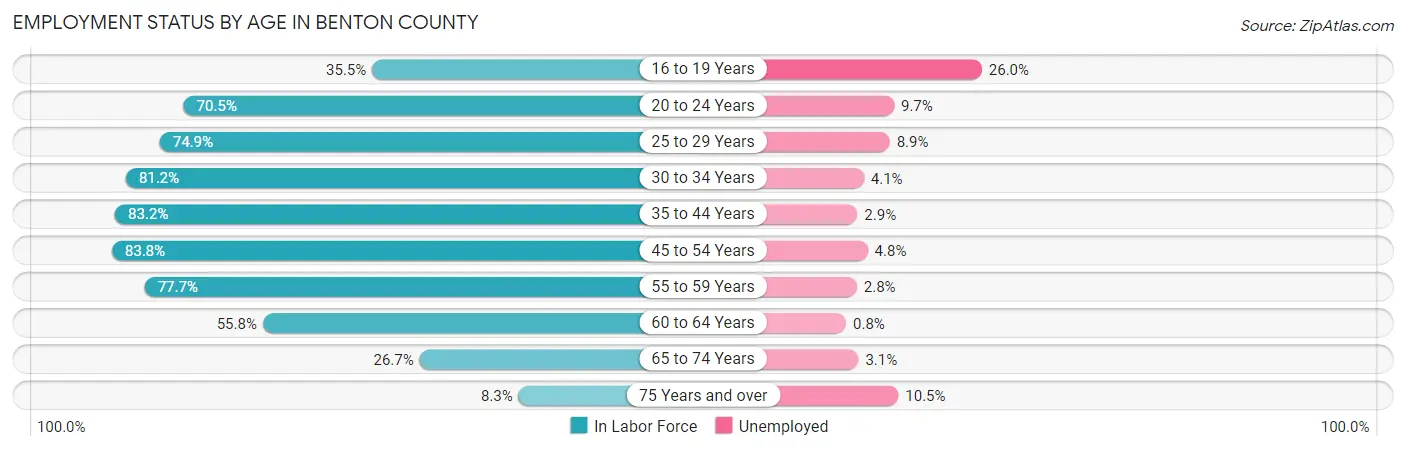
| Age Bracket | In Labor Force | Unemployed |
| 16 to 19 Years | 3,049 (35.5%) | 793 (26.0%) |
| 20 to 24 Years | 11,042 (70.5%) | 1,071 (9.7%) |
| 25 to 29 Years | 5,183 (74.9%) | 461 (8.9%) |
| 30 to 34 Years | 4,339 (81.2%) | 178 (4.1%) |
| 35 to 44 Years | 8,414 (83.2%) | 244 (2.9%) |
| 45 to 54 Years | 7,757 (83.8%) | 372 (4.8%) |
| 55 to 59 Years | 4,079 (77.7%) | 114 (2.8%) |
| 60 to 64 Years | 2,975 (55.8%) | 24 (0.8%) |
| 65 to 74 Years | 2,668 (26.7%) | 83 (3.1%) |
| 75 Years and over | 512 (8.3%) | 54 (10.5%) |
| Total | 49,986 (60.5%) | 3,399 (6.8%) |
Employment Status by Educational Attainment in Benton County
According to labor force statistics for Benton County, 77.6% of individuals (32,758) out of the total population between 25 and 64 years of age (42,214) are in the labor force, with 4.2% or 1,376 of them being unemployed. The group with the highest labor force participation rate are those with the educational attainment of bachelor's degree or higher, with 82.4% or 18,959 individuals in the labor force. Within the labor force, individuals with high school diploma education have the highest percentage of unemployment, with 5.8% or 244 of them being unemployed.
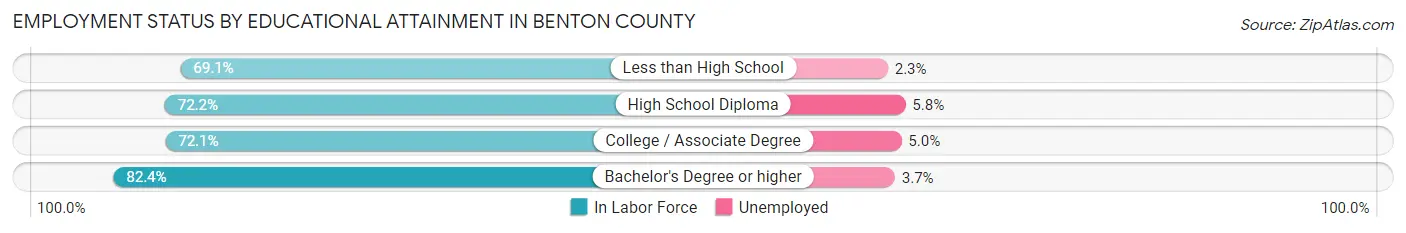
| Educational Attainment | In Labor Force | Unemployed |
| Less than High School | 1,225 (69.1%) | 41 (2.3%) |
| High School Diploma | 4,203 (72.2%) | 338 (5.8%) |
| College / Associate Degree | 8,372 (72.1%) | 581 (5.0%) |
| Bachelor's Degree or higher | 18,959 (82.4%) | 851 (3.7%) |
| Total | 32,758 (77.6%) | 1,773 (4.2%) |
Employment Occupations by Sex in Benton County
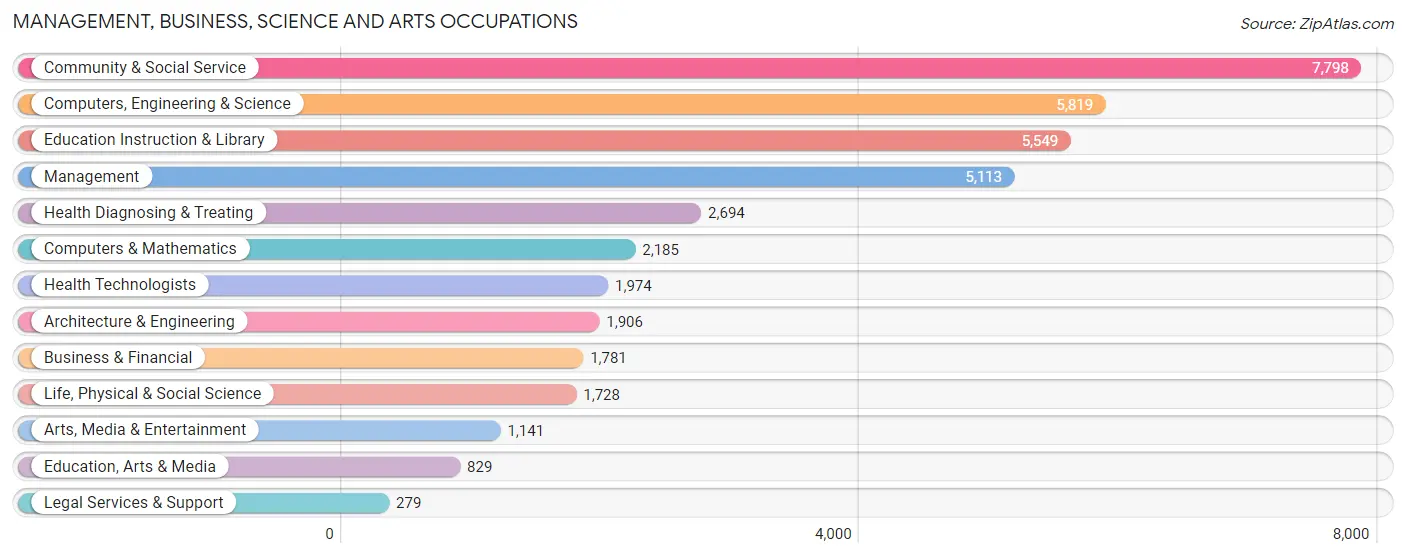
Management, Business, Science and Arts Occupations
The most common Management, Business, Science and Arts occupations in Benton County are Community & Social Service (7,798 | 16.7%), Computers, Engineering & Science (5,819 | 12.5%), Education Instruction & Library (5,549 | 11.9%), Management (5,113 | 11.0%), and Health Diagnosing & Treating (2,694 | 5.8%).
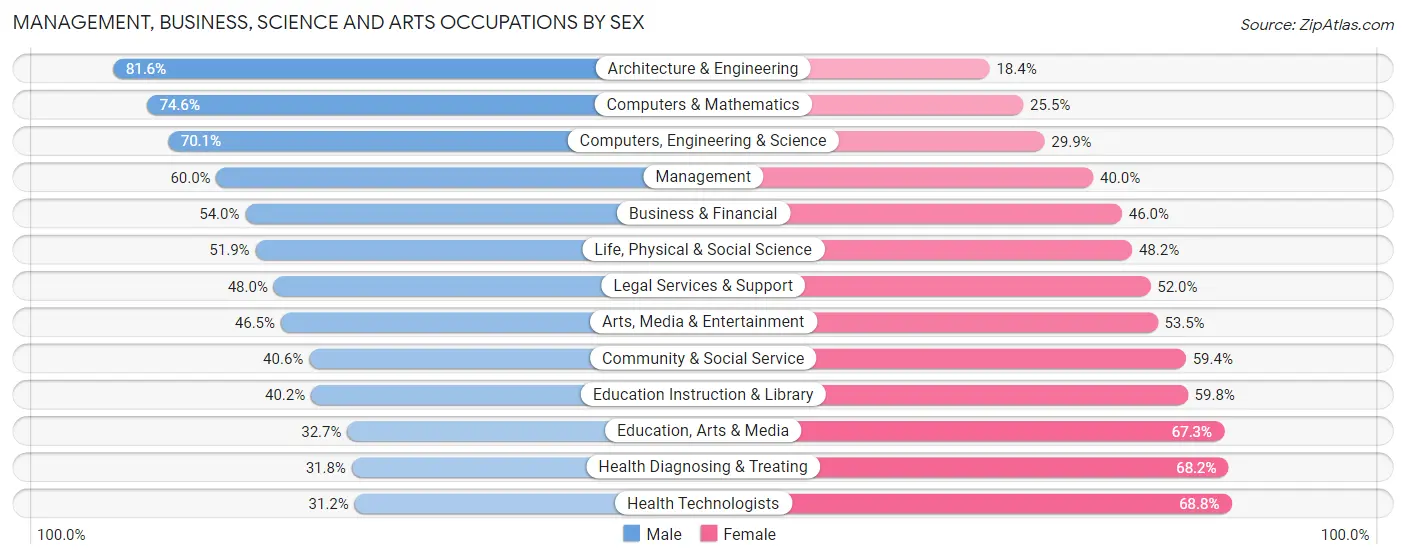
Management, Business, Science and Arts Occupations by Sex
Within the Management, Business, Science and Arts occupations in Benton County, the most male-oriented occupations are Architecture & Engineering (81.6%), Computers & Mathematics (74.6%), and Computers, Engineering & Science (70.1%), while the most female-oriented occupations are Health Technologists (68.8%), Health Diagnosing & Treating (68.2%), and Education, Arts & Media (67.3%).
| Occupation | Male | Female |
| Management | 3,067 (60.0%) | 2,046 (40.0%) |
| Business & Financial | 961 (54.0%) | 820 (46.0%) |
| Computers, Engineering & Science | 4,080 (70.1%) | 1,739 (29.9%) |
| Computers & Mathematics | 1,629 (74.6%) | 556 (25.5%) |
| Architecture & Engineering | 1,555 (81.6%) | 351 (18.4%) |
| Life, Physical & Social Science | 896 (51.8%) | 832 (48.1%) |
| Community & Social Service | 3,169 (40.6%) | 4,629 (59.4%) |
| Education, Arts & Media | 271 (32.7%) | 558 (67.3%) |
| Legal Services & Support | 134 (48.0%) | 145 (52.0%) |
| Education Instruction & Library | 2,233 (40.2%) | 3,316 (59.8%) |
| Arts, Media & Entertainment | 531 (46.5%) | 610 (53.5%) |
| Health Diagnosing & Treating | 856 (31.8%) | 1,838 (68.2%) |
| Health Technologists | 615 (31.2%) | 1,359 (68.8%) |
| Total (Category) | 12,133 (52.3%) | 11,072 (47.7%) |
| Total (Overall) | 24,707 (53.0%) | 21,894 (47.0%) |
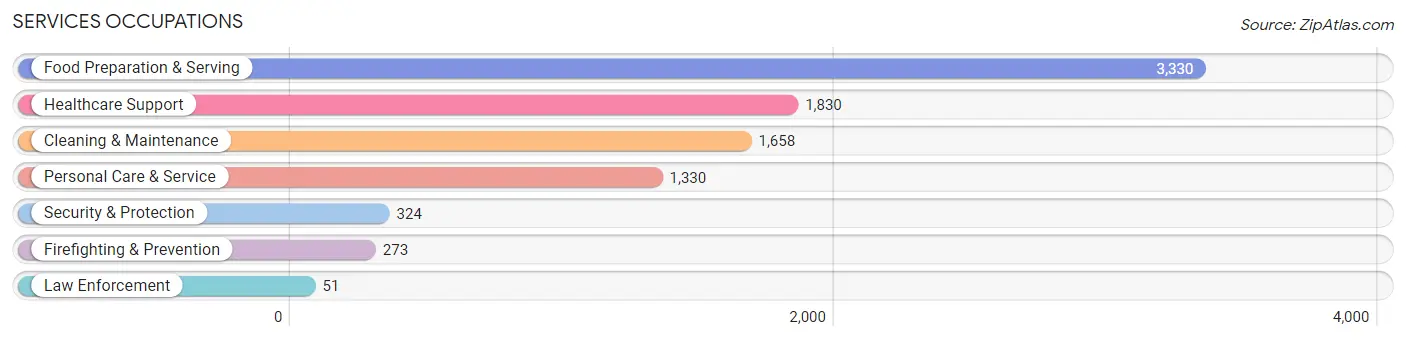
Services Occupations
The most common Services occupations in Benton County are Food Preparation & Serving (3,330 | 7.1%), Healthcare Support (1,830 | 3.9%), Cleaning & Maintenance (1,658 | 3.6%), Personal Care & Service (1,330 | 2.9%), and Security & Protection (324 | 0.7%).
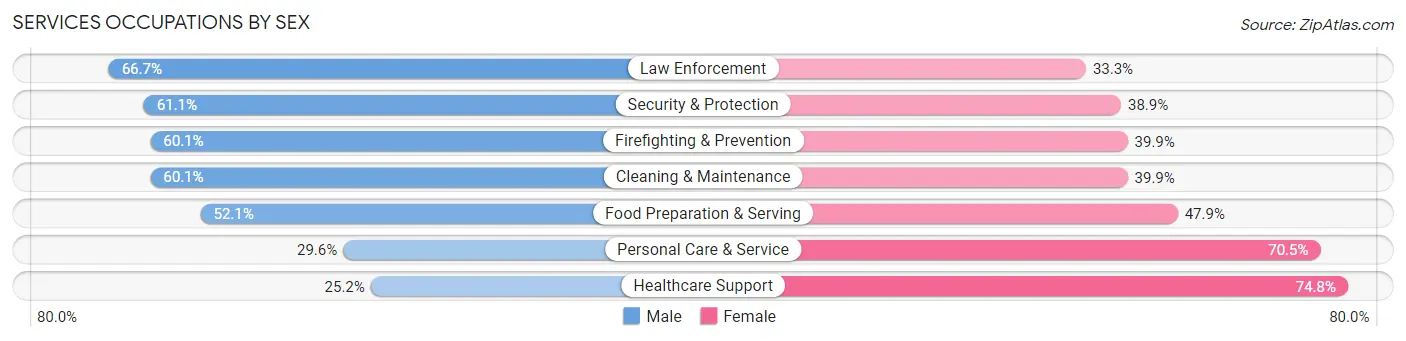
Services Occupations by Sex
Within the Services occupations in Benton County, the most male-oriented occupations are Law Enforcement (66.7%), Security & Protection (61.1%), and Firefighting & Prevention (60.1%), while the most female-oriented occupations are Healthcare Support (74.8%), Personal Care & Service (70.5%), and Food Preparation & Serving (47.9%).
| Occupation | Male | Female |
| Healthcare Support | 461 (25.2%) | 1,369 (74.8%) |
| Security & Protection | 198 (61.1%) | 126 (38.9%) |
| Firefighting & Prevention | 164 (60.1%) | 109 (39.9%) |
| Law Enforcement | 34 (66.7%) | 17 (33.3%) |
| Food Preparation & Serving | 1,736 (52.1%) | 1,594 (47.9%) |
| Cleaning & Maintenance | 996 (60.1%) | 662 (39.9%) |
| Personal Care & Service | 393 (29.5%) | 937 (70.5%) |
| Total (Category) | 3,784 (44.7%) | 4,688 (55.3%) |
| Total (Overall) | 24,707 (53.0%) | 21,894 (47.0%) |
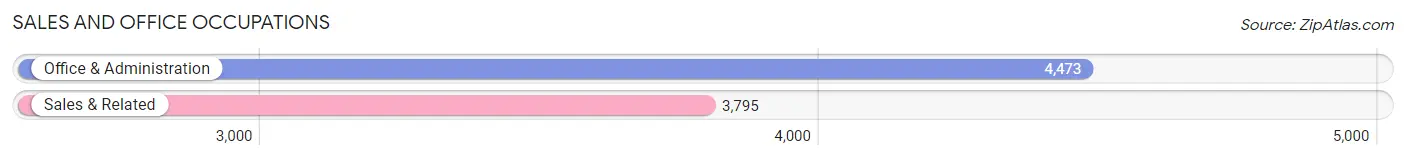
Sales and Office Occupations
The most common Sales and Office occupations in Benton County are Office & Administration (4,473 | 9.6%), and Sales & Related (3,795 | 8.1%).
Sales and Office Occupations by Sex
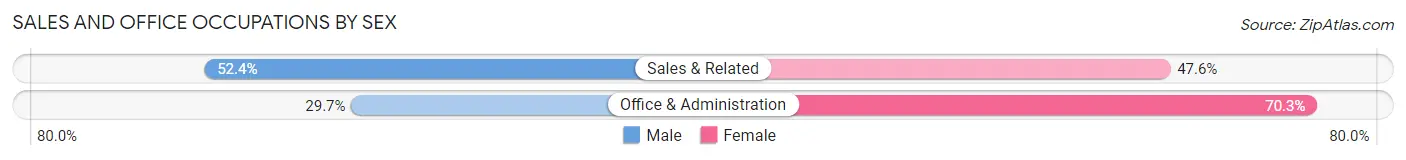
| Occupation | Male | Female |
| Sales & Related | 1,987 (52.4%) | 1,808 (47.6%) |
| Office & Administration | 1,330 (29.7%) | 3,143 (70.3%) |
| Total (Category) | 3,317 (40.1%) | 4,951 (59.9%) |
| Total (Overall) | 24,707 (53.0%) | 21,894 (47.0%) |
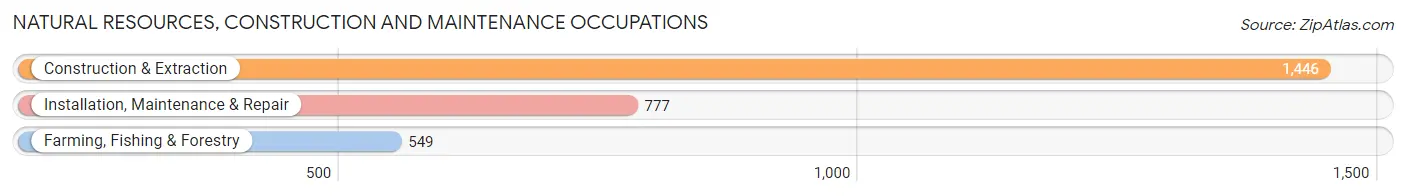
Natural Resources, Construction and Maintenance Occupations
The most common Natural Resources, Construction and Maintenance occupations in Benton County are Construction & Extraction (1,446 | 3.1%), Installation, Maintenance & Repair (777 | 1.7%), and Farming, Fishing & Forestry (549 | 1.2%).
Natural Resources, Construction and Maintenance Occupations by Sex
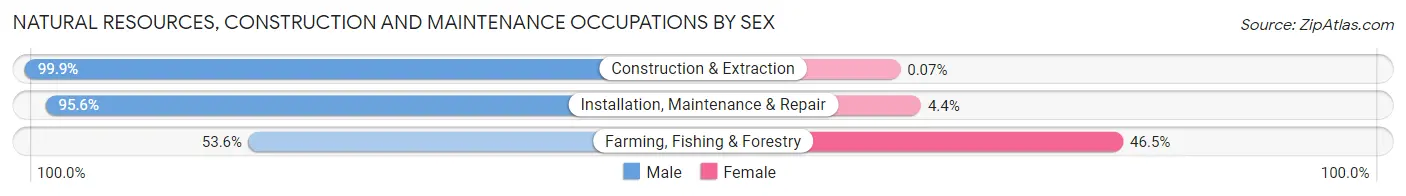
| Occupation | Male | Female |
| Farming, Fishing & Forestry | 294 (53.5%) | 255 (46.5%) |
| Construction & Extraction | 1,445 (99.9%) | 1 (0.1%) |
| Installation, Maintenance & Repair | 743 (95.6%) | 34 (4.4%) |
| Total (Category) | 2,482 (89.5%) | 290 (10.5%) |
| Total (Overall) | 24,707 (53.0%) | 21,894 (47.0%) |
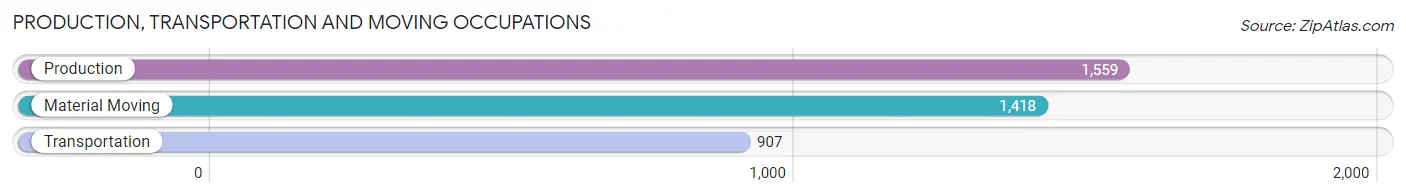
Production, Transportation and Moving Occupations
The most common Production, Transportation and Moving occupations in Benton County are Production (1,559 | 3.4%), Material Moving (1,418 | 3.0%), and Transportation (907 | 1.9%).
Production, Transportation and Moving Occupations by Sex
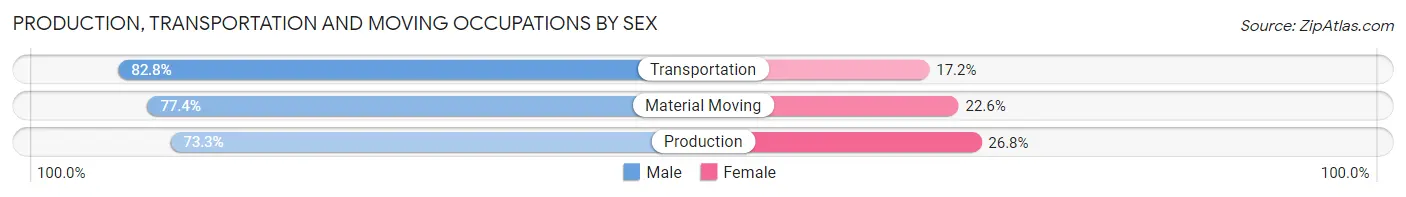
| Occupation | Male | Female |
| Production | 1,142 (73.3%) | 417 (26.8%) |
| Transportation | 751 (82.8%) | 156 (17.2%) |
| Material Moving | 1,098 (77.4%) | 320 (22.6%) |
| Total (Category) | 2,991 (77.0%) | 893 (23.0%) |
| Total (Overall) | 24,707 (53.0%) | 21,894 (47.0%) |
Employment Industries by Sex in Benton County
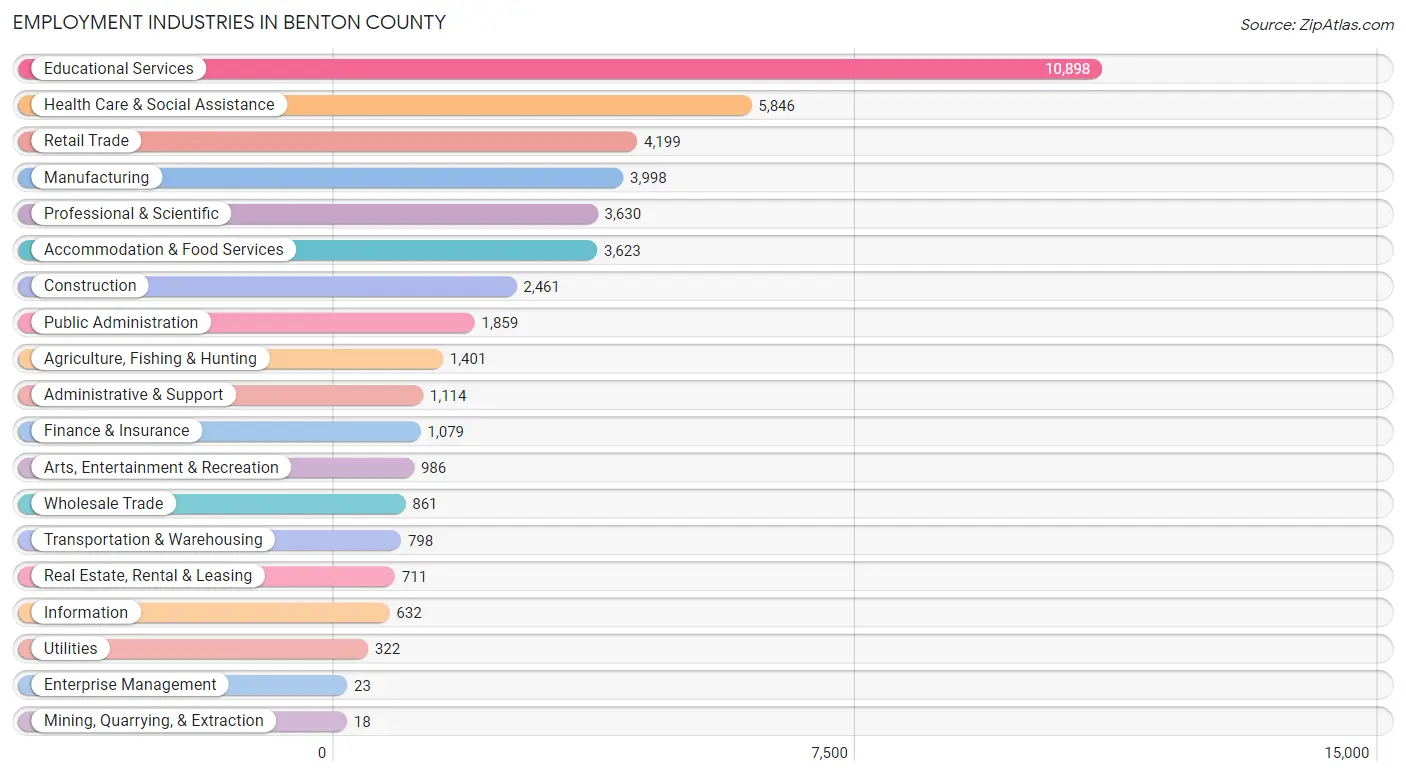
Employment Industries in Benton County
The major employment industries in Benton County include Educational Services (10,898 | 23.4%), Health Care & Social Assistance (5,846 | 12.5%), Retail Trade (4,199 | 9.0%), Manufacturing (3,998 | 8.6%), and Professional & Scientific (3,630 | 7.8%).
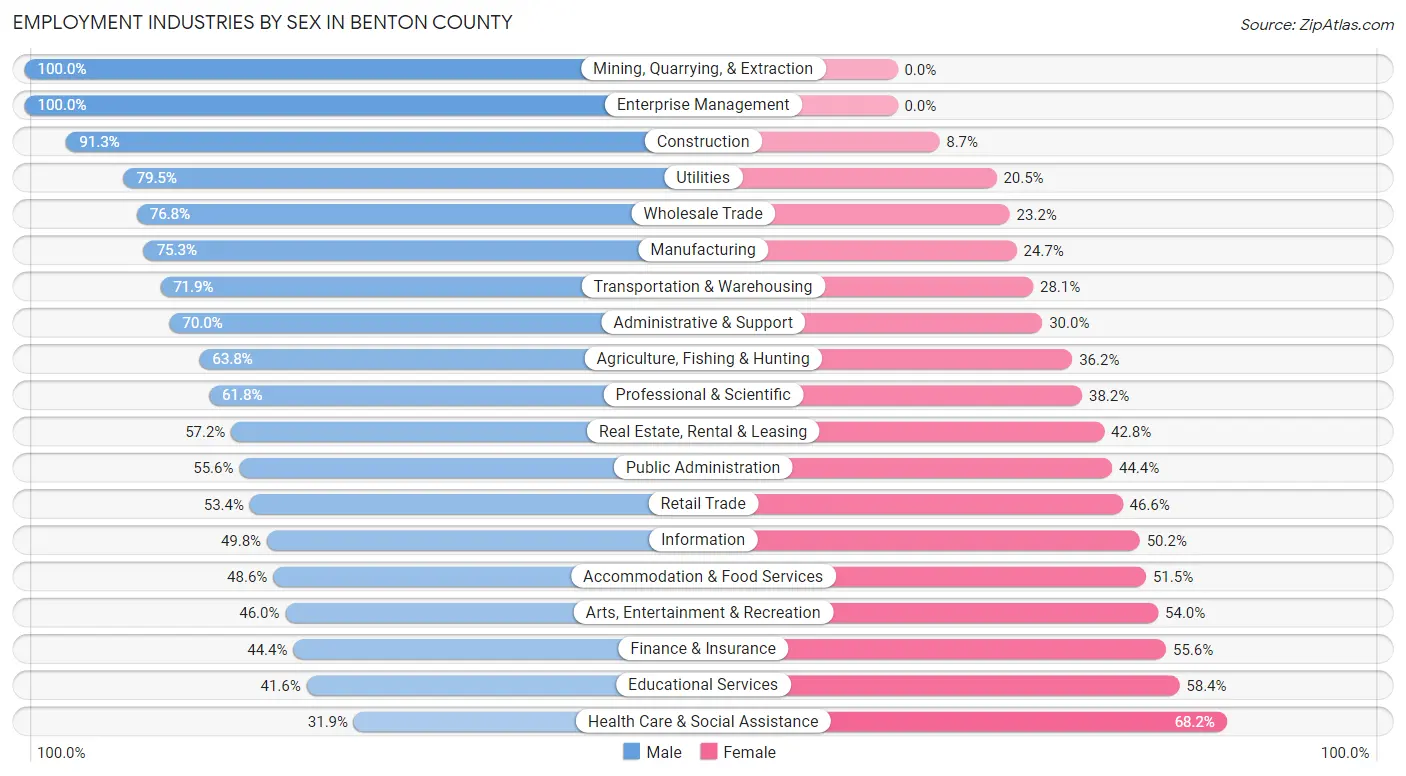
Employment Industries by Sex in Benton County
The Benton County industries that see more men than women are Mining, Quarrying, & Extraction (100.0%), Enterprise Management (100.0%), and Construction (91.3%), whereas the industries that tend to have a higher number of women are Health Care & Social Assistance (68.1%), Educational Services (58.4%), and Finance & Insurance (55.6%).
| Industry | Male | Female |
| Agriculture, Fishing & Hunting | 894 (63.8%) | 507 (36.2%) |
| Mining, Quarrying, & Extraction | 18 (100.0%) | 0 (0.0%) |
| Construction | 2,248 (91.3%) | 213 (8.7%) |
| Manufacturing | 3,012 (75.3%) | 986 (24.7%) |
| Wholesale Trade | 661 (76.8%) | 200 (23.2%) |
| Retail Trade | 2,242 (53.4%) | 1,957 (46.6%) |
| Transportation & Warehousing | 574 (71.9%) | 224 (28.1%) |
| Utilities | 256 (79.5%) | 66 (20.5%) |
| Information | 315 (49.8%) | 317 (50.2%) |
| Finance & Insurance | 479 (44.4%) | 600 (55.6%) |
| Real Estate, Rental & Leasing | 407 (57.2%) | 304 (42.8%) |
| Professional & Scientific | 2,243 (61.8%) | 1,387 (38.2%) |
| Enterprise Management | 23 (100.0%) | 0 (0.0%) |
| Administrative & Support | 780 (70.0%) | 334 (30.0%) |
| Educational Services | 4,538 (41.6%) | 6,360 (58.4%) |
| Health Care & Social Assistance | 1,862 (31.9%) | 3,984 (68.1%) |
| Arts, Entertainment & Recreation | 454 (46.0%) | 532 (54.0%) |
| Accommodation & Food Services | 1,759 (48.5%) | 1,864 (51.4%) |
| Public Administration | 1,033 (55.6%) | 826 (44.4%) |
| Total | 24,707 (53.0%) | 21,894 (47.0%) |
Education in Benton County
School Enrollment in Benton County
The most common levels of schooling among the 33,446 students in Benton County are college / undergraduate (17,978 | 53.7%), high school (3,716 | 11.1%), and graduate / professional (3,633 | 10.9%).
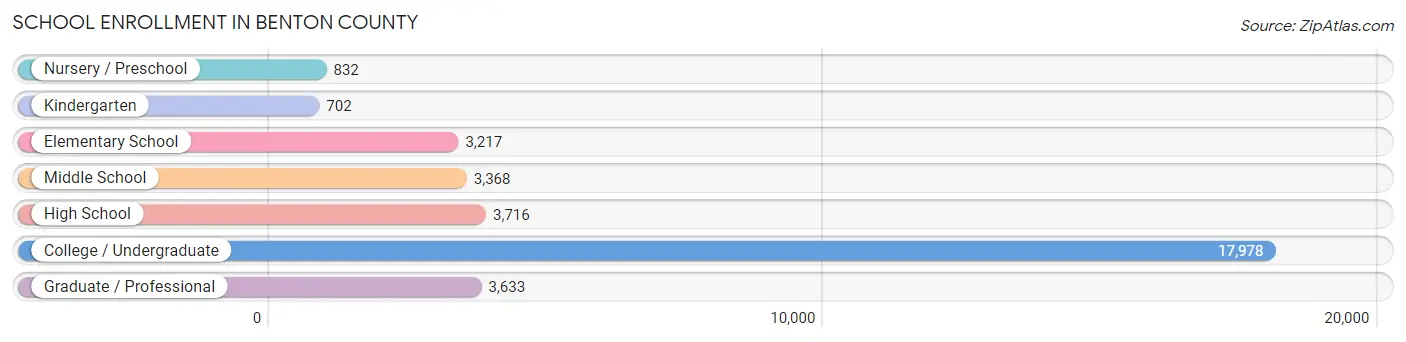
| School Level | # Students | % Students |
| Nursery / Preschool | 832 | 2.5% |
| Kindergarten | 702 | 2.1% |
| Elementary School | 3,217 | 9.6% |
| Middle School | 3,368 | 10.1% |
| High School | 3,716 | 11.1% |
| College / Undergraduate | 17,978 | 53.7% |
| Graduate / Professional | 3,633 | 10.9% |
| Total | 33,446 | 100.0% |
School Enrollment by Age by Funding Source in Benton County
Out of a total of 33,446 students who are enrolled in schools in Benton County, 2,977 (8.9%) attend a private institution, while the remaining 30,469 (91.1%) are enrolled in public schools. The age group of 3 to 4 year olds has the highest likelihood of being enrolled in private schools, with 302 (55.8% in the age bracket) enrolled. Conversely, the age group of 25 to 34 year olds has the lowest likelihood of being enrolled in a private school, with 3,305 (96.3% in the age bracket) attending a public institution.
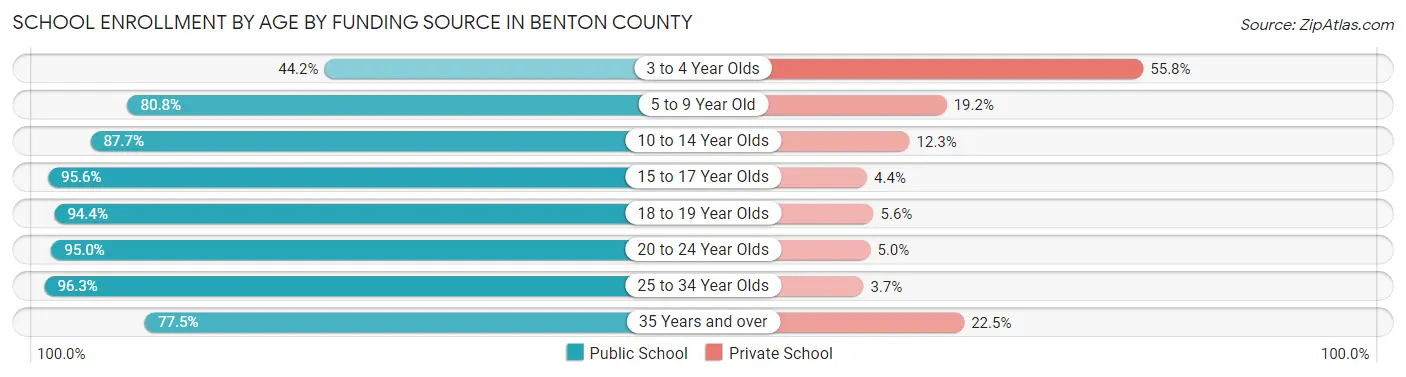
| Age Bracket | Public School | Private School |
| 3 to 4 Year Olds | 239 (44.2%) | 302 (55.8%) |
| 5 to 9 Year Old | 2,983 (80.8%) | 709 (19.2%) |
| 10 to 14 Year Olds | 3,771 (87.7%) | 528 (12.3%) |
| 15 to 17 Year Olds | 2,689 (95.6%) | 123 (4.4%) |
| 18 to 19 Year Olds | 5,937 (94.4%) | 350 (5.6%) |
| 20 to 24 Year Olds | 10,541 (95.0%) | 555 (5.0%) |
| 25 to 34 Year Olds | 3,305 (96.3%) | 127 (3.7%) |
| 35 Years and over | 998 (77.5%) | 289 (22.5%) |
| Total | 30,469 (91.1%) | 2,977 (8.9%) |
Educational Attainment by Field of Study in Benton County
Bio, nature & agricultural (5,587 | 16.2%), engineering (3,596 | 10.4%), business (3,405 | 9.9%), social sciences (2,585 | 7.5%), and education (2,560 | 7.4%) are the most common fields of study among 34,548 individuals in Benton County who have obtained a bachelor's degree or higher.
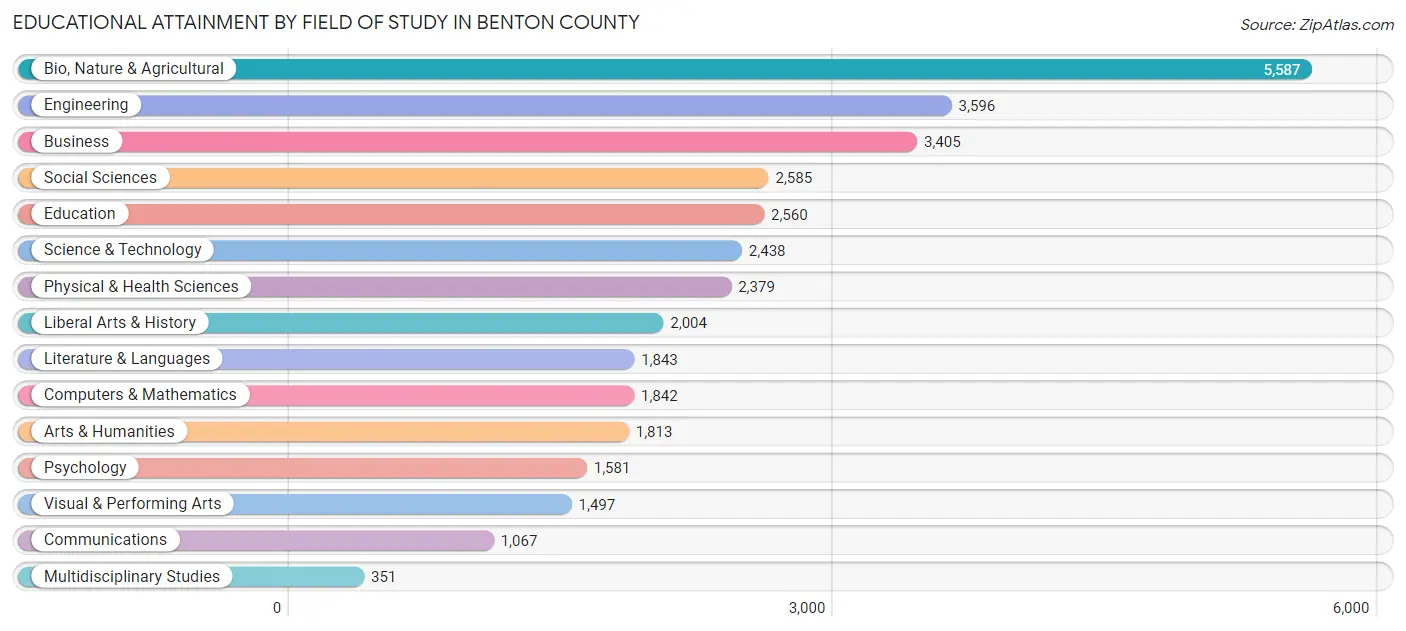
| Field of Study | # Graduates | % Graduates |
| Computers & Mathematics | 1,842 | 5.3% |
| Bio, Nature & Agricultural | 5,587 | 16.2% |
| Physical & Health Sciences | 2,379 | 6.9% |
| Psychology | 1,581 | 4.6% |
| Social Sciences | 2,585 | 7.5% |
| Engineering | 3,596 | 10.4% |
| Multidisciplinary Studies | 351 | 1.0% |
| Science & Technology | 2,438 | 7.1% |
| Business | 3,405 | 9.9% |
| Education | 2,560 | 7.4% |
| Literature & Languages | 1,843 | 5.3% |
| Liberal Arts & History | 2,004 | 5.8% |
| Visual & Performing Arts | 1,497 | 4.3% |
| Communications | 1,067 | 3.1% |
| Arts & Humanities | 1,813 | 5.2% |
| Total | 34,548 | 100.0% |
Transportation & Commute in Benton County
Vehicle Availability by Sex in Benton County
The most prevalent vehicle ownership categories in Benton County are males with 2 vehicles (9,427, accounting for 39.4%) and females with 2 vehicles (7,615, making up 46.0%).
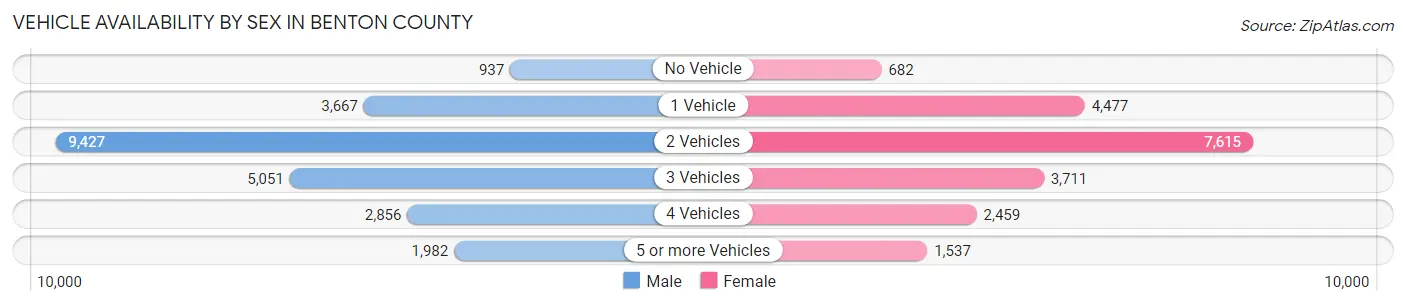
| Vehicles Available | Male | Female |
| No Vehicle | 937 (3.9%) | 682 (3.3%) |
| 1 Vehicle | 3,667 (15.3%) | 4,477 (21.9%) |
| 2 Vehicles | 9,427 (39.4%) | 7,615 (37.2%) |
| 3 Vehicles | 5,051 (21.1%) | 3,711 (18.1%) |
| 4 Vehicles | 2,856 (11.9%) | 2,459 (12.0%) |
| 5 or more Vehicles | 1,982 (8.3%) | 1,537 (7.5%) |
| Total | 23,920 (100.0%) | 20,481 (100.0%) |
Commute Time in Benton County
The most frequently occuring commute durations in Benton County are 10 to 14 minutes (9,251 commuters, 23.7%), 15 to 19 minutes (7,300 commuters, 18.7%), and 5 to 9 minutes (6,375 commuters, 16.3%).
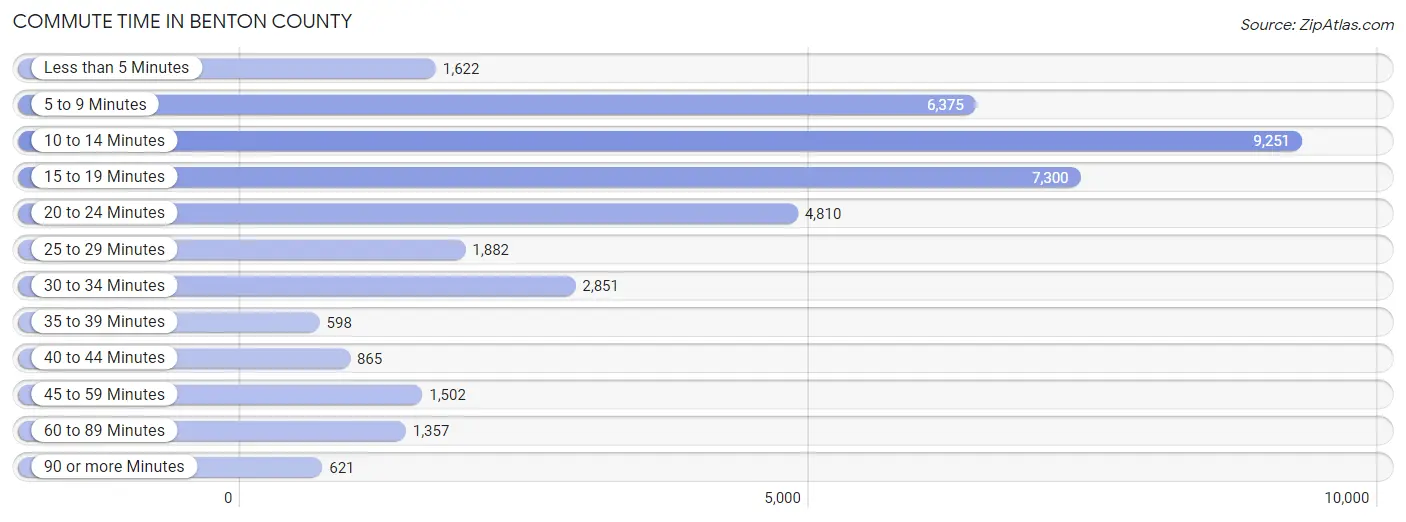
| Commute Time | # Commuters | % Commuters |
| Less than 5 Minutes | 1,622 | 4.2% |
| 5 to 9 Minutes | 6,375 | 16.3% |
| 10 to 14 Minutes | 9,251 | 23.7% |
| 15 to 19 Minutes | 7,300 | 18.7% |
| 20 to 24 Minutes | 4,810 | 12.3% |
| 25 to 29 Minutes | 1,882 | 4.8% |
| 30 to 34 Minutes | 2,851 | 7.3% |
| 35 to 39 Minutes | 598 | 1.5% |
| 40 to 44 Minutes | 865 | 2.2% |
| 45 to 59 Minutes | 1,502 | 3.8% |
| 60 to 89 Minutes | 1,357 | 3.5% |
| 90 or more Minutes | 621 | 1.6% |
Commute Time by Sex in Benton County
The most common commute times in Benton County are 10 to 14 minutes (4,873 commuters, 23.6%) for males and 10 to 14 minutes (4,378 commuters, 23.8%) for females.
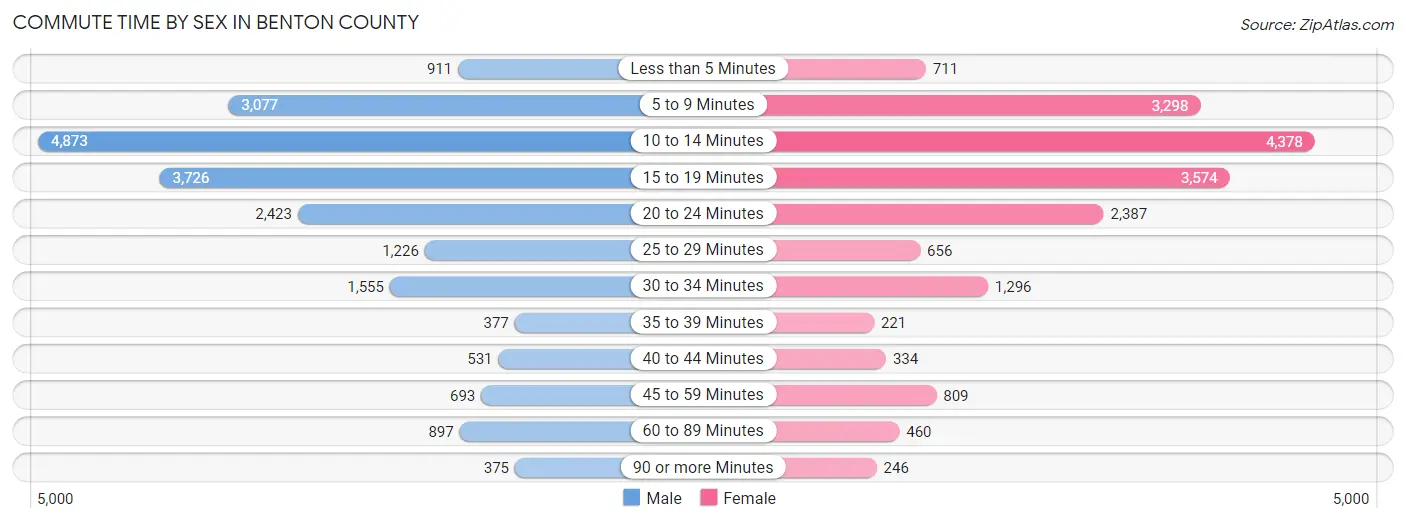
| Commute Time | Male | Female |
| Less than 5 Minutes | 911 (4.4%) | 711 (3.9%) |
| 5 to 9 Minutes | 3,077 (14.9%) | 3,298 (17.9%) |
| 10 to 14 Minutes | 4,873 (23.6%) | 4,378 (23.8%) |
| 15 to 19 Minutes | 3,726 (18.0%) | 3,574 (19.5%) |
| 20 to 24 Minutes | 2,423 (11.7%) | 2,387 (13.0%) |
| 25 to 29 Minutes | 1,226 (5.9%) | 656 (3.6%) |
| 30 to 34 Minutes | 1,555 (7.5%) | 1,296 (7.0%) |
| 35 to 39 Minutes | 377 (1.8%) | 221 (1.2%) |
| 40 to 44 Minutes | 531 (2.6%) | 334 (1.8%) |
| 45 to 59 Minutes | 693 (3.4%) | 809 (4.4%) |
| 60 to 89 Minutes | 897 (4.3%) | 460 (2.5%) |
| 90 or more Minutes | 375 (1.8%) | 246 (1.3%) |
Time of Departure to Work by Sex in Benton County
The most frequent times of departure to work in Benton County are 8:00 AM to 8:29 AM (2,937, 14.2%) for males and 8:00 AM to 8:29 AM (2,858, 15.6%) for females.
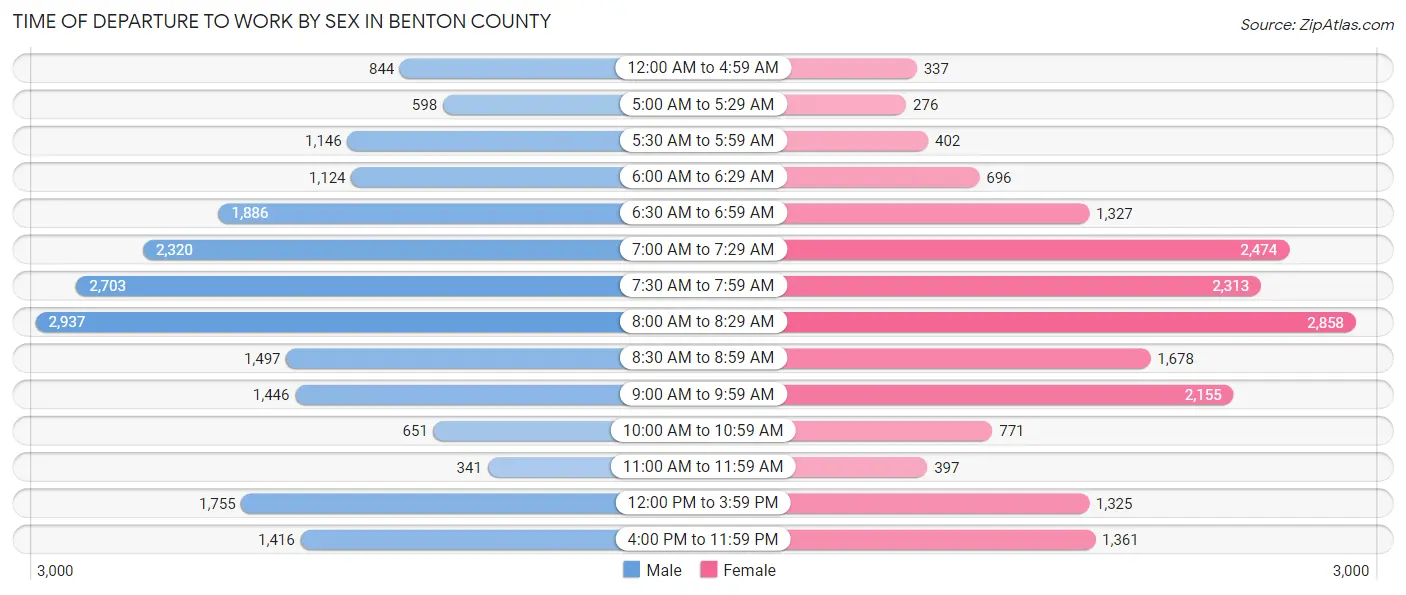
| Time of Departure | Male | Female |
| 12:00 AM to 4:59 AM | 844 (4.1%) | 337 (1.8%) |
| 5:00 AM to 5:29 AM | 598 (2.9%) | 276 (1.5%) |
| 5:30 AM to 5:59 AM | 1,146 (5.6%) | 402 (2.2%) |
| 6:00 AM to 6:29 AM | 1,124 (5.4%) | 696 (3.8%) |
| 6:30 AM to 6:59 AM | 1,886 (9.1%) | 1,327 (7.2%) |
| 7:00 AM to 7:29 AM | 2,320 (11.2%) | 2,474 (13.5%) |
| 7:30 AM to 7:59 AM | 2,703 (13.1%) | 2,313 (12.6%) |
| 8:00 AM to 8:29 AM | 2,937 (14.2%) | 2,858 (15.6%) |
| 8:30 AM to 8:59 AM | 1,497 (7.2%) | 1,678 (9.1%) |
| 9:00 AM to 9:59 AM | 1,446 (7.0%) | 2,155 (11.7%) |
| 10:00 AM to 10:59 AM | 651 (3.2%) | 771 (4.2%) |
| 11:00 AM to 11:59 AM | 341 (1.7%) | 397 (2.2%) |
| 12:00 PM to 3:59 PM | 1,755 (8.5%) | 1,325 (7.2%) |
| 4:00 PM to 11:59 PM | 1,416 (6.9%) | 1,361 (7.4%) |
| Total | 20,664 (100.0%) | 18,370 (100.0%) |
Housing Occupancy in Benton County
Occupancy by Ownership in Benton County
Of the total 37,853 dwellings in Benton County, owner-occupied units account for 21,191 (56.0%), while renter-occupied units make up 16,662 (44.0%).
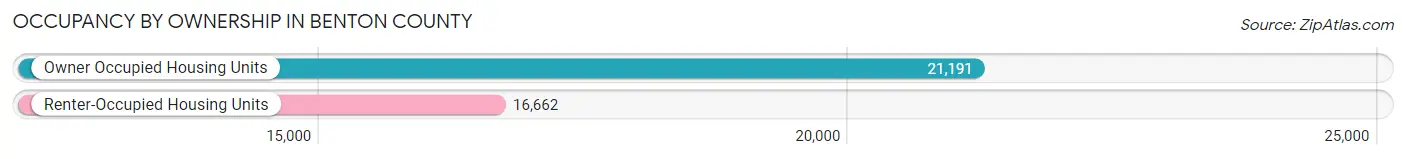
| Occupancy | # Housing Units | % Housing Units |
| Owner Occupied Housing Units | 21,191 | 56.0% |
| Renter-Occupied Housing Units | 16,662 | 44.0% |
| Total Occupied Housing Units | 37,853 | 100.0% |
Occupancy by Household Size in Benton County
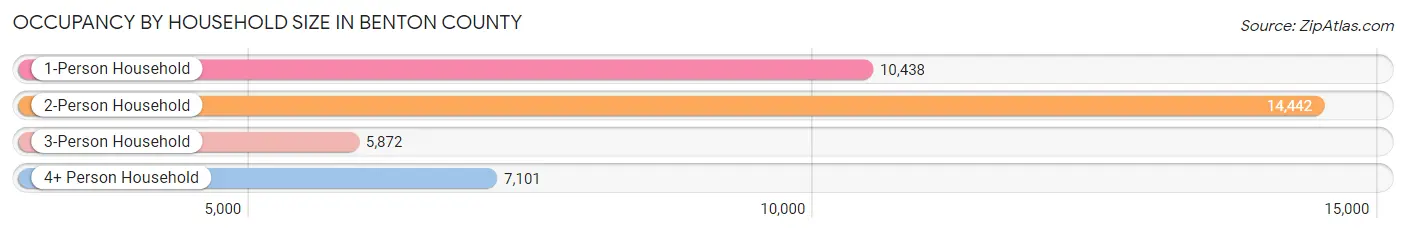
| Household Size | # Housing Units | % Housing Units |
| 1-Person Household | 10,438 | 27.6% |
| 2-Person Household | 14,442 | 38.2% |
| 3-Person Household | 5,872 | 15.5% |
| 4+ Person Household | 7,101 | 18.8% |
| Total Housing Units | 37,853 | 100.0% |
Occupancy by Ownership by Household Size in Benton County
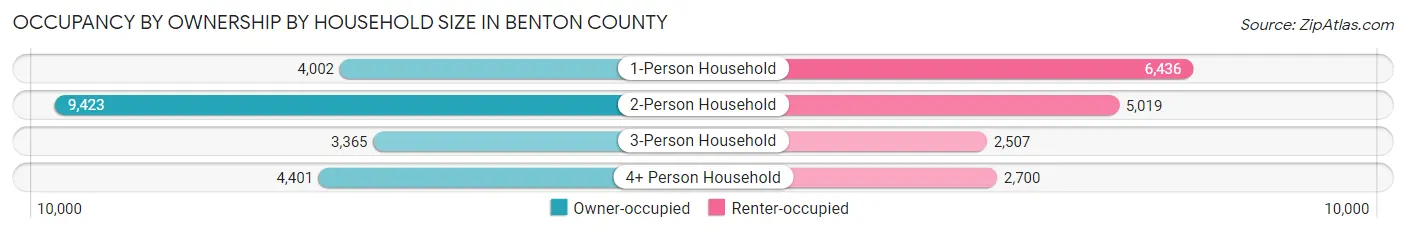
| Household Size | Owner-occupied | Renter-occupied |
| 1-Person Household | 4,002 (38.3%) | 6,436 (61.7%) |
| 2-Person Household | 9,423 (65.2%) | 5,019 (34.7%) |
| 3-Person Household | 3,365 (57.3%) | 2,507 (42.7%) |
| 4+ Person Household | 4,401 (62.0%) | 2,700 (38.0%) |
| Total Housing Units | 21,191 (56.0%) | 16,662 (44.0%) |
Occupancy by Educational Attainment in Benton County
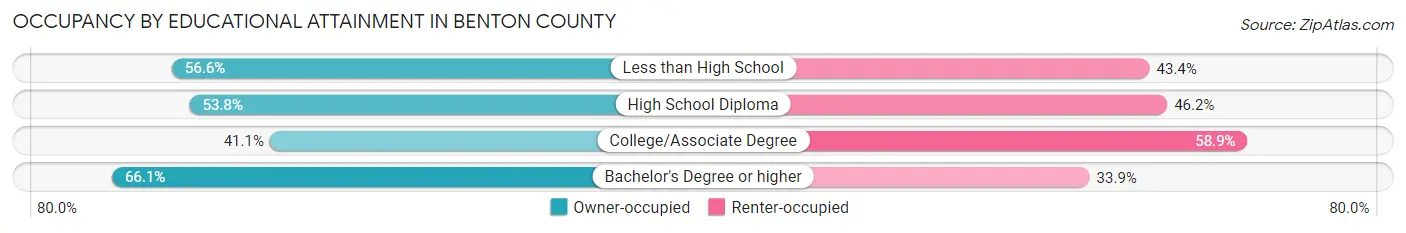
| Household Size | Owner-occupied | Renter-occupied |
| Less than High School | 692 (56.6%) | 530 (43.4%) |
| High School Diploma | 2,263 (53.8%) | 1,940 (46.2%) |
| College/Associate Degree | 5,279 (41.1%) | 7,558 (58.9%) |
| Bachelor's Degree or higher | 12,957 (66.1%) | 6,634 (33.9%) |
Occupancy by Age of Householder in Benton County
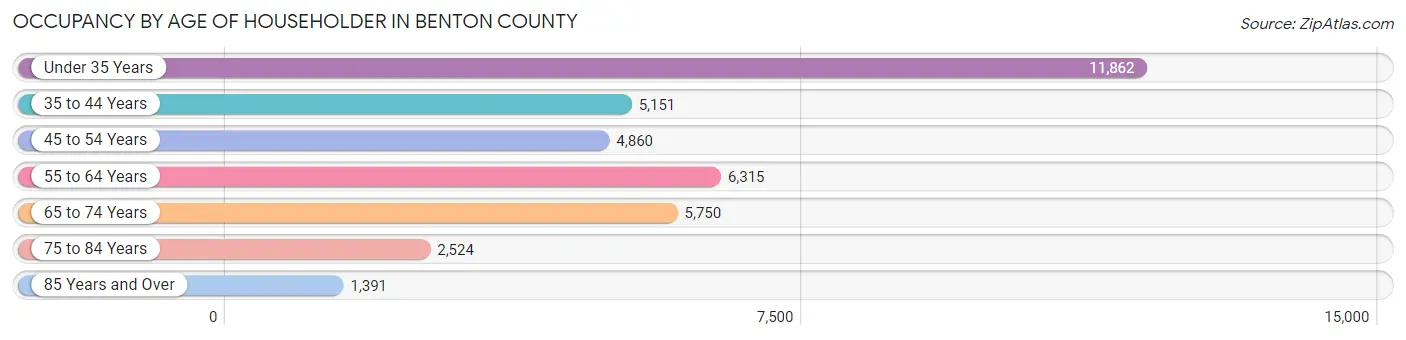
| Age Bracket | # Households | % Households |
| Under 35 Years | 11,862 | 31.3% |
| 35 to 44 Years | 5,151 | 13.6% |
| 45 to 54 Years | 4,860 | 12.8% |
| 55 to 64 Years | 6,315 | 16.7% |
| 65 to 74 Years | 5,750 | 15.2% |
| 75 to 84 Years | 2,524 | 6.7% |
| 85 Years and Over | 1,391 | 3.7% |
| Total | 37,853 | 100.0% |
Housing Finances in Benton County
Median Income by Occupancy in Benton County
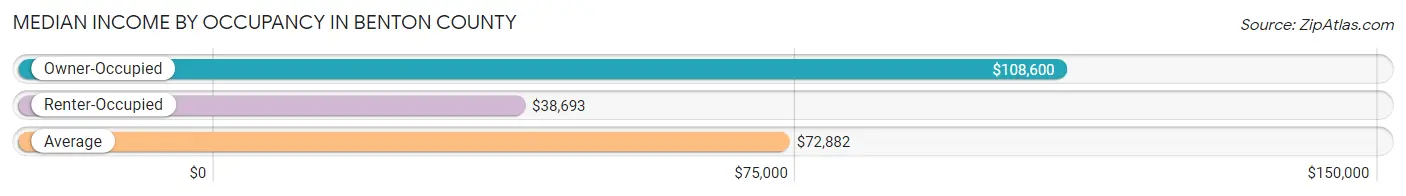
| Occupancy Type | # Households | Median Income |
| Owner-Occupied | 21,191 (56.0%) | $108,600 |
| Renter-Occupied | 16,662 (44.0%) | $38,693 |
| Average | 37,853 (100.0%) | $72,882 |
Occupancy by Householder Income Bracket in Benton County
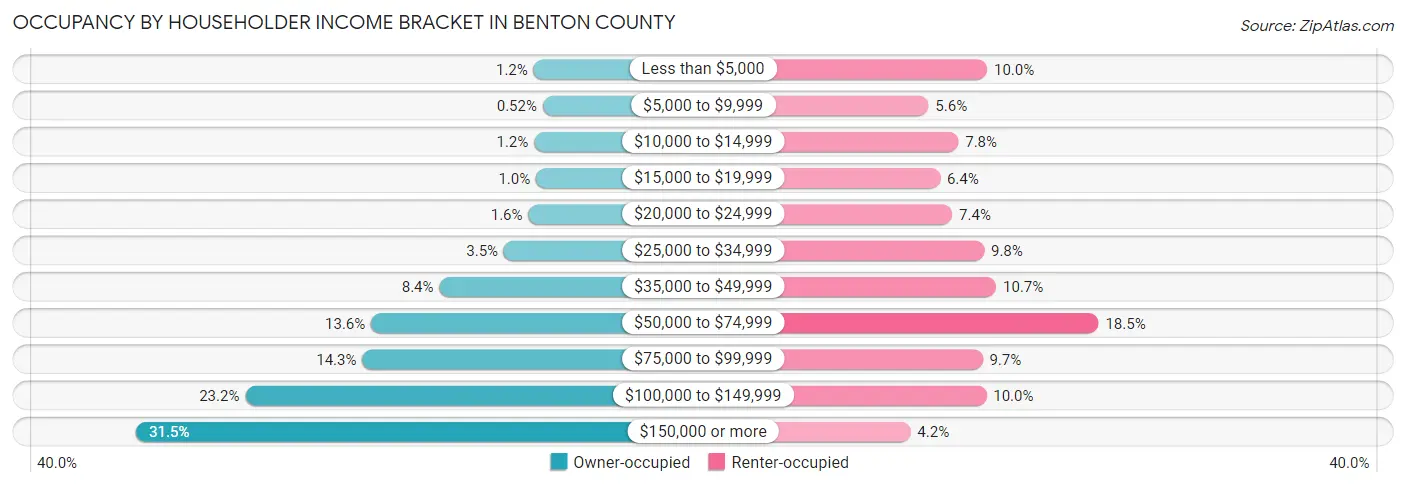
| Income Bracket | Owner-occupied | Renter-occupied |
| Less than $5,000 | 259 (1.2%) | 1,670 (10.0%) |
| $5,000 to $9,999 | 110 (0.5%) | 925 (5.6%) |
| $10,000 to $14,999 | 250 (1.2%) | 1,304 (7.8%) |
| $15,000 to $19,999 | 219 (1.0%) | 1,071 (6.4%) |
| $20,000 to $24,999 | 343 (1.6%) | 1,226 (7.4%) |
| $25,000 to $34,999 | 737 (3.5%) | 1,631 (9.8%) |
| $35,000 to $49,999 | 1,779 (8.4%) | 1,784 (10.7%) |
| $50,000 to $74,999 | 2,881 (13.6%) | 3,084 (18.5%) |
| $75,000 to $99,999 | 3,023 (14.3%) | 1,612 (9.7%) |
| $100,000 to $149,999 | 4,915 (23.2%) | 1,659 (10.0%) |
| $150,000 or more | 6,675 (31.5%) | 696 (4.2%) |
| Total | 21,191 (100.0%) | 16,662 (100.0%) |
Monthly Housing Cost Tiers in Benton County
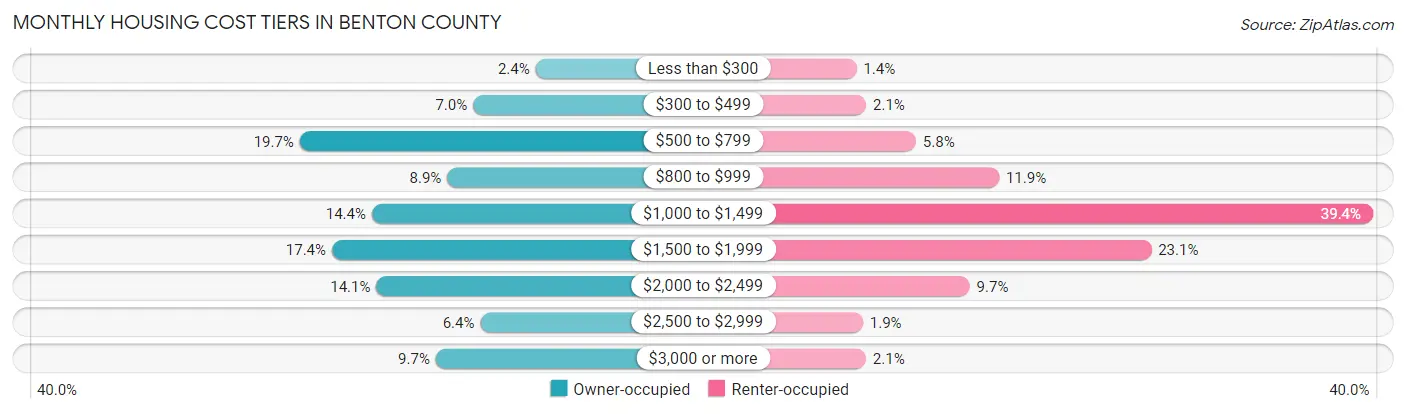
| Monthly Cost | Owner-occupied | Renter-occupied |
| Less than $300 | 502 (2.4%) | 233 (1.4%) |
| $300 to $499 | 1,476 (7.0%) | 352 (2.1%) |
| $500 to $799 | 4,183 (19.7%) | 963 (5.8%) |
| $800 to $999 | 1,882 (8.9%) | 1,982 (11.9%) |
| $1,000 to $1,499 | 3,057 (14.4%) | 6,569 (39.4%) |
| $1,500 to $1,999 | 3,681 (17.4%) | 3,851 (23.1%) |
| $2,000 to $2,499 | 2,987 (14.1%) | 1,623 (9.7%) |
| $2,500 to $2,999 | 1,364 (6.4%) | 311 (1.9%) |
| $3,000 or more | 2,059 (9.7%) | 350 (2.1%) |
| Total | 21,191 (100.0%) | 16,662 (100.0%) |
Physical Housing Characteristics in Benton County
Housing Structures in Benton County
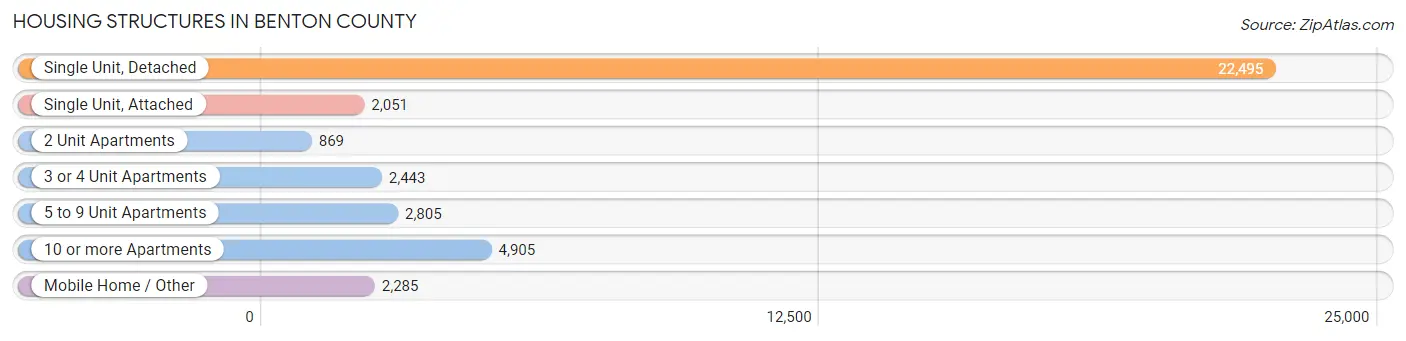
| Structure Type | # Housing Units | % Housing Units |
| Single Unit, Detached | 22,495 | 59.4% |
| Single Unit, Attached | 2,051 | 5.4% |
| 2 Unit Apartments | 869 | 2.3% |
| 3 or 4 Unit Apartments | 2,443 | 6.5% |
| 5 to 9 Unit Apartments | 2,805 | 7.4% |
| 10 or more Apartments | 4,905 | 13.0% |
| Mobile Home / Other | 2,285 | 6.0% |
| Total | 37,853 | 100.0% |
Housing Structures by Occupancy in Benton County
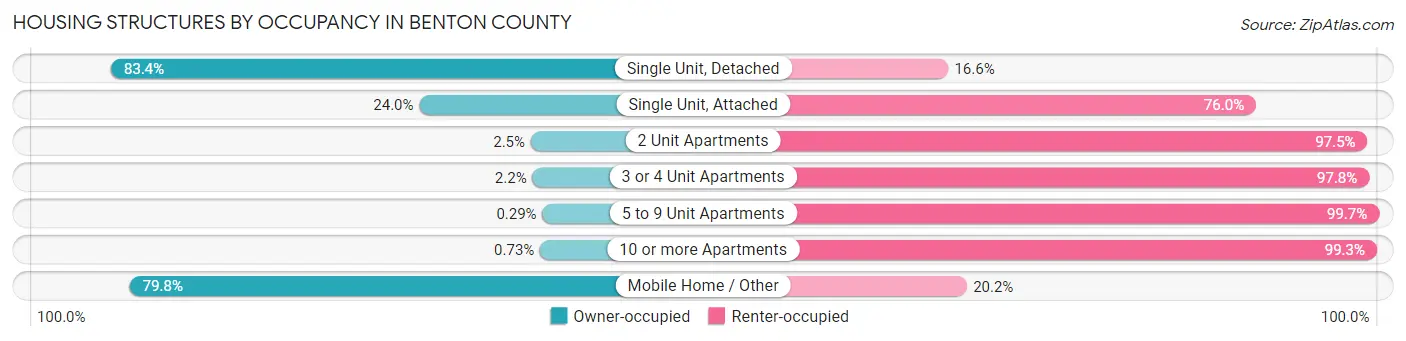
| Structure Type | Owner-occupied | Renter-occupied |
| Single Unit, Detached | 18,756 (83.4%) | 3,739 (16.6%) |
| Single Unit, Attached | 492 (24.0%) | 1,559 (76.0%) |
| 2 Unit Apartments | 22 (2.5%) | 847 (97.5%) |
| 3 or 4 Unit Apartments | 54 (2.2%) | 2,389 (97.8%) |
| 5 to 9 Unit Apartments | 8 (0.3%) | 2,797 (99.7%) |
| 10 or more Apartments | 36 (0.7%) | 4,869 (99.3%) |
| Mobile Home / Other | 1,823 (79.8%) | 462 (20.2%) |
| Total | 21,191 (56.0%) | 16,662 (44.0%) |
Housing Structures by Number of Rooms in Benton County
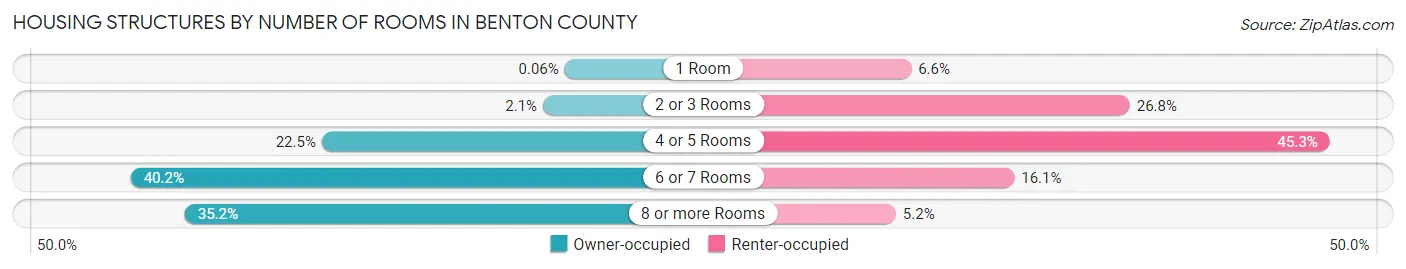
| Number of Rooms | Owner-occupied | Renter-occupied |
| 1 Room | 12 (0.1%) | 1,098 (6.6%) |
| 2 or 3 Rooms | 437 (2.1%) | 4,467 (26.8%) |
| 4 or 5 Rooms | 4,773 (22.5%) | 7,546 (45.3%) |
| 6 or 7 Rooms | 8,514 (40.2%) | 2,688 (16.1%) |
| 8 or more Rooms | 7,455 (35.2%) | 863 (5.2%) |
| Total | 21,191 (100.0%) | 16,662 (100.0%) |
Housing Structure by Heating Type in Benton County
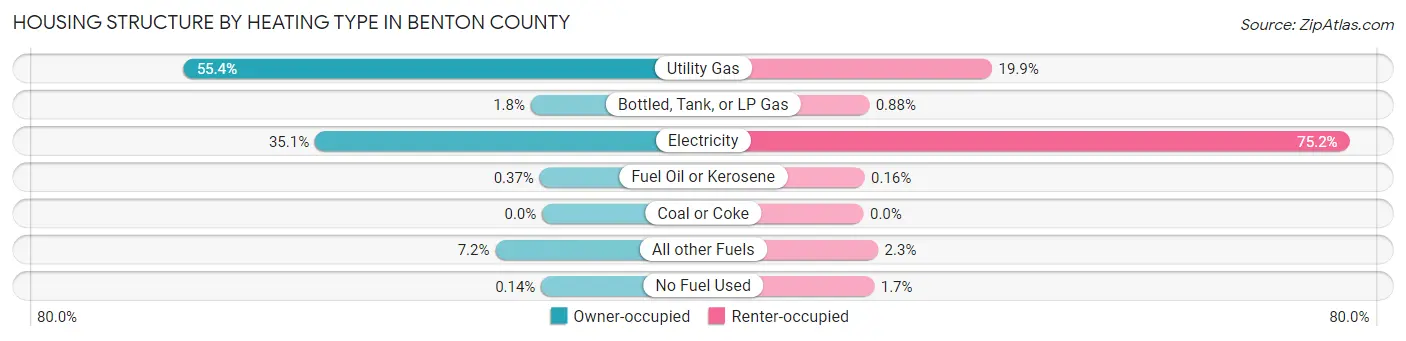
| Heating Type | Owner-occupied | Renter-occupied |
| Utility Gas | 11,738 (55.4%) | 3,311 (19.9%) |
| Bottled, Tank, or LP Gas | 371 (1.8%) | 146 (0.9%) |
| Electricity | 7,441 (35.1%) | 12,527 (75.2%) |
| Fuel Oil or Kerosene | 79 (0.4%) | 26 (0.2%) |
| Coal or Coke | 0 (0.0%) | 0 (0.0%) |
| All other Fuels | 1,533 (7.2%) | 376 (2.3%) |
| No Fuel Used | 29 (0.1%) | 276 (1.7%) |
| Total | 21,191 (100.0%) | 16,662 (100.0%) |
Household Vehicle Usage in Benton County
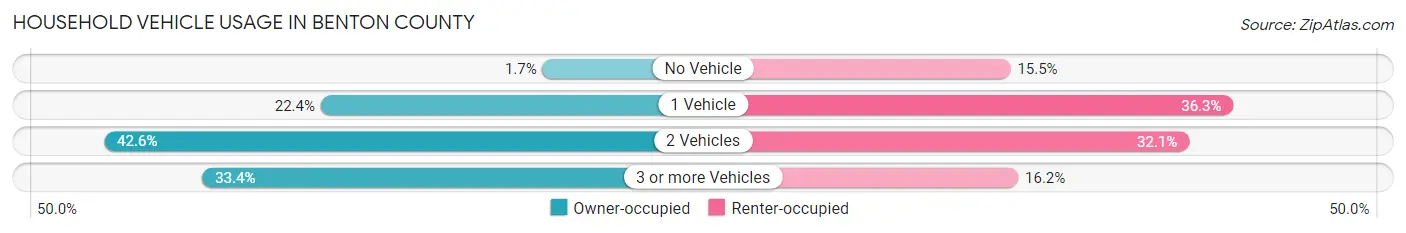
| Vehicles per Household | Owner-occupied | Renter-occupied |
| No Vehicle | 349 (1.7%) | 2,574 (15.4%) |
| 1 Vehicle | 4,737 (22.4%) | 6,040 (36.2%) |
| 2 Vehicles | 9,023 (42.6%) | 5,353 (32.1%) |
| 3 or more Vehicles | 7,082 (33.4%) | 2,695 (16.2%) |
| Total | 21,191 (100.0%) | 16,662 (100.0%) |
Real Estate & Mortgages in Benton County
Real Estate and Mortgage Overview in Benton County
| Characteristic | Without Mortgage | With Mortgage |
| Housing Units | 8,975 | 12,216 |
| Median Property Value | $416,400 | $453,900 |
| Median Household Income | $90,216 | $4,424 |
| Monthly Housing Costs | $698 | $2,059 |
| Real Estate Taxes | $4,470 | $157 |
Property Value by Mortgage Status in Benton County
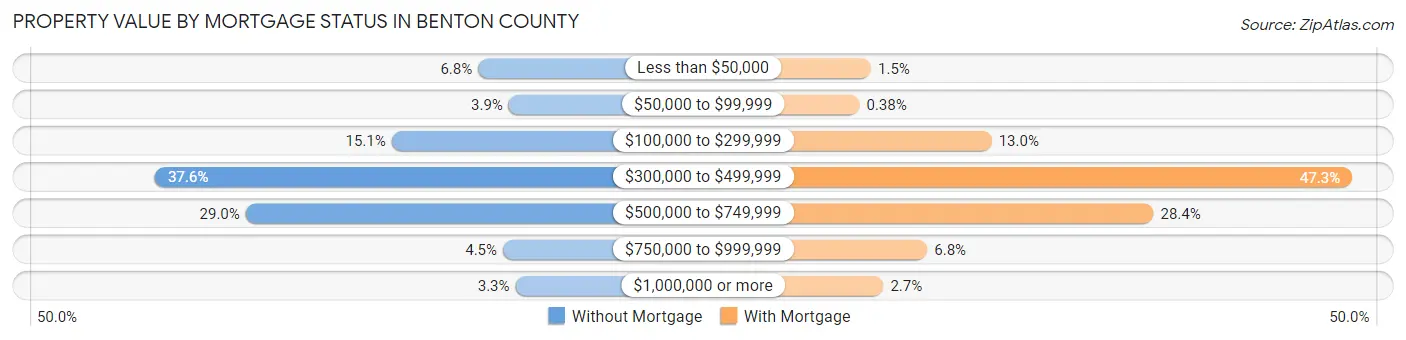
| Property Value | Without Mortgage | With Mortgage |
| Less than $50,000 | 611 (6.8%) | 181 (1.5%) |
| $50,000 to $99,999 | 350 (3.9%) | 47 (0.4%) |
| $100,000 to $299,999 | 1,351 (15.0%) | 1,584 (13.0%) |
| $300,000 to $499,999 | 3,373 (37.6%) | 5,776 (47.3%) |
| $500,000 to $749,999 | 2,598 (28.9%) | 3,467 (28.4%) |
| $750,000 to $999,999 | 399 (4.4%) | 836 (6.8%) |
| $1,000,000 or more | 293 (3.3%) | 325 (2.7%) |
| Total | 8,975 (100.0%) | 12,216 (100.0%) |
Household Income by Mortgage Status in Benton County
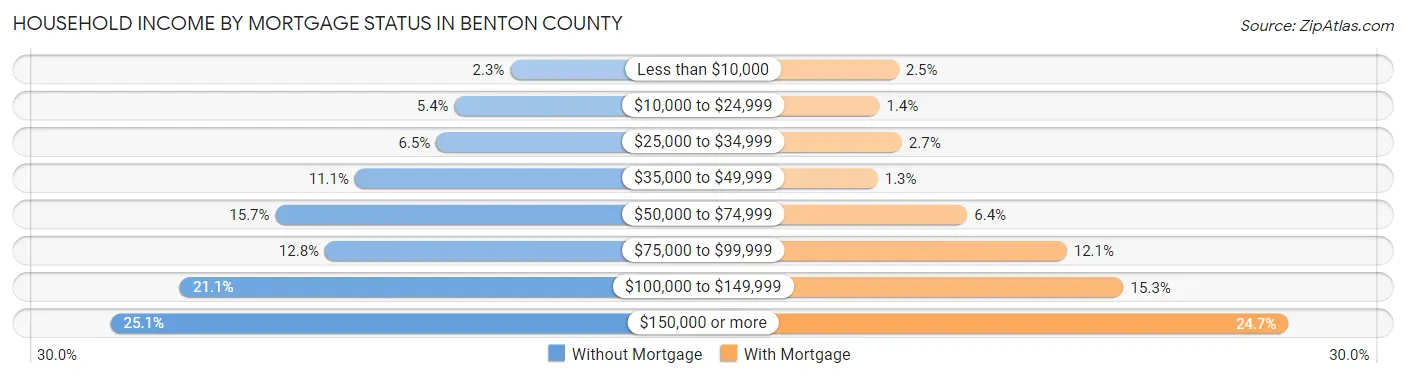
| Household Income | Without Mortgage | With Mortgage |
| Less than $10,000 | 202 (2.2%) | 302 (2.5%) |
| $10,000 to $24,999 | 488 (5.4%) | 167 (1.4%) |
| $25,000 to $34,999 | 582 (6.5%) | 324 (2.6%) |
| $35,000 to $49,999 | 999 (11.1%) | 155 (1.3%) |
| $50,000 to $74,999 | 1,406 (15.7%) | 780 (6.4%) |
| $75,000 to $99,999 | 1,152 (12.8%) | 1,475 (12.1%) |
| $100,000 to $149,999 | 1,895 (21.1%) | 1,871 (15.3%) |
| $150,000 or more | 2,251 (25.1%) | 3,020 (24.7%) |
| Total | 8,975 (100.0%) | 12,216 (100.0%) |
Property Value to Household Income Ratio in Benton County
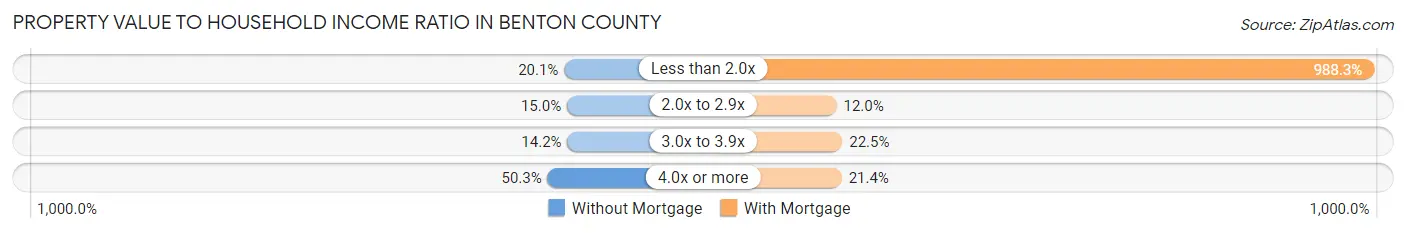
| Value-to-Income Ratio | Without Mortgage | With Mortgage |
| Less than 2.0x | 1,800 (20.1%) | 120,732 (988.3%) |
| 2.0x to 2.9x | 1,346 (15.0%) | 1,467 (12.0%) |
| 3.0x to 3.9x | 1,275 (14.2%) | 2,750 (22.5%) |
| 4.0x or more | 4,512 (50.3%) | 2,615 (21.4%) |
| Total | 8,975 (100.0%) | 12,216 (100.0%) |
Real Estate Taxes by Mortgage Status in Benton County
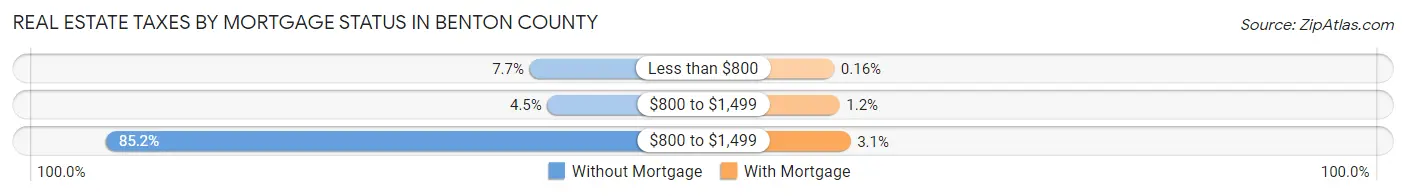
| Property Taxes | Without Mortgage | With Mortgage |
| Less than $800 | 694 (7.7%) | 20 (0.2%) |
| $800 to $1,499 | 401 (4.5%) | 140 (1.1%) |
| $800 to $1,499 | 7,642 (85.2%) | 383 (3.1%) |
| Total | 8,975 (100.0%) | 12,216 (100.0%) |
Health & Disability in Benton County
Health Insurance Coverage by Age in Benton County
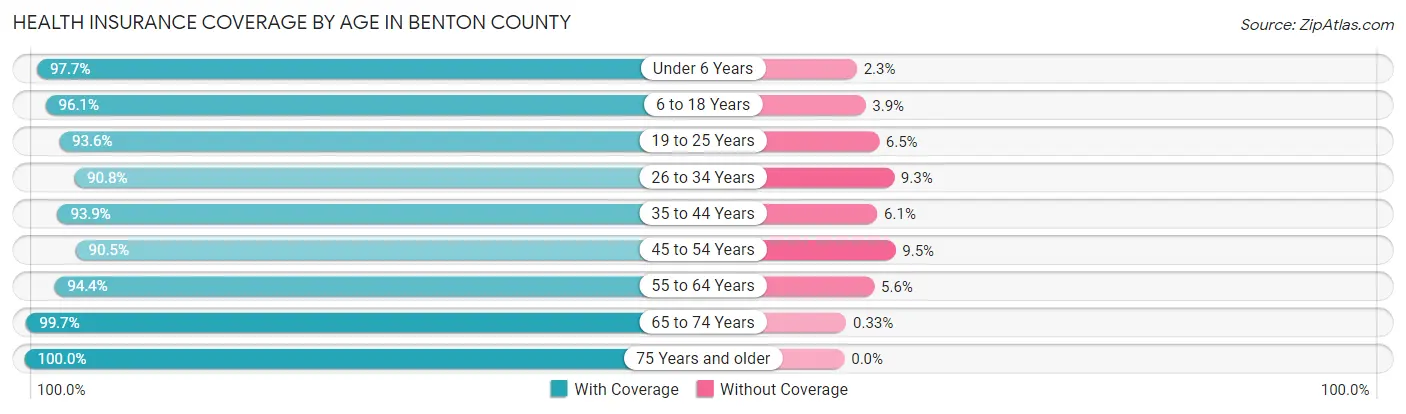
| Age Bracket | With Coverage | Without Coverage |
| Under 6 Years | 4,248 (97.7%) | 101 (2.3%) |
| 6 to 18 Years | 13,173 (96.1%) | 537 (3.9%) |
| 19 to 25 Years | 19,490 (93.5%) | 1,344 (6.5%) |
| 26 to 34 Years | 9,581 (90.7%) | 976 (9.2%) |
| 35 to 44 Years | 9,476 (93.9%) | 619 (6.1%) |
| 45 to 54 Years | 8,367 (90.5%) | 880 (9.5%) |
| 55 to 64 Years | 9,971 (94.4%) | 587 (5.6%) |
| 65 to 74 Years | 9,924 (99.7%) | 33 (0.3%) |
| 75 Years and older | 6,084 (100.0%) | 0 (0.0%) |
| Total | 90,314 (94.7%) | 5,077 (5.3%) |
Health Insurance Coverage by Citizenship Status in Benton County
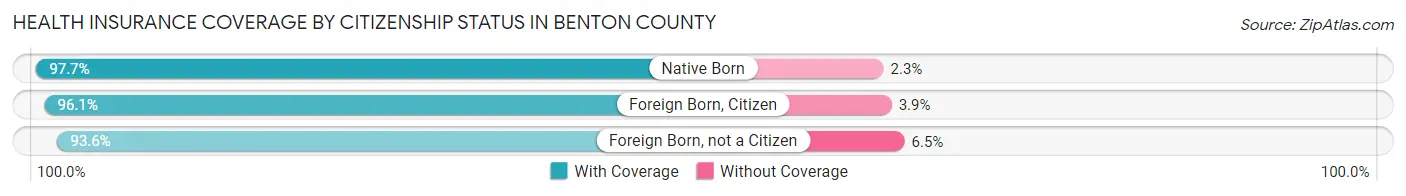
| Citizenship Status | With Coverage | Without Coverage |
| Native Born | 4,248 (97.7%) | 101 (2.3%) |
| Foreign Born, Citizen | 13,173 (96.1%) | 537 (3.9%) |
| Foreign Born, not a Citizen | 19,490 (93.5%) | 1,344 (6.5%) |
Health Insurance Coverage by Household Income in Benton County
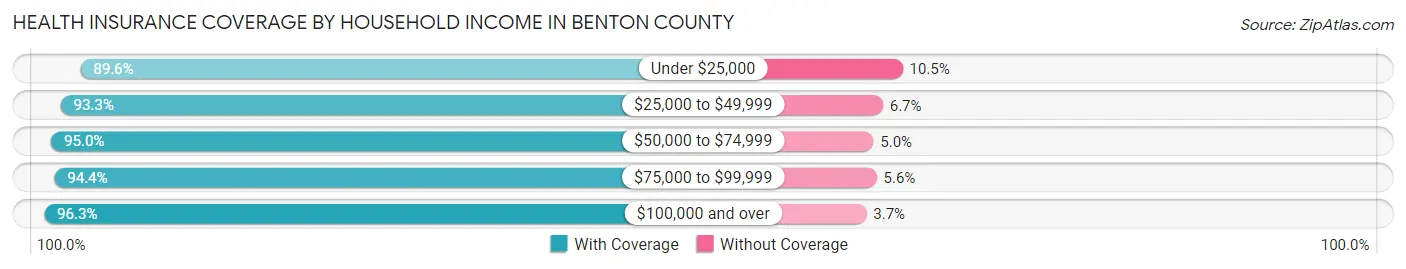
| Household Income | With Coverage | Without Coverage |
| Under $25,000 | 11,144 (89.5%) | 1,300 (10.4%) |
| $25,000 to $49,999 | 11,291 (93.3%) | 816 (6.7%) |
| $50,000 to $74,999 | 12,391 (95.0%) | 649 (5.0%) |
| $75,000 to $99,999 | 11,466 (94.4%) | 678 (5.6%) |
| $100,000 and over | 38,296 (96.3%) | 1,460 (3.7%) |
Public vs Private Health Insurance Coverage by Age in Benton County
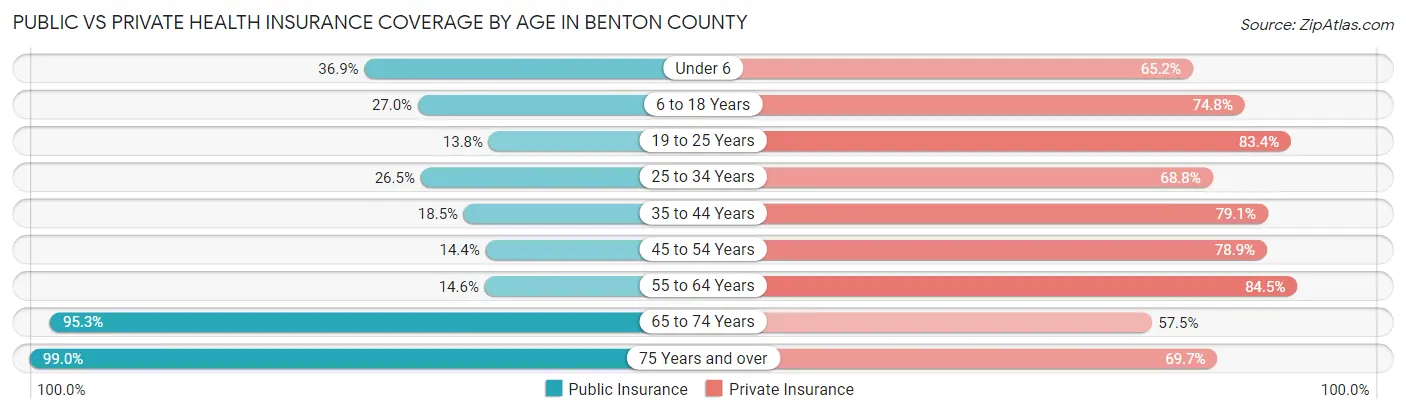
| Age Bracket | Public Insurance | Private Insurance |
| Under 6 | 1,606 (36.9%) | 2,834 (65.2%) |
| 6 to 18 Years | 3,700 (27.0%) | 10,254 (74.8%) |
| 19 to 25 Years | 2,882 (13.8%) | 17,369 (83.4%) |
| 25 to 34 Years | 2,794 (26.5%) | 7,264 (68.8%) |
| 35 to 44 Years | 1,864 (18.5%) | 7,980 (79.0%) |
| 45 to 54 Years | 1,335 (14.4%) | 7,297 (78.9%) |
| 55 to 64 Years | 1,540 (14.6%) | 8,925 (84.5%) |
| 65 to 74 Years | 9,488 (95.3%) | 5,720 (57.5%) |
| 75 Years and over | 6,024 (99.0%) | 4,242 (69.7%) |
| Total | 31,233 (32.7%) | 71,885 (75.4%) |
Disability Status by Sex by Age in Benton County
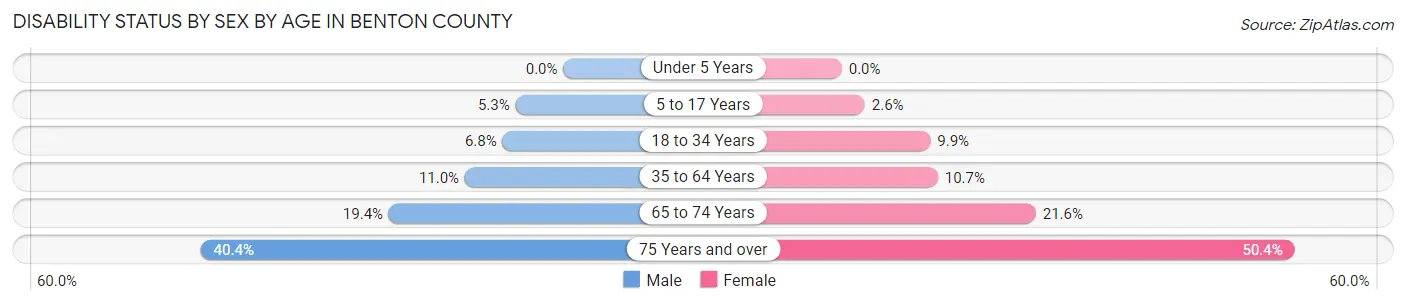
| Age Bracket | Male | Female |
| Under 5 Years | 0 (0.0%) | 0 (0.0%) |
| 5 to 17 Years | 306 (5.3%) | 141 (2.6%) |
| 18 to 34 Years | 1,241 (6.8%) | 1,612 (9.9%) |
| 35 to 64 Years | 1,616 (11.0%) | 1,620 (10.7%) |
| 65 to 74 Years | 958 (19.4%) | 1,086 (21.6%) |
| 75 Years and over | 1,030 (40.4%) | 1,782 (50.4%) |
Disability Class by Sex by Age in Benton County
Disability Class: Hearing Difficulty
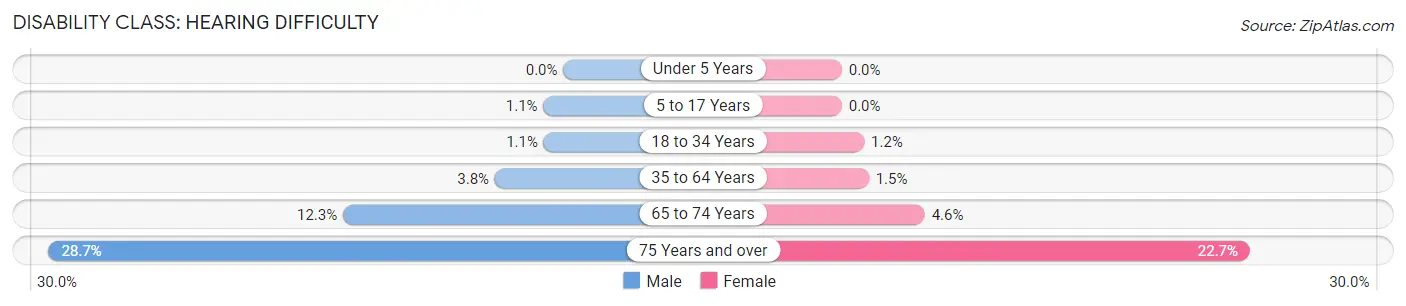
| Age Bracket | Male | Female |
| Under 5 Years | 0 (0.0%) | 0 (0.0%) |
| 5 to 17 Years | 64 (1.1%) | 0 (0.0%) |
| 18 to 34 Years | 200 (1.1%) | 202 (1.2%) |
| 35 to 64 Years | 562 (3.8%) | 227 (1.5%) |
| 65 to 74 Years | 605 (12.3%) | 232 (4.6%) |
| 75 Years and over | 731 (28.7%) | 803 (22.7%) |
Disability Class: Vision Difficulty
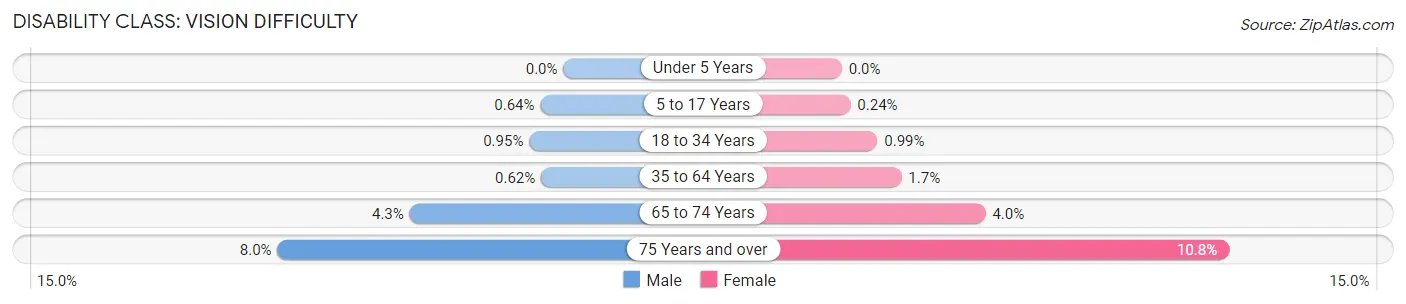
| Age Bracket | Male | Female |
| Under 5 Years | 0 (0.0%) | 0 (0.0%) |
| 5 to 17 Years | 37 (0.6%) | 13 (0.2%) |
| 18 to 34 Years | 174 (0.9%) | 162 (1.0%) |
| 35 to 64 Years | 91 (0.6%) | 252 (1.7%) |
| 65 to 74 Years | 211 (4.3%) | 201 (4.0%) |
| 75 Years and over | 203 (8.0%) | 381 (10.8%) |
Disability Class: Cognitive Difficulty
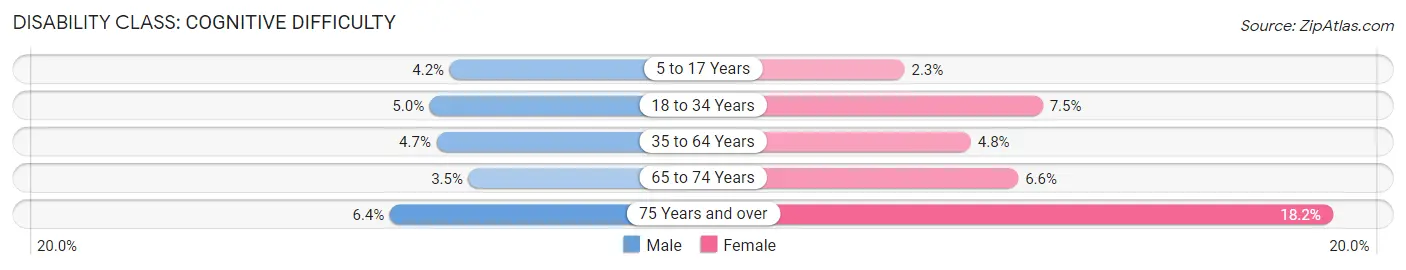
| Age Bracket | Male | Female |
| 5 to 17 Years | 242 (4.2%) | 128 (2.3%) |
| 18 to 34 Years | 908 (5.0%) | 1,220 (7.5%) |
| 35 to 64 Years | 693 (4.7%) | 726 (4.8%) |
| 65 to 74 Years | 173 (3.5%) | 329 (6.6%) |
| 75 Years and over | 164 (6.4%) | 644 (18.2%) |
Disability Class: Ambulatory Difficulty
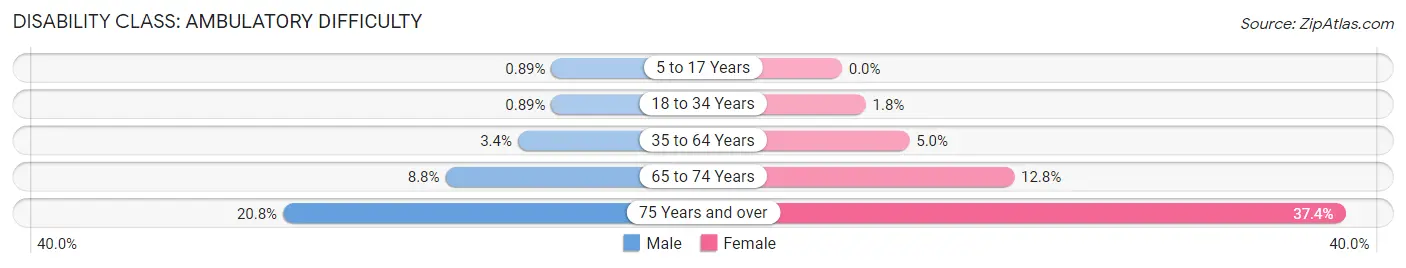
| Age Bracket | Male | Female |
| 5 to 17 Years | 51 (0.9%) | 0 (0.0%) |
| 18 to 34 Years | 164 (0.9%) | 290 (1.8%) |
| 35 to 64 Years | 498 (3.4%) | 760 (5.0%) |
| 65 to 74 Years | 432 (8.8%) | 643 (12.8%) |
| 75 Years and over | 531 (20.8%) | 1,321 (37.4%) |
Disability Class: Self-Care Difficulty
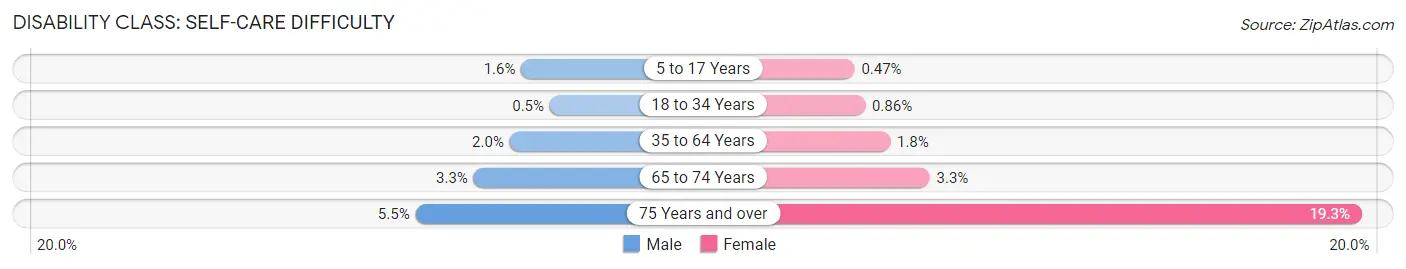
| Age Bracket | Male | Female |
| 5 to 17 Years | 90 (1.6%) | 26 (0.5%) |
| 18 to 34 Years | 92 (0.5%) | 140 (0.9%) |
| 35 to 64 Years | 294 (2.0%) | 272 (1.8%) |
| 65 to 74 Years | 164 (3.3%) | 164 (3.3%) |
| 75 Years and over | 140 (5.5%) | 682 (19.3%) |
Technology Access in Benton County
Computing Device Access in Benton County
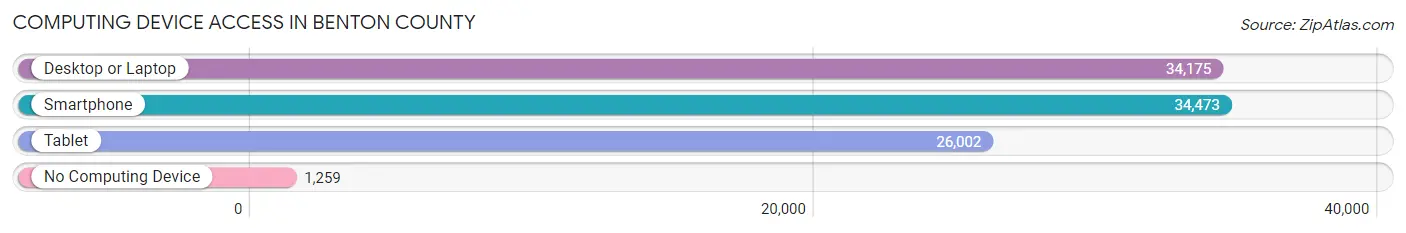
| Device Type | # Households | % Households |
| Desktop or Laptop | 34,175 | 90.3% |
| Smartphone | 34,473 | 91.1% |
| Tablet | 26,002 | 68.7% |
| No Computing Device | 1,259 | 3.3% |
| Total | 37,853 | 100.0% |
Internet Access in Benton County
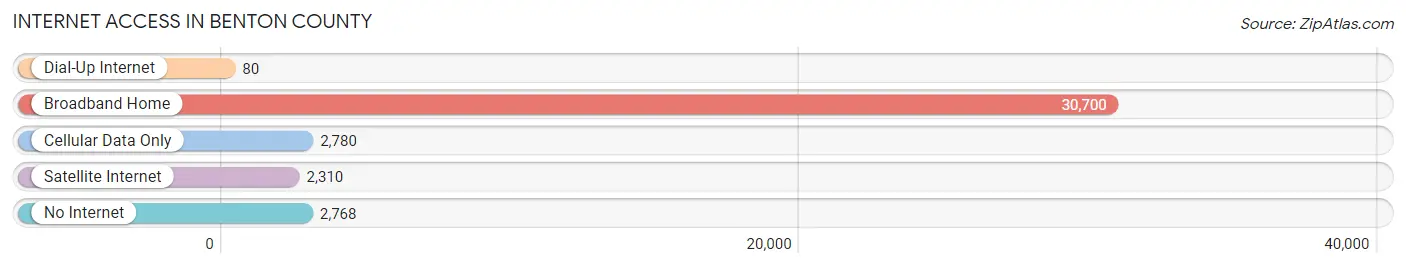
| Internet Type | # Households | % Households |
| Dial-Up Internet | 80 | 0.2% |
| Broadband Home | 30,700 | 81.1% |
| Cellular Data Only | 2,780 | 7.3% |
| Satellite Internet | 2,310 | 6.1% |
| No Internet | 2,768 | 7.3% |
| Total | 37,853 | 100.0% |
Benton County Summary
Benton County is located in the Willamette Valley of Oregon, and is part of the Corvallis Metropolitan Statistical Area. It is bordered by Linn County to the north, Polk County to the east, Lincoln County to the south, and the Pacific Ocean to the west. The county seat is Corvallis, and the largest city is Corvallis. As of the 2010 census, the population was 85,579.
History
Benton County was created in 1847 and named after Thomas Hart Benton, a U.S. Senator from Missouri. The county was originally part of the Oregon Territory, and was later part of the Oregon Provisional Government. In 1854, the county was divided into two parts, with the northern part becoming Linn County and the southern part becoming Benton County.
The county was largely rural until the 1950s, when the population began to grow rapidly due to the influx of people from other parts of the country. The growth was fueled by the expansion of Oregon State University, which is located in Corvallis.
Geography
Benton County is located in the Willamette Valley of Oregon, and is part of the Corvallis Metropolitan Statistical Area. It is bordered by Linn County to the north, Polk County to the east, Lincoln County to the south, and the Pacific Ocean to the west. The county has a total area of 541 square miles, of which 537 square miles is land and 4.2 square miles is water.
The county is mostly flat, with some rolling hills in the western part of the county. The Willamette River runs through the county, and there are several lakes and reservoirs in the area. The climate is mild, with cool, wet winters and warm, dry summers.
Economy
Benton County has a diverse economy, with a mix of agriculture, manufacturing, technology, and services. The county is home to Oregon State University, which is the largest employer in the county. Other major employers include Hewlett-Packard, Samaritan Health Services, and the Corvallis School District.
Agriculture is an important part of the economy, with the county producing a variety of crops, including grass seed, wheat, hay, and vegetables. The county is also home to several wineries and breweries.
Manufacturing is also an important part of the economy, with the county producing a variety of products, including electronics, wood products, and food products.
Technology is also an important part of the economy, with several companies located in the county, including Hewlett-Packard, Intel, and IBM.
Demographics
As of the 2010 census, the population of Benton County was 85,579. The population is fairly evenly split between men and women, with 49.3% male and 50.7% female. The median age is 33.7 years, and the median household income is $50,945.
The racial makeup of the county is 87.3% White, 4.2% Hispanic or Latino, 2.7% Asian, 1.3% African American, 0.7% Native American, and 0.2% Pacific Islander.
The largest religious group in the county is Christianity, with 58.3% of the population identifying as Christian. Other religious groups include Judaism (2.2%), Islam (1.2%), Buddhism (0.7%), and Hinduism (0.3%).
Conclusion
Benton County is located in the Willamette Valley of Oregon, and is part of the Corvallis Metropolitan Statistical Area. It is bordered by Linn County to the north, Polk County to the east, Lincoln County to the south, and the Pacific Ocean to the west. The county has a diverse economy, with a mix of agriculture, manufacturing, technology, and services. The population of Benton County is 85,579, and is fairly evenly split between men and women. The largest religious group in the county is Christianity, with 58.3% of the population identifying as Christian.
Common Questions
What is the Total Population of Benton County?
Total Population of Benton County is 95,615.
What is the Total Male Population of Benton County?
Total Male Population of Benton County is 48,293.
What is the Total Female Population of Benton County?
Total Female Population of Benton County is 47,322.
What is the Ratio of Males per 100 Females in Benton County?
There are 102.05 Males per 100 Females in Benton County.
What is the Ratio of Females per 100 Males in Benton County?
There are 97.99 Females per 100 Males in Benton County.
What is the Median Population Age in Benton County?
Median Population Age in Benton County is 33.5 Years.
What is the Average Family Size in Benton County
Average Family Size in Benton County is 2.8 People.
What is the Average Household Size in Benton County
Average Household Size in Benton County is 2.4 People.
What is Per Capita Income in Benton County?
Per Capita income in Benton County is $39,940.
What is the Median Family Income in Benton County?
Median Family Income in Benton County is $106,149.
What is the Median Household income in Benton County?
Median Household Income in Benton County is $72,882.
What is Income or Wage Gap in Benton County?
Income or Wage Gap in Benton County is 27.0%.
Women in Benton County earn 73.0 cents for every dollar earned by a man.
What is Family Income Deficit in Benton County?
Family Income Deficit in Benton County is $11,926.
Families that are below poverty line in Benton County earn $11,926 less on average than the poverty threshold level.
What is Inequality or Gini Index in Benton County?
Inequality or Gini Index in Benton County is 0.47.
How Large is the Labor Force in Benton County?
There are 49,986 People in the Labor Forcein in Benton County.
What is the Percentage of People in the Labor Force in Benton County?
60.5% of People are in the Labor Force in Benton County.
What is the Unemployment Rate in Benton County?
Unemployment Rate in Benton County is 6.8%.