Baker County, OR
Baker County Map
Baker County Overview
16,685
TOTAL POPULATION
8,629
MALE POPULATION
8,056
FEMALE POPULATION
107.11
MALES / 100 FEMALES
93.36
FEMALES / 100 MALES
47.4
MEDIAN AGE
3.0
AVG FAMILY SIZE
2.3
AVG HOUSEHOLD SIZE
$32,672
PER CAPITA INCOME
$66,780
AVG FAMILY INCOME
$51,657
AVG HOUSEHOLD INCOME
46.4%
WAGE / INCOME GAP [ % ]
53.6¢/ $1
WAGE / INCOME GAP [ $ ]
0.47
INEQUALITY / GINI INDEX
6,627
LABOR FORCE [ PEOPLE ]
48.2%
PERCENT IN LABOR FORCE
5.5%
UNEMPLOYMENT RATE
Baker County Area Codes
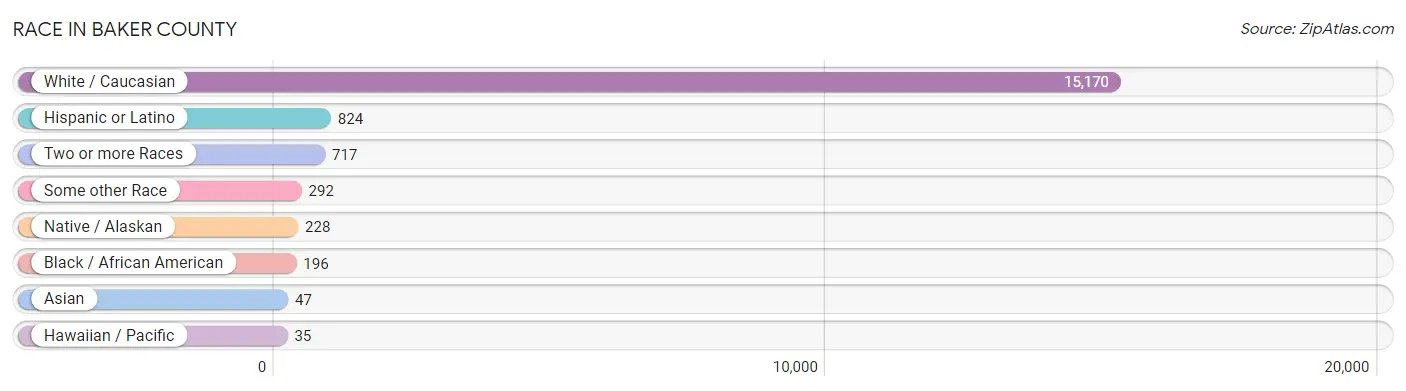
Race in Baker County
The most populous races in Baker County are White / Caucasian (15,170 | 90.9%), Hispanic or Latino (824 | 4.9%), and Two or more Races (717 | 4.3%).
| Race | # Population | % Population |
| Asian | 47 | 0.3% |
| Black / African American | 196 | 1.2% |
| Hawaiian / Pacific | 35 | 0.2% |
| Hispanic or Latino | 824 | 4.9% |
| Native / Alaskan | 228 | 1.4% |
| White / Caucasian | 15,170 | 90.9% |
| Two or more Races | 717 | 4.3% |
| Some other Race | 292 | 1.8% |
| Total | 16,685 | 100.0% |
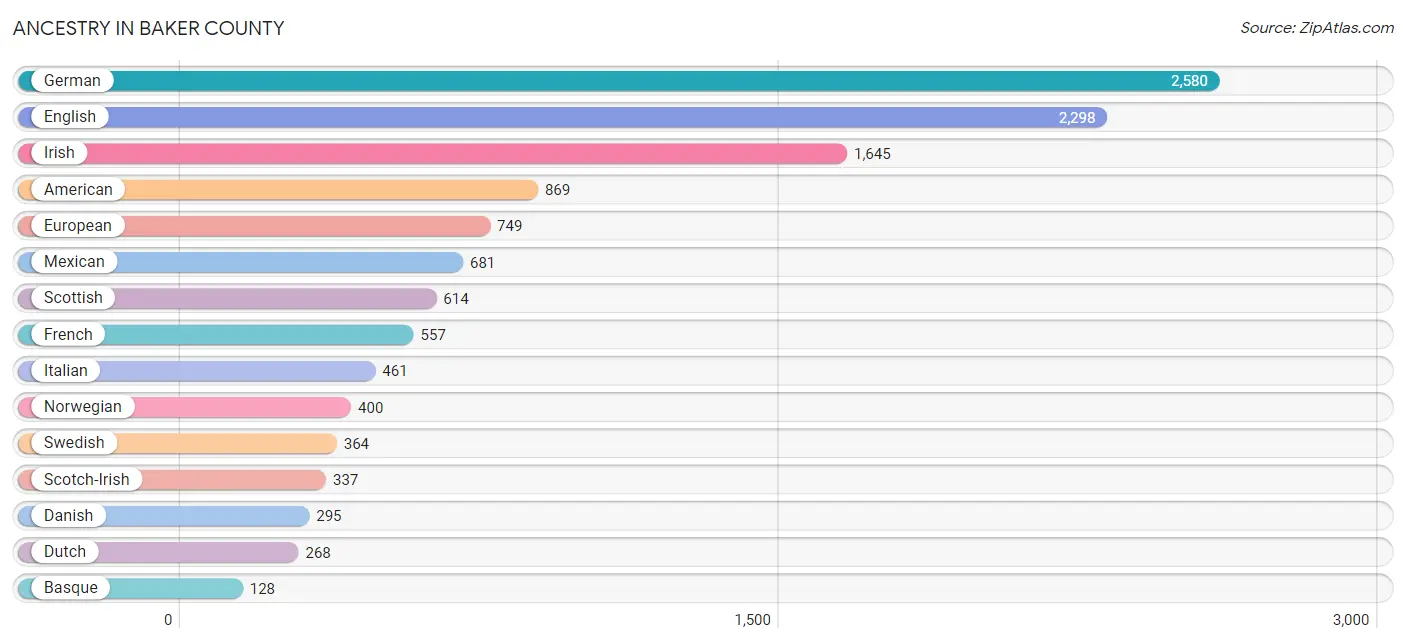
Ancestry in Baker County
The most populous ancestries reported in Baker County are German (2,580 | 15.5%), English (2,298 | 13.8%), Irish (1,645 | 9.9%), American (869 | 5.2%), and European (749 | 4.5%), together accounting for 48.8% of all Baker County residents.
| Ancestry | # Population | % Population |
| African | 7 | 0.0% |
| American | 869 | 5.2% |
| Apache | 27 | 0.2% |
| Arapaho | 4 | 0.0% |
| Armenian | 6 | 0.0% |
| Australian | 56 | 0.3% |
| Austrian | 28 | 0.2% |
| Basque | 128 | 0.8% |
| Belgian | 55 | 0.3% |
| Bhutanese | 35 | 0.2% |
| Blackfeet | 13 | 0.1% |
| British | 74 | 0.4% |
| Canadian | 47 | 0.3% |
| Central American | 5 | 0.0% |
| Central American Indian | 25 | 0.2% |
| Cherokee | 88 | 0.5% |
| Choctaw | 11 | 0.1% |
| Croatian | 25 | 0.2% |
| Czech | 82 | 0.5% |
| Czechoslovakian | 46 | 0.3% |
| Danish | 295 | 1.8% |
| Delaware | 39 | 0.2% |
| Dutch | 268 | 1.6% |
| Eastern European | 9 | 0.1% |
| English | 2,298 | 13.8% |
| Ethiopian | 62 | 0.4% |
| European | 749 | 4.5% |
| Finnish | 85 | 0.5% |
| French | 557 | 3.3% |
| French Canadian | 24 | 0.1% |
| German | 2,580 | 15.5% |
| Greek | 68 | 0.4% |
| Guamanian / Chamorro | 4 | 0.0% |
| Guatemalan | 5 | 0.0% |
| Hungarian | 30 | 0.2% |
| Indian (Asian) | 31 | 0.2% |
| Inupiat | 5 | 0.0% |
| Irish | 1,645 | 9.9% |
| Israeli | 7 | 0.0% |
| Italian | 461 | 2.8% |
| Jamaican | 13 | 0.1% |
| Japanese | 38 | 0.2% |
| Korean | 24 | 0.1% |
| Lithuanian | 39 | 0.2% |
| Mexican | 681 | 4.1% |
| Native Hawaiian | 13 | 0.1% |
| Nigerian | 2 | 0.0% |
| Northern European | 43 | 0.3% |
| Norwegian | 400 | 2.4% |
| Pakistani | 80 | 0.5% |
| Pennsylvania German | 2 | 0.0% |
| Peruvian | 7 | 0.0% |
| Polish | 111 | 0.7% |
| Portuguese | 9 | 0.1% |
| Puerto Rican | 11 | 0.1% |
| Romanian | 15 | 0.1% |
| Russian | 65 | 0.4% |
| Samoan | 11 | 0.1% |
| Scandinavian | 83 | 0.5% |
| Scotch-Irish | 337 | 2.0% |
| Scottish | 614 | 3.7% |
| Serbian | 40 | 0.2% |
| Shoshone | 4 | 0.0% |
| Sioux | 9 | 0.1% |
| Slovak | 7 | 0.0% |
| Slovene | 12 | 0.1% |
| South American | 7 | 0.0% |
| Spaniard | 1 | 0.0% |
| Spanish | 38 | 0.2% |
| Sri Lankan | 29 | 0.2% |
| Subsaharan African | 71 | 0.4% |
| Swedish | 364 | 2.2% |
| Swiss | 34 | 0.2% |
| Thai | 4 | 0.0% |
| Ukrainian | 105 | 0.6% |
| Welsh | 45 | 0.3% |
| Yakama | 6 | 0.0% |
| Yuman | 4 | 0.0% | View All 78 Rows |
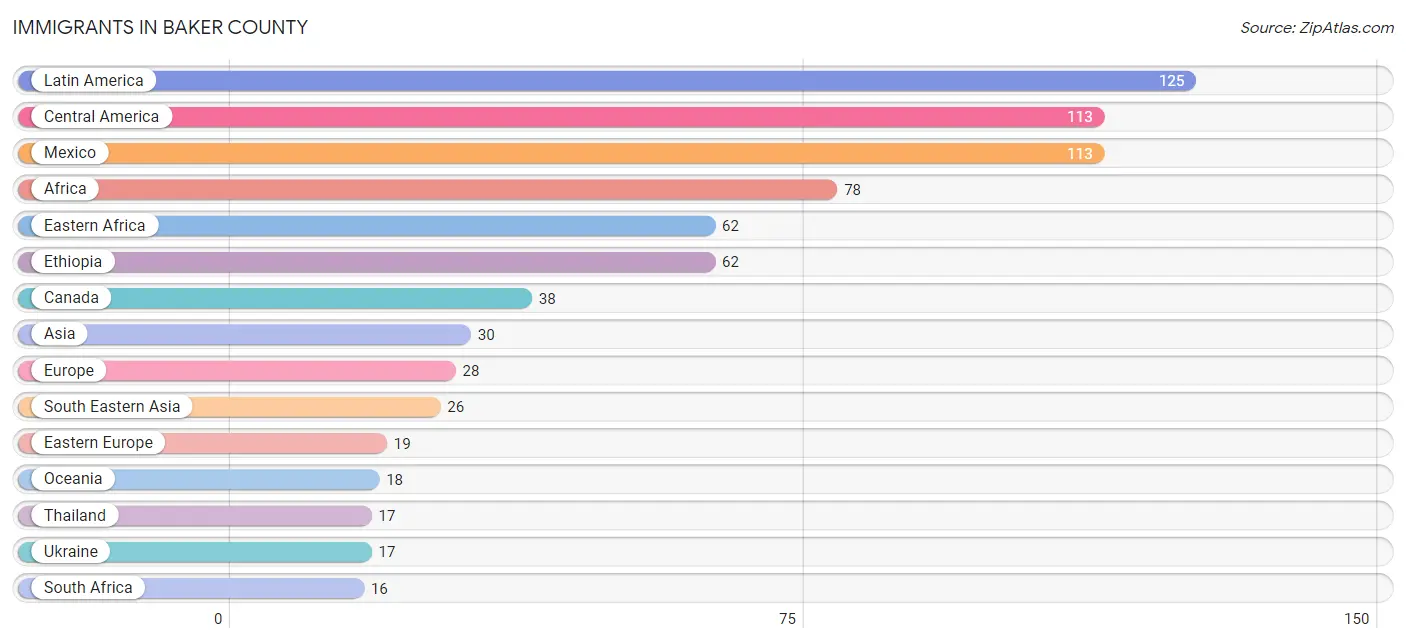
Immigrants in Baker County
The most numerous immigrant groups reported in Baker County came from Latin America (125 | 0.7%), Central America (113 | 0.7%), Mexico (113 | 0.7%), Africa (78 | 0.5%), and Eastern Africa (62 | 0.4%), together accounting for 2.9% of all Baker County residents.
| Immigration Origin | # Population | % Population |
| Africa | 78 | 0.5% |
| Asia | 30 | 0.2% |
| Canada | 38 | 0.2% |
| Central America | 113 | 0.7% |
| Eastern Africa | 62 | 0.4% |
| Eastern Europe | 19 | 0.1% |
| Ethiopia | 62 | 0.4% |
| Europe | 28 | 0.2% |
| India | 4 | 0.0% |
| Latin America | 125 | 0.7% |
| Mexico | 113 | 0.7% |
| Netherlands | 9 | 0.1% |
| Oceania | 18 | 0.1% |
| Peru | 7 | 0.0% |
| Philippines | 9 | 0.1% |
| Russia | 2 | 0.0% |
| South Africa | 16 | 0.1% |
| South America | 12 | 0.1% |
| South Central Asia | 4 | 0.0% |
| South Eastern Asia | 26 | 0.2% |
| Thailand | 17 | 0.1% |
| Ukraine | 17 | 0.1% |
| Western Europe | 9 | 0.1% | View All 23 Rows |
Sex and Age in Baker County
Sex and Age in Baker County
The most populous age groups in Baker County are 65 to 69 Years (722 | 8.4%) for men and 60 to 64 Years (794 | 9.9%) for women.
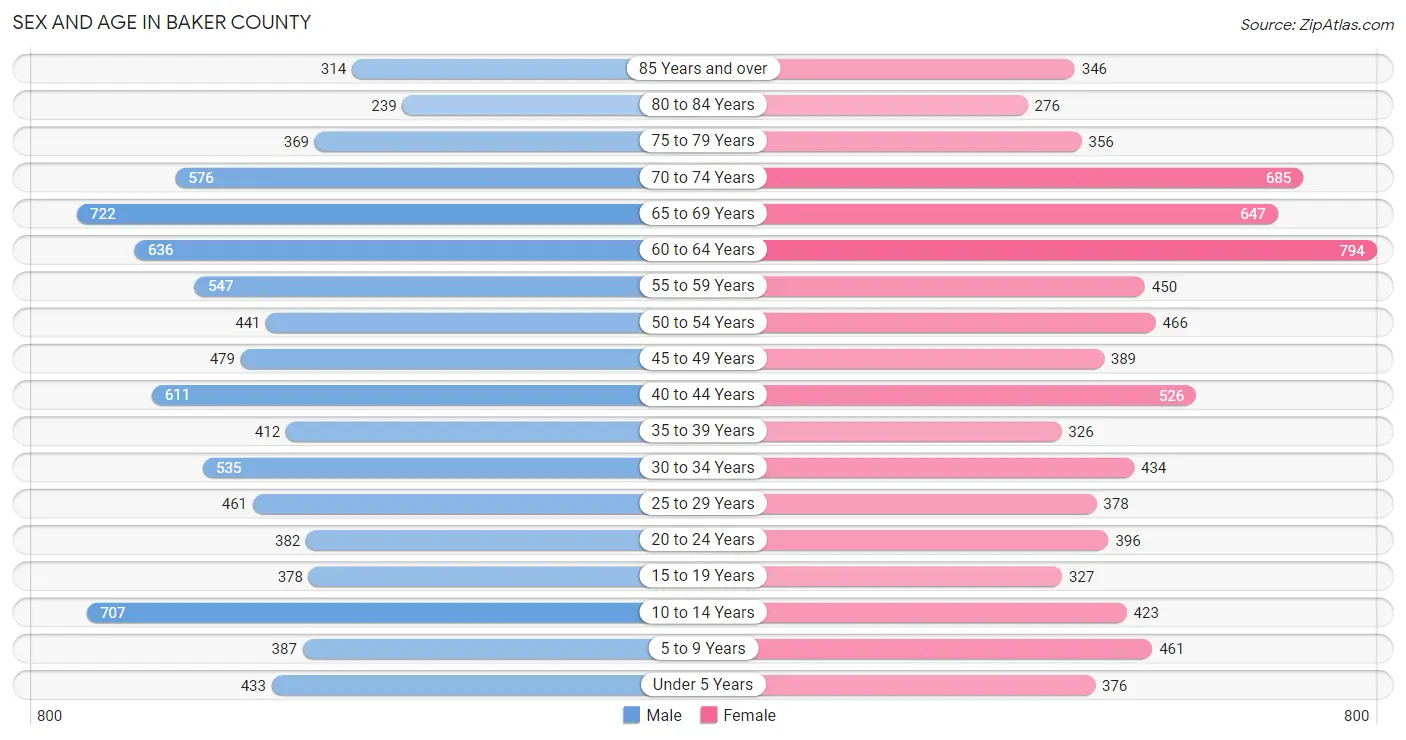
| Age Bracket | Male | Female |
| Under 5 Years | 433 (5.0%) | 376 (4.7%) |
| 5 to 9 Years | 387 (4.5%) | 461 (5.7%) |
| 10 to 14 Years | 707 (8.2%) | 423 (5.2%) |
| 15 to 19 Years | 378 (4.4%) | 327 (4.1%) |
| 20 to 24 Years | 382 (4.4%) | 396 (4.9%) |
| 25 to 29 Years | 461 (5.3%) | 378 (4.7%) |
| 30 to 34 Years | 535 (6.2%) | 434 (5.4%) |
| 35 to 39 Years | 412 (4.8%) | 326 (4.1%) |
| 40 to 44 Years | 611 (7.1%) | 526 (6.5%) |
| 45 to 49 Years | 479 (5.6%) | 389 (4.8%) |
| 50 to 54 Years | 441 (5.1%) | 466 (5.8%) |
| 55 to 59 Years | 547 (6.3%) | 450 (5.6%) |
| 60 to 64 Years | 636 (7.4%) | 794 (9.9%) |
| 65 to 69 Years | 722 (8.4%) | 647 (8.0%) |
| 70 to 74 Years | 576 (6.7%) | 685 (8.5%) |
| 75 to 79 Years | 369 (4.3%) | 356 (4.4%) |
| 80 to 84 Years | 239 (2.8%) | 276 (3.4%) |
| 85 Years and over | 314 (3.6%) | 346 (4.3%) |
| Total | 8,629 (100.0%) | 8,056 (100.0%) |
Families and Households in Baker County
Median Family Size in Baker County
The median family size in Baker County is 2.98 persons per family, with single female/mother families (499 | 12.5%) accounting for the largest median family size of 3.14 persons per family. On the other hand, single male/father families (179 | 4.5%) represent the smallest median family size with 2.55 persons per family.
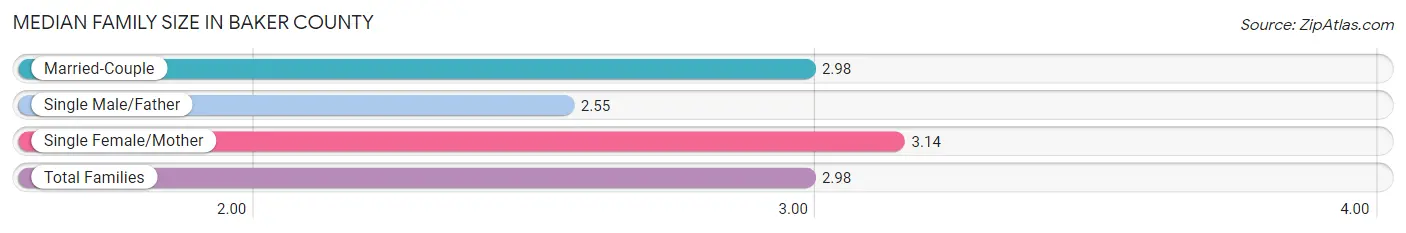
| Family Type | # Families | Family Size |
| Married-Couple | 3,326 (83.1%) | 2.98 |
| Single Male/Father | 179 (4.5%) | 2.55 |
| Single Female/Mother | 499 (12.5%) | 3.14 |
| Total Families | 4,004 (100.0%) | 2.98 |
Median Household Size in Baker County
The median household size in Baker County is 2.30 persons per household, with single female/mother households (499 | 7.1%) accounting for the largest median household size of 3.48 persons per household. non-family households (3,000 | 42.8%) represent the smallest median household size with 1.31 persons per household.
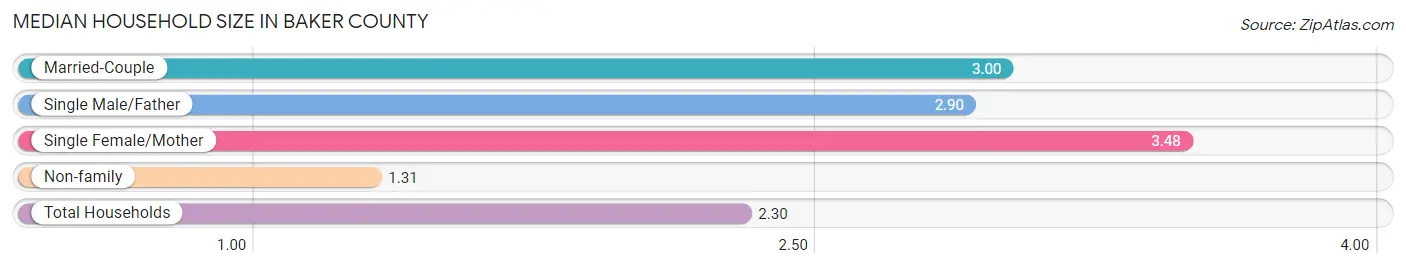
| Household Type | # Households | Household Size |
| Married-Couple | 3,326 (47.5%) | 3.00 |
| Single Male/Father | 179 (2.6%) | 2.90 |
| Single Female/Mother | 499 (7.1%) | 3.48 |
| Non-family | 3,000 (42.8%) | 1.31 |
| Total Households | 7,004 (100.0%) | 2.30 |
Household Size by Marriage Status in Baker County
Out of a total of 7,004 households in Baker County, 4,004 (57.2%) are family households, while 3,000 (42.8%) are nonfamily households. The most numerous type of family households are 2-person households, comprising 2,426, and the most common type of nonfamily households are 1-person households, comprising 2,417.
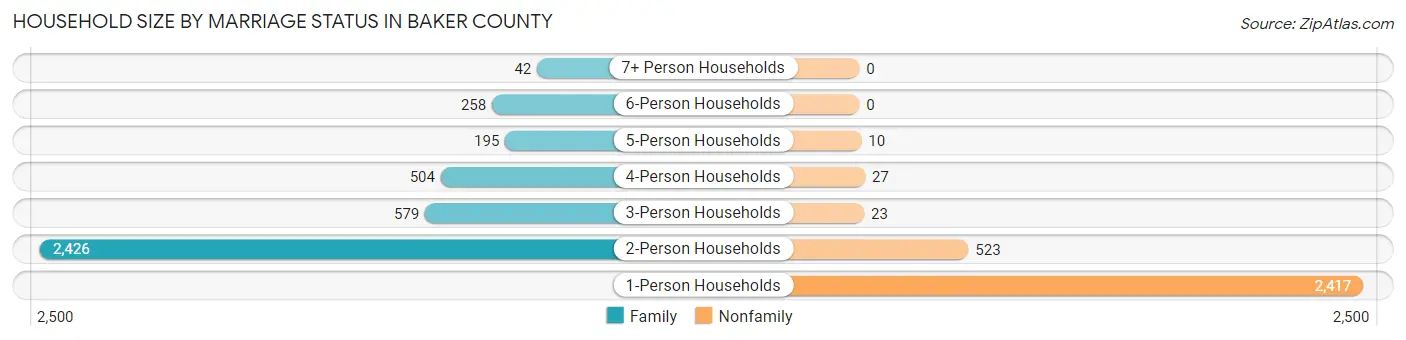
| Household Size | Family Households | Nonfamily Households |
| 1-Person Households | - | 2,417 (34.5%) |
| 2-Person Households | 2,426 (34.6%) | 523 (7.5%) |
| 3-Person Households | 579 (8.3%) | 23 (0.3%) |
| 4-Person Households | 504 (7.2%) | 27 (0.4%) |
| 5-Person Households | 195 (2.8%) | 10 (0.1%) |
| 6-Person Households | 258 (3.7%) | 0 (0.0%) |
| 7+ Person Households | 42 (0.6%) | 0 (0.0%) |
| Total | 4,004 (57.2%) | 3,000 (42.8%) |
Female Fertility in Baker County
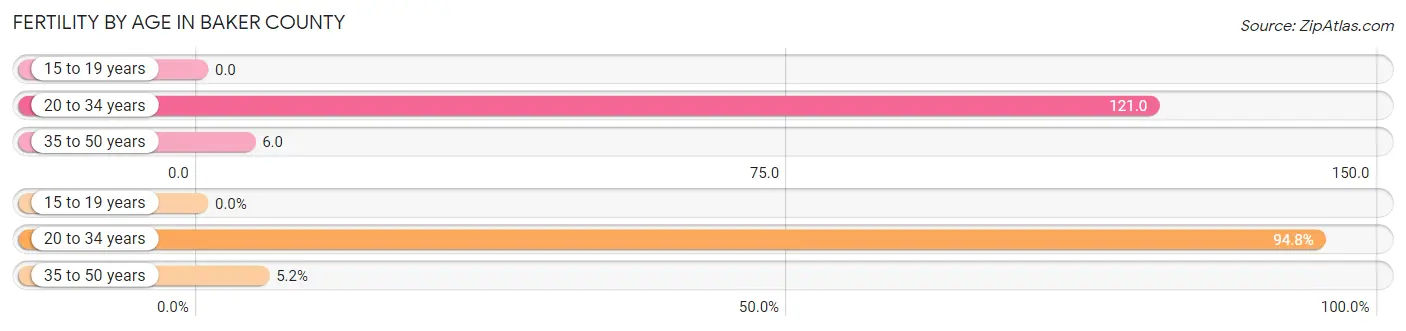
Fertility by Age in Baker County
Average fertility rate in Baker County is 55.0 births per 1,000 women. Women in the age bracket of 20 to 34 years have the highest fertility rate with 121.0 births per 1,000 women. Women in the age bracket of 20 to 34 years acount for 94.8% of all women with births.
| Age Bracket | Women with Births | Births / 1,000 Women |
| 15 to 19 years | 0 (0.0%) | 0.0 |
| 20 to 34 years | 146 (94.8%) | 121.0 |
| 35 to 50 years | 8 (5.2%) | 6.0 |
| Total | 154 (100.0%) | 55.0 |
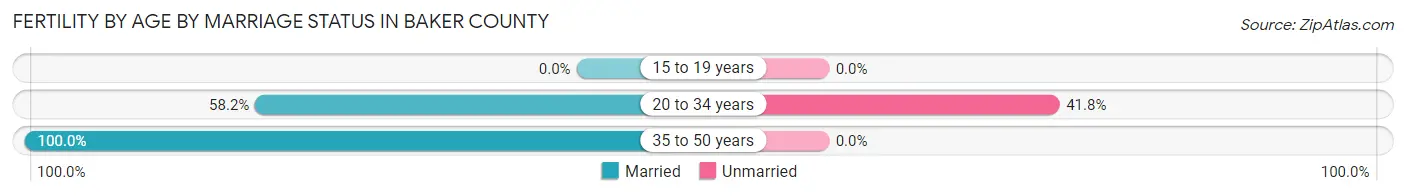
Fertility by Age by Marriage Status in Baker County
60.4% of women with births (154) in Baker County are married. The highest percentage of unmarried women with births falls into 20 to 34 years age bracket with 41.8% of them unmarried at the time of birth, while the lowest percentage of unmarried women with births belong to 35 to 50 years age bracket with 0.0% of them unmarried.
| Age Bracket | Married | Unmarried |
| 15 to 19 years | 0 (0.0%) | 0 (0.0%) |
| 20 to 34 years | 85 (58.2%) | 61 (41.8%) |
| 35 to 50 years | 8 (100.0%) | 0 (0.0%) |
| Total | 93 (60.4%) | 61 (39.6%) |
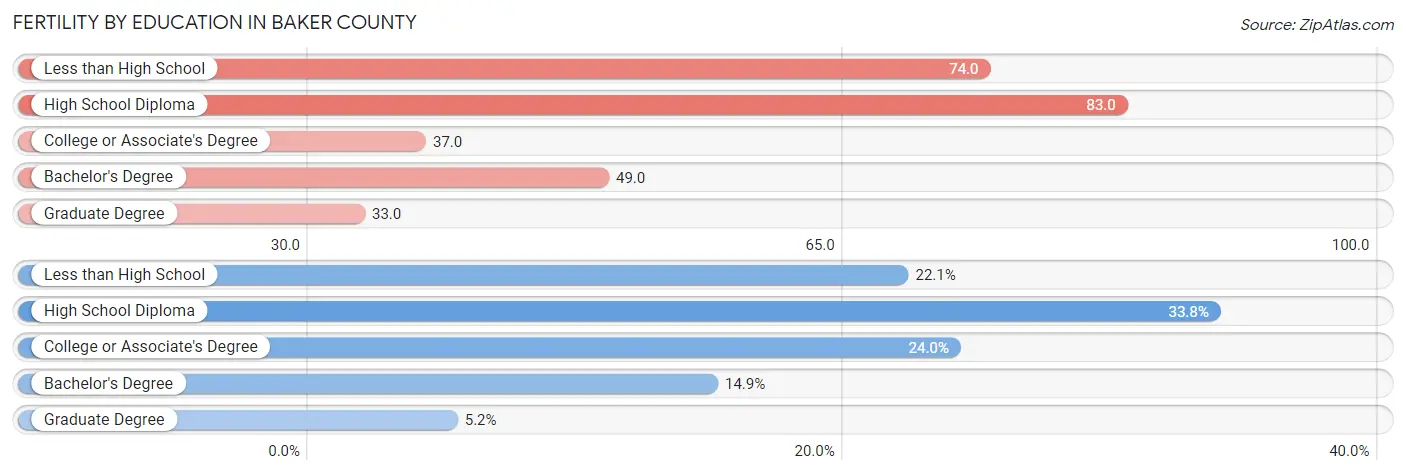
Fertility by Education in Baker County
Average fertility rate in Baker County is 55.0 births per 1,000 women. Women with the education attainment of high school diploma have the highest fertility rate of 83.0 births per 1,000 women, while women with the education attainment of graduate degree have the lowest fertility at 33.0 births per 1,000 women. Women with the education attainment of high school diploma represent 33.8% of all women with births.
| Educational Attainment | Women with Births | Births / 1,000 Women |
| Less than High School | 34 (22.1%) | 74.0 |
| High School Diploma | 52 (33.8%) | 83.0 |
| College or Associate's Degree | 37 (24.0%) | 37.0 |
| Bachelor's Degree | 23 (14.9%) | 49.0 |
| Graduate Degree | 8 (5.2%) | 33.0 |
| Total | 154 (100.0%) | 55.0 |
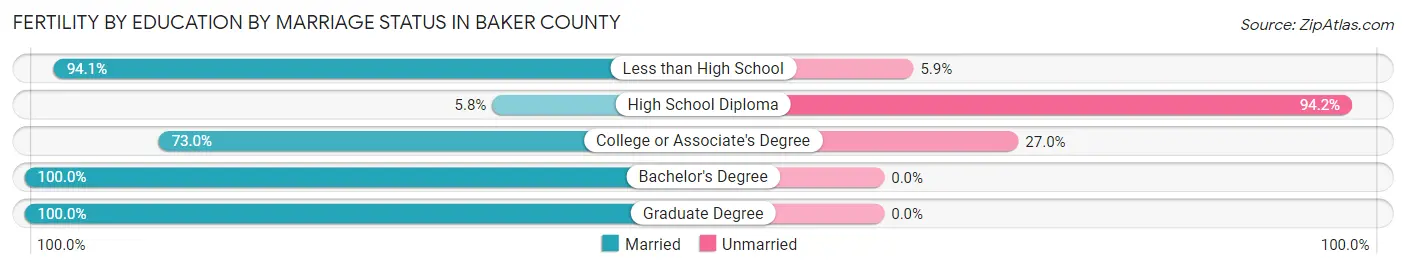
Fertility by Education by Marriage Status in Baker County
39.6% of women with births in Baker County are unmarried. Women with the educational attainment of bachelor's degree are most likely to be married with 100.0% of them married at childbirth, while women with the educational attainment of high school diploma are least likely to be married with 94.2% of them unmarried at childbirth.
| Educational Attainment | Married | Unmarried |
| Less than High School | 32 (94.1%) | 2 (5.9%) |
| High School Diploma | 3 (5.8%) | 49 (94.2%) |
| College or Associate's Degree | 27 (73.0%) | 10 (27.0%) |
| Bachelor's Degree | 23 (100.0%) | 0 (0.0%) |
| Graduate Degree | 8 (100.0%) | 0 (0.0%) |
| Total | 93 (60.4%) | 61 (39.6%) |
Income in Baker County
Income Overview in Baker County
Per Capita Income in Baker County is $32,672, while median incomes of families and households are $66,780 and $51,657 respectively.
| Characteristic | Number | Measure |
| Per Capita Income | 16,685 | $32,672 |
| Median Family Income | 4,004 | $66,780 |
| Mean Family Income | 4,004 | $93,162 |
| Median Household Income | 7,004 | $51,657 |
| Mean Household Income | 7,004 | $74,409 |
| Income Deficit | 4,004 | $0 |
| Wage / Income Gap (%) | 16,685 | 46.35% |
| Wage / Income Gap ($) | 16,685 | 53.65¢ per $1 |
| Gini / Inequality Index | 16,685 | 0.47 |
Earnings by Sex in Baker County
Average Earnings in Baker County are $37,658, $46,047 for men and $24,703 for women, a difference of 46.4%.
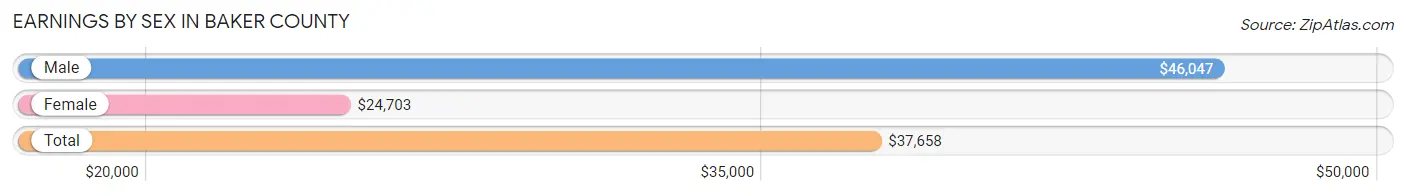
| Sex | Number | Average Earnings |
| Male | 4,008 (54.2%) | $46,047 |
| Female | 3,389 (45.8%) | $24,703 |
| Total | 7,397 (100.0%) | $37,658 |
Earnings by Sex by Income Bracket in Baker County
The most common earnings brackets in Baker County are $100,000+ for men (485 | 12.1%) and $25,000 to $29,999 for women (273 | 8.1%).
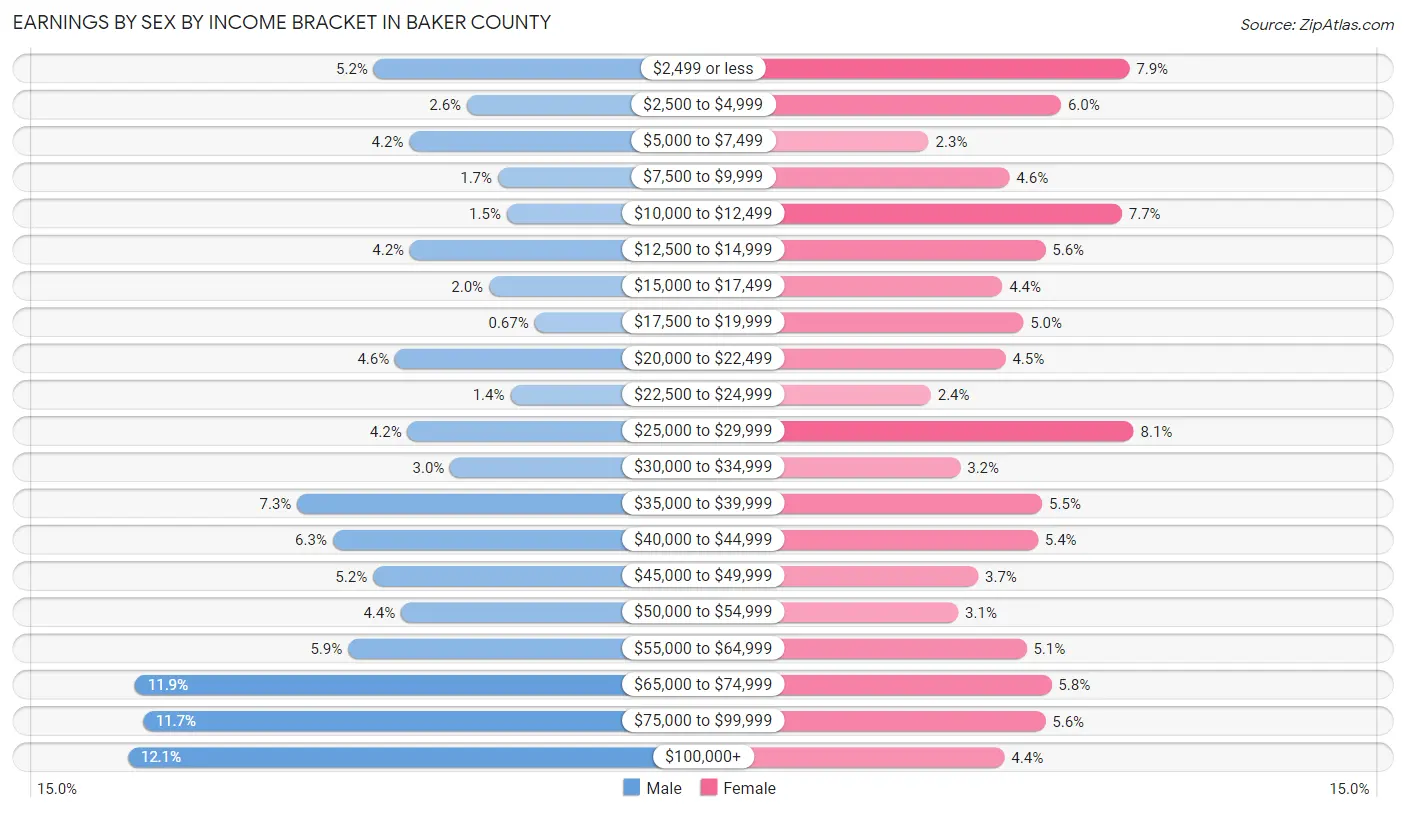
| Income | Male | Female |
| $2,499 or less | 208 (5.2%) | 269 (7.9%) |
| $2,500 to $4,999 | 103 (2.6%) | 204 (6.0%) |
| $5,000 to $7,499 | 168 (4.2%) | 78 (2.3%) |
| $7,500 to $9,999 | 68 (1.7%) | 155 (4.6%) |
| $10,000 to $12,499 | 58 (1.5%) | 262 (7.7%) |
| $12,500 to $14,999 | 167 (4.2%) | 189 (5.6%) |
| $15,000 to $17,499 | 78 (1.9%) | 148 (4.4%) |
| $17,500 to $19,999 | 27 (0.7%) | 168 (5.0%) |
| $20,000 to $22,499 | 184 (4.6%) | 151 (4.5%) |
| $22,500 to $24,999 | 54 (1.3%) | 80 (2.4%) |
| $25,000 to $29,999 | 170 (4.2%) | 273 (8.1%) |
| $30,000 to $34,999 | 122 (3.0%) | 108 (3.2%) |
| $35,000 to $39,999 | 294 (7.3%) | 186 (5.5%) |
| $40,000 to $44,999 | 254 (6.3%) | 182 (5.4%) |
| $45,000 to $49,999 | 209 (5.2%) | 125 (3.7%) |
| $50,000 to $54,999 | 177 (4.4%) | 106 (3.1%) |
| $55,000 to $64,999 | 237 (5.9%) | 171 (5.1%) |
| $65,000 to $74,999 | 477 (11.9%) | 195 (5.8%) |
| $75,000 to $99,999 | 468 (11.7%) | 189 (5.6%) |
| $100,000+ | 485 (12.1%) | 150 (4.4%) |
| Total | 4,008 (100.0%) | 3,389 (100.0%) |
Earnings by Sex by Educational Attainment in Baker County
Average earnings in Baker County are $49,796 for men and $27,948 for women, a difference of 43.9%. Men with an educational attainment of graduate degree enjoy the highest average annual earnings of $85,341, while those with high school diploma education earn the least with $39,563. Women with an educational attainment of bachelor's degree earn the most with the average annual earnings of $53,340, while those with less than high school education have the smallest earnings of $13,798.
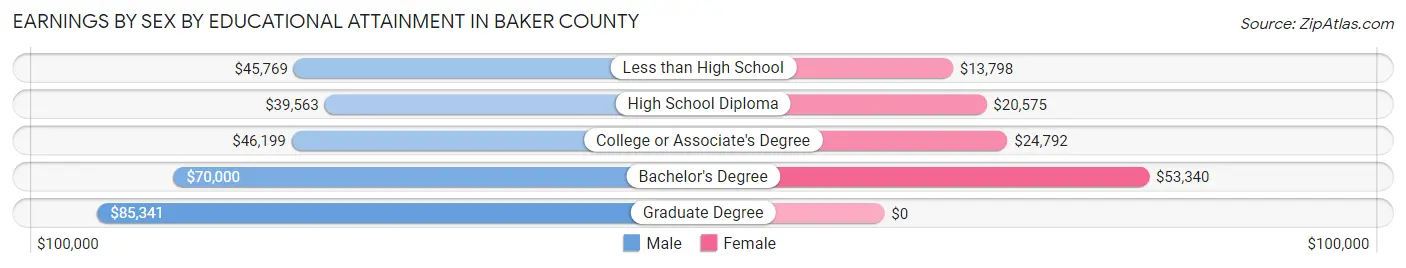
| Educational Attainment | Male Income | Female Income |
| Less than High School | $45,769 | $13,798 |
| High School Diploma | $39,563 | $20,575 |
| College or Associate's Degree | $46,199 | $24,792 |
| Bachelor's Degree | $70,000 | $53,340 |
| Graduate Degree | $85,341 | $0 |
| Total | $49,796 | $27,948 |
Family Income in Baker County
Family Income Brackets in Baker County
According to the Baker County family income data, there are 789 families falling into the $35,000 to $49,999 income range, which is the most common income bracket and makes up 19.7% of all families. Conversely, the less than $10,000 income bracket is the least frequent group with only 128 families (3.2%) belonging to this category.
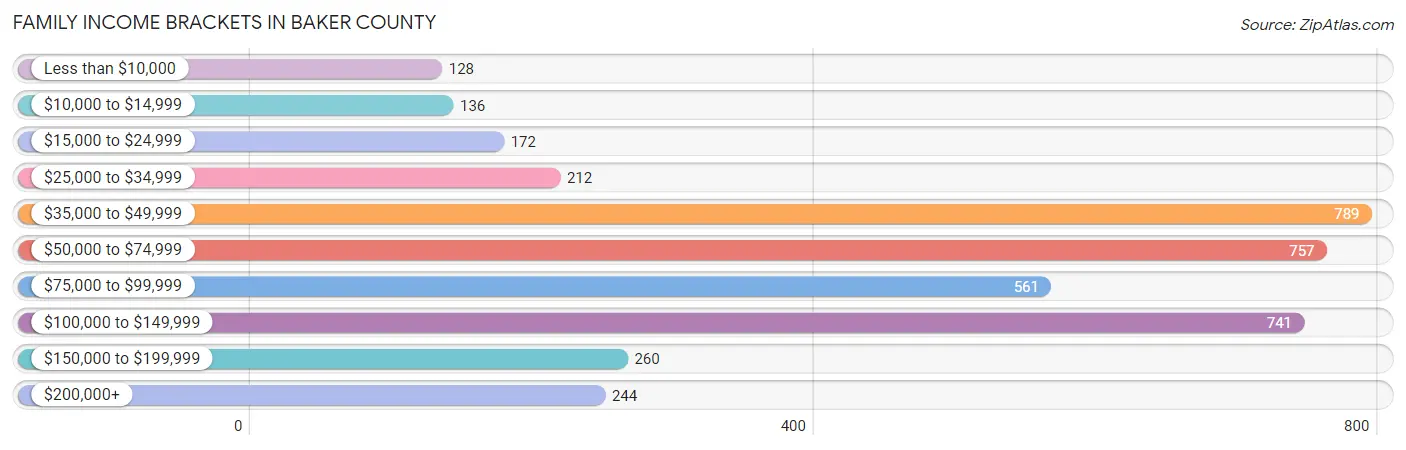
| Income Bracket | # Families | % Families |
| Less than $10,000 | 128 | 3.2% |
| $10,000 to $14,999 | 136 | 3.4% |
| $15,000 to $24,999 | 172 | 4.3% |
| $25,000 to $34,999 | 212 | 5.3% |
| $35,000 to $49,999 | 789 | 19.7% |
| $50,000 to $74,999 | 757 | 18.9% |
| $75,000 to $99,999 | 561 | 14.0% |
| $100,000 to $149,999 | 741 | 18.5% |
| $150,000 to $199,999 | 260 | 6.5% |
| $200,000+ | 244 | 6.1% |
Family Income by Famaliy Size in Baker County
7+ person families (42 | 1.1%) account for the highest median family income in Baker County with $141,750 per family, while 2-person families (2,555 | 63.8%) have the highest median income of $29,792 per family member.
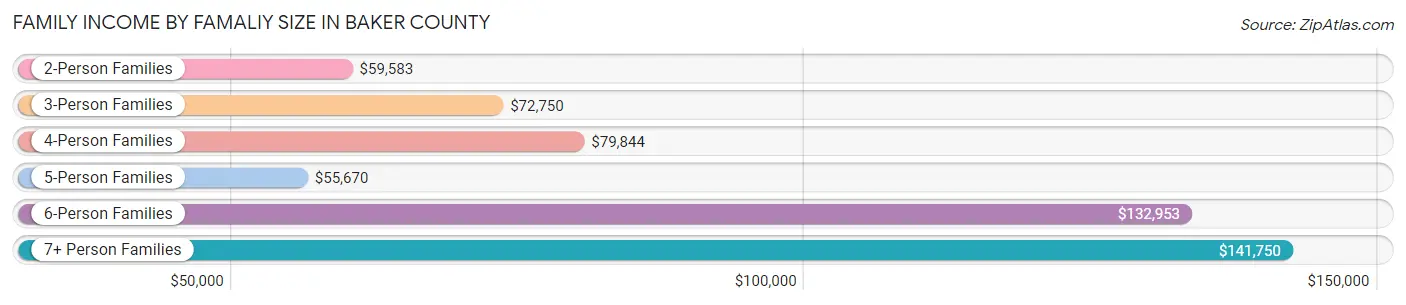
| Income Bracket | # Families | Median Income |
| 2-Person Families | 2,555 (63.8%) | $59,583 |
| 3-Person Families | 489 (12.2%) | $72,750 |
| 4-Person Families | 484 (12.1%) | $79,844 |
| 5-Person Families | 179 (4.5%) | $55,670 |
| 6-Person Families | 255 (6.4%) | $132,953 |
| 7+ Person Families | 42 (1.1%) | $141,750 |
| Total | 4,004 (100.0%) | $66,780 |
Family Income by Number of Earners in Baker County
The median family income in Baker County is $66,780, with families comprising 3+ earners (203) having the highest median family income of $134,081, while families with no earners (1,282) have the lowest median family income of $45,690, accounting for 5.1% and 32.0% of families, respectively.
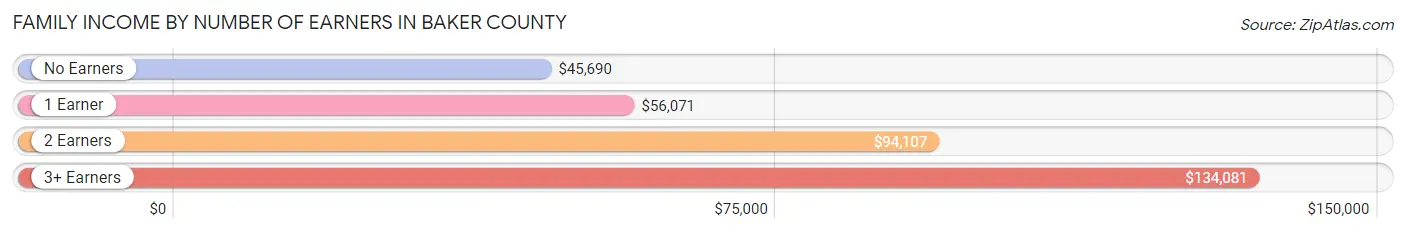
| Number of Earners | # Families | Median Income |
| No Earners | 1,282 (32.0%) | $45,690 |
| 1 Earner | 1,052 (26.3%) | $56,071 |
| 2 Earners | 1,467 (36.6%) | $94,107 |
| 3+ Earners | 203 (5.1%) | $134,081 |
| Total | 4,004 (100.0%) | $66,780 |
Household Income in Baker County
Household Income Brackets in Baker County
With 1,296 households falling in the category, the $35,000 to $49,999 income range is the most frequent in Baker County, accounting for 18.5% of all households. In contrast, only 280 households (4.0%) fall into the $200,000+ income bracket, making it the least populous group.
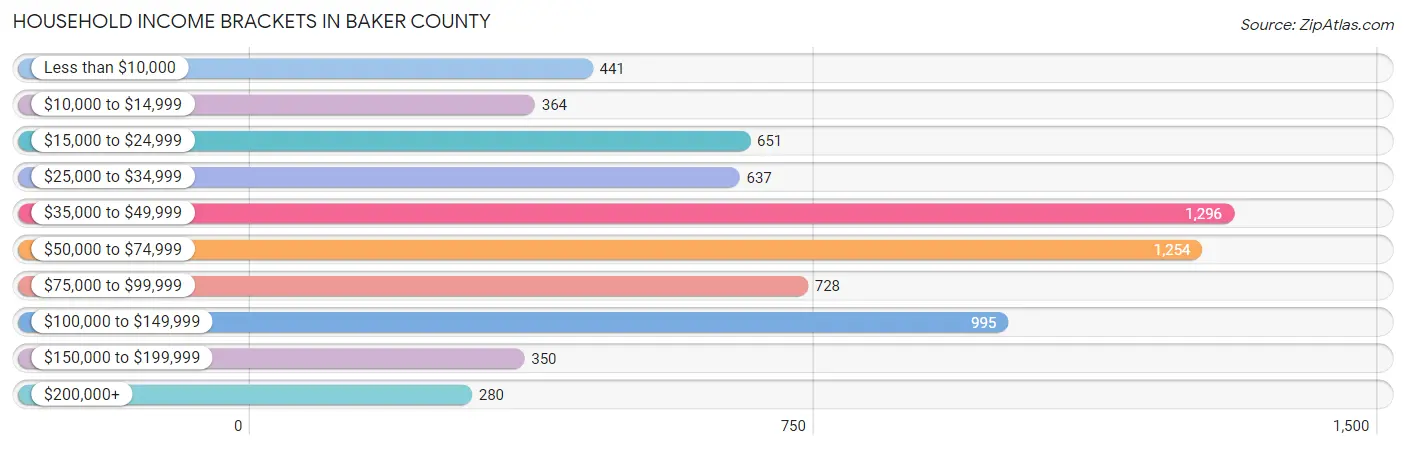
| Income Bracket | # Households | % Households |
| Less than $10,000 | 441 | 6.3% |
| $10,000 to $14,999 | 364 | 5.2% |
| $15,000 to $24,999 | 651 | 9.3% |
| $25,000 to $34,999 | 637 | 9.1% |
| $35,000 to $49,999 | 1,296 | 18.5% |
| $50,000 to $74,999 | 1,254 | 17.9% |
| $75,000 to $99,999 | 728 | 10.4% |
| $100,000 to $149,999 | 995 | 14.2% |
| $150,000 to $199,999 | 350 | 5.0% |
| $200,000+ | 280 | 4.0% |
Household Income by Householder Age in Baker County
The median household income in Baker County is $51,657, with the highest median household income of $70,809 found in the 25 to 44 years age bracket for the primary householder. A total of 1,623 households (23.2%) fall into this category. Meanwhile, the 15 to 24 years age bracket for the primary householder has the lowest median household income of $0, with 141 households (2.0%) in this group.
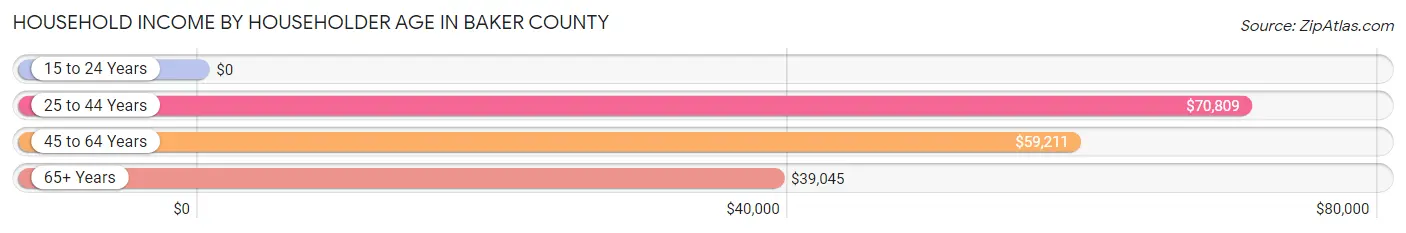
| Income Bracket | # Households | Median Income |
| 15 to 24 Years | 141 (2.0%) | $0 |
| 25 to 44 Years | 1,623 (23.2%) | $70,809 |
| 45 to 64 Years | 2,370 (33.8%) | $59,211 |
| 65+ Years | 2,870 (41.0%) | $39,045 |
| Total | 7,004 (100.0%) | $51,657 |
Poverty in Baker County
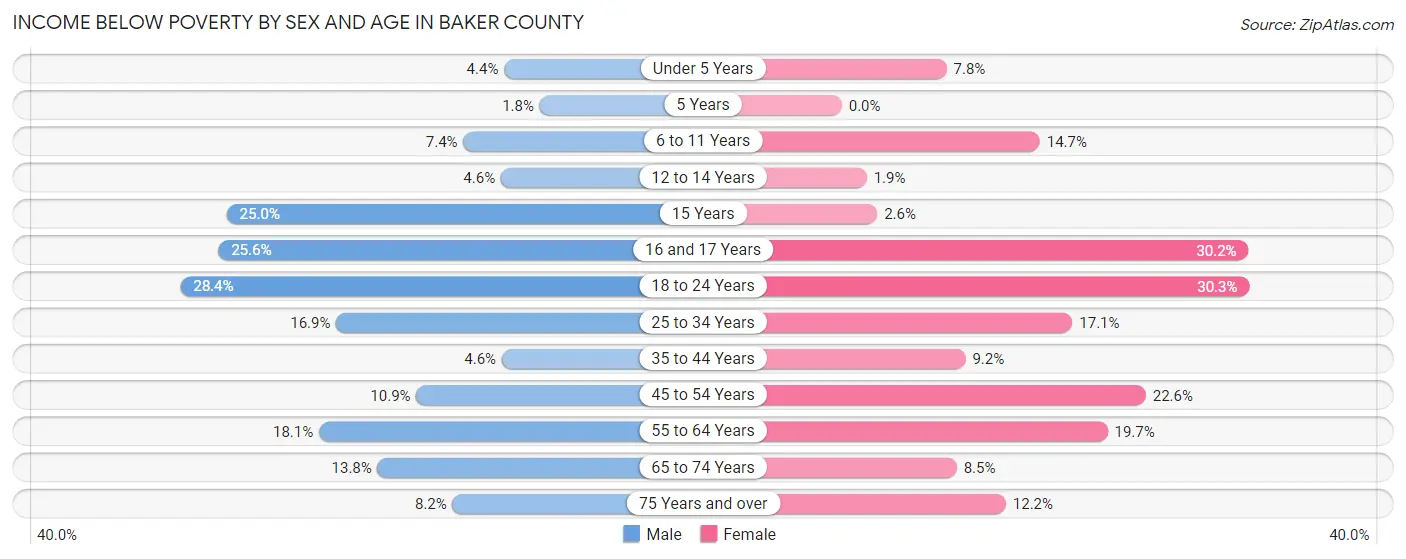
Income Below Poverty by Sex and Age in Baker County
With 12.5% poverty level for males and 14.9% for females among the residents of Baker County, 18 to 24 year old males and 18 to 24 year old females are the most vulnerable to poverty, with 128 males (28.4%) and 131 females (30.2%) in their respective age groups living below the poverty level.
| Age Bracket | Male | Female |
| Under 5 Years | 19 (4.4%) | 28 (7.8%) |
| 5 Years | 2 (1.8%) | 0 (0.0%) |
| 6 to 11 Years | 44 (7.4%) | 81 (14.7%) |
| 12 to 14 Years | 17 (4.6%) | 5 (1.8%) |
| 15 Years | 18 (25.0%) | 2 (2.6%) |
| 16 and 17 Years | 52 (25.6%) | 64 (30.2%) |
| 18 to 24 Years | 128 (28.4%) | 131 (30.2%) |
| 25 to 34 Years | 148 (16.9%) | 139 (17.1%) |
| 35 to 44 Years | 38 (4.6%) | 78 (9.2%) |
| 45 to 54 Years | 98 (10.9%) | 193 (22.6%) |
| 55 to 64 Years | 212 (18.1%) | 244 (19.7%) |
| 65 to 74 Years | 177 (13.8%) | 113 (8.5%) |
| 75 Years and over | 75 (8.2%) | 119 (12.2%) |
| Total | 1,028 (12.5%) | 1,197 (14.9%) |
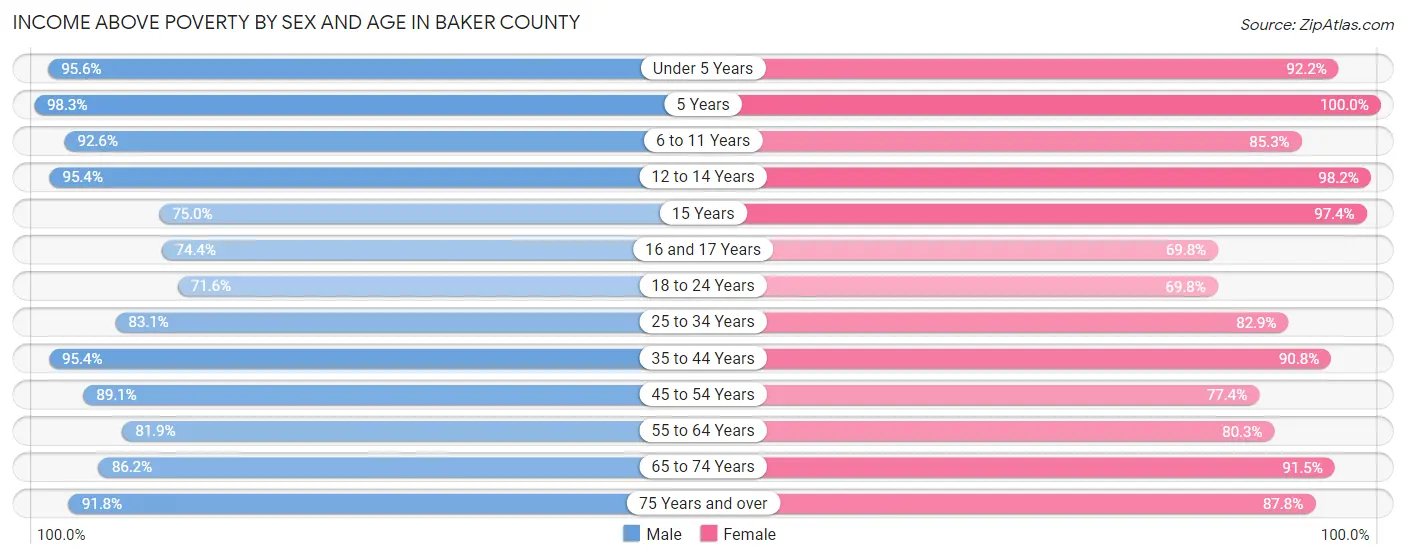
Income Above Poverty by Sex and Age in Baker County
According to the poverty statistics in Baker County, males aged 5 years and females aged 5 years are the age groups that are most secure financially, with 98.3% of males and 100.0% of females in these age groups living above the poverty line.
| Age Bracket | Male | Female |
| Under 5 Years | 414 (95.6%) | 332 (92.2%) |
| 5 Years | 112 (98.3%) | 57 (100.0%) |
| 6 to 11 Years | 549 (92.6%) | 470 (85.3%) |
| 12 to 14 Years | 350 (95.4%) | 265 (98.2%) |
| 15 Years | 54 (75.0%) | 74 (97.4%) |
| 16 and 17 Years | 151 (74.4%) | 148 (69.8%) |
| 18 to 24 Years | 322 (71.6%) | 302 (69.8%) |
| 25 to 34 Years | 730 (83.1%) | 673 (82.9%) |
| 35 to 44 Years | 795 (95.4%) | 772 (90.8%) |
| 45 to 54 Years | 800 (89.1%) | 662 (77.4%) |
| 55 to 64 Years | 957 (81.9%) | 993 (80.3%) |
| 65 to 74 Years | 1,107 (86.2%) | 1,211 (91.5%) |
| 75 Years and over | 837 (91.8%) | 858 (87.8%) |
| Total | 7,178 (87.5%) | 6,817 (85.1%) |
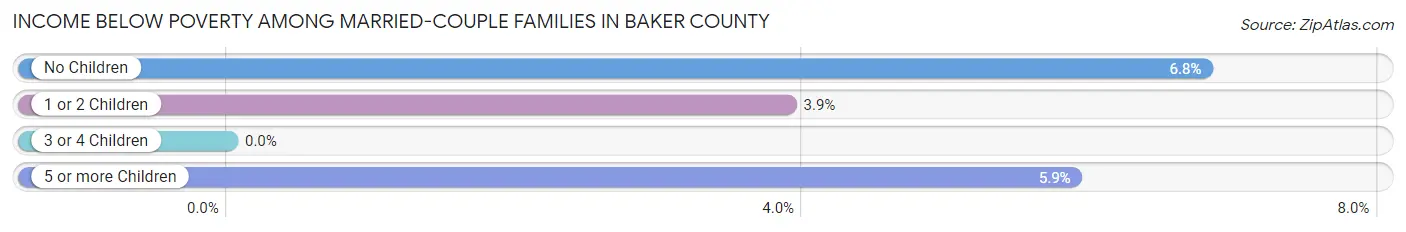
Income Below Poverty Among Married-Couple Families in Baker County
The poverty statistics for married-couple families in Baker County show that 5.4% or 180 of the total 3,326 families live below the poverty line. Families with no children have the highest poverty rate of 6.8%, comprising of 152 families. On the other hand, families with 3 or 4 children have the lowest poverty rate of 0.0%, which includes 0 families.
| Children | Above Poverty | Below Poverty |
| No Children | 2,087 (93.2%) | 152 (6.8%) |
| 1 or 2 Children | 667 (96.1%) | 27 (3.9%) |
| 3 or 4 Children | 376 (100.0%) | 0 (0.0%) |
| 5 or more Children | 16 (94.1%) | 1 (5.9%) |
| Total | 3,146 (94.6%) | 180 (5.4%) |
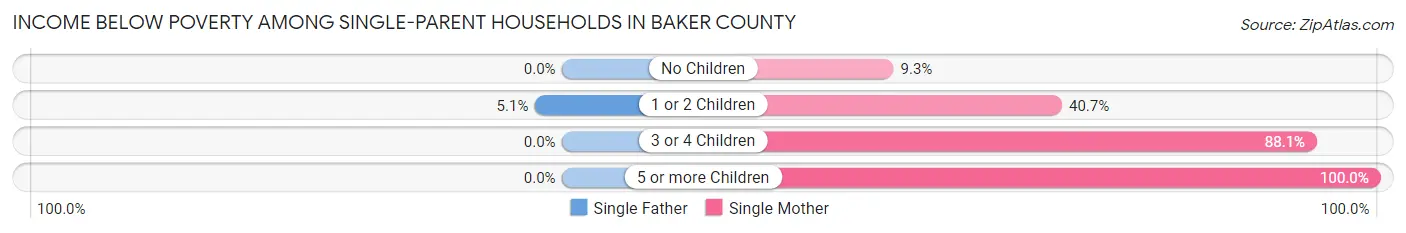
Income Below Poverty Among Single-Parent Households in Baker County
According to the poverty data in Baker County, 3.9% or 7 single-father households and 34.7% or 173 single-mother households are living below the poverty line. Among single-father households, those with 1 or 2 children have the highest poverty rate, with 7 households (5.1%) experiencing poverty. Likewise, among single-mother households, those with 5 or more children have the highest poverty rate, with 16 households (100.0%) falling below the poverty line.
| Children | Single Father | Single Mother |
| No Children | 0 (0.0%) | 20 (9.3%) |
| 1 or 2 Children | 7 (5.1%) | 85 (40.7%) |
| 3 or 4 Children | 0 (0.0%) | 52 (88.1%) |
| 5 or more Children | 0 (0.0%) | 16 (100.0%) |
| Total | 7 (3.9%) | 173 (34.7%) |
Income Below Poverty Among Married-Couple vs Single-Parent Households in Baker County
The poverty data for Baker County shows that 180 of the married-couple family households (5.4%) and 180 of the single-parent households (26.6%) are living below the poverty level. Within the married-couple family households, those with no children have the highest poverty rate, with 152 households (6.8%) falling below the poverty line. Among the single-parent households, those with 5 or more children have the highest poverty rate, with 16 household (100.0%) living below poverty.
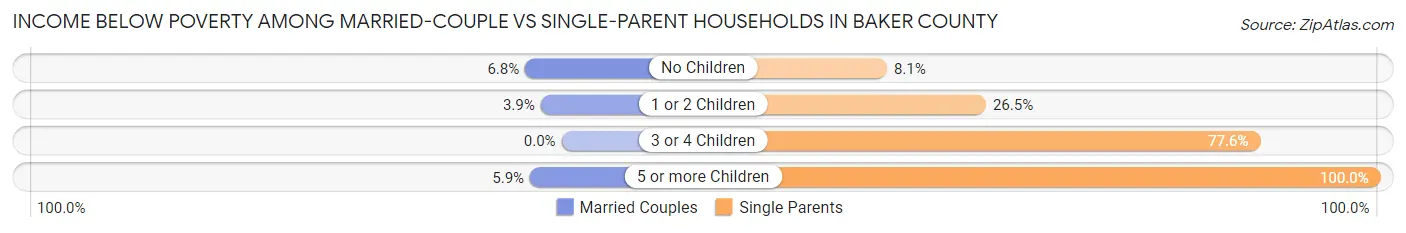
| Children | Married-Couple Families | Single-Parent Households |
| No Children | 152 (6.8%) | 20 (8.1%) |
| 1 or 2 Children | 27 (3.9%) | 92 (26.5%) |
| 3 or 4 Children | 0 (0.0%) | 52 (77.6%) |
| 5 or more Children | 1 (5.9%) | 16 (100.0%) |
| Total | 180 (5.4%) | 180 (26.6%) |
Employment Characteristics in Baker County
Employment by Class of Employer in Baker County
Among the 6,136 employed individuals in Baker County, private company employees (3,457 | 56.3%), local government employees (617 | 10.1%), and not-for-profit organizations (584 | 9.5%) make up the most common classes of employment.
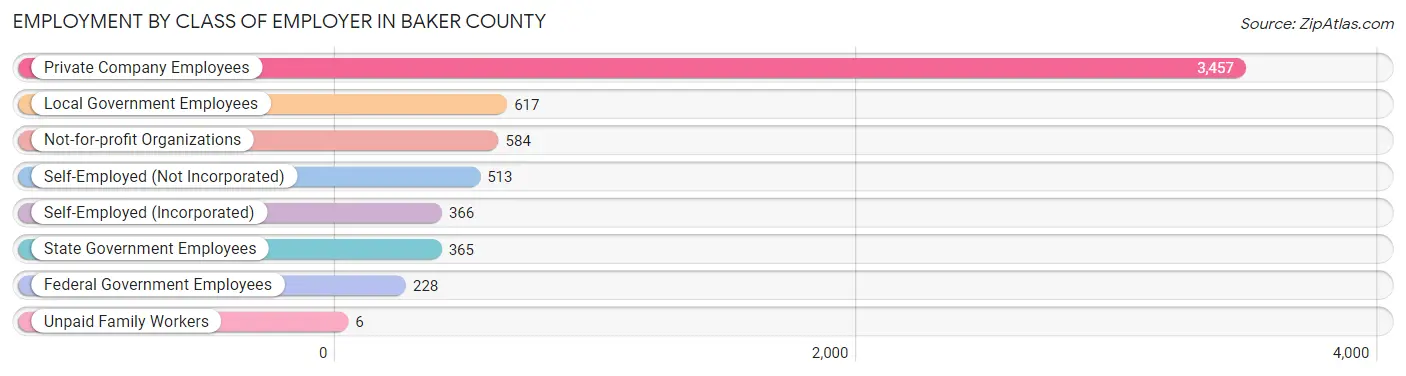
| Employer Class | # Employees | % Employees |
| Private Company Employees | 3,457 | 56.3% |
| Self-Employed (Incorporated) | 366 | 6.0% |
| Self-Employed (Not Incorporated) | 513 | 8.4% |
| Not-for-profit Organizations | 584 | 9.5% |
| Local Government Employees | 617 | 10.1% |
| State Government Employees | 365 | 5.9% |
| Federal Government Employees | 228 | 3.7% |
| Unpaid Family Workers | 6 | 0.1% |
| Total | 6,136 | 100.0% |
Employment Status by Age in Baker County
According to the labor force statistics for Baker County, out of the total population over 16 years of age (13,749), 48.2% or 6,627 individuals are in the labor force, with 5.5% or 364 of them unemployed. The age group with the highest labor force participation rate is 30 to 34 years, with 86.1% or 834 individuals in the labor force. Within the labor force, the 25 to 29 years age range has the highest percentage of unemployed individuals, with 15.5% or 96 of them being unemployed.
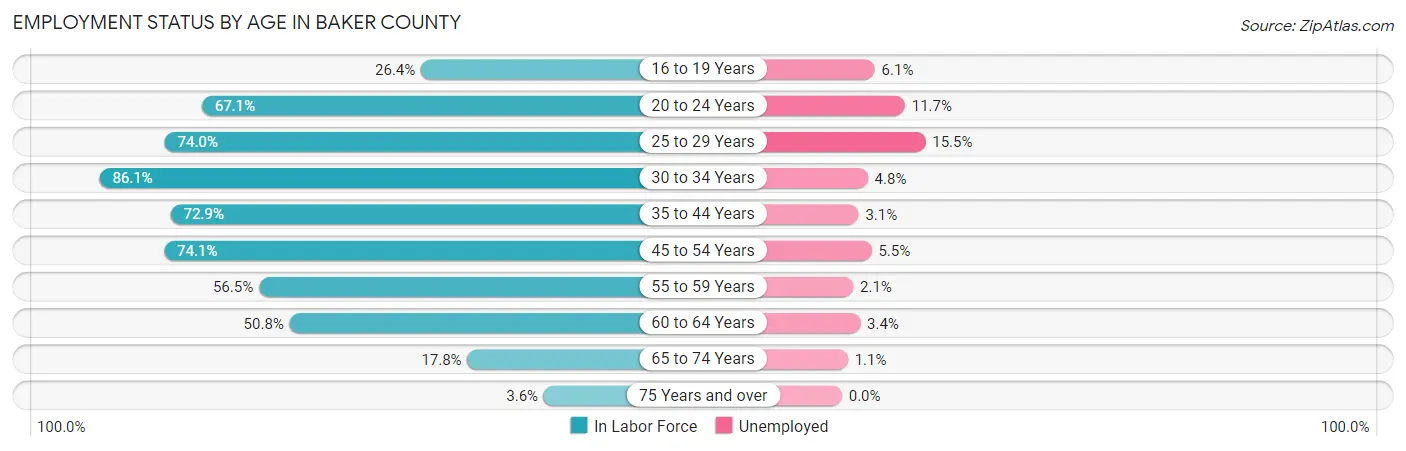
| Age Bracket | In Labor Force | Unemployed |
| 16 to 19 Years | 147 (26.4%) | 9 (6.1%) |
| 20 to 24 Years | 522 (67.1%) | 61 (11.7%) |
| 25 to 29 Years | 621 (74.0%) | 96 (15.5%) |
| 30 to 34 Years | 834 (86.1%) | 40 (4.8%) |
| 35 to 44 Years | 1,367 (72.9%) | 42 (3.1%) |
| 45 to 54 Years | 1,315 (74.1%) | 72 (5.5%) |
| 55 to 59 Years | 563 (56.5%) | 12 (2.1%) |
| 60 to 64 Years | 726 (50.8%) | 25 (3.4%) |
| 65 to 74 Years | 468 (17.8%) | 5 (1.1%) |
| 75 Years and over | 68 (3.6%) | 0 (0.0%) |
| Total | 6,627 (48.2%) | 364 (5.5%) |
Employment Status by Educational Attainment in Baker County
According to labor force statistics for Baker County, 68.8% of individuals (5,425) out of the total population between 25 and 64 years of age (7,885) are in the labor force, with 5.3% or 288 of them being unemployed. The group with the highest labor force participation rate are those with the educational attainment of bachelor's degree or higher, with 85.8% or 1,693 individuals in the labor force. Within the labor force, individuals with less than high school education have the highest percentage of unemployment, with 7.4% or 25 of them being unemployed.
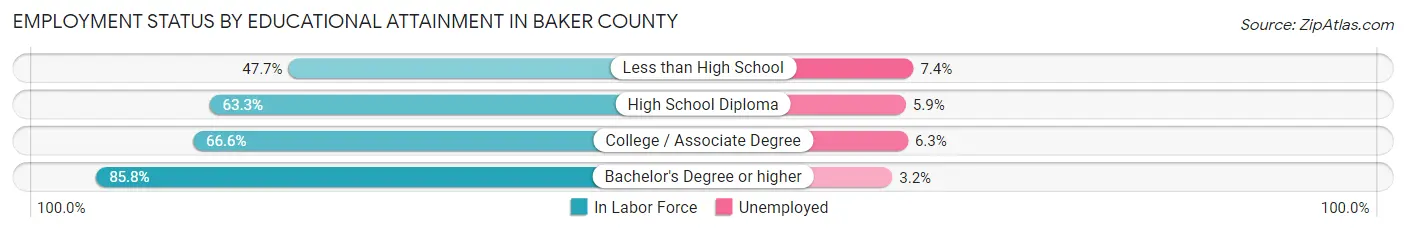
| Educational Attainment | In Labor Force | Unemployed |
| Less than High School | 336 (47.7%) | 52 (7.4%) |
| High School Diploma | 1,334 (63.3%) | 124 (5.9%) |
| College / Associate Degree | 2,065 (66.6%) | 195 (6.3%) |
| Bachelor's Degree or higher | 1,693 (85.8%) | 63 (3.2%) |
| Total | 5,425 (68.8%) | 418 (5.3%) |
Employment Occupations by Sex in Baker County
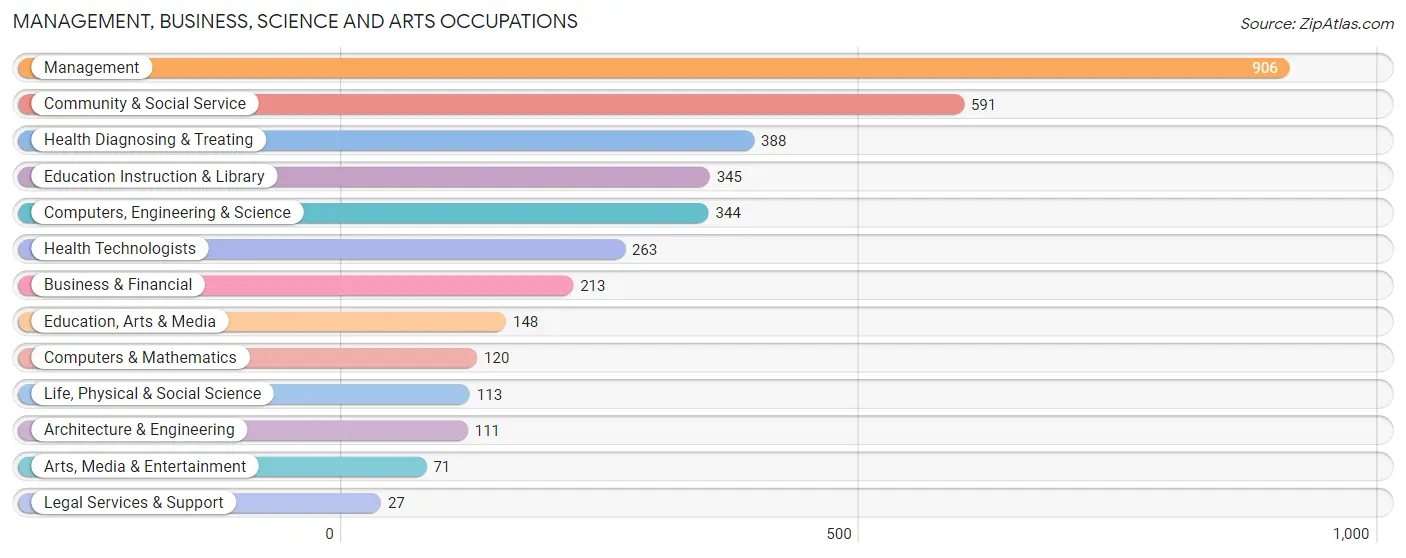
Management, Business, Science and Arts Occupations
The most common Management, Business, Science and Arts occupations in Baker County are Management (906 | 14.4%), Community & Social Service (591 | 9.4%), Health Diagnosing & Treating (388 | 6.2%), Education Instruction & Library (345 | 5.5%), and Computers, Engineering & Science (344 | 5.5%).
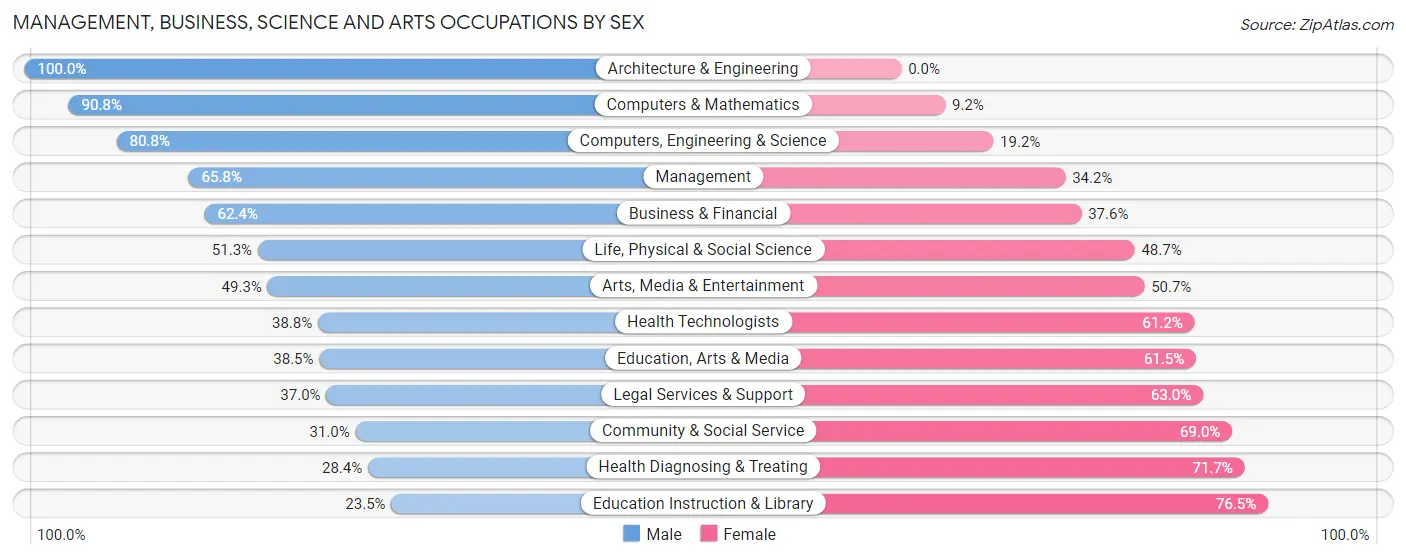
Management, Business, Science and Arts Occupations by Sex
Within the Management, Business, Science and Arts occupations in Baker County, the most male-oriented occupations are Architecture & Engineering (100.0%), Computers & Mathematics (90.8%), and Computers, Engineering & Science (80.8%), while the most female-oriented occupations are Education Instruction & Library (76.5%), Health Diagnosing & Treating (71.7%), and Community & Social Service (69.0%).
| Occupation | Male | Female |
| Management | 596 (65.8%) | 310 (34.2%) |
| Business & Financial | 133 (62.4%) | 80 (37.6%) |
| Computers, Engineering & Science | 278 (80.8%) | 66 (19.2%) |
| Computers & Mathematics | 109 (90.8%) | 11 (9.2%) |
| Architecture & Engineering | 111 (100.0%) | 0 (0.0%) |
| Life, Physical & Social Science | 58 (51.3%) | 55 (48.7%) |
| Community & Social Service | 183 (31.0%) | 408 (69.0%) |
| Education, Arts & Media | 57 (38.5%) | 91 (61.5%) |
| Legal Services & Support | 10 (37.0%) | 17 (63.0%) |
| Education Instruction & Library | 81 (23.5%) | 264 (76.5%) |
| Arts, Media & Entertainment | 35 (49.3%) | 36 (50.7%) |
| Health Diagnosing & Treating | 110 (28.3%) | 278 (71.7%) |
| Health Technologists | 102 (38.8%) | 161 (61.2%) |
| Total (Category) | 1,300 (53.2%) | 1,142 (46.8%) |
| Total (Overall) | 3,417 (54.5%) | 2,853 (45.5%) |
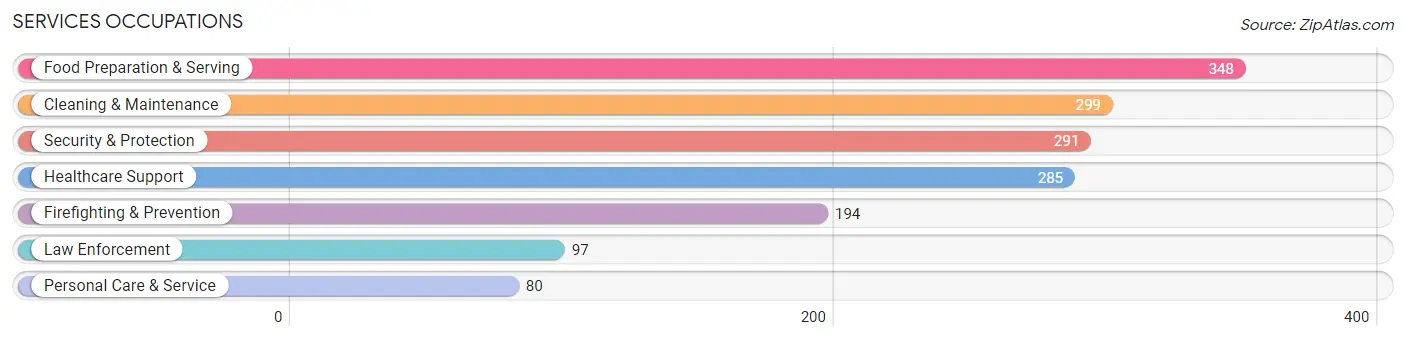
Services Occupations
The most common Services occupations in Baker County are Food Preparation & Serving (348 | 5.6%), Cleaning & Maintenance (299 | 4.8%), Security & Protection (291 | 4.6%), Healthcare Support (285 | 4.5%), and Firefighting & Prevention (194 | 3.1%).
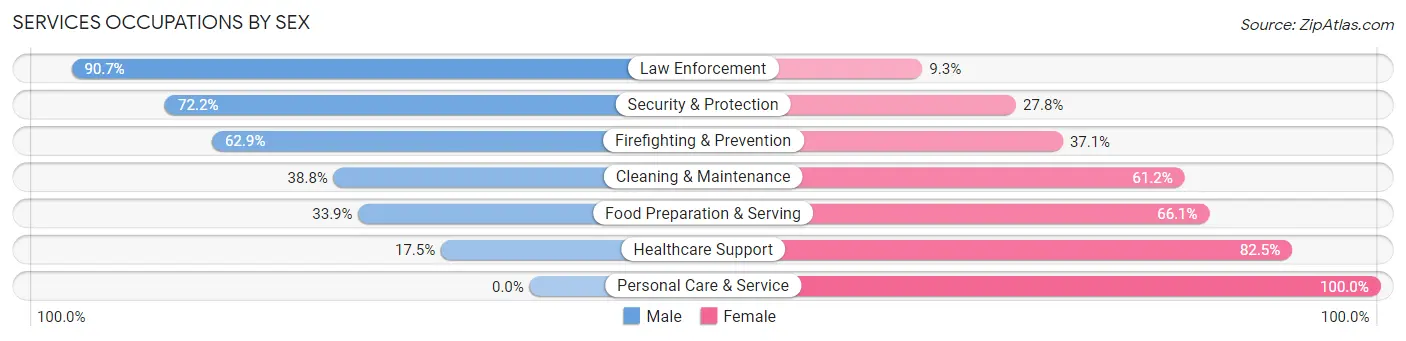
Services Occupations by Sex
Within the Services occupations in Baker County, the most male-oriented occupations are Law Enforcement (90.7%), Security & Protection (72.2%), and Firefighting & Prevention (62.9%), while the most female-oriented occupations are Personal Care & Service (100.0%), Healthcare Support (82.5%), and Food Preparation & Serving (66.1%).
| Occupation | Male | Female |
| Healthcare Support | 50 (17.5%) | 235 (82.5%) |
| Security & Protection | 210 (72.2%) | 81 (27.8%) |
| Firefighting & Prevention | 122 (62.9%) | 72 (37.1%) |
| Law Enforcement | 88 (90.7%) | 9 (9.3%) |
| Food Preparation & Serving | 118 (33.9%) | 230 (66.1%) |
| Cleaning & Maintenance | 116 (38.8%) | 183 (61.2%) |
| Personal Care & Service | 0 (0.0%) | 80 (100.0%) |
| Total (Category) | 494 (37.9%) | 809 (62.1%) |
| Total (Overall) | 3,417 (54.5%) | 2,853 (45.5%) |
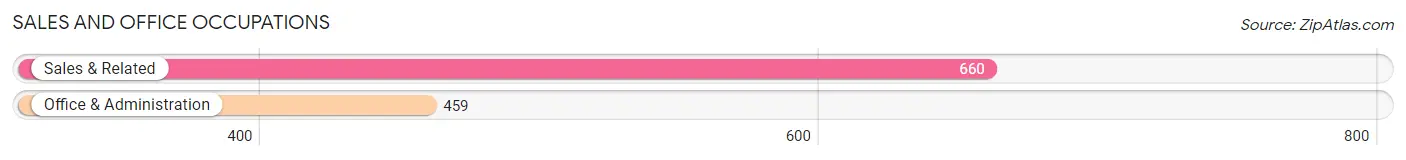
Sales and Office Occupations
The most common Sales and Office occupations in Baker County are Sales & Related (660 | 10.5%), and Office & Administration (459 | 7.3%).
Sales and Office Occupations by Sex
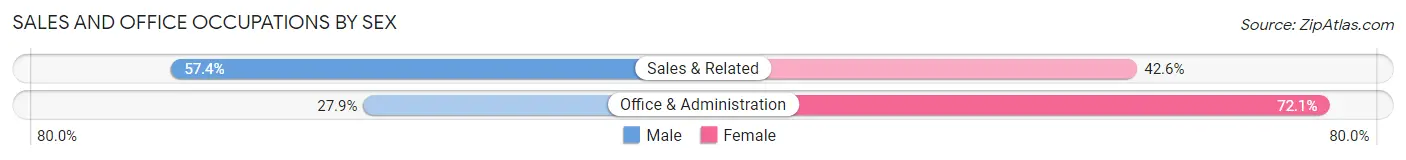
| Occupation | Male | Female |
| Sales & Related | 379 (57.4%) | 281 (42.6%) |
| Office & Administration | 128 (27.9%) | 331 (72.1%) |
| Total (Category) | 507 (45.3%) | 612 (54.7%) |
| Total (Overall) | 3,417 (54.5%) | 2,853 (45.5%) |
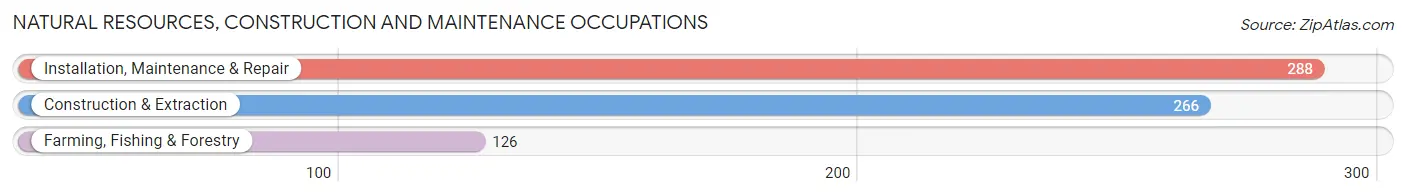
Natural Resources, Construction and Maintenance Occupations
The most common Natural Resources, Construction and Maintenance occupations in Baker County are Installation, Maintenance & Repair (288 | 4.6%), Construction & Extraction (266 | 4.2%), and Farming, Fishing & Forestry (126 | 2.0%).
Natural Resources, Construction and Maintenance Occupations by Sex
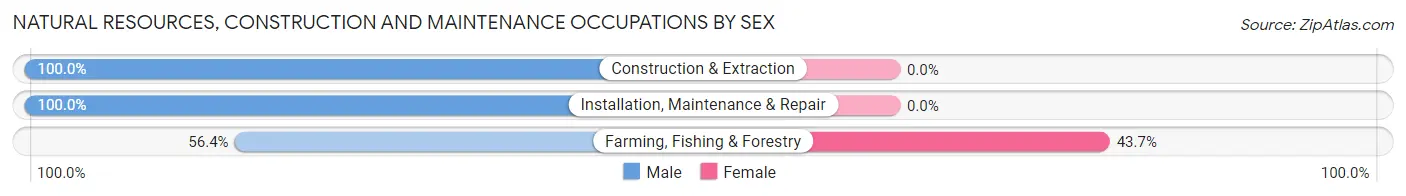
| Occupation | Male | Female |
| Farming, Fishing & Forestry | 71 (56.4%) | 55 (43.6%) |
| Construction & Extraction | 266 (100.0%) | 0 (0.0%) |
| Installation, Maintenance & Repair | 288 (100.0%) | 0 (0.0%) |
| Total (Category) | 625 (91.9%) | 55 (8.1%) |
| Total (Overall) | 3,417 (54.5%) | 2,853 (45.5%) |
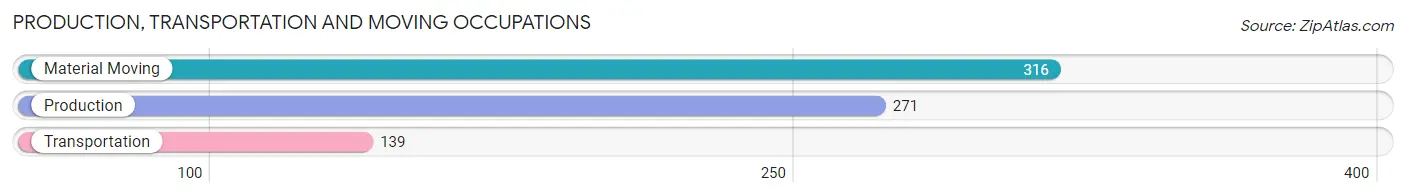
Production, Transportation and Moving Occupations
The most common Production, Transportation and Moving occupations in Baker County are Material Moving (316 | 5.0%), Production (271 | 4.3%), and Transportation (139 | 2.2%).
Production, Transportation and Moving Occupations by Sex
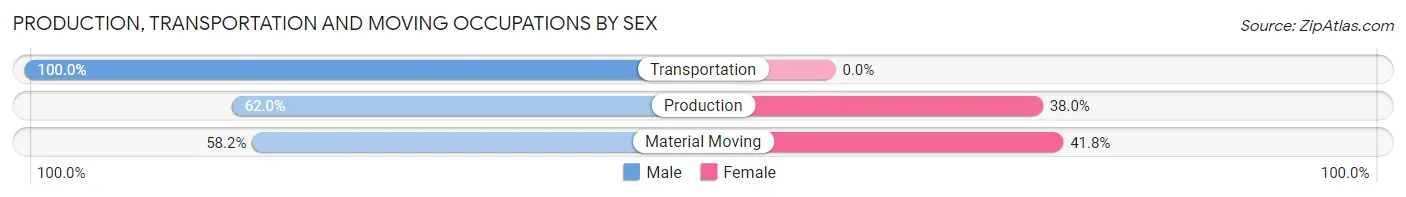
| Occupation | Male | Female |
| Production | 168 (62.0%) | 103 (38.0%) |
| Transportation | 139 (100.0%) | 0 (0.0%) |
| Material Moving | 184 (58.2%) | 132 (41.8%) |
| Total (Category) | 491 (67.6%) | 235 (32.4%) |
| Total (Overall) | 3,417 (54.5%) | 2,853 (45.5%) |
Employment Industries by Sex in Baker County
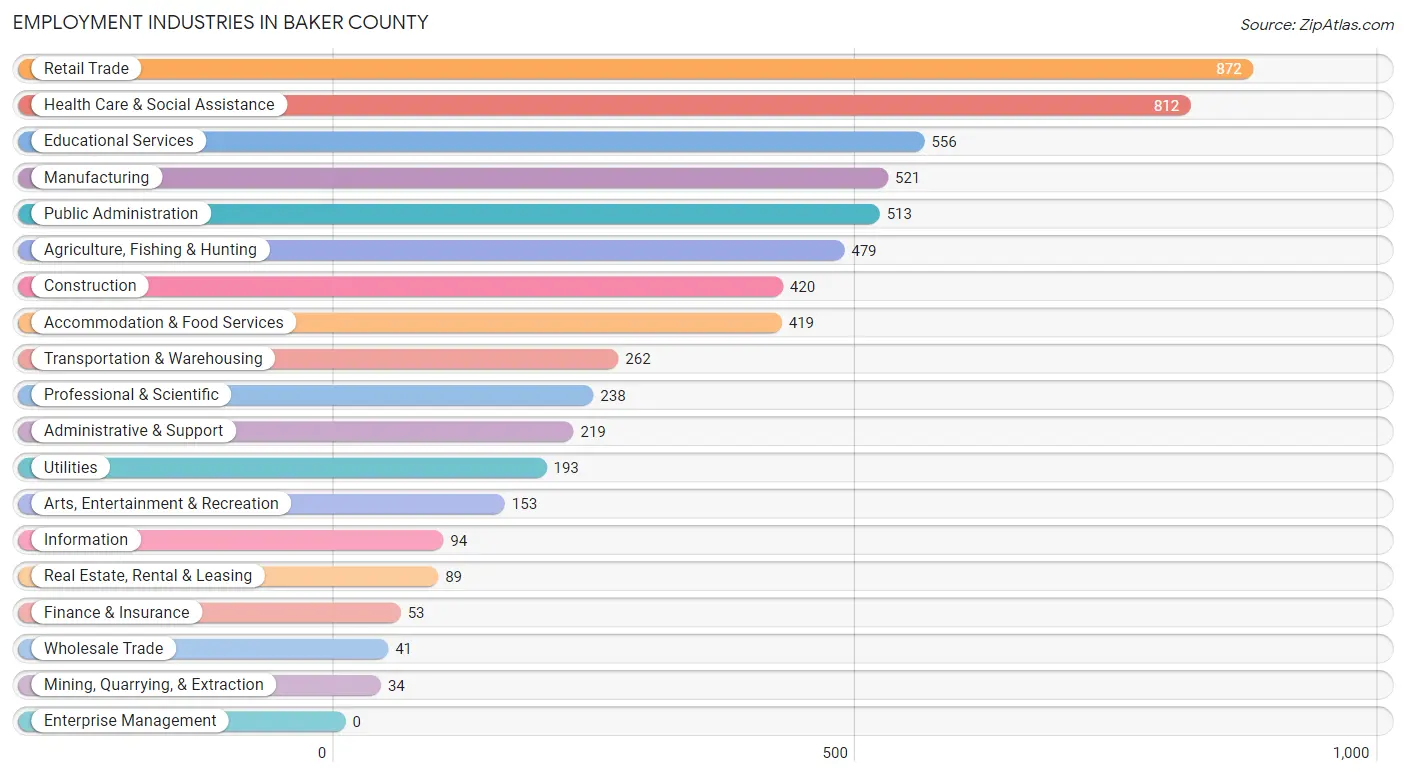
Employment Industries in Baker County
The major employment industries in Baker County include Retail Trade (872 | 13.9%), Health Care & Social Assistance (812 | 13.0%), Educational Services (556 | 8.9%), Manufacturing (521 | 8.3%), and Public Administration (513 | 8.2%).
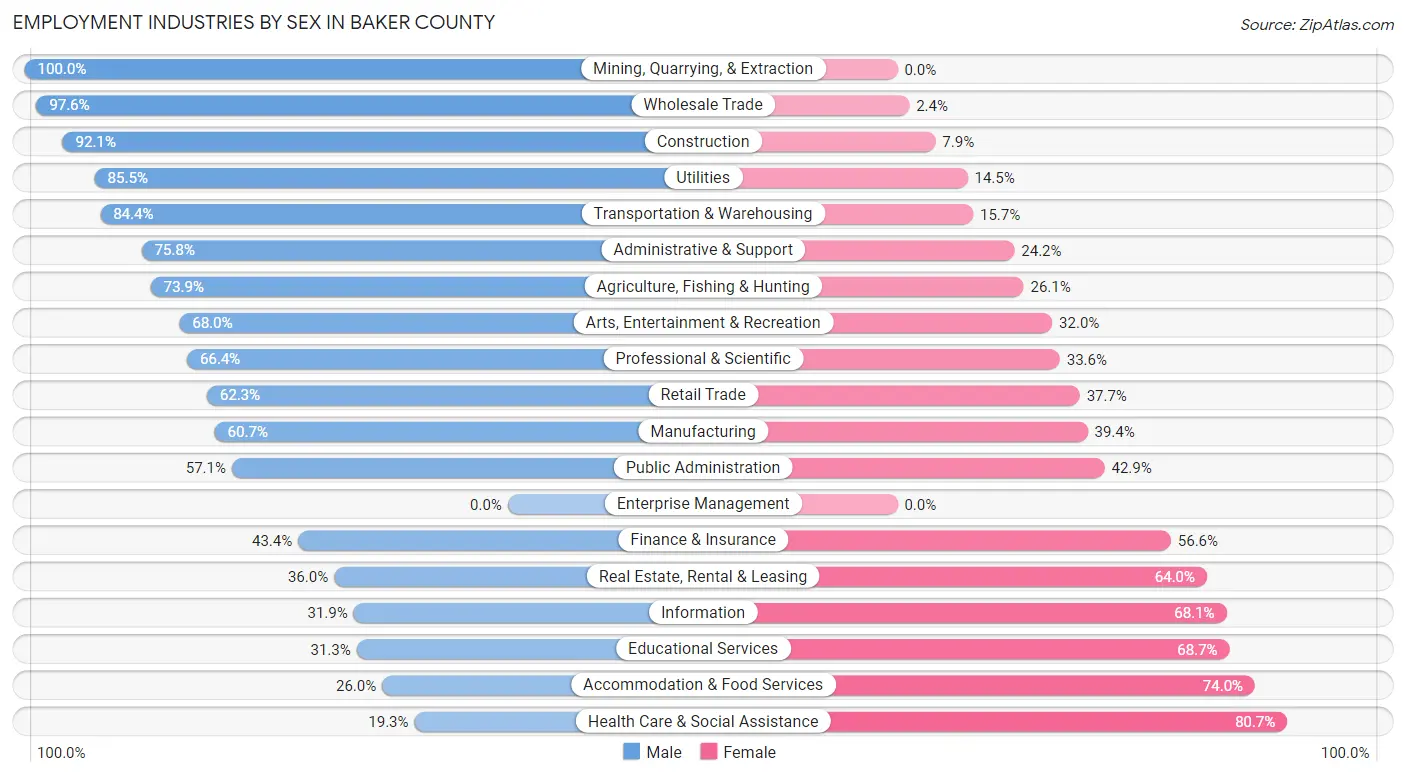
Employment Industries by Sex in Baker County
The Baker County industries that see more men than women are Mining, Quarrying, & Extraction (100.0%), Wholesale Trade (97.6%), and Construction (92.1%), whereas the industries that tend to have a higher number of women are Health Care & Social Assistance (80.7%), Accommodation & Food Services (74.0%), and Educational Services (68.7%).
| Industry | Male | Female |
| Agriculture, Fishing & Hunting | 354 (73.9%) | 125 (26.1%) |
| Mining, Quarrying, & Extraction | 34 (100.0%) | 0 (0.0%) |
| Construction | 387 (92.1%) | 33 (7.9%) |
| Manufacturing | 316 (60.7%) | 205 (39.4%) |
| Wholesale Trade | 40 (97.6%) | 1 (2.4%) |
| Retail Trade | 543 (62.3%) | 329 (37.7%) |
| Transportation & Warehousing | 221 (84.4%) | 41 (15.7%) |
| Utilities | 165 (85.5%) | 28 (14.5%) |
| Information | 30 (31.9%) | 64 (68.1%) |
| Finance & Insurance | 23 (43.4%) | 30 (56.6%) |
| Real Estate, Rental & Leasing | 32 (36.0%) | 57 (64.0%) |
| Professional & Scientific | 158 (66.4%) | 80 (33.6%) |
| Enterprise Management | 0 (0.0%) | 0 (0.0%) |
| Administrative & Support | 166 (75.8%) | 53 (24.2%) |
| Educational Services | 174 (31.3%) | 382 (68.7%) |
| Health Care & Social Assistance | 157 (19.3%) | 655 (80.7%) |
| Arts, Entertainment & Recreation | 104 (68.0%) | 49 (32.0%) |
| Accommodation & Food Services | 109 (26.0%) | 310 (74.0%) |
| Public Administration | 293 (57.1%) | 220 (42.9%) |
| Total | 3,417 (54.5%) | 2,853 (45.5%) |
Education in Baker County
School Enrollment in Baker County
The most common levels of schooling among the 3,235 students in Baker County are middle school (927 | 28.7%), high school (780 | 24.1%), and elementary school (598 | 18.5%).
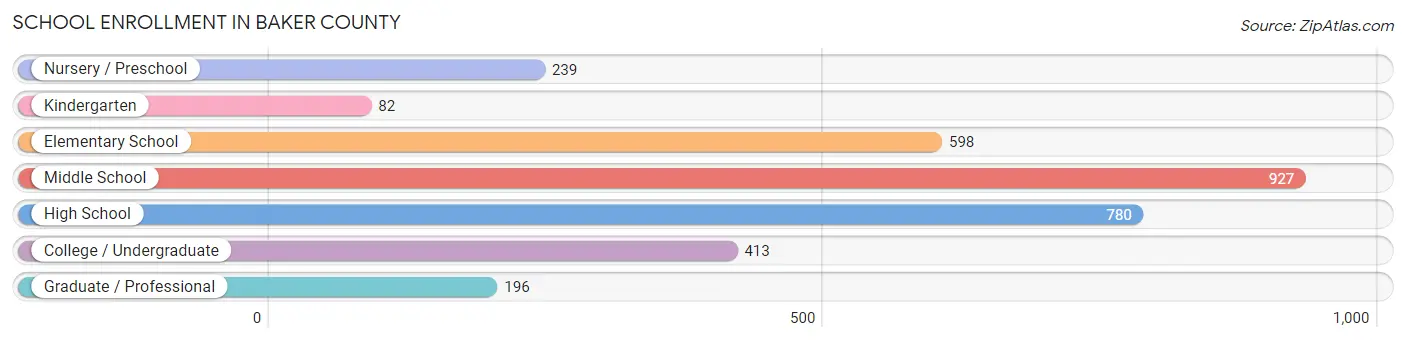
| School Level | # Students | % Students |
| Nursery / Preschool | 239 | 7.4% |
| Kindergarten | 82 | 2.5% |
| Elementary School | 598 | 18.5% |
| Middle School | 927 | 28.7% |
| High School | 780 | 24.1% |
| College / Undergraduate | 413 | 12.8% |
| Graduate / Professional | 196 | 6.1% |
| Total | 3,235 | 100.0% |
School Enrollment by Age by Funding Source in Baker County
Out of a total of 3,235 students who are enrolled in schools in Baker County, 738 (22.8%) attend a private institution, while the remaining 2,497 (77.2%) are enrolled in public schools. The age group of 3 to 4 year olds has the highest likelihood of being enrolled in private schools, with 116 (70.7% in the age bracket) enrolled. Conversely, the age group of 25 to 34 year olds has the lowest likelihood of being enrolled in a private school, with 167 (97.1% in the age bracket) attending a public institution.
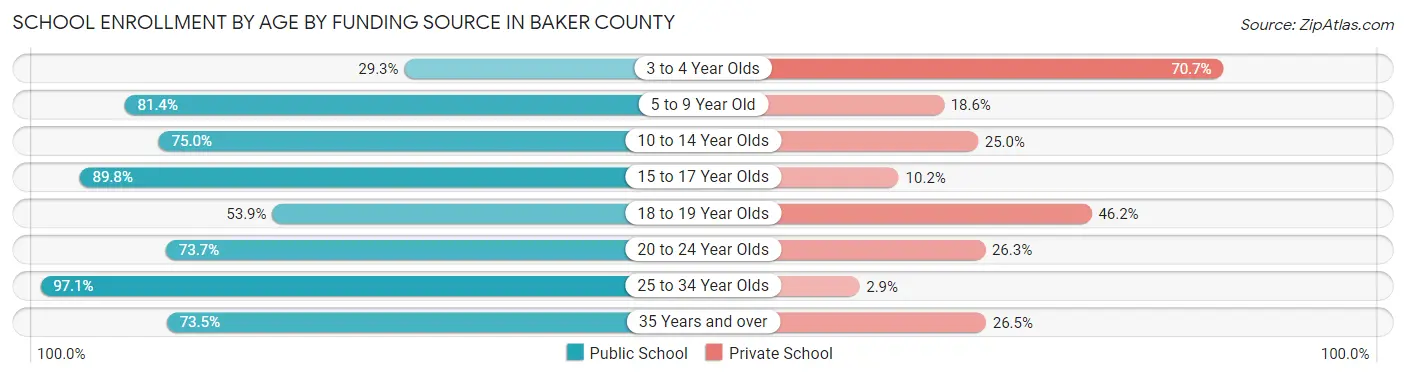
| Age Bracket | Public School | Private School |
| 3 to 4 Year Olds | 48 (29.3%) | 116 (70.7%) |
| 5 to 9 Year Old | 594 (81.4%) | 136 (18.6%) |
| 10 to 14 Year Olds | 790 (75.0%) | 263 (25.0%) |
| 15 to 17 Year Olds | 491 (89.8%) | 56 (10.2%) |
| 18 to 19 Year Olds | 35 (53.8%) | 30 (46.2%) |
| 20 to 24 Year Olds | 210 (73.7%) | 75 (26.3%) |
| 25 to 34 Year Olds | 167 (97.1%) | 5 (2.9%) |
| 35 Years and over | 161 (73.5%) | 58 (26.5%) |
| Total | 2,497 (77.2%) | 738 (22.8%) |
Educational Attainment by Field of Study in Baker County
Bio, nature & agricultural (608 | 18.9%), education (499 | 15.5%), business (302 | 9.4%), science & technology (301 | 9.3%), and arts & humanities (235 | 7.3%) are the most common fields of study among 3,221 individuals in Baker County who have obtained a bachelor's degree or higher.
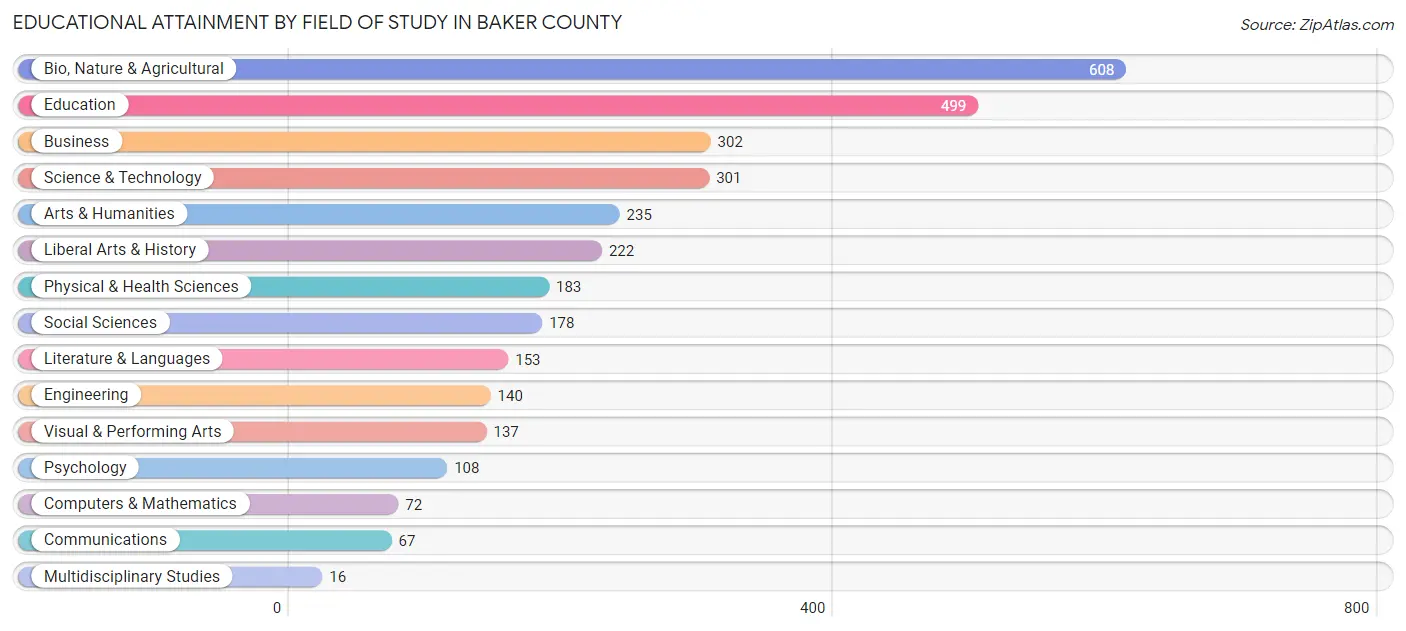
| Field of Study | # Graduates | % Graduates |
| Computers & Mathematics | 72 | 2.2% |
| Bio, Nature & Agricultural | 608 | 18.9% |
| Physical & Health Sciences | 183 | 5.7% |
| Psychology | 108 | 3.4% |
| Social Sciences | 178 | 5.5% |
| Engineering | 140 | 4.3% |
| Multidisciplinary Studies | 16 | 0.5% |
| Science & Technology | 301 | 9.3% |
| Business | 302 | 9.4% |
| Education | 499 | 15.5% |
| Literature & Languages | 153 | 4.8% |
| Liberal Arts & History | 222 | 6.9% |
| Visual & Performing Arts | 137 | 4.3% |
| Communications | 67 | 2.1% |
| Arts & Humanities | 235 | 7.3% |
| Total | 3,221 | 100.0% |
Transportation & Commute in Baker County
Vehicle Availability by Sex in Baker County
The most prevalent vehicle ownership categories in Baker County are males with 2 vehicles (1,324, accounting for 40.1%) and females with 2 vehicles (899, making up 47.5%).
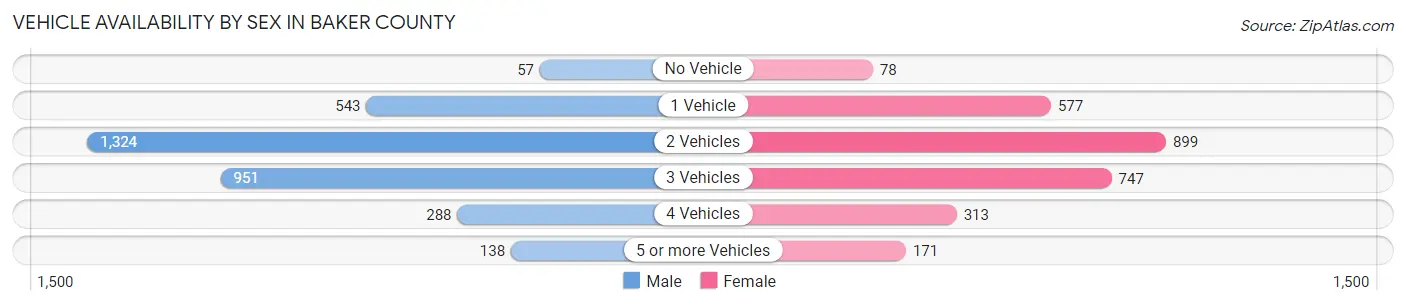
| Vehicles Available | Male | Female |
| No Vehicle | 57 (1.7%) | 78 (2.8%) |
| 1 Vehicle | 543 (16.5%) | 577 (20.7%) |
| 2 Vehicles | 1,324 (40.1%) | 899 (32.3%) |
| 3 Vehicles | 951 (28.8%) | 747 (26.8%) |
| 4 Vehicles | 288 (8.7%) | 313 (11.2%) |
| 5 or more Vehicles | 138 (4.2%) | 171 (6.1%) |
| Total | 3,301 (100.0%) | 2,785 (100.0%) |
Commute Time in Baker County
The most frequently occuring commute durations in Baker County are 5 to 9 minutes (2,151 commuters, 38.4%), 10 to 14 minutes (889 commuters, 15.9%), and less than 5 minutes (687 commuters, 12.3%).
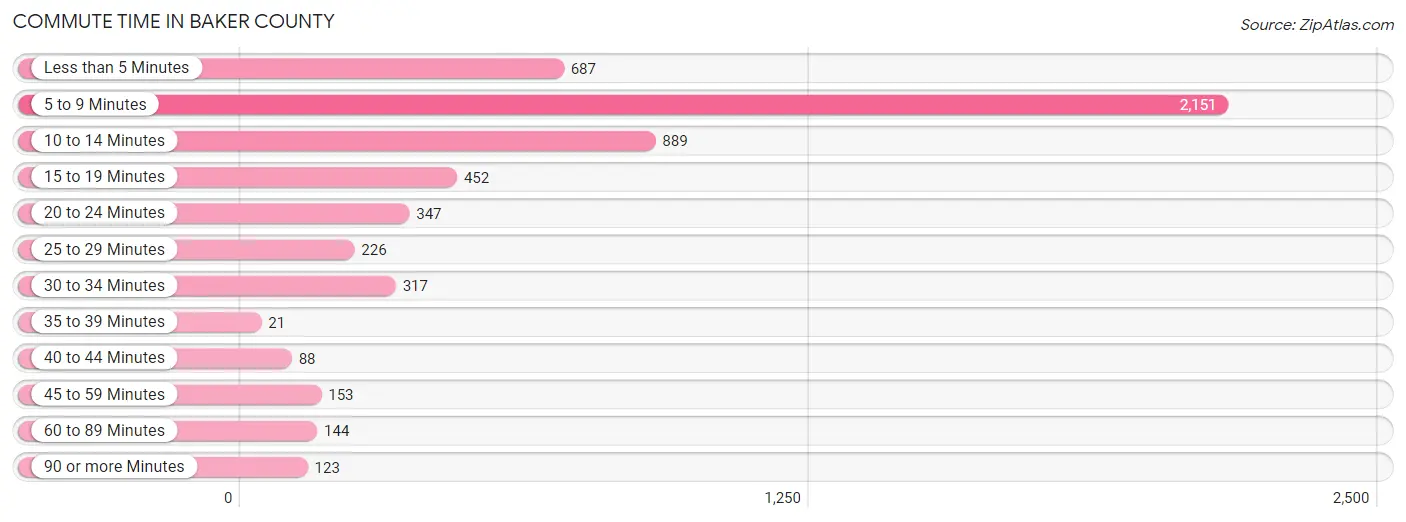
| Commute Time | # Commuters | % Commuters |
| Less than 5 Minutes | 687 | 12.3% |
| 5 to 9 Minutes | 2,151 | 38.4% |
| 10 to 14 Minutes | 889 | 15.9% |
| 15 to 19 Minutes | 452 | 8.1% |
| 20 to 24 Minutes | 347 | 6.2% |
| 25 to 29 Minutes | 226 | 4.0% |
| 30 to 34 Minutes | 317 | 5.7% |
| 35 to 39 Minutes | 21 | 0.4% |
| 40 to 44 Minutes | 88 | 1.6% |
| 45 to 59 Minutes | 153 | 2.7% |
| 60 to 89 Minutes | 144 | 2.6% |
| 90 or more Minutes | 123 | 2.2% |
Commute Time by Sex in Baker County
The most common commute times in Baker County are 5 to 9 minutes (1,180 commuters, 40.0%) for males and 5 to 9 minutes (971 commuters, 36.6%) for females.
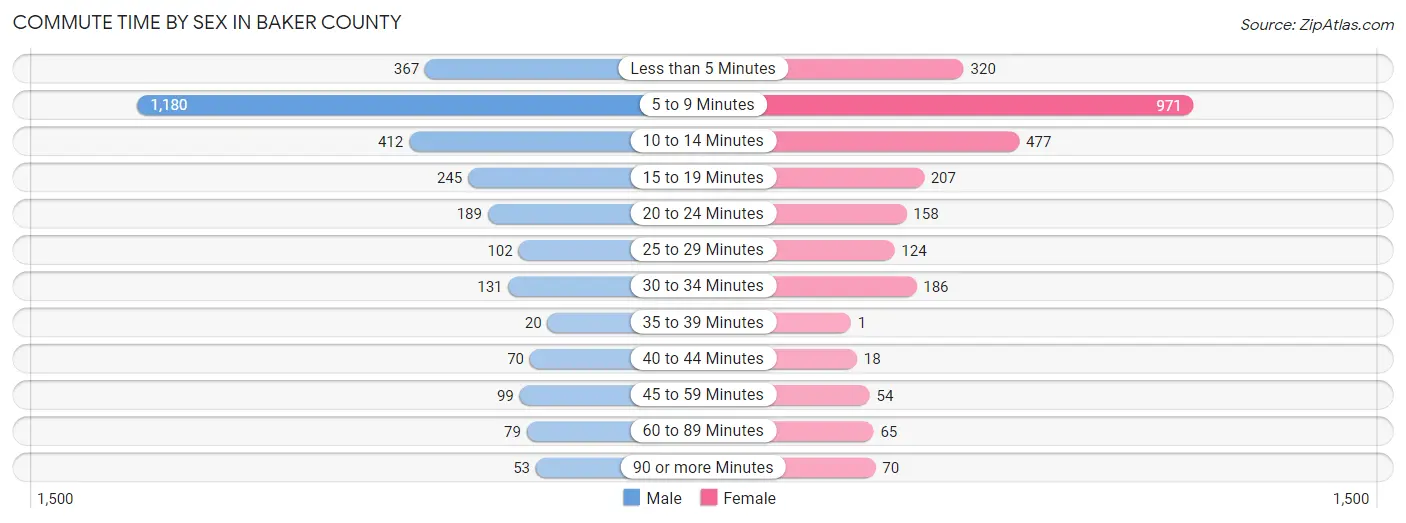
| Commute Time | Male | Female |
| Less than 5 Minutes | 367 (12.4%) | 320 (12.1%) |
| 5 to 9 Minutes | 1,180 (40.0%) | 971 (36.6%) |
| 10 to 14 Minutes | 412 (14.0%) | 477 (18.0%) |
| 15 to 19 Minutes | 245 (8.3%) | 207 (7.8%) |
| 20 to 24 Minutes | 189 (6.4%) | 158 (6.0%) |
| 25 to 29 Minutes | 102 (3.5%) | 124 (4.7%) |
| 30 to 34 Minutes | 131 (4.4%) | 186 (7.0%) |
| 35 to 39 Minutes | 20 (0.7%) | 1 (0.0%) |
| 40 to 44 Minutes | 70 (2.4%) | 18 (0.7%) |
| 45 to 59 Minutes | 99 (3.4%) | 54 (2.0%) |
| 60 to 89 Minutes | 79 (2.7%) | 65 (2.5%) |
| 90 or more Minutes | 53 (1.8%) | 70 (2.6%) |
Time of Departure to Work by Sex in Baker County
The most frequent times of departure to work in Baker County are 7:00 AM to 7:29 AM (494, 16.8%) for males and 7:30 AM to 7:59 AM (459, 17.3%) for females.
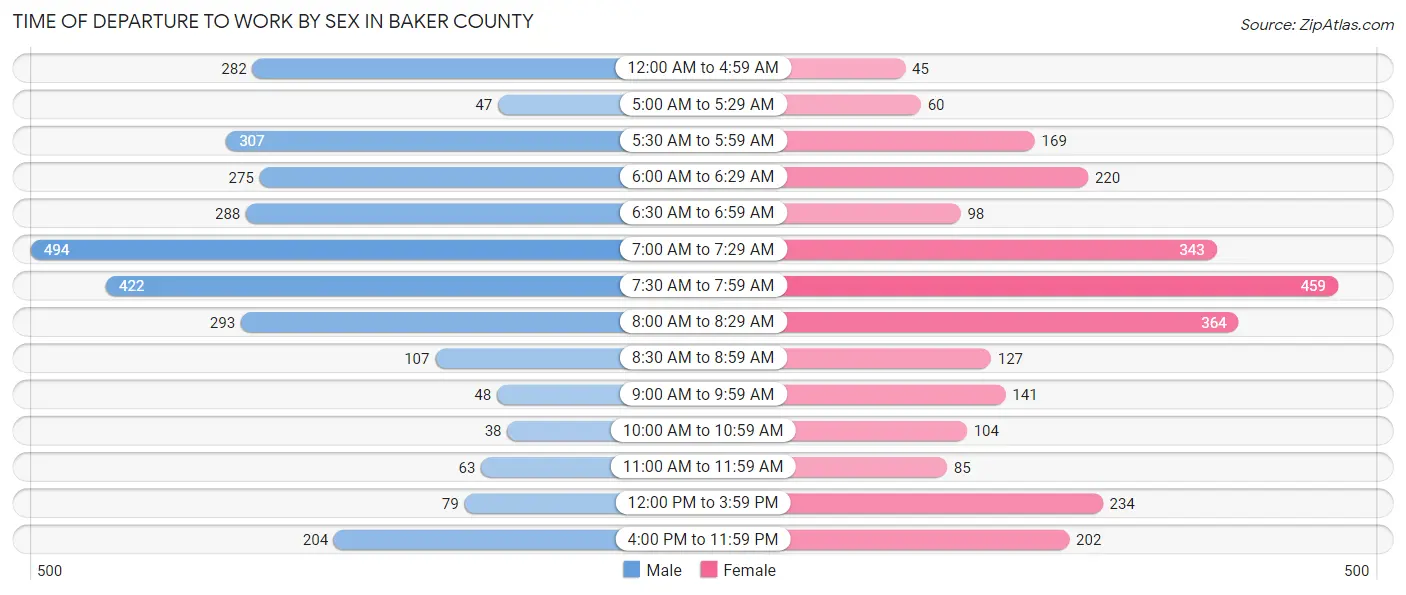
| Time of Departure | Male | Female |
| 12:00 AM to 4:59 AM | 282 (9.6%) | 45 (1.7%) |
| 5:00 AM to 5:29 AM | 47 (1.6%) | 60 (2.3%) |
| 5:30 AM to 5:59 AM | 307 (10.4%) | 169 (6.4%) |
| 6:00 AM to 6:29 AM | 275 (9.3%) | 220 (8.3%) |
| 6:30 AM to 6:59 AM | 288 (9.8%) | 98 (3.7%) |
| 7:00 AM to 7:29 AM | 494 (16.8%) | 343 (12.9%) |
| 7:30 AM to 7:59 AM | 422 (14.3%) | 459 (17.3%) |
| 8:00 AM to 8:29 AM | 293 (9.9%) | 364 (13.7%) |
| 8:30 AM to 8:59 AM | 107 (3.6%) | 127 (4.8%) |
| 9:00 AM to 9:59 AM | 48 (1.6%) | 141 (5.3%) |
| 10:00 AM to 10:59 AM | 38 (1.3%) | 104 (3.9%) |
| 11:00 AM to 11:59 AM | 63 (2.1%) | 85 (3.2%) |
| 12:00 PM to 3:59 PM | 79 (2.7%) | 234 (8.8%) |
| 4:00 PM to 11:59 PM | 204 (6.9%) | 202 (7.6%) |
| Total | 2,947 (100.0%) | 2,651 (100.0%) |
Housing Occupancy in Baker County
Occupancy by Ownership in Baker County
Of the total 7,004 dwellings in Baker County, owner-occupied units account for 5,058 (72.2%), while renter-occupied units make up 1,946 (27.8%).
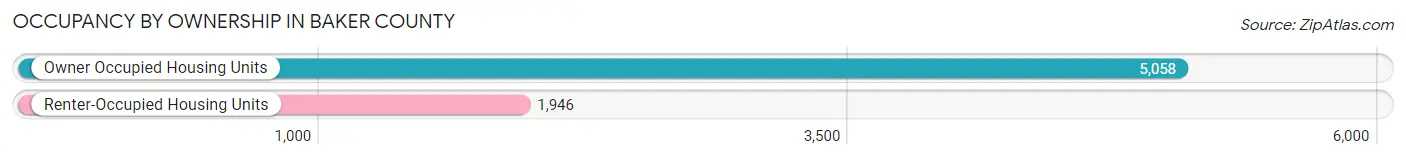
| Occupancy | # Housing Units | % Housing Units |
| Owner Occupied Housing Units | 5,058 | 72.2% |
| Renter-Occupied Housing Units | 1,946 | 27.8% |
| Total Occupied Housing Units | 7,004 | 100.0% |
Occupancy by Household Size in Baker County
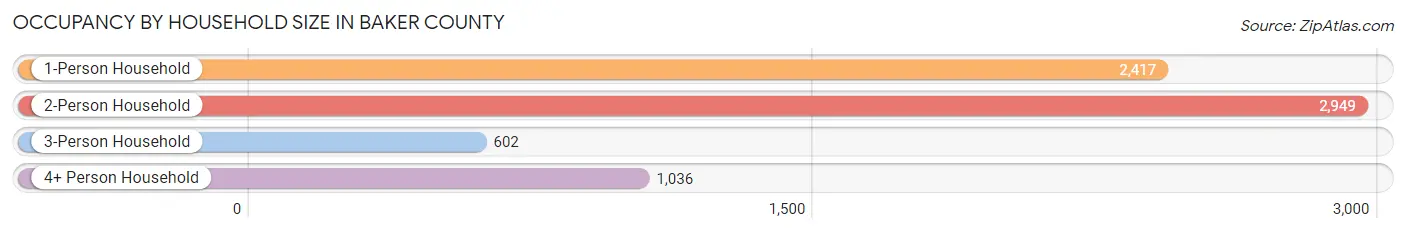
| Household Size | # Housing Units | % Housing Units |
| 1-Person Household | 2,417 | 34.5% |
| 2-Person Household | 2,949 | 42.1% |
| 3-Person Household | 602 | 8.6% |
| 4+ Person Household | 1,036 | 14.8% |
| Total Housing Units | 7,004 | 100.0% |
Occupancy by Ownership by Household Size in Baker County
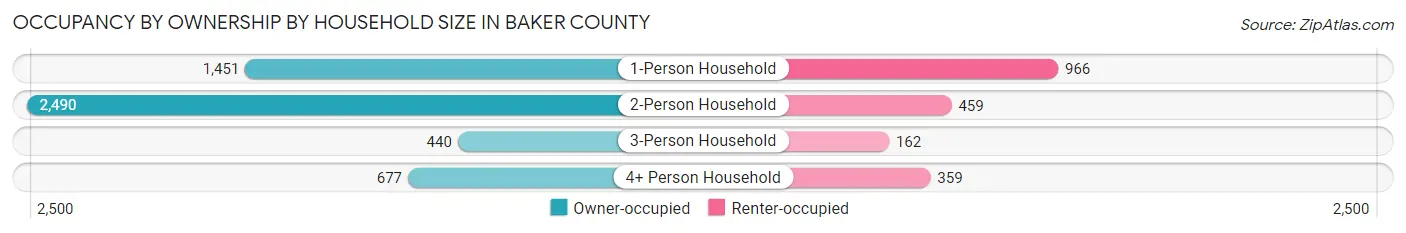
| Household Size | Owner-occupied | Renter-occupied |
| 1-Person Household | 1,451 (60.0%) | 966 (40.0%) |
| 2-Person Household | 2,490 (84.4%) | 459 (15.6%) |
| 3-Person Household | 440 (73.1%) | 162 (26.9%) |
| 4+ Person Household | 677 (65.3%) | 359 (34.6%) |
| Total Housing Units | 5,058 (72.2%) | 1,946 (27.8%) |
Occupancy by Educational Attainment in Baker County
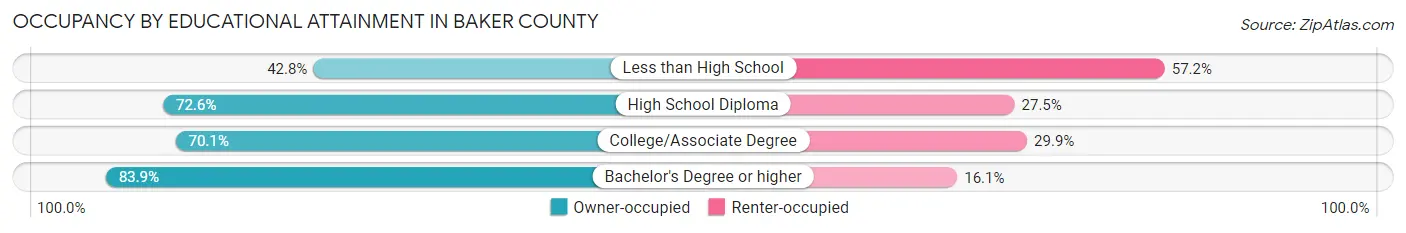
| Household Size | Owner-occupied | Renter-occupied |
| Less than High School | 252 (42.8%) | 337 (57.2%) |
| High School Diploma | 1,271 (72.6%) | 481 (27.5%) |
| College/Associate Degree | 1,913 (70.1%) | 817 (29.9%) |
| Bachelor's Degree or higher | 1,622 (83.9%) | 311 (16.1%) |
Occupancy by Age of Householder in Baker County
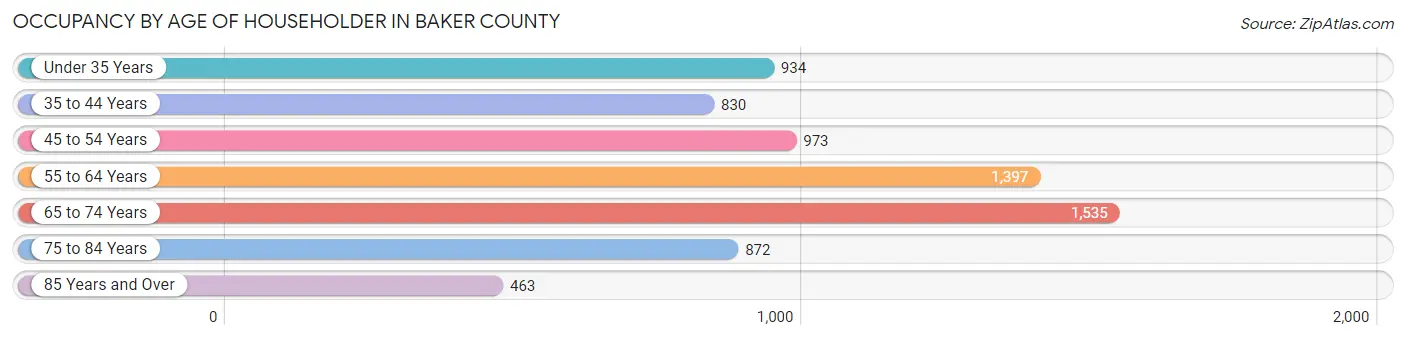
| Age Bracket | # Households | % Households |
| Under 35 Years | 934 | 13.3% |
| 35 to 44 Years | 830 | 11.8% |
| 45 to 54 Years | 973 | 13.9% |
| 55 to 64 Years | 1,397 | 20.0% |
| 65 to 74 Years | 1,535 | 21.9% |
| 75 to 84 Years | 872 | 12.4% |
| 85 Years and Over | 463 | 6.6% |
| Total | 7,004 | 100.0% |
Housing Finances in Baker County
Median Income by Occupancy in Baker County
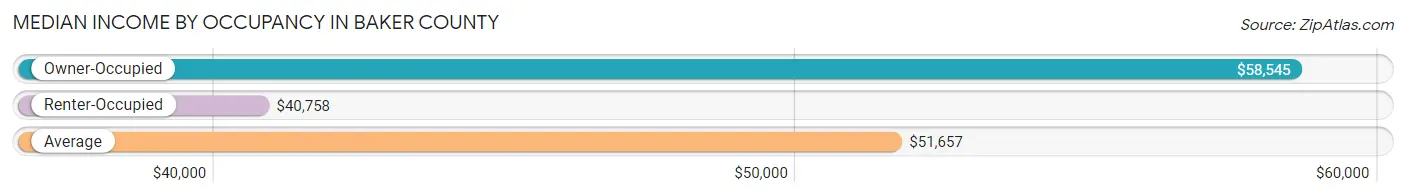
| Occupancy Type | # Households | Median Income |
| Owner-Occupied | 5,058 (72.2%) | $58,545 |
| Renter-Occupied | 1,946 (27.8%) | $40,758 |
| Average | 7,004 (100.0%) | $51,657 |
Occupancy by Householder Income Bracket in Baker County
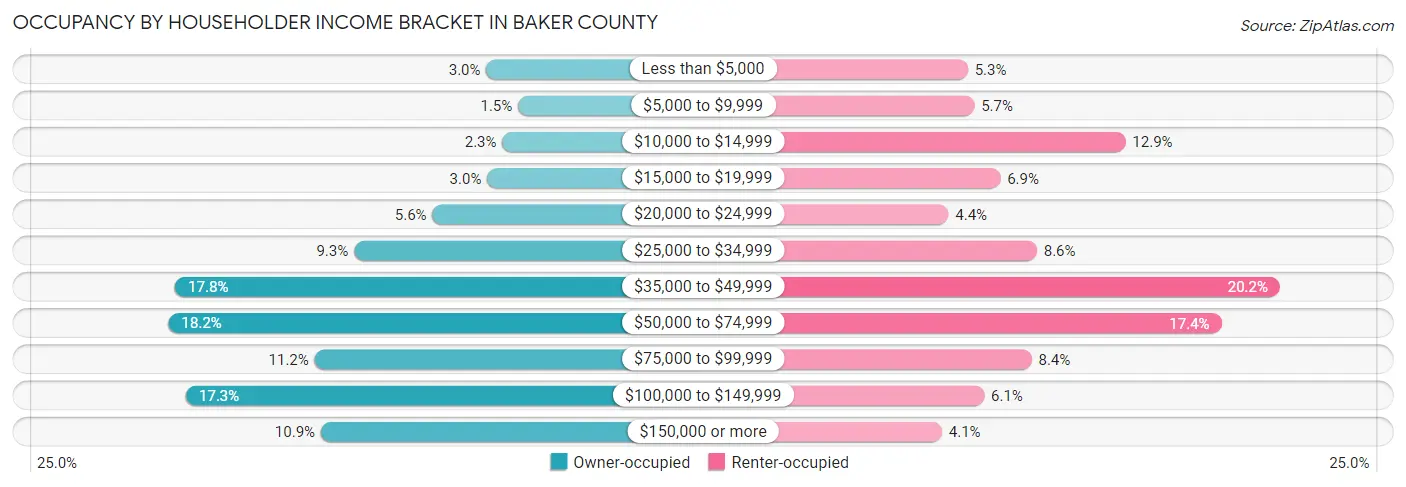
| Income Bracket | Owner-occupied | Renter-occupied |
| Less than $5,000 | 152 (3.0%) | 104 (5.3%) |
| $5,000 to $9,999 | 76 (1.5%) | 110 (5.7%) |
| $10,000 to $14,999 | 114 (2.2%) | 250 (12.9%) |
| $15,000 to $19,999 | 150 (3.0%) | 134 (6.9%) |
| $20,000 to $24,999 | 282 (5.6%) | 86 (4.4%) |
| $25,000 to $34,999 | 471 (9.3%) | 168 (8.6%) |
| $35,000 to $49,999 | 902 (17.8%) | 393 (20.2%) |
| $50,000 to $74,999 | 918 (18.1%) | 339 (17.4%) |
| $75,000 to $99,999 | 566 (11.2%) | 163 (8.4%) |
| $100,000 to $149,999 | 876 (17.3%) | 119 (6.1%) |
| $150,000 or more | 551 (10.9%) | 80 (4.1%) |
| Total | 5,058 (100.0%) | 1,946 (100.0%) |
Monthly Housing Cost Tiers in Baker County
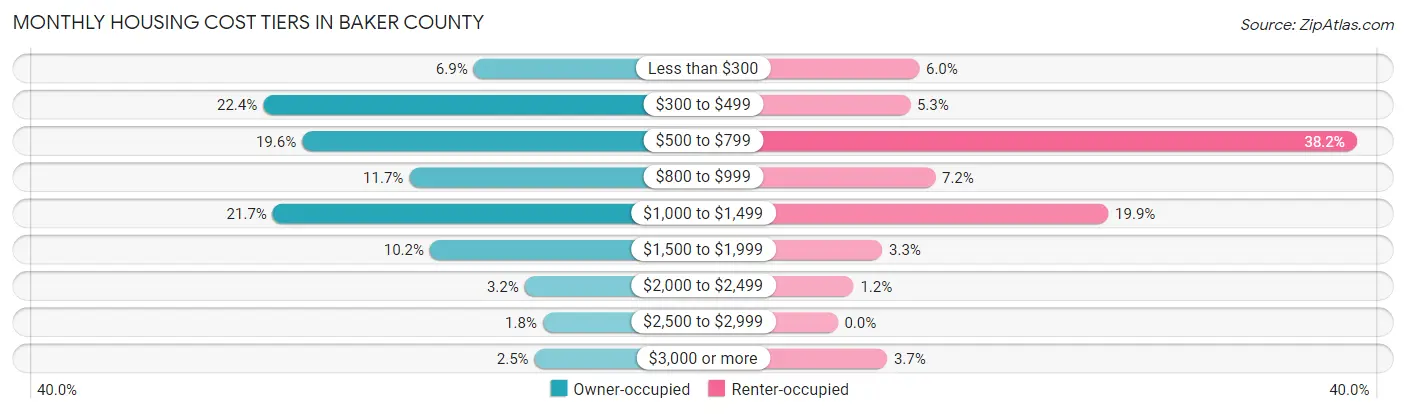
| Monthly Cost | Owner-occupied | Renter-occupied |
| Less than $300 | 351 (6.9%) | 117 (6.0%) |
| $300 to $499 | 1,135 (22.4%) | 104 (5.3%) |
| $500 to $799 | 990 (19.6%) | 744 (38.2%) |
| $800 to $999 | 591 (11.7%) | 140 (7.2%) |
| $1,000 to $1,499 | 1,099 (21.7%) | 388 (19.9%) |
| $1,500 to $1,999 | 514 (10.2%) | 64 (3.3%) |
| $2,000 to $2,499 | 161 (3.2%) | 23 (1.2%) |
| $2,500 to $2,999 | 93 (1.8%) | 0 (0.0%) |
| $3,000 or more | 124 (2.5%) | 71 (3.6%) |
| Total | 5,058 (100.0%) | 1,946 (100.0%) |
Physical Housing Characteristics in Baker County
Housing Structures in Baker County
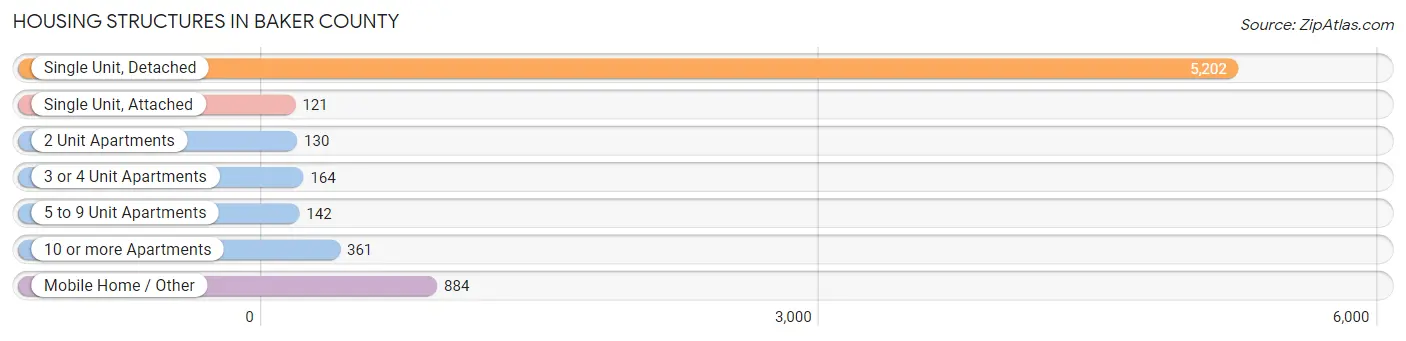
| Structure Type | # Housing Units | % Housing Units |
| Single Unit, Detached | 5,202 | 74.3% |
| Single Unit, Attached | 121 | 1.7% |
| 2 Unit Apartments | 130 | 1.9% |
| 3 or 4 Unit Apartments | 164 | 2.3% |
| 5 to 9 Unit Apartments | 142 | 2.0% |
| 10 or more Apartments | 361 | 5.1% |
| Mobile Home / Other | 884 | 12.6% |
| Total | 7,004 | 100.0% |
Housing Structures by Occupancy in Baker County
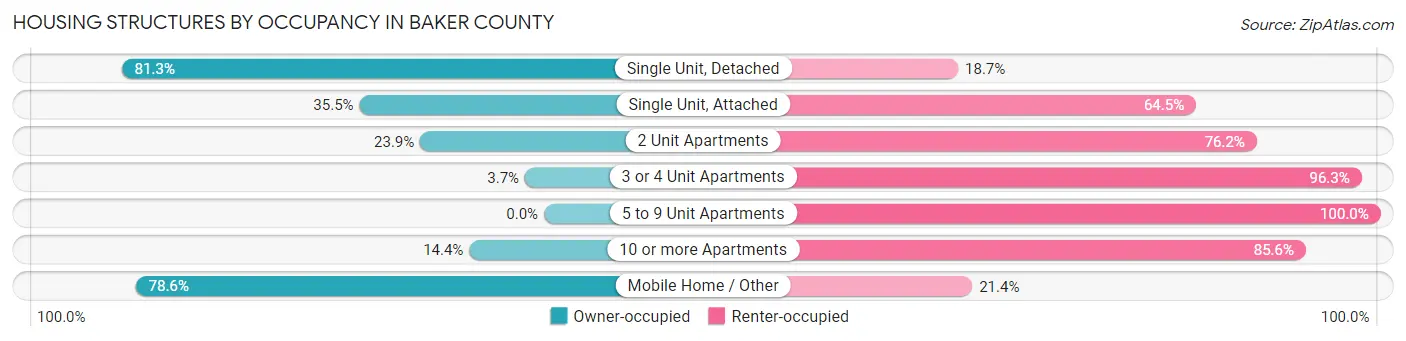
| Structure Type | Owner-occupied | Renter-occupied |
| Single Unit, Detached | 4,231 (81.3%) | 971 (18.7%) |
| Single Unit, Attached | 43 (35.5%) | 78 (64.5%) |
| 2 Unit Apartments | 31 (23.8%) | 99 (76.1%) |
| 3 or 4 Unit Apartments | 6 (3.7%) | 158 (96.3%) |
| 5 to 9 Unit Apartments | 0 (0.0%) | 142 (100.0%) |
| 10 or more Apartments | 52 (14.4%) | 309 (85.6%) |
| Mobile Home / Other | 695 (78.6%) | 189 (21.4%) |
| Total | 5,058 (72.2%) | 1,946 (27.8%) |
Housing Structures by Number of Rooms in Baker County
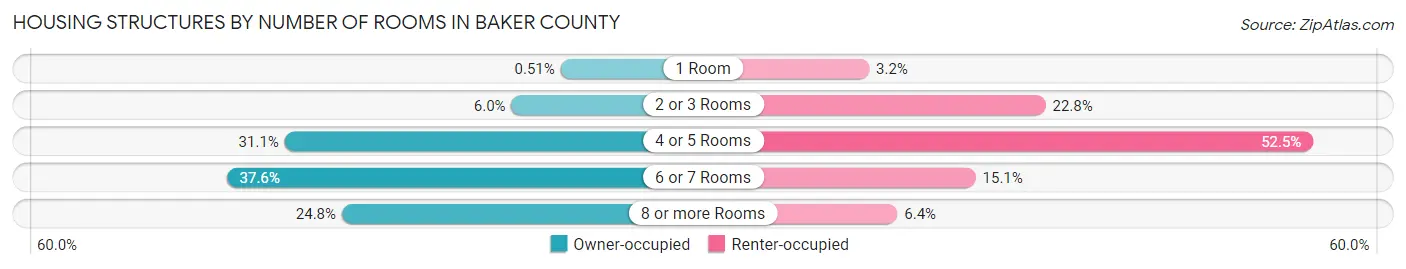
| Number of Rooms | Owner-occupied | Renter-occupied |
| 1 Room | 26 (0.5%) | 63 (3.2%) |
| 2 or 3 Rooms | 302 (6.0%) | 444 (22.8%) |
| 4 or 5 Rooms | 1,575 (31.1%) | 1,022 (52.5%) |
| 6 or 7 Rooms | 1,901 (37.6%) | 293 (15.1%) |
| 8 or more Rooms | 1,254 (24.8%) | 124 (6.4%) |
| Total | 5,058 (100.0%) | 1,946 (100.0%) |
Housing Structure by Heating Type in Baker County
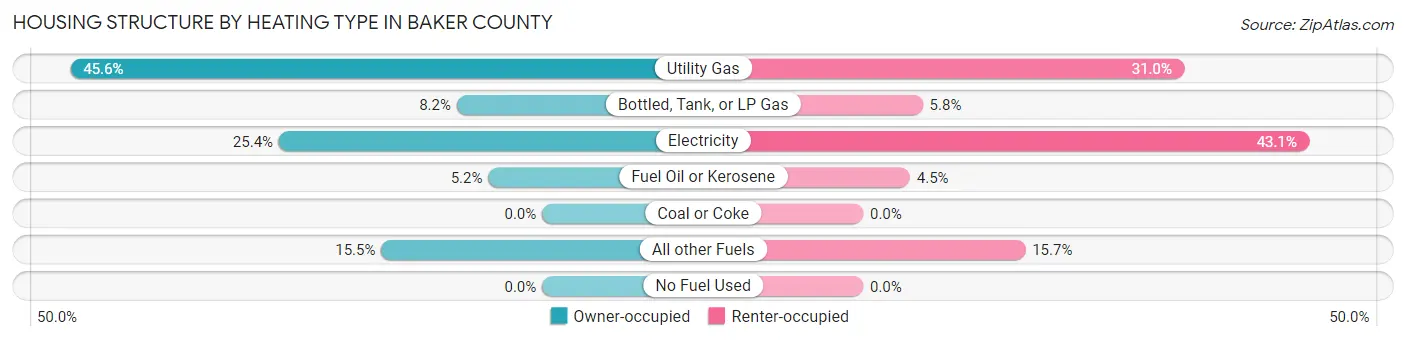
| Heating Type | Owner-occupied | Renter-occupied |
| Utility Gas | 2,306 (45.6%) | 603 (31.0%) |
| Bottled, Tank, or LP Gas | 417 (8.2%) | 112 (5.8%) |
| Electricity | 1,286 (25.4%) | 838 (43.1%) |
| Fuel Oil or Kerosene | 263 (5.2%) | 88 (4.5%) |
| Coal or Coke | 0 (0.0%) | 0 (0.0%) |
| All other Fuels | 786 (15.5%) | 305 (15.7%) |
| No Fuel Used | 0 (0.0%) | 0 (0.0%) |
| Total | 5,058 (100.0%) | 1,946 (100.0%) |
Household Vehicle Usage in Baker County
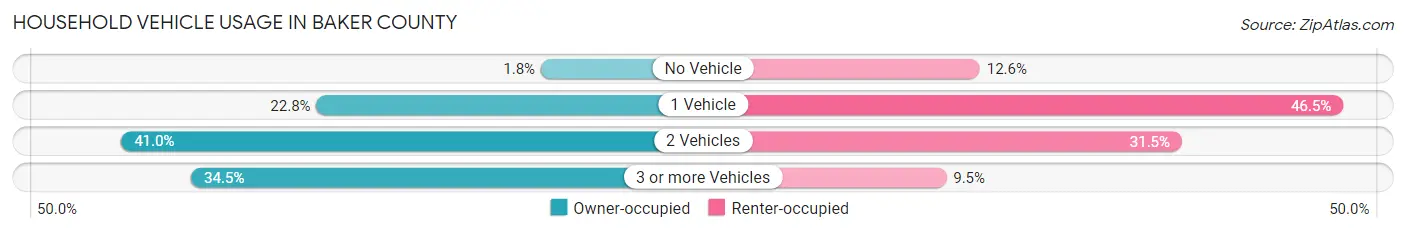
| Vehicles per Household | Owner-occupied | Renter-occupied |
| No Vehicle | 91 (1.8%) | 245 (12.6%) |
| 1 Vehicle | 1,151 (22.8%) | 905 (46.5%) |
| 2 Vehicles | 2,073 (41.0%) | 612 (31.5%) |
| 3 or more Vehicles | 1,743 (34.5%) | 184 (9.5%) |
| Total | 5,058 (100.0%) | 1,946 (100.0%) |
Real Estate & Mortgages in Baker County
Real Estate and Mortgage Overview in Baker County
| Characteristic | Without Mortgage | With Mortgage |
| Housing Units | 2,579 | 2,479 |
| Median Property Value | $224,300 | $235,000 |
| Median Household Income | $47,036 | $409 |
| Monthly Housing Costs | $468 | $116 |
| Real Estate Taxes | $1,902 | $10 |
Property Value by Mortgage Status in Baker County
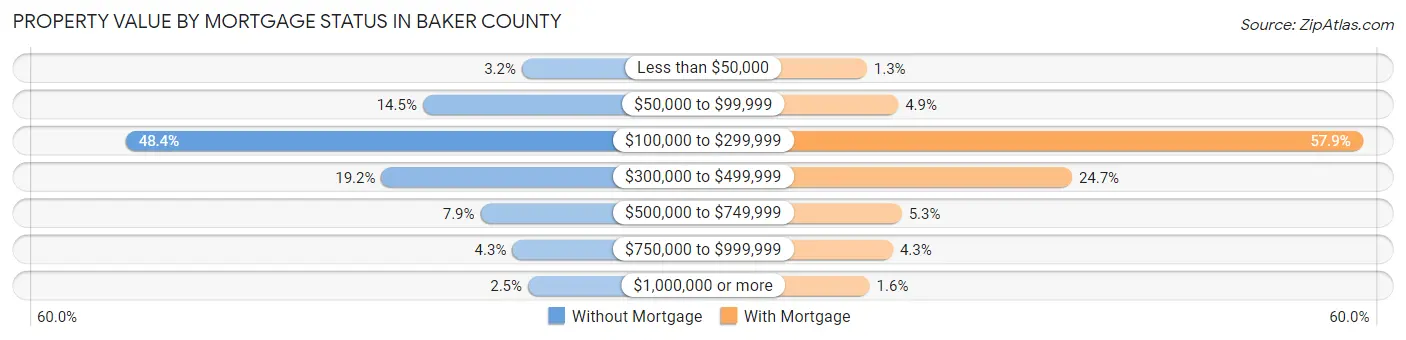
| Property Value | Without Mortgage | With Mortgage |
| Less than $50,000 | 82 (3.2%) | 32 (1.3%) |
| $50,000 to $99,999 | 374 (14.5%) | 121 (4.9%) |
| $100,000 to $299,999 | 1,249 (48.4%) | 1,436 (57.9%) |
| $300,000 to $499,999 | 496 (19.2%) | 613 (24.7%) |
| $500,000 to $749,999 | 204 (7.9%) | 131 (5.3%) |
| $750,000 to $999,999 | 110 (4.3%) | 106 (4.3%) |
| $1,000,000 or more | 64 (2.5%) | 40 (1.6%) |
| Total | 2,579 (100.0%) | 2,479 (100.0%) |
Household Income by Mortgage Status in Baker County
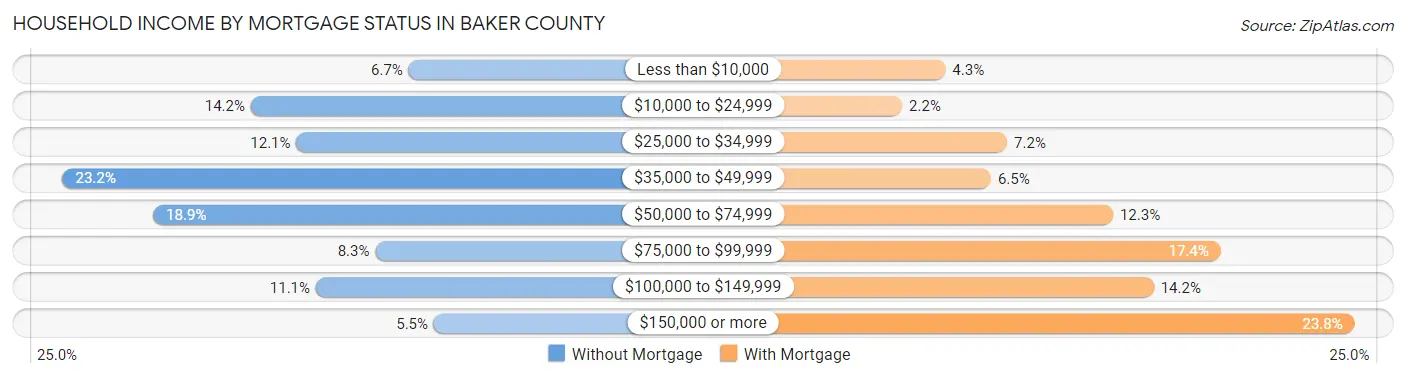
| Household Income | Without Mortgage | With Mortgage |
| Less than $10,000 | 173 (6.7%) | 106 (4.3%) |
| $10,000 to $24,999 | 367 (14.2%) | 55 (2.2%) |
| $25,000 to $34,999 | 311 (12.1%) | 179 (7.2%) |
| $35,000 to $49,999 | 598 (23.2%) | 160 (6.5%) |
| $50,000 to $74,999 | 487 (18.9%) | 304 (12.3%) |
| $75,000 to $99,999 | 214 (8.3%) | 431 (17.4%) |
| $100,000 to $149,999 | 287 (11.1%) | 352 (14.2%) |
| $150,000 or more | 142 (5.5%) | 589 (23.8%) |
| Total | 2,579 (100.0%) | 2,479 (100.0%) |
Property Value to Household Income Ratio in Baker County
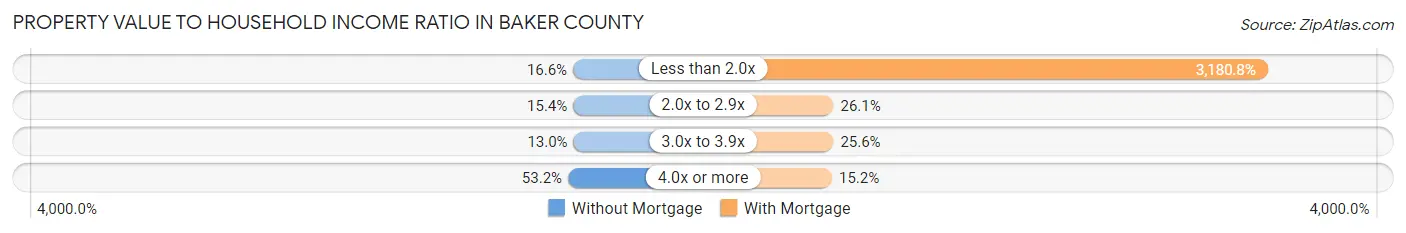
| Value-to-Income Ratio | Without Mortgage | With Mortgage |
| Less than 2.0x | 427 (16.6%) | 78,851 (3,180.8%) |
| 2.0x to 2.9x | 397 (15.4%) | 648 (26.1%) |
| 3.0x to 3.9x | 334 (13.0%) | 634 (25.6%) |
| 4.0x or more | 1,372 (53.2%) | 377 (15.2%) |
| Total | 2,579 (100.0%) | 2,479 (100.0%) |
Real Estate Taxes by Mortgage Status in Baker County
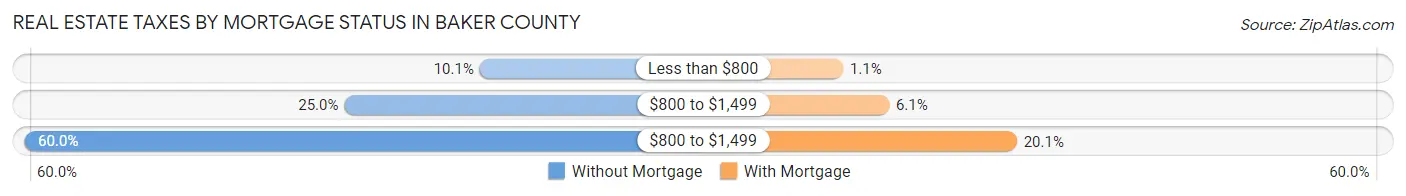
| Property Taxes | Without Mortgage | With Mortgage |
| Less than $800 | 261 (10.1%) | 27 (1.1%) |
| $800 to $1,499 | 644 (25.0%) | 152 (6.1%) |
| $800 to $1,499 | 1,546 (60.0%) | 499 (20.1%) |
| Total | 2,579 (100.0%) | 2,479 (100.0%) |
Health & Disability in Baker County
Health Insurance Coverage by Age in Baker County
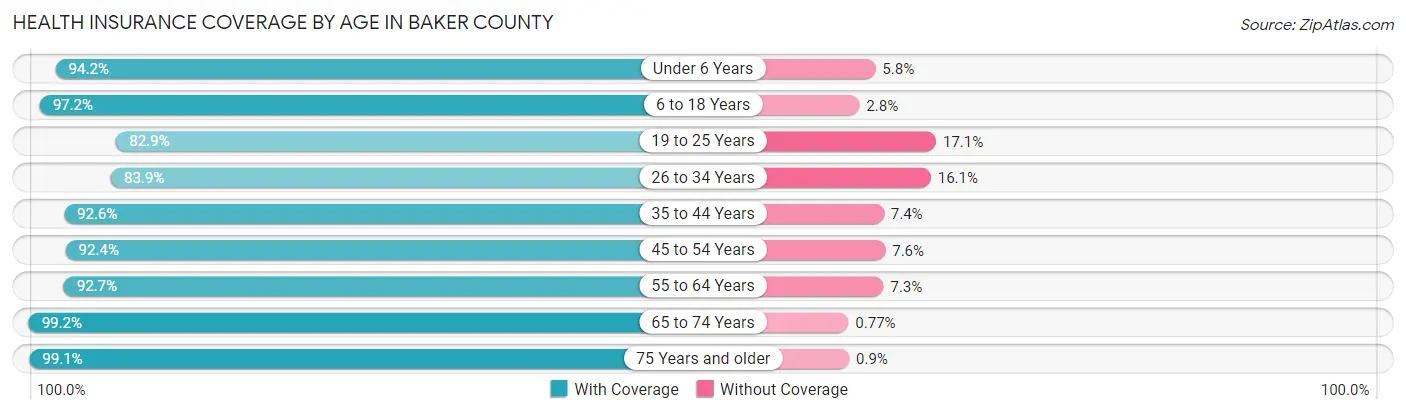
| Age Bracket | With Coverage | Without Coverage |
| Under 6 Years | 925 (94.2%) | 57 (5.8%) |
| 6 to 18 Years | 2,409 (97.2%) | 70 (2.8%) |
| 19 to 25 Years | 780 (82.9%) | 161 (17.1%) |
| 26 to 34 Years | 1,274 (83.9%) | 245 (16.1%) |
| 35 to 44 Years | 1,559 (92.6%) | 124 (7.4%) |
| 45 to 54 Years | 1,619 (92.4%) | 134 (7.6%) |
| 55 to 64 Years | 2,230 (92.7%) | 176 (7.3%) |
| 65 to 74 Years | 2,588 (99.2%) | 20 (0.8%) |
| 75 Years and older | 1,872 (99.1%) | 17 (0.9%) |
| Total | 15,256 (93.8%) | 1,004 (6.2%) |
Health Insurance Coverage by Citizenship Status in Baker County
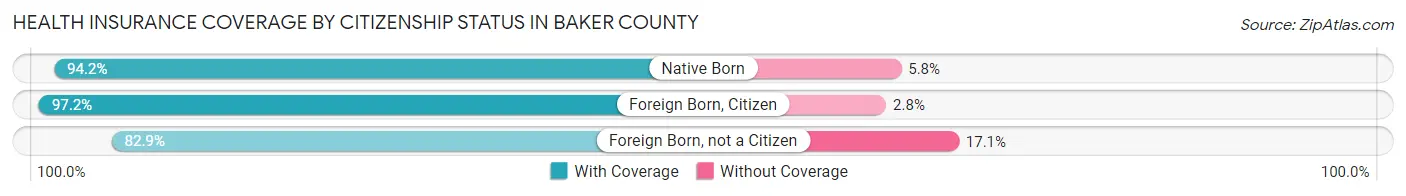
| Citizenship Status | With Coverage | Without Coverage |
| Native Born | 925 (94.2%) | 57 (5.8%) |
| Foreign Born, Citizen | 2,409 (97.2%) | 70 (2.8%) |
| Foreign Born, not a Citizen | 780 (82.9%) | 161 (17.1%) |
Health Insurance Coverage by Household Income in Baker County
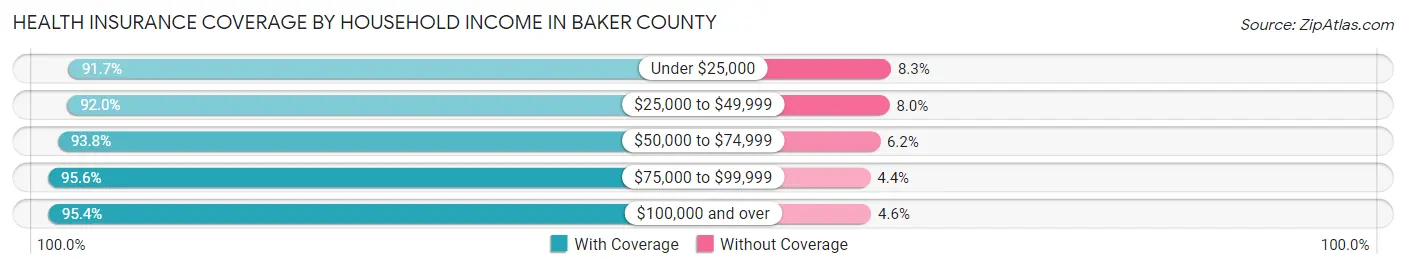
| Household Income | With Coverage | Without Coverage |
| Under $25,000 | 2,040 (91.7%) | 184 (8.3%) |
| $25,000 to $49,999 | 3,696 (92.0%) | 321 (8.0%) |
| $50,000 to $74,999 | 2,868 (93.8%) | 190 (6.2%) |
| $75,000 to $99,999 | 1,883 (95.6%) | 87 (4.4%) |
| $100,000 and over | 4,651 (95.4%) | 222 (4.6%) |
Public vs Private Health Insurance Coverage by Age in Baker County
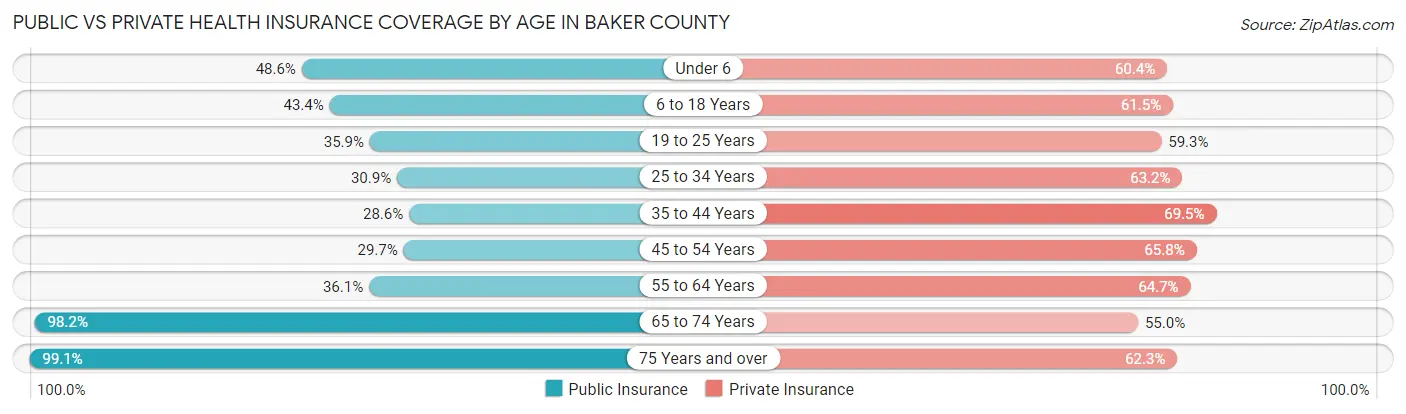
| Age Bracket | Public Insurance | Private Insurance |
| Under 6 | 477 (48.6%) | 593 (60.4%) |
| 6 to 18 Years | 1,076 (43.4%) | 1,524 (61.5%) |
| 19 to 25 Years | 338 (35.9%) | 558 (59.3%) |
| 25 to 34 Years | 469 (30.9%) | 960 (63.2%) |
| 35 to 44 Years | 482 (28.6%) | 1,170 (69.5%) |
| 45 to 54 Years | 520 (29.7%) | 1,154 (65.8%) |
| 55 to 64 Years | 868 (36.1%) | 1,557 (64.7%) |
| 65 to 74 Years | 2,560 (98.2%) | 1,434 (55.0%) |
| 75 Years and over | 1,872 (99.1%) | 1,176 (62.3%) |
| Total | 8,662 (53.3%) | 10,126 (62.3%) |
Disability Status by Sex by Age in Baker County
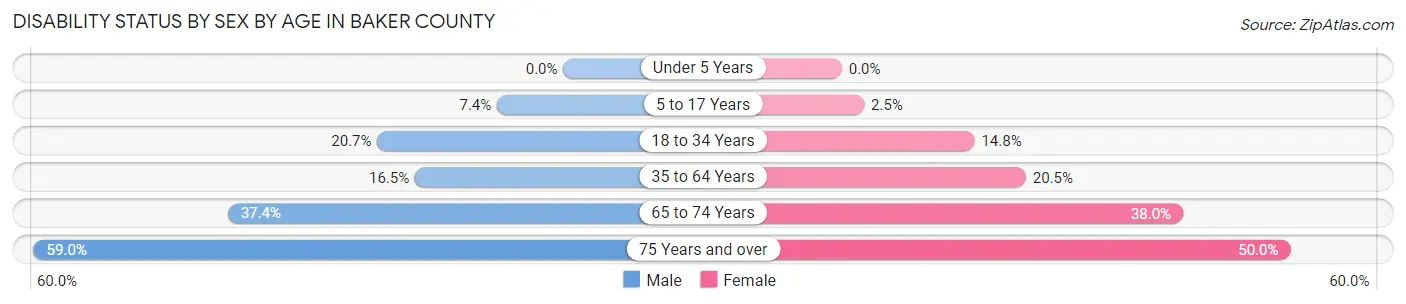
| Age Bracket | Male | Female |
| Under 5 Years | 0 (0.0%) | 0 (0.0%) |
| 5 to 17 Years | 101 (7.4%) | 29 (2.5%) |
| 18 to 34 Years | 275 (20.7%) | 184 (14.8%) |
| 35 to 64 Years | 479 (16.5%) | 603 (20.5%) |
| 65 to 74 Years | 480 (37.4%) | 503 (38.0%) |
| 75 Years and over | 538 (59.0%) | 488 (49.9%) |
Disability Class by Sex by Age in Baker County
Disability Class: Hearing Difficulty
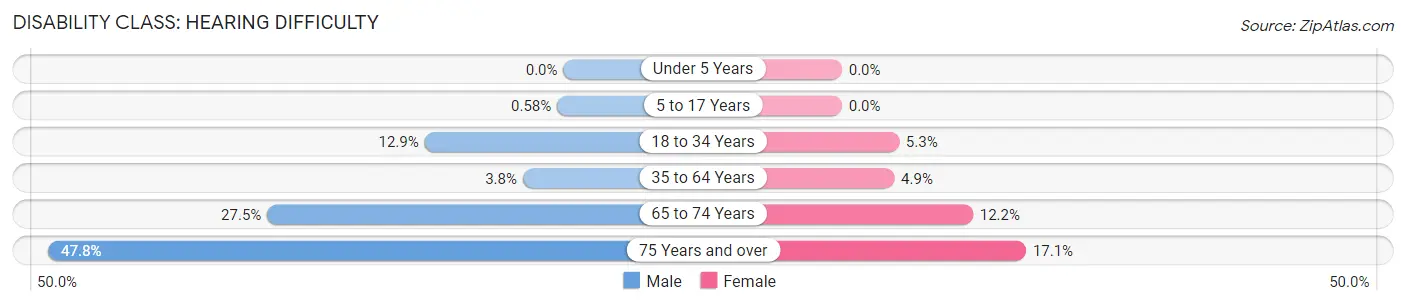
| Age Bracket | Male | Female |
| Under 5 Years | 0 (0.0%) | 0 (0.0%) |
| 5 to 17 Years | 8 (0.6%) | 0 (0.0%) |
| 18 to 34 Years | 171 (12.9%) | 66 (5.3%) |
| 35 to 64 Years | 109 (3.8%) | 143 (4.9%) |
| 65 to 74 Years | 353 (27.5%) | 161 (12.2%) |
| 75 Years and over | 436 (47.8%) | 167 (17.1%) |
Disability Class: Vision Difficulty
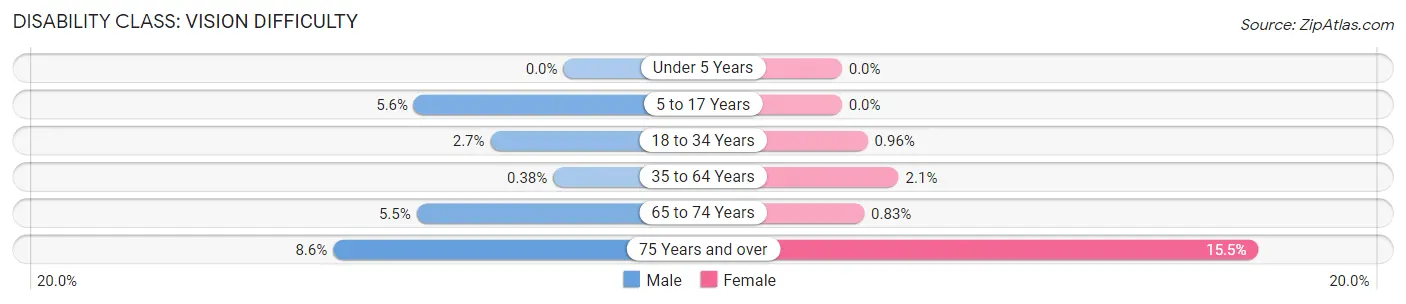
| Age Bracket | Male | Female |
| Under 5 Years | 0 (0.0%) | 0 (0.0%) |
| 5 to 17 Years | 76 (5.6%) | 0 (0.0%) |
| 18 to 34 Years | 36 (2.7%) | 12 (1.0%) |
| 35 to 64 Years | 11 (0.4%) | 62 (2.1%) |
| 65 to 74 Years | 70 (5.4%) | 11 (0.8%) |
| 75 Years and over | 78 (8.6%) | 151 (15.5%) |
Disability Class: Cognitive Difficulty
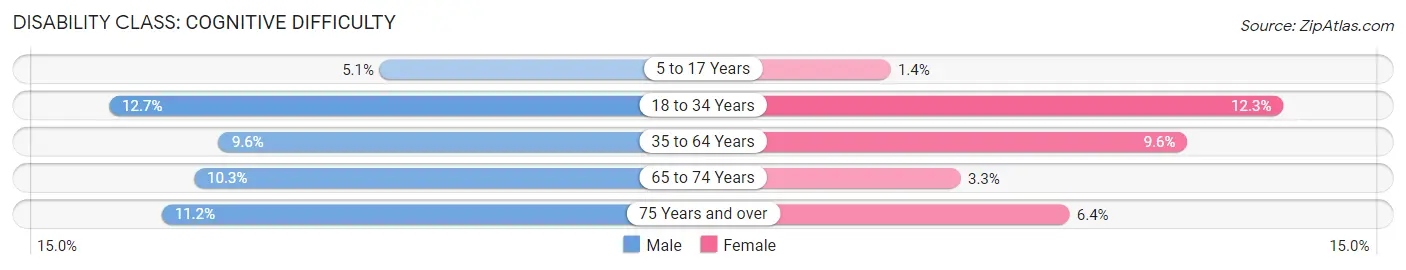
| Age Bracket | Male | Female |
| 5 to 17 Years | 70 (5.1%) | 16 (1.4%) |
| 18 to 34 Years | 168 (12.7%) | 153 (12.3%) |
| 35 to 64 Years | 278 (9.6%) | 283 (9.6%) |
| 65 to 74 Years | 132 (10.3%) | 44 (3.3%) |
| 75 Years and over | 102 (11.2%) | 62 (6.4%) |
Disability Class: Ambulatory Difficulty
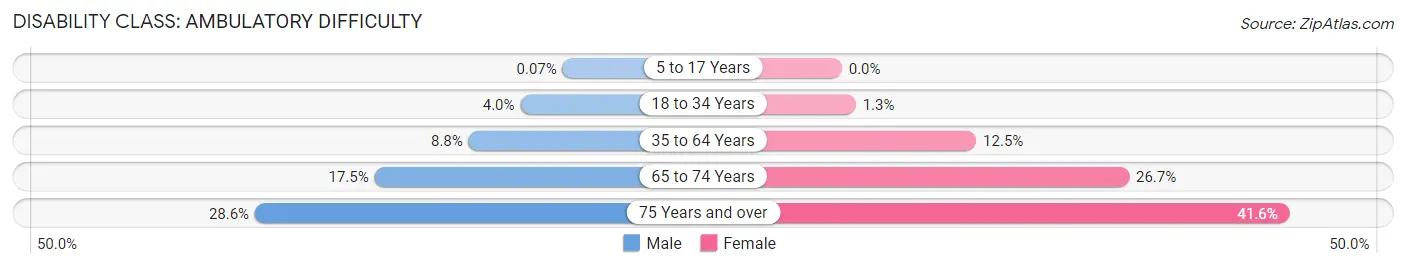
| Age Bracket | Male | Female |
| 5 to 17 Years | 1 (0.1%) | 0 (0.0%) |
| 18 to 34 Years | 53 (4.0%) | 16 (1.3%) |
| 35 to 64 Years | 255 (8.8%) | 367 (12.5%) |
| 65 to 74 Years | 225 (17.5%) | 353 (26.7%) |
| 75 Years and over | 261 (28.6%) | 406 (41.6%) |
Disability Class: Self-Care Difficulty
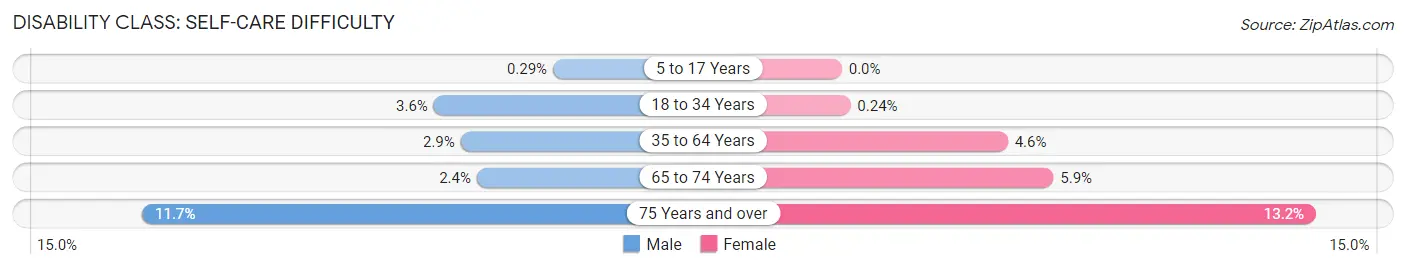
| Age Bracket | Male | Female |
| 5 to 17 Years | 4 (0.3%) | 0 (0.0%) |
| 18 to 34 Years | 48 (3.6%) | 3 (0.2%) |
| 35 to 64 Years | 83 (2.9%) | 136 (4.6%) |
| 65 to 74 Years | 31 (2.4%) | 78 (5.9%) |
| 75 Years and over | 107 (11.7%) | 129 (13.2%) |
Technology Access in Baker County
Computing Device Access in Baker County
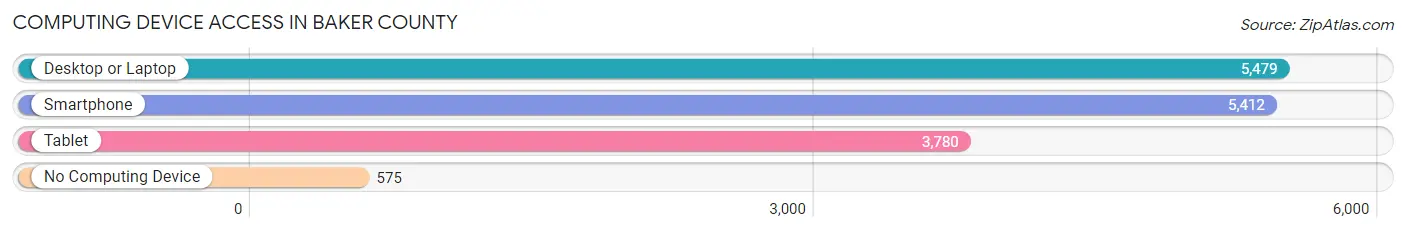
| Device Type | # Households | % Households |
| Desktop or Laptop | 5,479 | 78.2% |
| Smartphone | 5,412 | 77.3% |
| Tablet | 3,780 | 54.0% |
| No Computing Device | 575 | 8.2% |
| Total | 7,004 | 100.0% |
Internet Access in Baker County
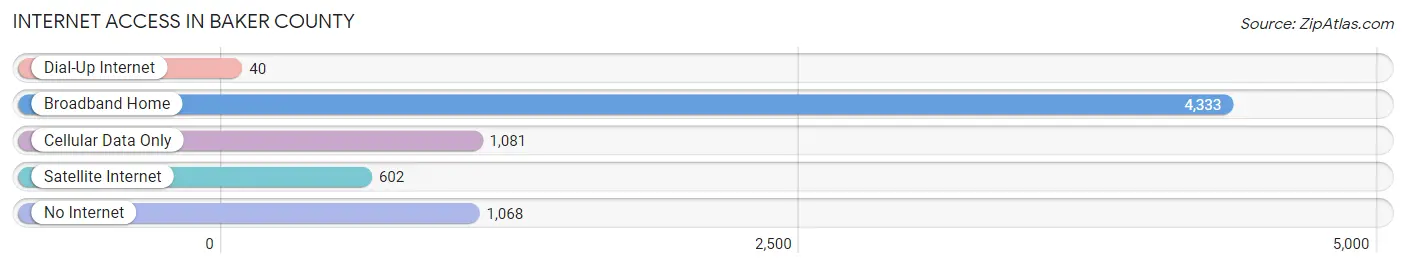
| Internet Type | # Households | % Households |
| Dial-Up Internet | 40 | 0.6% |
| Broadband Home | 4,333 | 61.9% |
| Cellular Data Only | 1,081 | 15.4% |
| Satellite Internet | 602 | 8.6% |
| No Internet | 1,068 | 15.2% |
| Total | 7,004 | 100.0% |
Baker County Summary
Baker County is located in the northeastern corner of Oregon, and is bordered by the states of Washington and Idaho. It is the second largest county in the state, covering an area of 5,072 square miles. The county seat is Baker City, which is also the largest city in the county. The county is named after Edward Dickinson Baker, a U.S. Senator from Oregon who was killed in the Civil War.
Geography
Baker County is located in the Blue Mountains region of Oregon, and is characterized by rugged terrain and high elevation. The county is home to the Elkhorn Mountains, which are part of the Blue Mountains. The highest point in the county is the summit of Lookout Mountain, which has an elevation of 8,065 feet. The county is also home to the Wallowa-Whitman National Forest, which covers 1.3 million acres and is the largest national forest in Oregon.
The county is drained by the Powder River, which flows through the county from north to south. The river is a tributary of the Snake River, which forms the border between Oregon and Idaho. Other major rivers in the county include the Burnt River, the John Day River, and the Malheur River.
Climate
Baker County has a semi-arid climate, with hot summers and cold winters. The average annual temperature is 44°F, and the average annual precipitation is 12.5 inches. The county is subject to occasional extreme weather events, such as floods, droughts, and wildfires.
Demographics
As of the 2010 census, the population of Baker County was 16,134. The population is predominantly white (94.2%), with small percentages of Native American (2.2%), Hispanic (1.7%), and African American (0.7%) residents. The median household income is $41,845, and the median age is 41.
Economy
Baker County is largely rural, and the economy is based on agriculture, forestry, and tourism. The county is home to several large cattle ranches, and the timber industry is also an important part of the economy. The county is also home to several ski resorts, which attract tourists from around the region.
The county is home to several large employers, including the Baker County School District, the Baker County Sheriff's Office, and the U.S. Forest Service. The county is also home to several manufacturing companies, including a paper mill and a wood products plant.
Conclusion
Baker County is a rural county located in the northeastern corner of Oregon. It is characterized by rugged terrain and high elevation, and is home to the Wallowa-Whitman National Forest. The county has a semi-arid climate, and the population is predominantly white. The economy is based on agriculture, forestry, and tourism, and the county is home to several large employers.
Common Questions
What is the Total Population of Baker County?
Total Population of Baker County is 16,685.
What is the Total Male Population of Baker County?
Total Male Population of Baker County is 8,629.
What is the Total Female Population of Baker County?
Total Female Population of Baker County is 8,056.
What is the Ratio of Males per 100 Females in Baker County?
There are 107.11 Males per 100 Females in Baker County.
What is the Ratio of Females per 100 Males in Baker County?
There are 93.36 Females per 100 Males in Baker County.
What is the Median Population Age in Baker County?
Median Population Age in Baker County is 47.4 Years.
What is the Average Family Size in Baker County
Average Family Size in Baker County is 3.0 People.
What is the Average Household Size in Baker County
Average Household Size in Baker County is 2.3 People.
What is Per Capita Income in Baker County?
Per Capita income in Baker County is $32,672.
What is the Median Family Income in Baker County?
Median Family Income in Baker County is $66,780.
What is the Median Household income in Baker County?
Median Household Income in Baker County is $51,657.
What is Income or Wage Gap in Baker County?
Income or Wage Gap in Baker County is 46.4%.
Women in Baker County earn 53.6 cents for every dollar earned by a man.
What is Inequality or Gini Index in Baker County?
Inequality or Gini Index in Baker County is 0.47.
How Large is the Labor Force in Baker County?
There are 6,627 People in the Labor Forcein in Baker County.
What is the Percentage of People in the Labor Force in Baker County?
48.2% of People are in the Labor Force in Baker County.
What is the Unemployment Rate in Baker County?
Unemployment Rate in Baker County is 5.5%.