Zip Codes with the Lowest Poverty Level Among Children Under the Age of 5 in Dayton, OH

RELATED REPORTS & OPTIONS

Lowest Poverty | Child 0-5
Population
Families and Households
Female Fertility
Female Fertility (Unmarried)
Race (Community Size)
Race (Percentage)
Ancestry (Community Size)
AfricanAlbanianAlsatianAmericanApacheArabArgentineanArmenianAustralianAustrianBasqueBelgianBhutaneseBlackfeetBolivianBrazilianBritishBulgarianBurmeseCajunCanadianCape VerdeanCelticCentral AmericanCentral American IndianCherokeeChileanChippewaChoctawColombianCosta RicanCreekCroatianCubanCzechCzechoslovakianDanishDominicanDutchEastern EuropeanEcuadorianEgyptianEnglishEstonianEthiopianEuropeanFilipinoFinnishFrenchFrench CanadianGermanGhanaianGreekGuamanian / ChamorroGuatemalanHaitianHonduranHungarianIcelanderIndian (Asian)InupiatIranianIraqiIrishIroquoisItalianJamaicanJapaneseKenyanKoreanLaotianLatvianLebaneseLiberianLithuanianLuxembourgerMacedonianMalteseMexicanMexican American IndianMoroccanNative HawaiianNavajoNicaraguanNigerianNorthern EuropeanNorwegianOkinawanPakistaniPalestinianPanamanianPennsylvania GermanPeruvianPolishPortuguesePotawatomiPuerto RicanRomanianRussianSalvadoranSamoanScandinavianScotch-IrishScottishSeminoleSenegaleseSerbianSiouxSlavicSlovakSloveneSouth AfricanSouth AmericanSpaniardSpanishSri LankanSubsaharan AfricanSudaneseSwedishSwissSyrianThaiTrinidadian and TobagonianTurkishUkrainianVenezuelanWelshWest IndianYugoslavian
Ancestry (Percentage)
AfricanAlbanianAlsatianAmericanApacheArabArgentineanArmenianAustralianAustrianBasqueBelgianBhutaneseBlackfeetBolivianBrazilianBritishBulgarianBurmeseCajunCanadianCape VerdeanCelticCentral AmericanCentral American IndianCherokeeChileanChippewaChoctawColombianCosta RicanCreekCroatianCubanCzechCzechoslovakianDanishDominicanDutchEastern EuropeanEcuadorianEgyptianEnglishEstonianEthiopianEuropeanFilipinoFinnishFrenchFrench CanadianGermanGhanaianGreekGuamanian / ChamorroGuatemalanHaitianHonduranHungarianIcelanderIndian (Asian)InupiatIranianIraqiIrishIroquoisItalianJamaicanJapaneseKenyanKoreanLaotianLatvianLebaneseLiberianLithuanianLuxembourgerMacedonianMalteseMexicanMexican American IndianMoroccanNative HawaiianNavajoNicaraguanNigerianNorthern EuropeanNorwegianOkinawanPakistaniPalestinianPanamanianPennsylvania GermanPeruvianPolishPortuguesePotawatomiPuerto RicanRomanianRussianSalvadoranSamoanScandinavianScotch-IrishScottishSeminoleSenegaleseSerbianSiouxSlavicSlovakSloveneSouth AfricanSouth AmericanSpaniardSpanishSri LankanSubsaharan AfricanSudaneseSwedishSwissSyrianThaiTrinidadian and TobagonianTurkishUkrainianVenezuelanWelshWest IndianYugoslavian
Immigrant Origin (Total)
AfricaArgentinaAsiaAustraliaBelarusBosnia and HerzegovinaBrazilBulgariaCambodiaCameroonCanadaCaribbeanCentral AmericaChinaColombiaCongoCosta RicaCubaDominican RepublicEastern AfricaEastern AsiaEastern EuropeEcuadorEgyptEl SalvadorEnglandEthiopiaEuropeFranceGermanyGhanaGreeceGuatemalaGuyanaHaitiHondurasHong KongHungaryIndiaIndonesiaIranIraqIrelandIsraelItalyJamaicaJapanJordanKenyaKoreaKuwaitLatin AmericaLebanonLiberiaMalaysiaMexicoMiddle AfricaMoldovaMoroccoNetherlandsNigeriaNorthern AfricaNorthern EuropeNorwayOceaniaPakistanPanamaPeruPhilippinesPolandPortugalRomaniaRussiaSaudi ArabiaScotlandSenegalSingaporeSouth AfricaSouth AmericaSouth Central AsiaSouth Eastern AsiaSouthern EuropeSpainSudanTaiwanThailandTrinidad and TobagoTurkeyUkraineUzbekistanVenezuelaVietnamWestern AfricaWestern AsiaWestern EuropeZaire
Immigrant Origin (Percentage)
AfricaArgentinaAsiaAustraliaBelarusBosnia and HerzegovinaBrazilBulgariaCambodiaCameroonCanadaCaribbeanCentral AmericaChinaColombiaCongoCosta RicaCubaDominican RepublicEastern AfricaEastern AsiaEastern EuropeEcuadorEgyptEl SalvadorEnglandEthiopiaEuropeFranceGermanyGhanaGreeceGuatemalaGuyanaHaitiHondurasHong KongHungaryIndiaIndonesiaIranIraqIrelandIsraelItalyJamaicaJapanJordanKenyaKoreaKuwaitLatin AmericaLebanonLiberiaMalaysiaMexicoMiddle AfricaMoldovaMoroccoNetherlandsNigeriaNorthern AfricaNorthern EuropeNorwayOceaniaPakistanPanamaPeruPhilippinesPolandPortugalRomaniaRussiaSaudi ArabiaScotlandSenegalSingaporeSouth AfricaSouth AmericaSouth Central AsiaSouth Eastern AsiaSouthern EuropeSpainSudanTaiwanThailandTrinidad and TobagoTurkeyUkraineUzbekistanVenezuelaVietnamWestern AfricaWestern AsiaWestern EuropeZaire
Income
Income (Families)
Income (Households)
Poverty
Poverty (Families)
Unemployment
Employment Occupations
Employment Industries
Employer Class
Commute Time
Commute Means
School Enrollment
Education by Degree Field
Occupancy
Finances
Physical Characteristics
Dayton
Compare Zip Codes
Comparison Subject

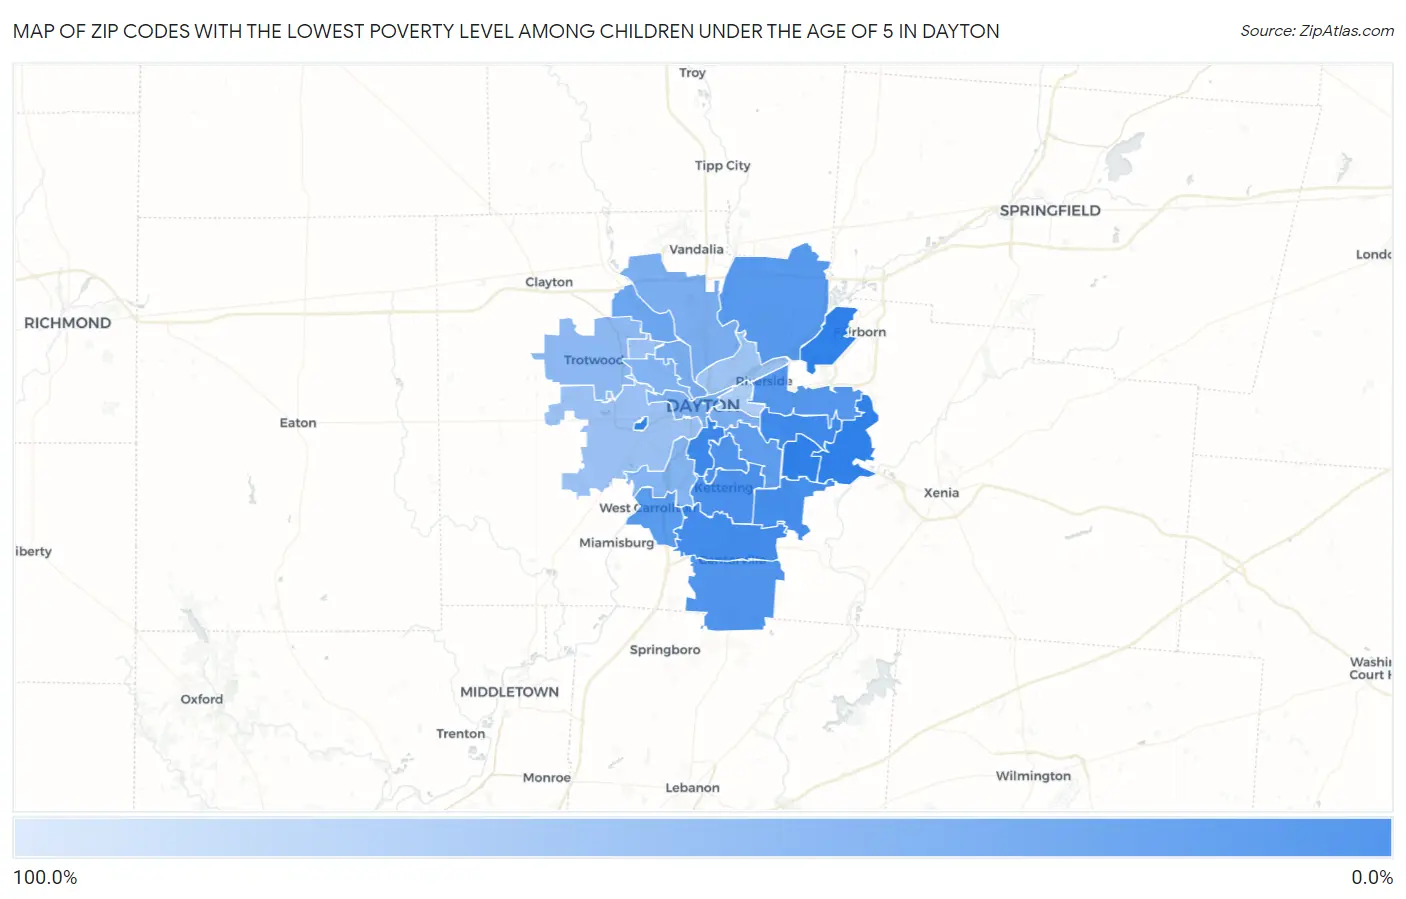
Map of Zip Codes with the Lowest Poverty Level Among Children Under the Age of 5 in Dayton

100.0%
0.0%
Zip Codes with the Lowest Poverty Level Among Children Under the Age of 5 in Dayton Map

Zip Codes with the Lowest Poverty Level Among Children Under the Age of 5 in Dayton, OH

Zip Code Child Poverty vs State vs National
1.454093.1%20.7%(-17.6)#7118.1%(-15.0)#1,555
2.454325.7%20.7%(-15.0)#13718.1%(-12.4)#3,378
3.454596.7%20.7%(-13.9)#16018.1%(-11.3)#4,093
4.454407.7%20.7%(-12.9)#18918.1%(-10.3)#4,763
5.454299.5%20.7%(-11.2)#22418.1%(-8.58)#5,930
6.4541911.4%20.7%(-9.29)#27018.1%(-6.69)#7,081
7.4545812.2%20.7%(-8.48)#29618.1%(-5.87)#7,564
8.4543115.3%20.7%(-5.36)#37318.1%(-2.76)#9,382
9.4542416.5%20.7%(-4.14)#39918.1%(-1.53)#10,044
10.4544917.9%20.7%(-2.81)#42218.1%(-0.206)#10,640
11.4542019.8%20.7%(-0.868)#45818.1%(+1.74)#11,537
12.4541527.1%20.7%(+6.42)#56118.1%(+9.02)#14,387
13.4540534.3%20.7%(+13.7)#64618.1%(+16.3)#16,456
14.4541436.0%20.7%(+15.3)#66818.1%(+17.9)#16,840
15.4541037.4%20.7%(+16.7)#68618.1%(+19.3)#17,146
16.4540238.5%20.7%(+17.8)#69618.1%(+20.4)#17,366
17.4543940.9%20.7%(+20.2)#70918.1%(+22.8)#17,813
18.4540641.4%20.7%(+20.7)#71218.1%(+23.3)#17,915
19.4542647.8%20.7%(+27.2)#75518.1%(+29.8)#18,847
20.4541756.2%20.7%(+35.5)#80118.1%(+38.1)#19,698
21.4541659.0%20.7%(+38.3)#80818.1%(+40.9)#19,902
22.4540459.2%20.7%(+38.6)#80918.1%(+41.2)#19,919
23.4540370.1%20.7%(+49.5)#83818.1%(+52.1)#20,530
24.45469100.0%20.7%(+79.3)#86618.1%(+81.9)#21,518

Common Questions

What are the Top 10 Zip Codes with the Lowest Poverty Level Among Children Under the Age of 5 in Dayton, OH?
Top 10 Zip Codes with the Lowest Poverty Level Among Children Under the Age of 5 in Dayton, OH are:
#1
0.0%
#2
0.0%
#3
0.0%
#4
0.0%
#5
3.1%
#6
5.7%
#7
6.7%
#8
7.7%
#9
9.5%
#10
11.4%
What zip code has the Lowest Poverty Level Among Children Under the Age of 5 in Dayton, OH?
45409 has the Lowest Poverty Level Among Children Under the Age of 5 in Dayton, OH with 3.1%.
What is the Poverty Level Among Children Under the Age of 5 in Dayton, OH?
Poverty Level Among Children Under the Age of 5 in Dayton is 44.7%.
What is the Poverty Level Among Children Under the Age of 5 in Ohio?
Poverty Level Among Children Under the Age of 5 in Ohio is 20.7%.
What is the Poverty Level Among Children Under the Age of 5 in the United States?
Poverty Level Among Children Under the Age of 5 in the United States is 18.1%.