Zip Codes with the Highest Percentage of Population with a Degree in Visual and Performing Arts in Dayton, OH
RELATED REPORTS & OPTIONS
Visual and Performing Arts
Dayton
Compare Zip Codes
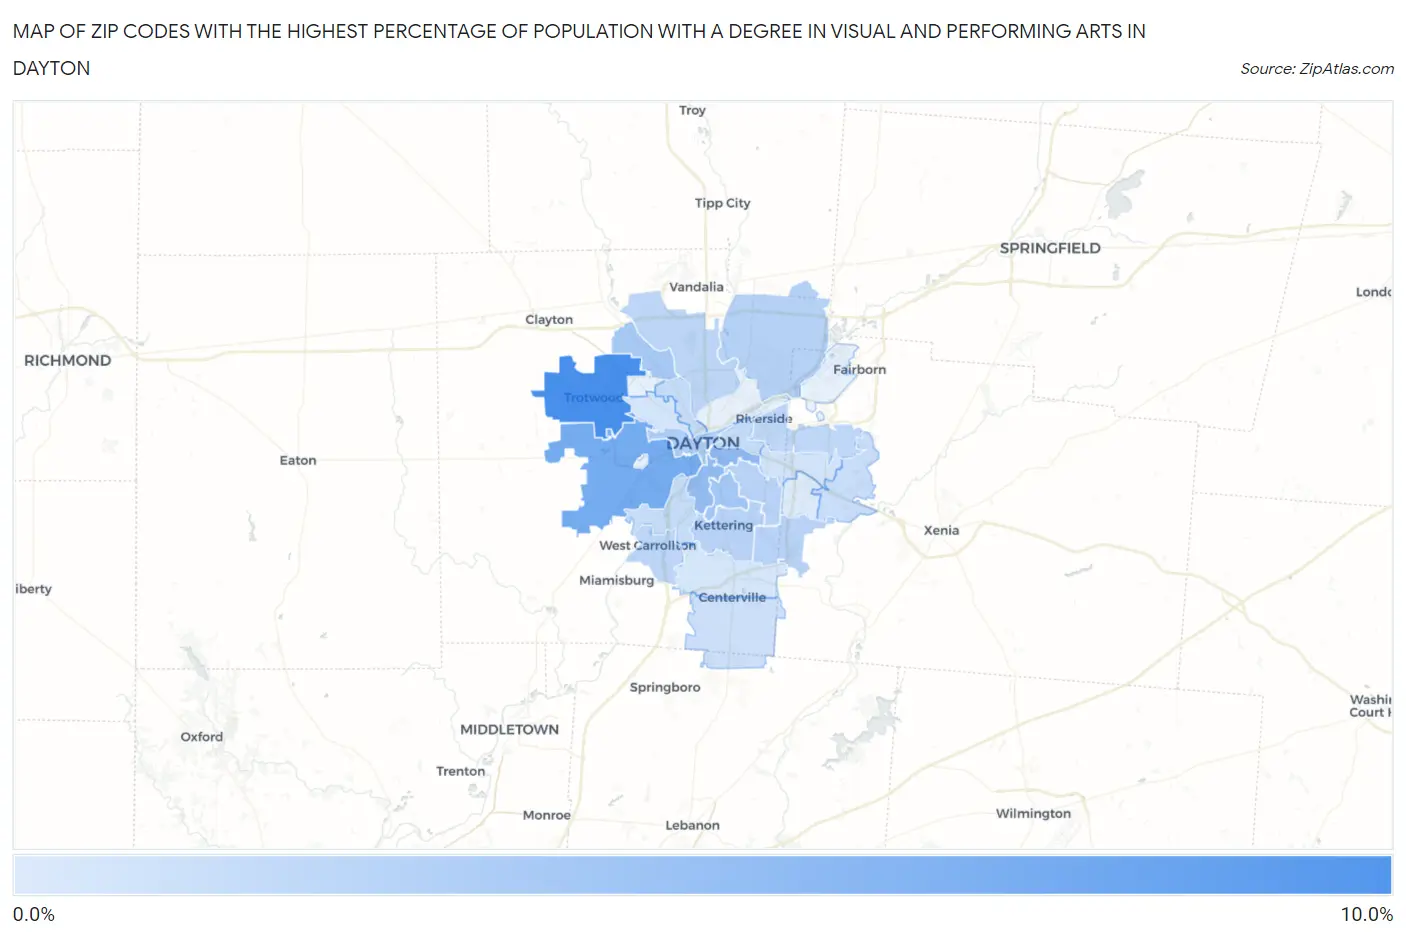
Map of Zip Codes with the Highest Percentage of Population with a Degree in Visual and Performing Arts in Dayton
0.0%
10.0%
Zip Codes with the Highest Percentage of Population with a Degree in Visual and Performing Arts in Dayton, OH
| Zip Code | % Graduates | vs State | vs National | |
| 1. | 45426 | 9.4% | 3.7%(+5.69)#78 | 4.3%(+5.15)#2,062 |
| 2. | 45417 | 6.9% | 3.7%(+3.16)#140 | 4.3%(+2.62)#3,793 |
| 3. | 45410 | 5.6% | 3.7%(+1.89)#194 | 4.3%(+1.35)#5,490 |
| 4. | 45409 | 5.3% | 3.7%(+1.62)#212 | 4.3%(+1.08)#5,996 |
| 5. | 45419 | 4.5% | 3.7%(+0.783)#281 | 4.3%(+0.241)#7,829 |
| 6. | 45415 | 4.3% | 3.7%(+0.622)#299 | 4.3%(+0.081)#8,258 |
| 7. | 45402 | 3.9% | 3.7%(+0.238)#334 | 4.3%(-0.303)#9,402 |
| 8. | 45424 | 3.5% | 3.7%(-0.174)#384 | 4.3%(-0.715)#10,752 |
| 9. | 45440 | 3.4% | 3.7%(-0.303)#407 | 4.3%(-0.844)#11,232 |
| 10. | 45429 | 3.4% | 3.7%(-0.312)#408 | 4.3%(-0.854)#11,261 |
| 11. | 45420 | 3.4% | 3.7%(-0.322)#411 | 4.3%(-0.863)#11,299 |
| 12. | 45414 | 3.2% | 3.7%(-0.511)#429 | 4.3%(-1.05)#11,992 |
| 13. | 45449 | 3.2% | 3.7%(-0.519)#430 | 4.3%(-1.06)#12,016 |
| 14. | 45431 | 3.1% | 3.7%(-0.640)#441 | 4.3%(-1.18)#12,454 |
| 15. | 45405 | 2.8% | 3.7%(-0.914)#483 | 4.3%(-1.45)#13,499 |
| 16. | 45403 | 2.8% | 3.7%(-0.917)#484 | 4.3%(-1.46)#13,517 |
| 17. | 45439 | 2.7% | 3.7%(-1.01)#497 | 4.3%(-1.55)#13,881 |
| 18. | 45434 | 2.6% | 3.7%(-1.08)#512 | 4.3%(-1.62)#14,135 |
| 19. | 45458 | 2.4% | 3.7%(-1.30)#536 | 4.3%(-1.84)#14,979 |
| 20. | 45432 | 2.1% | 3.7%(-1.60)#579 | 4.3%(-2.15)#16,041 |
| 21. | 45406 | 2.0% | 3.7%(-1.67)#591 | 4.3%(-2.21)#16,316 |
| 22. | 45459 | 2.0% | 3.7%(-1.75)#604 | 4.3%(-2.29)#16,576 |
| 23. | 45430 | 1.6% | 3.7%(-2.14)#656 | 4.3%(-2.68)#17,933 |
1
Common Questions
What are the Top 10 Zip Codes with the Highest Percentage of Population with a Degree in Visual and Performing Arts in Dayton, OH?
Top 10 Zip Codes with the Highest Percentage of Population with a Degree in Visual and Performing Arts in Dayton, OH are:
What zip code has the Highest Percentage of Population with a Degree in Visual and Performing Arts in Dayton, OH?
45426 has the Highest Percentage of Population with a Degree in Visual and Performing Arts in Dayton, OH with 9.4%.
What is the Percentage of Population with a Degree in Visual and Performing Arts in Dayton, OH?
Percentage of Population with a Degree in Visual and Performing Arts in Dayton is 4.4%.
What is the Percentage of Population with a Degree in Visual and Performing Arts in Ohio?
Percentage of Population with a Degree in Visual and Performing Arts in Ohio is 3.7%.
What is the Percentage of Population with a Degree in Visual and Performing Arts in the United States?
Percentage of Population with a Degree in Visual and Performing Arts in the United States is 4.3%.