Zip Codes with the Highest Percentage of Population with a Degree in Psychology in Dayton, OH
RELATED REPORTS & OPTIONS
Psychology
Dayton
Compare Zip Codes
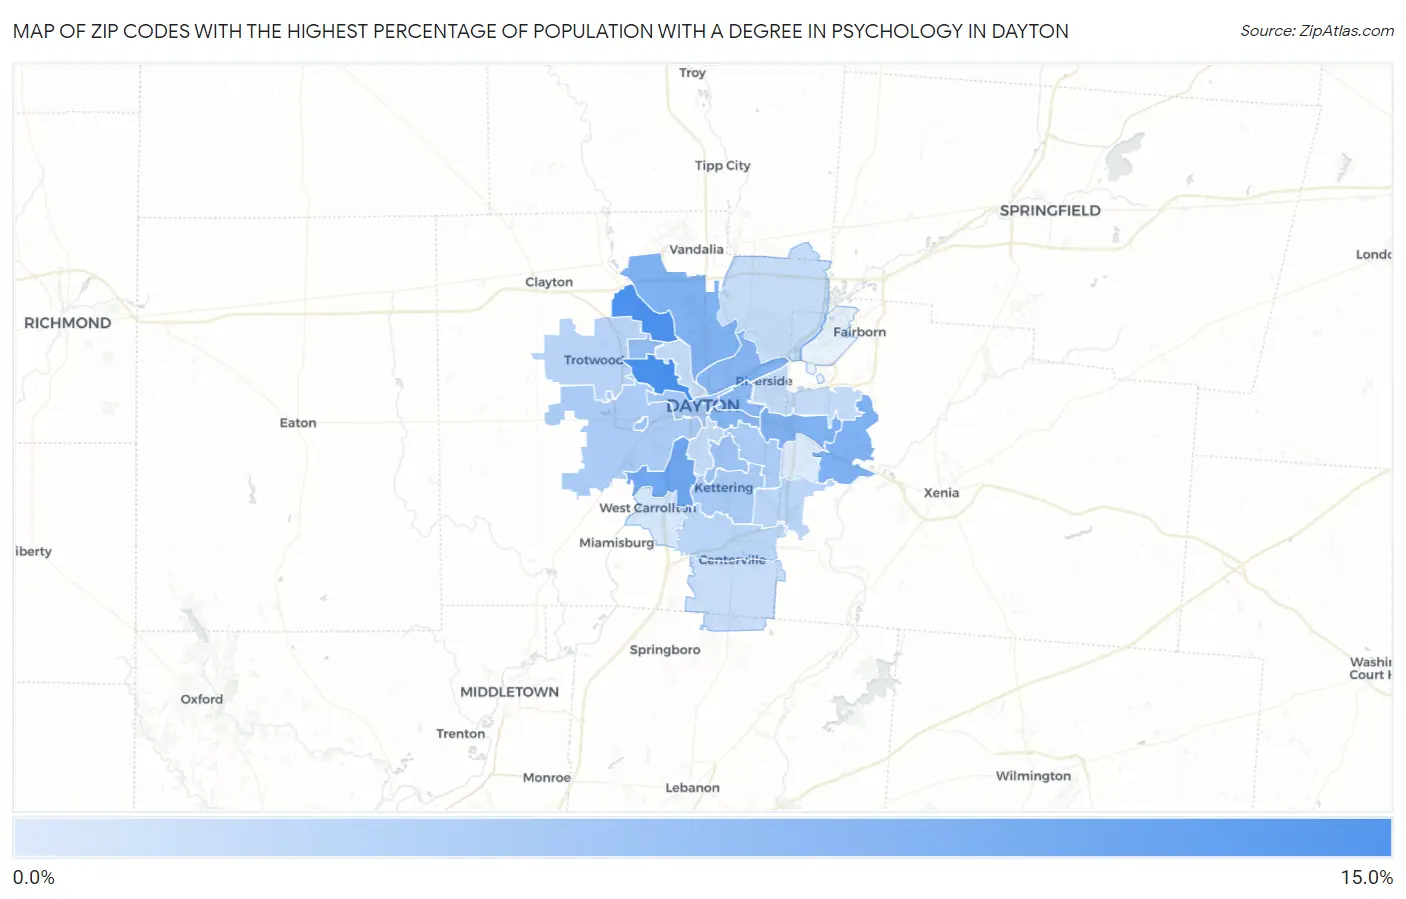
Map of Zip Codes with the Highest Percentage of Population with a Degree in Psychology in Dayton
0.0%
15.0%
Zip Codes with the Highest Percentage of Population with a Degree in Psychology in Dayton, OH
| Zip Code | % Graduates | vs State | vs National | |
| 1. | 45406 | 11.0% | 4.4%(+6.54)#56 | 5.1%(+5.90)#2,078 |
| 2. | 45415 | 10.9% | 4.4%(+6.47)#59 | 5.1%(+5.83)#2,108 |
| 3. | 45439 | 8.8% | 4.4%(+4.38)#90 | 5.1%(+3.74)#3,314 |
| 4. | 45434 | 7.9% | 4.4%(+3.44)#120 | 5.1%(+2.80)#4,309 |
| 5. | 45414 | 7.8% | 4.4%(+3.43)#121 | 5.1%(+2.79)#4,317 |
| 6. | 45432 | 7.8% | 4.4%(+3.42)#122 | 5.1%(+2.78)#4,339 |
| 7. | 45410 | 7.5% | 4.4%(+3.08)#130 | 5.1%(+2.44)#4,845 |
| 8. | 45404 | 7.5% | 4.4%(+3.08)#131 | 5.1%(+2.44)#4,847 |
| 9. | 45403 | 7.3% | 4.4%(+2.87)#141 | 5.1%(+2.23)#5,160 |
| 10. | 45416 | 6.7% | 4.4%(+2.34)#168 | 5.1%(+1.70)#6,111 |
| 11. | 45419 | 6.3% | 4.4%(+1.85)#202 | 5.1%(+1.21)#7,219 |
| 12. | 45428 | 6.2% | 4.4%(+1.84)#204 | 5.1%(+1.20)#7,259 |
| 13. | 45402 | 5.9% | 4.4%(+1.47)#231 | 5.1%(+0.831)#8,294 |
| 14. | 45429 | 5.7% | 4.4%(+1.25)#248 | 5.1%(+0.610)#8,997 |
| 15. | 45420 | 5.6% | 4.4%(+1.14)#260 | 5.1%(+0.502)#9,361 |
| 16. | 45417 | 5.5% | 4.4%(+1.14)#261 | 5.1%(+0.497)#9,375 |
| 17. | 45426 | 4.7% | 4.4%(+0.312)#359 | 5.1%(-0.328)#12,230 |
| 18. | 45459 | 4.7% | 4.4%(+0.284)#365 | 5.1%(-0.356)#12,338 |
| 19. | 45440 | 4.7% | 4.4%(+0.273)#367 | 5.1%(-0.367)#12,386 |
| 20. | 45431 | 4.1% | 4.4%(-0.288)#431 | 5.1%(-0.928)#14,485 |
| 21. | 45405 | 4.1% | 4.4%(-0.293)#432 | 5.1%(-0.933)#14,502 |
| 22. | 45409 | 4.1% | 4.4%(-0.321)#436 | 5.1%(-0.961)#14,610 |
| 23. | 45424 | 4.0% | 4.4%(-0.375)#450 | 5.1%(-1.01)#14,794 |
| 24. | 45458 | 4.0% | 4.4%(-0.456)#460 | 5.1%(-1.10)#15,087 |
| 25. | 45449 | 3.2% | 4.4%(-1.22)#571 | 5.1%(-1.86)#17,677 |
| 26. | 45430 | 2.8% | 4.4%(-1.60)#635 | 5.1%(-2.24)#18,762 |
1
Common Questions
What are the Top 10 Zip Codes with the Highest Percentage of Population with a Degree in Psychology in Dayton, OH?
Top 10 Zip Codes with the Highest Percentage of Population with a Degree in Psychology in Dayton, OH are:
What zip code has the Highest Percentage of Population with a Degree in Psychology in Dayton, OH?
45406 has the Highest Percentage of Population with a Degree in Psychology in Dayton, OH with 11.0%.
What is the Percentage of Population with a Degree in Psychology in Dayton, OH?
Percentage of Population with a Degree in Psychology in Dayton is 6.1%.
What is the Percentage of Population with a Degree in Psychology in Ohio?
Percentage of Population with a Degree in Psychology in Ohio is 4.4%.
What is the Percentage of Population with a Degree in Psychology in the United States?
Percentage of Population with a Degree in Psychology in the United States is 5.1%.