Zip Codes with the Highest Percentage of Population Employed in Installation, Maintenance & Repair in Dayton, OH
RELATED REPORTS & OPTIONS
Installation, Maintenance & Repair
Dayton
Compare Zip Codes
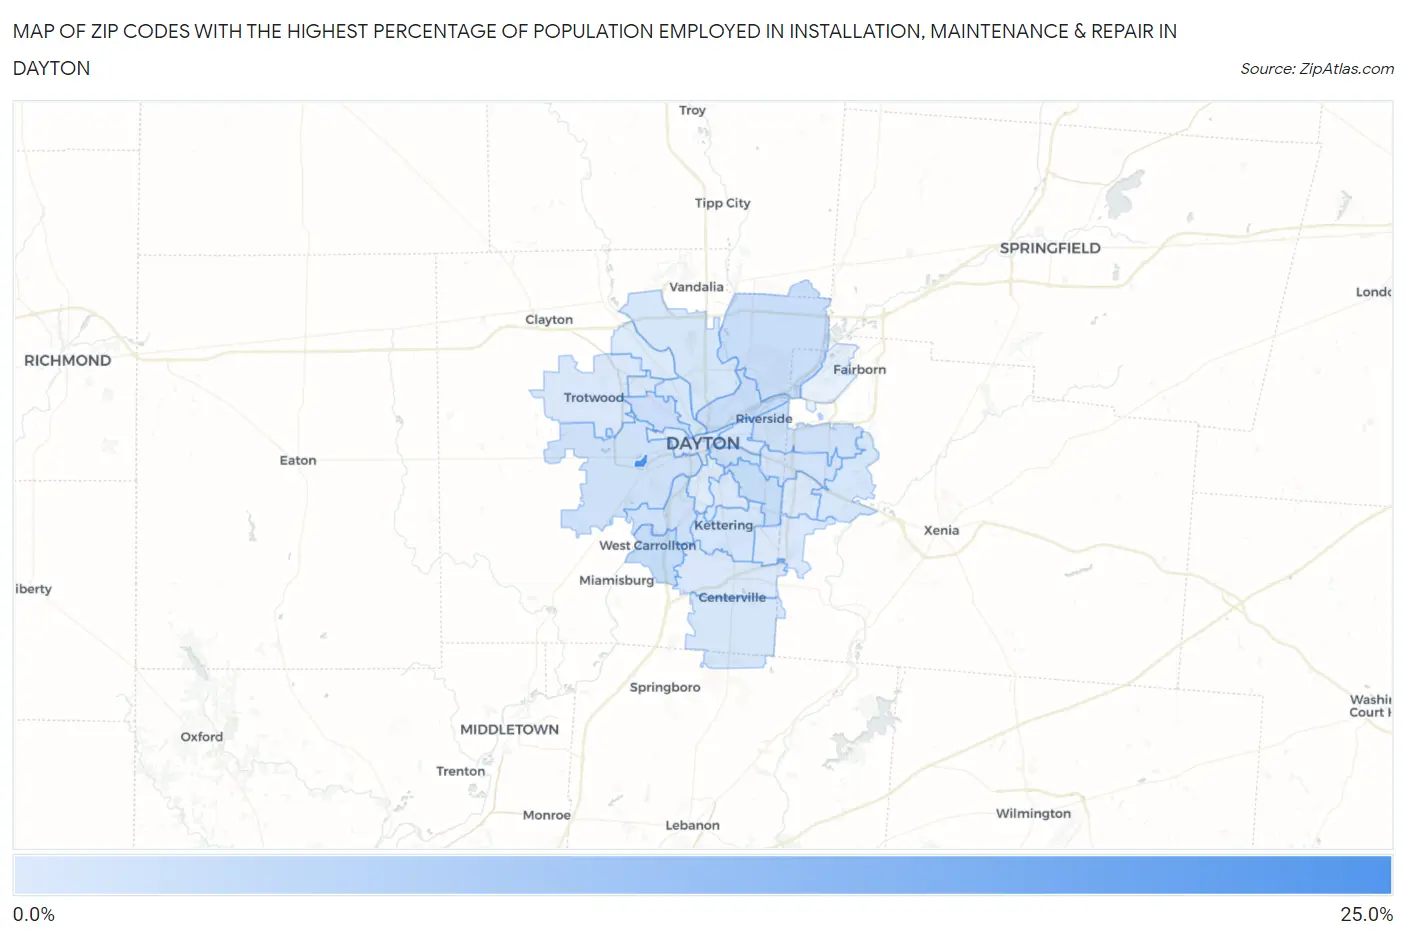
Map of Zip Codes with the Highest Percentage of Population Employed in Installation, Maintenance & Repair in Dayton
0.0%
25.0%
Zip Codes with the Highest Percentage of Population Employed in Installation, Maintenance & Repair in Dayton, OH
| Zip Code | % Employed | vs State | vs National | |
| 1. | 45428 | 25.0% | 3.1%(+21.9)#5 | 3.1%(+21.9)#243 |
| 2. | 45435 | 7.5% | 3.1%(+4.40)#147 | 3.1%(+4.40)#3,862 |
| 3. | 45469 | 5.1% | 3.1%(+2.02)#328 | 3.1%(+2.02)#8,442 |
| 4. | 45420 | 4.4% | 3.1%(+1.38)#409 | 3.1%(+1.37)#10,643 |
| 5. | 45449 | 4.1% | 3.1%(+1.09)#438 | 3.1%(+1.08)#11,732 |
| 6. | 45404 | 4.0% | 3.1%(+0.925)#467 | 3.1%(+0.919)#12,439 |
| 7. | 45424 | 3.9% | 3.1%(+0.793)#493 | 3.1%(+0.786)#13,007 |
| 8. | 45406 | 3.6% | 3.1%(+0.521)#547 | 3.1%(+0.514)#14,231 |
| 9. | 45439 | 2.9% | 3.1%(-0.148)#674 | 3.1%(-0.154)#17,431 |
| 10. | 45431 | 2.8% | 3.1%(-0.259)#699 | 3.1%(-0.266)#17,999 |
| 11. | 45410 | 2.8% | 3.1%(-0.272)#703 | 3.1%(-0.279)#18,065 |
| 12. | 45417 | 2.8% | 3.1%(-0.308)#709 | 3.1%(-0.314)#18,248 |
| 13. | 45432 | 2.6% | 3.1%(-0.443)#736 | 3.1%(-0.450)#18,986 |
| 14. | 45429 | 2.4% | 3.1%(-0.668)#782 | 3.1%(-0.675)#20,096 |
| 15. | 45403 | 2.2% | 3.1%(-0.861)#817 | 3.1%(-0.867)#21,081 |
| 16. | 45405 | 1.9% | 3.1%(-1.20)#869 | 3.1%(-1.21)#22,614 |
| 17. | 45458 | 1.8% | 3.1%(-1.23)#876 | 3.1%(-1.24)#22,762 |
| 18. | 45434 | 1.8% | 3.1%(-1.30)#889 | 3.1%(-1.30)#23,047 |
| 19. | 45414 | 1.7% | 3.1%(-1.32)#896 | 3.1%(-1.33)#23,158 |
| 20. | 45419 | 1.7% | 3.1%(-1.37)#901 | 3.1%(-1.37)#23,358 |
| 21. | 45416 | 1.5% | 3.1%(-1.57)#931 | 3.1%(-1.58)#24,211 |
| 22. | 45426 | 1.4% | 3.1%(-1.62)#936 | 3.1%(-1.62)#24,381 |
| 23. | 45402 | 1.4% | 3.1%(-1.69)#949 | 3.1%(-1.70)#24,636 |
| 24. | 45459 | 1.4% | 3.1%(-1.69)#950 | 3.1%(-1.70)#24,658 |
| 25. | 45440 | 1.3% | 3.1%(-1.81)#965 | 3.1%(-1.81)#25,064 |
| 26. | 45430 | 1.2% | 3.1%(-1.89)#977 | 3.1%(-1.90)#25,381 |
| 27. | 45409 | 0.95% | 3.1%(-2.11)#1,017 | 3.1%(-2.12)#26,060 |
| 28. | 45415 | 0.89% | 3.1%(-2.17)#1,026 | 3.1%(-2.18)#26,234 |
1
Common Questions
What are the Top 10 Zip Codes with the Highest Percentage of Population Employed in Installation, Maintenance & Repair in Dayton, OH?
Top 10 Zip Codes with the Highest Percentage of Population Employed in Installation, Maintenance & Repair in Dayton, OH are:
What zip code has the Highest Percentage of Population Employed in Installation, Maintenance & Repair in Dayton, OH?
45428 has the Highest Percentage of Population Employed in Installation, Maintenance & Repair in Dayton, OH with 25.0%.
What is the Percentage of Population Employed in Installation, Maintenance & Repair in Dayton, OH?
Percentage of Population Employed in Installation, Maintenance & Repair in Dayton is 2.3%.
What is the Percentage of Population Employed in Installation, Maintenance & Repair in Ohio?
Percentage of Population Employed in Installation, Maintenance & Repair in Ohio is 3.1%.
What is the Percentage of Population Employed in Installation, Maintenance & Repair in the United States?
Percentage of Population Employed in Installation, Maintenance & Repair in the United States is 3.1%.