Zip Codes with the Highest Percentage of Population Employed in Architecture & Engineering in Dayton, OH
RELATED REPORTS & OPTIONS
Architecture & Engineering
Dayton
Compare Zip Codes
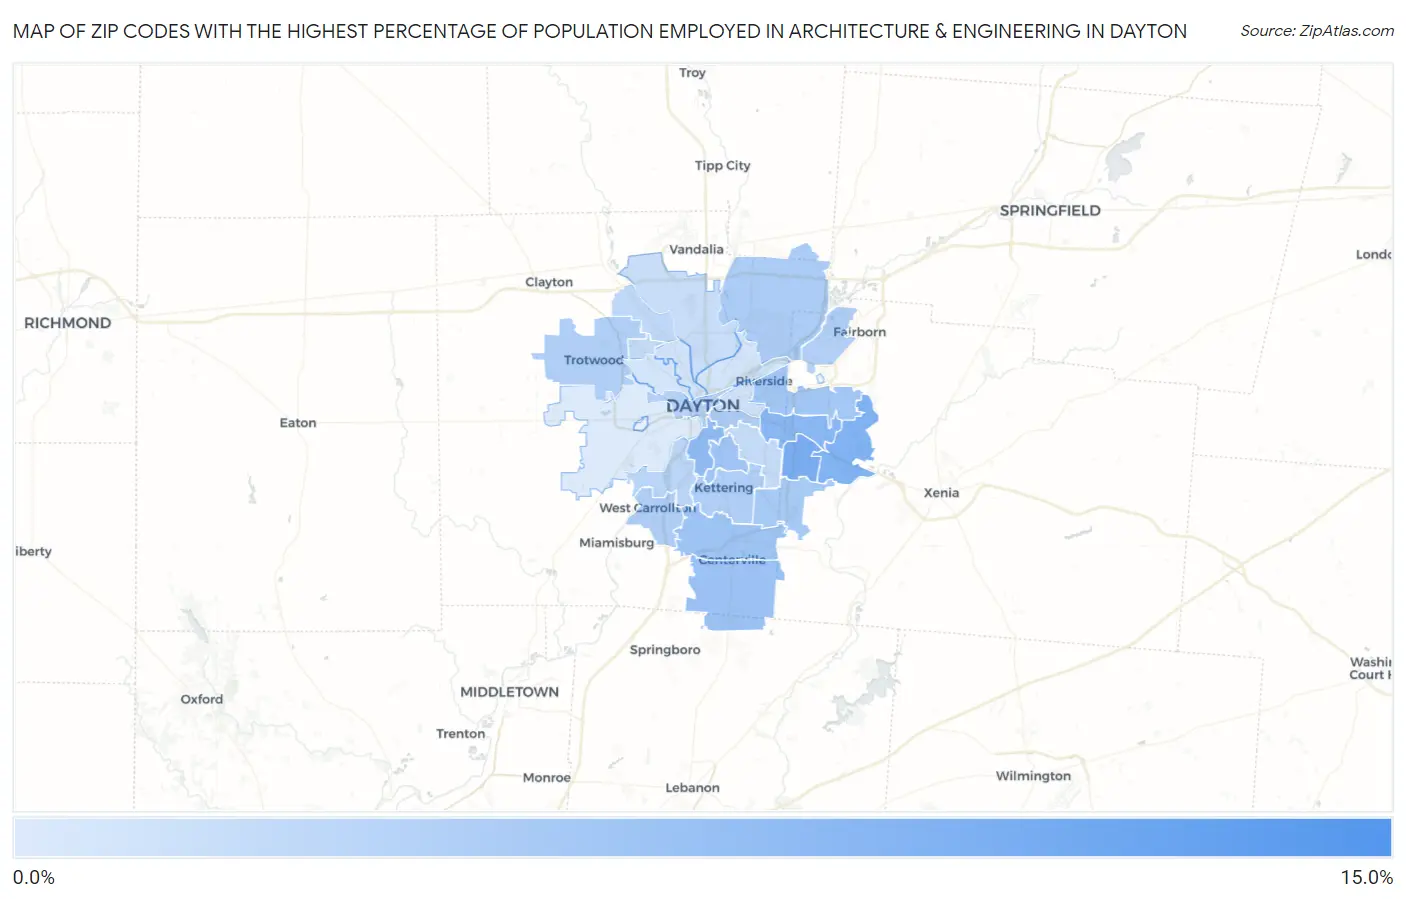
Map of Zip Codes with the Highest Percentage of Population Employed in Architecture & Engineering in Dayton
0.0%
15.0%
Zip Codes with the Highest Percentage of Population Employed in Architecture & Engineering in Dayton, OH
| Zip Code | % Employed | vs State | vs National | |
| 1. | 45469 | 10.2% | 2.1%(+8.04)#14 | 2.1%(+8.02)#333 |
| 2. | 45430 | 6.7% | 2.1%(+4.57)#26 | 2.1%(+4.55)#825 |
| 3. | 45434 | 6.3% | 2.1%(+4.13)#29 | 2.1%(+4.11)#977 |
| 4. | 45432 | 5.6% | 2.1%(+3.49)#45 | 2.1%(+3.47)#1,267 |
| 5. | 45409 | 5.1% | 2.1%(+2.97)#59 | 2.1%(+2.95)#1,595 |
| 6. | 45458 | 4.5% | 2.1%(+2.36)#90 | 2.1%(+2.34)#2,136 |
| 7. | 45459 | 4.1% | 2.1%(+2.00)#106 | 2.1%(+1.99)#2,574 |
| 8. | 45419 | 4.0% | 2.1%(+1.85)#117 | 2.1%(+1.84)#2,791 |
| 9. | 45431 | 3.8% | 2.1%(+1.70)#126 | 2.1%(+1.68)#3,039 |
| 10. | 45440 | 3.6% | 2.1%(+1.50)#145 | 2.1%(+1.48)#3,446 |
| 11. | 45410 | 3.3% | 2.1%(+1.15)#179 | 2.1%(+1.13)#4,252 |
| 12. | 45424 | 3.2% | 2.1%(+1.08)#189 | 2.1%(+1.06)#4,431 |
| 13. | 45449 | 3.1% | 2.1%(+0.928)#203 | 2.1%(+0.912)#4,848 |
| 14. | 45429 | 3.0% | 2.1%(+0.897)#209 | 2.1%(+0.881)#4,956 |
| 15. | 45426 | 3.0% | 2.1%(+0.843)#215 | 2.1%(+0.827)#5,132 |
| 16. | 45433 | 2.8% | 2.1%(+0.659)#255 | 2.1%(+0.643)#5,815 |
| 17. | 45402 | 2.6% | 2.1%(+0.496)#280 | 2.1%(+0.481)#6,444 |
| 18. | 45439 | 2.3% | 2.1%(+0.193)#346 | 2.1%(+0.178)#7,815 |
| 19. | 45415 | 2.0% | 2.1%(-0.143)#427 | 2.1%(-0.158)#9,666 |
| 20. | 45420 | 1.8% | 2.1%(-0.372)#486 | 2.1%(-0.387)#11,057 |
| 21. | 45416 | 1.8% | 2.1%(-0.383)#492 | 2.1%(-0.399)#11,156 |
| 22. | 45414 | 1.4% | 2.1%(-0.720)#575 | 2.1%(-0.735)#13,482 |
| 23. | 45403 | 1.1% | 2.1%(-1.06)#685 | 2.1%(-1.08)#16,078 |
| 24. | 45405 | 0.80% | 2.1%(-1.33)#760 | 2.1%(-1.35)#18,122 |
| 25. | 45406 | 0.67% | 2.1%(-1.47)#797 | 2.1%(-1.48)#19,112 |
| 26. | 45404 | 0.66% | 2.1%(-1.47)#800 | 2.1%(-1.48)#19,142 |
| 27. | 45417 | 0.13% | 2.1%(-2.00)#921 | 2.1%(-2.02)#22,305 |
1
Common Questions
What are the Top 10 Zip Codes with the Highest Percentage of Population Employed in Architecture & Engineering in Dayton, OH?
Top 10 Zip Codes with the Highest Percentage of Population Employed in Architecture & Engineering in Dayton, OH are:
What zip code has the Highest Percentage of Population Employed in Architecture & Engineering in Dayton, OH?
45469 has the Highest Percentage of Population Employed in Architecture & Engineering in Dayton, OH with 10.2%.
What is the Percentage of Population Employed in Architecture & Engineering in Dayton, OH?
Percentage of Population Employed in Architecture & Engineering in Dayton is 2.0%.
What is the Percentage of Population Employed in Architecture & Engineering in Ohio?
Percentage of Population Employed in Architecture & Engineering in Ohio is 2.1%.
What is the Percentage of Population Employed in Architecture & Engineering in the United States?
Percentage of Population Employed in Architecture & Engineering in the United States is 2.1%.