Zip Codes with the Highest Percentage of Population Employed in Legal Services & Support in Dayton, OH
RELATED REPORTS & OPTIONS
Legal Services & Support
Dayton
Compare Zip Codes
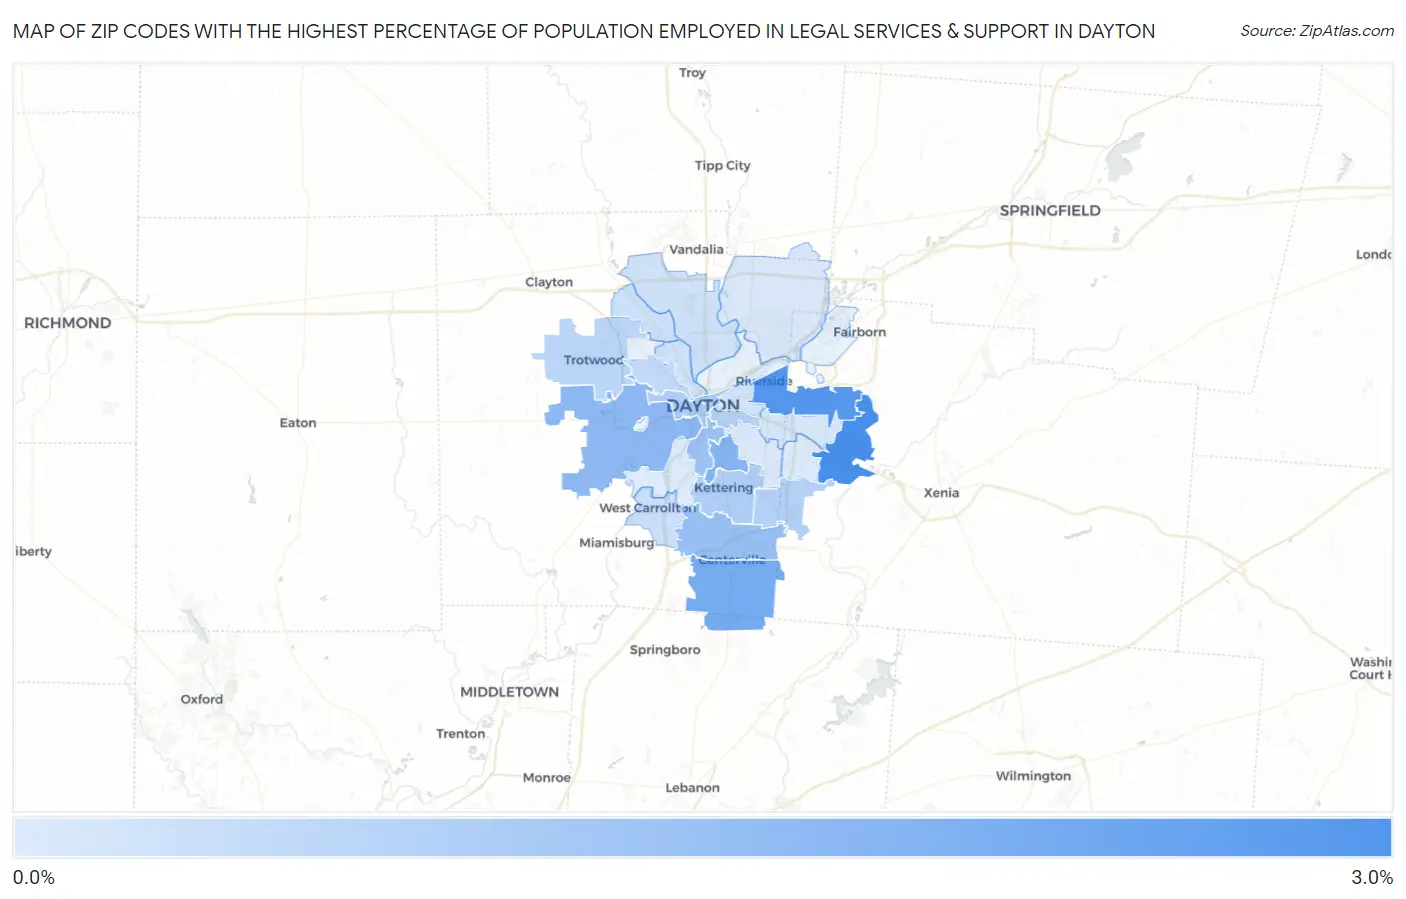
Map of Zip Codes with the Highest Percentage of Population Employed in Legal Services & Support in Dayton
0.0%
3.0%
Zip Codes with the Highest Percentage of Population Employed in Legal Services & Support in Dayton, OH
| Zip Code | % Employed | vs State | vs National | |
| 1. | 45434 | 2.7% | 0.92%(+1.77)#56 | 1.2%(+1.51)#2,213 |
| 2. | 45431 | 2.5% | 0.92%(+1.54)#61 | 1.2%(+1.29)#2,564 |
| 3. | 45458 | 1.9% | 0.92%(+1.01)#89 | 1.2%(+0.755)#3,634 |
| 4. | 45419 | 1.7% | 0.92%(+0.771)#116 | 1.2%(+0.512)#4,328 |
| 5. | 45417 | 1.6% | 0.92%(+0.641)#132 | 1.2%(+0.382)#4,794 |
| 6. | 45459 | 1.3% | 0.92%(+0.422)#160 | 1.2%(+0.163)#5,700 |
| 7. | 45409 | 1.3% | 0.92%(+0.359)#174 | 1.2%(+0.100)#6,021 |
| 8. | 45402 | 1.0% | 0.92%(+0.081)#227 | 1.2%(-0.178)#7,784 |
| 9. | 45429 | 1.0% | 0.92%(+0.080)#228 | 1.2%(-0.179)#7,791 |
| 10. | 45440 | 0.90% | 0.92%(-0.022)#259 | 1.2%(-0.281)#8,573 |
| 11. | 45410 | 0.89% | 0.92%(-0.035)#265 | 1.2%(-0.294)#8,700 |
| 12. | 45426 | 0.79% | 0.92%(-0.133)#290 | 1.2%(-0.392)#9,537 |
| 13. | 45406 | 0.68% | 0.92%(-0.245)#335 | 1.2%(-0.504)#10,617 |
| 14. | 45449 | 0.52% | 0.92%(-0.402)#405 | 1.2%(-0.661)#12,341 |
| 15. | 45415 | 0.49% | 0.92%(-0.435)#425 | 1.2%(-0.694)#12,755 |
| 16. | 45405 | 0.47% | 0.92%(-0.457)#435 | 1.2%(-0.716)#13,035 |
| 17. | 45414 | 0.46% | 0.92%(-0.468)#443 | 1.2%(-0.727)#13,182 |
| 18. | 45403 | 0.43% | 0.92%(-0.492)#454 | 1.2%(-0.751)#13,458 |
| 19. | 45432 | 0.36% | 0.92%(-0.566)#494 | 1.2%(-0.825)#14,346 |
| 20. | 45424 | 0.32% | 0.92%(-0.604)#514 | 1.2%(-0.863)#14,809 |
| 21. | 45420 | 0.27% | 0.92%(-0.653)#542 | 1.2%(-0.912)#15,360 |
| 22. | 45430 | 0.24% | 0.92%(-0.686)#556 | 1.2%(-0.945)#15,761 |
| 23. | 45439 | 0.24% | 0.92%(-0.687)#558 | 1.2%(-0.946)#15,776 |
1
Common Questions
What are the Top 10 Zip Codes with the Highest Percentage of Population Employed in Legal Services & Support in Dayton, OH?
Top 10 Zip Codes with the Highest Percentage of Population Employed in Legal Services & Support in Dayton, OH are:
What zip code has the Highest Percentage of Population Employed in Legal Services & Support in Dayton, OH?
45434 has the Highest Percentage of Population Employed in Legal Services & Support in Dayton, OH with 2.7%.
What is the Percentage of Population Employed in Legal Services & Support in Dayton, OH?
Percentage of Population Employed in Legal Services & Support in Dayton is 0.83%.
What is the Percentage of Population Employed in Legal Services & Support in Ohio?
Percentage of Population Employed in Legal Services & Support in Ohio is 0.92%.
What is the Percentage of Population Employed in Legal Services & Support in the United States?
Percentage of Population Employed in Legal Services & Support in the United States is 1.2%.