Zip Codes with the Highest Percentage of Households Without a Vehicle in Dayton, OH
RELATED REPORTS & OPTIONS
Households without a Cars
Dayton
Compare Zip Codes
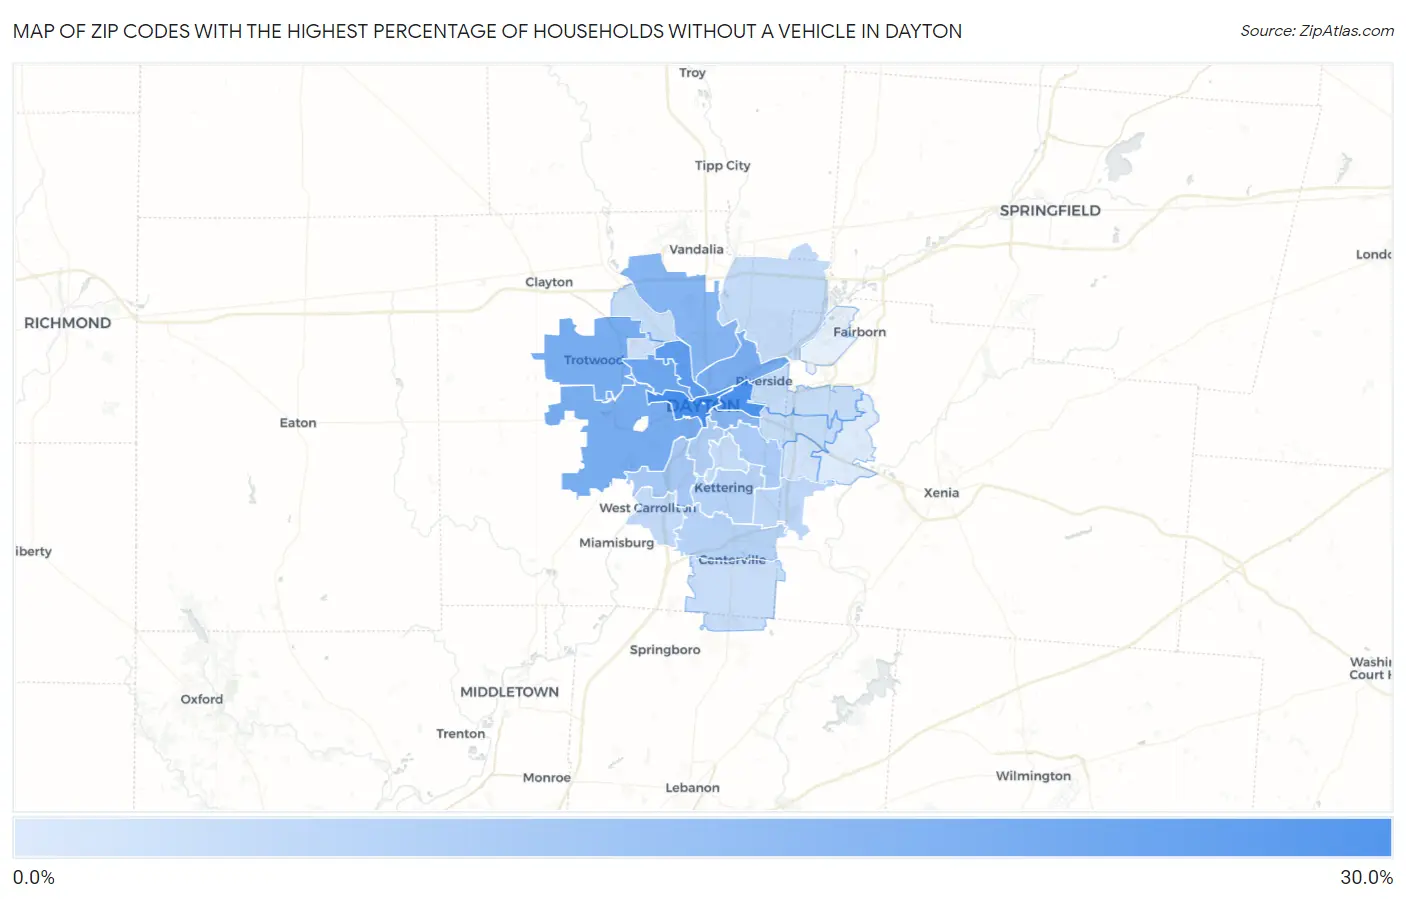
Map of Zip Codes with the Highest Percentage of Households Without a Vehicle in Dayton
0.0%
30.0%
Zip Codes with the Highest Percentage of Households Without a Vehicle in Dayton, OH
| Zip Code | Housholds Without a Car | vs State | vs National | |
| 1. | 45402 | 25.9% | 7.4%(+18.5)#47 | 8.3%(+17.6)#1,009 |
| 2. | 45403 | 25.2% | 7.4%(+17.8)#49 | 8.3%(+16.9)#1,053 |
| 3. | 45405 | 21.4% | 7.4%(+14.0)#61 | 8.3%(+13.1)#1,347 |
| 4. | 45406 | 18.8% | 7.4%(+11.4)#75 | 8.3%(+10.5)#1,664 |
| 5. | 45426 | 17.1% | 7.4%(+9.70)#86 | 8.3%(+8.80)#1,938 |
| 6. | 45417 | 16.9% | 7.4%(+9.50)#89 | 8.3%(+8.60)#1,977 |
| 7. | 45404 | 16.7% | 7.4%(+9.30)#93 | 8.3%(+8.40)#2,011 |
| 8. | 45414 | 14.4% | 7.4%(+7.00)#123 | 8.3%(+6.10)#2,549 |
| 9. | 45410 | 14.3% | 7.4%(+6.90)#127 | 8.3%(+6.00)#2,594 |
| 10. | 45439 | 8.9% | 7.4%(+1.50)#254 | 8.3%(+0.600)#5,861 |
| 11. | 45420 | 8.1% | 7.4%(+0.700)#287 | 8.3%(-0.200)#6,800 |
| 12. | 45409 | 7.4% | 7.4%(=0.000)#320 | 8.3%(-0.900)#7,884 |
| 13. | 45459 | 6.4% | 7.4%(-1.00)#381 | 8.3%(-1.90)#9,578 |
| 14. | 45429 | 6.3% | 7.4%(-1.10)#388 | 8.3%(-2.00)#9,799 |
| 15. | 45440 | 5.3% | 7.4%(-2.10)#472 | 8.3%(-3.00)#12,115 |
| 16. | 45449 | 4.6% | 7.4%(-2.80)#547 | 8.3%(-3.70)#13,949 |
| 17. | 45424 | 4.1% | 7.4%(-3.30)#603 | 8.3%(-4.20)#15,355 |
| 18. | 45419 | 4.0% | 7.4%(-3.40)#617 | 8.3%(-4.30)#15,755 |
| 19. | 45431 | 3.9% | 7.4%(-3.50)#625 | 8.3%(-4.40)#16,025 |
| 20. | 45415 | 3.9% | 7.4%(-3.50)#630 | 8.3%(-4.40)#16,079 |
| 21. | 45432 | 3.8% | 7.4%(-3.60)#649 | 8.3%(-4.50)#16,396 |
| 22. | 45458 | 3.4% | 7.4%(-4.00)#708 | 8.3%(-4.90)#17,622 |
| 23. | 45416 | 2.7% | 7.4%(-4.70)#781 | 8.3%(-5.60)#20,200 |
| 24. | 45430 | 2.0% | 7.4%(-5.40)#869 | 8.3%(-6.30)#22,516 |
| 25. | 45434 | 0.20% | 7.4%(-7.20)#1,031 | 8.3%(-8.10)#27,295 |
1
Common Questions
What are the Top 10 Zip Codes with the Highest Percentage of Households Without a Vehicle in Dayton, OH?
Top 10 Zip Codes with the Highest Percentage of Households Without a Vehicle in Dayton, OH are:
What zip code has the Highest Percentage of Households Without a Vehicle in Dayton, OH?
45402 has the Highest Percentage of Households Without a Vehicle in Dayton, OH with 25.9%.
What is the Percentage of Households Without a Vehicle in Dayton, OH?
Percentage of Households Without a Vehicle in Dayton is 17.5%.
What is the Percentage of Households Without a Vehicle in Ohio?
Percentage of Households Without a Vehicle in Ohio is 7.4%.
What is the Percentage of Households Without a Vehicle in the United States?
Percentage of Households Without a Vehicle in the United States is 8.3%.