Zip Codes with the Highest Percentage of Births to Unmarried Women in Dayton, OH

RELATED REPORTS & OPTIONS

Highest Illegitimacy | All Women
Population
Families and Households
Female Fertility
Female Fertility (Unmarried)
Race (Community Size)
Race (Percentage)
Ancestry (Community Size)
AfricanAlbanianAlsatianAmericanApacheArabArgentineanArmenianAustralianAustrianBasqueBelgianBhutaneseBlackfeetBolivianBrazilianBritishBulgarianBurmeseCajunCanadianCape VerdeanCelticCentral AmericanCentral American IndianCherokeeChileanChippewaChoctawColombianCosta RicanCreekCroatianCubanCzechCzechoslovakianDanishDominicanDutchEastern EuropeanEcuadorianEgyptianEnglishEstonianEthiopianEuropeanFilipinoFinnishFrenchFrench CanadianGermanGhanaianGreekGuamanian / ChamorroGuatemalanHaitianHonduranHungarianIcelanderIndian (Asian)InupiatIranianIraqiIrishIroquoisItalianJamaicanJapaneseKenyanKoreanLaotianLatvianLebaneseLiberianLithuanianLuxembourgerMacedonianMalteseMexicanMexican American IndianMoroccanNative HawaiianNavajoNicaraguanNigerianNorthern EuropeanNorwegianOkinawanPakistaniPalestinianPanamanianPennsylvania GermanPeruvianPolishPortuguesePotawatomiPuerto RicanRomanianRussianSalvadoranSamoanScandinavianScotch-IrishScottishSeminoleSenegaleseSerbianSiouxSlavicSlovakSloveneSouth AfricanSouth AmericanSpaniardSpanishSri LankanSubsaharan AfricanSudaneseSwedishSwissSyrianThaiTrinidadian and TobagonianTurkishUkrainianVenezuelanWelshWest IndianYugoslavian
Ancestry (Percentage)
AfricanAlbanianAlsatianAmericanApacheArabArgentineanArmenianAustralianAustrianBasqueBelgianBhutaneseBlackfeetBolivianBrazilianBritishBulgarianBurmeseCajunCanadianCape VerdeanCelticCentral AmericanCentral American IndianCherokeeChileanChippewaChoctawColombianCosta RicanCreekCroatianCubanCzechCzechoslovakianDanishDominicanDutchEastern EuropeanEcuadorianEgyptianEnglishEstonianEthiopianEuropeanFilipinoFinnishFrenchFrench CanadianGermanGhanaianGreekGuamanian / ChamorroGuatemalanHaitianHonduranHungarianIcelanderIndian (Asian)InupiatIranianIraqiIrishIroquoisItalianJamaicanJapaneseKenyanKoreanLaotianLatvianLebaneseLiberianLithuanianLuxembourgerMacedonianMalteseMexicanMexican American IndianMoroccanNative HawaiianNavajoNicaraguanNigerianNorthern EuropeanNorwegianOkinawanPakistaniPalestinianPanamanianPennsylvania GermanPeruvianPolishPortuguesePotawatomiPuerto RicanRomanianRussianSalvadoranSamoanScandinavianScotch-IrishScottishSeminoleSenegaleseSerbianSiouxSlavicSlovakSloveneSouth AfricanSouth AmericanSpaniardSpanishSri LankanSubsaharan AfricanSudaneseSwedishSwissSyrianThaiTrinidadian and TobagonianTurkishUkrainianVenezuelanWelshWest IndianYugoslavian
Immigrant Origin (Total)
AfricaArgentinaAsiaAustraliaBelarusBosnia and HerzegovinaBrazilBulgariaCambodiaCameroonCanadaCaribbeanCentral AmericaChinaColombiaCongoCosta RicaCubaDominican RepublicEastern AfricaEastern AsiaEastern EuropeEcuadorEgyptEl SalvadorEnglandEthiopiaEuropeFranceGermanyGhanaGreeceGuatemalaGuyanaHaitiHondurasHong KongHungaryIndiaIndonesiaIranIraqIrelandIsraelItalyJamaicaJapanJordanKenyaKoreaKuwaitLatin AmericaLebanonLiberiaMalaysiaMexicoMiddle AfricaMoldovaMoroccoNetherlandsNigeriaNorthern AfricaNorthern EuropeNorwayOceaniaPakistanPanamaPeruPhilippinesPolandPortugalRomaniaRussiaSaudi ArabiaScotlandSenegalSingaporeSouth AfricaSouth AmericaSouth Central AsiaSouth Eastern AsiaSouthern EuropeSpainSudanTaiwanThailandTrinidad and TobagoTurkeyUkraineUzbekistanVenezuelaVietnamWestern AfricaWestern AsiaWestern EuropeZaire
Immigrant Origin (Percentage)
AfricaArgentinaAsiaAustraliaBelarusBosnia and HerzegovinaBrazilBulgariaCambodiaCameroonCanadaCaribbeanCentral AmericaChinaColombiaCongoCosta RicaCubaDominican RepublicEastern AfricaEastern AsiaEastern EuropeEcuadorEgyptEl SalvadorEnglandEthiopiaEuropeFranceGermanyGhanaGreeceGuatemalaGuyanaHaitiHondurasHong KongHungaryIndiaIndonesiaIranIraqIrelandIsraelItalyJamaicaJapanJordanKenyaKoreaKuwaitLatin AmericaLebanonLiberiaMalaysiaMexicoMiddle AfricaMoldovaMoroccoNetherlandsNigeriaNorthern AfricaNorthern EuropeNorwayOceaniaPakistanPanamaPeruPhilippinesPolandPortugalRomaniaRussiaSaudi ArabiaScotlandSenegalSingaporeSouth AfricaSouth AmericaSouth Central AsiaSouth Eastern AsiaSouthern EuropeSpainSudanTaiwanThailandTrinidad and TobagoTurkeyUkraineUzbekistanVenezuelaVietnamWestern AfricaWestern AsiaWestern EuropeZaire
Income
Income (Families)
Income (Households)
Poverty
Poverty (Families)
Unemployment
Employment Occupations
Employment Industries
Employer Class
Commute Time
Commute Means
School Enrollment
Education by Degree Field
Occupancy
Finances
Physical Characteristics
Dayton
Compare Zip Codes
Comparison Subject

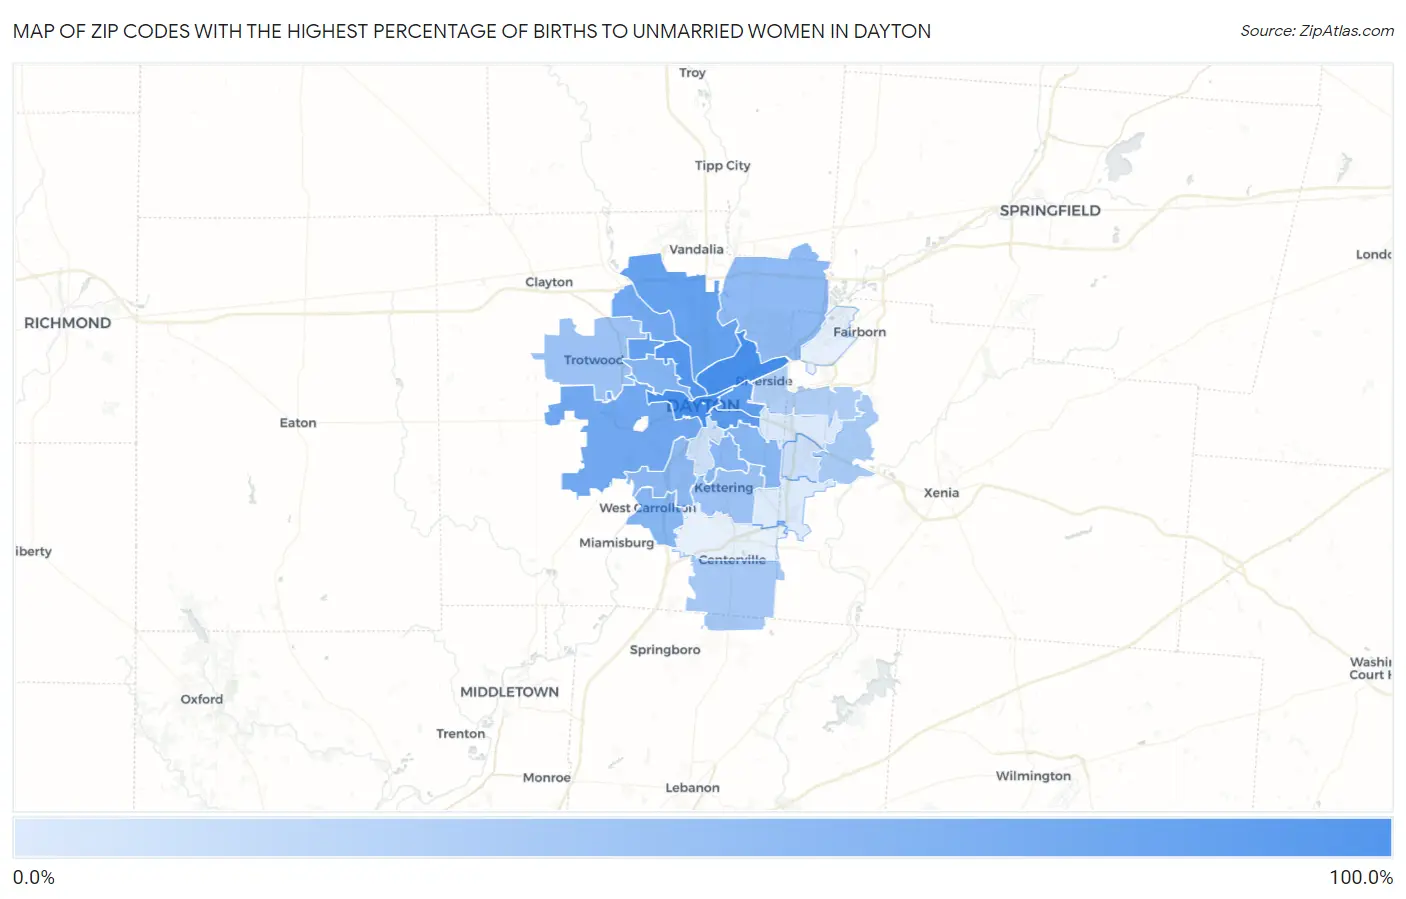
Map of Zip Codes with the Highest Percentage of Births to Unmarried Women in Dayton

0.0%
100.0%
Zip Codes with the Highest Percentage of Births to Unmarried Women in Dayton Map

Zip Codes with the Highest Percentage of Births to Unmarried Women in Dayton, OH

Zip Code % Unmarried vs State vs National
1.45402100.0%37.8%(+62.2)#432.1%(+67.9)#53
2.45404100.0%37.8%(+62.2)#532.1%(+67.9)#54
3.4540589.5%37.8%(+51.7)#8332.1%(+57.4)#2,115
4.4541083.4%37.8%(+45.6)#9532.1%(+51.3)#2,406
5.4540379.1%37.8%(+41.3)#11632.1%(+47.0)#2,695
6.4541476.9%37.8%(+39.1)#12832.1%(+44.8)#2,876
7.4541676.6%37.8%(+38.8)#13332.1%(+44.5)#2,920
8.4541768.2%37.8%(+30.4)#17332.1%(+36.1)#3,711
9.4541568.2%37.8%(+30.4)#17432.1%(+36.1)#3,714
10.4540655.3%37.8%(+17.5)#27332.1%(+23.2)#5,425
11.4544954.2%37.8%(+16.4)#27832.1%(+22.1)#5,563
12.4542052.1%37.8%(+14.3)#29032.1%(+20.0)#5,883
13.4541951.9%37.8%(+14.1)#29132.1%(+19.8)#5,909
14.4543950.0%37.8%(+12.2)#30032.1%(+17.9)#6,152
15.4542447.8%37.8%(+10.0)#31532.1%(+15.7)#6,637
16.4542940.6%37.8%(+2.80)#37632.1%(+8.50)#8,158
17.4542639.5%37.8%(+1.70)#38732.1%(+7.40)#8,467
18.4545834.6%37.8%(-3.20)#43232.1%(+2.50)#9,563
19.4543433.5%37.8%(-4.30)#43932.1%(+1.40)#9,770
20.4543129.5%37.8%(-8.30)#47832.1%(-2.60)#10,836
21.4540914.5%37.8%(-23.3)#60532.1%(-17.6)#14,758
22.4543014.0%37.8%(-23.8)#61332.1%(-18.1)#14,921
23.454328.2%37.8%(-29.6)#66532.1%(-23.9)#16,349
24.454407.0%37.8%(-30.8)#68632.1%(-25.1)#16,647

Common Questions

What are the Top 10 Zip Codes with the Highest Percentage of Births to Unmarried Women in Dayton, OH?
Top 10 Zip Codes with the Highest Percentage of Births to Unmarried Women in Dayton, OH are:
#1
100.0%
#2
100.0%
#3
89.5%
#4
83.4%
#5
79.1%
#6
76.9%
#7
76.6%
#8
68.2%
#9
68.2%
#10
55.3%
What zip code has the Highest Percentage of Births to Unmarried Women in Dayton, OH?
45402 has the Highest Percentage of Births to Unmarried Women in Dayton, OH with 100.0%.
What is the Percentage of Births to Unmarried Women in Dayton, OH?
Percentage of Births to Unmarried Women in Dayton is 72.7%.
What is the Percentage of Births to Unmarried Women in Ohio?
Percentage of Births to Unmarried Women in Ohio is 37.8%.
What is the Percentage of Births to Unmarried Women in the United States?
Percentage of Births to Unmarried Women in the United States is 32.1%.